Article

Joint Deployment of Sensors and Chargers in Wireless Rechargeable Sensor Networks

Institute of Logistics Science and Engineering, Shanghai Maritime University, Shanghai 201306, China
*
Author to whom correspondence should be addressed.
Energies 2024, 17(13), 3130; https://doi.org/10.3390/en17133130
Submission received: 29 May 2024 / Revised: 16 June 2024 / Accepted: 18 June 2024 / Published: 25 June 2024

Abstract

:
As a promising technology to achieve the permanent operation of battery-powered wireless sensor devices, wireless rechargeable sensor networks (WRSNs) by radio-frequency radiation have attracted considerable attention in recent years. Determining how to save the deployment cost of WRSNs has been a hot topic. Previous scholars have mainly studied the cost of deploying chargers, thus ignoring the impact of sensor deployment on the network. Therefore, we consider the new problem of joint deployment of sensors and chargers on a two-dimensional plane, i.e., deploying the minimum number of sensors and chargers used to monitor points of interest (PoIs). Considering the interaction of deployed sensors and chargers, we divide the problem into two stages, P1 and P2. P1 addresses the sensor deployment, while P2 addresses the deployment of chargers. Both P1 and P2 have proved to be NP-hard. Meanwhile, we notice that the aggregation effect of sensors can effectively reduce the number of chargers deployed; therefore, we propose a greedy heuristic approximate solution for deploying sensors by using the aggregation effect (GHDSAE). Then, a greedy heuristic (GH) solution and a particle swarm optimization (PSO) solution are proposed for P2. The time complexity of these solutions is analyzed. Finally, extensive simulation results show that the PSO solution can always reduce the number of chargers deployed based on the GHDSAE solution sensor deployment approach. Therefore, it is more cost-effective to jointly deploy sensors and chargers by using the GHDSAE solution and the PSO solution.

1. Introduction

Traditional wireless sensor networks (WSNs) are distributed networks composed of a large number of sensors that can perceive the external world. Sensors usually have the characteristics of small size, convenient deployment, low cost, and easy networking. Normally, battery-powered sensors with limited capacity tend to be out of service after frequenting wireless communication and data perception, which limits the continuous work of the WSNs. Also, sensors are sometimes located in dangerous or hard-to-reach areas, such as near volcanoes [1], inside concrete walls [2], or under bridges [3], making battery replacement schemes unsafe [4,5,6], as well as infeasible or costly. In order to solve this problem, much literature has proposed methods of energy saving [7,8] and energy acquisition [9]. Energy saving methods can extend the service life but cannot inherently solve the energy problem of WSNs. The energy harvesting method allows sensors to harvest energy from the surrounding environment, but many energy sources, such as thermal energy [10], wind energy [11,12], etc., are unpredictable and unreliable. The recent breakthrough in radio-frequency radiation charge technology brings new opportunities to solve this problem [13]. A major feature of wireless rechargeable sensor networks (WRSNs) is that their lifetime is no longer restricted by batteries, and wireless chargers can continuously and stably provide energy supply for sensor networks; thus, they have been used in smart grids [14], body sensor networks [15] and civil structure monitoring [16].
Among the research aspects of WRSNs, the deployment strategies of key devices, such as sensors and chargers, play important roles in the optimization of deployment cost, network performance, etc., and thus have been a hot topic. In the existing efforts, three typical scenarios are usually involved: (1) deploying static chargers to charge static sensors; (2) deploying mobile chargers to charge static sensors; and (3) deploying static chargers to charge mobile sensors. The first scenario is the most common and usually studies network utility maximization, delay minimization, and routing protocols [17,18,19]. The second scenario can be roughly divided into single mobile charger (MC) charging schemes and multi-MC charging schemes, which are constrained by network lifetime, path planning, coverage, monitoring efficiency, and so on [20,21]. The third scenario is common in monitoring mobile WSNs, such as in applications like industrial wireless identification and healthcare [22,23].
In the first scenario, previous efforts have been mainly focused on the deployment problem of static chargers. To optimize the deployment cost of chargers, the optimal charging coverage of the charger for sensors is studied in [24,25,26]. To maximize the charging utility, the optimal deployment strategy for chargers is studied in [27,28,29,30,31,32]. However, these works tend to overlook the deployment of sensors or directly utilize the distribution of sensors generated pseudo-randomly, thereby ignoring the impact of sensor deployment on subsequent charger deployment. This has been proven to be undeniable in our subsequent research. Therefore, we study a new problem, namely the joint deployment problem of chargers and sensors, and specifically, the sensors are deployed to monitor the points of interest (PoIs). As shown in Figure 1, PoIs are randomly and densely distributed in a two-dimensional plane. The deployed sensors have an aggregation effect, which is presented by deploying new sensors that are close to the deployed sensors. For example, in Figure 1, the sensors at candidate locations 1 and 2 have similar sensing reliability, but candidate location 1 is closer to the deployed sensors than candidate location 2, and thus, the next sensor is deployed at candidate location 1. Considering that the working state and the charging state of the sensor powered by radio-frequency radiation cannot be performed at the same time, any PoI has to be monitored by multi-sensors to ensure that the PoI is continuously monitored across all time domain, and a sensor can also monitor multi-PoIs. This many-to-one working mode is achieved by scheduling monitoring and charging timeslots for sensors. Specifically, a sensor can monitor multi-PoIs in a timeslot. Considering that multiple sensors sharing a charger can improve charging efficiency and reduce charger deployment costs, the aggregation effect of sensors in dense areas should be used to constrain sensor deployment and scheduling. In our deployment scheme for sensors, the life cycle of a sensor is first divided into several time slots, and these slots of all sensors are synchronized. The scheduling problem of a sensor is to select the working mode (working or charging) for the sensor in each time slot under the constraint of uninterrupted task monitoring. Finally, the chargers are deployed based on the deployment of sensors. The charging power provided to the sensor has a lower limit, such that the power received by the sensor during charging time slots should be no less than the energy it consumes during its working time slots. The main contributions of this paper are as follows:
(1)
We present a new problem of joint deployment of sensors and chargers in a two-dimensional plane with the constraints of deployment cost.
(2)
We propose a strategy for deploying static sensors and chargers in a two-dimensional plane by scheduling the working state and the charging state of the sensors to realize the real-time monitoring of PoIs. The target is to reduce the deployment cost of WSNs. We formulate the above problem and conclude two progressive problems, P1 and P2, to analyze the impact of sensor and charger deployment on deployment network costs and prove their NP-hardness.
(3)
The aggregation effect of sensors is revealed to effectively reduce the number of deployed chargers, and thus, the greedy heuristic approximate solution for deploying sensors by using the aggregation effect (GHDSAE) is proposed. Then, the greedy heuristic (GH) solution and the particle swarm optimization (PSO) solution are proposed for the deployment of chargers. The accuracy and efficiency of the solutions are evaluated through a large number of simulations at different computational scales.
The remainder of the paper is organized as follows. In Section 2, we present the related works. In Section 3, we introduce the relevant models, formulate our problem, and reformulate it for easier tractability. Next, we propose four solutions in Section 4. Numerical results are presented in Section 5. Finally, we conclude this work in Section 6.

2. Related Work

To deploy static chargers for static sensors, the main research objectives of network deployment are to minimize network deployment cost, maximize charging utility and radiation safety, etc. However, these studies ignore the impact of sensor deployment on the network and only consider the impact of charger deployment on network performance. Yu et al. were the first to consider the connected charger placement problem. In their scenario, given a fixed number of directional wireless chargers and candidate locations, the position and orientation angle of each charger are determined under the connection constraints of wireless chargers to maximize the overall charging utility [27]. Ding et al. considered two inverse problems: minimizing the charger deployment cost constrained by the requirement of charging level and maximizing the charging level constrained by the deployment cost budget of chargers [24]. Wang et al. considered the problem of obstacles and determined the position and direction of heterogeneous chargers with arbitrary shapes on the two-dimensional plane, so as to maximize the charging utility of the network [28]. Lin et al. evaluated the impact of data collection or sink nodes and proposed a two-stage strategy called search most and remove useless [29]. Wu et al. proposed a new cost criterion in multi-hop wireless charging, which is the comprehensive cost composed of energy cost and deployment cost [25]. You et al. investigated the impact of obstacles on the placement of wireless chargers to maximize the overall charging utility [30]. Yang et al. proposed an improved Firefly algorithm to solve the charger deployment optimization problem, and furthermore, an optimization framework that simultaneously maximizes the coverage and the charging efficiency [31]. Wang et al. investigated the effect of charger deployment on the overall charging utility of sensor networks. They abstracted the charger deployment problem as a multi-objective optimization problem that maximizes the received power of sensors and minimizes the number of charging sensors [32]. Fang et al. studied the application of WRSNs in indoor environments and used a genetic algorithm to optimize the deployment of chargers in indoor environments [26]. Gong et al. designed a two-stage algorithm to improve the energy management efficiency of WRSNs. The first stage uses a particle swarm optimization algorithm to optimize the area coverage. In the second stage, a queuing game-based energy supply algorithm is designed to optimize the energy distribution [33]. In these works, little consideration has been given to the impact of sensor deployment on the overall network.
Table 1 provides a summary of related work for comparison. These efforts provide theoretical basis and insights for our work, but none of them can directly address our problem in three ways. First, we investigate a novel and practical problem for jointly deploying sensors and chargers in static WRSNs with the constraints of deployment cost, which has not been addressed in previous work. Secondly, the impact of sensor deployment on charger deployment is specifically considered. Finally, the new challenge arises from the necessity of proposing approximate solutions with controllable properties such as accuracy and efficiency in the face of the NP-hard of this new problem.

3. Model and Problem Statement

3.1. Network Model

As shown in Figure 1, there are a known number of PoIs (denoted by O = { o 1 , o 2 , . . . , o N } ) randomly distributed in a two-dimensional plane Φ . Our aim is to deploy the minimal number of sensors (denoted by S = { s 1 , s 2 , . . . , s M } ) to cover all PoIs, and then to deploy minimum chargers (denoted by C = { c 1 , c 2 , . . . , c K } ) for charging all sensors. We assume that each sensor has a nearby receiver to collect the monitored information, thus the specific deployment of receivers is not involved in this work. Table 2 lists the parameters used in problem formulation.

3.2. Sensor Perception Model

We adopt a probability model for the sensor perception. In this model, the probability value of the PoIs being monitored by the sensor decreases with the growth of the distance between them. The perception model is as follows [34]:
P ( s j , o i ) = 0 e λ α β 1 r + r e d ( s j , o i ) r r e d ( s j , o i ) r + r e r r e d ( s j , o i )
where r e ( r e < r )   a n d   r is the uncertainty in the measurement sensor detection, α = d ( s j , o i ) ( r r e ) and λ , β are parameters for measuring the probability of detection. d ( s j , o i ) is Euclidean distance between s j and o i , with s j Φ , o i Φ .
We assume that the sensors are required to monitor the PoIs with a probability of no less than a certain probability c t h . Specifically, when P ( s j , o i ) c t h , the PoI o i is covered by the sensor s j .
In real life, the working state and the charging state of the sensor cannot occur at the same time, which means that the sensor cannot be charged during the working state, and cannot work during the charging process. Therefore, based on the many-to-one mode of sensor, it is necessary to schedule the status of sensors (working or charging) reasonably to meet the full-time domain monitoring of all PoIs. Specifically, we assume that a sensor’s life cycle is divided into J identical time slots, and the time slots of all sensors are synchronized by default. The scheduling scheme of all sensors is S T = { s 1 t , s 2 t , s m t } , where s j t = ( a 1 , a 2 , . . . , a J ) . a j = 1 indicates that the sensor is in a working state in the current time slot, and the sensor can monitor the PoIs. Otherwise, a j = 0 means that the sensor is in a charging state.
As shown in Figure 2, the scheduling scheme of the sensor s j in one life cycle is s j t = 1,0 , 0,1 . Obviously, the sensor s j only enters the working state in the time slot t 4 k t , 4 k + 1 t or t 4 k + 3 t , 4 k + 4 t , where k is an integer.

3.3. Charging Model

As the wireless charging power from the charger to the sensor decreases with the increase in distance, the sensor cannot obtain power when the charging distance exceeds a certain threshold d t h . Specifically, when d ( s j , c x ) d t h , the sensor s j is covered by the charger c x . The radio-frequency radiation power model in [35] is used:
P h s j , c x = τ P s ( d ( s j , c x ) + ε ) 2 d ( s j , c x ) d t h 0 d ( s j , c x ) > d t h
where τ is the wireless charging efficiency constant in the range of (0, 1), P s is the transmit power of the charger, d ( s j , c x ) is the Euclidean distance between the locations of s j and c x , with s j Φ , c x Φ ,   s j is the location of a sensor, c x is the location of a charger, ε is a fixed small parameter, and d t h is the maximum cover distance of a charger.
A number of studies have shown that the charging power of sensors can be aggregated from multiple chargers [36,37]. Therefore, the total charging power of s j from all chargers is:
P h s j , C = c x C P h s j , c x
Limited by the factors such as charging safety and hardware performance, the charging power of sensor has an upper limit P m a x . We assume that the average power consumption of the sensor is P c . Then, the maximum operating time slots τ m a x of the sensor in one life cycle can be calculated as follows.
τ m a x = J 1 P m a x / P c N o   s o l u t i o n   P c P m a x / ( J 1 ) P m a x ( J 1 ) P c < P m a x / ( J 1 )   P c > P m a x ( J 1 )
When P c > P m a x ( J 1 ) , the harvested power of sensors in up to J 1 time slots is less than the power consumption in one time slot, and thus the deployment of the charger is meaningless.
Then, to maintain the continuous operation of the sensor, the minimum charging power P m i n s j of sensor s j is:
P m i n s j = P c | | s j t | | 1 J | | s j t | | 1
where s j t is the schedule of s j in one cycle. | | s j t | | 1 is the 1-norm of s j t .
Specifically, when P h s j , C P m i n s j , the sensor s j is fully charged by the charger set C .

3.4. Problem Formulation

In summary, our goal is to minimize the deployment costs of sensors and chargers with the constraints of continuous monitoring of all PoIs. The deployment cost includes sensor deployment cost and charger deployment cost. Therefore, we divide the problem into two parts: P1 and P2. P1 represents the deployment cost of the sensor:
P 1 :   m i n   M s . t .   0 | | s j t | | 1 τ m a x , s j t S T w . r . t   s 1 , s 2 , , s M
where M is the number of sensors deployed.
P2 represents the deployment cost of the charger:
P 2 :   m i n   K s . t .   P h s j , C P m i n s j , s j S w . r . t   c 1 , c 2 , , c K
where K is the number of chargers deployed.
To facilitate the calculation, we introduce an evaluation function to reconstruct P1 and P2:
Q = 1 M n = 1 N m i n [ P ( s j ) c t h , 1 ]
W = 1 K m = 1 M m i n [ P h s j , C P m i n , 1 ]
Then, the formulation of P1 and P2 can be rewritten as:
P 1 M i n   Q s . t . Q = 1 w . r . t   s 1 , s 2 , , s M
P 2 M i n   W s . t . W = 1 w . r . t   c 1 , c 2 , , c K

4. Solutions

In this section, we show that the P1 and P2 problems are NP-hard. Then, we propose approximate solutions for the P1 and P2 problems, respectively.

4.1. Hardness Analysis

In this part, we prove that the above problem is NP-hard.
For P1, we simplify the sensor probabilistic perception model, where the distance between the PoI and the sensor is less than ( r + r e ) , and we assume that the sensor can detect the PoI. And, we simplify the charging state and working state of the sensor, assuming that the sensor can be charged while in the working state. Therefore, the P1 problem is transformed into the selection of the minimum number of sensors that can cover all PoIs in the continuous plane. This is a typical set coverage decision problem, which has been shown to be NP-hard [28].
For P2, we simplify the charging model, where the charging power is a constant when the distance between the charger and the sensor is less than d t h . Obviously, charger selection boils down to finding the minimum number of chargers that can cover all sensors. This is also a typical set covering decision problem, which has been shown to be NP-hard [28].
In summary, the original problems P1 and P2 are also NP-hard problems. This implies that finding the optimal solution may not be computationally tractable. Correspondingly, the area discretization is adopted, that is: the original continuous and infinite solution space Φ is transformed into a finite solution set through discretization, which divides Φ into finite, discrete units or locations to simplifies the complexity of the problem and makes the solution more feasible and efficient.

4.2. Area Discretization

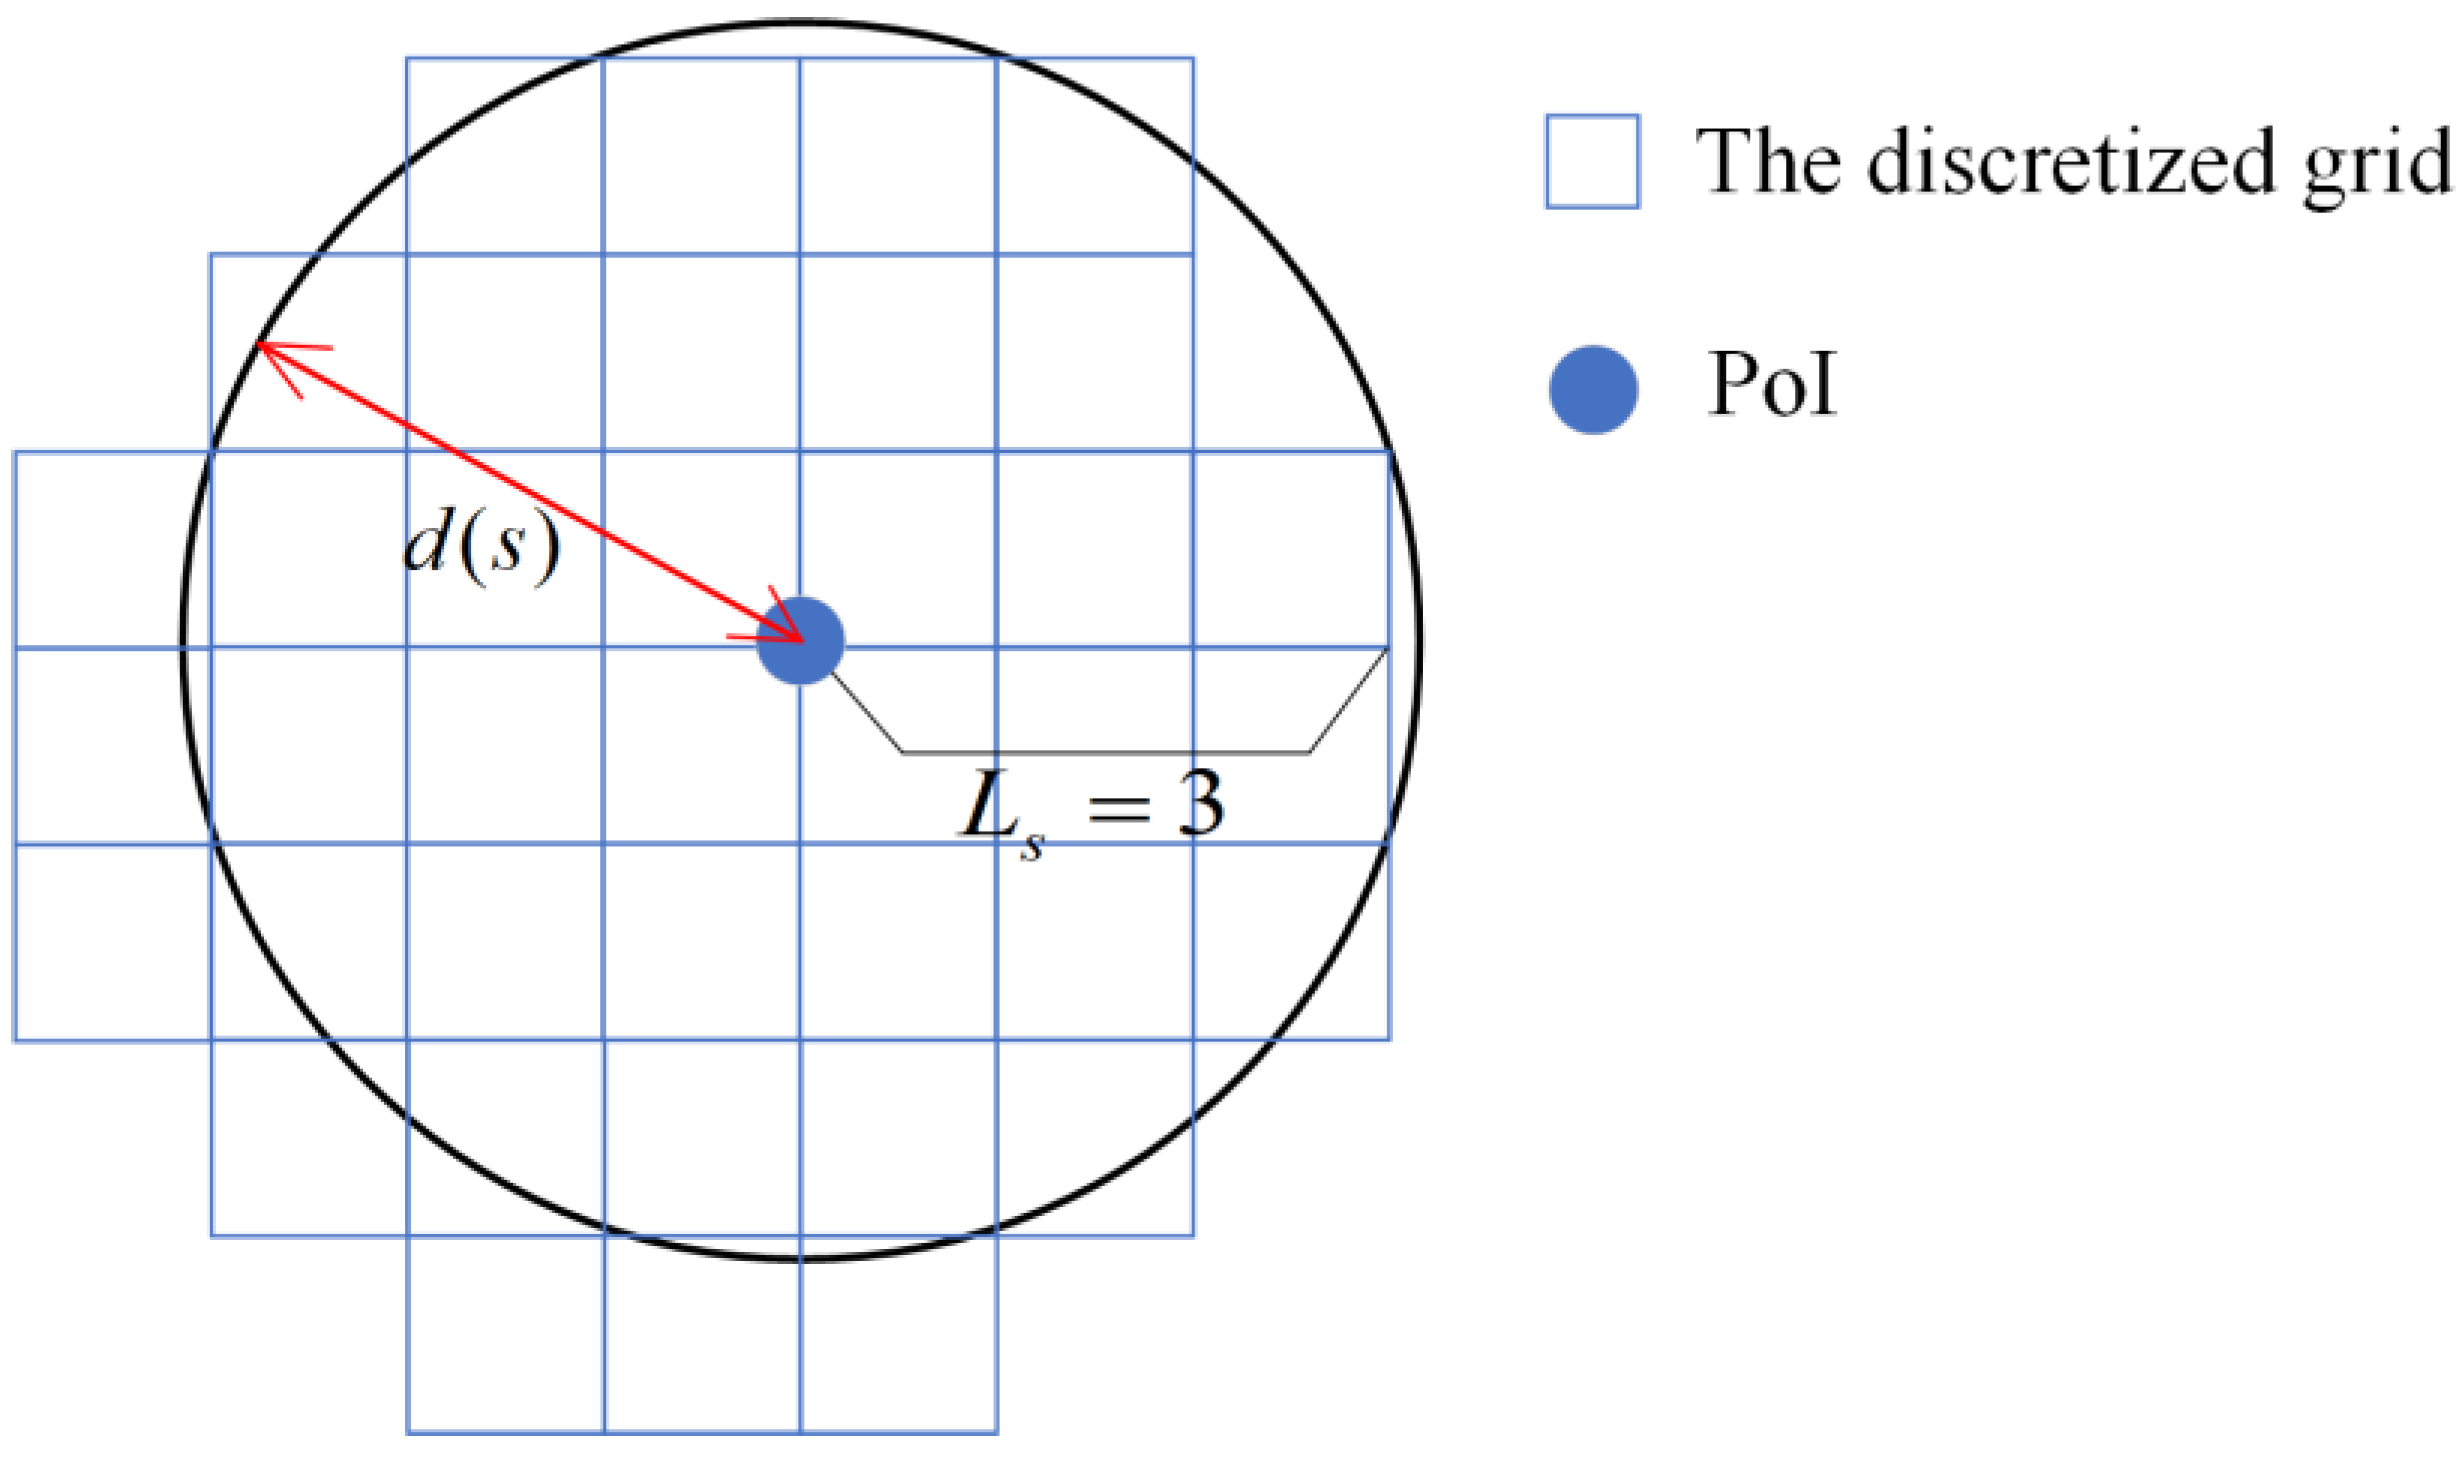
For sensor deployment, all effective deployment locations of sensor are within the maximum sensing distance d s centered at the PoIs, and d s = ( l n   c t h λ β + r r e ) . Therefore, a grid discretization of perception area is adopted at each PoI. As shown in Figure 3, each grid square is represented by its upper right corner. If the distance between a grid square and the PoI is less than d s , this grid square is a candidate deployment location for sensor, and all candidate deployment locations for sensors form a set S . In order to minimize the discretization error, an integer L s = 3 is used as the number of squares along the radius direction, and then the length of each square is:
d s = d s sin ( tan 1 ( 1 / L s ) )
For charger deployment, all effective deployment locations of charger are within the maximum charging distance d t h centered at the sensors. Therefore, a grid discretization of charging area is adopted at each sensor. Similarly, each grid square is represented by its upper right corner, and the length of each square is L c . If the distance between a grid square and the sensor is less than d t h , this grid square is a candidate deployment location for charger, and all candidate deployment locations for chargers form a set C .

4.3. Approximate Algorithms for Deploying Sensors

Based on the result of area discretization, the GHDSAE solution in Algorithm 1 is proposed to deploy sensors. In Algorithm 1, two principles are adopted to iteratively select the optimal deployment location: (1) always choose a location that can cover the maximum number of PoIs that have not yet been covered; (2) based on the principle one, always choose a location closer to the deployed sensors.
Specifically, Line 1 initializes some key parameters, where Q is an intermediate parameter indicating the number of PoIs that have been covered by deployed sensors. In Line 2, the candidate location set S is calculated by the discretization method in Section 4.2. Lines 3–9 of Algorithm 1 are the iterative deployment phase. In Lines 4–6, for each candidate location in S , the number of uncovered PoIs that the location can cover within τ m a x time slots is calculated. In Line 7 the location with the highest number of covered PoIs is chosen as the optimal location to deploy a new sensor. If there exist multiple best locations, the distance between these locations and the deployed sensors are further compared, and the location with the smallest distance is chosen. In Line 8, all related variables are updated. Finally, in Line 10, the deployment of sensor S and the scheduling scheme for all sensors S T are outputted.
Algorithm 1: Details of the GHDSAE for sensor deployment
Input:  A   set   o i   of   O ,   the   maximum   working   time   slot   τ m a x ,
Output:  The   deployment   of   sensors   S ,   the   scheduling   scheme   of   all   sensors   S T
1: Q = 0 ,   N   ,   S T ,   S ;
2 :   Calculate   the   S ;
3 :   While   Q N  do
4:   For  each   s j S  do
5:    Calculate   the   maximum   number   of   uncovered   PoIs   for   the   previous   τ m a x slots;
6:    End for
7:   Find   the   candidate   location   of   sensor   s j with the largest number of effectively covering PoIs and the smallest distance to already deployed sensors;
8:   Update   Q ,     S T ,     S S { s j } ,   S S { s j } ;
9:  End while
10 :   Return   S ,   S T
In Algorithm 1, the number of PoIs is N . Firstly, the time complexity of the candidate location of sensors is O N L s 2 . Then the time complexity of calculating the coverage effect of candidate locations is O N L s 2 J N + τ m a x , and the complexity of selecting the best candidate location is O N 2 L s 4 + N L s 2 . Finally, the time complexity of deploying sensors and updating S T is O ( N J ) . The final time complexity is:
O N L s 2 + O N L s 2 J N + τ m a x + O N 2 L s 4 + N L s 2 + O N J = O N 2
The approximation rate of Algorithm 1 is similar to that in [38], which is ignored here.
To analyze the impact of the sensor aggregation effect on the charger deployment, we further eliminate the sensor aggregation effect in Line 7 of Algorithm 1, and this modified approach is referred to as the greedy heuristic solution for deploying sensors (GHDS).

4.4. Approximate Algorithm for Deploying Chargers

Based on the results of sensor deployment, the GH solution in Algorithm 2 and the PSO solution in Algorithm 3 are proposed to deploy the chargers. In Algorithm 2, the principles for iteratively selecting the optimal deployment locations for new chargers are: (1) preferentially deploy chargers for a sensor that has not yet been fully charged and has the most neighbor sensors that have not yet been fully charged; (2) based on the principle one, always choose the locations that can charge the maximum number of sensors that have not yet been fully charged. Specifically, the number of neighbor sensors is defined as the number of other sensors in a circle centered at the sensor with a radius of 2 d t h .
The process of Algorithm 2 is as follows: in Line 1, the minimum charging power P m i n s j of each sensor s j in S is calculated according to the sensor scheduling S T and Equation (5). In Line 2, the candidate location set C is calculated by the discretization method in Section 4.2. In Line 3, the candidate locations C are sorted in descending order based on the number of their covered sensors. The sensors S are sorted in descending order based on the number of neighbor sensors. Lines 4–9 are the iterative deployment phase. The k is the maximum number of chargers to be deployed to charge one sensor, and the L o o p _ 1 is a temporary intermediate variable. In Line 6, the charging power P h s j , C of s j based on the currently deployed charger C is calculated. If the s j is still not fully charged ( P h s j , C < P m i n s j ) and L o o p _ 1 < k , Lines 6 and 7 are executed to deploy new chargers for s j . In Lines 7 and 8, the charging power from the candidate locations for s j is calculated, and the candidate chargers with the maximum P h s j , C L o o p _ 1 are deployed. Finally, In Line 11, the deployed chargers C is outputted.
Algorithm 2: Details of GH for charger deployment
Input :   A   set   s j   of   S ,   the   scheduling   scheme   of   all   sensors   S T
Output :   The   deployment   of   chargers   C
1 :   Calculate   the   P m i n s j   for   each   sensor   s j   in   S ;
2 :   Calculate   the   C ;
3 :   Sort   the   C   and   S in descending order;
4 :   For   s j S  do
5 :   L o o p _ 1 = 0 ;
6 :   While   P h s j , C < P m i n s j && L o o p _ 1 k  do
7 :   Find   the   candidate   locations   with   the   largest   P h s j , C L o o p _ 1 ;
8 :   Update   C , C ;
9:   End While
10:  End For
11 :     Return   C
In Algorithm 2, assuming there are M sensors, firstly, the time complexity of calculating the charging power of the sensors and the candidate location of chargers is O M and O M L c 2 respectively. The time complexity of arranging the candidate chargers in descending order is O ( M 2 L c 2 + M 2 L c 4 ) . The time complexity of arranging the sensors in descending order according to the number of neighbors of the sensor is O ( M 2 L c 2 + M 2 ) . The time complexity of deploying chargers is O ( k M 2 L c 2 ) . The final time complexity is:
O M L c 2 + O M + O M 2 L c 2 + M 2 L c 4 + O M 2 L c 2 + M 2 + O ( k M 2 L c 2 ) = O ( M 2 )
Algorithm 3 uses the PSO solution to deploy the chargers. To avoid falling into a local optimal solution, three improvements are made: (1) The sensors are arranged in descending order according to their neighbor sensors. The number of neighbor sensors is defined as the number of other sensors in a circle centered at the sensor with a radius of 2 d t h ; (2): A square search area is established for each sensor. The search area is centered at the sensor with the side length of 2 d t h ; (3): Deploy up to k chargers per sensor to achieve full charging; otherwise, deployment will fail. We define the particle Z i = ( X 1 , Y 1 , . . . , X i , Y i ) in Φ , and the iteration velocity v i and iteration location X i of the particles are respectively:
v i ( t + 1 ) = ω · v i ( t ) + φ k · r k · ( ρ i X i ( t ) ) + φ l · r l · ( ρ l X i ( t ) ) X i ( t + 1 ) = X i ( t ) + v i ( t + 1 )
v i ( t ) and X i ( t ) are the current velocity and location of the particle Z i , ρ i is the current best location of Z i , ρ l is the current best location of all particles, r k and r l are two random vectors at ( 0,1 ) , ω , φ k , φ l are the parameters of the particle swarm solution.
The details of the PSO solution deployment charger are shown in Algorithm 3. The principles for iteratively selecting the optimal deployment locations for new chargers are: (1) preferentially deploy chargers for a sensor that has not yet been fully charged and has the most neighbor sensors that have not yet been fully charged; (2) based on the principle one, choose the particles to deploy new chargers, where the maximum number of sensors that have not yet been fully charged can be charged. Specifically, the number of neighbor sensors is defined as the number of other sensors in a circle centered at the sensor with a radius of 2 d t h .
The process of Algorithm 3 is as follows: In Line 1, the minimum charging power P m i n s j of each sensor s j in S is calculated. In Line 2, the sensors S are sorted in descending order based on the number of neighbor sensors. Lines 3–10 are the iterative deployment phase. Similarly, k is the maximum number of chargers to be deployed to charge one sensor, and L o o p _ 1 is a temporary intermediate variable. In Line 5, the charging power P h s j , C of s j based on the currently deployed charger C is calculated. If the s j is still not fully charged ( P h s j , C < P m i n s j ) and L o o p _ 1 < k , Line 6 is executed to deploy new chargers for s j . In Line 6, g iterations are executed to update the positions of the particles and calculate the maximum fitness value P h s j , C L o o p _ 1 . In Line 7, the particle with the maximum P h s j , C L o o p _ 1 is used to deploy new chargers. Finally, In Line 10, all deployed chargers C is outputted.
Algorithm 3: Details of PSO for charger deployment
Input :   A   set   s j   of   S ,   the   parameters   of   the   chargers ,   the   scheduling   scheme   of   all   sensors   S T
Output :   The   deployment   of   chargers   C
1 :   Calculate   the   P m i n s j   of   the   sensor   s j ;
2 :   Sort   the   S in descending order;
3 :   For   each   s j S  do
4 :   L o o p _ 1 = 0 ;
5 :   While P h s j , C < P m i n s j && L o o p _ 1 k  do
6 :   Iterate   g   times ,   and   calculate   the   maximum   fitness   value   P h s j , C L o o p _ 1 of each particle;
7 :   Select   the   particle   with   the   maximum   P h s j , C L o o p _ 1 ,   update   C ;
8:   End While
9:  End for 
10 :   Return   C
For Algorithm 3, the number of sensors is M , the particles in the PSO solution are w , and the iteration of each search is g . The time complexity of calculating the minimum charging power for a sensor is O M . The time complexity of calculating the number of sensors in the number of neighbors of the sensor and sorting them in descending order is O ( M 2 ) . Iterate g times, the time complexity of calculating the maximum P h s j , C L o o p _ 1 with at most k particles is O ( k w g M 2 ) . The time complexity of updating the set of chargers is O ( k M ) . The final time complexity is:
O M + O ( M 2 ) + O ( k w g M 2 ) + O ( k M ) = O ( M 2 )

5. Simulation Evaluation

5.1. Simulation Setup

Extensive simulations are performed to verify the accuracy, scalability and efficiency of the proposed algorithm. In these simulations, the PoIs are randomly distributed in a two-dimensional space Φ of 50 m × 50 m. The parameters used in the simulations are shown in Table 3, where the parameters in the sensing model and charging model refer to those in [34,35], respectively.
Corresponding to the two sub-problems in Section 3.4 and the corresponding solutions in Section 4, the subsequent analyses are also carried out from two parts, i.e., sensor deployment and charger deployment. All numerical analyses are generated by averaging the results of 50 independent simulations to avoid the influence of random factors. All experiments are evaluated in the MatlabR2021a environment, and the computer model is Lenovo Legion Y7000 2020 (Shanghai, China).

5.2. Solution of the Sensor Deployment

As the foundation of charger deployment, we verify the scalability and efficiency of the GHDSAE solution and the GHDS solution for the sensor deployment by varying the number of PoIs, the discretization accuracy, and the perception probability.

5.2.1. Varying the Number of PoIs

Figure 4 shows the performance of deployed sensors when the number of PoIs is varying. The results show that as the number of PoIs increases, more sensors are deployed for both the GHDS solution and the GHDSAE solution, but the increase rate slows down because as the number of PoIs increases, the possibility of one sensor monitoring multiple PoIs gradually increases, which results in a slower increasing trend of the number of deployed sensors. Compared with the GHDS solution, the GHDSAE solution saves −0.04~0.47% (with an average of 0.19%) sensors, but the GHDSAE solution consumes 207.62~262.34% (with an average of 232.53%) more time than the GHDS solution. Therefore, the number of sensors deployed by the GHDSAE solution is comparable to that deployed by the GHDS solution, and thus, the aggregation effect has no significant impact on the deployment of sensors. Although the GHDSAE solution takes longer than the GHDS solution, its execution time is still within seconds, making it acceptable. In summary, both algorithms are scalable as the problem scale grows.

5.2.2. Varying the Number of L s

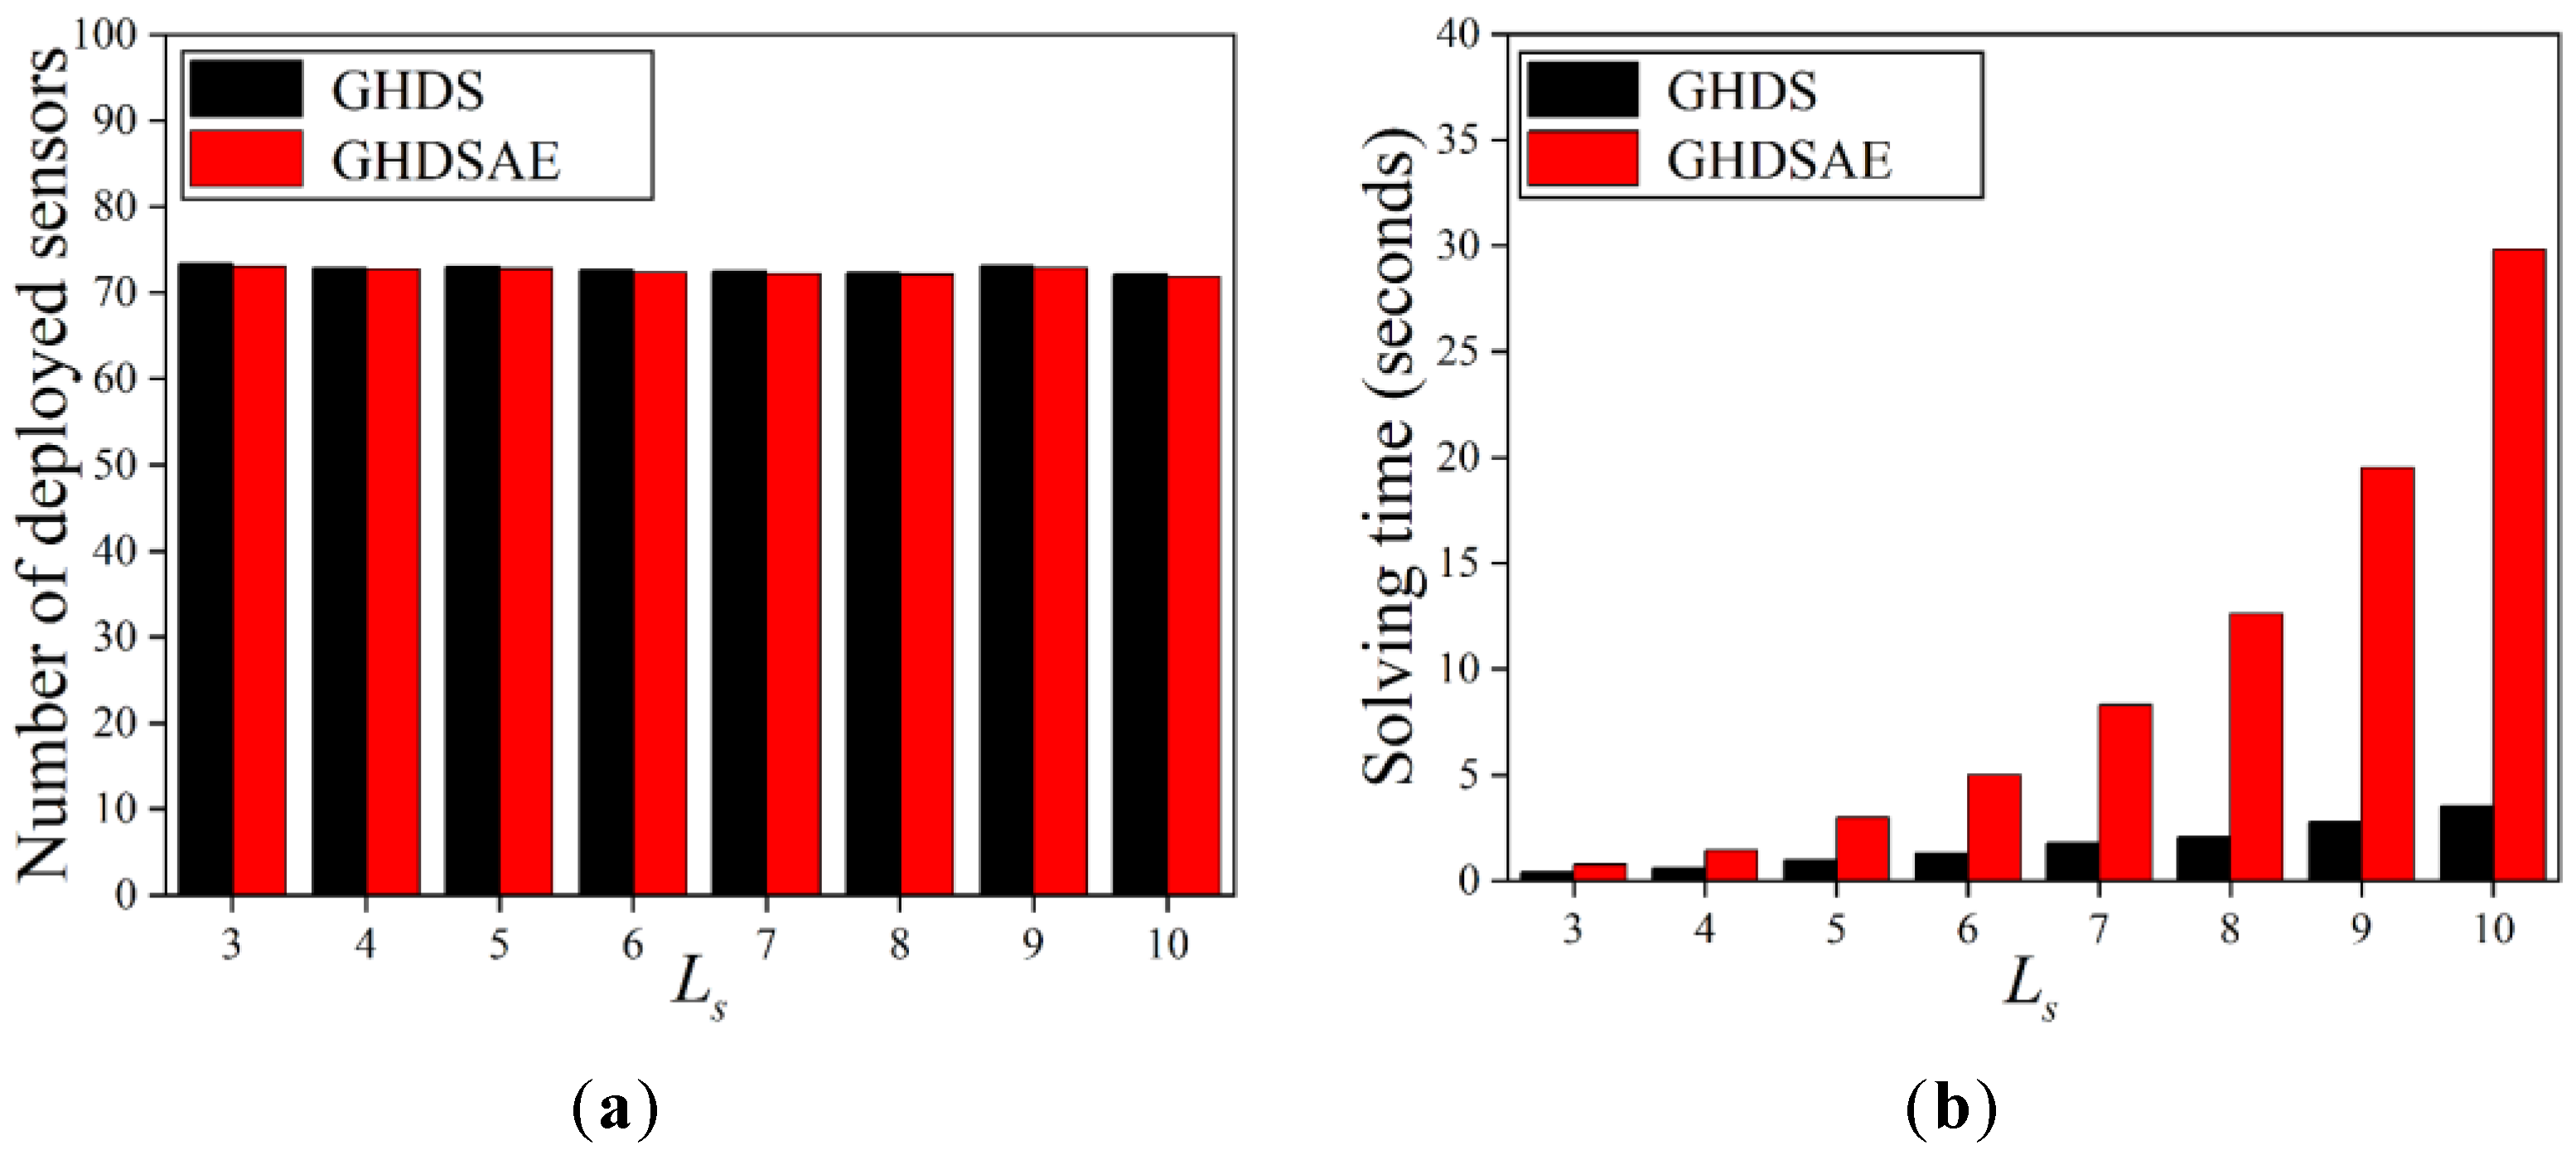
Figure 5 shows the performance of deployed sensors when the number of L s is varying. We can see that the number of sensors deployed by the two solutions is equivalent. Furthermore, the number of deployed sensors does not change significantly as L s increases. This can be explained by the fact that most sensors are deployed near the border of the circle sensing area of each PoI, and thus, the improvement of discretization accuracy of the deployment area by increasing L s does not affect the deployment result of the sensor. With the increase of L s , the solving time of the two solutions increases significantly, and the growth rate of the GHDSAE solution is faster, but its solving time is still in seconds. In summary, both algorithms are robust as the discretization accuracy grows.

5.2.3. Varying the Perception Probability of Sensors

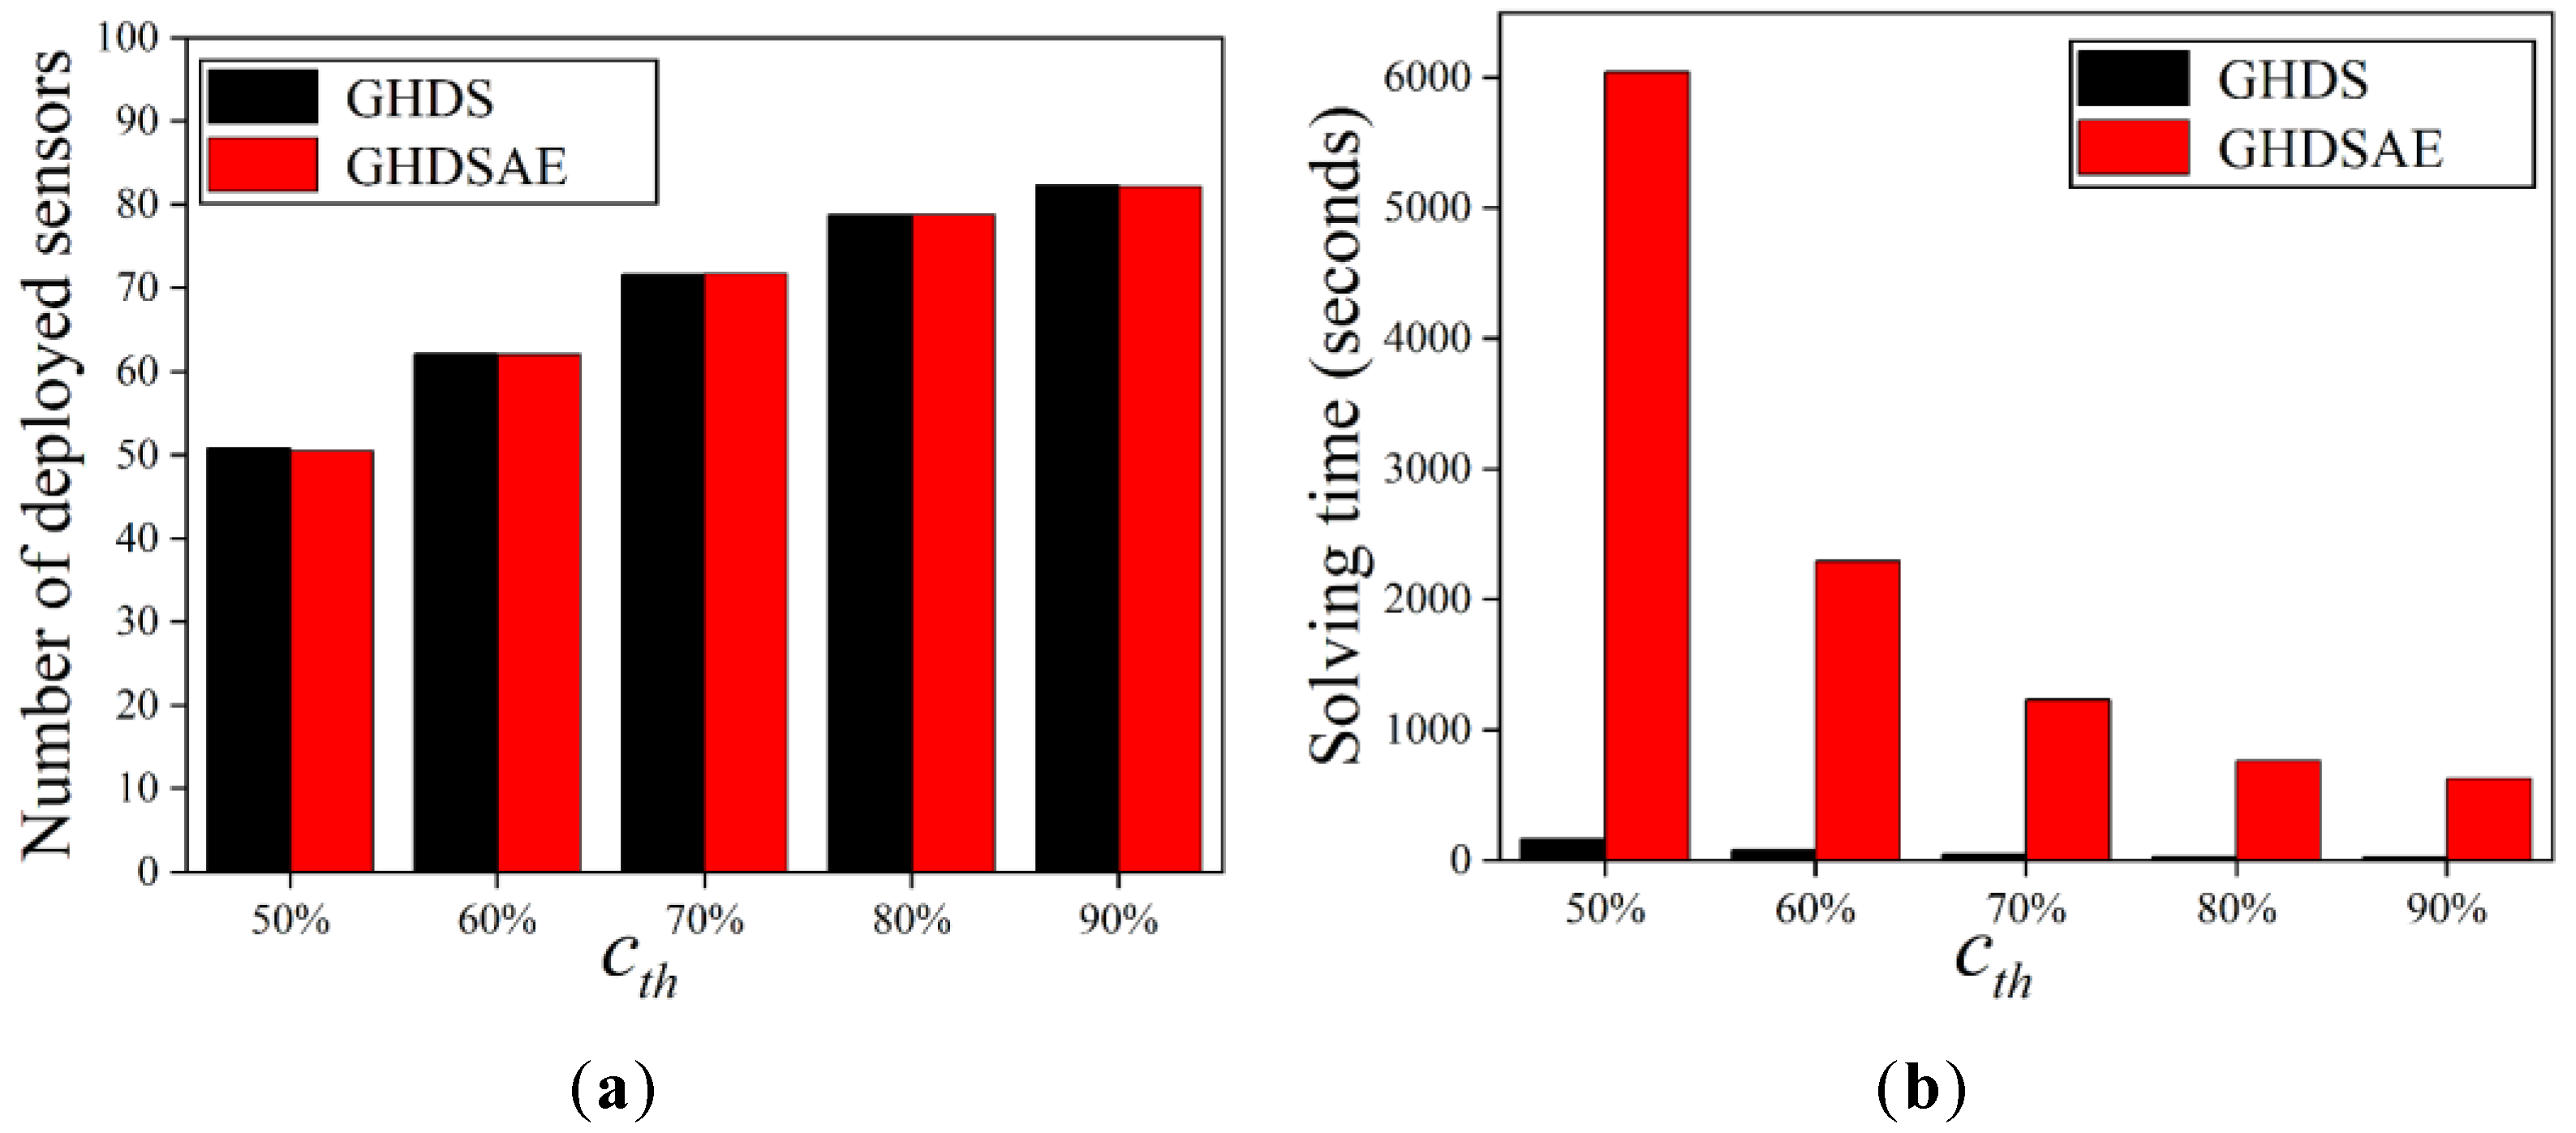
Figure 6 shows the effect of increasing c t h on the number of deployed sensors. Due to the changing value of c t h , according to Equation (1), the maximum effective coverage radius of the sensor also changes, which results in a change in the distance between the candidate sensor and the PoI, and the distance between the candidate sensors. When c t h   = 90% and c t h   = 80%, the maximum effective coverage radiuses of the sensor are 2.3992 m and 2.2444 m, respectively, so the distance between the candidate sensors should not be greater than 0.1548 m, and if the distance is too small, the solving time will be too long. To eliminate the effect of spacing, we uniformly set the spacing between candidate sensors to 0.1 m.
As shown in Figure 6, the number of sensors deployed by the two solutions increases with the growth of c t h , and the increasing trend slows down. According to Equation (1), as c t h increases, the effective coverage radius of the sensor decreases and the rate of decrease slows down, which results in an increase in deployed sensors and a decrease in the growth trend. As c t h increases, the solving time gets shorter and shorter. Because of the high discretization accuracy, the higher the c t h , the fewer candidate locations there are for placing sensors, so the solving time decreases. In summary, both algorithms are scalable as the perception probability grows.
To sum up, the proposed solutions for sensor deployment are robust as the number of PoIs, the accuracy of sensor discretization and the probability of sensor perception grow. The number of sensors deployed by the GHDSAE solution is comparable to that of the GHDS solution. Although the GHDSAE solution takes longer than the GHDS solution, its execution time is still within seconds, making it acceptable.

5.3. Solution of the Charger Deployment

For the charger deployment scenarios, we verify the accuracy, scalability, and efficiency of the GHDSAE solution and the GHDS solution by varying the number of PoIs, the discretization accuracy, and the perception probability. Additionally, we verify that the aggregation effect of sensors reduces the number of chargers deployed, thus reducing the overall deployment cost of the network.

5.3.1. Varying the Number of PoIs

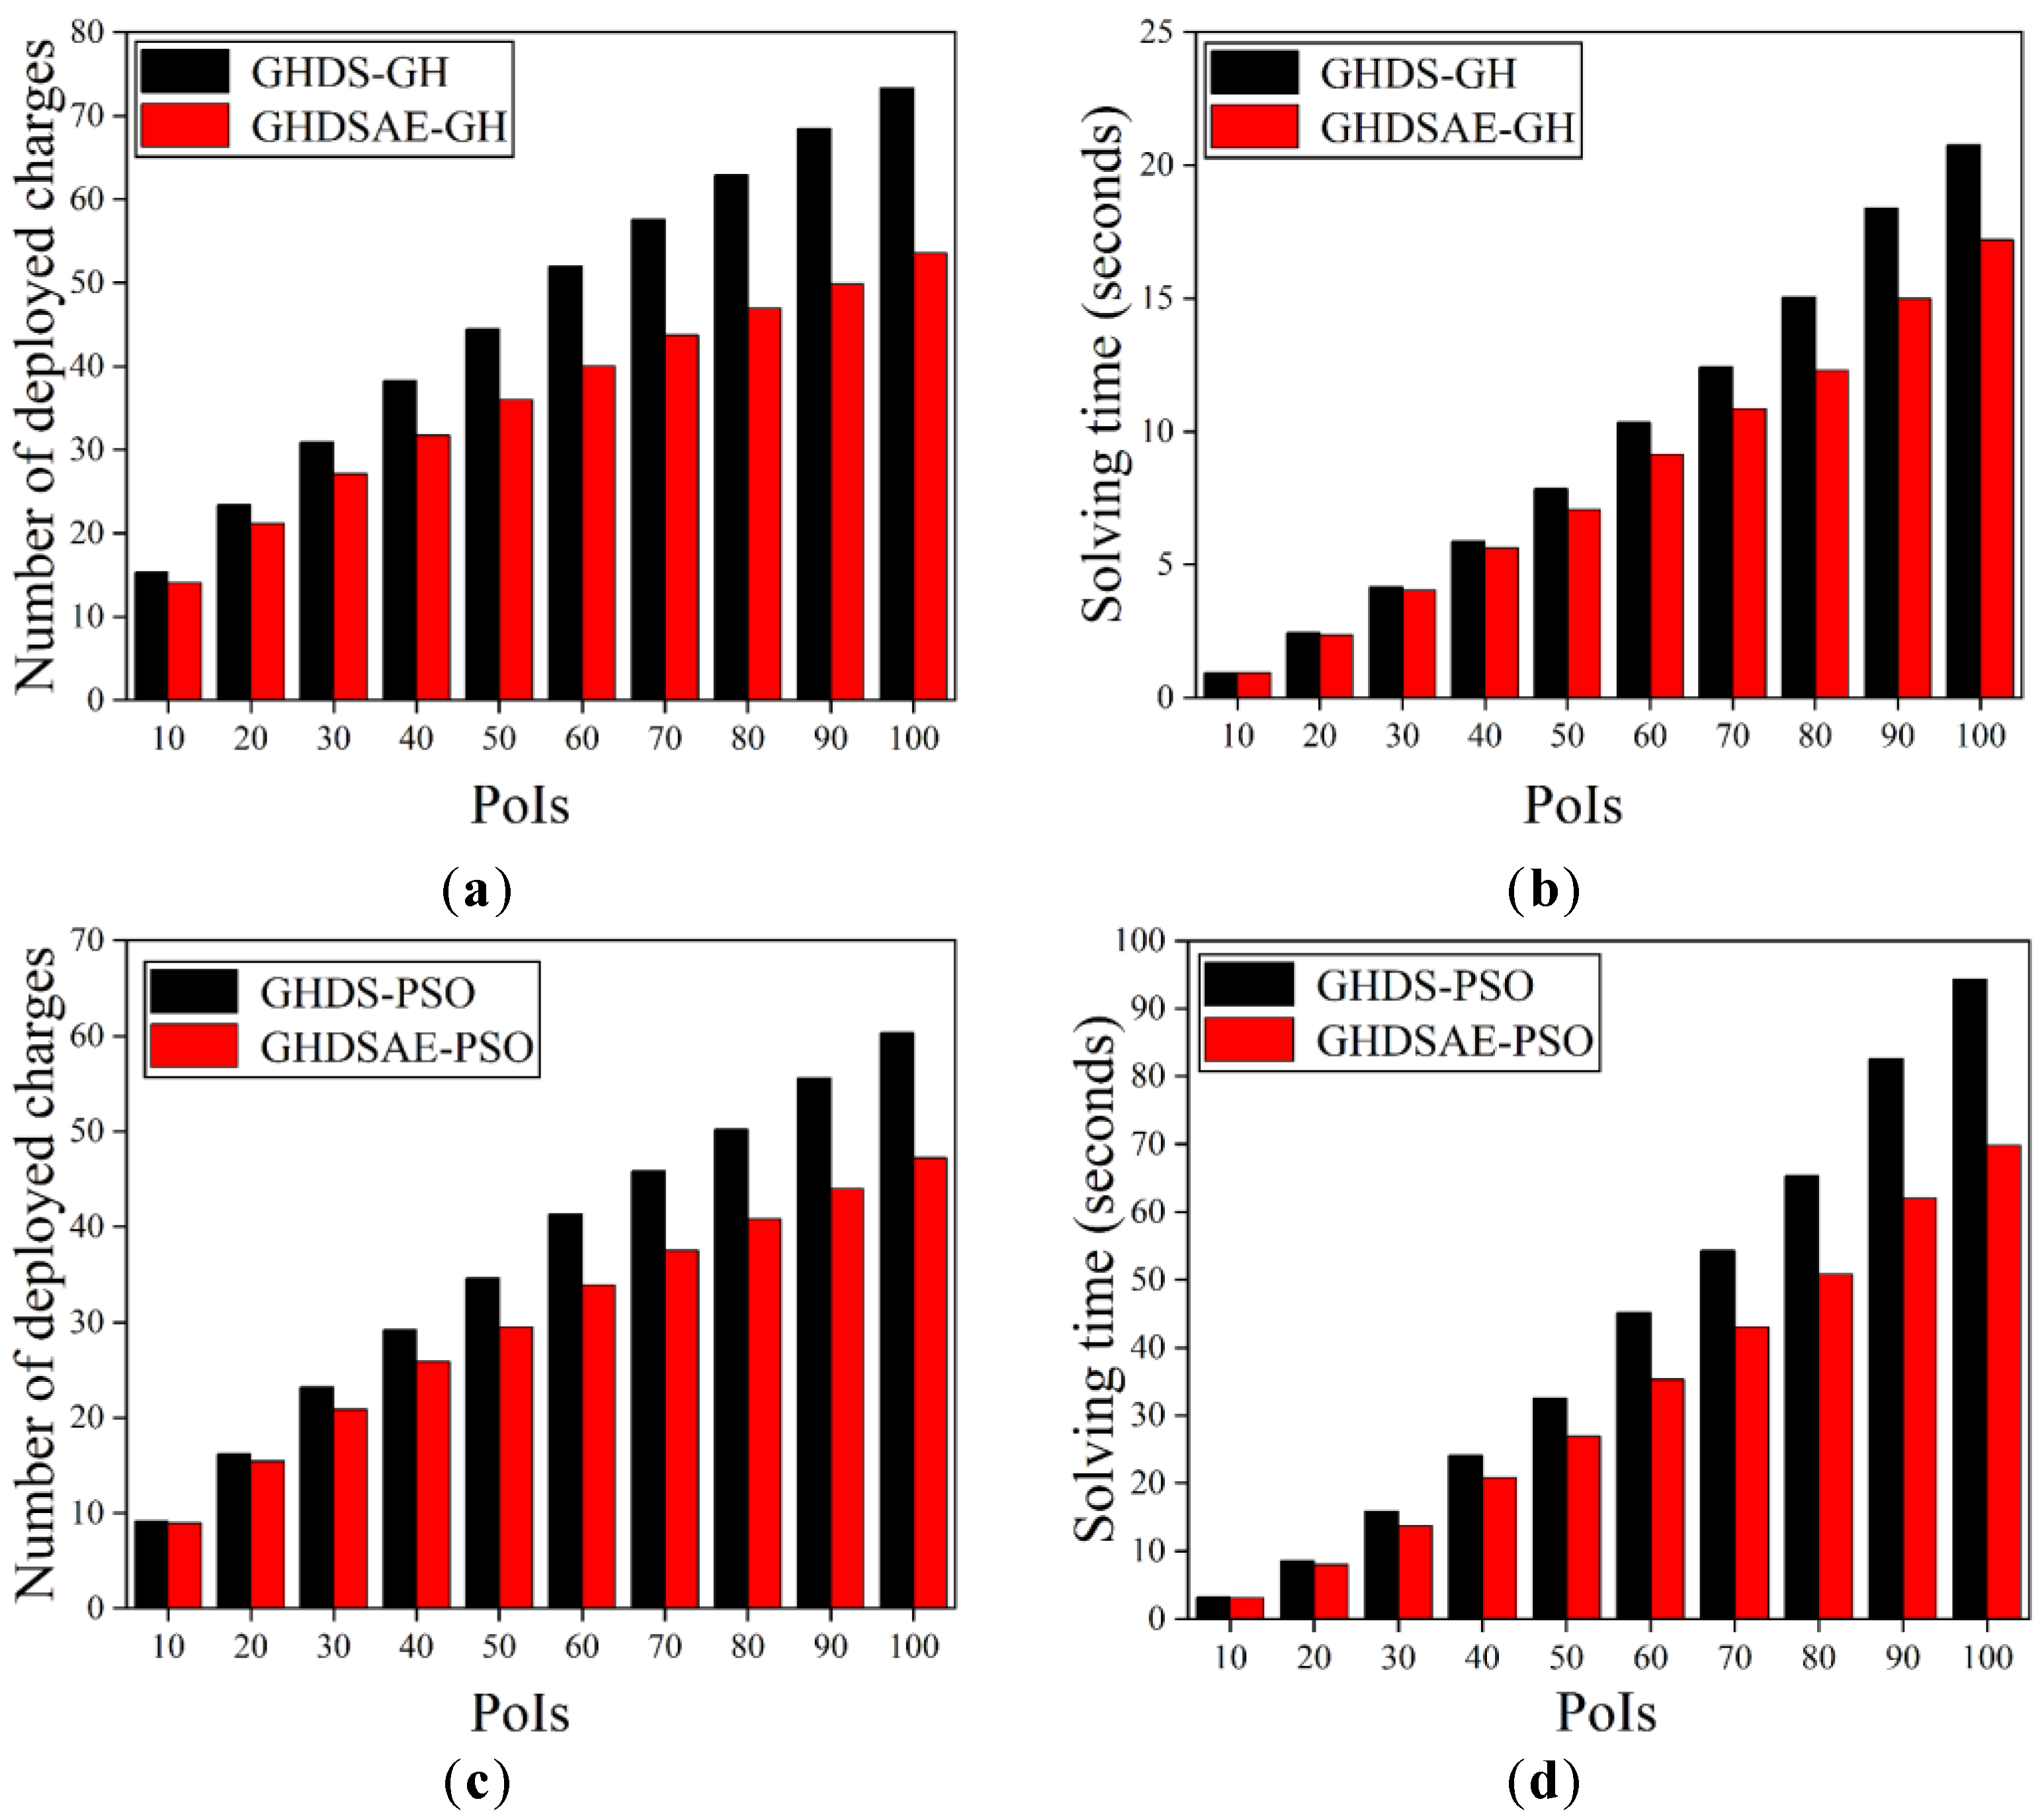
The scalability of the GH and the PSO solutions is verified by varying the number of PoIs to increase the problem scale. Figure 7 shows that as the number of PoIs increases, the number of deployed chargers also increases, and the growth trend gradually slows down. Both the GH and the PSO solutions based on the GHDSAE solution can always deploy fewer chargers than the GH and the PSO solutions based on the GHDS solution. In Figure 7a, the GHDSAE-based GH solution saves 8.09~27.19% (with an average of 19.27%) chargers than that of the GHDS-based GH solution. In Figure 7, the GHDSAE-based GH solution saves 0.14~18.58% (with an average of 9.92%) solution time than that of the GHDS-based GH solution. In Figure 7c, the GHDSAE-based PSO solution saves 1.97~21.72% (with an average of 14.44%) chargers than that of the GHDS-based PSO solution. In Figure 7d, the GHDSAE-based PSO solution overspends 2.23~25.95% (with an average of 16.86%) solution time than that of the GHDS-based PSO solution. As a result, the aggregation effect of sensors can effectively reduce the deployment of chargers at the cost of slightly incremental computing time. Likewise, both the PSO solution based on the GHDSAE and the GHDS solutions can always deploy fewer chargers than that of the GH solution based on the GHDSAE and the GHDS solutions. In Figure 7a,c, the GHDS-based PSO solution saves 17.71~40.34% (with an average of 23.98%) chargers than the GHDS-based GH solution. Furthermore, the GHDSAE-based PSO solution saves 11.80~36.36% (with an average of 19.00%) chargers than the GHDSAE-based GH solution. In Figure 7b,d, the GHDS-based PSO solution consumes 237.36~354.39% (with an average of 310.35%) more solving time than that of the GHDS-based GH solution. The GHDSAE-based PSO solution consumes 230.29~314.03% (with an average of 277.63%) more solving time than that of the GHDSAE-based GH solution. This is mainly due to the fact that the PSO solution is a random population intelligence-based optimization algorithm that requires several iterations to search for the optimal solution, and thus achieves delicate search and high-precision deployment. However, the PSO solution can always converge to an optimal solution with the cost of acceptable solving time. In summary, both the GH and PSO solutions are scalable as the problem scale grows, and the PSO solution always outperforms the GH solution by deploying fewer chargers with the cost of acceptable calculation time expenses, and the aggregation effect of sensors can effectively reduce the deployment of chargers at the cost of slightly incremental computing time.

5.3.2. Varying the Number of L s

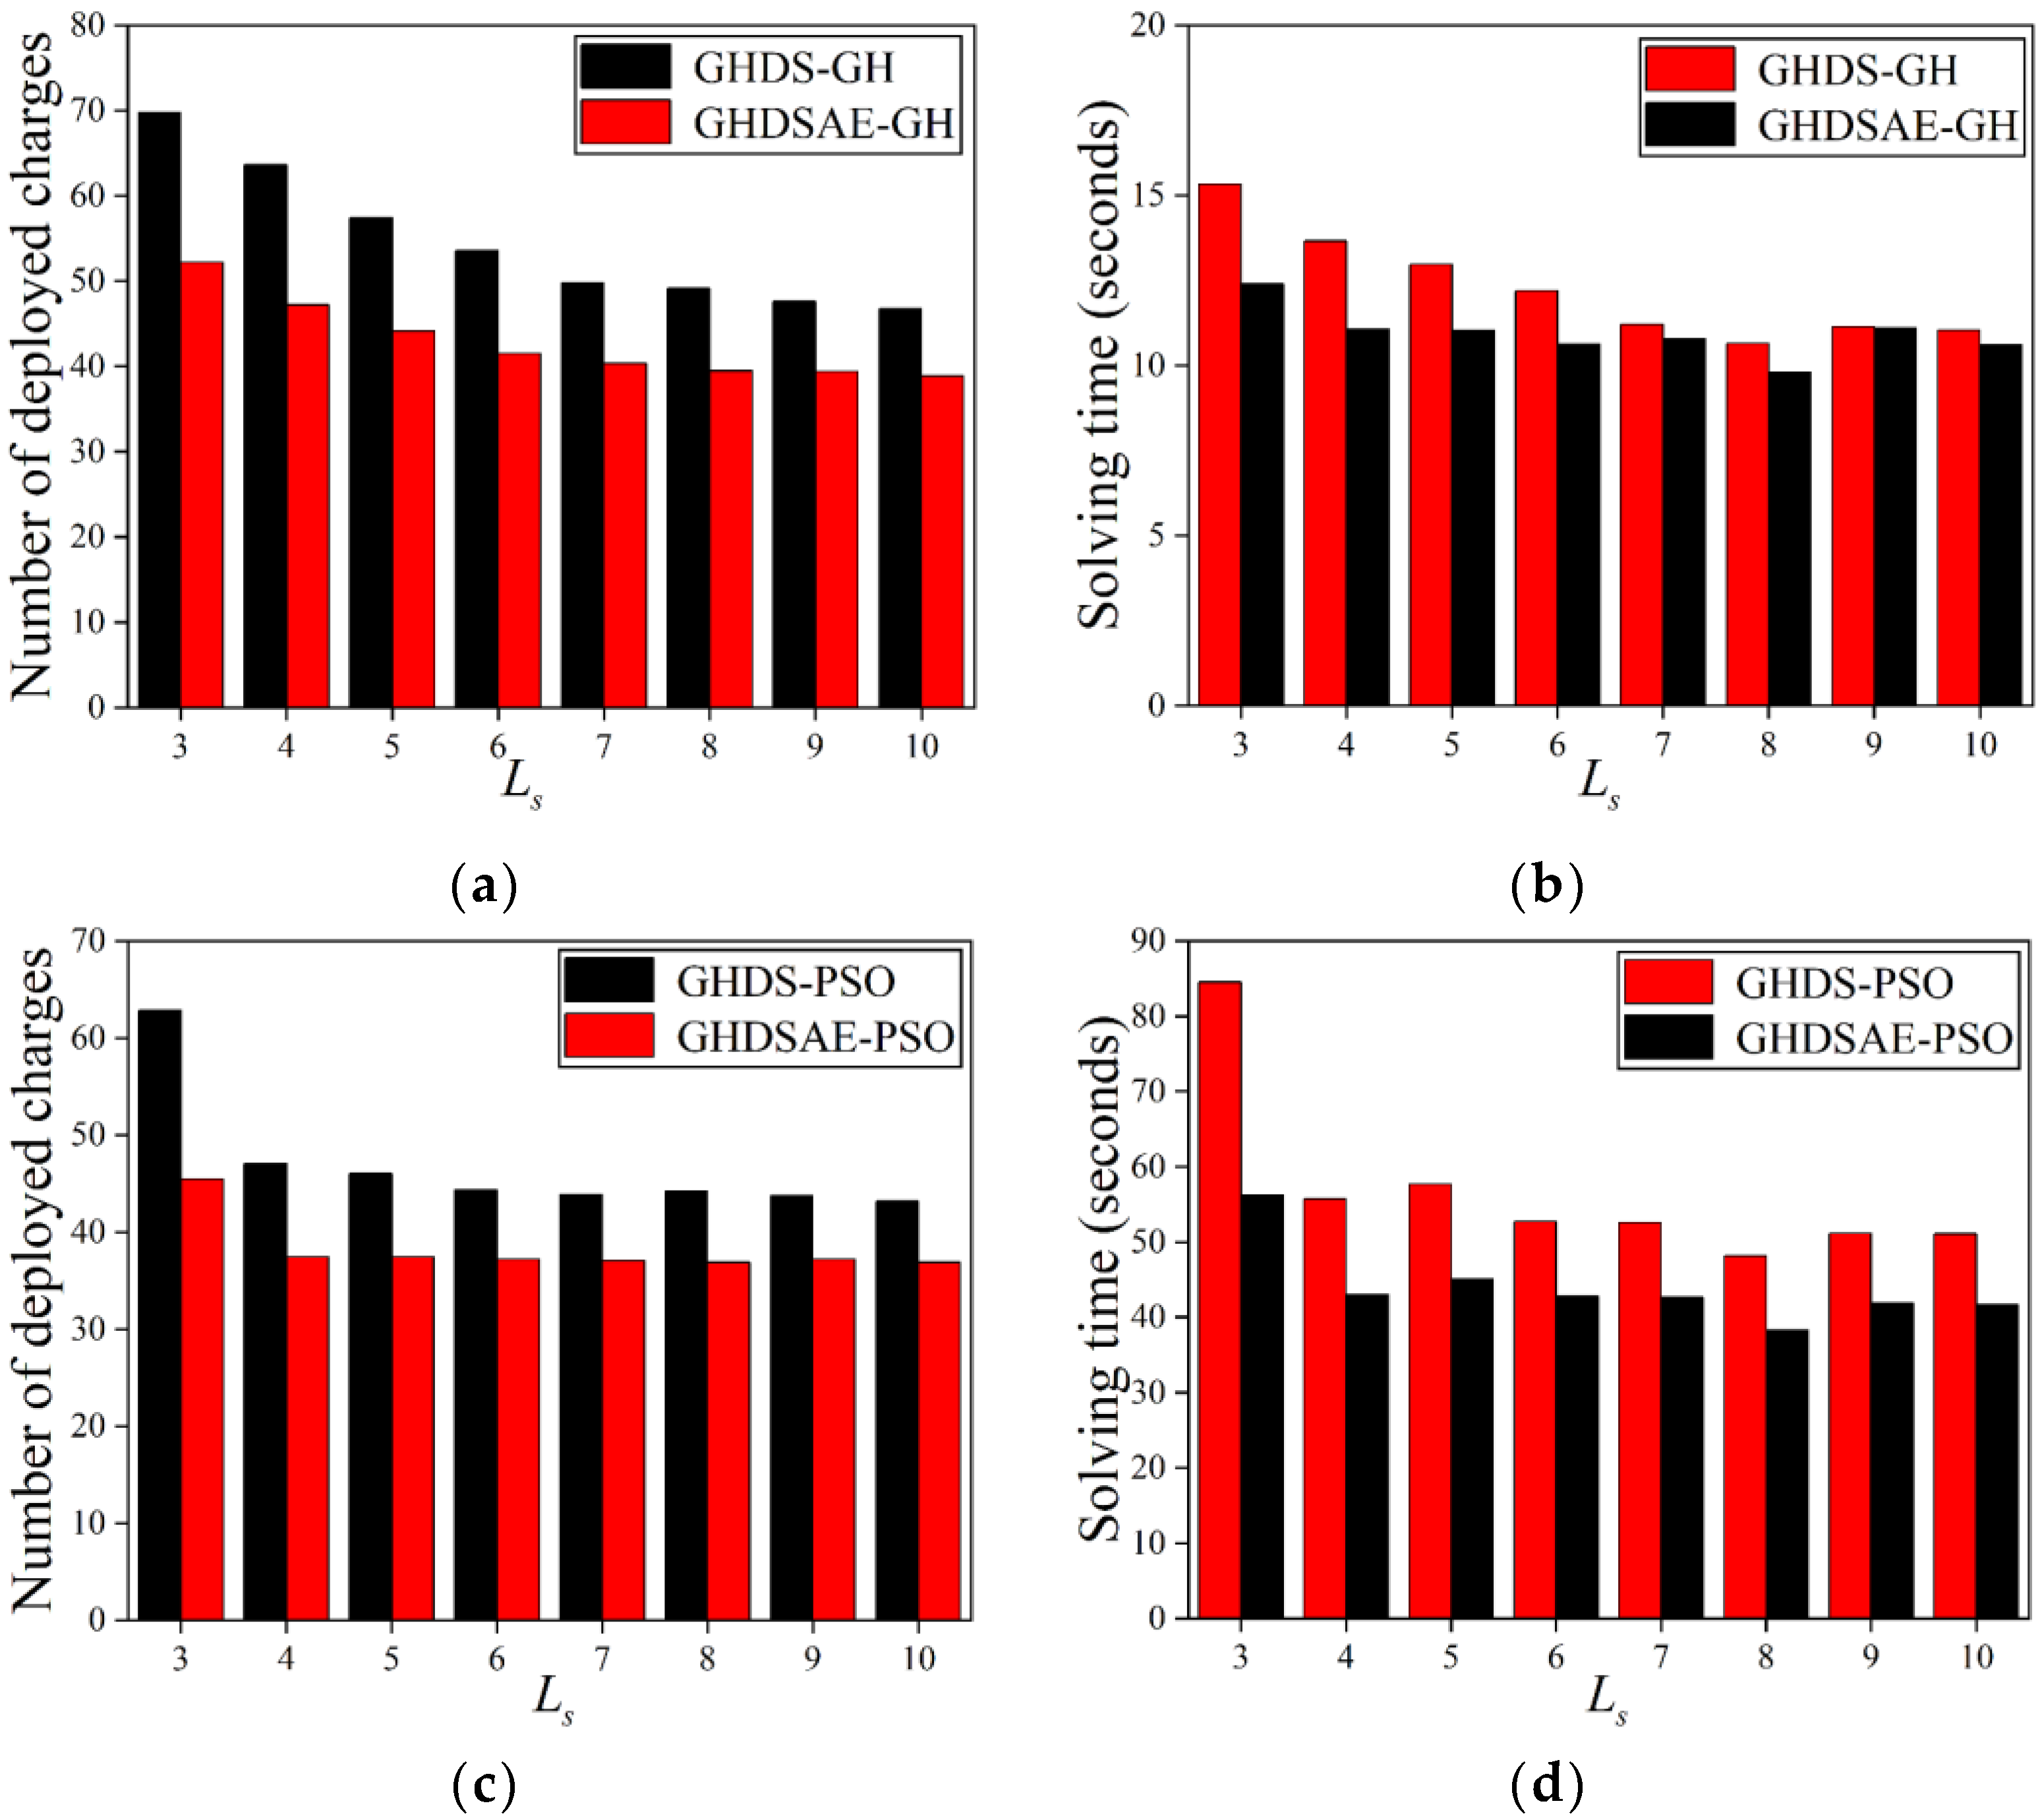
The accuracy of the GH and PSO solutions is verified by varying the number of L s to improve discretization accuracy. The results in Figure 8 show that as the number of L s increases, the number of deployed chargers decreases. Both the GH and PSO solutions based on the GHDSAE solution can always deploy fewer chargers than that of the GH and the PSO solutions based on the GHDS solution. In Figure 8a, the GHDSAE-based GH solution saves 16.82~25.81% (with an average of 21.20%) chargers than that of the GHDS-based GH solution. In Figure 8b, the GHDSAE-based GH solution saves 0.26~19.21% (with an average of 10.22%) less time than that of the GHDS-based GH solution. There is an inflection point at L s = 7 , and subsequent increases of L s do not significantly reduce the number of chargers. In Figure 8c, the GHDSAE-based PSO solution saves 14.60~27.77% (with an average of 18.08%) more chargers than the GHDS-based PSO solution. In Figure 8d, the GHDSAE-based PSO solution saves 18.15~33.51% (with an average of 21.62%) less time than that of the GHDS-based PSO solution. An inflection point occurs at L s = 5 , and subsequent increases of L s do not significantly reduce the number of chargers. In consequence, the aggregation effect of sensors can reduce the deployment of chargers at the expense of slightly incremental computing time. Likewise, both the PSO solutions based on the GHDSAE and the GHDS solutions can always deploy fewer chargers than that of GH solutions based on the GHDSAE and the GHDS solutions. In Figure 8a,c, the GHDS-based PSO solution saves 7.62~26.06% (with an average of 13.81%) more chargers than the GHDS-based GH solutions. The GHDSAE-based PSO solutions save 5.15~20.72% (with an average of 10.53%) more chargers than the GHDSAE-based GH solution. In Figure 8b,d, the GHDS-based PSO solution consumes 308.06~451.70% (with an average of 360.05%) more solving time than that of the GHDS-based GH solution, and the GHDSAE-based PSO solution consumes 276.72~354.08% (with an average of 301.20%) more solving time than that of the GHDSAE-based GH solution. In summary, both the GH and PSO solutions are scalable as the discretization accuracy grows, and the PSO solution always outperforms the GH solution by deploying fewer chargers with the cost of acceptable calculation time expenses, and the aggregation effect of sensors can effectively reduce the deployment of chargers at the cost of slightly incremental computing time.

5.3.3. Varying the Perception Probability of Sensors

Figure 9 shows the effect of the increase of sensor perception probability on the number of deployed chargers. The results show that with the increase of sensor perception probability, the number of deployed chargers increases, and the increasing trend slows down. In Figure 9a, the GHDSAE-based GH solution saves 9.99~19.39% (with an average of 13.43%) more chargers than the GHDS-based GH solution. In Figure 9b, the GHDSAE-based GH solution consumes −6.69~3.62% (with an average of 0.69%) more time than that of the GHDS-based GH solution. In Figure 9c, the GHDSAE-based PSO solution saves 8.98~20.79% (with an average of 12.98%) more chargers than the GHDS-based PSO solution. In consequence, In Figure 9d, the GHDSAE-based PSO solution saves 11.09~24.98% (with an average of 15.77%) less time than the GHDS-based PSO solution. As a result, the GHDSAE-based solution deployment chargers are superior to the GHDS-based solution deployment chargers with acceptable computing time. Likewise, both the PSO solutions based on the GHDSAE and the GHDS solutions can always deploy fewer chargers than the GH solution based on the GHDSAE and the GHDS solutions. In Figure 9a,c, the GHDS-based PSO solution saves 5.45~6.63% (with an average of 5.84%) chargers compared to the GHDS-based GH solution. The GHDSAE-based PSO solution saves 3.91~8.29% (with an average of 5.39%) more chargers than the GHDSAE-based GH solution. In Figure 9b,d, the GHDS-based PSO solution consumes 275.83~330.32% (with an average of 307.64%) more solving time than the GHDS-based GH solution. In summary, both the GH and PSO solutions are scalable as the perception probability grows, and the PSO solution always outperforms the GH solution by deploying fewer chargers with the cost of acceptable calculation time expenses, and the aggregation effect of sensors can effectively reduce the deployment of chargers at the cost of slightly incremental computing time.

5.3.4. Varying the Transmitting Power of Chargers

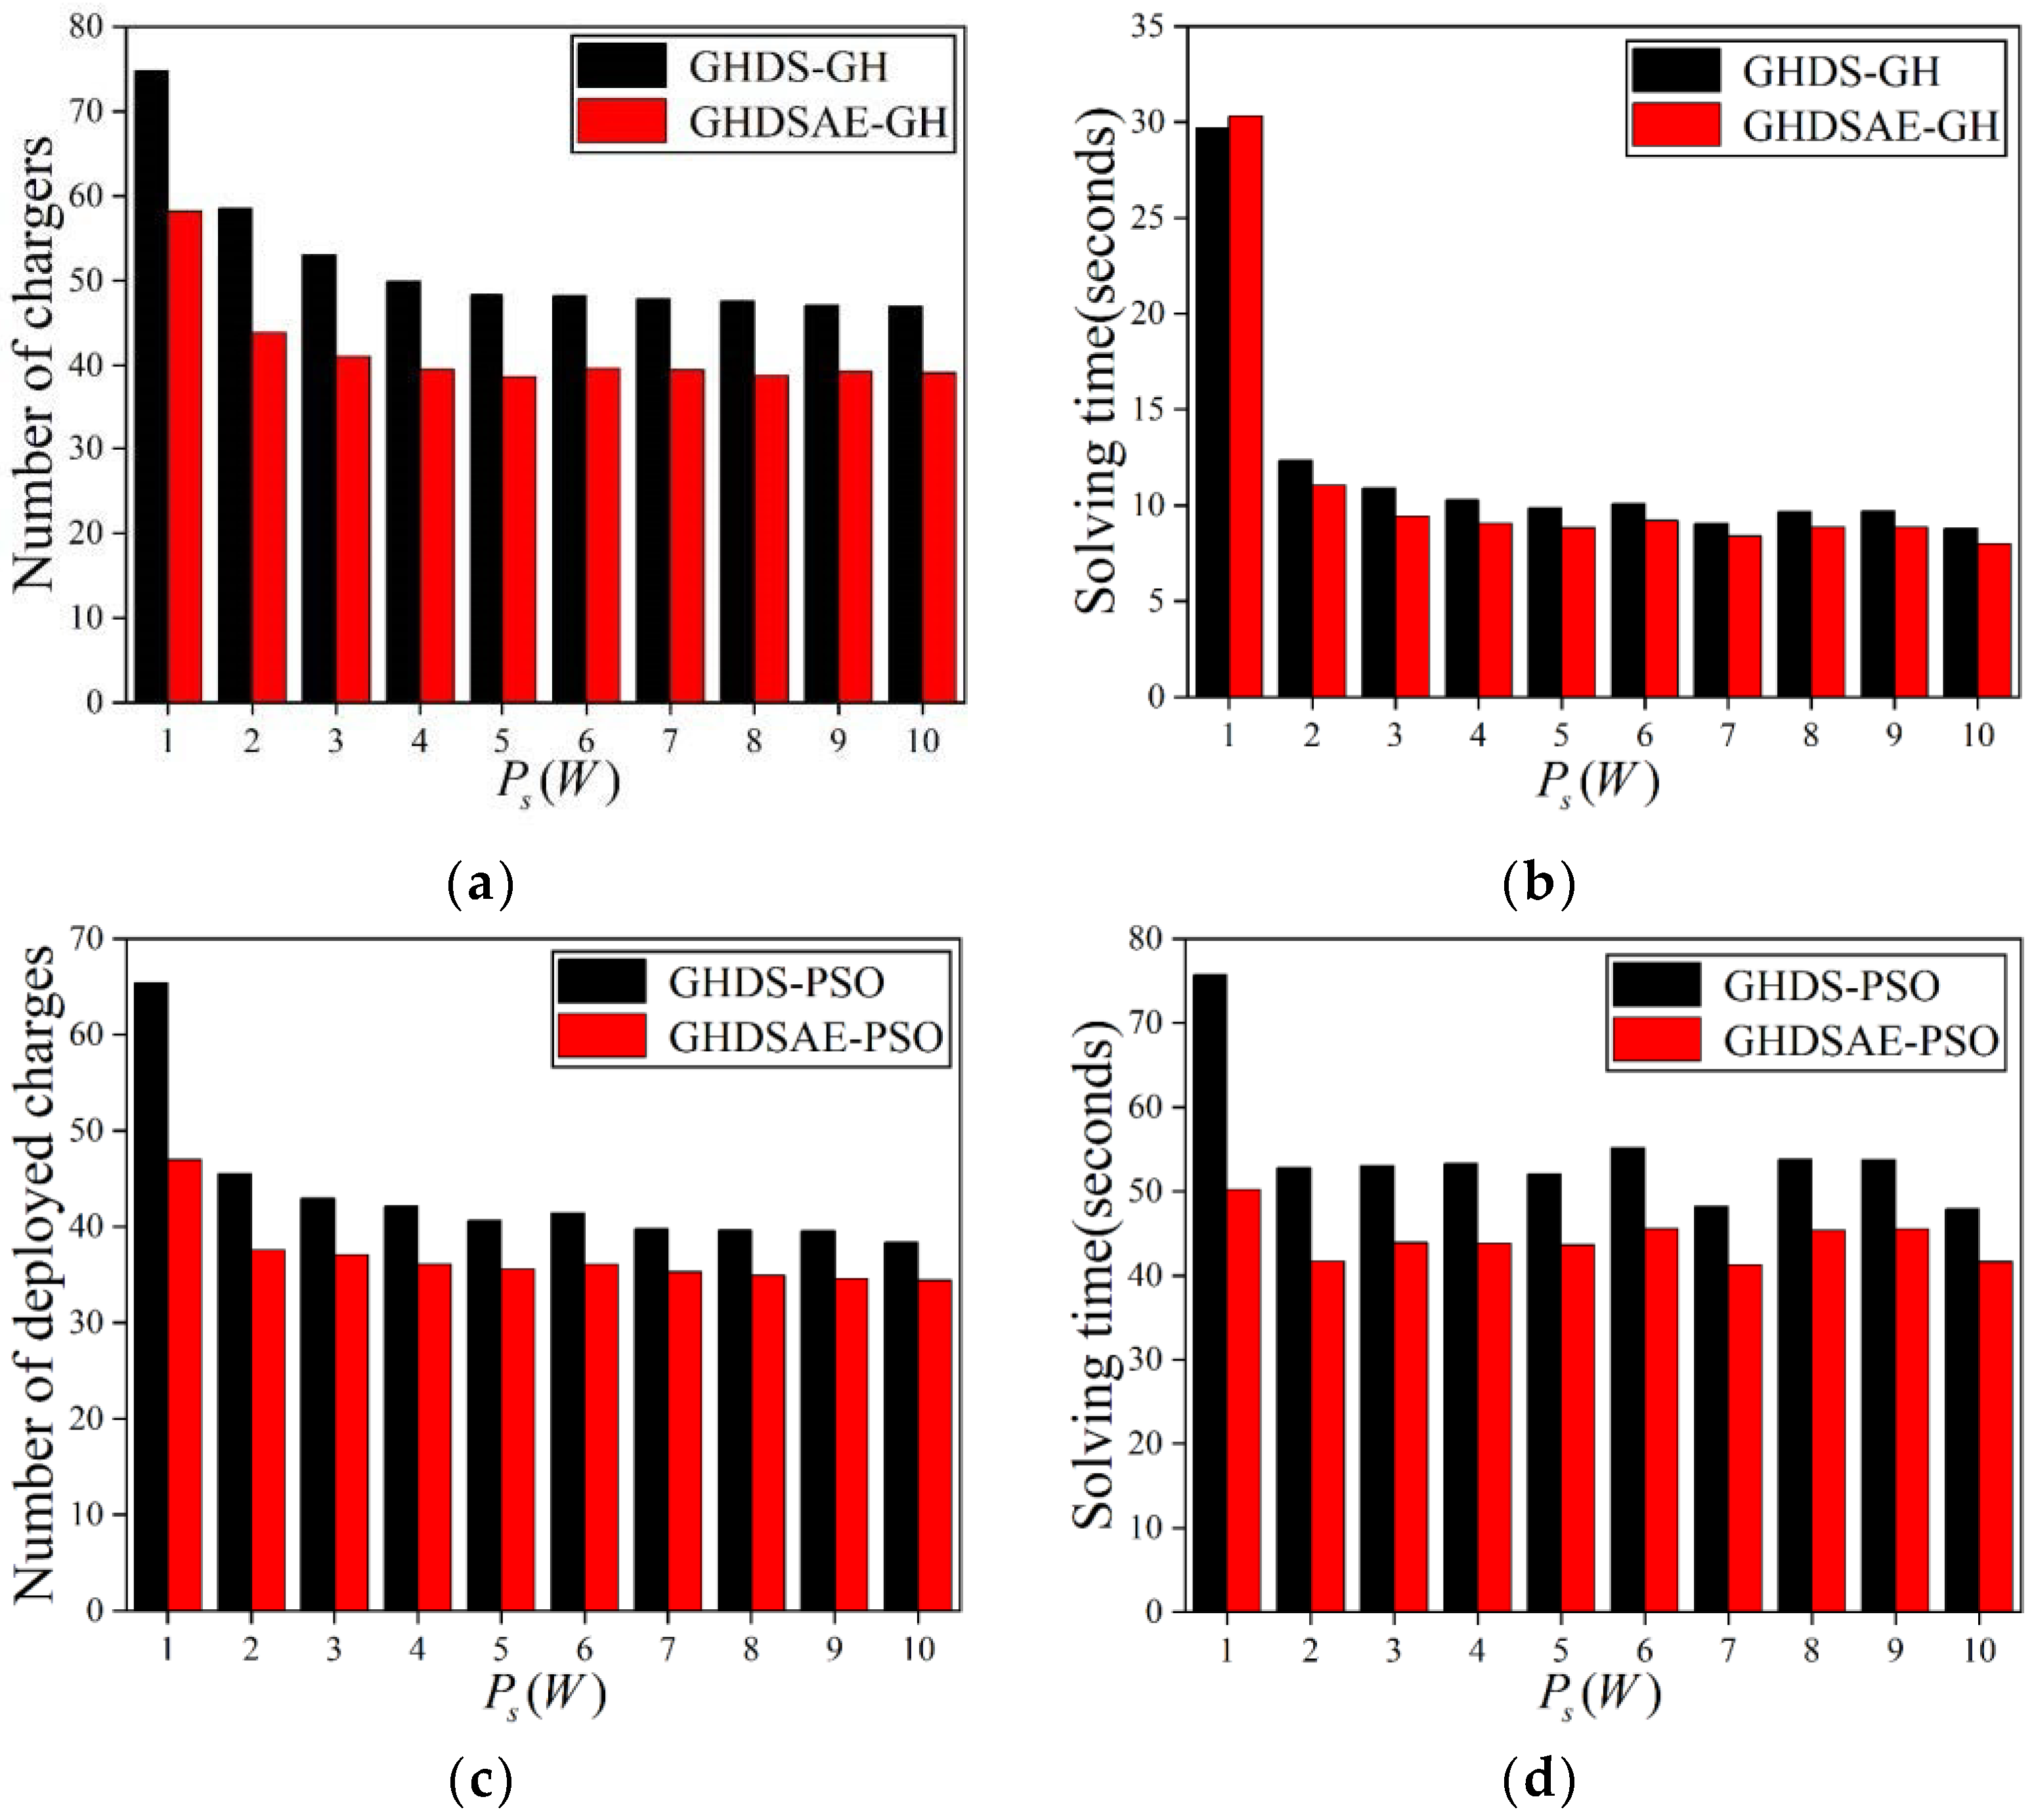
In Figure 10, the results show that as P s increases, the number of deployed chargers decreases. According to Equations (2) and (3), with the increase of P s , P h s j , c x is gradually increased while keeping d ( s j , c x ) and P h s j , C unchanged, the number of deployed chargers decreases. Both the GH and PSO solutions based on the GHDSAE solution can always deploy fewer chargers than that of GH and PSO solutions based on the GHDS solution. In Figure 10a, the GHDSAE-based GH solution saves 16.50~24.93% (with an average of 19.75%) chargers than that of the GHDS-based GH solution. In Figure 10b, the GHDSAE-based GH solution saves −2.13~13.5% (with an average of 8.70%) more time than the GHDS-based GH solution. In Figure 10c, the GHDSAE-based PSO solution saves 10.33~28.20% (with an average of 14.53%) more chargers than the GHDS-based PSO solution. In Figure 10d, the GHDSAE-based PSO solution saves 13.05~33.68% (with an average of 18.19%) less time than the GHDS-based PSO solution. As a consequence, the GHDSAE-based solution deployment chargers are superior to the GHDS-based solution deployment chargers, at the cost of a slight increase in time, which is still within an acceptable range. Likewise, both the PSO solutions based on the GHDSAE and the GHDS solutions can always deploy fewer chargers than the GH solution based on the GHDSAE and the GHDS solutions. In Figure 10a,c, the GHDS-based PSO solution saves 12.57~22.20% (with an average of 16.72%) more chargers than the GHDS-based GH solution. And the GHDSAE-based PSO solution saves 8.07~19.32% (with an average of 11.40%) chargers than the GHDSAE-based GH solution. In Figure 10b,d, the GHDS-based PSO solution consumes 154.95~457.14% (with an average of 395.25%) more solving time than the GHDS-based GH solution. The GHDSAE-based PSO solution consumes 65.56~422.69% (with an average of 352.50%) more solving time than the GHDSAE-based GH solution. In summary, both the GH and PSO solutions are scalable as the transmitting power grows, the PSO solution always outperforms the GH solution by deploying fewer chargers with the cost of acceptable calculation time expenses, and the aggregation effect of sensors can effectively reduce the deployment of chargers at the cost of slightly incremental computing time.

5.3.5. Varying the Number of L c

Since the charger discretization method is not used to deploy chargers based on the PSO solution, we only analyze the chargers deployed based on the GH solution. The results in Figure 8 show that as L c increases, the number of chargers deployed by the GH solution increases. When L c   = 1.5 (m), the number of deployed chargers has an inflection point, indicating that when L c   < 1.5 (m), L c does not affect the number of deployed chargers. When L c   > 1.5 (m), the number of deployed chargers increases with L c . As L c increases, according to Equation (2), the distance between candidate chargers increases, and the distance between the candidate chargers and the sensor increases, resulting in an increase in the number of deployed chargers. In Figure 11a, the GHDSAE-based GH solution saves 5.82~24.84% (with an average of 18.97%) more chargers than the GHDS-based GH solution. In Figure 11b, the GHDSAE-based GH solution saves −2.09~12.88% (with an average of 4.29%) less time than the GHDS-based GH solution. As a result, the deployed chargers of the GHDSAE-based solution are fewer than the GHDS-based solution with the cost of acceptable solving time growth, and the improvement of discrete accuracy for charging area can reduce the number of chargers deployed, but there is also a performance limit.
In conclusion, the proposed solutions for charger deployment are scalable as the number of PoIs, the accuracy of sensor discretization, the probability of sensor perception, the transmitting power of chargers, and the accuracy of charge discretization grow. The aggregation effect of sensors can effectively reduce the deployment of chargers at the cost of slightly incremental computing time. In addition, the PSO solution always outperforms the GH solution by deploying fewer chargers with the cost of acceptable calculation time expenses.

6. Conclusions

This paper explores the novel problem of jointly deploying sensors and chargers on a two-dimensional plane, deploying a minimum number of wireless sensors and chargers under the constraint of continuous monitoring PoIs. Considering the interaction between the deployment of sensors and chargers, we derive two progressive problems: P1 and P2. P1 solves the deployment of sensors with the constraint that the monitoring probability of any PoIs is not less than a preset limit c t h . P2 solves the deployment problem of chargers with the constraint that the minimum charging power of any sensors is not less than P m i n s j . We demonstrate that both P1 and P2 are NP-hard problems. We note that the aggregation effect of sensors can effectively reduce the number of deployed chargers, and therefore the GHDSAE solution is proposed. Then, the GH solution and the PSO solution are proposed for the deployment of chargers. The accuracy, scalability, and efficiency of the GH and PSO solutions are verified by changing the problem scale, the discretization accuracy, and the perception probability. The numerical comparative results show that the aggregation of sensors can effectively reduce the number of chargers required, based on which the PSO solution can effectively reduce the deployment of chargers at the cost of a slight increase in computing time. As a result, it is more cost-effective to deploy sensors using the GHDSAE solution approach and chargers using the PSO solution.
In the future, the joint deployment of sensors and chargers will be applied in mobile wireless rechargeable sensor networks for electric vehicle adoption rates, grid constraints, and renewable energy integration scenarios to further explore the key network performance, such as charging benefit maximization, monitoring benefit maximization, delay minimization, life cycle maximization, network deployment cost minimization, etc.

Author Contributions

H.Y.: Conceptualization, Methodology, Writing—Original draft preparation, Reviewing and Editing. J.L.: Data curation, Software and Validation. All authors have read and agreed to the published version of the manuscript.

Funding

This research was funded by the Science and Technology Commission of Shanghai Municipality grant number 18510745100.

Data Availability Statement

The original contributions presented in the study are included in the article, further inquiries can be directed to the corresponding author.

Conflicts of Interest

The authors declare no conflicts of interest.

References

  1. Royer, L.; Terray, L.; Rubéo-Lisa, M.; Sudre, J.; Gauthier, P.J.; Claude, A.; Giammanco, S.; Pecora, E.; Principato, P.; Breton, V. Lessons Learnt from Monitoring the Etna Volcano Using an IoT Sensor Network through a Period of Intense Eruptive Activity. Sensors 2024, 24, 1577. [Google Scholar] [CrossRef] [PubMed]
  2. Zhang, Y.; Cui, Y.; Wang, C.; Song, X.; Pei, Y.; Yuan, Z. Rotating permanent magnet antenna array for directional communication in pipeline monitoring system. AEU-Int. J. Electron. Commun. 2024, 177, 155210. [Google Scholar] [CrossRef]
  3. Armijo, A.; Zamora-Sánchez, D. Integration of Railway Bridge Structural Health Monitoring into the Internet of Things with a Digital Twin: A Case Study. Sensors 2024, 24, 2115. [Google Scholar] [CrossRef] [PubMed]
  4. Guetta, Y.; Shapiro, A. On-board physical battery replacement system and procedure for drones during flight. IEEE Robot. Autom. Lett. 2022, 7, 9755–9762. [Google Scholar] [CrossRef]
  5. Karamov, D.N.; Suslov, K.V. Structural optimization of autonomous photovoltaic systems with storage battery replacements. Energy Rep. 2021, 7, 349–358. [Google Scholar] [CrossRef]
  6. Sharma, P.; Holla, V.V.; Gurram, S.; Kamble, N.; Yadav, R.; Srinivas, D.; Pal, P.K. A Study of Battery Replacement Characteristics of Patients with Parkinson’s Disease and Factors Influencing Battery Drain. Mov. Disord. 2023, 26, 580–583. [Google Scholar] [CrossRef] [PubMed]
  7. Yang, Y.; Song, T. Energy-efficient cooperative caching for information-centric wireless sensor networking. IEEE Internet Things J. 2021, 9, 846–857. [Google Scholar] [CrossRef]
  8. Sudha, M.; Chandrakala, D.; Sreethar, S.; Shrivindhya, A. Energy Efficient Spiking Deep Residual Network and Binary Horse Herd Optimization Espoused clustering Protocol for Wireless Sensor Networks. Appl. Soft Comput. 2024, 157, 111456. [Google Scholar] [CrossRef]
  9. Nguyen, P.D.; Kim, L.W. Sensor system: A Survey of sensor Type, Ad Hoc network Topology and energy harvesting techniques. Electronics 2021, 10, 219. [Google Scholar] [CrossRef]
  10. Dziurdzia, P.; Bratek, P.; Markiewicz, M. An Efficient Electrothermal Model of a Thermoelectric Converter for a Thermal Energy Harvesting Process Simulation and Electronic Circuits Powering. Energies 2023, 17, 204. [Google Scholar] [CrossRef]
  11. Dhurgadevi, M.; Sakthivel, P. An Analysis of Wind Energy Generation by Opting the Better Placement of Wind Turbine by Artificial Neural Network and to Improve the Energy Efficiency of Wireless Sensor Network. Wirel. Pers. Commun. 2022, 123, 2607–2624. [Google Scholar] [CrossRef]
  12. Zheng, J.; Li, Z.; Zhang, H. Low-Wind-Speed Galloping Wind Energy Harvester Based on a W-Shaped Bluff Body. Energies 2024, 17, 958. [Google Scholar] [CrossRef]
  13. Makhetha, M.J.; Markus, E.D.; Abu-Mahfouz, A.M. Efficient wireless power transfer via self-resonant Conformal Strongly Coupled Magnetic Resonance for wireless sensor networks. Energy Rep. 2022, 8, 1358–1367. [Google Scholar] [CrossRef]
  14. Kuthadi, V.M.; Selvaraj, R.; Baskar, S.; Shakeel, P.M. Data security tolerance and portable based energy-efficient framework in sensor networks for smart grid environments. Sustain. Energy Technol. Assess. 2022, 52, 102184. [Google Scholar]
  15. Qiu, S.; Hao, Z.; Wang, Z.; Liu, L.; Liu, J.; Zhao, H.; Fortino, G. Sensor combination selection strategy for kayak cycle phase segmentation based on body sensor networks. IEEE Internet Things J. 2021, 9, 4190–4201. [Google Scholar] [CrossRef]
  16. Yuan, S. High-rise building deformation monitoring based on remote wireless sensor network. IEEE Sens. J. 2021, 21, 25133–25141. [Google Scholar] [CrossRef]
  17. Zhao, C.; Zhang, X.; Wu, C.; Chen, S.; Chen, F. Design of optimal utility of wireless rechargeable sensor networks via joint spatiotemporal scheduling. Appl. Math. Model. 2020, 86, 54–73. [Google Scholar] [CrossRef]
  18. Tita, E.D.; Nwadiugwu, W.P.; Lee, J.M.; Kim, D.S. Real-time optimizations in energy profiles and end-to-end delay in WSN using two-hop information. Comput. Commun. 2021, 172, 169–182. [Google Scholar] [CrossRef]
  19. Huang, S.C. A Charging-Aware Multi-Mode Routing Protocol for Data Collection in Wireless Rechargeable Sensor Networks. Sensors 2019, 19, 3338. [Google Scholar] [CrossRef]
  20. Malebary, S. Wireless mobile charger excursion optimization algorithm in wireless rechargeable sensor networks. IEEE Sens. J. 2020, 20, 13842–13848. [Google Scholar] [CrossRef]
  21. Zhang, P.; Ding, X.; Xu, J.; Wang, J.; Shi, L. Successive interference cancellation based throughput optimization for multi-hop wireless rechargeable sensor networks. Sensors 2020, 20, 327. [Google Scholar] [CrossRef] [PubMed]
  22. Sun, Y.; Lin, C.; Dai, H.; Wang, P.; Wang, L.; Wu, G.; Zhang, Q. Trading off charging and sensing for stochastic events monitoring in WRSNs. IEEE/ACM Trans. Netw. 2021, 30, 557–571. [Google Scholar] [CrossRef]
  23. Dhanvijay, M.M.; Patil, S.C. Internet of Things: A survey of enabling technologies in healthcare and its applications. Comput. Netw. 2019, 153, 113–131. [Google Scholar] [CrossRef]
  24. Ding, X.; Wang, Y.; Sun, G.; Luo, C.; Li, D.; Chen, W.; Hu, Q. Optimal charger placement for wireless power transfer. Comput. Netw. 2020, 170, 107123. [Google Scholar] [CrossRef]
  25. Wu, S.; Dai, H.; Xu, L.; Liu, L.; Xiao, F.; Xu, J. Comprehensive cost optimization for charger deployment in multi-hop wireless charging. IEEE Trans. Mob. Comput. 2022, 22, 4563–4577. [Google Scholar] [CrossRef]
  26. Fang, Z.; Chien, W.-C.; Zhang, C.; Hang, N.T.; Chen, W.M. GA-based Charger Deployment Algorithm in Indoor Wireless Rechargeable Sensor Networks. J. Internet Technol. 2023, 24, 487–494. [Google Scholar]
  27. Yu, N.; Dai, H.; Chen, G.; Liu, A.X.; Tian, B.; He, T. Connectivity-constrained placement of wireless chargers. IEEE Trans. Mob. Comput. 2019, 20, 909–927. [Google Scholar] [CrossRef]
  28. Wang, X.; Dai, H.; Wang, W.; Zheng, J.; Yu, N.; Chen, G.; Dou, W.; Wu, X. Practical heterogeneous wireless charger placement with obstacles. IEEE Trans. Mob. Comput. 2019, 19, 1910–1927. [Google Scholar] [CrossRef]
  29. Lin, T.L.; Chang, H.Y.; Wang, Y.H. A novel hybrid search and remove strategy for power balance wireless charger deployment in wireless rechargeable sensor networks. Energies 2020, 13, 2661. [Google Scholar] [CrossRef]
  30. You, W.; Ren, M.; Ma, Y.; Wu, D.; Yang, J.; Liu, X.; Liu, T. Practical charger placement scheme for wireless rechargeable sensor networks with obstacles. ACM Trans. Sens. Netw. 2023, 20, 11. [Google Scholar] [CrossRef]
  31. Yang, M.; Wang, A.; Sun, G.; Zhang, Y.; Engineering, E. Deploying charging nodes in wireless rechargeable sensor networks based on improved firefly algorithm. Comput. Electr. Eng. 2018, 72, 719–731. [Google Scholar] [CrossRef]
  32. Wang, Y.; Wang, F.; Zhu, Y.; Liu, Y.; Zhao, C. Optimization strategy of wireless charger node deployment based on improved cuckoo search algorithm. EURASIP J. Wirel. Commun. Netw. 2021, 2021, 74. [Google Scholar] [CrossRef]
  33. Gong, C.; Guo, C.; Xu, H.; Zhou, C.; Yuan, X. A joint optimization strategy of coverage planning and energy scheduling for wireless rechargeable sensor networks. Processes 2020, 8, 1324. [Google Scholar] [CrossRef]
  34. Xu, P.; Wu, J.; Chang, C.-Y.; Shang, C.; Roy, D.S. MCDP: Maximizing cooperative detection probability for barrier coverage in rechargeable wireless sensor networks. IEEE Sens. J. 2020, 21, 7080–7092. [Google Scholar] [CrossRef]
  35. He, S.; Chen, J.; Jiang, F.; Yau, D.K.; Xing, G.; Sun, Y. Energy provisioning in wireless rechargeable sensor networks. IEEE Trans. Mob. Comput. 2012, 12, 1931–1942. [Google Scholar] [CrossRef]
  36. Li, Y.; Chen, Y.; Chen, C.S.; Wang, Z.; Zhu, Y.H. Charging while moving: Deploying wireless chargers for powering wearable devices. IEEE Trans. Veh. Technol. 2018, 67, 11575–11586. [Google Scholar] [CrossRef]
  37. Power Over Distance, Powercast. Available online: http://www.powercastco.com (accessed on 25 May 2024).
  38. Yao, H.; Zheng, C.; Fu, X.; Yang, Y.; Ungurean, I. Charger and receiver deployment with delay constraint in mobile wireless rechargeable sensor networks. Ad Hoc Netw. 2022, 126, 102756. [Google Scholar] [CrossRef]
Figure 1. An illustration of the network model.
Energies 17 03130 g001
Figure 2. An illustration of sensor scheduling.
Energies 17 03130 g002
Figure 3. An illustration of grid discretization for sensor deployment.
Energies 17 03130 g003
Figure 4. Deployed sensors with the increase of PoIs. (a) The number of deployed sensors; (b) Solving time.
Energies 17 03130 g004
Figure 5. Deployed sensors with the increase in L s . (a) The number of deployed sensors; (b) Solving time.
Energies 17 03130 g005
Figure 6. Deployed sensors with the increase of sensor perception probability. (a) The number of deployed sensors; (b) Solving time.
Energies 17 03130 g006
Figure 7. Deployed chargers with the increase of PoIs. (a) Deployed chargers of GH; (b) Solving time of GH; (c) Deployed chargers of PSO; (d) Solving time of PSO.
Energies 17 03130 g007
Figure 8. Deployed chargers with the increase of L s . (a) Deployed chargers of GH; (b) Solving time of GH; (c) Deployed chargers of PSO; (d) Solving time of PSO.
Energies 17 03130 g008
Figure 9. Deployed chargers with the increase of sensor perception probability. (a) Deployed chargers of GH; (b) Solving time of GH; (c) Deployed chargers of PSO; (d) Solving time of PSO.
Energies 17 03130 g009
Figure 10. Deployed chargers with the increase of transmitting Power. (a) Deployed chargers of GH; (b) Solving time of GH; (c) Deployed chargers of PSO; (d) Solving time of PSO.
Energies 17 03130 g010
Figure 11. Deployed chargers with the increase of L c . (a) Deployed chargers of GH; (b) Solving time of GH.
Energies 17 03130 g011
Table 1. Relative work comparison. Static Sensor (SS), Static Charger (SC), Charging Utility (CU), Deployment Cost (DC), Coverage Rate (CR), Energy Consumption Cost (ECC).
PaperDeployment
Objective
Coverage
Objective
Optimization ObjectiveApproaches
CUDCCRECC
[27]SCSS GH
[24]SCSS GH
[28]SCSS GH
[29]SCSS GH
[25]SCSS GH
[30]SCSS GH
[31]SCSS IFA
[32]SCSS ICS
[26]SCSS GA
[33]SCSS GH & PSO
OurSS & SCSS & PoIs GH & PSO
Table 2. The symbols and descriptions used in the problem formulation.
ParametersDescription
Φ A two-dimensional plane used to define the problem
T Sensor’s life cycle
J The number of time slots in a life cycle of the sensor
τ The wireless charging efficiency
d t h The maximum charging distance of the charger
P m a x The maximum charging power of the sensor
τ m a x The maximum operating time slot of the sensor
P c The average power consumption of the sensor
c t h A continuous variable. The sensing probability the sensor perceives the PoIs
P s A continuous variable. The maximum transmitting power of the charger
VariablesDescription
o i A two-dimensional continuous variable. The location of the i-th deployed PoI, and O = { o 1 , o 2 , . . . , o N } ) is the set of all deployed PoIs, and oi also refers to the PoIs itself for simplicity
s j A two-dimensional continuous variable. The location of the j-th deployed sensor, and S = { s 1 , s 2 , . . . , s M } is the set of all deployed sensors, and sj also refers to the sensor itself for simplicity
c x A   two-dimensional   continuous   variable .   The   location   of   the   x -th   deployed   charger ,   and   C = { c 1 , c 2 , . . . , c K }   is   the   set   of   all   deployed   chargers ,   and   c x also refers to the charger itself for simplicity
P h s j , c x A   two-dimensional   continuous   variable .   Wireless   charging   power   delivered   by   a   charger   c x   to   the   sensor   s j
P h s j , C A   two-dimensional   continuous   variable .   Wireless   charging   power   delivered   by   all   chargers   C   to   the   sensor   s j
P m i n s j A   two-dimensional   continuous   variable .   The   minimum   charging   power   of   s j
s j t A   binary-continuous   variable .   The   schedule   of   s j in one cycle
S T The scheduling scheme of all sensors
P ( s j , o i ) A   two-dimensional   continuous   variable .   The   probability   of   sensing   a   point   o i by a sensor s j .
Table 3. Simulation parameters.
ParametersValuesParametersValues
Side length of the square50 (m) λ 0.5
J 5 β 0.5
P s 5 (W) r 5.6
P c 0.012 (W) r e 3.4
P m a x 0.04 (W) c t h 70%
d t h 15 (m) L c 5
τ 0.003 L s 1 (m)
ε 0.2316PoIs70
k 10
Disclaimer/Publisher’s Note: The statements, opinions and data contained in all publications are solely those of the individual author(s) and contributor(s) and not of MDPI and/or the editor(s). MDPI and/or the editor(s) disclaim responsibility for any injury to people or property resulting from any ideas, methods, instructions or products referred to in the content.