Abstract
Local natural gas distribution companies (LDCs) require accurate demand forecasts across various time periods, geographic regions, and customer class hierarchies. Achieving coherent forecasts across these hierarchies is challenging but crucial for optimal decision making, resource allocation, and operational efficiency. This work introduces a method that structures the gas distribution system into cross-temporal hierarchies to produce accurate and coherent forecasts. We apply our method to a case study involving three operational regions, forecasting at different geographical levels and analyzing both hourly and daily frequencies. Trained on five years of data and tested on one year, our model achieves a 10% reduction in hourly mean absolute scaled error and a 3% reduction in daily mean absolute scaled error.
1. Introduction
Local natural gas distribution companies (LDCs) rely on accurate forecasts to facilitate decision making across various functions within their organization. Historically, natural gas forecasting models have been developed at a single level of aggregation [1]. Temporally, models are designed for specific timeframes, e.g., hourly or daily. In the context of gas operations, geographical operating areas are often subdivided into smaller sub-regions or customer classifications and independently modeled. However, it is unlikely that the forecasts at all hierarchical levels are coherent; the underlying hours and days do not aggregate to the corresponding monthly value, and the aggregated sub-regions’ gas consumption do not aggregate to the total gas transferred through the system.
For illustration, Figure 1 suggests incoherent temporal and spatial hierarchical levels in a natural gas distribution context within a single U.S. state. The scenario is incoherent spatially as the gas is consumed in the three different geographic sub-regions; , , and do not aggregate to the gas burned throughout the state. Temporal incoherence is evident in forecasted hourly values of , and , not aggregating across 24-h periods to equal their daily counterparts.
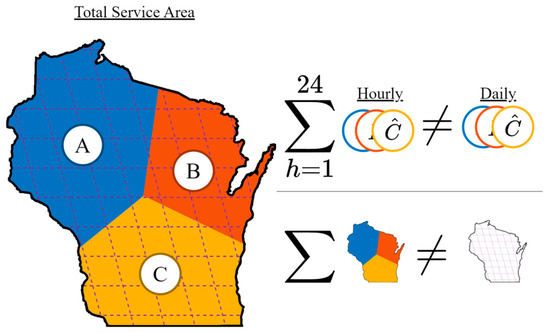
Figure 1.
Illustration of an incoherent natural gas distribution scenario in which gas consumed in operating areas , , and does not aggregate spatially or temporally.
When disparities arise between hierarchical level forecasts, confidence in the forecasts drops, complicating both operational and strategic planning [2]. This inconsistency, known as “forecast incoherence”, can lead to suboptimal decisions, inaccurate resource allocation, and an increased risk of operational disruptions, thereby undermining the LDC’s ability to meet the dynamic demands of their customers and maintain efficient operations [3].
The primary research question addressed in this study is: How can hierarchical time-series forecasting be applied to natural gas distribution to ensure coherent and accurate forecasts across temporal and spatial hierarchies?
The motivation for using hierarchical forecasting in this context stems from the complexity, reliance on precise timing, and the interdependence of various components of a natural gas distribution network. Achieving aligned decision making is particularly challenging when demand forecasts are incoherent [4]. LDCs rely on hourly, daily, and monthly forecasts for operational and strategic planning, often serving diverse customer bases across large geographic areas [5]. A lack of coherence in gas demand forecasts can disrupt operations, customer relations, finances, and overall sustainability. Incoherent forecasts can lead to supply management disruptions, impacting public safety, electric grid stability, and regulatory compliance. Everyday decisions tied to supply procurement, inventory, and distribution scheduling heavily depend on accurate demand forecasts [6]. Hence, incoherent forecasts can lead to poor resource allocation and operational efficiency choices.
The task of forecasting natural gas demand is frequently deconstructed into smaller components [5]. By decomposing the challenge of supplying enough gas to the entire distribution network, forecasters can attain a better understanding of specific factors influencing gas demand, leading to more accurate and effective forecasting outcomes. This work shows how improvements can be made over state-of-the-art gas demand forecast solutions by arranging the forecastable components of gas distribution into a cross-temporal hierarchical structure to produce a new set of reconciled forecasts. Hierarchical time-series forecasting entails forecasting at every level within the hierarchy. Time-series reconciliation (TSR) is a framework to reconcile the forecasts subject to a set of aggregation constraints to produce coherent forecasts. The aggregation constraints selected in this work reflect a realistic spatio-temporal structure of an LDC gas operating area.
The contributions of this work lie in the implementation of a novel cross-temporal forecast reconciliation framework for natural gas demand. State-of-the-art gas demand forecast solutions are enhanced with time-series reconciliation techniques. Forecast reconciliation is an a posteriori refinement of existing forecasts—any technique or preferred style of estimation can be used to generate the set of initial base forecasts. Therefore, this work intends to pick up where many leave off, after forecast generation. We show how gas demand forecasting can be improved by using hierarchical time-series forecasting techniques by reviewing the state-of-the-art hierarchical framework and reconciliation techniques in Section 2. Then, we establish the notation used in our reconciliation and form a hierarchical time series of natural gas data in Section 3. Our cross-temporal forecasting framework is presented in Section 4, and Section 5 provides its performance analysis when applied to a noisy, real-world gas consumption data set.
2. Related Work
A hierarchical time series is a collection arranged by different aggregate levels. Forecast reconciliation is the process of adjusting incoherent forecasts to be coherent using hierarchical constraints [7]. Hierarchical structures facilitate a comprehensive understanding of time-series data, capturing both individual series behaviors and their interactions within larger aggregates. There are two objectives of hierarchical time-series forecasting: (1) to improve forecasting accuracy at each level of aggregation, thus enhancing the granularity and reliability of predictions for individual series, and (2) to maintain coherence, ensuring that the sum of forecast values across hierarchy levels align with the forecast total of the aggregated series. This coherence ensures the forecasts are consistent across all levels of the hierarchy.
To address these objectives, various hierarchical time-series approaches have been developed. These approaches, generally categorized as cross-sectional, temporal, and cross-temporal [8,9], offer distinct strategies for reconciling forecasts across hierarchy levels while improving accuracy within each level. The gas distribution problem fits naturally into a hierarchical framework—with the total gas demanded being the aggregate-most level in the hierarchy. The gas demanded is subdivided in temporal and spatial partitions of gas consumption uniquely nested below. Early hierarchical methods employed a form of directional–structural scaling, which involves generating forecasts for a single gas demand series and linearly combining the forecasts to obtain demand estimate series for the other levels in the LDC hierarchy [10]. The bottom-up (BU) forecasting framework [11] generates gas forecasts at the lowest level of the hierarchy and sums them to produce forecasts for the higher levels, e.g., hourly forecasts aggregated to coherent daily forecasts. The top-down (TD) approach operates in the opposite direction, where the top level of the hierarchy is forecasted and disaggregated into the lower, more granular levels, e.g., total gas demanded disaggregated into operating areas , and [12]. The middle-out (MO) approach takes a time series from the middle of the hierarchy and both aggregates and disaggregates the series into a coherent structure [13]. The BU, TD, and MO approaches originate from decomposition and smoothing techniques in spatial econometrics [14]. While these single-series methods are computationally efficient and produce coherent results, they do not consider the inherent correlation structure of the hierarchy.
The factors affecting gas demand at one hierarchical level are correlated with the gas demanded at other levels. Sánchez-Úbeda presents the first algorithm capable of balancing gas data using this correlation in their multi-horizon gas demand forecast decomposition [15]. Hierarchical works progressed from single-level (BU, TD, and MO) to combination (COM) approaches to leverage dependencies between different levels [3]. COM approaches [9,16,17] are implemented such that they independently model and produce forecasts for all gas demand series in the hierarchy. The forecasts made at these levels are likely to be incoherent, but much more likely to be accurate than forecasts obtained via the aggregation or disaggregation of a single forecasted series [18]. Numerous studies have concentrated on generating accurate gas forecasts at a single level (ignoring aggregation constraints) [5,6,19]. As a result, COM methods use these specialized forecasts, considering both time and space, and reconcile all levels within the hierarchy simultaneously to attain overall coherence.
Hyndman et al. pioneered early work in optimal reconciliation methods by describing the statistical quantities of the BU, TD, and MO methods and identifying a minimum variance unbiased estimator to produce coherent forecasts [16,17]. Wang successfully applied the insights gained from optimal reconciliation to a grouped time series, finding an optimal weighted-least-squares solution (now known as variance scaling) [7]. These methods summarize the correlations and interactions among the hierarchical levels linearly to optimally combine and reconcile the forecasts. Wickramasuriya [16] and Athanasopoulos [10] show how ad hoc adjustments can be incorporated into the optimal combination process using important covariates, sub-series trends, and domain knowledge. While ample empirical results exist to support the use of COM methods over structural-scaling approaches [3,9], early optimal reconciliation methods were limited to applications with smaller hierarchies either bound to the unit of analysis, such as geographical region and customer type, or to the unit of time [2]. The gas distribution problem depends on adaptability across various hierarchical variables, such as time, geography, customer class, and average yearly usage. Consequently, it is crucial for gas demand forecasts to be coherent across the various hierarchical variables, including temporal and spatial dimensions.
Given that the physical process of natural gas distribution has both temporal and spatial aggregation constraints, the forecasts should also adhere to these constraints. Cross-sectional hierarchies are constructed from multiple contemporaneous time series, such as geographical divisions or customer groupings [20] (Figure 1). Cross-sectional methods focus on achieving coherence among various spatial elements or series within a specific context, reconciling data across different sections or units at a single point in time [8]. Van Erven and Cugliari were among the first to apply a cross-sectional forecast reconciliation method on energy data [3,21]. Specifically, they implemented a Game-Theoretically Optimal (GTOP) reconciliation method for electricity demand data disaggregated into 17 tariff groupings. Bai and Pinson also propose a distributed reconciliation method based on the GTOP method in their application of day-ahead wind power forecasting [22]. Gawel implements a cross-sectional global and local approach for gas consumption, specifically focusing the distribution infrastructure in Poland [23]. However, they chose to reconcile cross-sectionally across the spatial dimension of their data. Cross-sectional reconciliation methods focus on achieving coherence between forecasts at different aggregates, but not across different frequencies.
Temporal hierarchies are constructed from one or more time series by means of non-overlapping temporal aggregation [11]. Early examples of temporal aggregation were implemented to overcome limited memory availability by smoothing daily stock time series into weekly time series [24]. Jeon, Panagiotelis, and Petropoulos concentrate on producing temporally coherent probabilistic electricity demand forecasts [25]. Temporal reconciliation methods leverage time-series modeling techniques to refine forecasts at different frequencies [2]. Theodosiou investigates how to combine independent, temporally incoherent forecasts using different deep learning architectures in their forecast refinement. Di Fonzo implements the closest industrial process to use hierarchical forecasting with photovoltaic power generation [11]. Cross-temporal methods combine elements of both cross-sectional and temporal approaches, emphasizing the incorporation and evolution of temporal patterns in a coherent hierarchy [26].
Cross-temporal reconciliation harmonizes and ensures consistency across temporal and spatial hierarchies [17]. Kourentzes et al. demonstrate how to improve forecast accuracy by exploiting relationships in both the cross-sectional and temporal hierarchies in forecasting Australian tourism data [8]. The tourism forecasting problem resembles the geographical and temporal constraints of natural gas distribution [8]. Spiliotis offers a non-linear perspective of the problem of hierarchical reconciliation, incorporating the constraints of hierarchical time-series forecasting with machine learning forecasting techniques [9].
Natural gas distribution represents a real-world forecasting problem that theoretically fits the hierarchical forecasting model but has not yet been explored. While theoretical works show the uses of HTS are common, particularly using the Australian tourism data set [8], no published works, to our knowledge, demonstrate the effectiveness of applying hierarchical constraints to more dynamic problems, such as natural gas distribution. Our study addresses this gap by explicitly outlining how the cross-temporal hierarchy is formed for gas distribution, demonstrating how to effectively combine the spatial and temporal dimensions of the demand forecasting problem.
Hierarchical time-series forecasting offers a robust framework for handling complex hierarchies and taking advantage of dependencies between different aggregates, thereby providing more accurate and coherent forecasts, contributing to better planning, resource allocation, and decision making [8]. We impose these natural aggregation constraints in a hierarchical time series of natural gas and introduce the notation used in our reconciliation in Section 3.
3. Method and Materials
We proposed a cross-temporal hierarchy to reconcile natural gas demand forecasts. The cross-temporal hierarchy introduced in this section is based on [3]. This section is divided into two parts: (1) we present the notation for the cross-temporal hierarchy, and (2) we use this notation to introduce gas forecast reconciliation solutions.
3.1. Cross-Temporal Hierarchy Notation
Using the scenario presented in Figure 1, an LDC was partitioned into three operating areas, , , and , and into hourly and daily forecast frequencies. Figure 2 shows the observed series at each of these frequencies, including the aggregated hourly and daily LDC total series and .
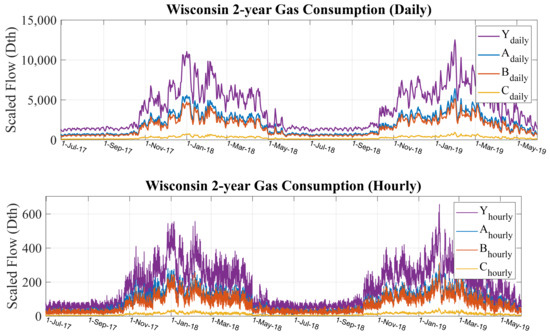
Figure 2.
Hourly and daily components of hierarchical natural gas consumption series, .
The series shown in Figure 2 can be organized into a hierarchy according to the LDC’s spatial and temporal constraints. Considering these constraints separately, their hierarchies are shown in Figure 3.
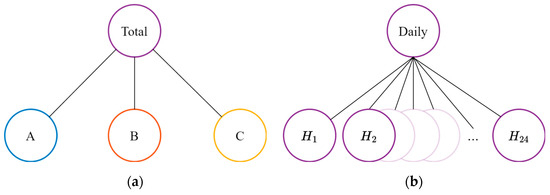
Figure 3.
Two-level LDC hierarchies showing spatial (a) and temporal (b) aggregation structures.
Figure 3a illustrates the spatial structure for operating areas , , and . The right side shows the temporal structure with daily demand aggregated from hourly demand. Let the number of nodes in each hierarchy be represented by scalar , and the number of nodes at the lowest hierarchical level available be . We converted each hierarchy in Figure 3 into its summation matrix to form of size Let and be the summation matrices for the spatial and temporal hierarchies illustrated in Figure 3, respectively:
In this example, the top row of both and is a unit vector of length . is a 4 × 3 matrix, with the number of rows, , corresponding to the total number of spatial nodes in Figure 3, and number of columns, = 3, corresponding to the number of nodes at the lowest hierarchical level (in this case, the level containing series , , and ). The summation matrix, , is 25 × 24. The rows correspond to the 24 h and daily time series. The columns correspond to the signals at the lowest level of the hierarchy, i.e., 24 h. The summation matrices and represent common gas operation hierarchies [5]. Comparing (1) and (2) to the aggregation constraints shown in Figure 1, it is clear how each matrix, , can be partitioned by levels of the hierarchy [17]. Despite these summation matrices representing common gas operation hierarchies, current LDC practice is to forecast these levels independently without coherence constraints [5].
Both the cross-sectional (spatial) and temporal dimensions are crucial aspects of the gas distribution problem. Until recently, the hierarchical structures applicable to optimal reconciliation techniques were limited to the dimension of analysis. Note cross-sectional, e.g., , hierarchies impose constraints dependent on the unit of analysis (typically regions), and temporal imposes constraints dependent on the unit of time. The introduction of cross-temporal hierarchies allows both dimensions to be included in reconciling gas forecasts [3]. We built a new cross-temporal hierarchy using the same data shown in Figure 2 and both sets of constraints seen in Figure 3.
The observations shown in Figure 2 are measured at times , with representing the total number of observations in a single series at the lowest hierarchical level. For our new cross-temporal hierarchy, let be the total number of series at the most disaggregated level (24 h × 3 operating areas) and be the total number of nodes within our cross-temporal hierarchy. The hierarchical time series, , is an -vector containing all observations made at time .
Not all time series necessarily have an observation at time, (i.e., no midday readings in daily time series, ). Let the 24 h spanned in coincide temporally with . Figure 4 illustrates the structure of .
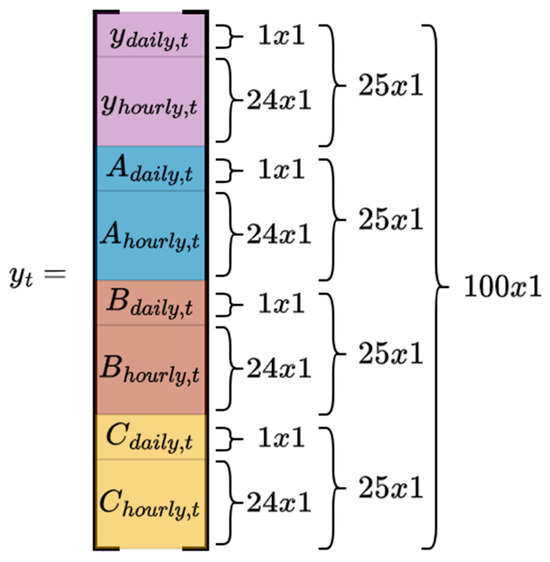
Figure 4.
Structure of , formed by stacking observations from each time series.
The top level of the hierarchy, level 0, is the LDC’s total daily demand, . Let be an -vector of the lowest level of the hierarchy , , . We constructed a summation matrix, , to reflect the hierarchical structure seen in Figure 5, such that all levels in aggregate in
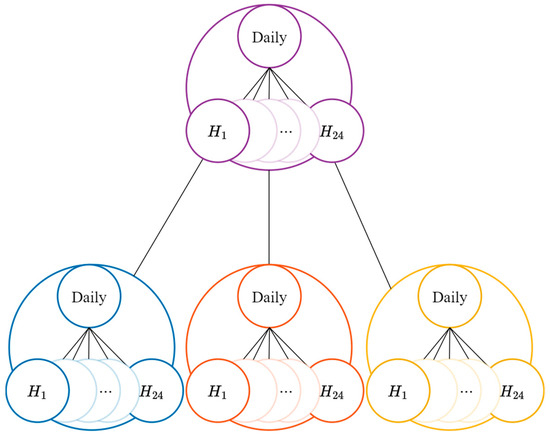
Figure 5.
Cross-temporal hierarchy diagram showing the aggregation relationships between hierarchical levels (—blue, —orange, —yellow, —purple).
The relationship defined in (4) summarizes the LDC aggregation constraints between hierarchical levels. An illustrated version of our cross-temporal hierarchical structure is shown below in Figure 5.
Our cross-temporal summation matrix, , has a size of 100 × 72, which is shown on the right side of Figure 6. The blue lines help visually map where the spatial and temporal aggregation constraints from the single dimension hierarchies are present.
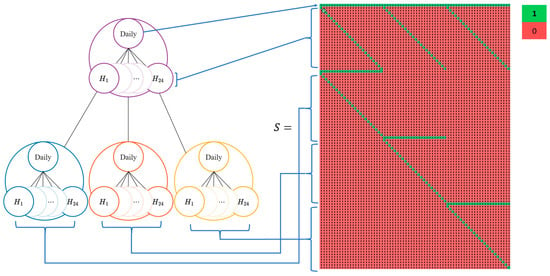
Figure 6.
Mapping from cross-temporal diagram to summation matrix .
In the next sub-section, the relationship defined in (4) and illustrated in Figure 6 is used to create the cross-temporal coherent forecasts.
3.2. Cross-Temporal Reconciliation for Natural Gas Forecasts
This section shows how forecast reconciliation maps a set of incoherent base forecasts to a set of coherent, reconciled forecasts [16]. Further descriptions of the mathematical models for natural gas forecasting can be found in [5]. Forecast reconciliation begins by first defining the base forecasts. Let be the forecast horizon and be -step-ahead forecasts for each gas demand series in the hierarchy, which has the same structure as , see Figure 5, then
The base forecasts may be generated using any forecasting method [9]. The standard practice for gas demand forecasting is to use exogenous variables that match the temporal frequencies in our gas hierarchy (daily and hourly) during the model training of the multivariate time series, [5]. The data used in the basic five-parameter model training meet the necessary statistical criteria of regression analysis, and have been tested for homoscedasticity, autocorrelation, and endogeneity (p-value > 0.05).
There are many ways to generate natural gas demand forecasts. LDCs often invest significant resources in developing tailored forecasting solutions for their unique gas delivery systems [5,27]. Five-parameter linear regression models generate multivariate forecasts [6]. The consumption data used to train this model were not preprocessed or detrended. Exogenous weather variables undergo a nonlinear transformation before being used in training. Let the heating degree day (HDD) be , be a heating degree day at reference temperature 65 °F, be a heating degree day at reference temperature 55 °F, be a wind-adjusted heating degree day at reference temperature 65 °F, and be a mean heating degree day. These variables are independent correlated time series known to be helpful in forecasting gas demand. Aggregate the lowest frequency versions of these time series such that they are of the same form of hierarchical (Figure 4) and hold multivariate characteristics within the hierarchical time-series setting. The base five-parameter model is
See references [6,28] for more details on this regression model. The regression model parameters were estimated using MATLAB’s fitlm (R2024a) [29]. Using this function, models were trained for each of the eight time series making up in (5). The base forecasts are the basis of reconciliation, and it is critical to ensure appropriate modeling techniques are used. We determined each model was statistically significant using the F-statistic text () and the variance explained was in the 90th percentile.
The base forecasts forming (5) are not constrained to the LDC hierarchy structure. Thus, is likely to be incoherent [8,22]. To resolve the incoherence, we use the variance-shrinking (VS) and minimum trace (MinT) [11] reconciliation methods constrained by the cross-temporal hierarchy illustrated in Figure 6 to produce coherent forecasts. The hierarchical reconciliation tool is the hts R package (hts 4/4.3.0) [30].
Let be an mapping matrix that maps base forecasts, , to a set of reconciled forecasts, . In general, the reconciliation methods according to [31] are defined as
linearly projects the base forecasts, , into bottom-level disaggregated forecasts that are then summed by summation matrix [31]. Bottom-up reconciled forecasts are obtained by setting , where is a null matrix. The top-down reconciliation method uses proportions in forming projection matrix The bottom-up and top-down methods focus on a particular level of the hierarchy and do not share information between hierarchical levels. Identifying this shortcoming, the VS and MinT methods reduce error variances across all hierarchical levels while mitigating modeling uncertainty [8].
(7) introduces two types of errors. Let
step-ahead base forecast error, and
step-ahead reconciled forecast error. These error vectors are organized in the same structure as our hierarchical time series (Figure 4). Note the differences of and and how they are used in the following reconciliation methods. Keep samples time-ordered during base forecast model training; ensure does not exceed the lowest frequency interval length and time when calculating the reconciliation error. Hyndman et al. [17] formed VS reconciliation by letting denote the variance–covariance matrix of the base forecast errors (8), and . The VS reconciliation matrix, , is
Athanasopoulos et al. [10] and Wickramasuriya et al. [16] enhanced the regression-based approach by incorporating the theoretical insights from Hyndman’s solution (further discussed in [32]). They implemented an optimization approach to reconciliation using the full covariance matrix of forecast errors produced in (9). Minimizing the trace of , equal to the sum of variances of all the reconciled forecasts, the MinT reconciliation matrix is
The only difference between MinT and VS is the covariance matrix used by the estimators [16]. The top-down, bottom-up, VS, and MinT reconciliation matrices, , are substituted into (7) to produce a set of coherent gas forecasts, . The results and performance analysis of each reconciliation method are discussed next.
4. Results
All published hierarchical forecasting techniques assume an underlying coherence is present in the training data. As summarized in the literature review (Section 2), numerous researchers have found success in reconciling forecasts using coherence theory-driven optimal combination methods. A particular challenge faced in this work is that the underlying data used to train the base models are not coherent. Figure 7 illustrates this incoherence between the summed hourly demand and daily demand for a sample month (January 2019).
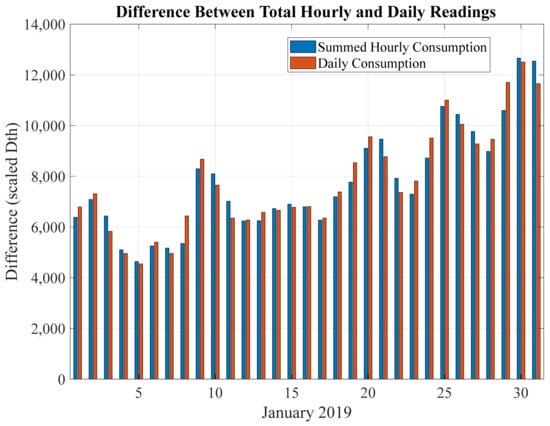
Figure 7.
Incoherency between daily and summed hourly gas demands.
Despite the incoherence visible in Figure 7, we show that forecast reconciliation yields better forecasts than base forecasting models. We attribute this performance improvement to the combination of information from each hierarchical level [2].
We use scale-independent error metrics accounting for the differences in scales across hierarchical levels to evaluate performance [33]. Let the naïve model (NAV) produce incoherent forecasts
for both daily and hourly series. The naïve method produces forecasts equal to the last observed value and is frequently used as a benchmark against more sophisticated reconciliation techniques [9]. The base forecasts (6) are included in the following performance analysis to compare the reconciled forecasts performed against the incoherent estimates. We evaluate the forecasting performance of the naïve, base, VS, and MinT methods in terms of accuracy and bias.
Forecast skill is measured as the mean absolute scaled error (MASE) and root mean squared scaled error (RMSSE). The mean absolute scaled error is:
The in-sample is favored by Hyndman and Koehler for its consistent availability and effective scaling of errors [33]. The root mean squared scaled error is:
The serves as a standardized measure, providing an indication of the relative magnitude of errors by normalizing them based on the in-sample . The absolute mean scaled error () is:
and minimizes errors using the median.
All measures are scale-independent, meaning averaging across series is possible [9]. Table 1 compares these metrics and their averages across the cross-temporal hierarchy.

Table 1.
Forecasting accuracy metrics , , and for base forecasts (BFs), VS, and MinT across hourly and daily resolutions and operating areas , and .
In Table 1, lower values indicate better results. The best metrics for each operating area are in bold. The base forecasts have inherent incoherence, while VS and MinT rows display coherent results. Any value in Table 1 exceeding 1.00 indicates that the naïve model outperformed the base forecast model (6). Since the base forecast models have no autoregressive terms, it is not surprising that the naïve one-step-ahead persistence model out-performs all hourly forecasts.
The MinT is the most accurate method in this study, with an average hourly , of and daily across all operating areas and temporal frequencies. Comparing these results to the base forecasts and VS reconciliation and Table 1 shows 10% hourly and 3% daily improvements when compared to incoherent base forecasts, and 7% hourly and 9% daily improvements when compared to coherent VS forecasts. Examining the and of each hierarchical level, MinT consistently demonstrates superior forecasting accuracy compared to base forecast and VS methods. This consistency shows the robustness of MinT in reconciling forecasts across different temporal and hierarchical levels.
In measures of bias, MinT does not outperform the VS technique, with average hourly and daily of . We found this observation to be interesting, considering VS is closely related to the implementation of MinT, except for that fact that the full covariance matrix of forecast errors produced in (9) is used in MinT and only the diagonal in VS. With more information on hierarchical interactions and effects, we expected the bias to decrease with the additional information used in MinT.
Figure 8 provides additional insights into the relative accuracy of each reconciliation method across gas operating areas , , , and . Figure 9 shows the daily results for the same areas.
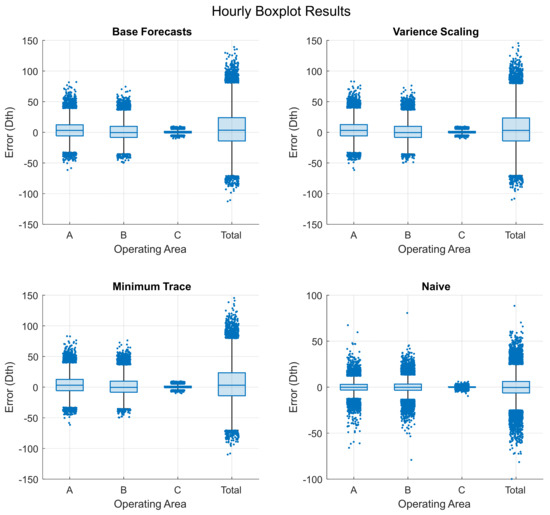
Figure 8.
Hourly box plot results for the error distribution across different operating areas, comparing each reconciliation method (variance scaling, minimum trace, and naïve).
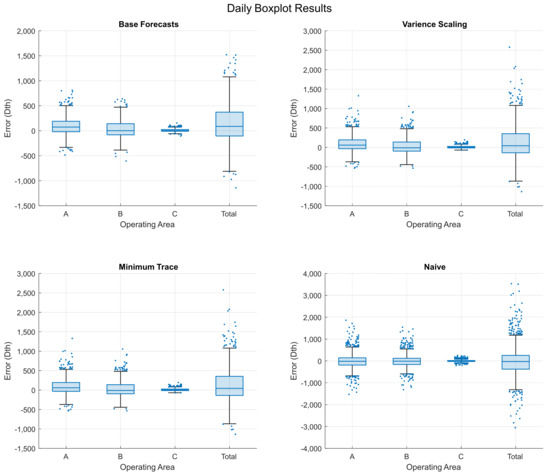
Figure 9.
Daily box plot results for the error distribution across different operating areas, comparing each reconciliation method (variance scaling, minimum trace, and naïve).
Natural gas demand forecasting performance is typically assessed using scaled-dependent or percent-error metrics evaluated at a single level. Both Figure 8 and Figure 9 show errors measured in dekatherms (Dth), which are calculated by taking the difference between actuals, , and forecasts, , for the naïve, base forecast, VS, and MinT methods. Unlike the relative out-of-sample error metrics in Table 1, these results are scale-dependent. Across both hourly and daily plots, errors are distributed around zero, except for fourth quantile outliers. The VS and MinT residuals in Figure 8 and Figure 9 appear nearly identical. This occurs because the generalized least squares solution for MinT converges closely to the ordinary least squares solution for VS. This suggests that the ordinary least squares solution effectively summarizes most, but not all, intra-hierarchy interactions. A trade-off occurs between computational efficiency and information gain while working with large hierarchies. While the VS method is outperformed in terms of accuracy, it is computationally quicker to calculate than MinT. This trade-off must be considered, especially if reconciliation is carried out over large temporal hierarchies.
Figure 10 and Figure 11 present another view of the unscaled residuals over the 2023 heating season.
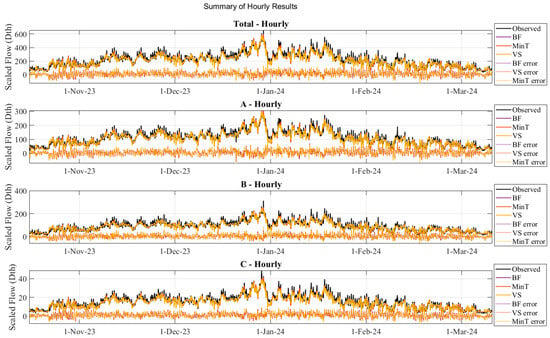
Figure 10.
Hourly reconciled forecasts compared to observed data, with the differences plotted below in corresponding dashed colors.
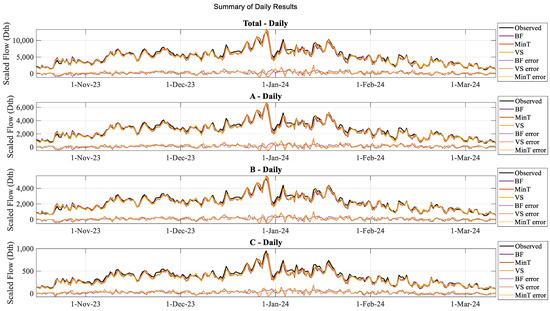
Figure 11.
Daily reconciled forecasts compared to observed data, with the differences plotted below in corresponding dashed.
Observing Figure 10 and Figure 11, the actuals are shown in black, BF in purple, MinT in orange, and VS in yellow. The corresponding dashed lines in the same colors indicate the differences between each method and the observed gas demand. Gas practitioners are particularly interested in accurate forecasts during peak winter periods [23,34,35]. In Figure 10, the orange peaks stand out, indicating that MinT reconciliation effectively leverages the correlation between exogenous weather variables and gas consumption in areas , , , and . This is, in part, due to the MinT method’s ability to model inter-hierarchy series interaction (via the inclusion of off-diagonals of ). The VS method performs similarly, but does not consider these interactions and does not perform as well on these peaks. Figure 11 shows daily estimates with a similar pattern of orange peaks, though not as consistently. This suggests that the smoother, lower-frequency daily series benefited from MinT reconciliation, but not as significantly as the hourly results in Figure 10. This also motivates further research into gas demand reconciliation and suggests that training specialized forecasting models for each hierarchical level could better leverage different exogenous correlations.
Given the inherent incoherence in the natural gas data, the results depicted in Figure 8 and Figure 9 show satisfactory performance when contrasting the coherent VS and MinT forecasts with the incoherent naïve and independently generated base forecasts. These findings underscore the applicability and effectiveness of MinT in improving forecasting accuracy in temporal and hierarchical contexts.
5. Discussion
We use cross-temporal forecast reconciliation methods tailored to the needs of local gas distribution. Most time-series reconciliation efforts focus on a particular temporal or cross-sectional hierarchy, raising doubts about the effectiveness of such methods in the context of gas delivery [3]. We hypothesized that insights from single-dimensional approaches could apply to cross-temporal implementations with suitable aggregation structures. Cross-temporal reconciliation is made possible by organizing gas demand series into a hierarchical time-series structure, which is then used to constrain forecasts across both measurement resolution (time) and operating area (space), ensuring coherence. We propose two reconciliation schemes to transform incoherent natural gas base forecasts into coherent sets of gas demand forecasts. A case study is carried out focusing on natural gas demands across three operational regions, forecasting at various geographical levels, and analyzing both hourly and daily frequencies. Cross-temporal reconciliation using the MinT method results in a 10% improvement in hourly forecasts and a 3% improvement in daily forecasts compared to incoherent base forecasts. Additionally, MinT yields a 7% improvement in hourly forecasts and a 9% improvement in daily forecasts compared to coherent VS forecasts.
Future research on the cross-temporal reconciliation of natural gas demands will focus on integrating demand forecasting with other energy systems, like electricity and heat generation, to optimize energy management. Investigating regulatory and policy implications within the hierarchical constraints set by government regulators is also a realistic application. Additionally, analyzing different customer segments and their consumption behaviors can lead to tailored forecasting approaches for each segment. These ideas contribute to a more efficient gas distribution system, while also providing significant financial incentives to local distribution companies.
The superior performance of MinT and VS methods over base forecasts is attributed to combining information from all levels of the natural gas demand hierarchy. Future directions include exploring error propagation based on individual gas demand levels rather than the entire hierarchy, as well as adjusting for the natural incoherence of gas data before reconciliation. In summary, MinT’s capability to leverage hierarchical structures and ensure coherence across aggregation levels renders it superior for hierarchical time-series forecasting and reconciliation in gas demand forecasting.
Author Contributions
Conceptualization, C.O.Q., R.J.P. and G.F.C.; methodology, C.O.Q., R.J.P. and G.F.C.; software, C.O.Q.; validation, C.O.Q. and R.J.P.; formal analysis, C.O.Q. and R.J.P.; investigation, C.O.Q. and R.J.P.; resources, C.O.Q.; data curation, C.O.Q.; writing—original draft preparation, C.Q; writing—review and editing, R.J.P. and G.F.C.; visualization, C.O.Q.; supervision, R.J.P.; project administration, G.F.C.; funding acquisition, R.J.P. All authors have read and agreed to the published version of the manuscript.
Funding
This research was funded by Marquette Energy Analytics, LLC, 309 N. Water St. Milwaukee, Wisconsin 53202; info@marquetteenergyanalytics.com; Website: https://marquetteenergyanalytics.com/ (accessed on 1 June 2024).
Data Availability Statement
The original contributions presented in the study are included in the article, further inquiries can be directed to the corresponding author.
Conflicts of Interest
Authors Colin Quinn and George Corliss are employees of Marquette Energy Analytics. Author Richard Povinelli has been involved as a consultant in Marquette Energy Analytics. Marquette Energy Analytics uses this technology in their product. The funding sponsors had no role in the design of the study; in the collection, analyses, or interpretation of data; in the writing of the manuscript, and in the decision to publish the results.
References
- Soldo, B. Forecasting Natural Gas Consumption. Appl. Energy 2012, 92, 26–37. [Google Scholar] [CrossRef]
- Theodosiou, F.; Kourentzes, N. Forecasting with Deep Temporal Hierarchies. SSRN Electron. J. 2021, 92, 26–37. [Google Scholar] [CrossRef]
- Athanasopoulos, G.; Hyndman, R.J.; Kourentzes, N.; Panagiotelis, A. Forecast Reconciliation: A Review. Int. J. Forecast. 2024, 40, 430–456. [Google Scholar] [CrossRef]
- Parrish, W.; Kidnay, A.; McCartney, D. Fundamentals of Natural Gas Processing, 2nd ed.; CRC Press: Boca Raton, FL, USA, 2013; ISBN 978-0-8493-3406-1. [Google Scholar]
- Tamba, J.G.; Essiane, S.N.; Sapnken, E.F.; Koffi, F.D.; Nsouandélé, J.L.; Soldo, B.; Njomo, D. Forecasting Natural Gas: A Literature Survey. Int. J. Energy Econ. Policy 2018, 8, 216–249. [Google Scholar]
- Vitullo, S.R.; Brown, R.H.; Corliss, G.F.; Marx, B.M. Mathematical Models for Natural Gas Forecasting. Can. Appl. Math. Q. 2010, 17, 1–13. [Google Scholar]
- Hyndman, R.J.; Lee, A.J.; Wang, E. Fast Computation of Reconciled Forecasts for Hierarchical and Grouped Time Series. Comput. Stat. Data Anal. 2016, 97, 16–32. [Google Scholar] [CrossRef]
- Kourentzes, N.; Athanasopoulos, G. Cross-Temporal Coherent Forecasts for Australian Tourism. Ann. Tour. Res. 2019, 75, 393–409. [Google Scholar] [CrossRef]
- Spiliotis, E.; Abolghasemi, M.; Hyndman, R.J.; Petropoulos, F.; Assimakopoulos, V. Hierarchical Forecast Reconciliation with Machine Learning. Appl. Soft Comput. 2021, 112, 107756. [Google Scholar] [CrossRef]
- Athanasopoulos, G.; Ahmed, R.A.; Hyndman, R.J. Hierarchical Forecasts for Australian Domestic Tourism. Int. J. Forecast. 2009, 25, 146–166. [Google Scholar] [CrossRef]
- Athanasopoulos, G.; Hyndman, R.J.; Kourentzes, N.; Petropoulos, F. Forecasting with Temporal Hierarchies. Eur. J. Oper. Res. 2017, 262, 60–74. [Google Scholar] [CrossRef]
- Gross, C.W.; Sohl, J.E. Disaggregation Methods to Expedite Product Line Forecasting. J. Forecast. 1990, 9, 233–254. [Google Scholar] [CrossRef]
- Taieb, S.B.; Taylor, J.W.; Hyndman, R.J. Coherent Probabilistic Forecasts for Hierarchical Time Series. In Proceedings of the 34th International Conference on Machine Learning ICML, Sydney, Australia, 6–11 August 2017; Volume 7, pp. 5143–5155. [Google Scholar]
- Corrado, L.; Fingleton, B. Where Is the Economics in Spatial Econometrics? J. Reg. Sci. 2012, 52, 210–239. [Google Scholar] [CrossRef]
- Sánchez-Úbeda, E.F.; Berzosa, A. Modeling and Forecasting Industrial End-Use Natural Gas Consumption. Energy Econ. 2007, 29, 710–742. [Google Scholar] [CrossRef]
- Wickramasuriya, S.L.; Athanasopoulos, G.; Hyndman, R.J. Optimal Forecast Reconciliation for Hierarchical and Grouped Time Series Through Trace Minimization. J. Am. Stat. Assoc. 2019, 114, 804–819. [Google Scholar] [CrossRef]
- Hyndman, R.J.; Ahmed, R.A.; Athanasopoulos, G.; Shang, H.L. Optimal Combination Forecasts for Hierarchical Time Series. Comput. Stat. Data Anal. 2011, 55, 2579–2589. [Google Scholar] [CrossRef]
- Sobhani, M.; Campbell, A.; Sangamwar, S.; Li, C.; Hong, T. Combining Weather Stations for Electric Load Forecasting. Energies 2019, 12, 1510. [Google Scholar] [CrossRef]
- Majazi Dalfard, V.; Nazari Asli, M.; Asadzadeh, S.M.; Sajjadi, S.M.; Nazari-Shirkouhi, A. A Mathematical Modeling for Incorporating Energy Price Hikes into Total Natural Gas Consumption Forecasting. Appl. Math. Model. 2013, 37, 5664–5679. [Google Scholar] [CrossRef]
- Hyndman, R.J.; Athanasopoulos, G. Forecasting: Principles and Practice, 3rd ed.; OTexts: Melbourne, Australia, 2021; ISBN 978-0987507112. [Google Scholar]
- van Erven, T.; Cugliari, J. Game-Theoretically Optimal Reconciliation of Contemporaneous Hierarchical Time Series Forecasts. Lect. Notes Stat. 2015, 217, 297–317. [Google Scholar] [CrossRef]
- Bai, L.; Pinson, P. Distributed Reconciliation in Day-Ahead Wind Power Forecasting. Energies 2019, 12, 1112. [Google Scholar] [CrossRef]
- Gaweł, B.; Paliński, A. Global and Local Approaches for Forecasting of Long-Term Natural Gas Consumption in Poland Based on Hierarchical Short Time Series. Energies 2024, 17, 347. [Google Scholar] [CrossRef]
- Hippert, H.S.; Pedreira, C.E.; Souza, R.C. Neural Networks for Short-Term Load Forecasting: A Review and Evaluation. IEEE Trans. Power Syst. 2001, 16, 44–55. [Google Scholar] [CrossRef]
- Panagiotelis, A.; Athanasopoulos, G.; Gamakumara, P.; Hyndman, R.J. Forecast Reconciliation: A Geometric View with New Insights on Bias Correction. Int. J. Forecast. 2021, 37, 343–359. [Google Scholar] [CrossRef]
- Di Fonzo, T.; Girolimetto, D. Enhancements in Cross-Temporal Forecast Reconciliation, with an Application to Solar Irradiance Forecasts. arXiv 2022, arXiv:2209.07146. [Google Scholar]
- Mokhatab, S.; Poe, W.; Mak, J.Y. Handbook of Natural Gas Transmission and Processing; Elsevier Science: Amsterdam, The Netherlands, 2012; ISBN 9780123869142. [Google Scholar]
- Fakoor, M. Disaggregation: Inferring Daily Gas Flow from Billing Cycle Data. Ph.D. Thesis, Marquette University, Milwaukee, WI, USA, 2019. [Google Scholar]
- MathWorks Fit Linear Regression Model—Fitlm. R2024a. Available online: https://www.mathworks.com/help/stats/fitlm.html (accessed on 10 June 2024).
- Hyndman, R.J.; Athanasopoulos, G.; Shang, H.L. Hts: An R Package for Forecasting Hierarchical or Grouped Time Series. 2014. Available online: https://cran.r-project.org/web/packages/hts/vignettes/hts.pdf (accessed on 10 June 2024).
- Wickramasuriya, S.L.; Athanasopoulos, G.; Hyndman, R.J. Forecasting Hierarchical and Grouped Time Series through Trace Minimization; Monash University: Melbourne, Australia, 2015. [Google Scholar]
- Gamakumara, P.; Panagiotelis, A.; Athanasopoulos, G.; Hyndman, R.J. Probabilistic Forecasts in Hierarchical Time Series; Monash University Work Paper XX/19; Monash University: Melbourne, Australia, 2019. [Google Scholar]
- Hyndman, R.J. Another Look at Forecast-Accuracy Metrics for Intermittent Demand. Int. J. Energy Stat. 2006, 4, 43–47. [Google Scholar]
- Quinn, C.O.; Povinelli, R.J.; Corliss, G.F. Alarm Forecasting in Natural Gas Pipelines. Master’s Thesis, Marquette University, Milwaukee, WI, USA, 2020. [Google Scholar]
- Vitullo, S.R.; Corliss, G.F.; Adya, M.; Nourzad, F.; Brown, R.H. An Algorithm for Disaggregating Temporal Natural Gas Consumption. Can. Appl. Math. Q. 2013, 21, 391–410. [Google Scholar]
Disclaimer/Publisher’s Note: The statements, opinions and data contained in all publications are solely those of the individual author(s) and contributor(s) and not of MDPI and/or the editor(s). MDPI and/or the editor(s) disclaim responsibility for any injury to people or property resulting from any ideas, methods, instructions or products referred to in the content. |
© 2024 by the authors. Licensee MDPI, Basel, Switzerland. This article is an open access article distributed under the terms and conditions of the Creative Commons Attribution (CC BY) license (https://creativecommons.org/licenses/by/4.0/).