Abstract
Accurate photovoltaic power prediction is of great significance to the stable operation of the electric power system with renewable energy as the main body. In view of the different influence mechanisms of meteorological factors on photovoltaic power generation in different irradiation intervals and that the data-driven algorithm has the problem of regression to the mean, in this article, a prediction method based on irradiation interval distribution and Transformer-long short-term memory (IID-Transformer-LSTM) is proposed. Firstly, the irradiation interval distribution is calculated based on the boxplot. Secondly, the distributed data of each irradiation interval is input into the Transformer-LSTM model for training. The self-attention mechanism of the Transformer is applied in the coding layer to focus more important information, and LSTM is applied in the decoding layer to further capture the potential change relationship of photovoltaic power generation data. Finally, sunny data, cloudy data, and rainy data are selected as test sets for case analysis. Through experimental verification, the method proposed in this article has a certain improvement in prediction accuracy compared with the traditional methods under different weather conditions. In the case of local extrema and large local fluctuations, the prediction accuracy is clearly improved.
1. Introduction
In recent years, with the depletion of traditional fossil energy and with increasingly serious global environmental problems [1], countries all over the world have paid more and more attention to the development of renewable energy [2]. It is a general trend to replace traditional fossil energy with renewable energy such as wind and solar energy [3,4]. With the advantages of safety, high efficiency, and green economic advantages, solar energy is widely used around the world [5]. According to the statistics of the International Energy Agency (IEA) as of 15 December 2023, the total global photovoltaic installed capacity in 2023 has reached 1552.3 GW, and it is predicted to reach 1954.6 GW in 2024, with 402.3 GW of newly installed capacity. By 2030, to achieve net zero emissions, the photovoltaic installed capacity needs to reach 6101 GW, that is, about 682.97 GW per year, and the average annual growth rate needs to reach 14.16%. However, due to the influence of meteorological factors such as solar radiation and temperature, photovoltaic power generation has a certain volatility and randomness [6,7]. When a high proportion of photovoltaic power generation is connected to the grid, the complexity of power grid’s dispatching is increased to a certain extent, which will have a certain impact on the stable operation of the power system [8]. Therefore, accurate photovoltaic power prediction is of great significance to the development of an electric power system with renewable energy as its main body [9].
At present, photovoltaic power prediction mainly includes a physical model method and a data-driven method [10]. According to the meteorological factors and the parameters of photovoltaic power generation equipment, the physical model method establishes the corresponding photoelectric conversion model to calculate the power of photovoltaic generation [11]. However, the modeling process of the physical model method is complex and requires high-quality meteorological forecast data. It is difficult to achieve better prediction results in practical applications; the data-driven method takes historical data as the research object, and combines data processing methods and deep learning algorithms to establish a photovoltaic power generation prediction model to achieve the accurate prediction of photovoltaic power generation [12]. The current common deep learning algorithms mainly include LSTM [13], gated recurrent units (GRUs [14]), recurrent neural networks (RNNs [15]), convolutional neural networks (CNNs [16]), etc. In [17], Wang, K. stated that the average value, the standard deviation, and the coefficient of variation of the total horizontal radiation variables were used as clustering features, and the fuzzy C-means (FCMs) clustering method was used to divide the historical data into sunny, sunny-to-cloudy, and rainy days. A quantile regression-convolutional neural network-bidirectional long short-term memory (QR-CNN-BiLSTM) combined prediction model was proposed to realize the short-term interval prediction of photovoltaic power. In [18], Liu, X. stated that the levy-flight beetle antennae search (LFBAS) algorithm is used to search similar days, and the historical days similar to the forecast day are selected from the historical data in real time. Finally, the searched data of similar days are decomposed, reconstructed, and input into the GRUs to establish the prediction model of photovoltaic power generation. In [19], Wu T stated that they applied grey correlation analysis, the Pearson correlation coefficient, and kmeans++ to realize similar day clustering, and proposed a short-term photovoltaic power prediction model based on improved extreme gradient boosting-kernel extreme value learning machine combination. The above methods only focus on the cluster analysis of the overall meteorological conditions of a certain day, and they study the influence mechanism of various factors on photovoltaic power generation under different meteorological days. However, the meteorological factors such as solar radiation and temperature in different time periods of the same day are also very different. It is difficult to accurately analyze the mechanisms of various meteorological factors on photovoltaic power generation by directly taking the overall meteorological conditions of a day as the object. In contrast, analyzing the mechanisms of photovoltaic generators under specific irradiation intervals is more conducive to mining the complex mapping relationship between photovoltaic power generation and various influencing factors. In addition, due to the great volatility and uncertainty of meteorological data and photovoltaic power generation, the data-driven algorithm tends to generate average or median values during training, rather than accurately capturing the dynamic changes and outliers of the data, which is the problem of the regression to the mean. The prediction in a specific irradiation interval can effectively reduce the difference between the peak and valley values of the sequence, alleviate the problem of the regression to the mean of the data-driven algorithm to a certain extent, and further improve the accuracy of prediction.
In [20], Wang, M. combined the extreme learning machine (ELM) algorithm and the k-nearest neighbor algorithm to establish and integrate the ELM model for each k-nearest neighbor, and proposed a probability prediction method based on the evidence extreme learning machine (EELM). In [21], Meng, A. stated that they used three neural network combination predictions such as GRUs, LSTM, and RNNs, and applied the Q-learning algorithm to optimize the combination of three neural network prediction weights, which realized the complementary advantages of deep learning and had a high accuracy of prediction. In [22], Tang, Y. stated that they used a parallel model of a dilated convolutional neural network (DCNN) and BiLSTM. The temporal and spatial features of historical data were extracted simultaneously by using a temporal neural network and a convolutional neural network in parallel to effectively improve the prediction accuracy. The above methods can achieve better prediction results when the meteorological conditions are relatively stable. However, when the meteorological conditions fluctuate greatly and the amount of the noise of the photovoltaic power generation data is large, the traditional model is sensitive to noise data, which are easy to over-fit, and the robustness needs to be improved.
In view of the above problems, this paper proposes short-term photovoltaic power prediction based on irradiation interval distribution and Transformer-LSTM. Firstly, the correlation analysis of meteorological characteristics is carried out to extract the most relevant meteorological characteristics of photovoltaic power generation. In order to capture the mapping relationship between various meteorological factors and photovoltaic power generation under specific meteorological intervals, the boxplot calculation is used to obtain the distribution of the irradiation intervals, and the isolated forest algorithm is used to eliminate the irradiation-power outliers in each irradiation interval to improve the data quality. Secondly, the Transformer-LSTM prediction model of each irradiation interval is constructed and is input into the corresponding data for training. More important information is mined through the self-attention mechanism of the Transformer, which can effectively resist noise and interference. The multi-head attention mechanism can still ensure good robustness when the meteorological conditions fluctuate greatly. In addition, the LSTM module is introduced to replace the traditional Transformer decoding layer, and the sensitivity of LSTM to time series features can further capture the potential change rules in photovoltaic power generation time series data, so as to further improve the prediction accuracy and universality of the model. Finally, sunny, cloudy, and rainy days are selected as test sets, and are input into the corresponding prediction model according to the irradiation interval. The prediction results of each part are reorganized to obtain the final result of photovoltaic power prediction.
2. Irradiation Interval Distribution
2.1. Analysis of the Influence Mechanism of Photovoltaic Power Generation Power in Different Irradiation Intervals
Photovoltaic power generation is mainly determined by irradiation and is affected by temperature to a certain extent [23]. The irradiation varies greatly in different weather or different time periods of the same day, and the influence factors in different irradiation intervals also have different effects on photovoltaic power generation. For example, too high a temperature will lead to the decrease of photovoltaic power generation, but the increase in irradiation will lead to an increase in temperature. Under the suitable temperature of normal irradiation or low irradiation conditions, the influence of temperature on photovoltaic power generation is relatively small. Therefore, the photovoltaic power generation process is more complicated under high irradiation and high-temperature conditions, which has a great influence on the accurate prediction of photovoltaic power generation. In addition, according to the relevant characteristics of the data-driven algorithm, there is always a regression to the mean problem in the prediction of the peak and valley values of the sequence, which will lead to a large prediction error near the extreme value interval of the sequence. The traditional prediction method does not consider the difference in the influence of various influencing factors on photovoltaic power generation under different irradiation interval conditions, which has a great impact on the prediction accuracy of photovoltaic power generation. Figure 1 is a comparison diagram of photovoltaic predicted power-irradiation without considering the distribution of the irradiation interval. The data in Figure 1 comes from the case part of Section 5. The prediction curve in Figure 1 is the prediction result of the LSTM model in Section 5.5. From the red circle part of the diagram, it can be seen that the prediction results have large errors under high irradiation and low irradiation conditions, but the prediction is more accurate under medium irradiation conditions. This is due to the fact that the time proportion of medium irradiation conditions is the largest in general, the influence mechanism of each influencing factor on photovoltaic power generation in different irradiation intervals is different, and the algorithm has the problem of the regression to the mean.
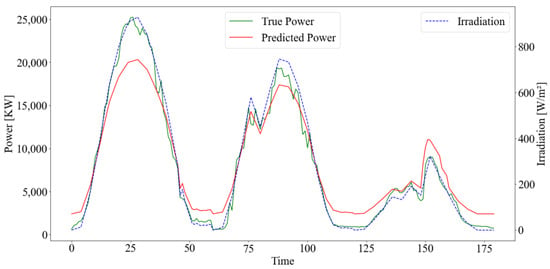
Figure 1.
A photovoltaic prediction power–irradiation comparison diagram.
In view of the above problems, this paper proposes a photovoltaic power prediction method considering the distribution of the irradiation interval. The prediction model is constructed in different irradiation intervals, and the mechanism of each influencing factor on photovoltaic power generation in different irradiation intervals is fully utilized to reduce the difference between the peak and valley values of the photovoltaic power generation sequence in model training, so as to effectively alleviate the problem of the regression to the mean of the data-driven algorithm.
2.2. Irradiation Interval Distribution Based on a Boxplot and an Isolated Forest
A boxplot is a method based on the minimum value, the first quantile, the median, the third quantile and the maximum value to describe the center position and dispersion range of one or more sets of continuous sequence distribution. It can find out the abnormal value of the data and judge the skewness and tail weight of the data, and can clearly show the overall distribution of the data [24].
Because the accuracy of the boxplot is easily affected by the median of the data, the irradiation data should not contain too much low irradiation data. Therefore, this paper intends to extract the data with irradiations greater than 100 W/m2 into groups A, B, C, and D, and use the boxplot to show the distribution of irradiation. Figure 2 is the irradiation box line diagram. From the diagram, it can be seen that the irradiation distribution of the four groups’ data is basically the same. The irradiation above 600 W/m2 accounts for about 25%, the irradiation between 200 W/m2 and 600 W/m2 accounts for about 50%, and the irradiation between 100 W/m2 and 200 W/m2 accounts for about 25%. It can be seen from Section 2.1 that when under the condition of medium irradiation the temperature is less affected, the photovoltaic power prediction in this irradiation interval is relatively accurate, and the proportion of medium irradiation is the highest. Therefore, when the irradiation interval distribution is set, the range of the medium irradiation interval is relatively wide, and the range of the high irradiation and low-irradiation interval is small. Combined with the boxplot of each group of irradiation, the initial irradiation interval distribution is set to be an ultra-low irradiation interval , a low irradiation interval , a medium irradiation interval , and high irradiation interval . The calculation formula of each interval is shown in Equation (1).
where represents the minimum value of group j when i = 2, represents the first quantile of group j when i = 2, represents the third quantile of group j when i = 3, and represents the maximum value of group j when i = 4.
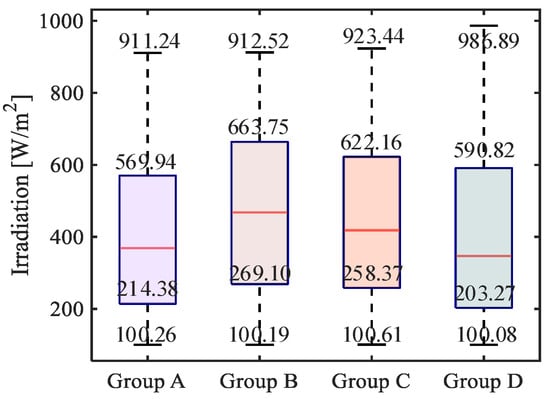
Figure 2.
A boxplot of the irradiation groups.
As an unsupervised learning anomaly data detection method, an isolated forest can quickly identify outliers in data. The main idea is to randomly construct isolated trees, recursively segment the data set randomly until all sample points are isolated, and finally evaluate the degree of abnormality of the data points by the path length. The path length refers to the number of segmentations along the tree from the root node to the data point, and the path length of the abnormal point is usually relatively short. Figure 3 is the schematic diagram of outlier detection in an isolated forest algorithm.
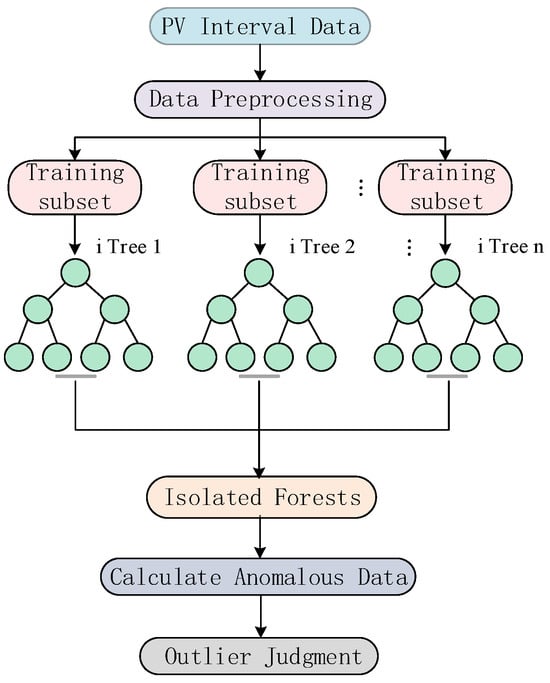
Figure 3.
An isolated forest outlier detection schematic diagram.
Considering the characteristics of photovoltaic power generation, this paper intends to use 5:00–20:00 photovoltaic power generation data to perform outlier detection on the data. Figure 4 is the outlier detection map of photovoltaic power generation power–irradiation in each irradiation interval.
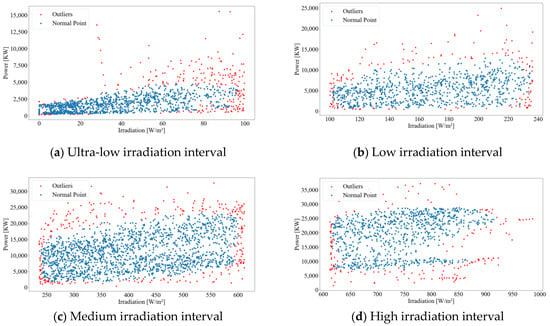
Figure 4.
Outlier detection in the different irradiation intervals.
3. Transformer-LSTM Model
3.1. Relevant Principle of Transformer
The Transformer model is a novel neural network architecture based on a self-attention mechanism, which aims to solve sequence–sequence tasks. Compared with the traditional neural network, the Transformer model not only solves the long-term dependence problem, but also can be trained in parallel, which greatly improves the operating efficiency of the model. The core content of the Transformer model mainly includes a self-attention mechanism, a multi-head attention mechanism, and position coding [25,26,27]. Figure 5 shows the internal architecture of the Transformer model.
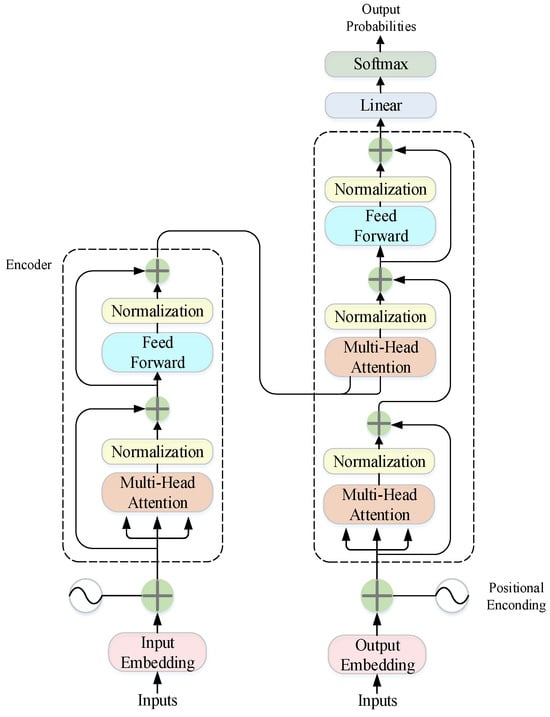
Figure 5.
A schematic diagram of the Transformer.
- (1)
- Self-attention Mechanism
The self-attention mechanism is a key feature of the Transformer, which enables the model to perform the weighted aggregation of various parts of the input sequence. The attention scores of the query vector (Q), key vector (K), and weight vector (V) are calculated using Equation (2).
where f is the model input, and is a trainable projection matrix. After the attention score is scaled, the value matrix is fused by weight summation, and then the final result is calculated. The calculation formula is shown in Equation (3).
- (2)
- Multi-head Attention
In order to capture different types of relationships, the Transformer uses H parallel self-attention mechanism (head) calculations, each head captures information in different subspaces by learning different weights. Under the condition of , the calculation process of the multi-head attention mechanism is shown in Equation (4).
- (3)
- Position Coding
Since Transformer does not have built-in sequence order information, position encoding is used to add some information to each position in the input sequence so that the model can distinguish tags at different positions.
where pos refers to the sequence position, i refers to the dimension, and refers to the size of the embedded space dimension.
3.2. Relevant Principle of LSTM
The original intention of LSTM design is to solve the long-term dependence problem in RNNs. Its output is affected by both the current time input and the previous time input and can accurately represent and transmit the information in the long time series without forgetting the effective information before a long amount of time has passed. Not only that, LSTM can also solve the problem of gradient disappearance and gradient explosion in general RNNs.
LSTM is different from general RNNs, which only has a single neural network layer. Its internal structure has four neural network layers: a forgetting gate, an input gate, a memory gate, and an output gate, and interacts in a specific form. The internal network structure is shown in Figure 6.
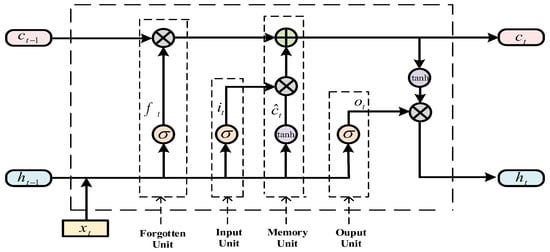
Figure 6.
A schematic diagram of an LSTM.
In Figure 6, , , , and represent the forgetting gate, the input gate, the memory gate, and the output gate in the internal structure of the LSTM, respectively, with indicating the update state of the memory gate, and being the output at time t. The calculation formulas of each part are shown in Equation (7).
where is the Sigmoid activation function, tanh is the hyperbolic tangent activation function, , , , and are, respectively, the weight matrices of the forgetting gate, the input gate, the memory gate, and the output gate at time t, is the unit output at the previous time, is the input at time t, is the state of the memory gate at a time, , , , and are, respectively, the bias vectors of the forgetting gate, the input gate, the memory gate, and the output gate.
3.3. Relevant Principle of Transformer-LSTM
When the traditional Transformer is applied in the field of time series prediction, the decoding layer is usually a linear layer, which will lead to a large error in the prediction task of complex data sets. Therefore, this paper intends to reconstruct the decoding layer based on the traditional Transformer model structure, modify the traditional decoding layer to be a fully connected layer, and refer to an LSTM module. Using the superiority of LSTM in time series prediction, the potential change rules in photovoltaic power generation time series data are further captured.
The Transformer is a sequence-to-sequence architecture model, which includes an encoder and a decoder. The Transformer model’s design is modular and flexible, allowing us to replace the components in it to adapt to different scenarios while keeping the overall framework unchanged. Therefore, the method of replacing the original decoding layer of the Transformer with LSTM is effective. In addition, the Transformer-LSTM has superior performance in other fields [28,29], which further verifies the effectiveness of the Transformer-LSTM model.
The data processing process of the Transformer-LSTM network is divided into intra-unit data processing and inter-unit data processing. The data is transmitted in two ways to realize the prediction of photovoltaic power generation, the in-cell processing is responsible for data parallel processing, and the out-of-cell processing is responsible for data serial processing. The overall architecture of the Transformer-LSTM model is shown in Figure 7.
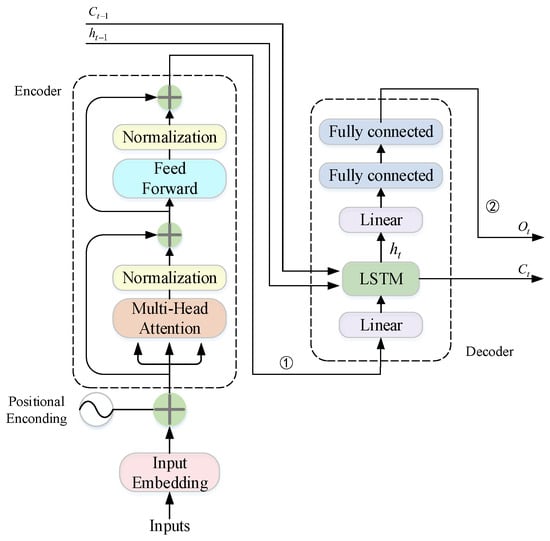
Figure 7.
The schematic design of Transformer-LSTM.
The data processing in the unit relies on the independent position coding layer, the Transformer coding layer and the LSTM decoding layer in the unit. The data advances in the unit according to the ① route in Figure 7, and the new input at each moment is position-coded and Transformer-coded. The encoded data can retain more features to ensure that the degree of signal attenuation is reduced during the prediction of photovoltaic power generation. The out-of-cell data processing is realized by the LSTM decoding layer. In the LSTM network, the time series can be completely saved. This feature can save more time features in photovoltaic power prediction, realize the serial data processing capability of the network, and improve the prediction performance of the network. The data transfer outside the Transformer-LSTM unit is shown in the Figure 7 ② data flow.
4. The Overall Framework of Prediction Based on Irradiation Interval Distribution and Transformer-LSTM
In order to improve the prediction accuracy of short-term photovoltaic power generation, this paper proposes a prediction method based on irradiation interval distribution and Transformer-LSTM, and the specific framework flow is shown in Figure 8.
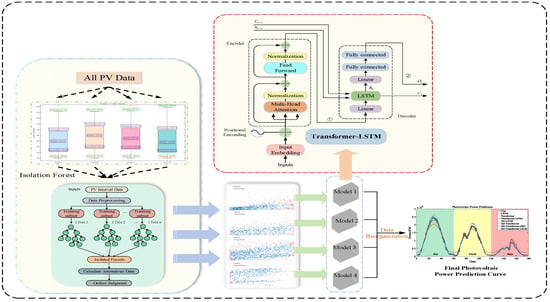
Figure 8.
The overall framework of the model studied in this article.
- Data preprocessing: Firstly, the original photovoltaic power generation data set is preprocessed, mainly including the processing of missing values and outliers in the original data and correlation analysis. The 3σ principle is used to detect the abnormal values of meteorological factors and photovoltaic power. The missing values and abnormal values are supplemented or replaced by linear interpolation, and the data are normalized.
- Through the Pearson coefficient, the correlation analysis of six meteorological factors, such as irradiation, air pressure, wind speed, rainfall, temperature, and cloud cover, is carried out to find out the meteorological factors most related to photovoltaic power generation: irradiation and temperature.
- Based on the box line diagram, the distribution of irradiation intervals in photovoltaic power generation data is observed to calculate the ultra-low irradiation interval , low irradiation interval , medium irradiation interval and the high irradiation interval.
- In order to further improve the data quality of each irradiation interval, the outlier detection of power–irradiation in each irradiation interval is carried out based on the isolated forest algorithm, and the outliers in the data are eliminated, which is conducive to the training of the model.
- Construct the prediction model of each irradiation interval, and the data of the corresponding interval is input into the model training. The test set is numbered internally, and the interval is input into the model prediction. Finally, the prediction results of each irradiation interval are reorganized according to the number to obtain the final prediction results, and the prediction results are evaluated.
5. Case and Analysis of Experimental Results
5.1. Data Description
The experimental data in this paper are derived from a photovoltaic power station in a certain area of Southern China, containing numerical weather prediction (NWP) data and corresponding photovoltaic power generation data for the four months from 1 June 2023 to 30 September 2023, with a time resolution of 15 min. The NWP data include six meteorological parameters: the irradiance, temperature, atmospheric pressure, rainfall, total cloud cover, and wind speed. Through the rainfall and total cloud cover, the data of sunny days, cloudy days, and rainy days are selected as the test set, and the remaining data are used as the training set. Considering the characteristics of photovoltaic power generation, this paper only uses 5:00–20:00 photovoltaic power generation data for simulation experiments.
5.2. Data Preprocessing and Feature Engineering
The original data contains certain abnormal data and missing values; it is proposed to use the 3σ principle to detect abnormal data, and to use linear interpolation to fill the data for missing values and abnormal data. In order to avoid the influence of the data magnitude on the prediction, the normalize function is used to normalize the unified data magnitude, and the calculation formula is shown in Equation (8).
where and are the mean and standard deviation of random variable , respectively.
In order to reduce the interference of redundancy in the original meteorological data, the Pearson correlation coefficient is used to screen the characteristic meteorological factors with high correlations with photovoltaic power generation as the input data of the model.
The calculation equation of the Pearson correlation coefficient is shown in Equation (9), and the Pearson correlation coefficient calculation results of each meteorological feature are shown in Table 1.
where is the covariance of data sets and . and are the standard deviations of data sets and , respectively. and are the average values of the data sets and , respectively. is the amount of data.

Table 1.
The Pearson correlation coefficients of the meteorological factors.
From Table 1, it can be seen that the correlation between photovoltaic power generation and irradiance is the highest, followed by temperature, while the correlation coefficients between atmospheric pressure, rainfall, the total cloud cover, and wind speed and power are all less than 0.15, and the correlation with power is too small. Therefore, this paper selects irradiance and temperature as characteristic meteorological factors input into the model to predict photovoltaic power generation.
5.3. Evaluating Indicator
In order to evaluate the accuracy of the photovoltaic power prediction model, this paper uses mean the absolute error (MAE) and root mean square error (RMSE) as the performance evaluation function. The specific expression is shown in Equations (10) and (11).
where is the actual value of photovoltaic power generation, is the predicted value of photovoltaic power generation.
5.4. The Prediction Results of Each Irradiation Interval
According to the results of the irradiation interval distribution obtained by Section 2.2, the historical photovoltaic power generation data is input into the corresponding Transformer-LSTM prediction model according to the irradiation interval distribution, and the SVM, GRU, LSTM, Transformer, and Transformer-GRU models are constructed as comparison models. Among them, the SVM model kernel function uses a Gaussian kernel function. The epochs of the GRU and LSTM models are 100, the batch size is 64, the learning rate is 0.001, and the activation function is Relu. The epochs of the Transformer, Transformer-GRU, and Transformer-LSTM models are 100, the batch size is 64, the number of multi-head attentions is 8, the learning rate is 0.001, and the activation function is Relu. Then, photovoltaic power prediction is performed on three test sets of sunny, cloudy, and rainy days. The prediction results in each irradiation interval are shown in Figure 9, and the prediction performance of each model is shown in Table 2.
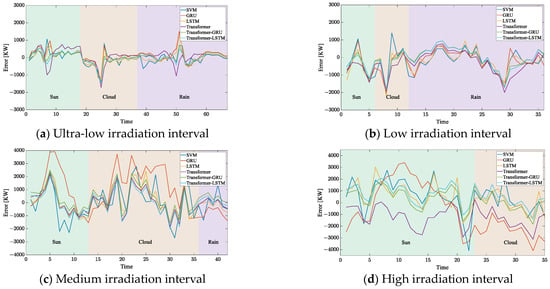
Figure 9.
A prediction error fluctuation diagram of the different irradiation intervals.

Table 2.
The prediction errors of each model in the different irradiation intervals.
Combined with the analysis of Figure 9 and Table 2, the data of the ultra-low irradiation interval are mainly concentrated in the time period with the lowest solar radiation in a day, such as in the morning and evening. The data proportion is basically the same under the three weather conditions. The irradiance and temperature in this interval are the lowest, which has the least influence on the photovoltaic power generation process. Compared with other irradiation intervals, it is the least difficult to predict the photovoltaic power, so the error fluctuation range is the smallest. Among the single models in this interval, the Transformer performs best and the prediction error is the smallest, the MAE = 0.3250, and the RMSE = 0.4645. The combined model shows great improvement over the performance of the single model. Among them, the Transformer-LSTM prediction model proposed in this paper performs best: an MAE = 0.2843, an RMSE = 0.4212. Compared with the Transformer model, the accuracy of the MAE index is improved by 12.52% and the accuracy of the RMSE index is improved by 9.32%. Compared with the Transformer-GRU combined model, the accuracy of the MAE index is improved by 6.63% and the accuracy of the RMSE index is improved by 3.74%.
The low-irradiation interval data are mainly concentrated in the rainy days. The irradiance and temperature in this interval are relatively low, and their influence on the photovoltaic power generation process is relatively small. Compared with other irradiation intervals, the difficulty of photovoltaic power prediction is relatively small. Therefore, the error fluctuation range is relatively small and the error range fluctuation during the rainy days is significantly smaller than that during sunny days and cloudy days. Among the single models in this interval, the Transformer has the best performance and the smallest prediction error: an MAE = 0.5311, an RMSE = 0.6998. The Transformer-LSTM combination model proposed in this paper shows a relatively small improvement compared with the Transformer.
The data of the middle irradiation interval are mainly concentrated in the cloudy weather conditions. The irradiance and temperature in this interval are relatively high, and their influence on the photovoltaic power generation process is relatively large. Compared with other irradiation intervals, the difficulty of photovoltaic power prediction is relatively large, so the error fluctuation range is relatively large. Among the single models in this interval, the Transformer performs best and the prediction error is the smallest: an MAE = 0.3380, an RMSE = 0.4032. Compared with the Transformer-LSTM combination model proposed in this paper, the accuracy of the MAE index is improved by 2.13%, and the accuracy of the RMSE index is improved by 1.88%.
Most of the data in the high irradiation interval are concentrated in the sunny days, and a small part of the data are distributed in the cloudy weather conditions. The irradiance and temperature in this interval are the highest, which has the greatest influence on the photovoltaic power generation process. The photovoltaic power generation process in this interval is also affected by the installed capacity. Compared with other irradiation intervals, it is the most difficult to predict the photovoltaic power in this interval, so the error fluctuation range is the largest. In this interval, the Transformer-LSTM prediction model proposed in this paper performs best: an MAE = 0.2319, an RMSE = 0.2831. Compared with the Transformer model, the accuracy of the MAE index is improved by 4.96%, and the accuracy of the RMSE index is improved by 4.16%. Compared with the Transformer-GRU combination model, the accuracy of the MAE index is improved by 5.00%, and the accuracy of the RMSE index is improved by 4.07%.
In summary, the Transformer-LSTM prediction model proposed in this paper shows certain improvement compared with the traditional prediction method under different irradiation interval conditions, which verifies the effectiveness and robustness of the proposed method.
5.5. Photovoltaic Power Prediction Results and Comparison
In order to further verify the accuracy and universality of the prediction method proposed in this paper, five comparison models are constructed to predict sunny, cloudy, and rainy days, respectively. The model information is shown in Table 3. In Table 3, the photovoltaic power prediction model based on IID refers to the following process. First, divide the original data into multiple parts according to the irradiance, and then construct the photovoltaic power prediction model of each part. Then, the photovoltaic power of each part is predicted, respectively. Finally, the final photovoltaic prediction power is obtained by combining the photovoltaic prediction power of each part in chronological order. The prediction results of each model are shown in Figure 10, and Table 3 provides the performance indicators of each model.

Table 3.
The prediction error of each model under different weather conditions.
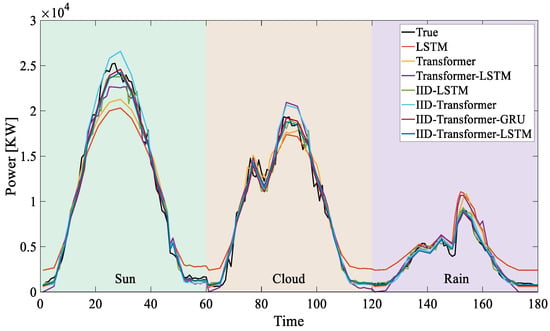
Figure 10.
The photovoltaic power prediction curves under different weather conditions.
By observing Table 2 and Table 3, it can be found that the photovoltaic power prediction error in Table 3 which is not based on the IID model is much larger than the photovoltaic power prediction error in each irradiation interval in Table 2. This is due to the following reasons. The error data in Table 2 are calculated according to the prediction results of each irradiation interval. This represents the prediction error of the photovoltaic power in each irradiation interval. The fluctuation of irradiance and temperature in the same irradiation interval is small, and their effects on the photovoltaic power generation process are similar. Therefore, the prediction error of the photovoltaic power is relatively small in the same irradiation interval. However, the error data in Table 3 that are not based on the IID model are directly predicted using the original data. The irradiance and temperature in the original data fluctuate greatly, and their influence on the photovoltaic power generation process varies greatly. Therefore, the photovoltaic power prediction error that is not based on the IID model is relatively large in Table 3.
Combined with the analysis of Figure 10 and Table 3, the prediction accuracy of photovoltaic power generation based on IID is significantly improved under sunny, cloudy, and rainy conditions, and the peak and valley values of photovoltaic power increase the most, which can effectively solve the problem of the data-driven algorithm regression to the mean. When the weather is sunny, the Transformer-LSTM performs best among the models without IID: an MAE = 0.9275, an RMSE = 1.1597. Compared with the Transformer-LSTM, IID-LSTM, IID-Transformer, and IID-Transformer-GRU models, the IID-Transformer-LSTM combined prediction model proposed in this paper performs superiorly: an MAE = 0.7699, an RMSE = 1.1597. The accuracy of the MAE index is improved by 23.34%, 7.65%, 13.58%, and 11.41%, respectively, and the accuracy of the RMSE index is improved by 22.13%, 13%, 14.76%, and 9.10%, respectively. When the weather is cloudy, the Transformer-LSTM performs best among the models without IID: an MAE = 0.9288, an RMSE = 1.1840. Compared with the Transformer-LSTM, IID-LSTM, IID-Transformer, and IID-Transformer-GRU models, the IID-Transformer-LSTM combined prediction model proposed in this paper performs best: an MAE = 0.5717, an RMSE = 0.7971. The accuracy of the MAE index is improved by 38.45%, 14.68%, 29.16%, and 3.10%, respectively, and the accuracy of the RMSE index is improved by 32.68%, 12.45%, 26.18%, and 5.78%, respectively. When the weather is rainy, the Transformer-LSTM performs best among the models without IID: an MAE = 0.5267, an RMSE = 0.7946. Compared with the Transformer-LSTM, IID-LSTM, IID-Transformer, and IID-Transformer-GRU models, the IID-Transformer-LSTM combined prediction model proposed in this paper performs best: an MAE = 0.3007, an RMSE = 0.4201. The accuracy of the MAE index is improved by 43.24%, 2.40%, 7.56%, and 10.27%, respectively, and the accuracy of the RMSE index is improved by 47.13%, 4.76%, 12.73%, and 4.73%, respectively.
6. Conclusions
In order to further improve the prediction accuracy of photovoltaic power generation, this paper proposes a prediction method based on irradiation interval distribution and Transformer-LSTM, aiming at the different principles of photovoltaic generators in different irradiation intervals and the problem of the regression to the mean in data-driven algorithms, and combines NWP data and photovoltaic power generation field power data in a certain area of Southern China for experimental verification.
- (1)
- Based on the boxplot calculation, the irradiation interval distribution is obtained, and the isolated forest algorithm is used to eliminate the irradiation–power outliers in each irradiation interval to optimize the data, so as to fully explore the influence mechanism of meteorological factors on photovoltaic power generation in each irradiation interval, and the irradiation interval distribution is used to reduce the difference between the peak and valley values of the sequence, so as to solve the problem of the regression to the mean and to improve the prediction accuracy.
- (2)
- This paper proposes a Transformer-LSTM combined prediction model. The coding layer uses the self-attention mechanism of the Transformer to focus on key information, and uses LSTM instead of the original decoding layer Transformer, so as to use the sensitivity of the LSTM to time perception to capture potential changes in photovoltaic power generation data.
- (3)
- The experimental results show that the prediction accuracy of the proposed method is significantly improved compared with other prediction models under sunny, cloudy, and rainy conditions, and the improvement is the largest near the peak and valley values of the photovoltaic sequence.
Author Contributions
Conceptualization, Z.L.; methodology, Z.L.; software, Z.L.; validation, Z.L.; writing—original draft preparation, W.M.; writing—review and editing, C.L.; supervision, B.W. All authors have read and agreed to the published version of the manuscript.
Funding
This research was funded by the National Key Research and Development Program of China (2022YFB2403503).
Data Availability Statement
The data presented in this study are available on request from the corresponding author due to privacy.
Acknowledgments
Zhiwei Liao thanks Wenlong Min, Chengjin Li, and Bowen Wang for their valuable discussions and their helpful advice with this paper.
Conflicts of Interest
The authors declare no conflicts of interest.
References
- Tang, X.; Bai, H.; Zhang, Y.; Pan, S.; Wu, P.; Zhou, C.; Deng, P.; Lei, J.; Li, Q.; Yuan, Z. Simulation and analysis of integrated energy conversion and storage systems using CloudPSS-IESLab. Energy Rep. 2022, 8, 1372–1382. [Google Scholar] [CrossRef]
- Xu, W.; Wang, Z.; Wang, W.; Zhao, J.; Wang, M.; Wang, Q. Short-Term Photovoltaic Output Prediction Based on Decomposition and Reconstruction and XGBoost under Two Base Learners. Energies 2024, 17, 906. [Google Scholar] [CrossRef]
- Kuo, W.C.; Chen, C.H.; Hua, S.H.; Wang, C.C. Assessment of different deep learning methods of power generation forecasting for solar PV system. Appl. Sci. 2022, 12, 7529. [Google Scholar] [CrossRef]
- Wu, X.; Lai, C.S.; Bai, C.; Lai, L.L.; Zhang, Q.; Liu, B. Optimal kernel ELM and variational mode decomposition for probabilistic PV power prediction. Energies 2020, 13, 3592. [Google Scholar] [CrossRef]
- Singh, S.; Saini, S.; Gupta, S.K.; Kumar, R. Solar-PV inverter for the overall stability of power systems with intelligent MPPT control of DC-link capacitor voltage. Prot. Control. Mod. Power Syst. 2023, 8, 15. [Google Scholar] [CrossRef]
- Li, P.; Wu, Z.; Zhang, C.; Xu, Y.; Dong, Z.; Hu, M. Multi-timescale affinely adjustable robust reactive power dispatch of distribution networks integrated with high penetration of PV. J. Mod. Power Syst. Clean Energy 2021, 11, 324–334. [Google Scholar] [CrossRef]
- Tsai, W.C.; Tu, C.S.; Hong, C.M.; Lin, W.M. A review of state-of-the-art and short-term forecasting models for solar pv power generation. Energies 2023, 16, 5436. [Google Scholar] [CrossRef]
- Gu, B.; Shen, H.; Lei, X.; Hu, H.; Liu, X. Forecasting and uncertainty analysis of day-ahead photovoltaic power using a novel forecasting method. Appl. Energy 2021, 299, 117291. [Google Scholar] [CrossRef]
- Cheng, L.; Zang, H.; Trivedi, A.; Srinivasan, D.; Wei, Z.; Sun, G. Mitigating the impact of photovoltaic power ramps on intraday economic dispatch using reinforcement forecasting. IEEE Trans. Sustain. Energy 2023, 15, 3–12. [Google Scholar] [CrossRef]
- Zhang, C.; Peng, T.; Nazir, M.S. A novel integrated photovoltaic power forecasting model based on variational mode decomposition and CNN-BiGRU considering meteorological variables. Electr. Power Syst. Res. 2022, 213, 108796. [Google Scholar] [CrossRef]
- Cui, Y.; Zhang, H.; Zhong, W.; Zhao, Y.; Zhang, J.; Wang, M. Multi-source optimal scheduling of renewable energy high-permeability power system with CSP plants considering demand response. High Volt. Eng. 2020, 46, 1486–1496. [Google Scholar]
- Dong, Z.; Zheng, L.; Su, R.; Wu, H.; Luo, P. An IGWO-SNN-based method for short-term forecast of photovoltaic output. Dianli Xitong Baohu Yu Kongzhi/Power Syst. Prot. Control 2023, 51, 131–138. [Google Scholar]
- Cao, Y.; Liu, G.; Luo, D.; Bavirisetti, D.P.; Xiao, G. Multi-timescale photovoltaic power forecasting using an improved Stacking ensemble algorithm based LSTM-Informer model. Energy 2023, 283, 128669. [Google Scholar] [CrossRef]
- Ma, H.; Zhang, C.; Peng, T.; Nazir, M.S.; Li, Y. An integrated framework of gated recurrent unit based on improved sine cosine algorithm for photovoltaic power forecasting. Energy 2022, 256, 124650. [Google Scholar] [CrossRef]
- Li, G.; Wang, H.; Zhang, S.; Xin, J.; Liu, H. Recurrent neural networks based photovoltaic power forecasting approach. Energies 2019, 12, 2538. [Google Scholar] [CrossRef]
- Ren, X.; Zhang, F.; Sun, Y.; Liu, Y. A Novel Dual-Channel Temporal Convolutional Network for Photovoltaic Power Forecasting. Energies 2024, 17, 698. [Google Scholar] [CrossRef]
- Wang, K.; Du, H.; Jia, R.; Liu, H.; Lianf, Y.; Wang, X. Short-term interval probability prediction of photovoltaic power based on similar daily clustering and QR-CNN-BiLSTM Model. High Volt. Technol. 2022, 48, 372–374. [Google Scholar]
- Liu, X.; Liu, Y.; Kong, X.; Ma, L.; Besheer, A.H.; Lee, K.Y. Deep neural network for forecasting of photovoltaic power based on wavelet packet decomposition with similar day analysis. Energy 2023, 271, 126963. [Google Scholar] [CrossRef]
- Wu, T.; Hu, R.; Zhu, H.; Jiang, M.; Lv, K.; Dong, Y.; Zhang, D. Combined IXGBoost-KELM short-term photovoltaic power prediction model based on multidimensional similar day clustering and dual decomposition. Energy 2024, 288, 129770. [Google Scholar] [CrossRef]
- Wang, M.; Wang, P.; Zhang, T. Evidential extreme learning machine algorithm-based day-ahead photovoltaic power forecasting. Energies 2022, 15, 3882. [Google Scholar] [CrossRef]
- Meng, A.; Xu, X.; Chen, J.; Wang, C.; Zhou, T.; Yin, H. Ultra Short Term Photovoltaic Power Prediction Based on Reinforcement Learning and Combined Deep Learning Model. Dianwang Jishu/Power Syst. Technol. 2021, 45, 4721–4728. [Google Scholar]
- Tang, Y.; Yang, K.; Zhang, S.; Zhang, Z. Photovoltaic power forecasting: A hybrid deep learning model incorporating transfer learning strategy. Renew. Sustain. Energy Rev. 2022, 162, 112473. [Google Scholar] [CrossRef]
- Hou, X.; Wen, D.; Li, F.; Ma, C.; Zhang, X.; Feng, H.; Ren, J. Influence of light and its temperature on solar photovoltaic panels. In Proceedings of the E3S Web of Conferences, Shanghai, China, 16–18 August 2019; EDP Sciences: Paris, France, 2019; Volume 118, p. 01047. [Google Scholar]
- Fu, W.; Fu, Y.; Li, B.; Zhang, H.; Zhang, X.; Liu, J. A compound framework incorporating improved outlier detection and correction, VMD, weight-based stacked generalization with enhanced DESMA for multi-step short-term wind speed forecasting. Appl. Energy 2023, 348, 121587. [Google Scholar] [CrossRef]
- Nascimento EG, S.; de Melo, T.A.; Moreira, D.M. A transformer-based deep neural network with wavelet transform for forecasting wind speed and wind energy. Energy 2023, 278, 127678. [Google Scholar] [CrossRef]
- Liu, J.; Zang, H.; Cheng, L.; Ding, T.; Wei, Z.; Sun, G. A Transformer-based multimodal-learning framework using sky images for ultra-short-term solar irradiance forecasting. Appl. Energy 2023, 342, 121160. [Google Scholar] [CrossRef]
- Song, H.; Zhang, H.; Wang, T.; Li, J.; Wang, Z.; Ji, H.; Chen, Y. Skip-RCNN: A Cost-effective Multivariate Time Series Forecasting Model. IEEE Access 2023, 11, 142087–142099. [Google Scholar] [CrossRef]
- Kow, P.Y.; Liou, J.Y.; Yang, M.T.; Lee, M.H.; Chang, L.C.; Chang, F.J. Advancing climate-resilient flood mitigation: Utilizing transformer-LSTM for water level forecasting at pumping stations. Sci. Total Environ. 2024, 927, 172246. [Google Scholar] [CrossRef]
- Tan, K.; Zhang, E. Load Forecast Based on RF-PSO-VMD-Transformer-LSTM. In Proceedings of the 2023 IEEE 3rd International Conference on Data Science and Computer Application (ICDSCA), Dalian, China, 27–29 October 2023; pp. 684–689. [Google Scholar]
Disclaimer/Publisher’s Note: The statements, opinions and data contained in all publications are solely those of the individual author(s) and contributor(s) and not of MDPI and/or the editor(s). MDPI and/or the editor(s) disclaim responsibility for any injury to people or property resulting from any ideas, methods, instructions or products referred to in the content. |
© 2024 by the authors. Licensee MDPI, Basel, Switzerland. This article is an open access article distributed under the terms and conditions of the Creative Commons Attribution (CC BY) license (https://creativecommons.org/licenses/by/4.0/).