Abstract
This study introduces numerical advancements in an alternative design for the Super Proton Synchrotron (SPS) Beam Dump Facility (BDF) at the European Laboratory for Particle Physics (CERN). The design envisions a high-power operation target made of flowing liquid lead. The proposed BDF is a versatile facility for both beam-dump-like and fixed-target experiments. The target behavior is studied, assuming a proton beam with a momentum of 400 GeV/c, a pulse frequency of 1/7.2 Hz, and an average beam power of 355 kW. Using various Computational Fluid Dynamics (CFD) codes, we evaluate the behavior of liquid lead and predict the thermal stress on the target vessel induced by the pulsed heat source generated by the charged particle beam. The comparison increases the reliability of the results, investigating the dependencies on the CFD modeling approach. The beam is a volumetric heat source with data from the beam-lead interaction simulations provided by the European Laboratory for Particle Physics and obtained with a Monte Carlo code. Velocity field and stress profiles can enhance the design of the lead loop and verify its viability and safety when operated with a liquid metal target.
1. Introduction
Nowadays, spallation sources of beam power have evolved into systems that can handle high-energy deposition delivered in short pulses. High heat and radiation deposition for these new high-power sources have led to changes in design concepts that now aim to reduce unwanted effects on target materials. For power systems requiring efficient cooling and high beam density, these competing requirements can be better accommodated by moving the target material out of the reaction zone to remove heat elsewhere. In similar situations, liquid metals are a good option in the design of accelerator-driven systems (ADS), subcritical assemblies driven by high-power proton accelerators through a spallation target, which is coupled to the nuclear reactor core; for example, see [1] and references therein. However, liquid metals require innovative solutions to several new problems, such as liquid metal corrosion and cavitation erosion [2,3,4]. While this can help to keep the average thermal and radiation load low and thus significantly extend the lifetime of the target material, practical implementation still presents conceptual issues that are difficult to resolve. Most effects can hardly be simulated with reliable computational tools, and experiments in this field are limited.
This paper considers the Super Proton Synchrotron Beam Dump Facility (SPS-BDF) at the European Laboratory for Particle Physics (CERN). The standard design of the SPS-BDF facility uses a particle beam against solid targets with high-Z material with a short nuclear interaction length. With the increase in energy, heat fluxes need to be dissipated and thermo-mechanical stresses to be limited but a heat removal system may be problematic in a constrained configuration. An alternative idea is to use a fluid that can be, at the same time, refrigerant and a solid target with high-Z material. Flowing liquid metals are attractive as they can provide a far larger thermal capacity and guarantee a comfortable safety operational margin. In particular, this article proposes a study on an alternative design for the Beam Dump Facility (BDF) using a liquid lead target of 400 °C. Heavy Liquid Metals can be suitable, but accurate CFD simulations are still an open research topic in this field. The assessment of their performance, especially in high-turbulent regimes, is still challenging with well-established CFD commercial codes due to their unique physical characteristics. Commercial codes are calibrated to simulate fluids such as air and water where turbulent heat transfer is modeled in the same way as dynamic turbulence. Instead, the low Prandtl number in liquid metals implies a significant difference in the behavior of the turbulent heat boundary layer. Therefore, a space-dependent turbulent Prandtl number must be correctly employed. Fortunately, the simple cylindrical geometry is well-known from nuclear reactor studies. Experimental data can be used to evaluate the turbulent Prandtl number, the temperature profile, and the heat turbulent flow transfer [5]. This paper addresses the heavy liquid metal turbulent heat transfer modeling for this geometry in commercial codes and opens the way for the alternative design of the Beam Dump Facility with these computational tools.
The paper is structured as follows. In the next section, we show some details of the facility with an HLM alternative target. In Section 3, we discuss the CFD modeling: heavy liquid metal turbulent heat transfer, generation of the heat source, and setup for CFD codes. Finally, in Section 4, we present the numerical simulations and analyze the pressure and temperature profiles needed to evaluate the feasibility of the alternative design of the facility.
2. The Facility and the HLM Alternative Target
The Beam Dump Facility (BDF) is a proposed facility foreseen to be located in the North Area of the Super Proton Synchrotron (SPS) at CERN (European Laboratory for Particle Physics) [6], developed to serve experiments associated with the search for feebly interacting particles. The facility, as proposed in Figure 1, would enable searches for very weakly interacting particles predicted by various physics models and extensive tau neutrino searches, as well. The current BDF design has been primarily driven by the requirements of the Search for Hidden Particles Experiment (SHiP) [7,8]: the target shall safely absorb the 400 GeV/c SPS primary beam every s, and it is required to maximize the production of charm mesons and to maximize the re-absorption of pions and kaons. This implies a high-Z material with a short nuclear interaction length. The main challenge comes from the requirement to withstand the high deposited power—up to 355 kW on average and up to MW over the 1 s beam pulse.
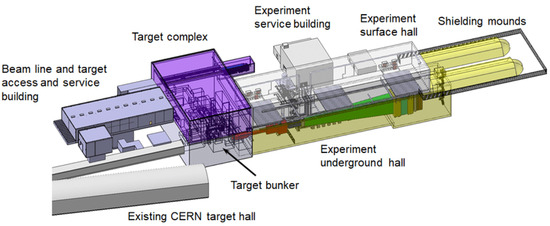
Figure 1.
Overview of the Beam Dump Facility (BDF) target complex and experimental area.
The BDF-proposed target baseline consists of cylindrical blocks of titanium-zirconium-doped molybdenum alloy (TZM), followed by pure tungsten sections, enclosed in tantalum-tungsten alloy cladding to prevent corrosion from the high-velocity cooling water. The thickness of each block and the location of each cooling slot were optimized to ensure uniform energy deposition and sufficient energy extraction [9]. To demonstrate the capability and sustain the thermo-mechanical stresses, a prototype target was built and tested successfully in the North Area target area during 2018 [10].
The current baseline can safely handle the beam power deposition when the beam is diluted; the dilution technique consists of magnetically deflecting the beam upstream to move the spot location over the pulse time. This is necessary to avoid premature failure by the target core or cladding cracking due to excessive energy density in the refractory metals composing the target core. The current design maximizes the physical capacity with the basic beam parameters. However, greater design flexibility implies lower energy density values and the absence of radiation damage.
In this paper, an alternative to the baseline design is evaluated to adopt HLM technologies developed in the framework of advanced nuclear technology research. The possibilities offered by proton-driven HLM targets are unique since they can overcome some of the operational challenges encountered in solid target/dump assemblies: the use of HLM (pure lead or lead-bismuth eutectic) has the potential advantages of increased power and power density handling capability, reduced degradation and loss of functionality over time due to thermo-mechanical stresses and radiation damage. Also, in the case of circulating systems, it offers the opportunity to displace the cooling system far from the target area.
The geometry considered for the preliminary investigations on the target is driven by the interaction volume simulated in FLUKA [11,12], consisting of a cylindrical volume of 2000 mm in length and a diameter of 150 mm. Inlet and outlet sections of 76 mm are added radially at both ends to allow the ingress and exit of the fluid, as shown in Figure 2.
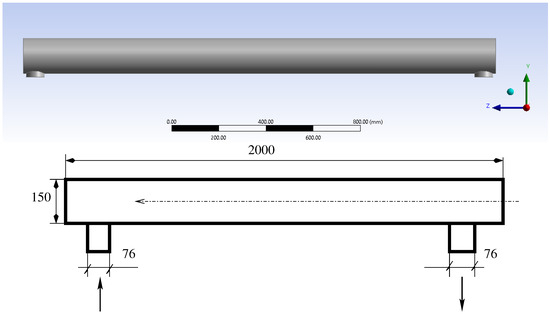
Figure 2.
The Beam Dump Facility target geometry.
This paper reports on the analyses made to determine the mass flow rate necessary to guarantee the management of thermal power through the use of the commercial code Ansys CFX [13]. Further thermo-hydraulic analysis is conducted using Ansys Fluent [14] to confirm the thermal results obtained for peak temperatures, thus advancing towards a concept design with tentative hydraulics parameters.
3. CFD Modeling
This section explores the mathematical model of turbulent heat transfer and the numerical implementation of the simulated data related to the heat source generated by the proton beam.
3.1. Turbulent Heat Transfer in Liquid Metals
Liquid metals are ideal fluids for new energy applications due to their thermal properties that greatly enhance heat transfer. The thermophysical properties of liquid lead as a function of temperature are characterized by high thermal conductivity k and low viscosity . In this paper, we assume [15]
for the density , molecular viscosity , heat conductivity k and specific heat , respectively. These physical properties have been obtained by fitting experimental data. Their trends, as a function of temperature T, are shown in Figure 3. The interested reader can consult the Handbook on liquid metals in [15], where experiments and measurement uncertainties are discussed in detail. Other relevant data about lead are the boiling point, at 2021 K, and the melting point, at 600 K [15].
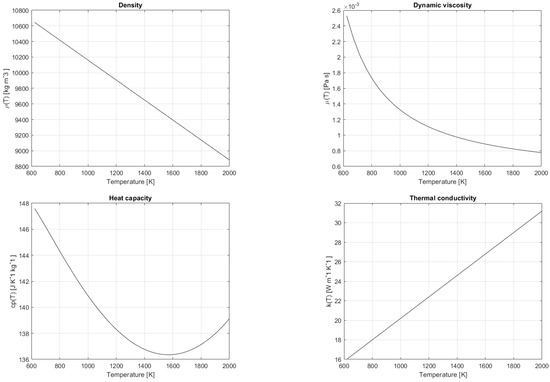
Figure 3.
Thermophysical properties of liquid lead as a function of temperature T, as shown in (1).
The accuracy required for the thermal management of a circulating HLM target raises the problem of CFD models for low Prandtl numbers. In fact, when dealing with liquid metals, the thermal diffusivity dominates the momentum diffusivity, leading to a Prandtl number in the range –. This problem is common in many industrial and research applications, such as nuclear reactors with fast spectrum and MHD (Magneto-Hydro-Dynamics) energy conversion facilities, where the high thermal conductance and heat capacity are desirable to remove high quantities of heat. When trying to model turbulent heat flows in liquid metals, standard models implemented in commercial codes such as Fluent and CFX are generally not accurate enough to reproduce the heat transfer in such regimes. The turbulent Prandtl number is defined as the ratio between the diffusivity and the turbulent viscosity , and it is commonly assumed to be constant: this is not the case for these fluids [16]. Commercial codes are, in fact, calibrated on materials such as water and air where the hypothesis of similarity between the dynamics of thermal and viscous turbulence holds and the calculation of turbulent diffusivity is set by taking and therefore . A more sophisticated model is required to reproduce the heat exchange when dealing with liquid metals with low Prandtl numbers. The model development requires extensive experimental data for all the regimes of interest. It must be taken into account that these experiments are very expensive and require ad-hoc measuring instruments developed to manage these types of fluids. When it is possible to perform CFD studies utilizing DNS (Direct Numerical Simulations), the correct heat transfer coefficients can be calculated directly with the simulation, avoiding the costs of the experimental facility. However, even these are limited to small spatial domains and simple geometries since the computational cost of DNS is very high, even on modern parallel architectures. Only a handful of geometries have been successfully explored with DNS using low Prandtl numbers. Various models have been developed in recent years based on RANS (Reynolds Averaged Navier–Stokes) models for different fluids. In particular, recent interest in turbulence models for heat transfer has increased because some designs for fourth-generation nuclear reactors utilize liquid metals (sodium and lead, in particular) as the refrigerant. This has spurred the development of effective and tailored computational tools for these new reactors [5,17].
Many strategies have been explored to tackle the turbulent heat exchange in liquid metals. A simple model can be obtained by specifying the turbulent Prandtl number as a function of the geometry and other dimensionless quantities, such as the distance to the wall or the viscosity [18]. The problem with this approach is that this function depends on the case under consideration and the specific geometry. The advantage of this approach is the simple implementation, and it does not significantly affect the system of partial differential equations to be solved. This is crucial when using commercial codes that leave a reduced set of options for the user to manipulate the mathematical model. Experimental evidence measuring integral heat transfer can be used to determine such functions that must be explored for a comprehensive set of Reynolds and Péclet numbers. For this purpose, experiments, not yet fully available, are necessary with advanced measurement techniques to estimate the mechanism of turbulent heat exchange that provides the heat and velocity flows near the walls, together with the fluctuations of the thermal and velocity fields. Furthermore, additional experiments are needed to define the thermal wall functions for liquid metals valid in the nonlinear region above .
Heat transfer in liquid metals with low Prandtl numbers is characterized by a high contribution of molecular conduction compared to conventional heat transfer with high Prandtl numbers for fluids such as water, where the inertial contribution and convective exchange have a dominant role. The temperature drop in liquid metals is limited within the laminar substrates. The models, based on global heat exchange and tailored to simple experimental geometry, show great accuracy when applied within the limits where they were obtained. On the other hand, they perform poorly when adapted to different regimes or geometries. Theoretical models are more complex to develop and often do not perform to the same level of accuracy as empirical models. However, they lead to a significant and deeper understanding of the heat transfer mechanism. Among the empirical models, we can mention the Aoki model, the Dwyer model, and the Reynolds model, which we report below [5].
All these models give comparable results in cylindrical geometries with diameters of 10 mm at 300 °C with velocities in the range from to m/s, which gives values for the Pèclet number ranging from 140 to 2800. In these models, the value of is assumed constant.
Numerous DNS simulations in flat channel geometry have been performed to study the spatial behavior of the value of the turbulent Prandtl number. These calculations show that the near-wall value is close to unity regardless of the Prandtl and Reynolds number if the Prandtl number is larger than [18]. For small values of Prandtl, such as the range – characteristic of liquid metals, the value of tends to 2 at the wall. The value increases moving away from the wall and reaches its maximum value at a distance of . The turbulent Prandtl number ranges from 1 to 3, which also agrees with the above correlations.
When using the Ansys CFX code, starting from the results of these correlations in [5], the following expression for the value of the turbulent Prandtl number is recommended
where b is calculated by the following formula
With the values defined above, the Kirillov correlation [19]
is reproduced quite well with the liquid metal LBE for low values, while for high values, it comes close to that of Stromquist [20]
3.2. CFD Codes for Thermo-Hydraulic Simulation
The dynamic and thermal analysis of the target device is carried out with two Ansys commercial codes: CFX and Fluent. The two codes are used in parallel to confirm the feasibility of the project and to compare the results obtained with different implementations of the turbulent Prandtl model.
The CFX and Fluent solvers were used and compared to check their suitability for performing the simulation of the BDF facility. The two codes adopt both the finite volume method and evaluate the quantities of interest (velocity, density, pressure, and temperature) in control volumes by using flux interpolations. The main difference between the two solvers lies in the definition of the single control volume: CFX implements the vertex-centered method (VCM), while Fluent uses the cell-centered method (CCM), as shown in Figure 4 [13,14].
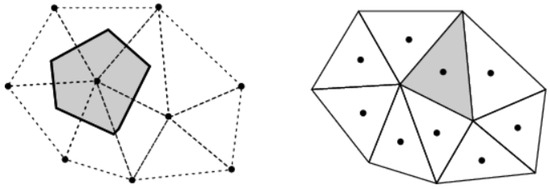
Figure 4.
Vertex-centered method (VCM) on the left and cell-centered method (CCM) on the right. The gray area illustrates the control volume for the two setups.
In the CFX code, the variables associated with the control volume are defined by the middle lines passing through each face of the grid cells. Conversely, in the cell-centered method, the variables are stored in the centroids of the computational cells, and the control volume is defined by the mesh triangulation. Both schemes have advantages and disadvantages in terms of accuracy and computational cost. The CCM has fewer flow unknowns but more degrees of freedom in total. This makes it more computationally expensive, using approximately double the memory and resources compared to VCM. On the other hand, it is less sensitive to mesh quality, in particular to the non-orthogonality and skewness of the discretization. Both solvers have different choices with different spatial discretization schemes, i.e., first-order upwind difference, second-order central difference, a high-resolution scheme in CFX, and first-order upwind, second-order upwind, and second-order central differencing in Fluent.
The CFD simulations performed with the CFX software v2021-R1 use the SST turbulence model. The and the SST turbulence model are considered the best approximations among RANS models for the simulation of heavy liquid metals, see references [5,16]. The boundary condition at the inlet is an imposed mass flow rate for the velocity and fixed temperature. The pressure is fixed, and the temperature gradient is set to zero at the outlet. All other boundaries are modeled as adiabatic walls, so we impose a no-slip condition for the velocity and no heat flux for the temperature. The computational domain is an unstructured mesh of million nodes with a on all the walls. The time step for the transient is set to s. The lead inlet temperature is 400 °C. The thermal transient analysis solves only the energy equation with imposed motion obtained from a previous isothermal simulation. In CFX, three classes of simulations are performed with different mass flow rates: 185 kg/s (A), kg/s (B), and kg/s (C), respectively. All cases have the same mesh with the same boundary conditions; the only variation is the mass flow rate at the inlet. Thermal power is implemented by an interpolation function using standard tools in CFX from an appropriate window selector. The heat source implementation in CFX using this approach has an error of if compared to the average steady-state power integrated directly from the FLUKA results. The maximum temperature, reached at the end of the thermal deposition, is 660 °C (case A) and 1163 °C (case C), while the maximum wall temperatures are 460 °C (case A) and 520 °C (case C). The target flow rate value is kg/s. With this flow rate, a CFD analysis is performed spanning two subsequent beams to analyze the temperature profile dependence on the frequency of the beams, i.e., to understand what influences the residual heat can impose on the next heat cycle. This analysis shows an increase in peak temperature between two successive beams of only 2 °C, so the thermal capacity of the lead can almost entirely remove the heat of a single beam before a new one delivers its heat payload.
From the point of view of the implemented models, Fluent presents more complex physical and numerical models. It can simulate almost all fields of physics, such as magnetohydrodynamics, acoustics, radiative heat exchange, combustion, and motion in porous materials. The implementation and solution of additional physical models in Fluent is also possible thanks to the implementation of UDFs.
The setup of the simulations in Fluent follows the CFX setup as close as possible to minimize numerical differences. The same turbulence SST model is selected. The boundary conditions have a fixed mass flow rate at the inlet, pressure at the outlet and zero velocity on walls. The temperature is fixed at the inlet. Adiabatic conditions are used on all other boundaries. The mesh is a polyhedral unstructured mesh of million nodes with a . The time step for the transient is s. The mesh size is selected based on the intensity of the time-dependent heat source. The mesh has an inflation layer (a layer of cells very close to the wall, whose dimensions grow further away from it) of mm.
The study of the thermal transient is carried out with different subsequent simulations aimed at analyzing the problem at increasing levels of complexity and computational cost. The classes of simulations carried out can be grouped into three cases labeled by (1) En_T, where only the energy equation with imposed motion is solved; (2) En_Tm, where only the energy equation with variable physical properties is solved; (3) En_full, where the complete simulation with variable properties, equation of motion, and energy are solved.
3.3. Thermal Source Modeling
From a thermo-hydraulic point of view, we study the turbulent heat transport generated by a volumetric thermal source inside an axial symmetric computational domain. The thermal source is generated by the interaction of the proton beam with the target, which is liquid lead entering at 400 °C. The chosen inlet temperature is typical for circulating liquid lead facilities [3,4,17,19], as it provides a robust margin against accidental localized solidification (occurring at 327 °C), and prevents significant corrosion on commercial-grade stainless-steel pipe walls [3]. The computational domain consists of three ducts, a middle one that is 2 m long and m in diameter, and two smaller 76 mm ducts for the inlet and the outlet, transverse to the central duct. The dimensions of the main duct reflect the interaction volume calculated with Monte Carlo simulations, and the transverse ducts reproduce the internal diameter of commercial 3 in pipes. The proton beam distribution provided on the coordinates is axisymmetric and peaks along the z-axis. The size of the thermal source is determined by the beam source using the Monte Carlo code Fluka [11,12]. Fluka is a general-purpose tool for particle transport and interactions with matter, covering an extended range of applications from proton and electron accelerator shielding to target design in different fields, such as calorimetry, dosimetry, and radiotherapy. The Fluka code, based on microscopic models, is consistent with the reaction and conservation laws. As a result, final predictions are obtained with a minimal set of free parameters fixed for all energy and target combinations. Fluka code can determine the interaction and propagation of many particles, such as photons, electrons, and neutrons.
The thermal source, which fills the entire volume of the middle conduit, is represented in Figure 5 as a function of the three spatial coordinates. The distribution is Gaussian on the x and y axis and exponential on the z direction. Table 1 summarizes the variation in the source data within the domain. The values reported in Table 1 indicate the minimum (Min), maximum (Max), and average (Ave) power density of the source; the quantities , indicate the variation in spatial coordinates in cylindrical coordinates, where is the increment over the z coordinate.
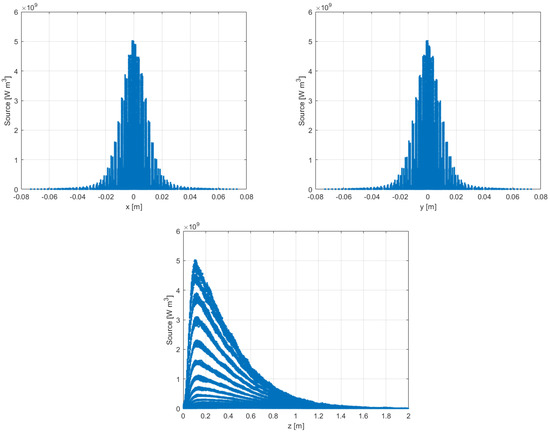
Figure 5.
Beam heat source as a function of the x, y, z coordinates.

Table 1.
Main features of the heat map in Cartesian and cylindrical coordinates.
The implementation of the thermal source is performed differently for each software. CFX allows the implementation of the source via a more user-friendly graphical interface. The implementation of the thermal source in CFX is, in fact, achieved by defining a volume within the domain in which the thermal source will be interpolated, using a function containing the heat map data.
The heat source for the k-th centroid is given by
where is the distance between the k-th centroid and the i-th point of the heat source, the value of the heat source at k-th centroid, n the number of heat source points and N is the number of mesh centroids. and are the j-th components of the k-th centroid and of the i-th point of the thermal source, respectively. The value of the heat source , to insert into the energy balance equation, is expressed in W/m3. In our case, given the viscosity of lead, the heat-generating contribution due to viscous effects can be neglected. In both solvers, the source is interpolated for each cell centroid in the computational domain via (10). This value is then averaged on the inverse distance between the three thermal sources closest to the centroid in the exam.
The thermal source generated by the proton beam is time-dependent and has characteristics summarized in Table 2. To verify the effects of the interpolation of the heat map on the mesh, a stationary simulation of the En_T type was conducted. In this case, only the energy equation was solved with constant physical properties for the lead and with an imposed velocity field. This simulation results in an average deposited power of W, against the W provided by CERN, with an error of , and a temperature at the outlet of 711 K. The heat map implementation is calibrated with this error of , the same one present in CFX simulations.

Table 2.
Heat map features.
The thermal source implementation in Fluent requires the use of User-Defined Functions (UDFs), written in C or C++. These allow the manipulation and implementation of equations and solution models directly in the Fluent solver loop. The source intensity, shown in Figure 5, significantly increases in a narrow cylinder close to the axis in the region near the beam entrance ( m). This small volume can be reasonably assumed to be a coaxial cylinder inside the central duct with a one-meter length and two-centimeter diameter. Inside this volume, the thermal source has values exceeding W/m3. This narrow distribution can affect the source interpolation based on (10).
To see this, we consider a C++ code, which creates a 2D uniform square mesh in the x, y axes. Figure 6 shows the centroid points (in red), which are carried out from the C++ code, and the source points (in blue) on a z constant plane. Two cases with different mesh sizes are considered to understand the importance of the discretization of the source term: a mesh with a pitch of 2 mm (on the left) and a finer one with a pitch of 0.5 mm (on the right). We observe that in Figure 6 on the left, there are no mesh points inside the inner circle where the interpolation may smooth the energy intensity contained in the central points.
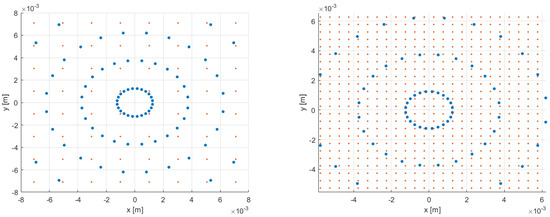
Figure 6.
Heat source interpolation strategy over points with different mesh on the x-y plane. The CFD mesh and the heat source points are in red and blue.
In the C++ code, an algorithm has been implemented to improve the source discretization, obtaining a redistribution of the source near the center of the cylindrical duct. The algorithm redefines the coordinates of the source points () with a distance from the duct axis under 4 mm.
The coordinates of these new points were obtained through a transformation into polar coordinates. In doing so, three new distinct circles were defined, starting from the point of origin, to spatially redistribute the points uniformly. Figure 7 shows the source distribution before and after applying the algorithm just discussed. We decided to keep the peak of the heat source within the first 2.5 mm (see Figure 5) and interpolate the thermal source on the centroid based on the coordinates of the closest point of the original source instead of averaging it with the inverse of the distance according to the appropriate function.
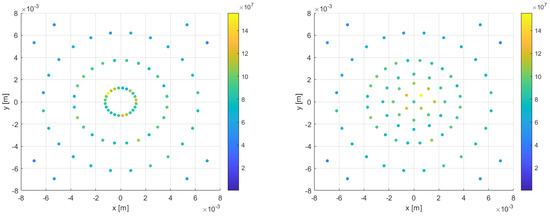
Figure 7.
Heat source with (right) and without the redistribution algorithm (left).
The thermal source obtained with our interpolation strategy is displayed in Figure 8, where we can see that the thermal source is well interpolated in both meshes. With the mm mesh, the heat source points are spaced along the entire x interval, while with the 2 mm mesh (on the left), these points may lead to a poor approximation near the axis and affect the overall thermal source input in the CFD code.
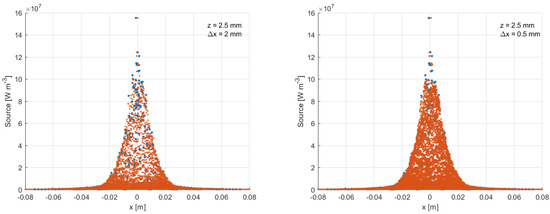
Figure 8.
Original heat source distribution (blue) and interpolated heat source distribution (red) based on a 2.0 mm (left) and 0.5 mm resolution mesh (right) at mm.
A polyhedral mesh was used for the CFD simulations in Fluent, with a cell size of 8 mm. In particular, after trying different configurations, it was decided to implement the heat map on the mesh through the two body of influence (BOI) mesh technique. These are regions within the volume of interest that can be defined by the user to modify the dimensions of the mesh in the area on which they are defined. They are, therefore, used for modeling effects such as obstacles, for example, or heat sources in our specific case. We chose to size them as two cylinders coaxial to the central duct of one meter long: the first with a 20 mm diameter and a 2 mm refinement, and the other with a 10 mm diameter and a 1 mm refinement.
UDFs are scripts in C++ or C that, taking advantage of Fluent’s native MACROS, allow you to solve scalar equations (User Define Scalar, UDS), define properties of materials and sources, execute commands during the solver wheels or implement new boundary conditions. For the simulations shown in this paper, two C scripts were developed. The first, property.c, is used to add the physical properties of lead as a function of the temperature, while the second, source.c, implements the heat source.
The source.c script approximates the heatmap provided by CERN in the fluid domain. The script contains two macros: DEFINE ON_DEMAND and DEFINE SOURCE. The DEFINE SOURCE is shown in Figure 9. The macros can handle various types of data and the native C data structures, which are useful for mesh manipulation. The first calculates the value of the volumetric heat source for each centroid of the mesh and stores this value in a User Defined Memory (UDM) structure. UDMs associate variables of interest to a group of mesh centroids, where the thermal source interpolation is based. The second macro adds the source term to the equation at runtime. The source.c code is parallelized using native Fluent structures and commands to allow code execution in parallel. Figure 10 shows the resulting thermal source implemented in Fluent using the UDF and the original Fluka heat source over the corresponding mesh points. Figure 10 shows that the interpolation can reproduce the central value. This is important to obtain a solution that does not change with internal refinement.
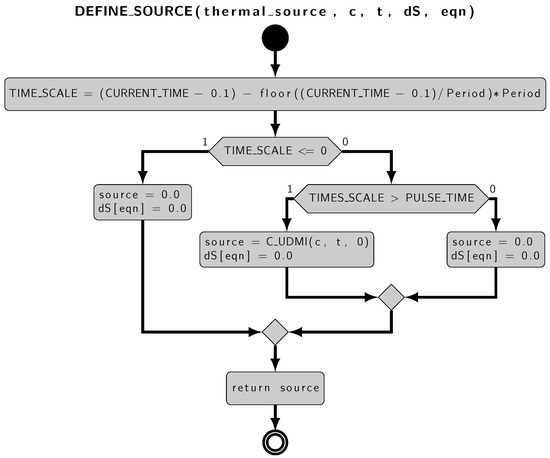
Figure 9.
Flow chart of the DEFINE SOURCE UDF.
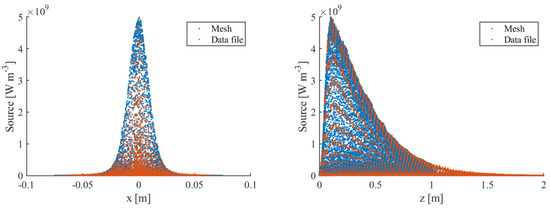
Figure 10.
Original and interpolated heat source on the z plane (left) and x plane (right).
4. Numerical Results
Before analyzing the thermal transient, the isothermal motion is simulated in steady conditions. This allows us to have a flow field solution to initialize the transient. Fluent unstructured mesh, defined above, results in nodes and elements. Furthermore, the mesh has an inflation layer (a layer of cells very close to the wall, whose dimensions grow further away from it) of mm. The initial configurations of the simulations, the same for CFX 2021-R1 and Fluent 2022-R1 software, are shown in Table 3.

Table 3.
Simulation setup.
The criteria adopted for valid solutions are standard for commercial CFD software. Convergence studies use automatic tools present in the commercial code based on the refinement of the gradient and the physical fields of interest and, therefore, on the distance to the wall. First, a loose grid with a boundary layer is considered. The solution is improved in the internal zone by applying refinements in the areas of interest and in the areas that present stiff gradients with the use of the selective refinement tools present in the software. Once a satisfactory solution has been obtained in the internal part, refinements based on the value are applied to obtain a reasonable value, typically lower than 1. Let us consider h to be the diameter of the mesh. The solution is assumed to be convergent when the difference between these solutions obtained by refining the mesh from h to is below the desired tolerance. Since the inlet and outlet turbulent boundary conditions are not physically known, some refinements are considered only in the cylindrical region. Only the stationary initial conditions from which the solution starts are verified for time-dependent solutions. The convergent solution at the refinement level k is obtained when the automatic refinement of the code , which leads to halving the characteristic cell measurement, returns the error in the norm less than . Convergence can be achieved when the heat source is well interpolated. Source term interpolation is discussed in the previous section.
In Fluent, the simulation converges with residuals less than for the velocity components and residuals of for the continuity and turbulent quantities. The mass imbalance between the inlet and outlet is less than , the pressure drops are 8539 Pa, and the maximum is equal to 1. In CFX, the residual for all quantities is lower than , while the pressure drops are 7509 Pa with the maximum equal to one. The plots and contours of the most relevant quantities of interest are shown in the next section, where the comparison between CFX and Fluent is presented.
4.1. Fluent Case En_T
Figure 11 shows the wall and the channel temperature profiles. The heat source is pulsed for a unit of time. The temperature reaches the maximum and decays when the particle beam vanishes. In the figure, we can see the maximum and average temperature in the three solution cases. The values relating to these quantities are also reported in Table 4.
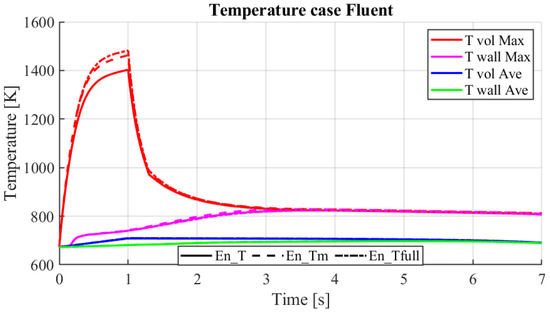
Figure 11.
Average and maximum temperature profiles on the wall and along the z-axis.

Table 4.
Table of the maximum and average temperature in the deposition period.
When looking at the maximum temperature in the fluid, the most evident differences are between the En_T case, with fixed physical properties, and the cases with physical properties changing with temperature, En_Tm and En_Tfull. The difference in the wall temperature in the three cases is negligible. However, the thermal delta for the TvolMax between the En_T and En_Tfull cases is ∼80 °C. In conclusion, the transient analysis with En_T is sound from the engineering point of view since the temperature profiles are very similar and numerically advantageous by only solving for the energy equation. The analysis shows that the maximum temperature is lower than the boiling point by 518 °C, and the maximum wall temperature is acceptable for the configuration and design proposed here.
4.2. CFX-Fluent Comparison
Now, we discuss the comparison between the CFX and Fluent solvers. We compare the solution of the isothermal motion and the thermal transient with constant properties with the energy equation alone (En_T). The comparison is made with two different meshes since Fluent shows convergence problems with the CFX structured mesh. The characteristics of the two meshes are reported in Table 5. The solver settings are the same for both codes as defined in Table 3.

Table 5.
Fluent and CFX mesh node/element features.
The comparison carried out for the isothermal case shows small differences in the variables of interest, mainly velocity, pressure and turbulent kinetic energy fields. These differences are visible in the contours and the profiles of Figure 12, Figure 13, Figure 14, Figure 15, Figure 16 and Figure 17, where a comparison of the velocity v, the turbulent kinetic energy k and the pressure between CFX (on top) and Fluent (on the bottom) are reported. From these emerge differences concentrated above all at the inlet of the pipe, in the area on top of the right transverse duct. The velocity field contours are in Figure 12 and the profiles in Figure 13. The differences are concentrated near the inlet due to its boundary configuration and different inlet velocity profiles. We recall that Fluent uses UDF functions for inlet velocity. In the developed flow region, the matching is quite good. The pressure contours are reported in Figure 14 and the profiles in Figure 15. As one can see, the matching is good. The turbulence kinetic energy contours are in Figure 16 and its profiles in Figure 17. As for the velocity field, the differences can be seen near the inlet due to different UDF functions for inlet velocity and turbulent kinetic energy.
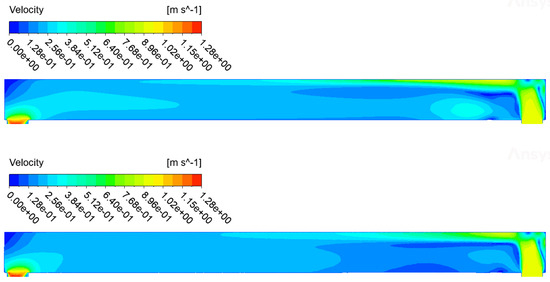
Figure 12.
Velocity contours for CFX (on top) and Fluent (on the bottom) simulations.
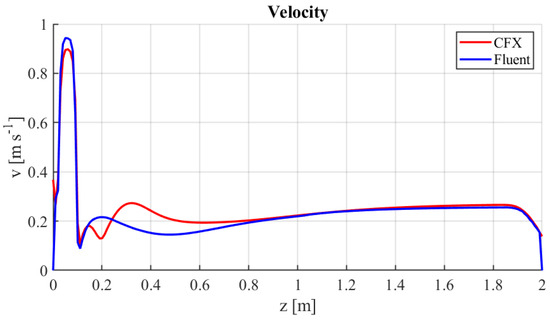
Figure 13.
Fluent and CFX velocity profiles along the z-axis.
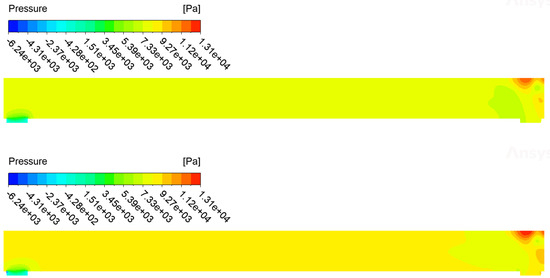
Figure 14.
Pressure contours for CFX (on top) and Fluent (on the bottom) simulations.
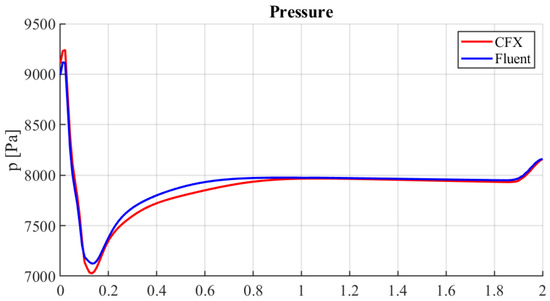
Figure 15.
Fluent and CFX pressure (p) along the z-axis.
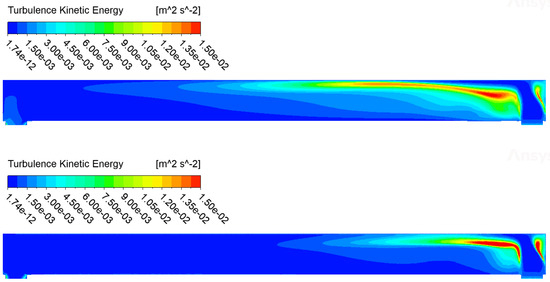
Figure 16.
Turbulent kinetic energy contours for CFX (on top) and Fluent (on the bottom) simulations.
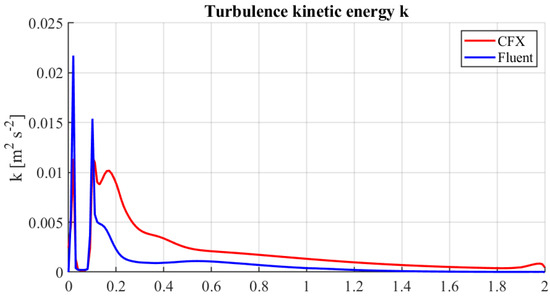
Figure 17.
Fluent and CFX turbulent kinetic energy k along the z-axis.
Figure 18 shows the differences in temperature behavior in CFX and Fluent, with imposed motion, constant physical properties, and only the energy equation solved. The two simulations show the results for two pulses. For both pulses, the temperature profile and peaks are almost identical. The first impulse, therefore, has no effect on the thermo-hydraulics of the subsequent one. This is also evidenced by the peak temperature at the outlet, which is reached before the second pulse. The temperature profiles obtained from the two simulations are similar, with the differences concerning the maximum temperatures on the wall and inside the channel. These peak differences between the two cases for TvolMax and TwallMax are 55 °C and 32 °C, respectively, due to the different flow field solutions. These differences can be considered acceptable since they are one order of magnitude lower than the nominal ones.
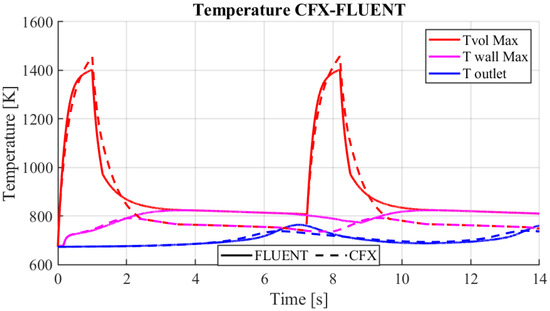
Figure 18.
Fluent and CFX temperature along the z-axis for two beam pulses.
In the case of our interest, the experience of using CFX and Fluent shows that both codes produce comparable results, leading to the same conclusions regarding the system design and performance predictions. This work reduces uncertainties related to the choice of CFD code, thereby increasing confidence in the results.
5. Conclusions
The simulation of a proposed experimental setup relying on liquid metals for heat removal raises the problem of CFD models for low Prandtl numbers. In fact, when dealing with liquid metals, the thermal diffusivity dominates the momentum diffusivity, leading to a Prandtl number in the range 0.001–0.03. With these premises, commercial codes, extensively tuned for water and air simulation, are not recommended because the simulation results may not be reliable, especially for the estimation of the turbulent heat exchange. For the specific setup analyzed in this paper, the circular geometry allows us to use empirical correlations obtained by experiments and DNS simulations performed with different liquid metals. By taking account of these correlations, we have simulated this experiment to advance toward an alternative facility conceptual design.
The thermo-hydraulic analysis confirms, in principle, the feasibility of using a liquid lead target for the BDF. The CFX and Fluent analyses, with a flow rate of kg/s, show a maximum peak temperature of 1482 K (Fluent, case En_Tfull)–1436 K (CFX) from the heat generated by the deposition of the proton beam. This is ∼530 degrees lower than the boiling point of lead, a sufficient safety margin that avoids any possibility of local vaporization and flashing phenomena. The maximum temperature value at the wall is 823 K (Fluent) and 793 K (CFX). The analysis also highlights the independence of the temperature profiles from the subsequent depositions of the successive pulses of the proton beam.
Further numerical work will investigate inlet geometry effects on the temperature field and thermal stress on the solid structures. Future experimental campaigns will improve the understanding of the beam–liquid lead interaction and provide data for CFD code performance evaluation and validation.
Author Contributions
Conceptualization, M.C., C.C., P.C.P., L.S.E., G.M., L.T. and R.F.X.; methodology, M.C., C.C., A.C., P.C.P., I.D.P., L.S.E., S.M., G.M., L.T. and R.F.X. validation, M.C., C.C., A.C., P.C.P., I.D.P., L.S.E., S.M., G.M., L.T. and R.F.X.; formal analysis, M.C., C.C., A.C., P.C.P., I.D.P., L.S.E., S.M., G.M., L.T. and R.F.X.; investigation, M.C., C.C., A.C., P.C.P., I.D.P., L.S.E., S.M., G.M., L.T. and R.F.X.; writing—original draft M.C., C.C., A.C., P.C.P., I.D.P., L.S.E., S.M., G.M., L.T. and R.F.X.; writing—review and M.C., C.C., A.C., P.C.P., I.D.P., L.S.E., S.M., G.M., L.T. and R.F.X. All authors have read and agreed to the published version of the manuscript.
Funding
This research received no external funding.
Data Availability Statement
The raw data supporting the conclusions of this article will be made available by the authors on request.
Conflicts of Interest
The authors declare no conflicts of interest.
References
- Bauer, G. Overview on spallation target design concepts and related materials issues. J. Nucl. Mater. 2010, 398, 19–27. [Google Scholar] [CrossRef]
- Riemer, B.; Wendel, M.; Felde, D. Cavitation damage experiments for mercury spallation targets at the LANSCE—WNR in 2008. J. Nucl. Mater. 2010, 398, 207–219. [Google Scholar] [CrossRef]
- Zhang, J. A review of steel corrosion by liquid lead and lead–bismuth. Corros. Sci. 2009, 51, 1207–1227. [Google Scholar] [CrossRef]
- Gong, X.; Short, M.P.; Auger, T.; Charalampopoulou, E.; Lambrinou, K. Environmental degradation of structural materials in liquid lead-and lead-bismuth eutectic-cooled reactors. Prog. Mater. Sci. 2022, 126, 100920. [Google Scholar] [CrossRef]
- Cheng, X.; Tak, N.I. Investigation on turbulent heat transfer to lead–bismuth eutectic flows in circular tubes for nuclear applications. Nucl. Eng. Des. 2006, 236, 385–393. [Google Scholar] [CrossRef]
- Calviani, M.; Goddard, B.; Jacobsson, R.; Lamont, M. (Eds.) SPS Beam Dump Facility: Comprehensive Design Study; CERN: Geneva, Switzerland, 2020. [Google Scholar] [CrossRef]
- Alekhin, S.; Altmannshofer, W.; Asaka, T.; Batell, B.; Bezrukov, F.; Bondarenko, K.; Boyarsky, A.; Choi, K.Y.; Corral, C.; Craig, N.; et al. A facility to Search for Hidden Particles at the CERN SPS: The SHiP physics case. Rep. Prog. Phys. 2016, 79, 124201. [Google Scholar] [CrossRef] [PubMed]
- Ahdida, C.; Akmete, A.; Albanese, R.; Alt, J.; Alexandrov, A.; Anokhina, A.; Aoki, S.; Arduini, G.; Atkin, E.; Azorskiy, N.; et al. The SHiP experiment at the proposed CERN SPS Beam Dump Facility. Eur. Phys. J. C 2022, 82, 486. [Google Scholar] [CrossRef]
- Bondarenko, K.; Boyarsky, A.; Jacobsson, R.; Mikulenko, O.; Ovchynnikov, M. Towards the optimal beam dump experiment to search for feebly interacting particles. Eur. Phys. J. C 2023, 83, 1126. [Google Scholar] [CrossRef]
- Lopez Sola, E.; Calviani, M.; Aberle, O.; Ahdida, C.; Avigni, P.; Battistin, M.; Bianchi, L.; Burger, S.; Busom Descarrega, J.; Canhoto Espadanal, J.; et al. Beam impact tests of a prototype target for the beam dump facility at CERN: Experimental setup and preliminary analysis of the online results. Phys. Rev. Accel. Beams 2019, 22, 123001. [Google Scholar] [CrossRef]
- FLUKA. Available online: https://fluka.cern/ (accessed on 12 June 2024).
- Ahdida, C.; Bozzato, D.; Calzolari, D.; Cerutti, F.; Charitonidis, N.; Cimmino, A.; Coronetti, A.; D’Alessandro, G.L.; Donadon Servelle, A.; Esposito, L.S.; et al. New Capabilities of the FLUKA Multi-Purpose Code. Front. Phys. 2022, 9, 788253. [Google Scholar] [CrossRef]
- ANSYS. CFX-Solver Theory Guide—Release LL; ANSYS: Houston, TX, USA, 2006. [Google Scholar]
- ANSYS. ANSYS Fluent—CFD Software; ANSYS: Houston, TX, USA, 2016. [Google Scholar]
- OECD; Nuclear Energy Agency. Handbook on Lead-Bismuth Eutectic Alloy and Lead Properties, Materials Compatibility, Thermalhydraulics and Technologies; Nuclear Energy Agency: Paris, France, 2015; p. 950. [Google Scholar] [CrossRef]
- Barbi, G.; Giovacchini, V.; Manservisi, S. A New Anisotropic Four-Parameter Turbulence Model for Low Prandtl Number Fluids. Fluids 2021, 7, 6. [Google Scholar] [CrossRef]
- Alemberti, A.; Smirnov, V.; Smith, C.F.; Takahashi, M. Overview of lead-cooled fast reactor activities. Prog. Nucl. Energy 2014, 77, 300–307. [Google Scholar] [CrossRef]
- Kawamura, H.; Ohsaka, K.; Abe, H.; Yamamoto, K. DNS of turbulent heat transfer in channel flow with low to medium-high Prandtl number fluid. Int. J. Heat Fluid Flow 1998, 19, 482–491. [Google Scholar] [CrossRef]
- Kirillov, P.; Ushakov, P. Heat transfer to liquid metals: Specific features, methods of investigation, and main relationships. Therm. Eng. 2001, 48, 50–59. [Google Scholar]
- Stromquist, W.K. Effect of Wetting on Heat Transfer Characteristics of Liquid Metals. Ph.D. Thesis, Tennessee University, Knoxville, TN, USA, 1953. [Google Scholar]
Disclaimer/Publisher’s Note: The statements, opinions and data contained in all publications are solely those of the individual author(s) and contributor(s) and not of MDPI and/or the editor(s). MDPI and/or the editor(s) disclaim responsibility for any injury to people or property resulting from any ideas, methods, instructions or products referred to in the content. |
© 2024 by the authors. Licensee MDPI, Basel, Switzerland. This article is an open access article distributed under the terms and conditions of the Creative Commons Attribution (CC BY) license (https://creativecommons.org/licenses/by/4.0/).