Article

Thermal Evaluation of the Initial Concept 3.X Vehicle at Mach 7 †

by
Abinayaa Dhanagopal
1,
Nathan S. Strasser
1,
Angelina Andrade
1,
Kevin R. Posladek
1,
Eugene N. A. Hoffman
2 and
Christopher S. Combs
1,*
1
Department of Mechanical Engineering, Margie and Bill Klesse College of Engineering and Integrated Design, The University of Texas at San Antonio, San Antonio, TX 78249, USA
2
Southwest Research Institute, San Antonio, TX 78238, USA
*
Author to whom correspondence should be addressed.
This paper is an extended version of our conference paper published in 2024 AIAA Scitech Forum held at Orlando, FL, USA, 8–12 January 2024.
Energies 2024, 17(12), 2916; https://doi.org/10.3390/en17122916
Submission received: 2 May 2024 / Revised: 10 June 2024 / Accepted: 11 June 2024 / Published: 13 June 2024

Abstract

:
High-speed global surface temperature distributions and heat flux measurements on the Initial Concept 3.X vehicle (IC3X) model were investigated at the UTSA Mach 7 wind tunnel, examining angles of attack of 0° and 5° at a freestream unit Reynolds number (Re) ~7 × 10⁶ m−1. A ruthenium-based, fast-responding, temperature-sensitive paint (fast-TSP) prepared in-house was applied to a 7.1% scale model of the vehicle. Static calibration was performed to convert the intensity measurements into surface temperature values. The surface temperatures and derived heat flux fields conformed to the predicted trends, which was corroborated by Schlieren flow visualization. Notably, the average surface temperature variation was identified to range from 6 to 34 K at a 0° angle of attack and from 11 to 44 K at a 5° angle of attack, with the most pronounced gradient detected at the stagnation point. Additional measurements provided a detailed thermal assessment of the model, including estimations of the stagnation point heat flux, the convective heat transfer coefficient, and the modified Stanton number. Statistical and time series analyses of the data collected revealed the absence of prevailing unsteady phenomena, suggesting that the tested design geometry is well suited for hypersonic flight applications. These experimental outcomes not only shed light on the aerothermodynamics experienced during high-speed flight but also underscore the effectiveness of fast-TSP in capturing both quantitative and qualitative thermal data.

1. Introduction

Hypersonic flight holds transformative potential for future travel as it could drastically reduce traveling times and prove indispensable for time-critical applications across emergency response, national defense, and civilian travel. A typical hypersonic vehicle is estimated to travel from Tokyo to LA in under 120 min [1]. The path to fully realizing an operational hypersonic vehicle, however, entails solving complex challenges such as the management of the extreme temperatures encountered. These vehicles are required to navigate demanding environments, and the aerothermodynamic conditions that they face are primarily influenced by their mission profiles, be it the upper atmosphere or outer space, and are characterized by the imposition of severe aerothermal loads on the mainframe. The precise measurement of the imposed loads and a thorough understanding of the complex aerothermodynamic environment is necessary for the design of robust thermal protection systems [2,3]. Since flight tests in the hypersonic speed regime can be expensive, challenging, and infrequent, innovative experimental capabilities in ground test facilities are highly sought after to obtain global information from vehicles. One such method is the use of temperature-sensitive paint (TSP), a popular luminescent coating technique used to obtain quantitative global temperature distributions and heat flux measurements on a model [4,5,6]. Unlike traditional measurement tools that offer discrete point-source data, TSP allows for the capture of aerothermodynamic information over the entire surface of a model, facilitating instantaneous, non-intrusive measurements. The use of TSP in hypersonic flows has been well documented [3,4]. It is cost-effective, efficient in analyzing surface temperatures over complex geometries, and compatible with various existing diagnostic techniques.
Furthermore, TSP has been instrumental in investigating intricate aerodynamic phenomena, including shock wave/boundary-layer interactions and boundary-layer transitions [7] through surface temperature changes on different models, such as cylinders [6,8], compression ramps [9], cones [10,11,12,13], and sharp fins [14]. The operating principle of TSP is sufficiently documented in the literature [15] and is, therefore, only briefly described here. Luminophore molecules embedded in an oxygen-impermeable layer are excited when illuminated with a suitable wavelength of light. Their transition from the excited state to the ground state involves competing mechanisms—luminescence, which is radiative, and quenching, a non-radiative process. Like most PSP formulations, the emission spectra for TSP luminophores lie in the 600–650 nm range. The photophysical process controlling the emission by which molecules lose their quantum efficiency with increasing temperatures forms the underlying mechanism by which TSP operates. This loss in efficiency is attributed to the increased collisions between molecules that occur at higher temperatures, known as thermal quenching [16]. At elevated temperatures, an increase in molecular collisions leads to enhanced quenching [17,18], thereby decreasing the luminescent intensity. In contrast, luminescence via fluorescence dominates at lower temperatures due to fewer collisions. These changes in luminescence, detectable through photodetectors, can be correlated with surface temperature variations upon calibration.
Despite its numerous advantages, TSP suffers from similar shortcomings to PSP, where variables such as non-uniform coating, illumination inconsistencies, etc., contribute significantly to the noise observed in optical measurements. According to Kose [19], TSP is also more susceptible to the photobleaching effect, where the intense illumination of painted samples can result in severe photodegradation and, as a result, complicate the quantitative measurements obtained. Discrepancies in measurements are prominent when the TSP layer thickness increases relative to the adjacent layers of the model [20]. Advances in paint formulation will help to address such shortcomings and increase the utility of the technique in obtaining quantitative measurements in ground test facilities.
Various TSP formulations, including those with single or dual emission bands, have been employed in wind tunnel tests to measure the temperature through the luminescent emission intensity and decay time [15,17]. The specific fast-TSP formulation used in this study enables the acquisition of time-resolved temperature and heat flux data in short-duration tests, as demonstrated by Martinez Schramm et al. [11,21], due to the relatively short (<1 μs) luminescent lifetime of the luminophores. In the present study, the luminescent intensity of Ru(phen) (Ruthenium tris(1,10-phenanthroline) dichloride) incorporated into a polyacrylic acid binder is used for the assessment of the heat flux evolution and temperature distribution along the Initial Concept 3.X vehicle (IC3X) encountering a hypersonic flow for overall test durations of 300–500 ms. This is made possible due to the luminophore’s short (<1 μs) luminescent lifetime.
The model geometry chosen (IC3X) is a generic hypersonic vehicle design representing an air-launched vehicle capable of completing a standard three-phase mission trajectory [22]. This geometry is of particular interest to the hypersonic community and has been the focus of multiple studies in the literature in recent years for hypersonic aeroelasticity [18,22,23] and aerothermodynamics [24,25,26]. This paper presents a comprehensive thermal evaluation of the model carried out in the current experimental campaign [27]. Global heat flux and heat transfer coefficient maps are obtained, in addition to a time series analysis of the temperature distribution along the model. Estimates for the Stanton number show excellent agreement with those obtained for axisymmetric models at hypersonic speeds in the literature. The results from the test campaign will provide valuable validation data for modelers and vehicle designers in the hypersonic community, enhancing their understanding and aiding in the development of hypersonic vehicles. The current study is also among the first to obtain fast-TSP measurements on a finned axisymmetric geometry at Mach 7.2.

2. Methodology

2.1. Wind Tunnel

All experiments presented in this study were conducted in the UTSA Mach 7.2 Ludwieg tube, pictured in Figure 1. The facility has an optically accessible test section (8” × 8”) allowing for the application of a suite of diagnostic techniques, like high-speed Schlieren, unsteady pressure/temperature-sensitive paint, molecular tagging velocimetry, and particle image velocimetry. Multiple steady-state passes per test, each on the order of 50 ms–100 ms, with total test times of approximately 500 ms, are possible in the facility. Stagnation temperatures of up to 700 K and pressures of up to 14 MPa (2000 psi) can be achieved in the facility. The freestream velocity was found to be 885 m/s [21]. A detailed description of this facility’s design, construction, and capabilities is presented by Bashor et al. [28] and Hoffman et al. [29,30,31]. A summary of the test conditions for the experimental campaign is provided in Table 1. All runs included in the experimental campaign involved heated stagnation conditions to visualize the thermal effects experienced by the test geometry. The range of temperatures experienced in the facility was within the operating range for the chosen fast-TSP and hence no damage or degradation to the paint layer on the model was caused.

2.2. Model Geometry

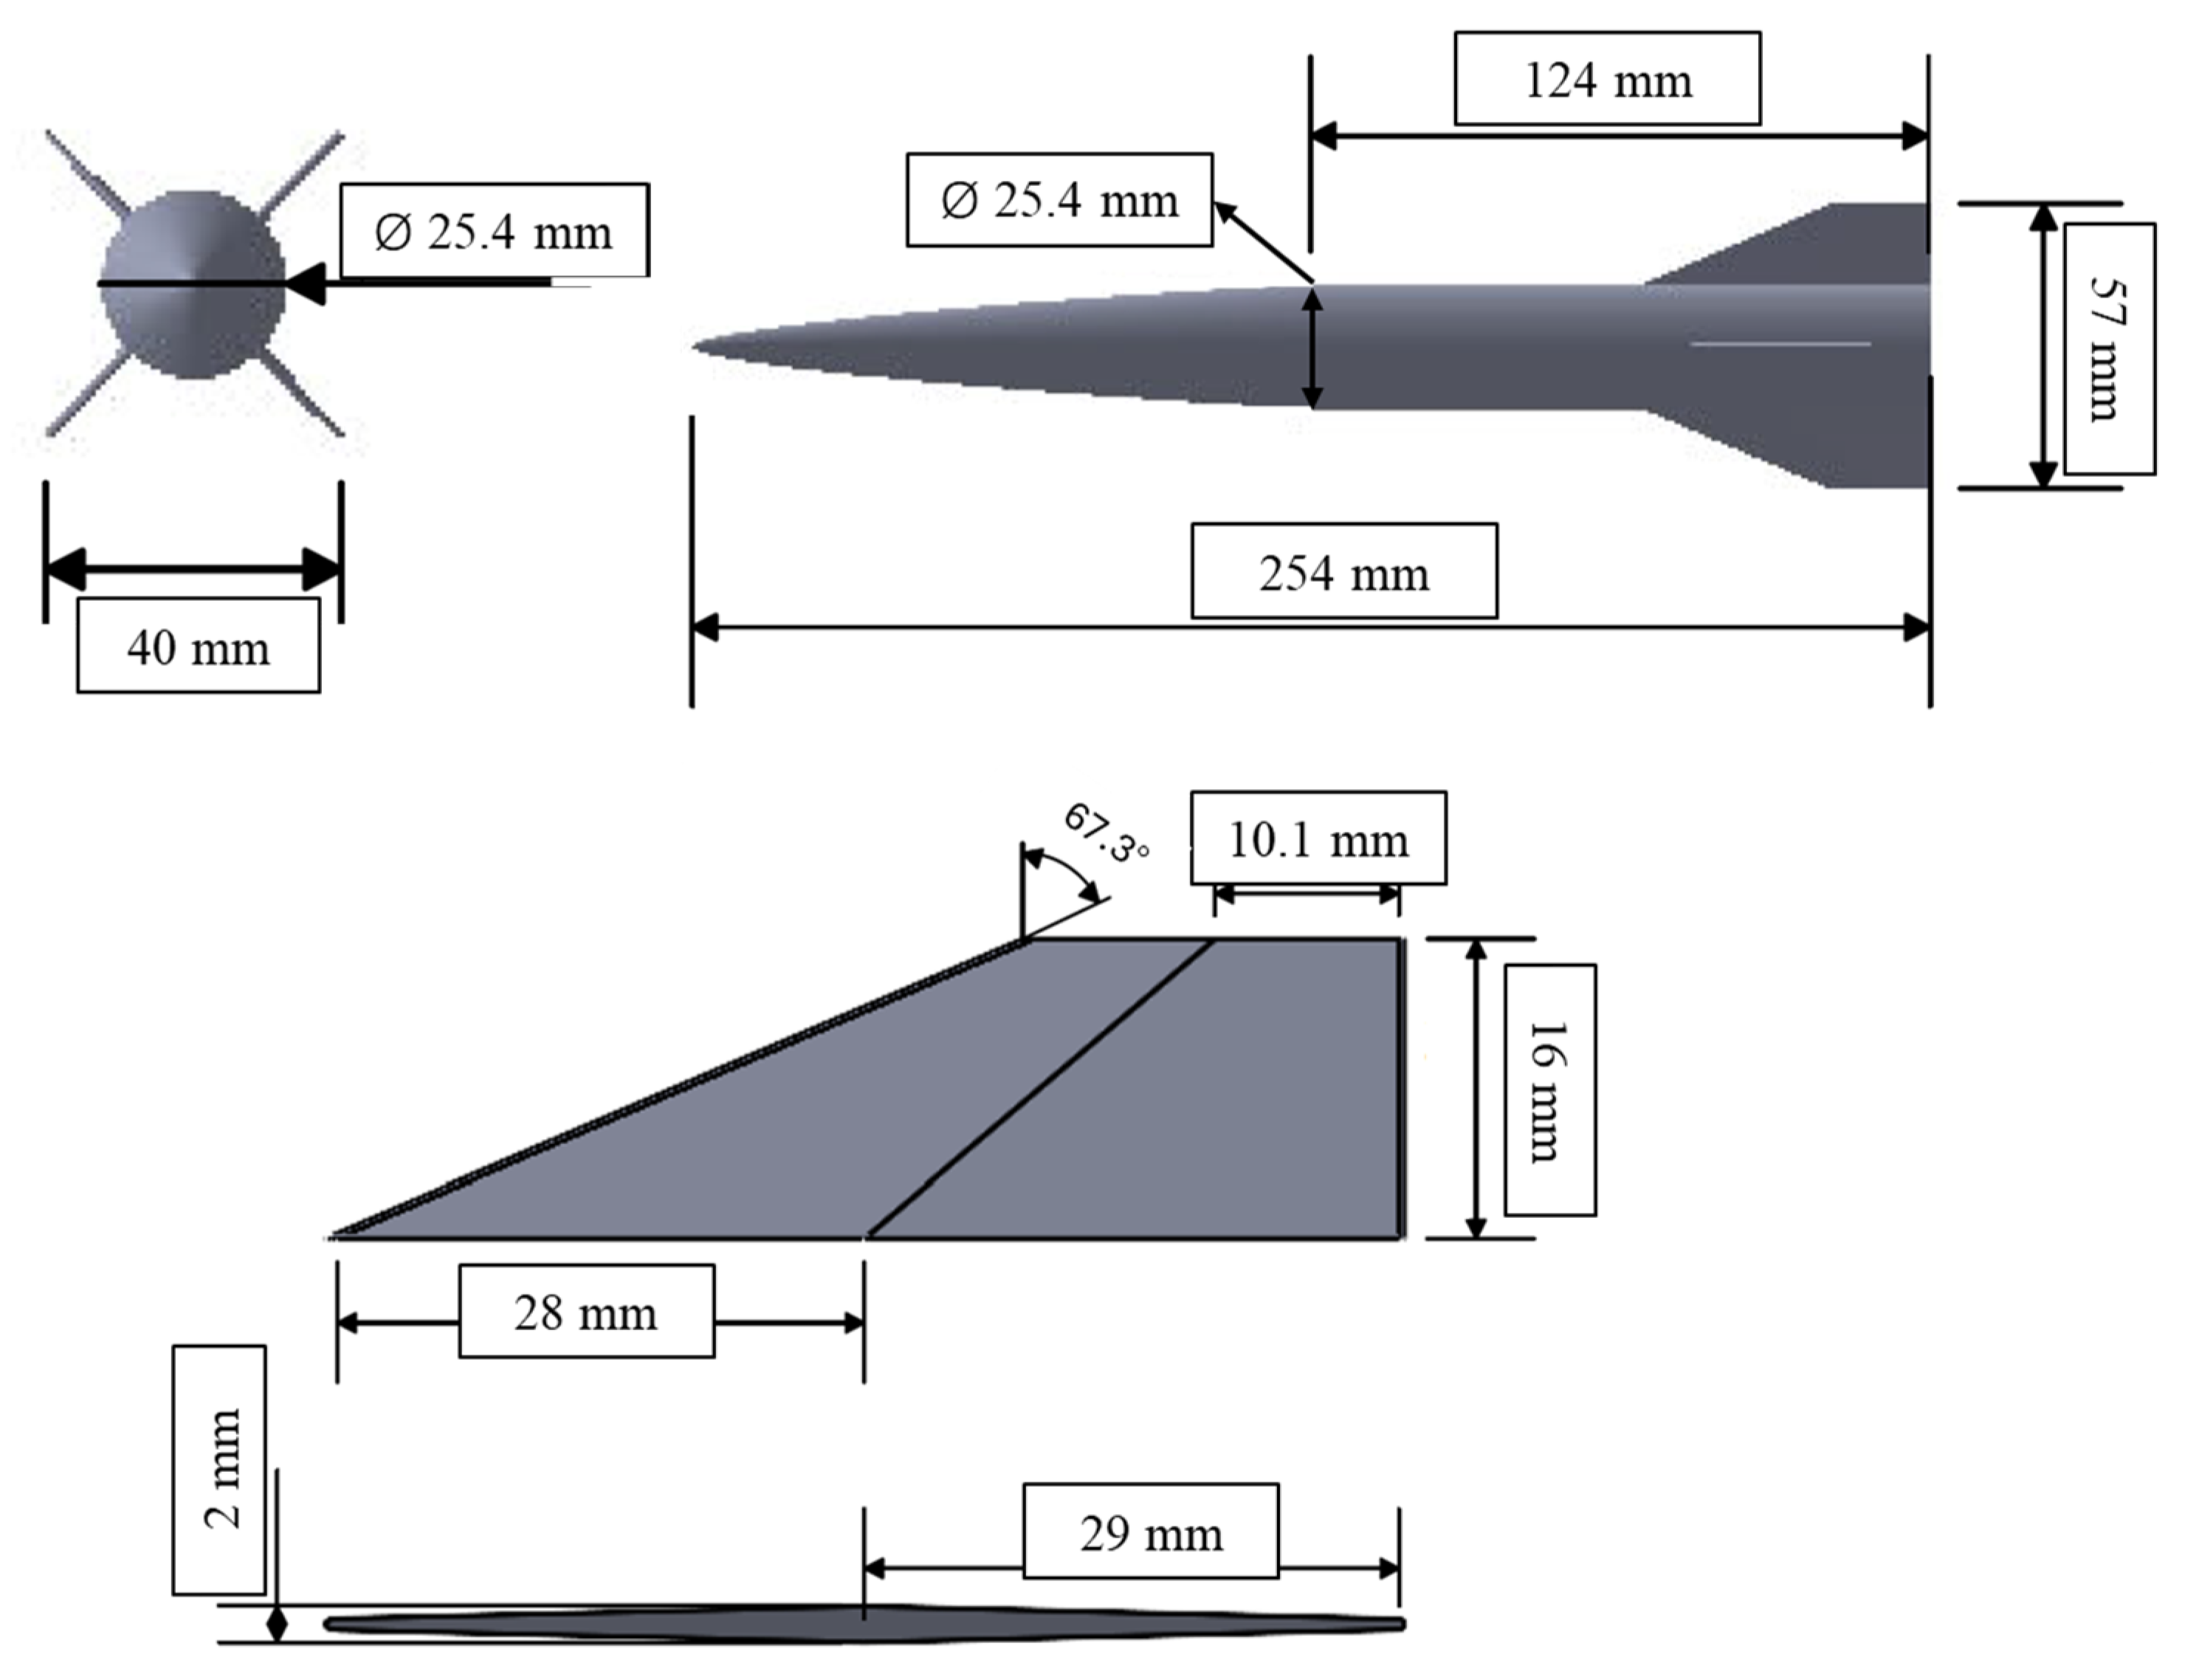
The test article used in this study is a simplified, reduced-scale axisymmetric model of the Initial Concept 3.X vehicle (IC3X), which was established by Witeoff and Neergaard [23] using the PASS code suite. This geometry is chosen as it is an operationally relevant yet canonical geometry that is of interest to the hypersonic community. The model span and its properties are shown in Figure 2 and Table 2. The shape of the ogive follows a spherically blunted tangent design, where the tip of the nose is a 10 mm diameter hemisphere that tangentially transitions to a power-law forebody. The fins shown in Figure 2 are diamond airfoils. The root chord is 86.4 cm and tapers down to a 30.4 cm chord at the tip. The leading edge is swept back 67.3° and the trailing edge is unswept. The aft body is a circular cylinder. The model is fabricated in-house using an ELEGOO 8 K water-washable photopolymer resin and is thoroughly post-processed to reduce surface non-linearities. The model fabricated is a 7% scaled down version of the original model as obtained from Witeoff and Neergard [32].

2.3. Fast-TSP Preparation and Application

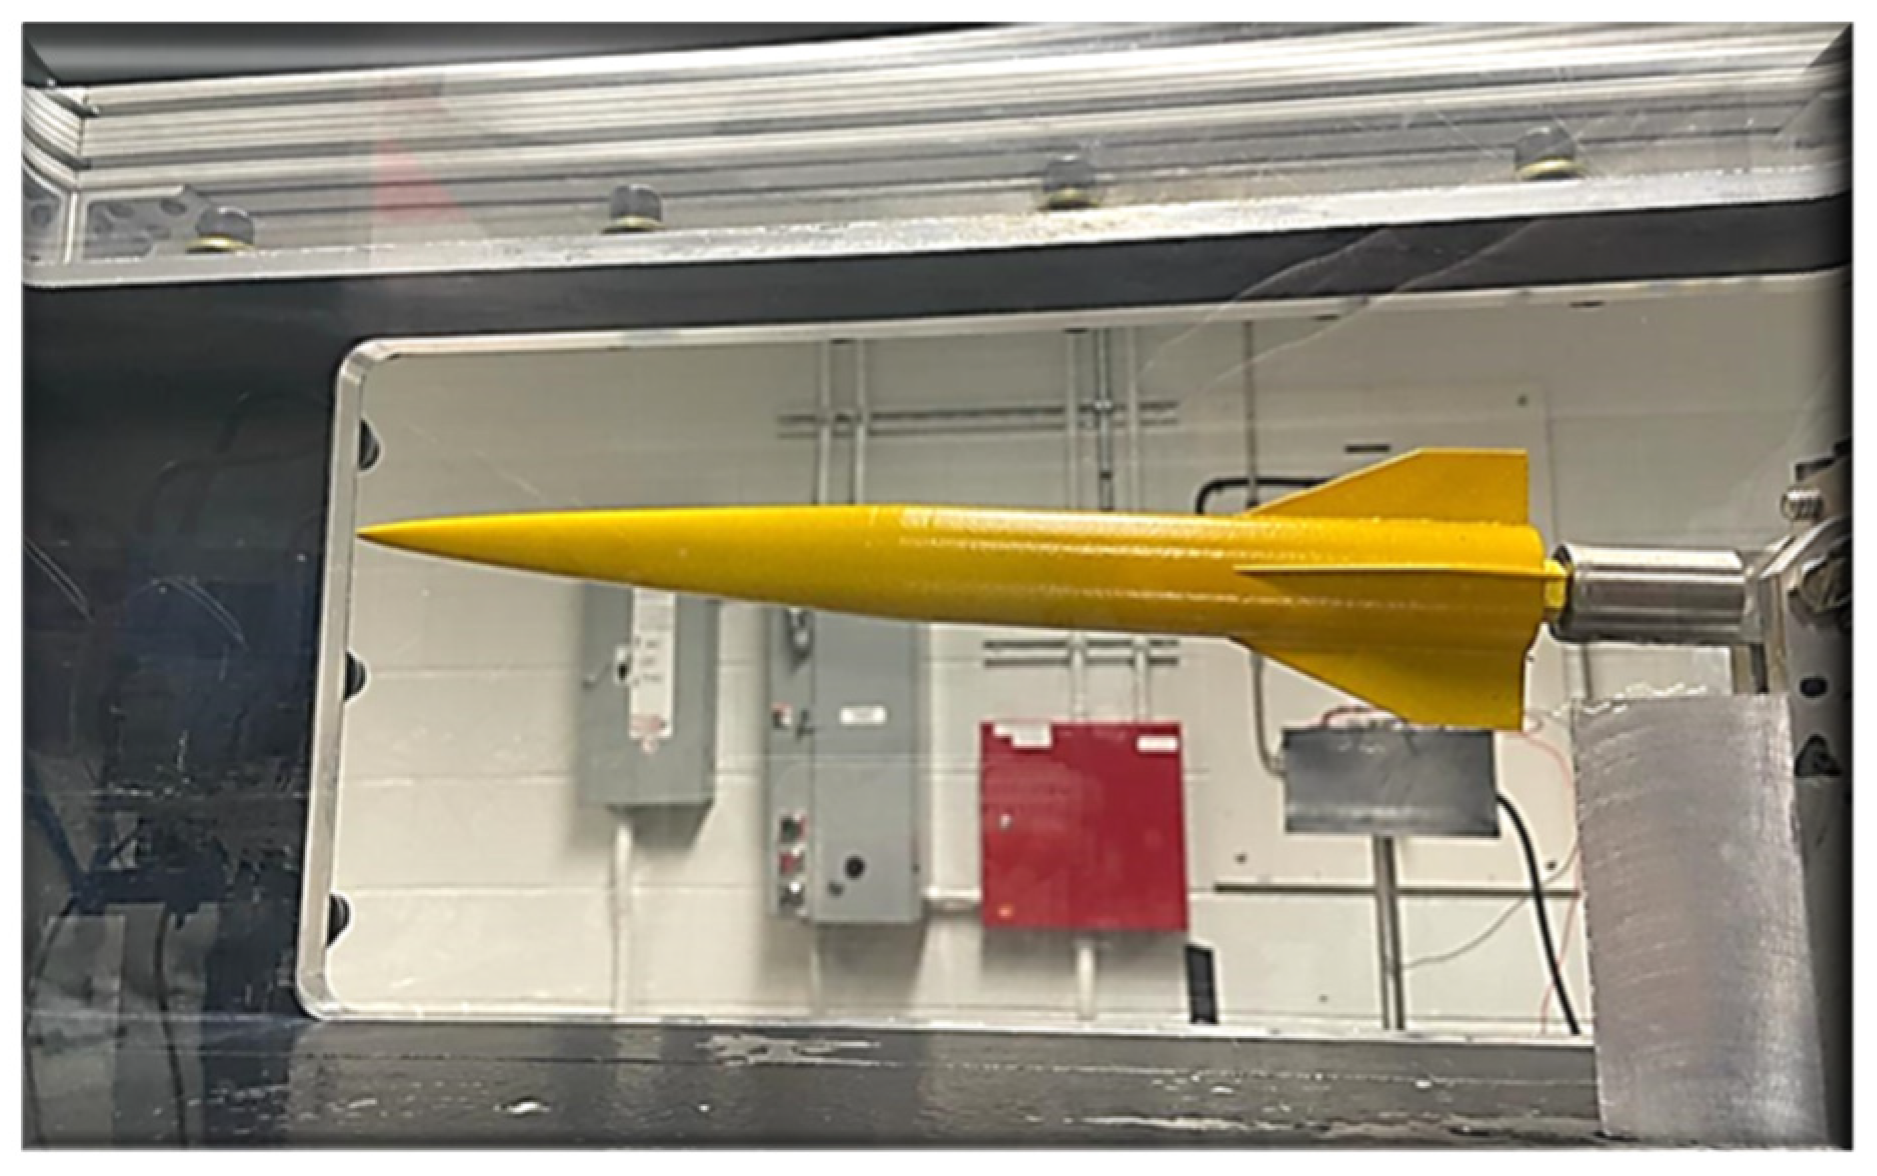
A single-luminophore, porous, ruthenium-based paint obtained from the formulation detailed by Nakakita et al. [33] and used in several hypersonic facilities in organizations like NASA [4], DLR [11,34], and JAXA [35] is used as the fast-TSP throughout this experimental campaign. Table 3 details the composition of the TSP used in the study. Dichlorotris (1,10-phenanthroline) ruthenium (II) hydrate, commonly referred to as Ru(phen), prepared in small batches with a concentration of 102 mmol, is the luminophore dye used in the experiment. A volume of roughly 20 mL of fast-TSP sprayed onto the model is required for a single test run. A base layer of commercially available white paint is applied before painting the models with the TSP to provide insulation between the model material and the TSP layer and reflection. This primer layer facilitates the amplification of the TSP signal intensity and allows the model to be approximated as a semi-infinite body for heat flux calculations. A high-pressure, low-volume (HPLV) spray gun is used to deposit the primer to ensure even coats, and, once dry, the same gun is used for fast-TSP application. Acetone and ethanol are used to clean the spray gun between layers and the gun is operated at a constant line pressure of 140 kPa (20 psi), held perpendicularly to the model’s surface. Fifteen passes per model is regarded as the baseline to ensure the consistency and speed of the response. The temporal response of TSP has been found to scale proportionally to the square of the paint thickness, according to the TSP characterization work performed [36]. To achieve the fastest response time possible, thin layers of TSP coats are desirable. The model is left to dry in the dark when it has an even light-yellow color, as seen in Figure 3. Although, currently, no direct measurements of the layer thickness or surface roughness have been performed, these estimates will be obtained and the Schlieren visualization of both painted and unpainted models will be carried out in future experiments to understand the influence of the paint layer on the model and to improve the paint response. The paint layer thickness will depend on the volume of paint used to achieve smooth coats on a model. However, the surface of the painted TSP model in this case is expected to be comparable to the model surface coated with PSP. Based on estimates obtained during PSP calibration [37], the thickness of the paint layer on the model is expected to vary between 8 and 50 µm, which is on par with the surface intrusion that occurs when inserting a Kulite or other probes to obtain in situ measurements on the model. According to the material trade and sizing optimization studies conducted by Witeoff and Neergaard [32], the IC3X monocoque composed of titanium alloy is expected to have a skin thickness in the order of 1.3 to 3.1 mm. On top of this, a thermal protective system (TPS) layer of varying thickness will be applied, which will contribute to the surface roughness. In comparison to this, the models coated with temperature-sensitive paint possess a lower magnitude of surface roughness. Schairer et al. [38] have shown that, for tests at high Reynolds numbers, the true effect of the Reynolds number may be obscured due to the pressure-sensitive paint’s intrusiveness. However, this can be avoided by ensuring that both the painted and unpainted surfaces of the model are hydraulically smooth.

2.4. Experimental Setup and Data Processing

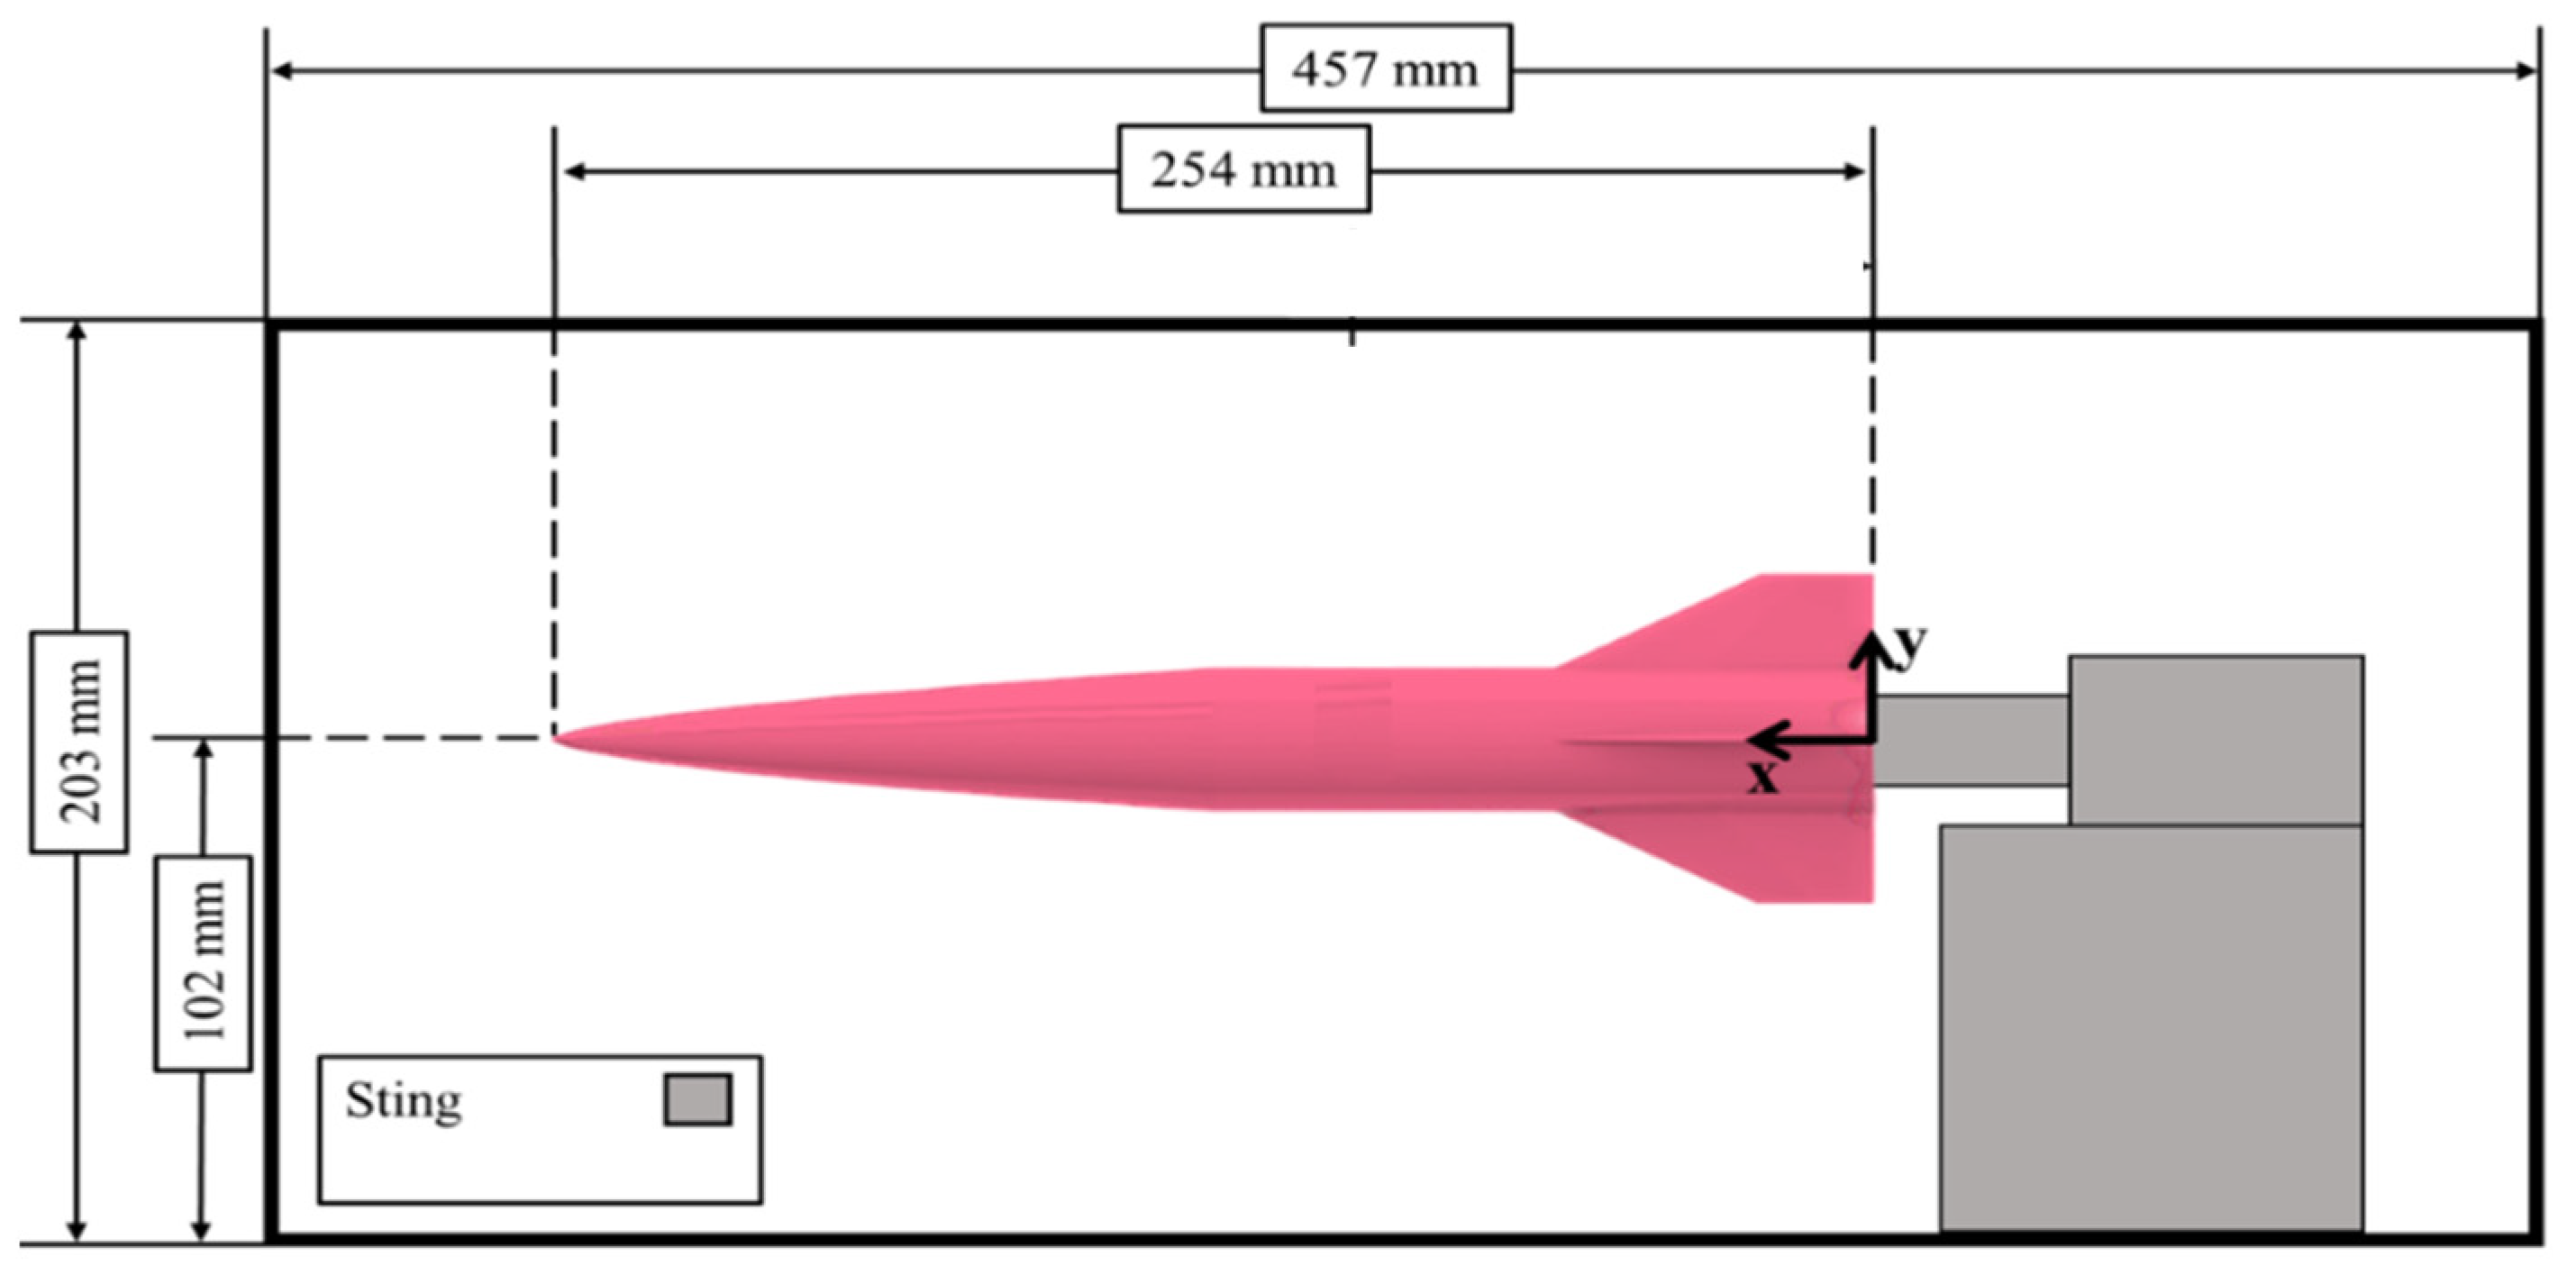
The IC3X model coated with fast-TSP was installed in the wind tunnel test section, as shown in Figure 4. The model was mounted on a variable-angle strut that allowed for tests to be conducted at different angles of attack. Luminus CBM-120 LED modules (Woburn, MA, USA) were used to illuminate the model, and the LEDs were synchronized with the camera and actuated via an in-house triggering system developed by LaLonde et al. [30] to enable accurate data acquisition beginning from flow commencement in the test section. A complementary metal–oxide–semiconductor (CMOS) camera from Photron (Fastcam SA-Z high-speed camera, Tokyo, Japan) was installed perpendicularly to the model and the field of view for the test, as shown in Figure 5. Optical filters to eliminate reflections and ambient light were placed ahead of the camera. A long-pass filter with a cut-on wavelength of 610 nm and an AR-coated filter obtained from Innovative Scientific Solutions Inc. (ISSI, Dayton, OH, USA) were used. The luminescent intensity obtained from TSP is a function of the temperature but can also be influenced by factors such as the paint layer thickness, illumination source, concentration of luminophores, etc. [32]. The data obtained were processed to mitigate noise, similarly to the PSP experimental campaign described in Dhanagopal et al. [31].

3. Static Calibration

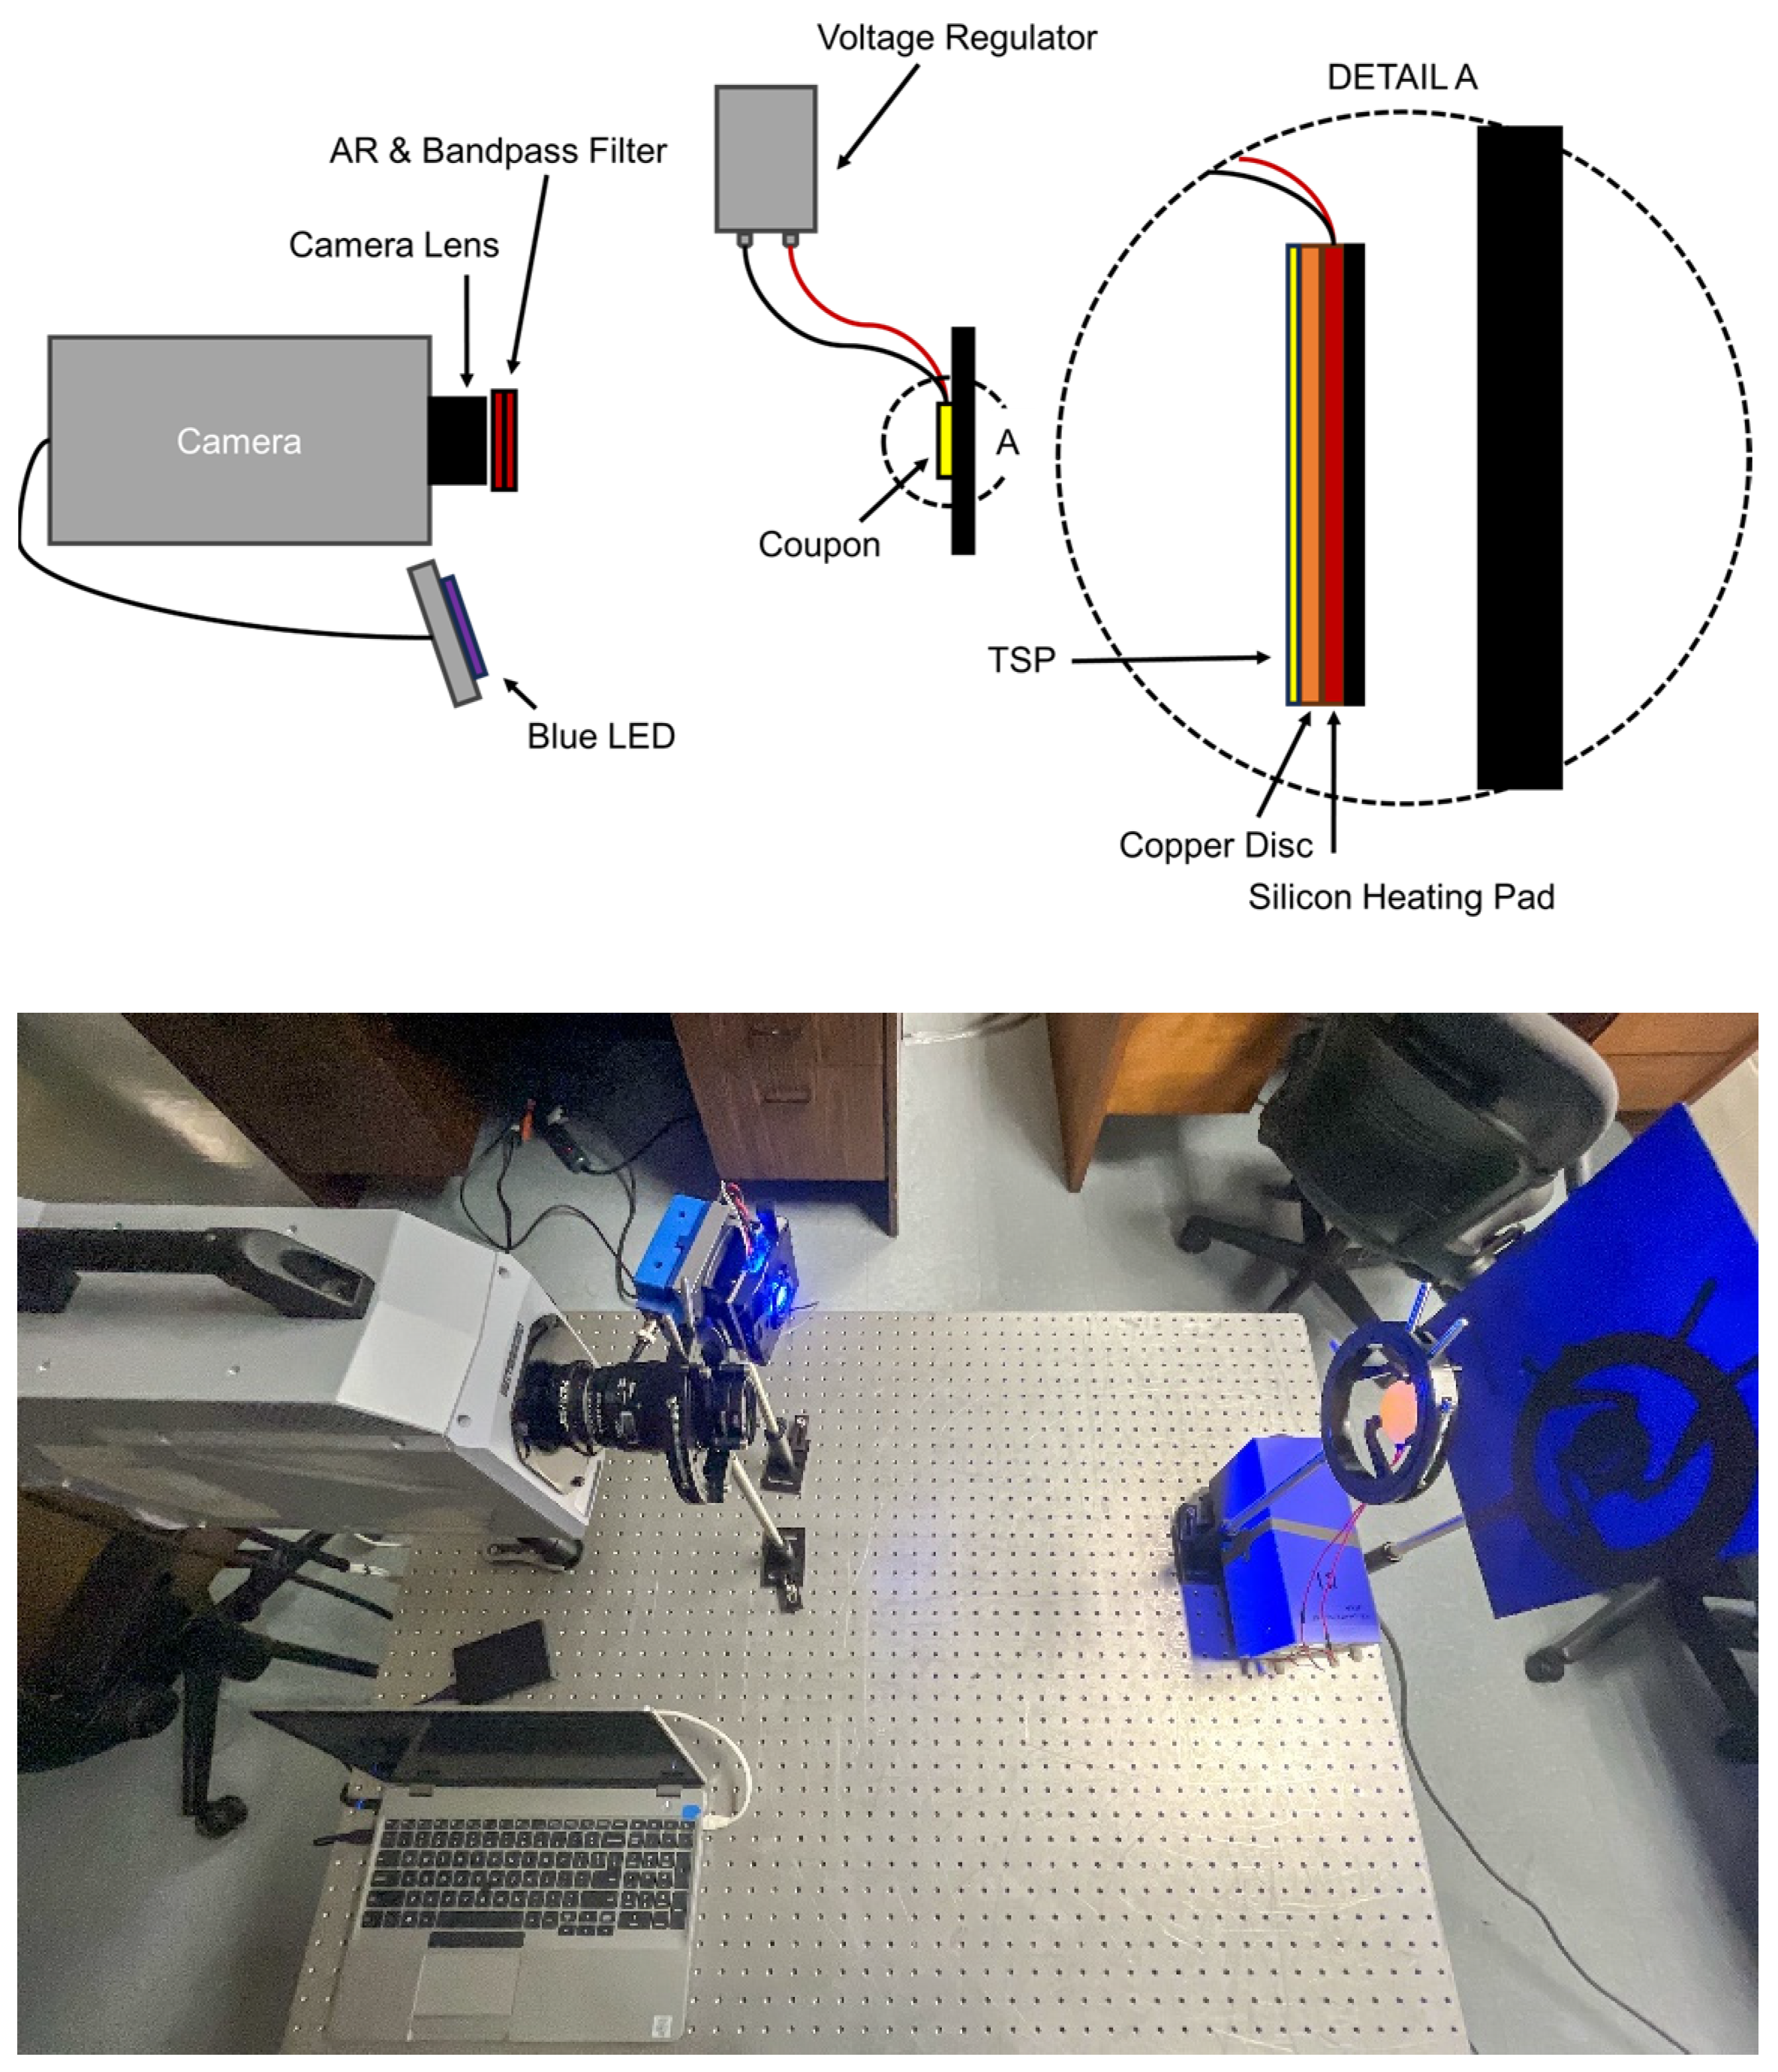
The static calibration procedure followed is established in this section. As described in the previous section, an aluminum coupon was prepared by applying a uniform basecoat of white insulating primer, followed by the TSP layer, using an HPLV spray gun. The coupon was heated through silicon heating pads, which allowed for controlled temperature changes through a voltage regulator. A standard K-type thermocouple was used to obtain the temperature data on the coupon, and they were recorded throughout the test via LabVIEW. The coupon was imaged using the Photron SA-Z camera. Care was taken to avoid saturation, and optical filters were installed ahead of the camera. The calibration experiment was set up as shown in Figure 6.
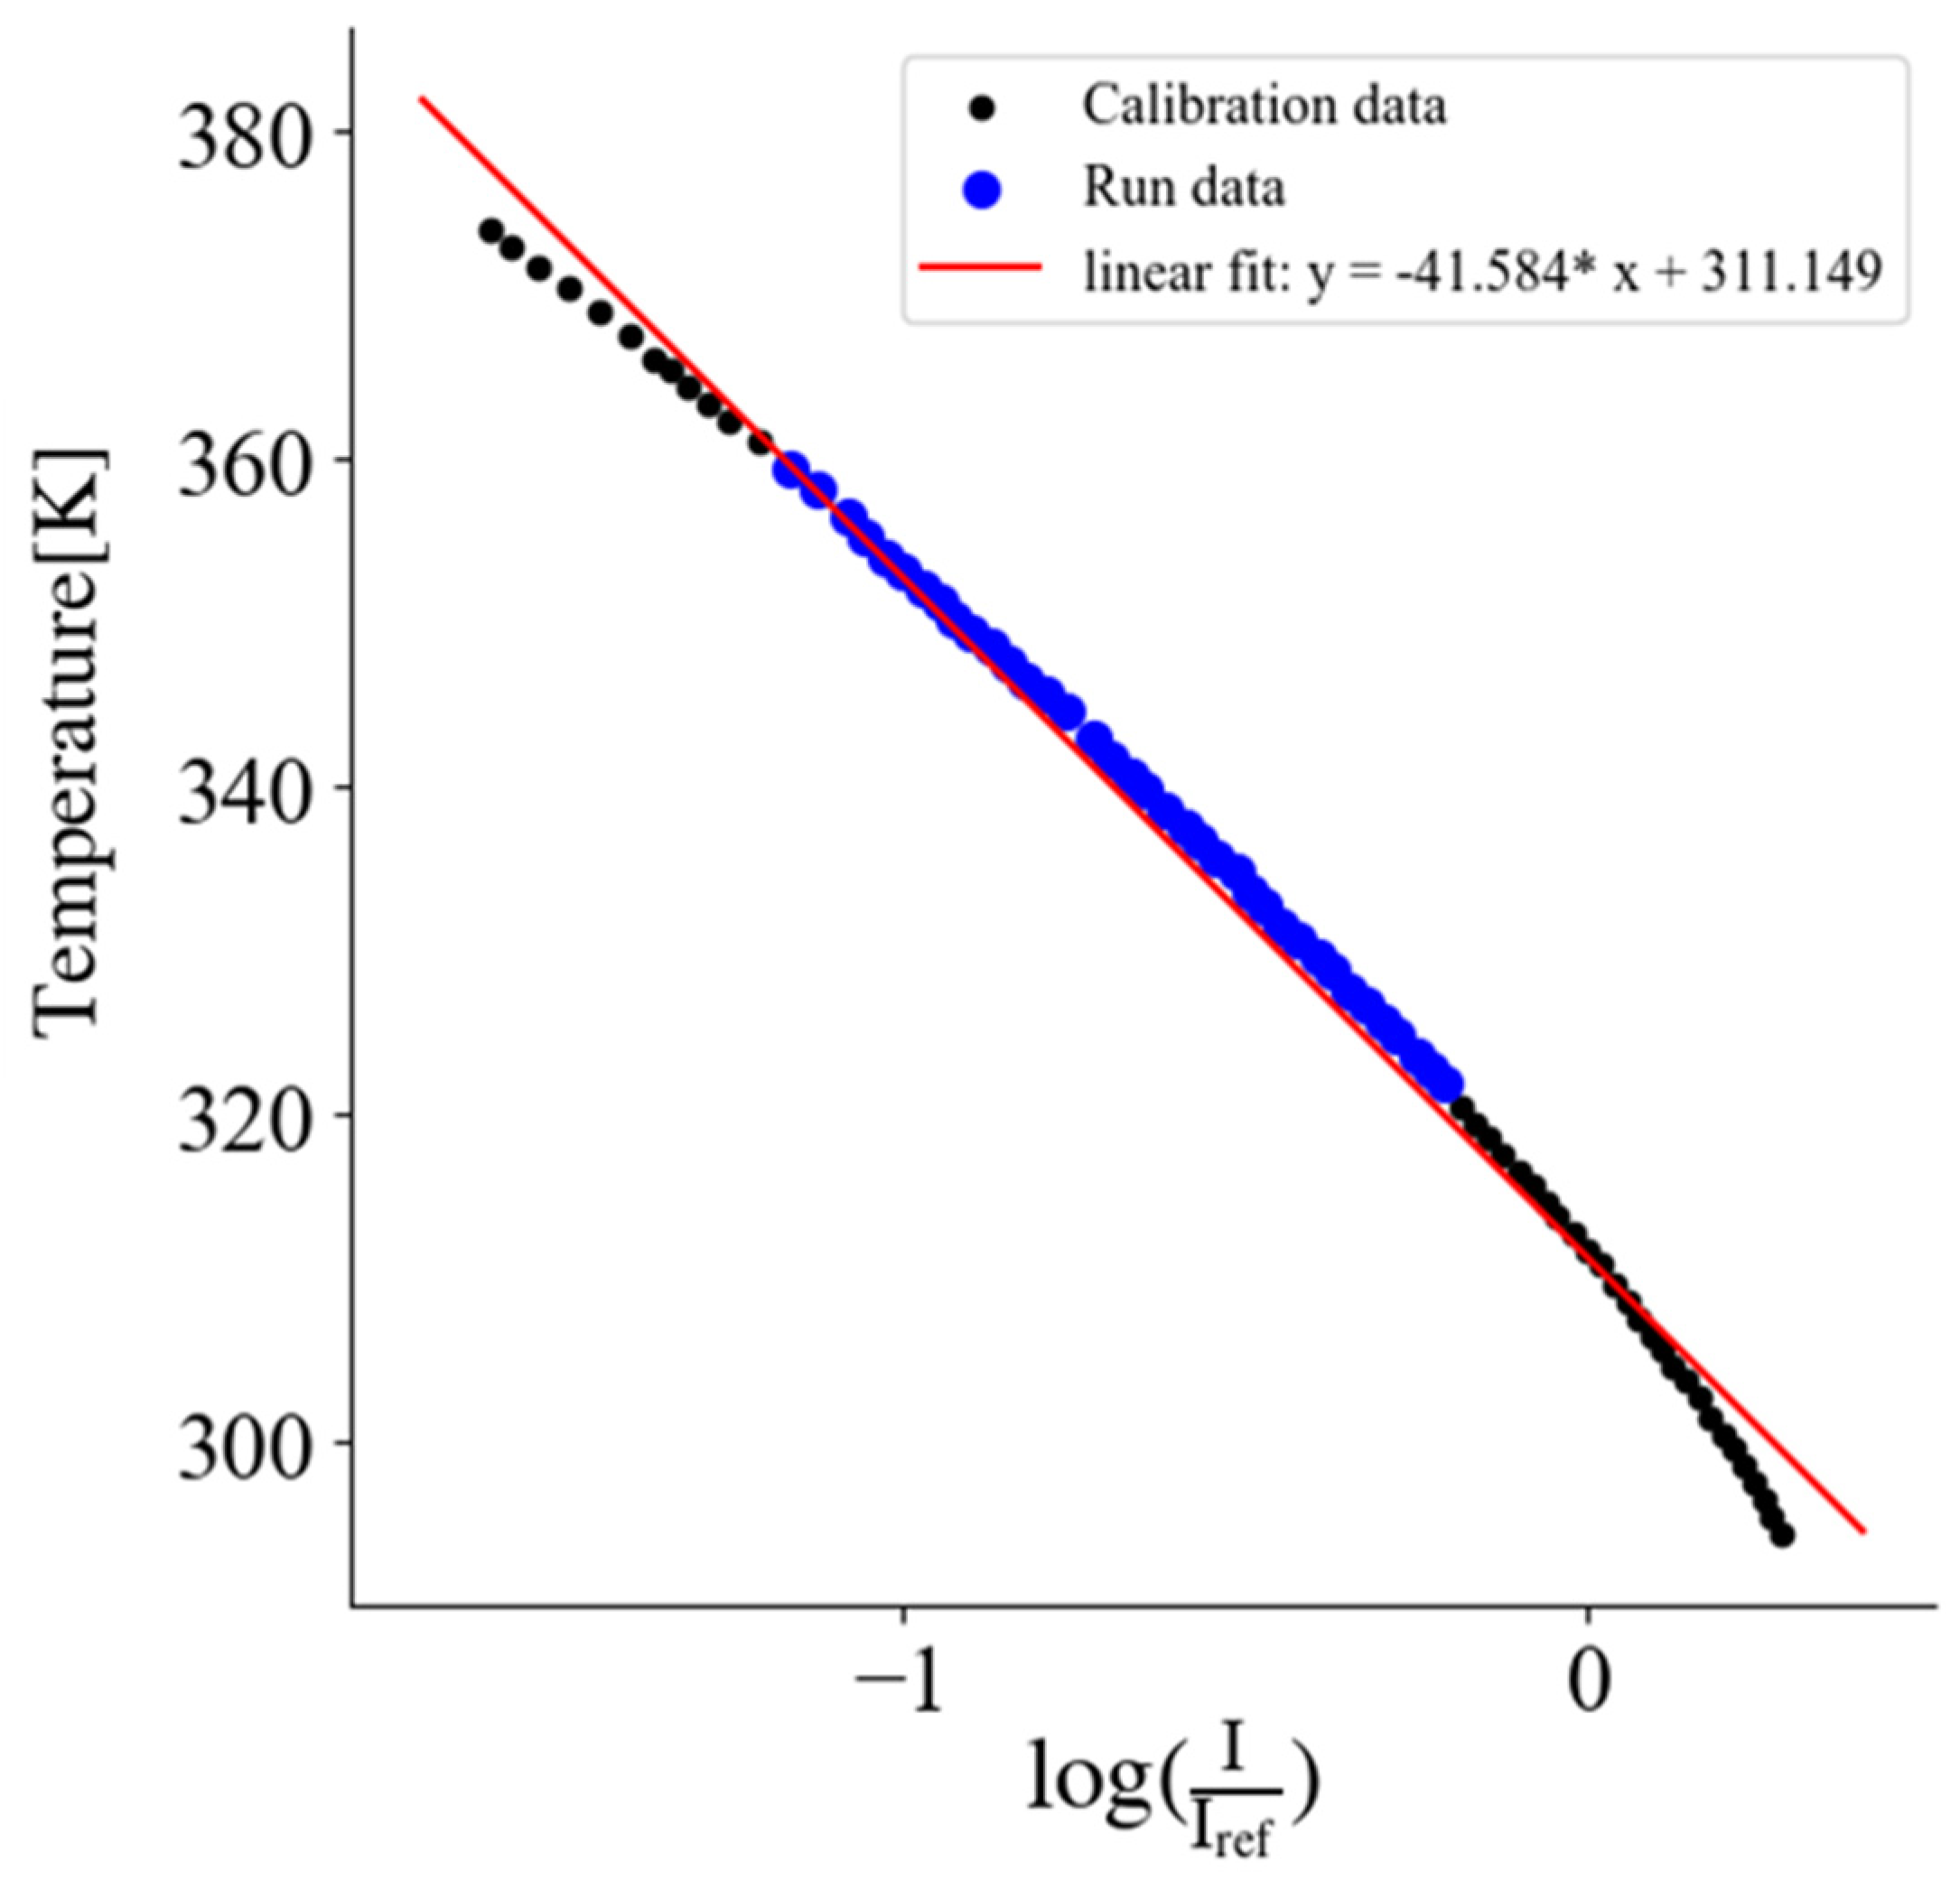
Between each step change in temperature, intensity measurements were collected after ensuring that the temperature on the coupon reached a steady state. An initial reference image of TSP fluorescence was taken at room temperature. All subsequent intensity measurements were normalized to this reference. Following background subtraction to remove noise, the mean intensity value was plotted against the measured surface temperatures, demonstrating an exponential intensity decrease with increasing temperature. Based on this preliminary initial calibration, it was confirmed that the paint followed an exponential response for the chosen temperature ranges. The well-established relation correlating the luminescent intensity with temperature found in the literature [17,40] is provided here.
I I r e f = k = 0 n { a k T T r e f k }
Following this, calibration coefficients obtained using a fit in accordance with Equation (1) were used to convert the pixel intensities into temperatures, which are provided in Figure 7. The data points corresponding to the surface temperatures estimated on the model during the test are identified on the curve as run data points. A preliminary estimate of the paint’s sensitivity response was calculated using the formula in Equation (2) [41], which showed an average intensity degradation of a 2.5% change per K; similar values are reported in the literature [11].
S T = d I d T 1 I 100 % K

4. Surface Temperature Measurements

An investigation of the global surface temperature distribution on the IC3X model was conducted at 0° and 5° angles of attack (AoA) using images acquired at 20 kHz. The temperature values presented in this study had the reference temperature readings obtained before the run subtracted from the total temperature values calculated, resulting in temperature fluctuations (ΔT). This was implemented to emphasize the thermal effects associated with the compressible flow phenomena around the model. The respective stagnation temperature values (T0) were normalized the temperature changes in charts comparing multiple runs. The models were initially at room temperature prior to the test. The AoA on the model was set using a digital level gauge prior to the run. The uncertainty in the measured AoA was found to be less than one degree across multiple tests performed in the facility.

4.1. Instantaneous Temperature Fields

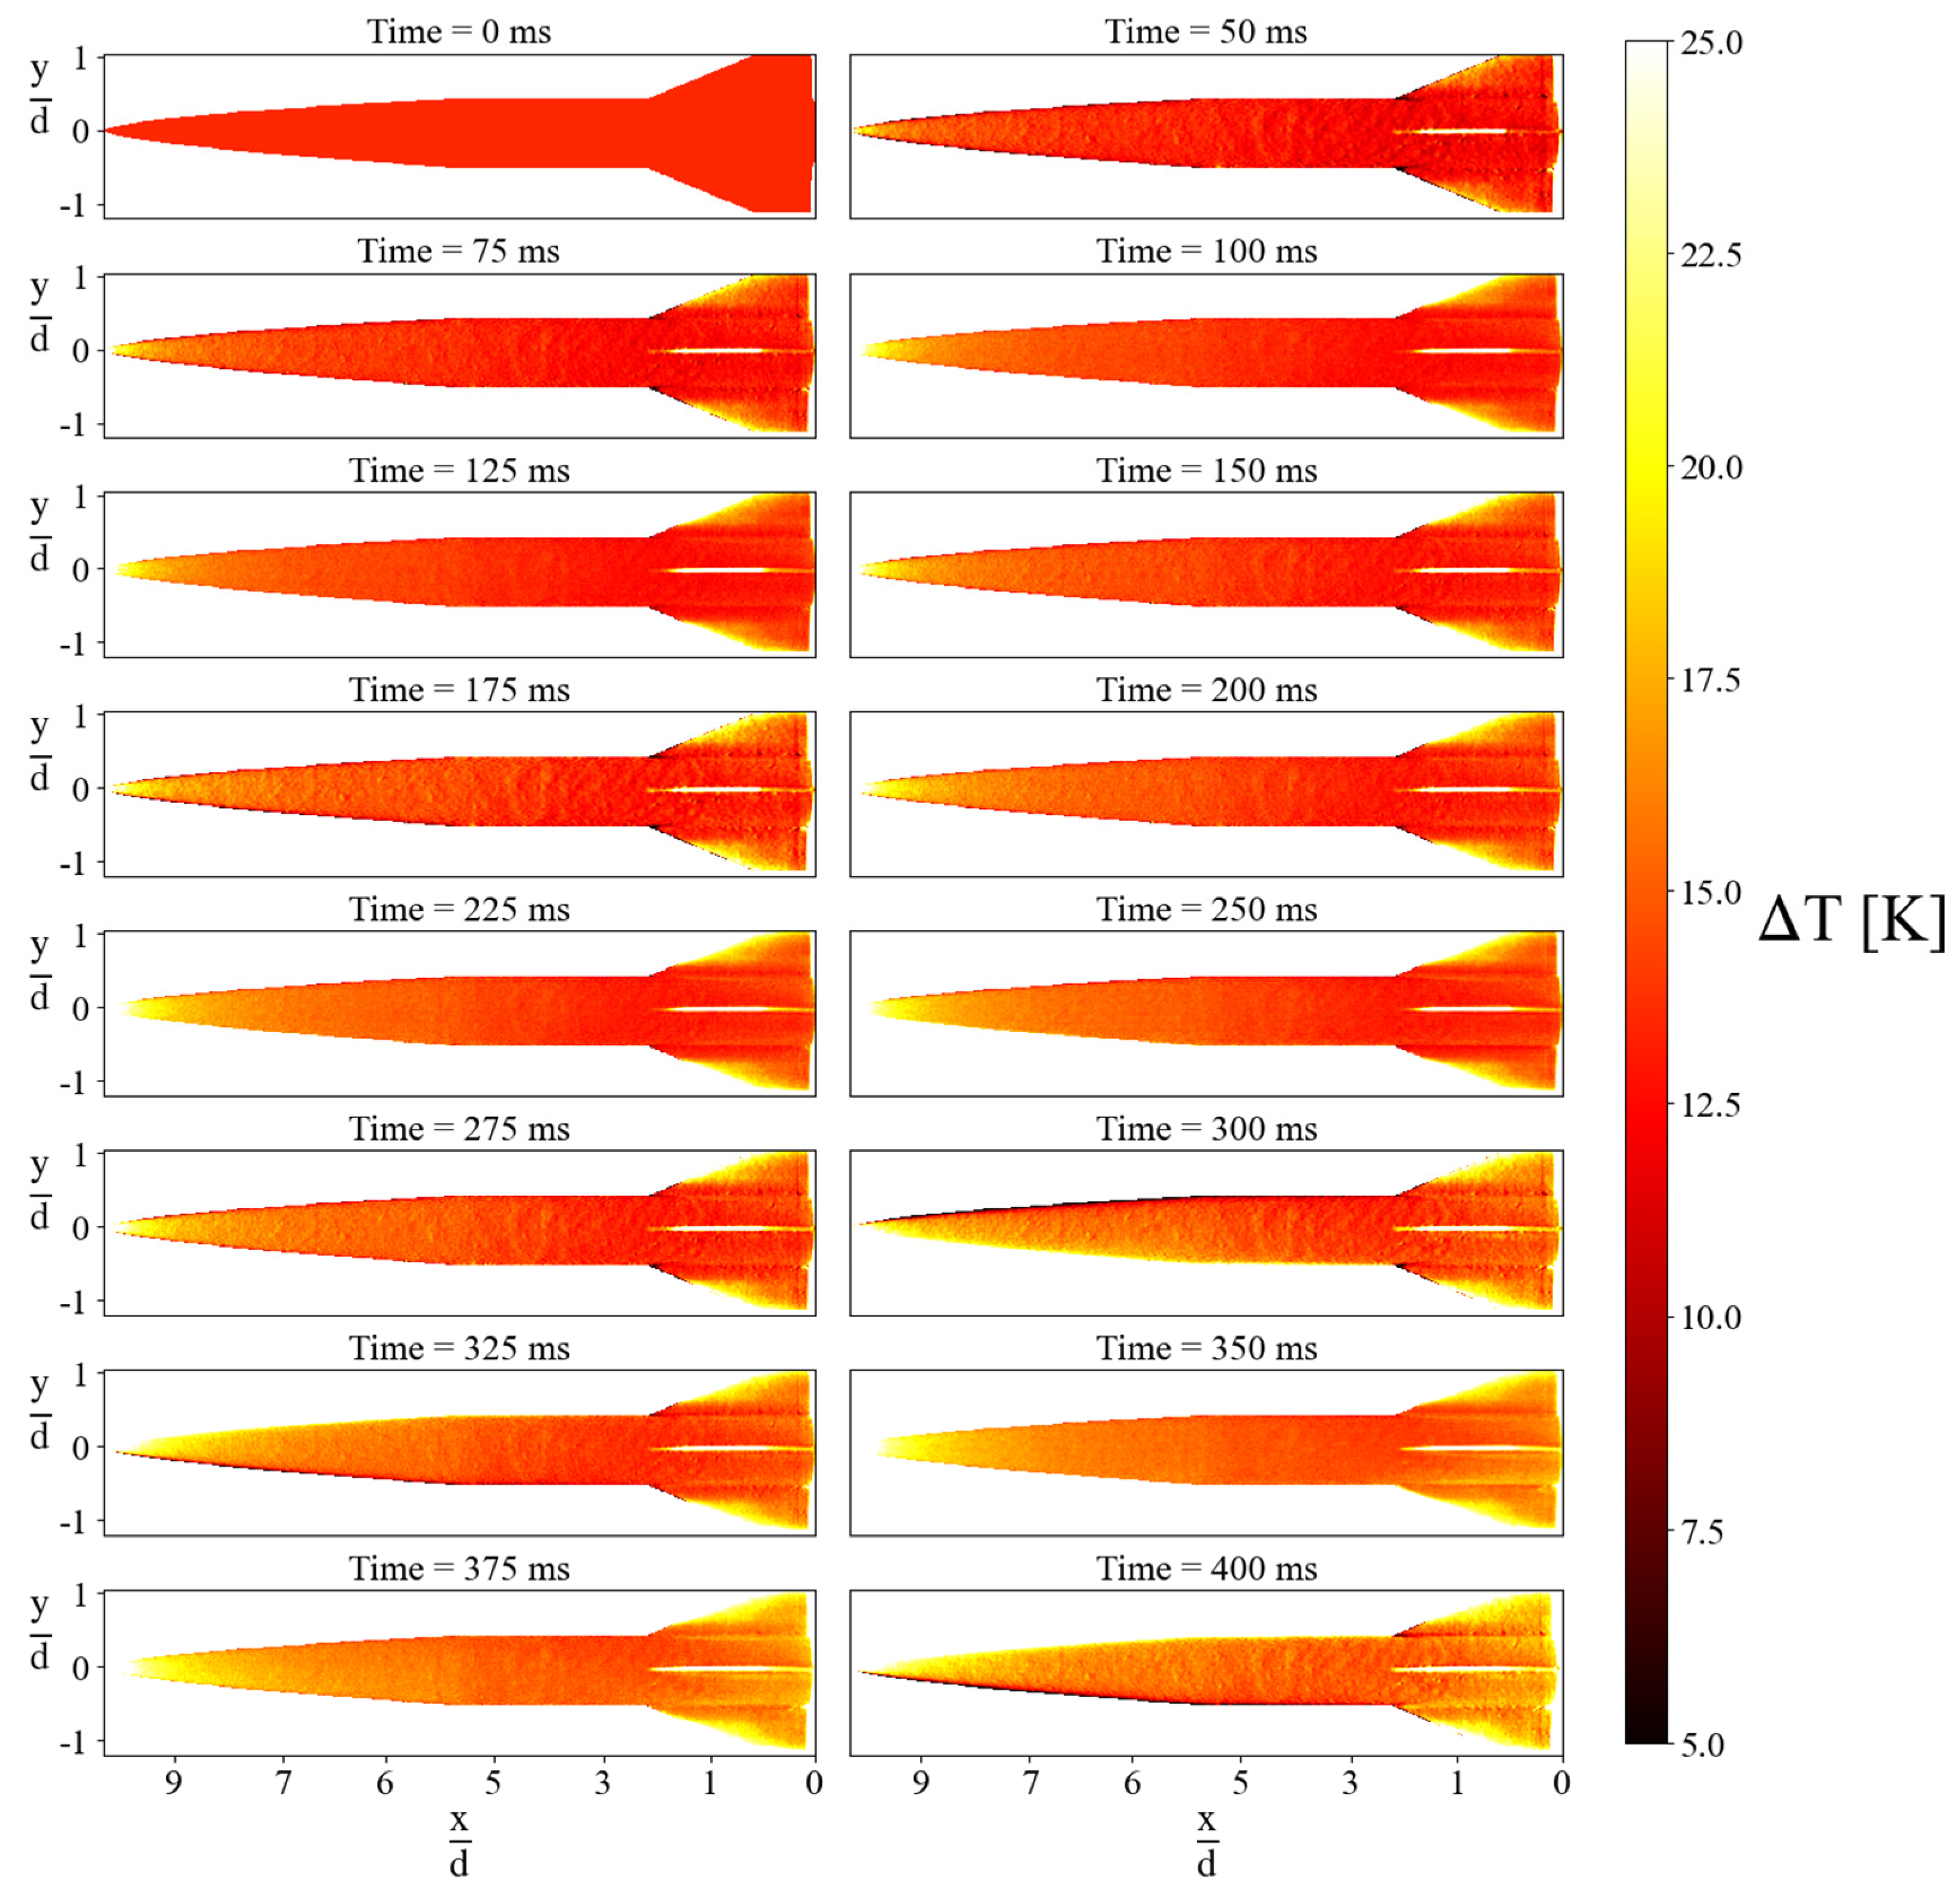
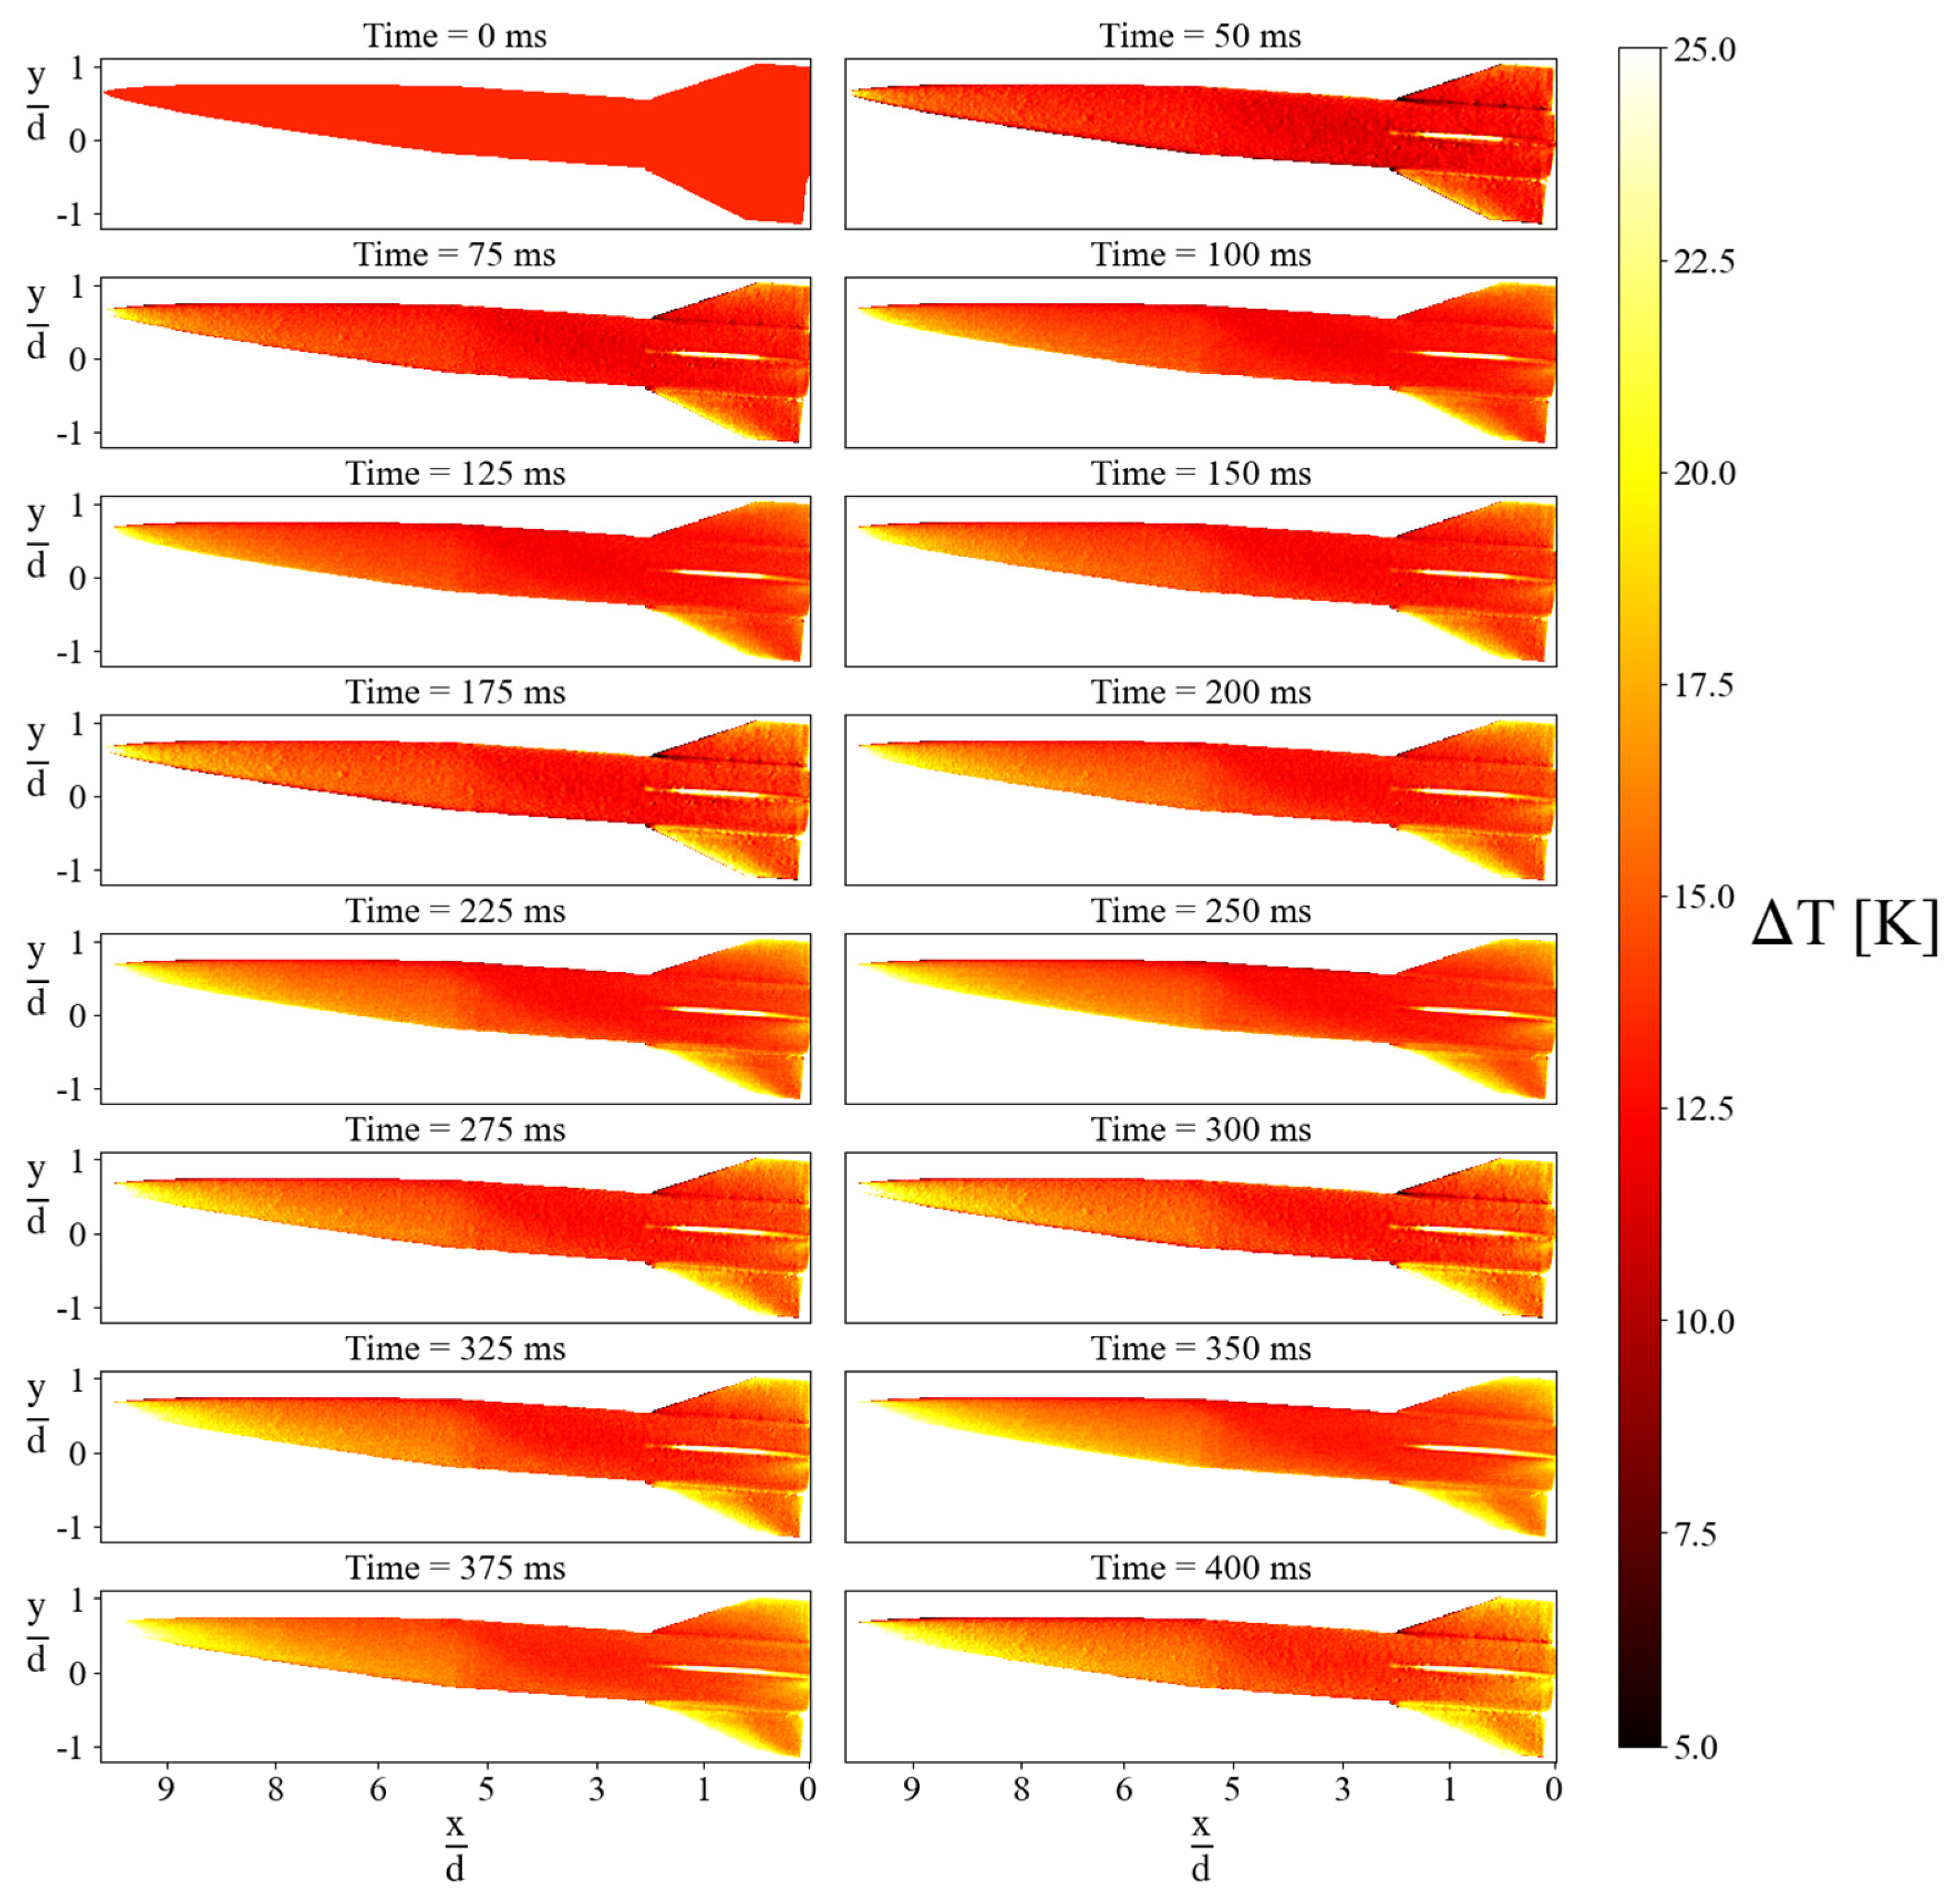
Montages showing the instantaneous surface temperature distributions obtained on the IC3X for both the 0° and 5° AoA are presented in Figure 8 and Figure 9, respectively. The general trends of heating are visualized for both cases. These images were obtained after an extensive data reduction procedure to minimize error propagation. Image registration was performed to realign the wind-on and wind-off images to account for the aeroelastic deformations that the model encounters during a test run. Due to the symmetry of the model at the 0° AoA, the temperature gradients are also axisymmetric. However, for the 5° AoA case, due to the inclination towards the freestream, there is asymmetry in the heating profiles. The temperature gradients are stronger on the windward side of the model for the 5° AoA case. The overall range of temperature fluctuations is comparable for both and lies between 5 K and 25 K. All results are presented as temperature maps with the x and y coordinates normalized by the body diameter (d), forming a non-dimensional coordinate system ( x d , y d ). The results in the following sections will be presented similarly, and individual locations chosen along the model for analysis will be identified by their respective x d coordinates throughout this study.
The temperature changes for both cases show minimal changes up to 75 ms; this corresponds to the steady-state pass duration of the wind tunnel facility where the heat flux estimation, convective heat transfer coefficient calculation, Schlieren analysis, etc., are all performed. Only spatial thermal gradients exist predominantly during this period. Models placed in a hypersonic flow should trend towards the adiabatic wall temperature, which can be estimated theoretically. The surface temperature on the model should trend towards and eventually reach the theoretical adiabatic wall temperature, which, in this case, is about 520 K. The temperature values continue to climb, as shown in Figure 9; however, the temperatures on the model are not fully recovered, which is expected due to the short run times experienced in impulse facilities such as the current one.

4.2. Mean Surface Temperature

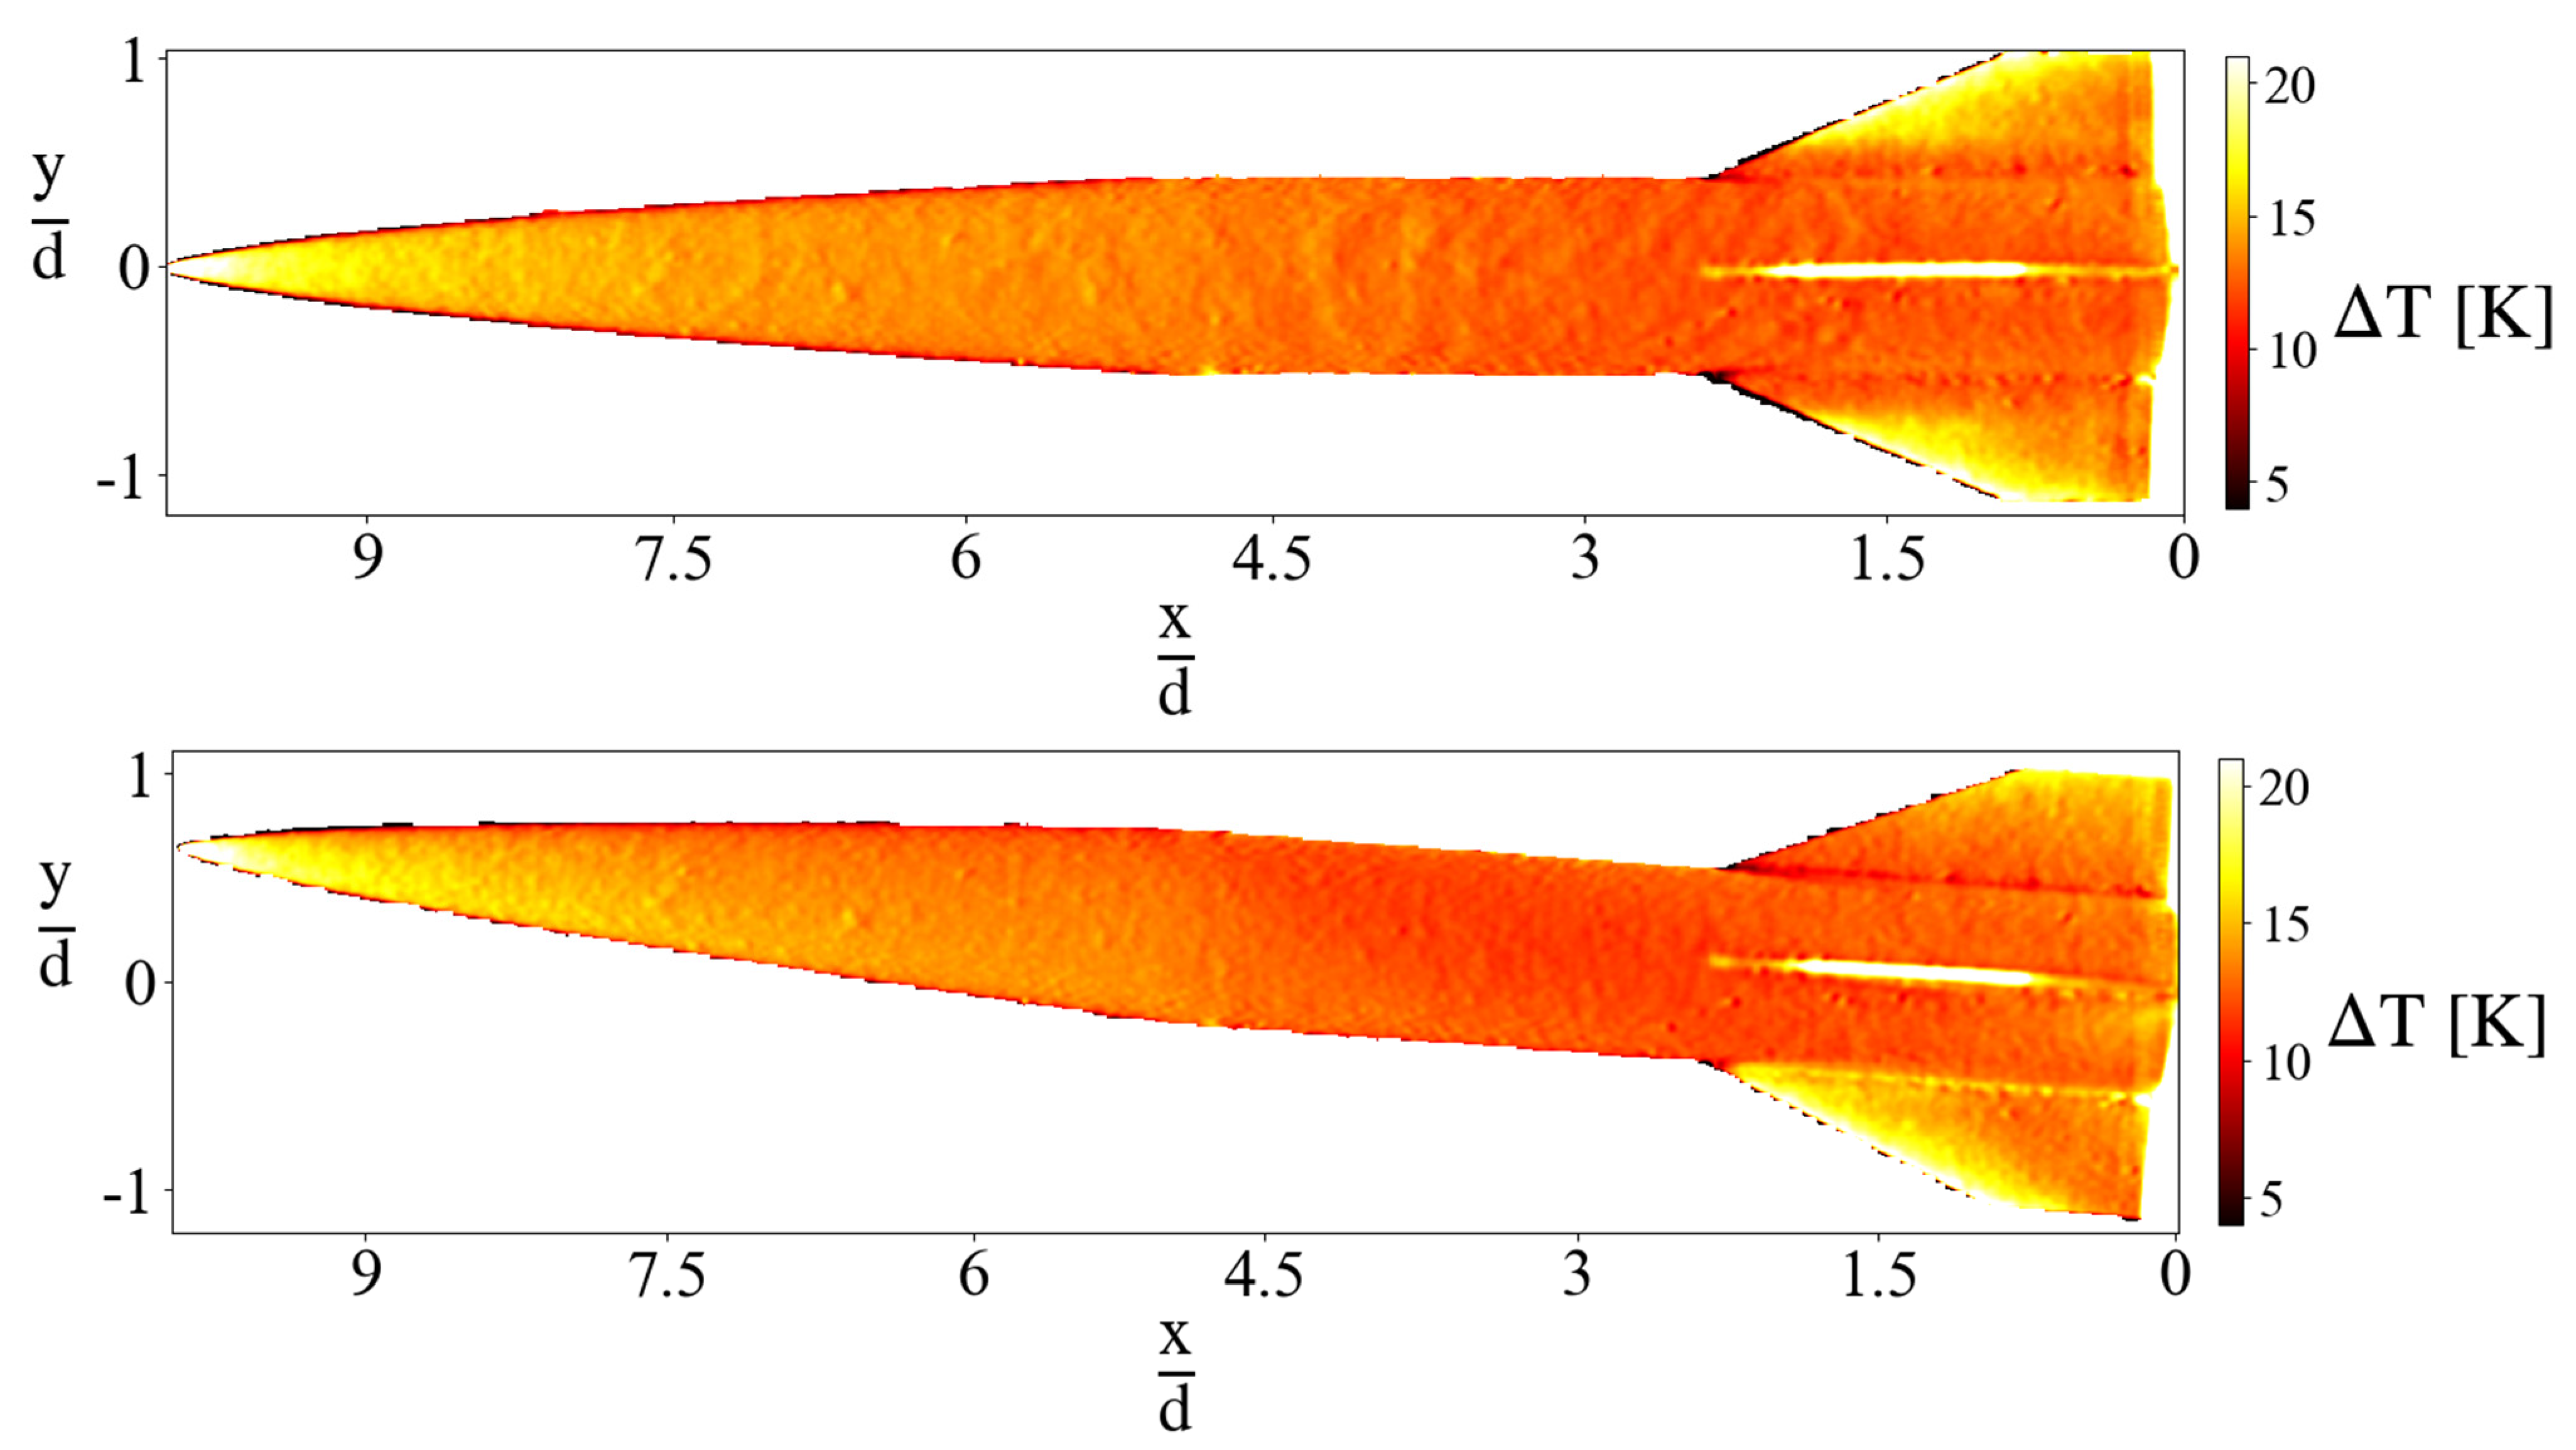
The average temperature distributions obtained on the IC3X for both the 0° and 5° AoA during the first steady-state pass are presented in Figure 10. The temperature profiles qualitatively follow the expected trends that align with the dominant flow features on the IC3X visualized via Schlieren imaging presented by Delgado [42]. Closer investigations using high-speed Schlieren on the ogive and the fin–body interface are elaborated in the latter sections. The average temperature maps obtained strongly resemble the PSP pressure maps reported in [37], indicating the coupled nature of the pressure and temperature fluctuations experienced on the model. The overall temperature distribution across the model reveals elevated temperature zones in the nose, which is the stagnation region and hence experiences the highest amount of heating. There is a clear low-temperature region along the centerline of the model, and the temperature begins to increase near the fin located on the centerline. The bright white region on the center fin is not considered for further analysis, as this region could be subjected to a higher pixel intensity due to its relative orientation with the camera. In addition, some of the pixel counts could arise due to self-reflections. The fins on the top and bottom also show a temperature increase due to their slender geometry, increased heat transfer rate, and the presence of a fin shock wave. The temperature profile in the 5° AoA case shows that the temperature gradient is higher on the model’s windward side due to a stronger oblique shock at the nose region. The rate of the temperature changes on the top and bottom fin is not symmetrical as in the 0° AoA case due to the inclination of the model with respect to the oncoming flow.

4.3. Standard Deviation

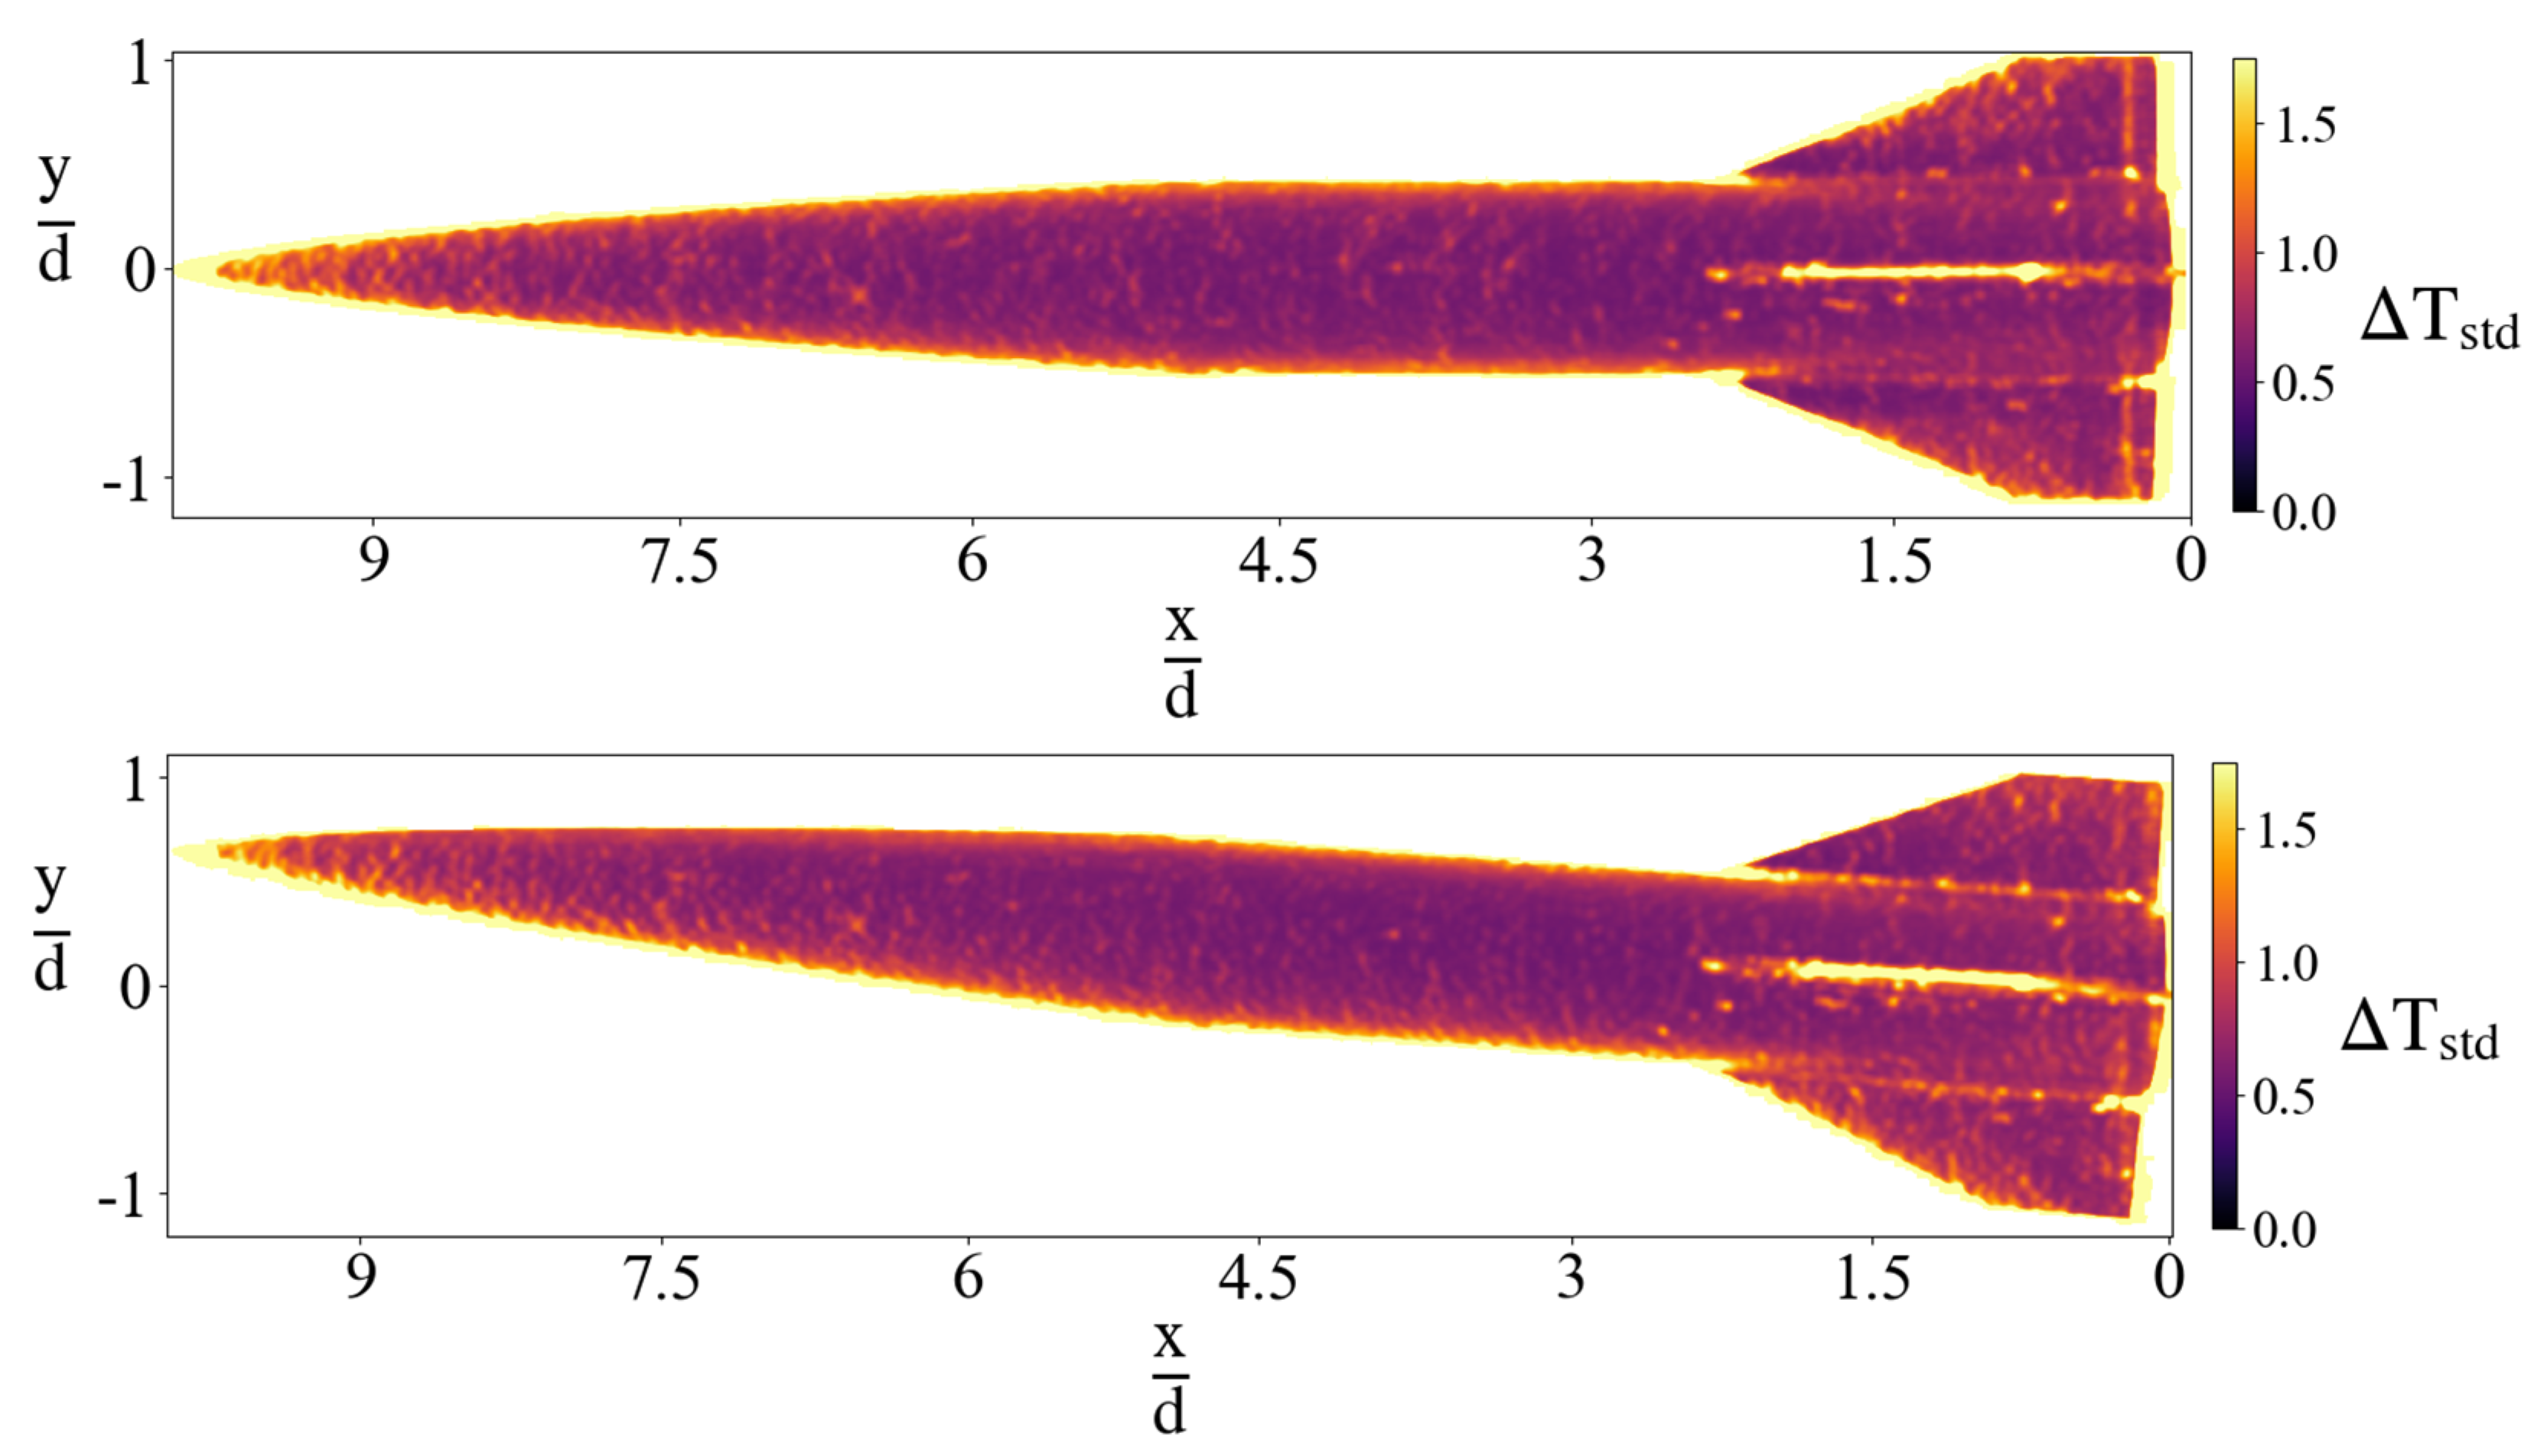
The standard deviation of the surface temperature distribution for the 0° and 5° AoA pictured in Figure 11 shows minimal deviations in temperature from the mean. As explained previously, the fin on the centerline of the model is subjected to reflections and has higher pixel counts due to the viewing angle. Therefore, the deviations shown on the fin are discarded and not treated as physical. The highest deviation occurs at the nose of the model, where substantial thermal gradients exist due to the presence of the oblique shock wave. Overall, the data lie within two standard deviations from the mean for both the 0° and 5° cases. No large-scale unsteady flow phenomena are known to occur across the IC3X; hence, the absence of significant or large-scale thermal fluctuations is not unusual.

4.4. Temporal Temperature Gradients

The temperature trends across time, normalized by the respective stagnation temperatures for both 0° and 5°, are presented in Figure 12. Unlike canonical geometries such as the flat plate, where an average temperature is computed across the entire surface and then analyzed over time, for axisymmetric models like the IC3X, average temperatures across discrete pixel windows distributed along the model are chosen for analysis. These pixel windows are referred to as virtual sensors and are indicated for both 0° and 5° in Figure 13. All windows except the fin lie on the centerline of the model. The virtual sensor was placed on the top fin, which, due to its orientation with the camera’s line of sight, bears greater physical significance than the fin on the centerline. The data presented here are for the first steady-state pass. Data acquisition commenced from the middle of the steady-state pass; as a result, the initial rise in temperature during startup and the beginning of the steady-state pass was not captured. Predictably, the nose at the 0° AoA shows the highest temperature increase over time, closely followed by the nose at the 5° AoA. This temporal gradient at the nose is also attributed to the compression encountered by the oblique shock wave, across which the surface temperatures will rise. The temperature changes at all other locations over time are relatively minimal. The virtual sensor at the fin for the 0° AoA shows higher temperature values at the top fin. For the 5° AoA, the top fin is expected to have lower values than the bottom fin due to asymmetry.

5. Heat Flux

Heat flux estimates were obtained on the temperature values measured using TSP. The average heat flux estimates for the first steady-state pass for both the 0° and 5° AoA are presented in Figure 14. The heat flux trends are in accordance with the surface temperature trends discussed previously. The nose on the model is the thinnest point in the body. At this point, the localized thermal mass is significantly lower, leading to high flux values. The heat flux is calculated using the classical heat conduction equation given in Equation (3).
q t = 2 ρ c k π   [ i = 1 n T t i T t i 1 t n t i + t n t i 1 ]
The values of the constants (ρck) correspond to the properties of the insulating base layer and are based on estimates obtained similarly to those reported in [12,40]. The insulating base layer of white paint coupled with the TSP layer atop the model acts as a semi-infinite medium, and, hence, using the above equation is valid. The heat flux distribution on the model qualitatively follows the trends reported in the literature. The magnitude of the values is lower than expected as the startup portion of the wind tunnel test, where the models experience significant amounts of flux, was not captured in entirety in the current study. Ozawa et al. [11] report similar trends but a higher flux magnitude ranging between 0.19 and 0.37 MW on a cone at Mach 7.4. TSP experiments conducted in the Boeing/AFOSR Mach 6 Quiet Tunnel on a 7° half-angle cone show good overlap with the data obtained here; the overall heat transfer range is within 0–8 kW/m2. The flux values obtained also follow the approximate cubic relationship with the freestream velocity shown in Equation (4) below, obtained from [43]. CH refers to the Stanton number. The calculated flux values match the experimental data obtained at the stagnation point for both the 0° and 5° AoA.
q w = 1 2 ρ V 3 C H

6. Average Convective Heat Transfer Coefficient

The convective heat transfer coefficient gives a measure of the rate of heat transfer across the model from the surrounding fluid. In other words, it can be described as the thermal resistance of the model immersed in the freestream expressed by the H value, which is calculated using the simple relation
H = q / Δ T
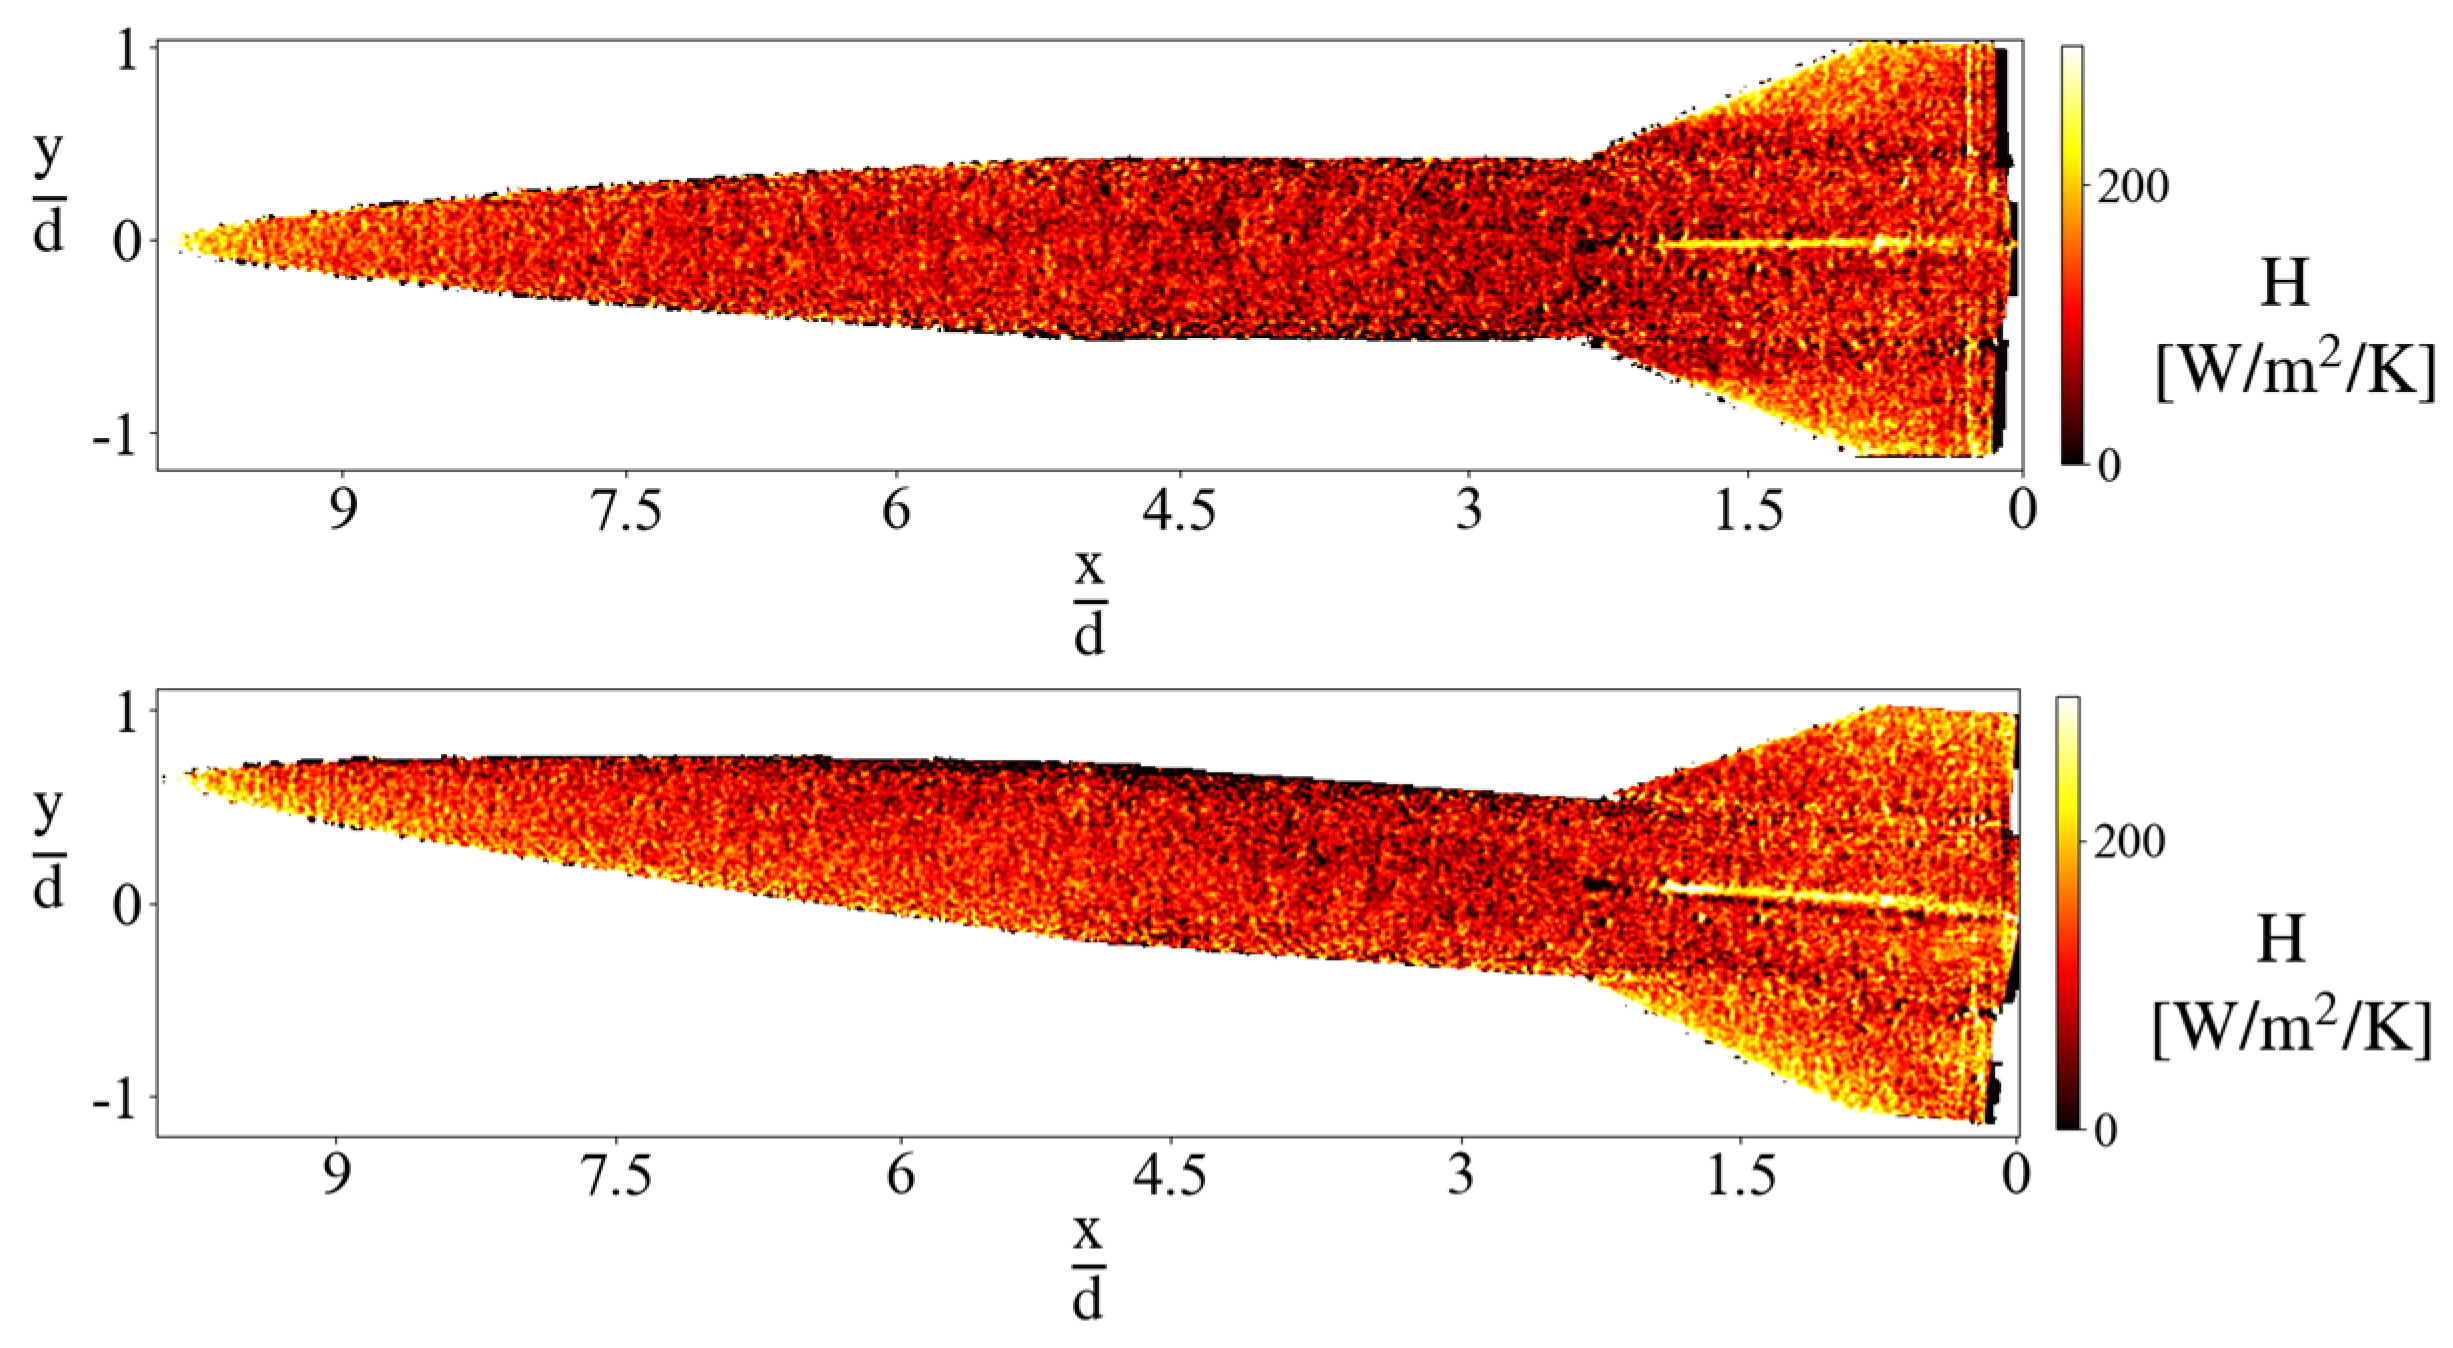
Hypersonic vehicles are known to experience extreme temperatures and pressures due to shock waves and expansion fans. Knowledge of the H values could help to design appropriate TPS systems for hypersonic vehicles. As observed from the average H values for the 0° and 5° AoA in Figure 15, the convective heat transfer coefficient is higher at the nose and higher when the AoA is increased due to the formation of a stronger shock.

7. Modified Stanton Number

7.1. Average Profile

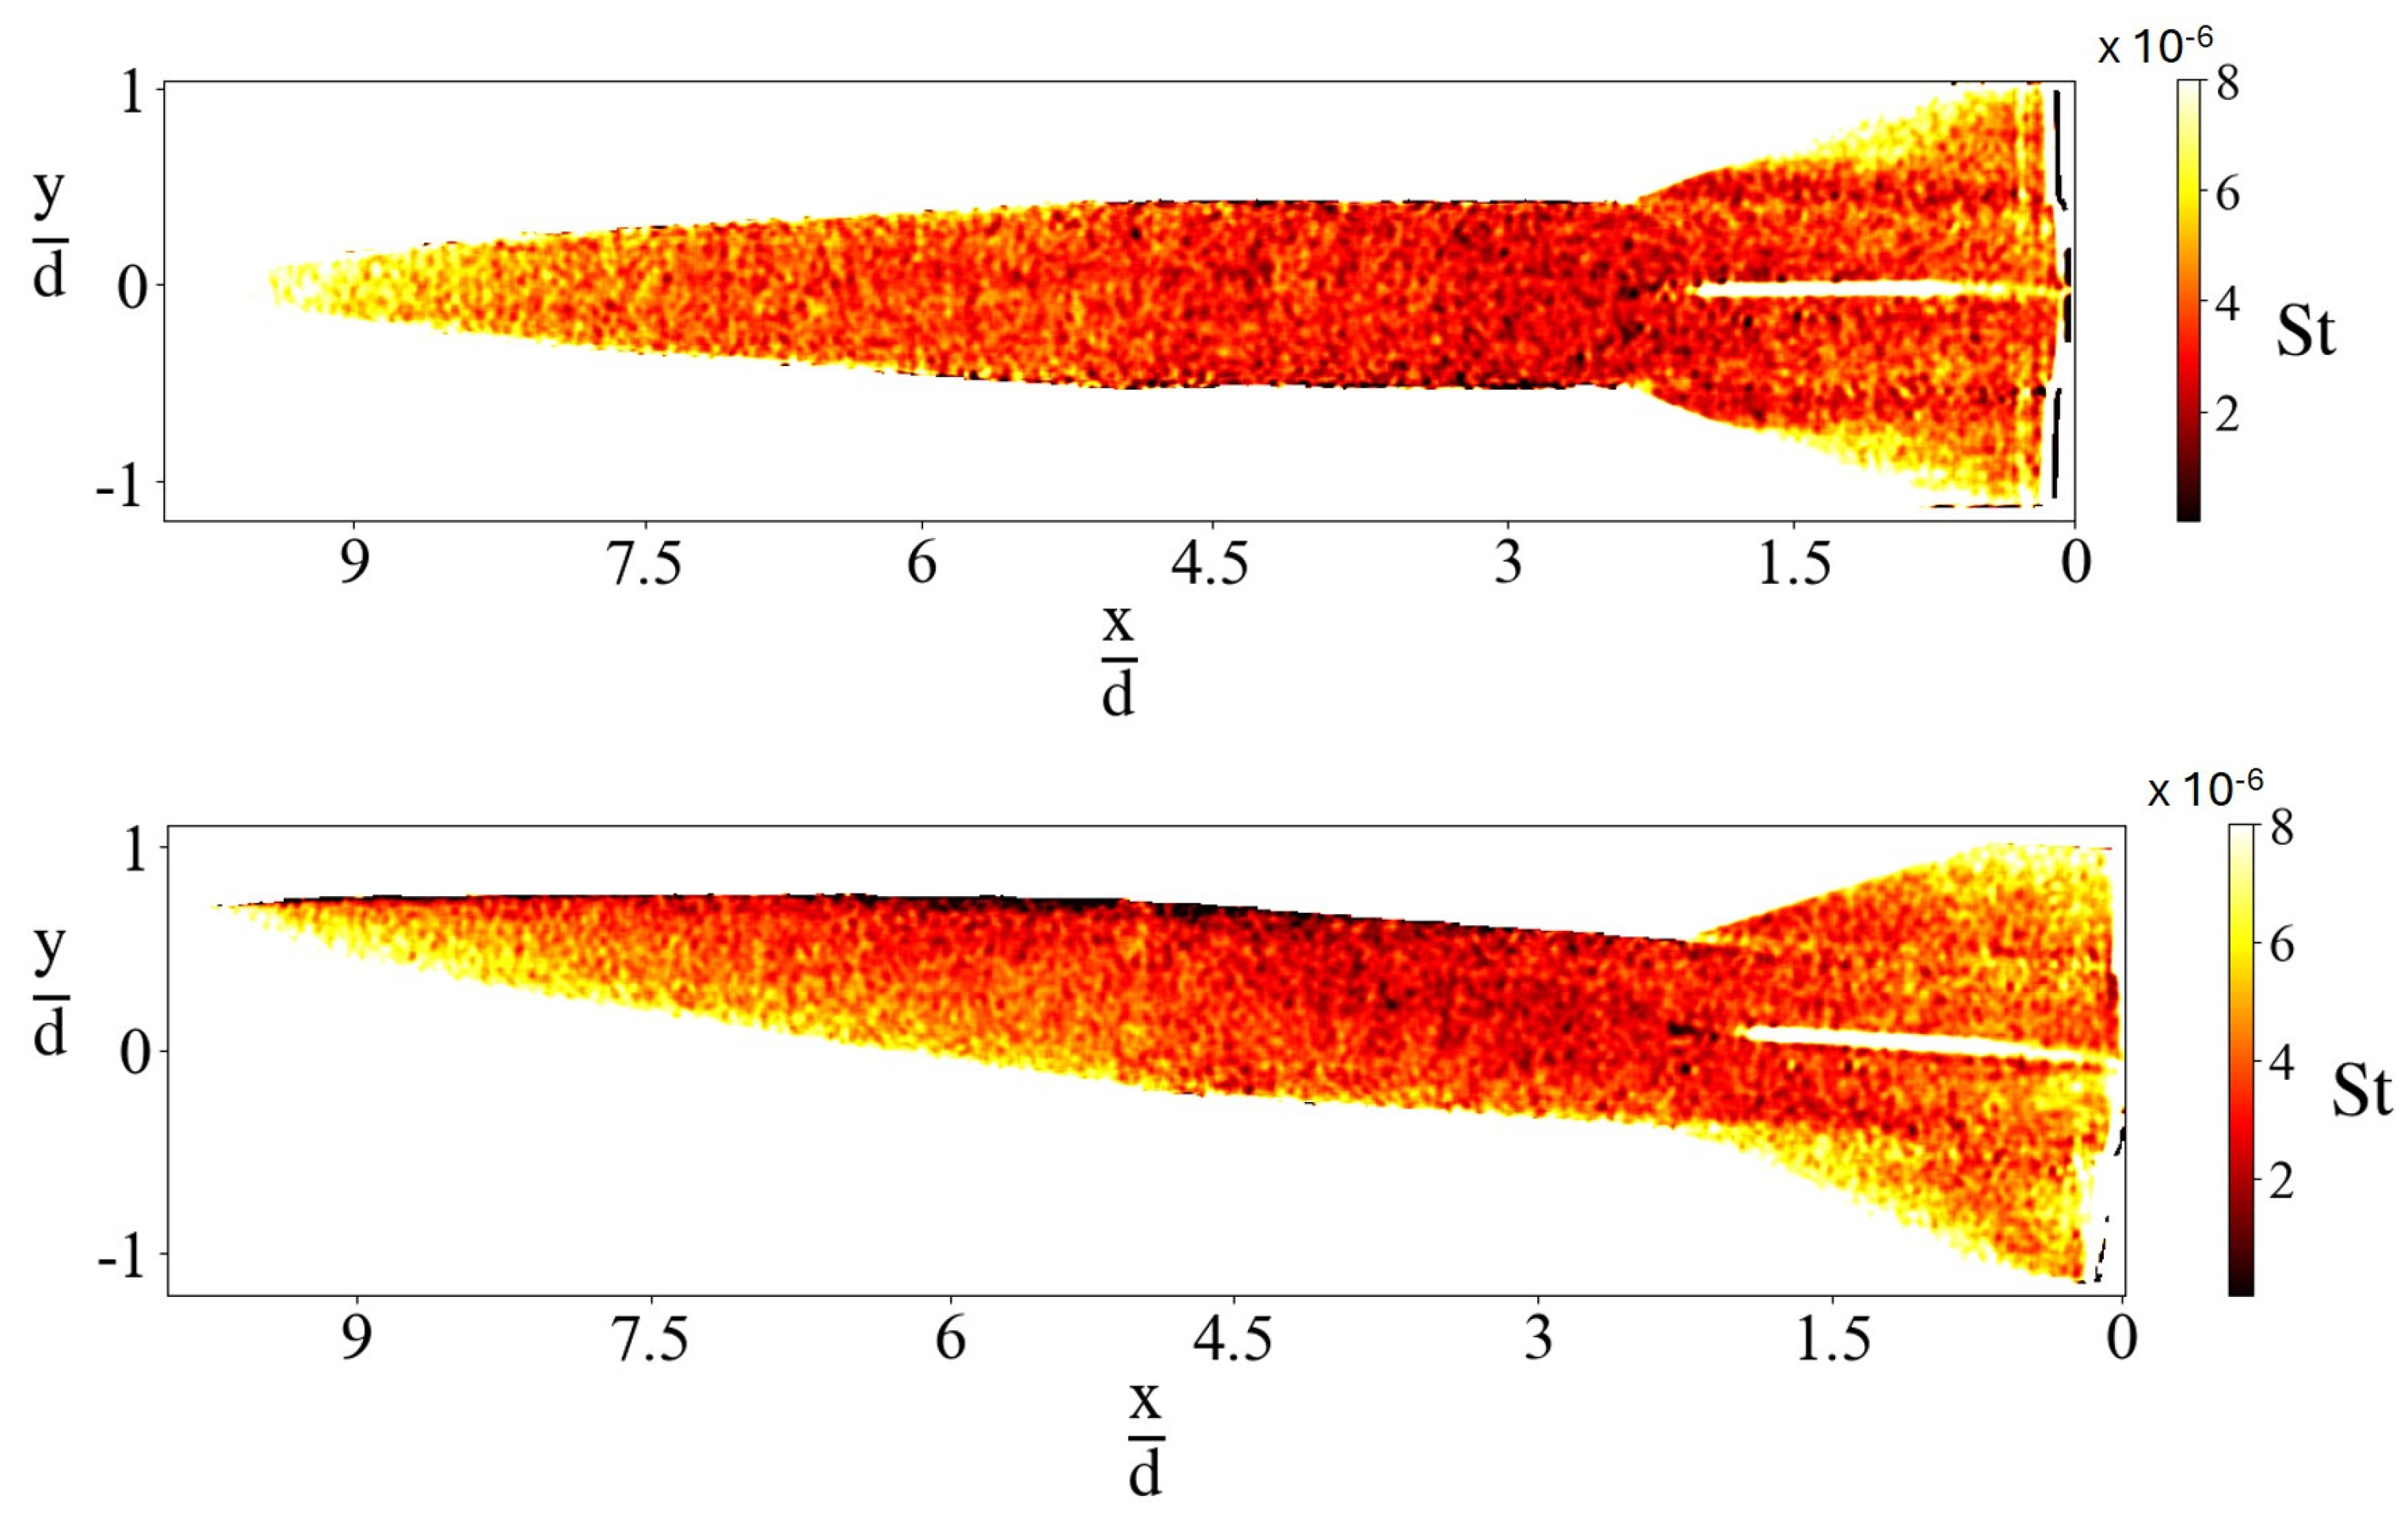
The Stanton number is used to characterize convection and provides a measure of the ratio of heat transferred into a medium to the kinetic energy of the medium. Lower Stanton number values indicate a less efficient heat transfer rate compared to the fluid’s temperature. Modified Stanton number values are calculated for the 0° and 5° AoA and shown in Figure 16. The heat flux values are used for this, as expressed in Equation (6).
M o d i f i e d   S t a n t o n   N u m b e r   ( S t ) = q c e ρ e u e ( T o T w )
The wall temperature and flux values are obtained by the TSP, and the stagnation temperature is used instead of the traditional adiabatic wall temperature. Other studies in the literature [8,12] have also estimated the Stanton number values in this way.

7.2. Spatial Distribution

The Stanton number values at different locations on the model are compared for the 0° and 5° AoA in Figure 17. On the nose and fin, the magnitude is higher for the 0° case. The average Stanton number obtained on the ogive of the IC3X along the centerline at the 0° AoA shows good agreement with data collected on a 7° half-angle cone at Mach 6 reported in [8]. The spatial distribution and the magnitude of the Stanton number across different runs conducted in the Purdue Mach 6 Quiet Tunnel are similar to those obtained on the IC3X and are shown in Figure 18.

8. Schlieren Visualization

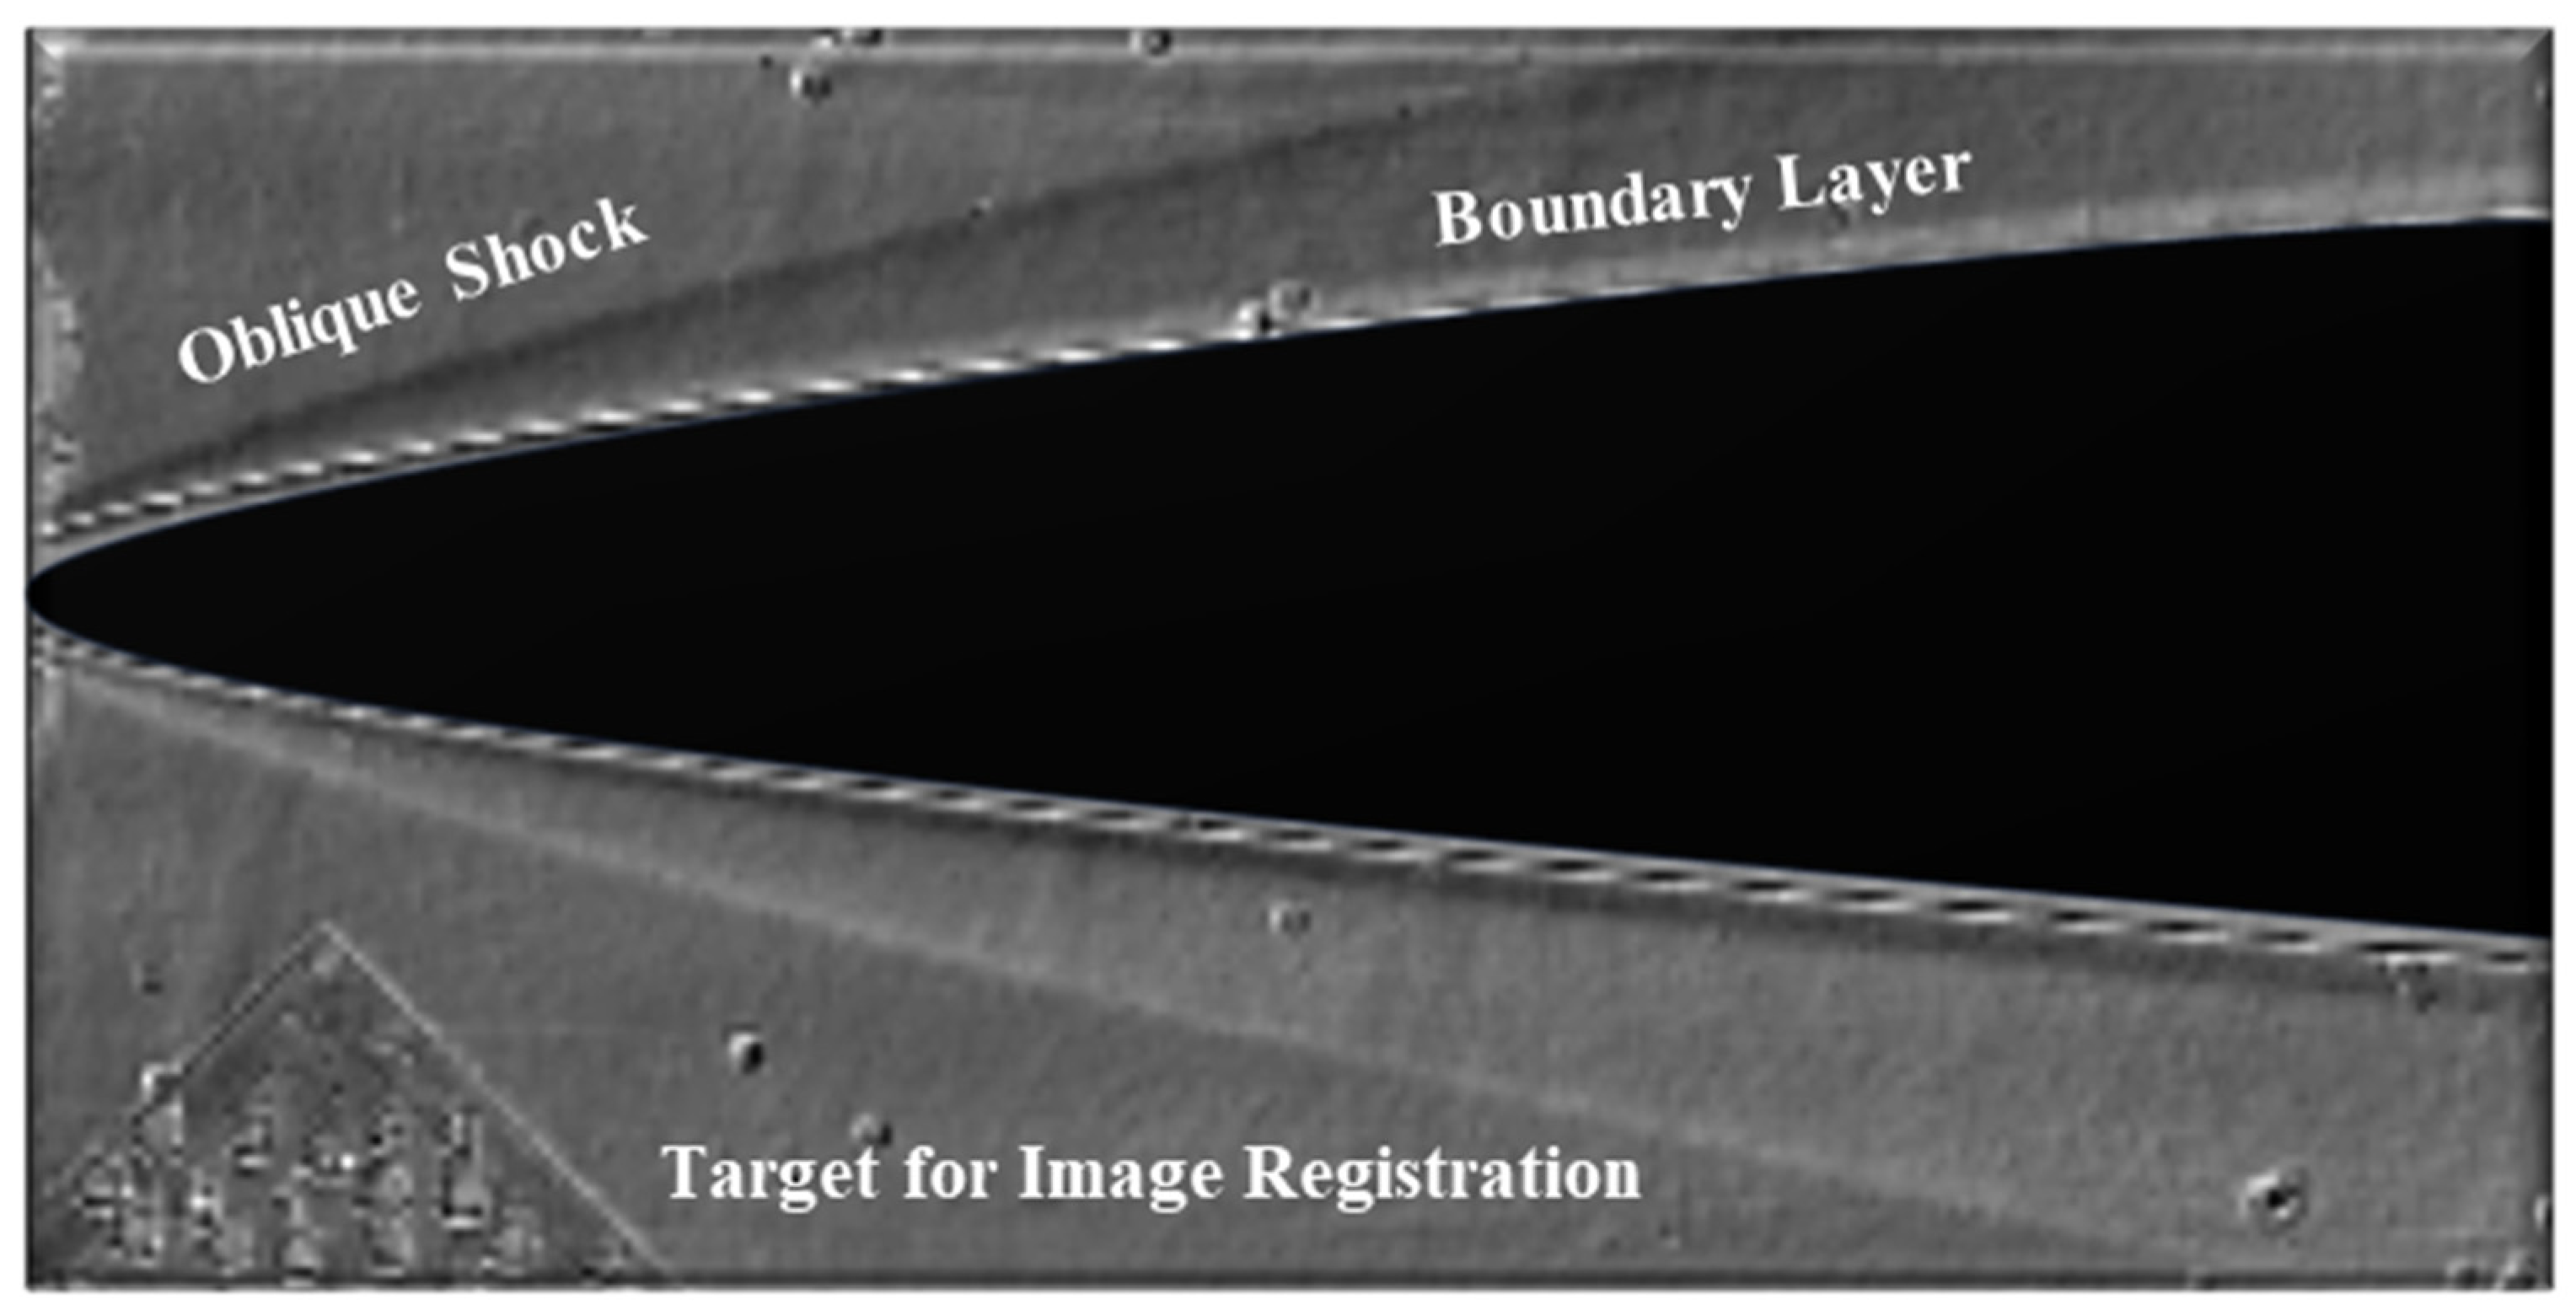
The results from high-speed Schlieren imaging using a modified Z-type setup are presented in this section. Qualitative line-of-sight Schlieren has been employed routinely in hypersonic wind tunnel testing to obtain insights regarding compressible flow phenomena such as shock waves [44] and expansion fans and to visualize shock wave boundary-layer interactions [45], boundary-layer growth, boundary-layer transitions, and other viscous effects that are the source of local density gradients [46,47]. The following components were part of the Schlieren setup: a luminous CBT140 LED powered by a Cuvee low-voltage high-current LED driver circuit, two flat mirrors, and two spherical mirrors with a 152.4 mm diameter and 1524 mm focal length, respectively. A monochrome Photron Fastcam SA-Z model 2100 K high-speed camera was used to capture images. The test conditions for all of the experiments are listed in Table 4. The IC3X model geometry, as described earlier, had a span of 254 mm, which was larger than the concave mirrors being used, thereby requiring multiple wind tunnel runs to visualize the entire flow field. A horizontal knife edge was used for all images captured to provide wall-normal density gradient sensitivity. The model was nominally held at zero-degrees incidence relative to the oncoming flow prior to each run. The angle of attack was measured via a digital level as in the case of the previous experiments. The digital level had uncertainty of approximately ±0.01 degrees. Figure 19 and Figure 20 provide the representative Schlieren images of the ogive and the aft portion of the model. The field of view was chosen based on the zones of interest on the model from a flow physics point of view. Figure 20 highlights the leading-edge oblique shock clearly. The edges of the model appear to have texture that is attributed to pixel non-uniformities. However, there is also a thin layer of flow enveloping the ogive, which is identified as the boundary-layer region. Although elongated and rope-like waves along the boundary layer have been observed in Schlieren images in multiple studies on sharp tip cones and ogives in the literature [48], they are not fully resolved in this present configuration. Multiple shorter measurement windows will be used in the future to capture the inception and growth along the boundary layer effectively. Across the multiple wind tunnel tests carried out, no apparent changes in flow characteristics due to potential model oscillations arose, and all measurements exhibited stationary flow dynamics. The aft portion of the model shown in Figure 20 was held at 0° as well; the field of view, in this case, was focused on the body–fin interaction region to capture the SWBLI phenomenon that is likely to occur. In Figure 20, the shock expansion fan system emanating from the ogive–cylinder transition zone along the model is clearly visible, and the leading-edge shock is present. No additional information regarding boundary-layer interactions was otherwise obtained. It is important to note that because Schlieren is path-integrated by nature, it poses a significant challenge in visualizing flow features on axisymmetric geometries such as the IC3X. Freestream noise, camera sensor noise, etc., can cause the signal-to-noise ratio in the boundary layer to dip significantly, in addition to optical aberrations and other sources of noise in the optical path. It was also found that the frame rates chosen were insufficient to fully resolve all of the boundary-layer dynamics evolving over this geometry; future test campaigns will focus on obtaining a better resolution for the boundary layer with improved lighting and higher frame rates.
A sequence of time-resolved Schlieren images and heat flux fields derived from the TSP measurements is presented in Figure 21. The Schlieren sequences of both the front and aft portions of the model are shown. The exact shape and influence of certain flow features are challenging to distinguish in the instantaneous Schlieren images due to the obfuscating properties of the shock-induced density gradients. Various sequences were recorded across different experiments; therefore, the experimental times were synchronized using the pressure trace and trigger signal in LabVIEW (Version 2023 Q1). Since the data acquired for a few of the runs did not include the beginning of the first steady-state pass, the time sequence presented here is from the middle to the end of the first steady-state pass. At 60 ms, the incident oblique shock is clearly visible ahead of the nose, and a corresponding rise in heat flux is observed towards the left of the shock via the TSP images. The shock expansion fan system that originates at the ogive–cylinder transition region is visible; the heat flux values in the cylindrical portion (not visualized in the Schlieren images shown above) of the model are lower. There is possible thickening of the boundary layer that occurs in the aft region closer to the fin due to the interaction between the boundary layer and the shock expansion fan system that changes in height over time, which could explain the reduction in heat flux in the undisturbed region ( x d 3 to 6). At 80 ms, the global heat flux levels are elevated due to the cumulative increase in the surface temperature. The dynamics of the shock waves and expansion fans appear largely stationary and inviscid in nature. For instance, the incident shock wave on the model remains at the same location as the other major structures identified. Therefore, the flux and thermal gradients across a given site on the model vary similarly across time. The changes calculated in the surface temperature, heat flux, and convective heat transfer coefficient shown earlier qualitatively follow the expected trends, as observed in the Schlieren images.

9. Uncertainty and Error Propagation

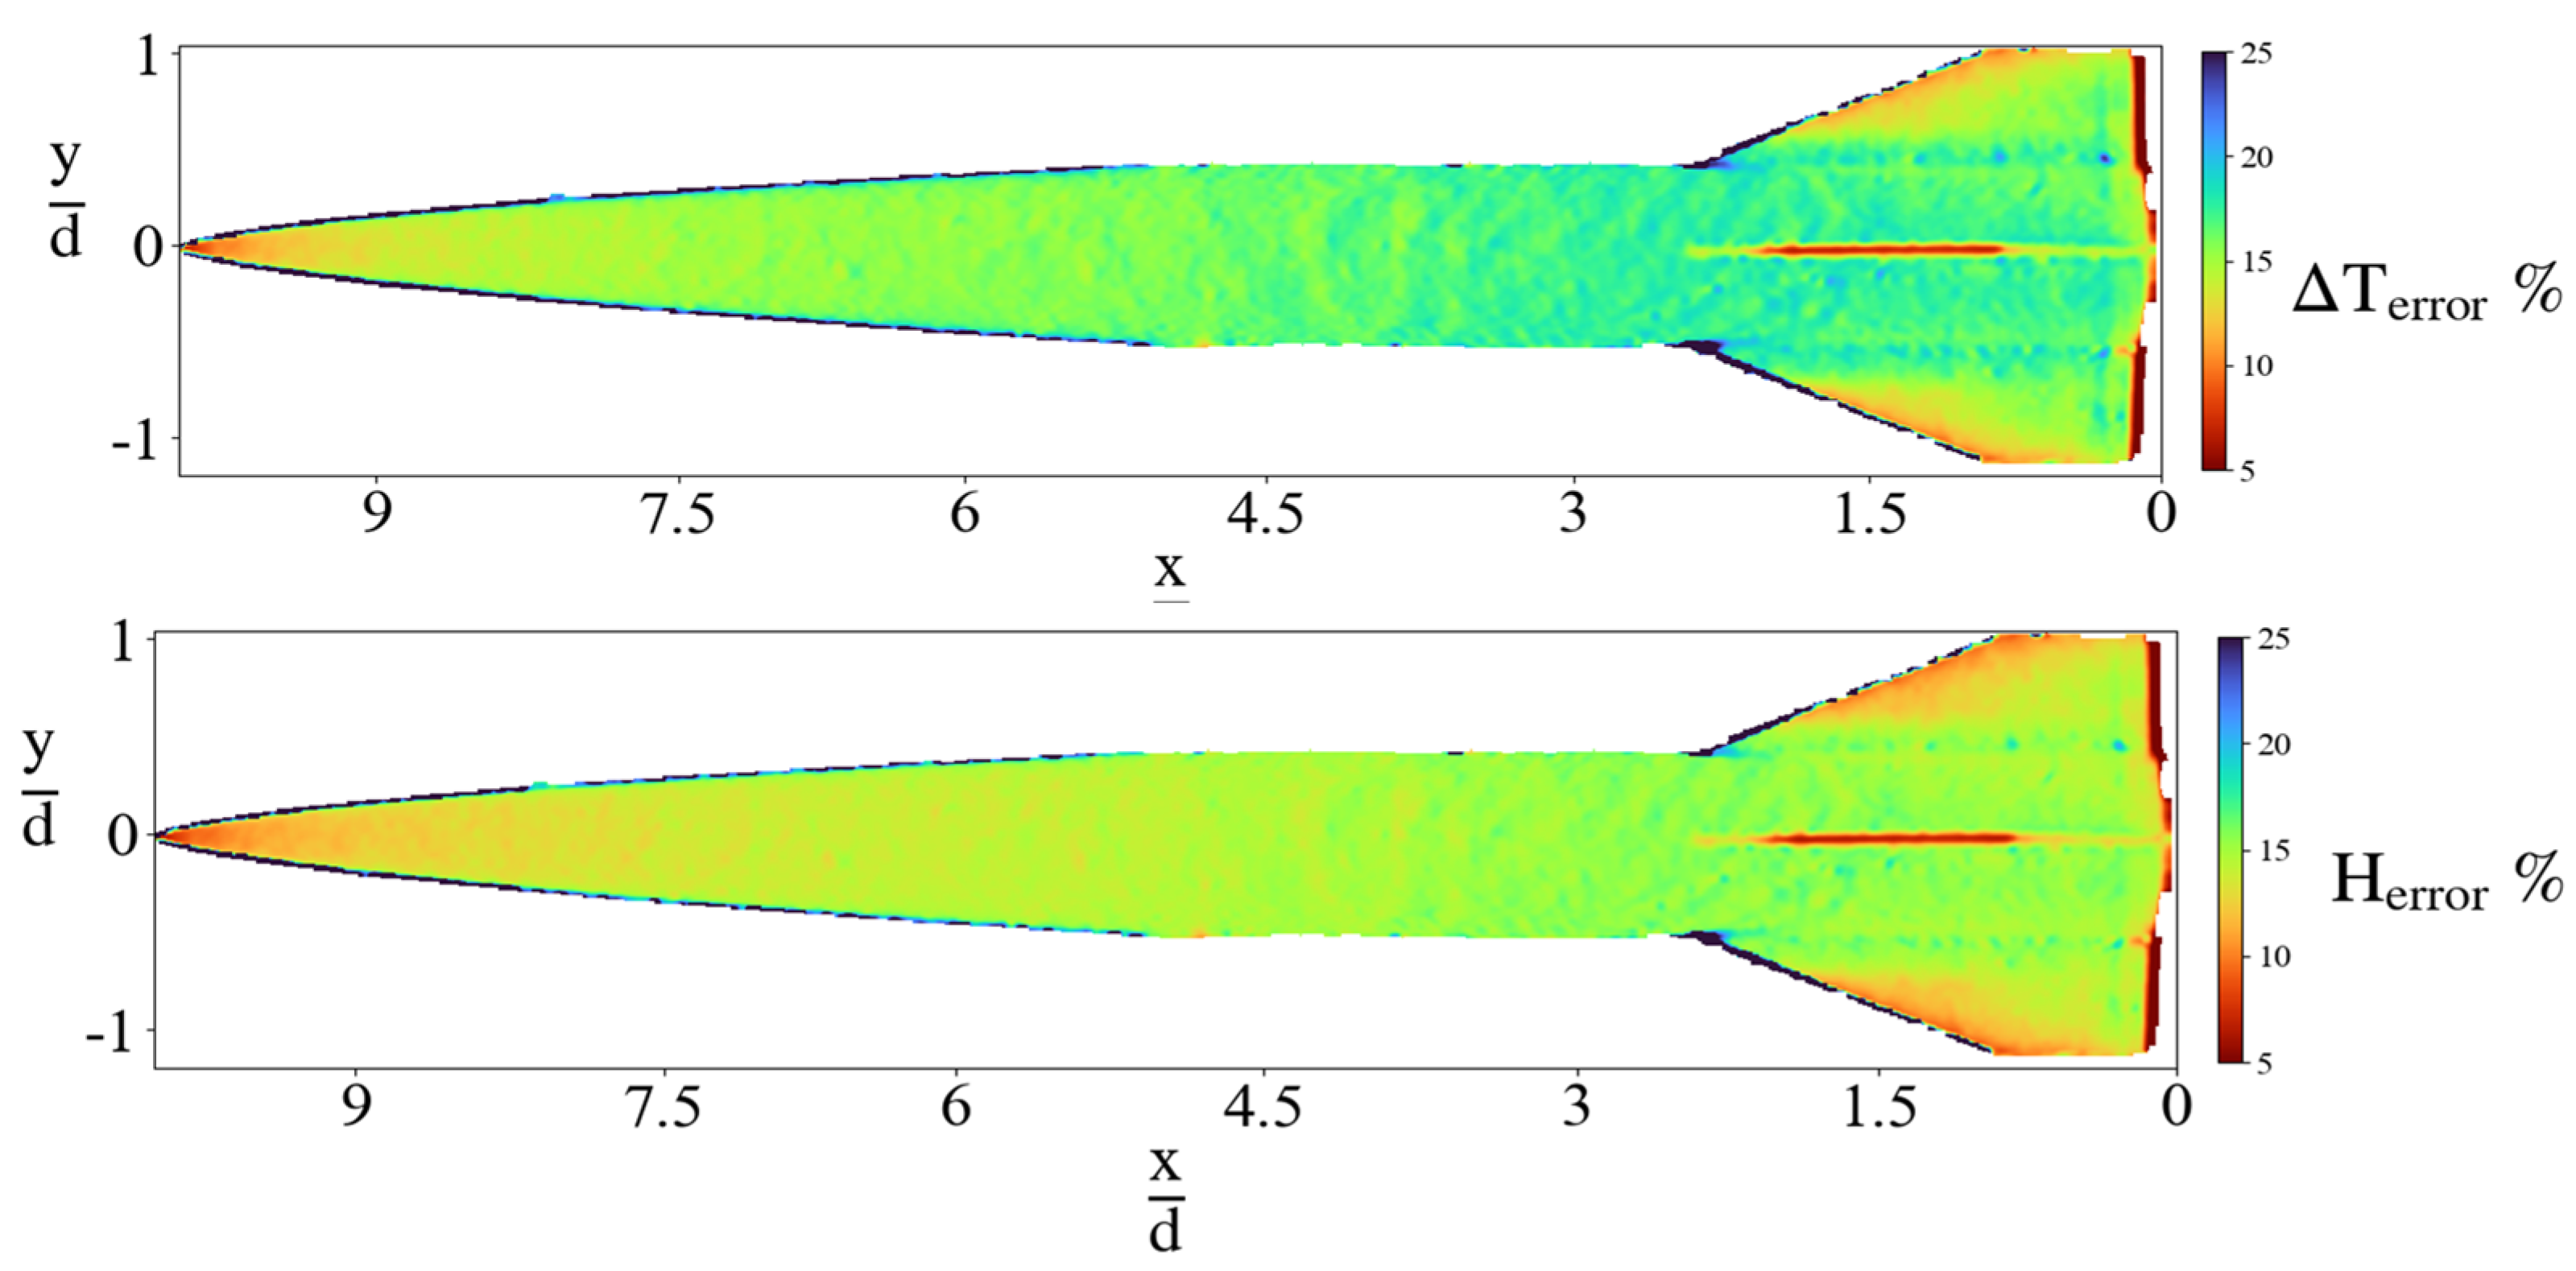
An uncertainty analysis was conducted to quantify the error in the measurements obtained from the experimental campaign. Figure 22 below shows the spatial distribution of the uncertainty in the surface temperature and heat transfer coefficient on the IC3X. It was found that the uncertainty near the leading edge was minimal compared to other regions on the model. The second most dominant error source was pixel noise, which varied spatially on the model, and, as a result, the uncertainty varied on the model accordingly.
The list of error sources considered and their contributions are listed in Table 5 below. This list is not exhaustive, but all quantifiable sources of error were accounted for.
The change in the surface temperature values (ΔT) was calculated using a room temperature assumption for the reference temperature. The error in this approximation was expected to be within ±2 K. The errors in calibration constants A and B were estimated from the benchtop calibration curve. The final source of error considered in this error analysis was the pixel uncertainty in the images resulting from camera noise. This was estimated by calculating the standard deviation in a cropped, uniformly illuminated region on the model. The error propagated due to these individual terms was calculated using a Euclidean norm as defined in Equation (6).
ϵ t o t a l = i = 1 n 1 2 + 2 2 + + n 2
εtotal refers to the cumulative uncertainty, and εi represents individual error sources. The cumulative uncertainty was estimated at 22% for ΔT and H and 2% for the flux and Stanton number. Table 6 describes the individual error contributions from each parameter considered and the cumulative uncertainty estimated using Equation (7).

10. Summary

The values computed using the results obtained from the fast-TSP experiments on the IC3X geometry at two different AoA at Re ~7 × 10⁻⁶ m−1 are listed in Table 7, serving as a reference for the range of values expected with this model geometry at the chosen test conditions, offering insights into its thermal behavior.

11. Conclusions

Temperature-sensitive paint experiments were conducted on the IC3X geometry at Mach 7.2 and Re ~7 × 10⁻⁶ m−1. These experiments showcase the ability to obtain global temperature and heat flux fields using TSP for the model, suggesting that the utility of luminescent coating techniques like TSP could be extended beyond purely qualitative information. The average change in surface temperature was between 6 and 34 K with a peak magnitude of 39 K at the stagnation point for the 0° AoA case and 11–44 K overall with a peak magnitude of 43 K recorded at the stagnation point for the 5° case. The global heat flux values were in agreement with the trends found in the literature [8,11,43] and averaged about 1.26 × 10³ at 0° AoA and 1.30 × 10³ for 5° AoA. Similarly, the heat transfer coefficient and Stanton number estimates obtained for the IC3X are within ranges that are comparable to the values obtained in the literature for axisymmetric models [8,12]. All calculated parameters and trends observed on the IC3X testify to the aerodynamic efficiency of this geometry. At realistic angles of attack that the model is likely to experience, the absence of abrupt thermal swings indicates excellent thermal stability, which is highly favorable from a design standpoint. The current experimental campaign is an extension of the facility’s analytical capabilities and demonstrates the ability to obtain validation and verification data for researchers seeking to conduct CFD analyses on specific geometries of their choosing at the UTSA Mach 7 Ludwieg tube. Future experimental efforts will focus on obtaining robust thermocouple measurements to anchor the surface temperature values obtained via TSP to a known reference. Steps will also be taken to improve the calibration to provide greater measurement accuracy.

Author Contributions

Conceptualization, C.S.C.; methodology, A.D. and C.S.C.; software, A.D.; formal analysis, A.D.; investigation, A.D., N.S.S., K.R.P. and E.N.A.H.; data curation, A.D., A.A., N.S.S. and K.R.P.; writing—original draft preparation, A.D.; writing—review and editing, A.D., N.S.S., A.A., E.N.A.H. and C.S.C.; supervision, C.S.C.; project administration, C.S.C.; funding acquisition, C.S.C. All authors have read and agreed to the published version of the manuscript.

Funding

This work was sponsored (in part) by the Air Force Office of Scientific Research, USAF, under grant/contract number FA9550-21-1-0089. Additional support was provided by NASA grant 80NSSC19M0194. The views and conclusions contained herein are those of the authors and should not be interpreted as necessarily representing the official policies or endorsements, either expressed or implied, of the Air Force Office of Scientific Research, NASA, or the US Government.

Data Availability Statement

The data presented in this study are available on request from the corresponding author.

Acknowledgments

The authors would like to acknowledge all members of the UTSA Hypersonics laboratory for their contributions to this project. The authors would also like to thank Andrew Cervantes for his help with the TSP calibration efforts.

Conflicts of Interest

The authors declare no conflicts of interest. The funders had no role in the design of the study; in the collection, analyses, or interpretation of the data; in the writing of the manuscript; or in the decision to publish the results.

References

  1. Voland, R.T.; Huebner, L.D.; McClinton, C.R. X-43A Hypersonic Vehicle Technology Development. Acta Astronaut. 2006, 59, 181–191. [Google Scholar] [CrossRef]
  2. Bertin, J.J.; Cummings, R.M. Critical Hypersonic Aerothermodynamic Phenomena. Annu. Rev. Fluid Mech. 2006, 38, 129–157. [Google Scholar] [CrossRef]
  3. Laub, B.; Venkatapathy, E. Thermal Protection System Technology and Facility Needs for Demanding Future Planetary Missions. In Proceedings of the International Workshop Planetary Probe Atmospheric Entry and Descent Trajectory Analysis and Science, Lisbon, Portugal, 6–9 October 2003. [Google Scholar]
  4. Buck, G.M.; Watkins, A.N.; Danehy, P.M.; Inman, J.A.; Alderfer, D.W.; Dyakonov, A.A. Experimental Measurement of RCS Jet Interaction Effects on a Capsule Entry Vehicle. In Proceedings of the 46th AIAA Aerospace Sciences Meeting and Exhibit, Reno, Nevada, 7–10 January 2008. [Google Scholar]
  5. Kurits, I.; Lewis, M.J.; Hamner, M.P.; Norris, J.D. Development of a Global Heat Transfer Measurement System at AEDC Hypervelocity Wind Tunnel 9. In Proceedings of the 2007 22nd International Congress on Instrumentation in Aerospace Simulation Facilities, Pacific Grove, CA, USA, 10–14 June 2007. [Google Scholar] [CrossRef]
  6. Lee, J.J.; Dutton, J.C.; Jacobi, A.M. Application of Temperature-Sensitive Paint for Surface Temperature Measurement in Heat Transfer Enhancement Applications. J. Mech. Sci. Technol. 2007, 21, 1253–1262. [Google Scholar] [CrossRef]
  7. Hoffman, E.N.A. Effects of Surface Roughness on Shock-Wave/Boundary-Layer Interactions at Mach 7.2. Ph.D. Thesis, The University of Texas at San Antonio, San Antonio, TX, USA, 2023. [Google Scholar]
  8. Liu, T.; Ward, C.A.C.; Rubal, J.; Sullivan, J.P.; Schneider, S.P. Heat-Flux Measurements with Temperature-Sensitive Paint in a Mach-6 Quiet Tunnel. J. Spacecr. Rockets 2013, 50, 282–293. [Google Scholar] [CrossRef]
  9. Roghelia, A.; Olivier, H.; Egorov, I.; Chuvakhov, P. Correction to: Experimental Investigation of Görtler Vortices in Hypersonic Ramp Flows. Exp. Fluids 2017, 58, 169. [Google Scholar] [CrossRef]
  10. Ozawa, H.; Laurence, S.J. Experimental Investigation of the Shock-Induced Flow over a Wall-Mounted Cylinder. J. Fluid Mech. 2018, 849, 1009–1042. [Google Scholar] [CrossRef]
  11. Ozawa, H.; Laurence, S.J.; Schramm, J.M.; Wagner, A.; Hannemann, K. Fast-Response Temperature-Sensitive-Paint Measurements on a Hypersonic Transition Cone. Exp. Fluids 2015, 56, 1853. [Google Scholar] [CrossRef]
  12. Smith, C.D.; Kreth, P.A.; Schmisseur, J.D.; Strickland, G. Temperature-Sensitive Paint Measurements of Cylinder-Induced Shockwave-Boundary Layer Interaction on a 6-Degree Cone with Laminar Mach 7 Flow. In Proceedings of the AIAA SCITECH 2023 Forum, National Harbor, MD, USA, 23–27 January 2023. [Google Scholar]
  13. Grossir, G.; Pinna, F.; Bonuccif, G.; Regert, T.; Rambaud, P.; Chazot, O. Hypersonic Boundary Layer Transition on a 7 Degree Half-Angle Cone at Mach 10. In Proceedings of the AIAA AVIATION 2014—7th AIAA Theoretical Fluid Mechanics Conference, Atlanta, GA, USA, 16–20 June 2014. [Google Scholar]
  14. Maszkiewicz, S.A.; Gillespie, G.I.; Laurence, S.J. Experimental Investigation of Transitional, Sharp-Fin-Induced Shock-Wave/Boundary-Layer Interactions at Mach 6. In Proceedings of the AIAA Science and Technology Forum and Exposition, AIAA SciTech Forum 2022, San Diego, CA, USA, 3–7 January 2022. [Google Scholar]
  15. Liu, T.; Campbell, B.T.; Burns, S.P.; Sullivan, J.P. Temperature- and Pressure-Sensitive Luminescent Paints in Aerodynamics. Appl. Mech. Rev. 1997, 50, 227–246. [Google Scholar] [CrossRef]
  16. Rabek, J.F. Polymer Photodegradation: Mechanisms and Experimental Methods; Springer: Dordrecht, The Netherlands, 1995. [Google Scholar]
  17. Liu, T. Pressure- and Temperature-Sensitive Paints. In Encyclopedia of Aerospace Engineering; Wiley: Hoboken, NJ, USA, 2011. [Google Scholar]
  18. Morawetz, H. Mechanisms of Photophysical Processes and Photochemical Reactions in Polymers-Theory and Applications, by Jan F. Rabek, John Wiley & Sons, New York, 1987, 756 Pp. Price: $204.00. J. Polym. Sci. Polym. Lett. Ed. 1988, 26, 276. [Google Scholar] [CrossRef]
  19. Kose, M.K. Multi-Luminophore Coatings for Pressure Sensitive Pain Applications; University of Florida: Gainesville, FL, USA, 2005. [Google Scholar]
  20. Liu, X.; Shao, H.; Zhou, W.; Liu, Y.; Peng, D. Apparent Temperature in Temperature-Sensitive Paint Measurement and Its Effect on Surface Heat Flux Determination for Hypersonic Flows. Meas. Sci. Technol. 2020, 31, 125302. [Google Scholar] [CrossRef]
  21. Schramm, J.M.; Edzards, F.; Hannemann, K. Development of Ultra-Fast Temperature Sensitive Paints for Hypersonic High Speed Flows. In Proceedings of the 21st AIAA International Space Planes and Hypersonics Technologies Conference, Hypersonics 2017, Xiamen, China, 6–9 March 2017. [Google Scholar]
  22. Pasiliao, C.L.; Sytsma, M.J.; Neergaard, L.J.; Witeof, Z.D.; Trolier, J.W. Preliminary Aerothermal Structural Simulation. In Proceedings of the AIAA AVIATION 2014—14th AIAA Aviation Technology, Integration, and Operations Conference, Atlanta, GA, USA, 16–20 June 2014. [Google Scholar]
  23. Klock, R.J.; Cesnik, C.E.S. Aeroelastic Stability of High-Speed Cylindrical Vehicles. In Proceedings of the 58th AIAA/ASCE/AHS/ASC Structures, Structural Dynamics, and Materials Conference, Grapevine, TX, USA, 9–13 January 2017. [Google Scholar]
  24. Blocher, B.L.; Panigrahi, A.; Eitner, M.A.; Villa, B.E.D.; Sirohi, J.; Clemens, N.T. Pressure Field and Mean Deflection Estimation of a Hypersonic Vehicle Model in Mach 5 Flow. In Proceedings of the AIAA SCITECH 2024 Forum, Orlando, FL, USA, 8–12 January 2024. [Google Scholar] [CrossRef]
  25. Elizondo, V.D.; Dhanagopal, A.; Combs, C.S. Fast-Responding Pressure-Sensitive Paint Measurements of the IC3X at Mach 7.2. Aerospace 2023, 10, 890. [Google Scholar] [CrossRef]
  26. Willems, J.A.; McNamara, J.J.; Reasor, D.A. Coupled Fluid-Thermal Response in the Gap Region of a High-Speed Control Surface. In Proceedings of the AIAA AVIATION 2023 Forum, San Diego, CA, USA, 12–16 June 2023. [Google Scholar]
  27. Dhanagopal, A.; Strasser, N.S.; Andrade, A.; Hoffman, E.N.A.; Combs, C.S. Global Surface Temperature Distribution on the Initial Concept 3.X Vehicle at Mach 7. In Proceedings of the AIAA SciTech Forum and Exposition, Orlando, FL, USA, 8–12 January 2024. [Google Scholar]
  28. Bashor, I.P.; Hoffman, E.; Gonzalez, G.; Combs, C.S. Design and Preliminary Calibration of the Utsa Mach 7 Hypersonic Ludwieg Tube. In Proceedings of the AIAA Aviation 2019 Forum, Dallas, TX, USA, 17–21 June 2019. [Google Scholar]
  29. Hoffman, E.N.A.; Lalonde, E.J.; Garcia, M.; Valeria Delgado, E.; Chen, I.; Bilbo, H.A.; Combs, C.S. Characterization of the UTSA Mach 7 Ludwieg Tube. In Proceedings of the AIAA Science and Technology Forum and Exposition, AIAA SciTech Forum 2022, San Diego, CA, USA, 3–7 January 2022. [Google Scholar]
  30. Hoffman, E.N.A.; Valeria, D.E.; Garcia, M.; Lalonde, E.J.; Rodriguez, J.M.; Combs, C.S. Preliminary Testing of the UTSA Mach 7 Ludwieg Tube. In Proceedings of the AIAA Aviation and Aeronautics Forum and Exposition, AIAA AVIATION Forum 2021, Virtual Event, 2–6 August 2021. [Google Scholar]
  31. Hoffman, E.N.A.; Lalonde, E.J.; Andrade, A.; Chen, I.; Bilbo, H.A.; Combs, C.S. Flow Characterization of the UTSA Hypersonic Ludwieg Tube. Aerospace 2023, 10, 463. [Google Scholar] [CrossRef]
  32. Witeof, Z.D.; Neergaard, L.J. Initial Concept 3.0 Finite Elemental Model Definition; Air Force Research Laboratory: Dayton, OH, USA, 2014. [Google Scholar]
  33. Nakakita, K.; Osafune, T.; Asai, K. Global Heat Transfer Measurement in a Hypersonic Shock Tunnel Using Temperature-Sensitive. In Proceedings of the 41st Aerospace Sciences Meeting and Exhibit, Reno, Nevada, 6–9 January 2003. [Google Scholar]
  34. Martinez Schramm, J.; Hannemann, K.; Ozawa, H.; Beck, W.; Klein, C. Development of Temperature Sensitive Paints in the High Enthalpy Shock Tunnel Göttingen, HEG. In Proceedings of the 8th European Symposium on Aerothermodynamics for Space Vehicles, Lisbon, Portugal, 2–6 March 2015. [Google Scholar]
  35. Nagai, H.; Nagayama, T.; Tanno, H.; Komuro, T. Boundary-Layer Transition Detection at High-Enthalpy Flow Using Temperature-Sensitive Paint. In 31st International Symposium on Shock Waves 1; Springer: Cham, Switzerland, 2019. [Google Scholar]
  36. Hubner, J.P.; Carroll, B.F.; Schanze, K.S.; Ji, H.F.; Holden, M.S. Temperature- and Pressure-Sensitive Paint Measurements in Short-Duration Hypersonic Flow. AIAA J. 2001, 39, 654–659. [Google Scholar] [CrossRef]
  37. Dhanagopal, A.; Williamson, C.; LaLonde, E.J.; Gutierrez, S.; Andrade, A.; Delgado, V.; Combs, C.S. High-Speed Pressure Sensitive Paint Measurements of the Initial Concept 3.X Vehicle at Mach 7. In Proceedings of the AIAA SCITECH 2023 Forum, National Harbor, MD, USA, 23–27 January 2023. [Google Scholar]
  38. Schairer, E.T.; Mehta, R.D.; Olsen, M.E. Effects of Pressure-Sensitive Paint on Experimentally Measured Wing Forces and Pressures. AIAA J. 2002, 40, 1830–1838. [Google Scholar] [CrossRef]
  39. Cervantes, A.; Combs, C.S. Calibrating Fast Responsive Temperature Sensitive from 0 to 100 Degrees Celsius. In Proceedings of the AIAA AVIATION 2024 Forum, Las Vegas, NV, USA, 29 July–2 August 2024. [Google Scholar]
  40. Smith, C.D.; Kreth, P.A.; Schmisseur, J.D.; Strickland, G. Characterization of Temperature Sensitive Paint for Application in Hypersonic Ludwieg Tubes at the University of Tennessee. In Proceedings of the AIAA Science and Technology Forum and Exposition, AIAA SciTech Forum 2022, San Diego, CA, USA, 3–7 January 2022. [Google Scholar]
  41. Egami, Y.; Matsuda, Y.; Yamaguchi, H.; Niimi, T. Property Changes of Temperature-Sensitive Paint Immobilized in Acrylic Polymer Matrices. Sens. Actuators B Chem. 2014, 195, 677–681. [Google Scholar] [CrossRef]
  42. Elizondo, V.D. High-Speed Pressure-Sensitive Paint Measurements of a Hypersonic Vehicle. Ph.D. Thesis, The University of Texas at San Antonio, San Antonio, TX, USA, 2022. [Google Scholar]
  43. Anderson, J.D. Hypersonic and High-Temperature Gas Dynamics, 3rd ed.; American Institute of Aeronautics & Astronautics: Reston, VA, USA, 2019. [Google Scholar]
  44. Kleine, H.; Grönig, H. Color Schlieren Methods in Shock Wave Research. Shock Waves 1991, 1, 51–63. [Google Scholar] [CrossRef]
  45. Hoffman, E.N.; Kendhammer, D.M.; LaLonde, E.J.; Andrade, A.; Combs, C.S. Effects of Distributed Roughness on Shock-Wave/Boundary-Layer Interactions at Mach 7.2. In Proceedings of the AIAA SCITECH 2023 Forum, National Harbor, MD, USA, 23–27 January 2023. [Google Scholar]
  46. Shumway, N.M.; Laurencey, S.J. Methods for Identifying Key Features in Schlieren Images from Hypersonic Boundary-Layer Stability Experiments. In Proceedings of the 53rd AIAA Aerospace Sciences Meeting, Kissimmee, FL, USA, 5–9 January 2015. [Google Scholar]
  47. Laurence, S.J.; Wagner, A.; Hannemann, K. Schlieren-Based Techniques for Investigating Instability Development and Transition in a Hypersonic Boundary Layer. Exp. Fluids 2014, 55, 1782. [Google Scholar] [CrossRef]
  48. Hill, J.L.; Benitez, E.K.; Borg, M.P.; Reeder, M.F. Global Reconstruction of Hypersonic Boundary Layer Disturbance Modes. In Proceedings of the AIAA SCITECH 2023 Forum, National Harbor, MD, USA, 23–27 January 2023. [Google Scholar]
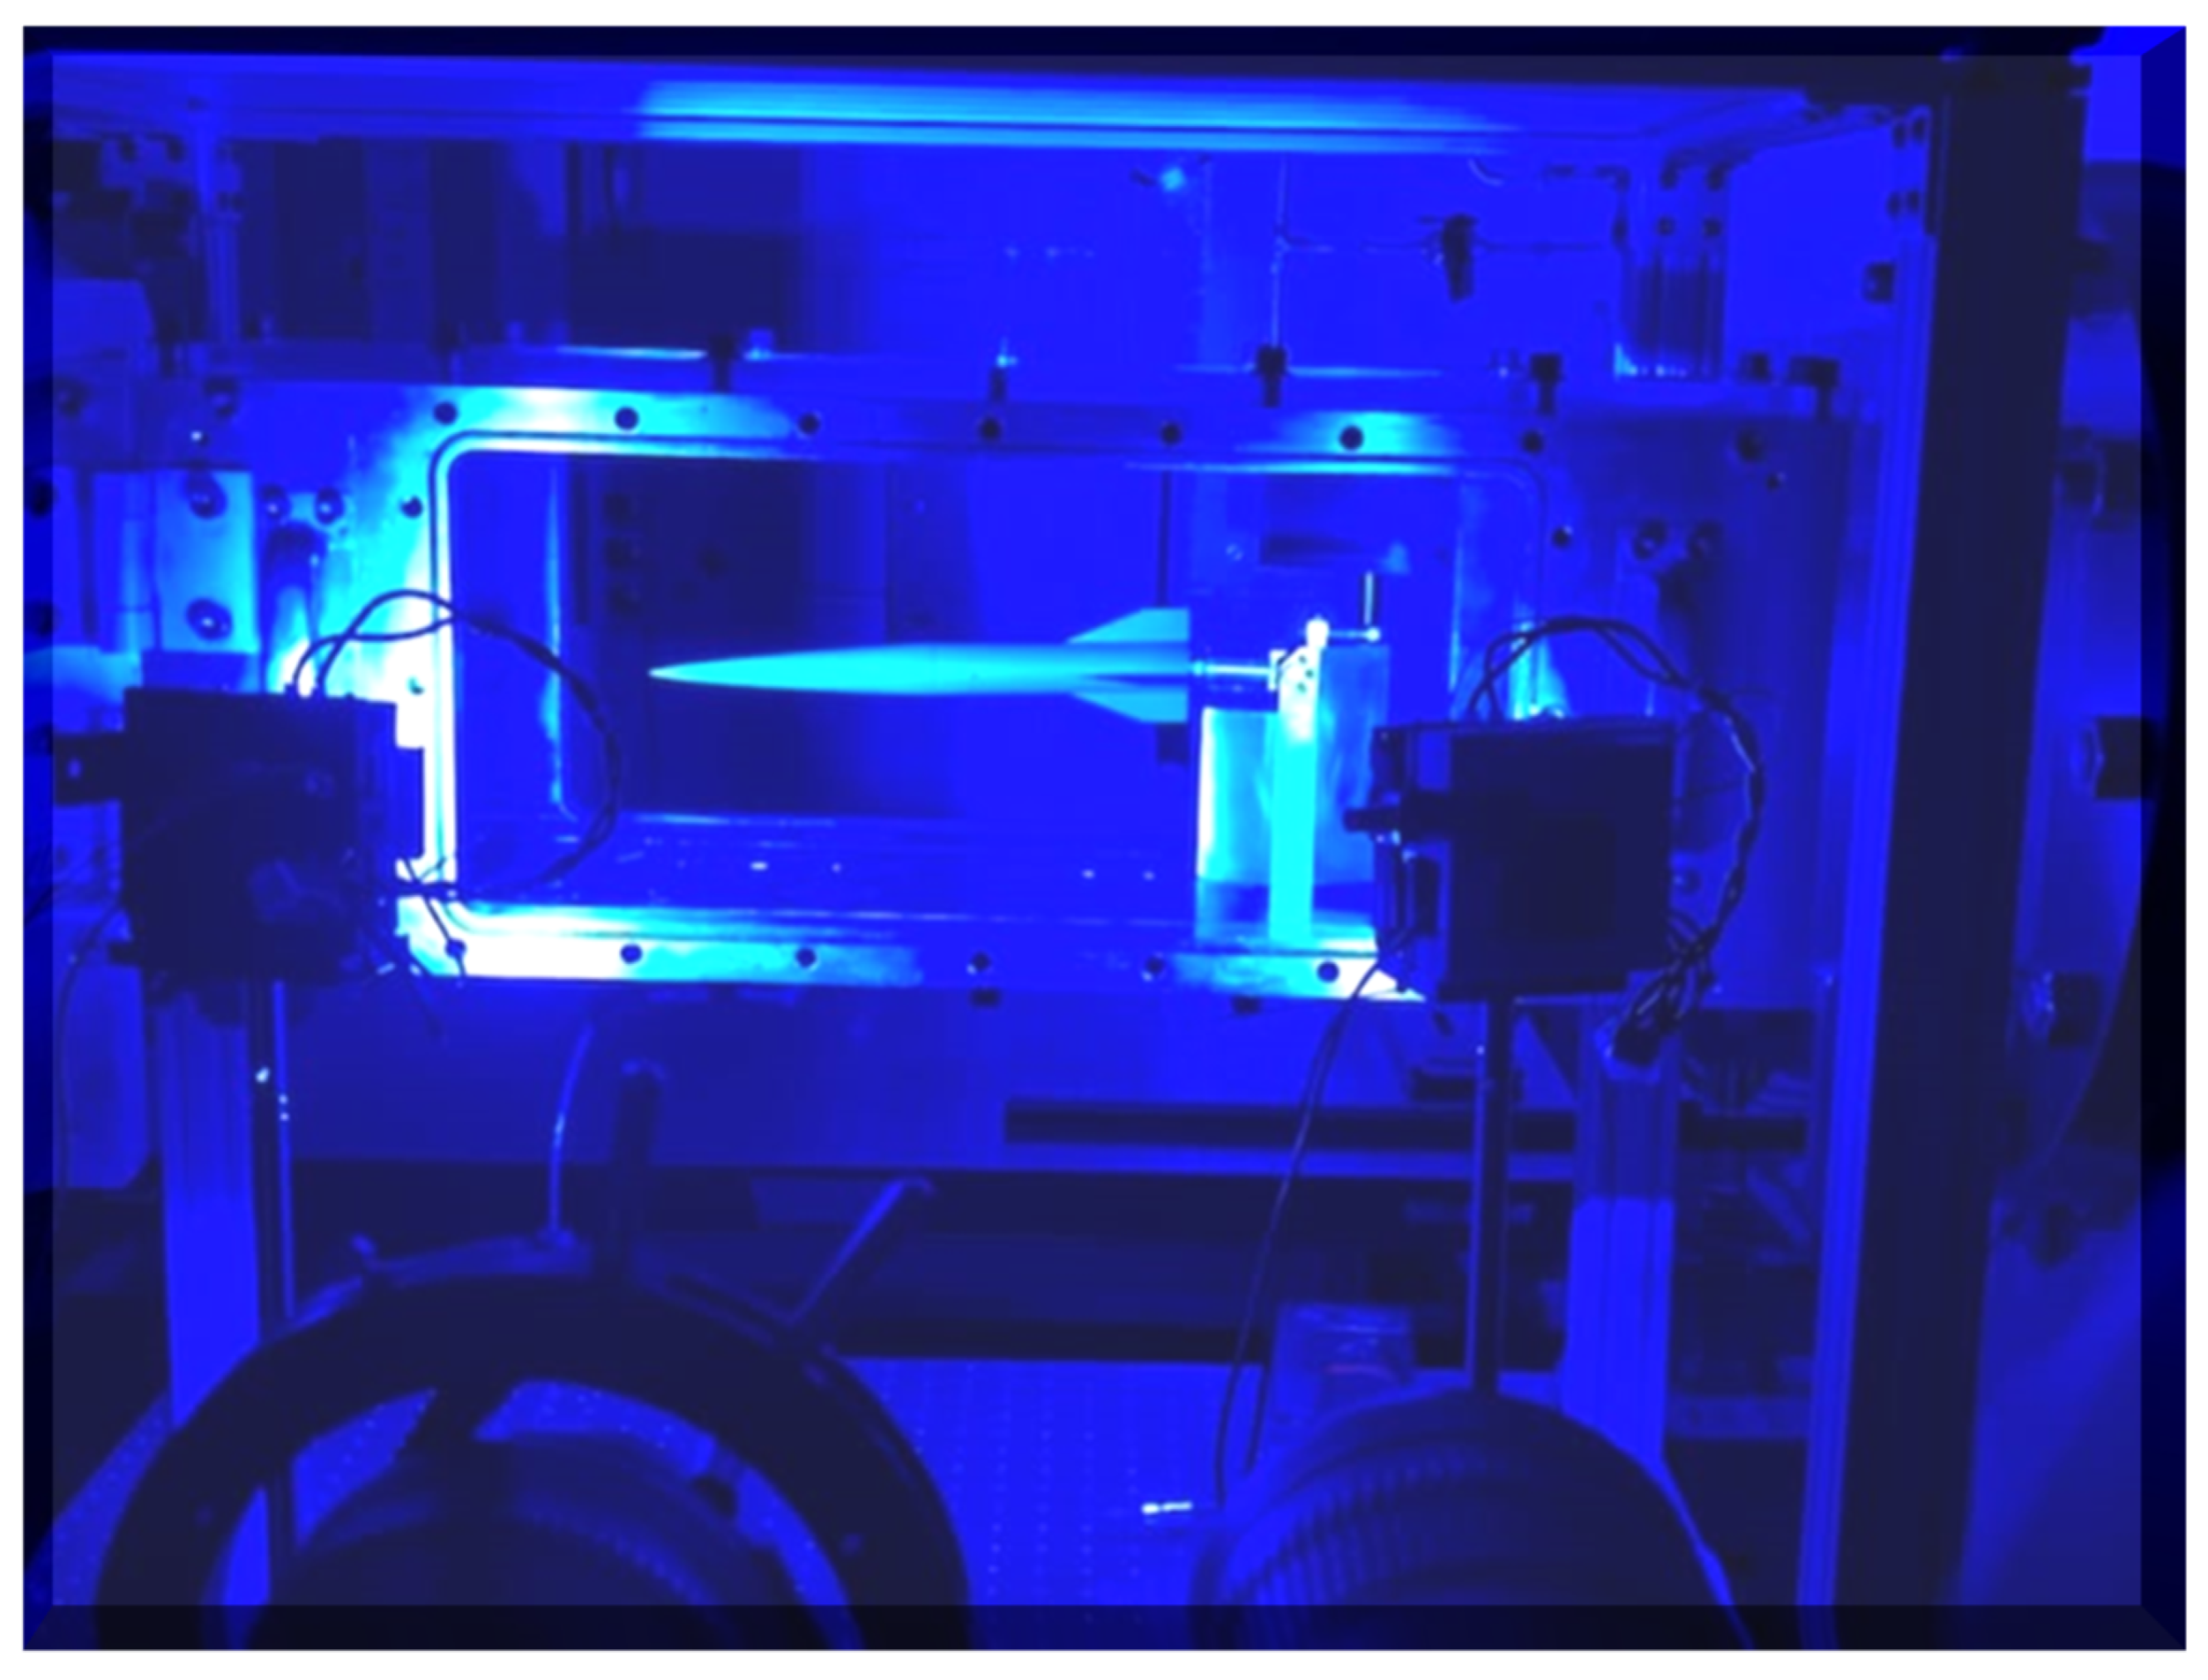
Figure 1. UTSA Mach 7 Ludwieg tube.
Energies 17 02916 g001
Figure 2. IC3X model geometry.
Energies 17 02916 g002
Figure 3. Painted IC3X model mounted in the test section.
Energies 17 02916 g003
Figure 4. TSP experimental setup.
Energies 17 02916 g004
Figure 5. IC3X field of view.
Energies 17 02916 g005
Figure 6. Experimental setup (top) and schematic diagram (bottom) for TSP [39].
Energies 17 02916 g006
Figure 7. Static calibration curve.
Energies 17 02916 g007
Figure 8. Instantaneous temperature distribution at 0° AoA.
Energies 17 02916 g008
Figure 9. Instantaneous temperature distribution at 5° AoA.
Energies 17 02916 g009
Figure 10. Mean temperature distribution at 0° and 5° AoA.
Energies 17 02916 g010
Figure 11. Standard deviation temperature maps for IC3X at 0° and 5° AoA.
Energies 17 02916 g011
Figure 12. Temporal variations in temperature for 0° and 5° AoA.
Energies 17 02916 g012
Figure 13. Virtual temperature sensors denoted by pixel squares for 0° and 5° AoA.
Energies 17 02916 g013
Figure 14. Mean heat flux distribution at 0° and 5° AoA.
Energies 17 02916 g014
Figure 15. Mean convective heat coefficient distribution at 0° and 5° AoA.
Energies 17 02916 g015
Figure 16. Mean Stanton number at 0° and 5° AoA.
Energies 17 02916 g016
Figure 17. Mean modified Stanton number along x d for 0° and 5° AoA.
Energies 17 02916 g017
Figure 18. Comparison of modified Stanton number along x d for 0° AoA with data from Liu et al. [8] on the 7° cone at Mach 6.
Energies 17 02916 g018
Figure 19. Schlieren of 0° AoA IC3X forebody at Mach 7.2.
Energies 17 02916 g019
Figure 20. Schlieren of 0° AoA IC3X aft body at Mach 7.2.
Energies 17 02916 g020
Figure 21. Instantaneous temperature distributions and Schlieren at 0° AoA.
Energies 17 02916 g021
Figure 22. Error propagation in temperature and convective heat transfer coefficient at 0° AoA.
Energies 17 02916 g022
Table 1. Test conditions.
Flow ParameterCondition
Test GasDry Air
Stagnation Pressure1.8 ± 0.02 MPa
Test Section Pressure0.34 ± 0.0002 kPa
Mach Number7.2 ± 0.2
Test Time (Steady State)80 ms
Driver Tube Temperature582 ± 10 K
Initial Model Surface Temperature295 ± 2 K
Freestream Unit Reynolds Number7 × 106 m−1
Table 2. Model properties.
PropertySI Units
Body Length25.4 cm
Body Diameter2.54 cm
Wingspan5.72 cm
Mass120 g
Resin Flexure Strength28 MPa
Resin Extension Strength24 MPa
Table 3. TSP composition.
ComponentFunctionAmount
Ru(phen)Luminophore100 mg
EthanolSolvent or thinner28 mL
Polyacrylic AcidBinder13.68 mL (19.767 g)
Table 4. Schlieren experimental conditions.
TestModelAcquisition Rate [kHz]Po [MPa]To
[K]
Re
(×106 m−1)
1Ogive 0°3001.832721
2Ogive 0°3151.832721
3Fin 0°3151.832721
4Fin 0°3151.832721
Table 5. Sources of error.
CauseUncertainty
Pixel Noise±1.26%
Calibration Constant A±0.293
Calibration Constant B±0.385
Reference Temperature±2 K
Table 6. Error propagation.
ParameterAvg. ΔT%Average Flux%Average H%St%
Pixel Measurement±60±6±0.3
Calibration Const A±30±3±0.2
Calibration Const B±0.3±2±2±2
Ref Temp±200±200
Cumulative±22±2±22±2
Table 7. Summary of results from TSP experiments.
VariableAngle of AttackValueUncertainty
Average Change in Surface Temperature
ΔT (K)
6–34±2.15 K
11–44
Average Change in Surface Temperature
at the Stagnation Point ΔT (K)
39±2.15 K
43
Stagnation Point Heat Flux
q (W/m2)
1.93 × 10⁴±100 (W/m2)
4.77 × 10⁴
Average Heat Flux
q (W/m2)
1.26 × 10³±100 (W/m2)
1.30 × 10³
Convective Heat Transfer Coefficient
H (W/m2/K)
84.4±34.2 (W/m2/K)
101.9
Average Modified Stanton Number
St (×10−6)
0.14–46±6.71 × 10⁻⁸
0.18–54
Disclaimer/Publisher’s Note: The statements, opinions and data contained in all publications are solely those of the individual author(s) and contributor(s) and not of MDPI and/or the editor(s). MDPI and/or the editor(s) disclaim responsibility for any injury to people or property resulting from any ideas, methods, instructions or products referred to in the content.