Highlights
What are the main findings?
- The safety performance of batteries in laboratory testing driving conditions of electric vehicles is important.
- The safety issues of batteries during laboratory experiments should not be underestimated.
What is the implication of the main finding?
- Lithium iron phosphate battery exhibited good performance in maintaining voltage plateau and discharge voltage stability.
- Nickel cobalt manganese ternary lithium battery exhibited excellent energy density and long-term endurance.
Abstract
High-voltage heat release from batteries can cause safety issues for electric vehicles. Relevant scientific research work is carried out in the laboratory. The battery safety of laboratory experiments should not be underestimated. In order to evaluate the safety performance of batteries in the laboratory testing of driving conditions of electric vehicles, this paper simulated and compared the discharge characteristics of two common batteries (lithium iron phosphate (LFP) battery and nickel–cobalt–manganese (NCM) ternary lithium battery) in three different operating conditions. The operating conditions are the NEDC (New European Driving Cycle), WLTP (World Light Vehicle Test Procedure) and CLTC-P (China light vehicle test cycle) for normal driving of electric vehicles. LFP batteries have a higher maximum voltage and lower minimum voltage under the same initial voltage conditions, with a maximum voltage difference variation of 11 V. The maximum current of WLTP is significantly higher than NEDC and CLTC-P operating conditions (>20 A). Low current discharge conditions should be emulated in teaching simulation and experiments for safety reasons. The simulation data showed that the LFP battery had good performance in maintaining the voltage plateau and discharge voltage stability, while the NCM battery had excellent energy density and long-term endurance.
1. Introduction
The widespread application of new energy vehicles has attracted much attention to their stability and safety [1]. Due to the high energy density and long service life of LFP and NCM batteries, they are widely used in electric vehicles, extended-range electric vehicles and hybrid vehicles [2]. Previous research hotspots have focused on safety issues during the charging process, while many safety issues occur during the discharge process in reality [3]. A lot of universities are also actively promoting the construction of battery-related courses and laboratories; the safety issues of university laboratories cannot be ignored.
Rapid charging and discharging generate a large amount of heat, which need cooling measures to ensure safety [4]. Based on the fast-self-discharge detection method of lithium batteries [5], the discharge data can achieve accurate battery capacity estimation [6]. Lithium batteries’ characteristics were affected by discontinuous deposition and electrolyte degradation during the discharge process [7]. The self-discharge prediction of lithium-ion batteries can also be carried out with an Improved Support Vector Machine method [8], which used the experiment data of 20% initial State of Charge (SOC) to accurately predict the self-discharge voltage drop of lithium-ion batteries. The discharge rate had an impact on the temperature field of the battery [9]. Deep transfer learning was applied to drive the capacity estimation of lithium-ion batteries with partial fragments of charging/discharging data [10]. The deep discharge characteristics and control strategies can also optimize the lifespan and safety issues of electric vehicle batteries [11].
Lai et al. evaluated the thermal hazard of 18,650 lithium-ion batteries at different discharge rates (1C, 2C, 3C and 4C) [12]. The discharge capacity and discharge energy values were 3.117 Ah and 9.021 Wh during the 4C discharge rate. The discharging rates of 1C, 2C and 3C were suitable in terms of thermal stability and safety. Wang et al. investigated the mechanism of deterioration of the wettability of lithium-ion battery separators caused by low-temperature discharge, and found that low-temperature discharge current can lead to performance degradation [13]. Zhang applied a predictive model to measure the thermal behavior of lithium battery modules under high charging and discharging rates [14]. The maximum temperature at 5C was 334.32 K, which was beyond the safe working temperature range of Li-ion batteries. Khan et al. used a battery thermal management system with metal phase change materials to test the situation of fast charging/discharging [15]. The research results indicated that rapid discharge requires a more optimized thermal management system.
Hemavathi evaluated the lithium-ion discharge performance with high current at 25 °C and 60 °C [16]. The experimental results exhibited a better cooling effect with a 33% reduction in temperature rise at 3C battery discharge rate at 25 °C. Tsafack et al. investigated the effect of a high constant charging current rate on the charging/discharging efficiency [17]. The battery efficiency was between 62% and 82%. Ouyang et al. tested the sensitivity of lithium-ion batteries with different capacities to overcharging/discharging [18]. Considering the serious damage of overcharge and over-discharge on batteries, it was critical to avoid overcharge and over-discharge, especially for high-capacity batteries. Li et al. revealed the mechanism of stress rebound during the discharge process of lithium-ion batteries [19]. The stress high point moves forward and the highest point value decreases as the battery ages.
Due to the high discharge voltage and current of electric vehicles, conducting experimental research directly will inevitably cause unpredictable safety issues. Therefore, many discharge studies used simulation models and a combination of simulation and experimentation. Meng et al. modeled the discharge voltage of lithium-ion batteries through orthogonal experiments under conditions below zero degrees Celsius [20]. The maximum value of the relative errors for the parameters was 12.65%, which proved the effectiveness of the model. Yao et al. used data-driven battery capacity estimation based on partial discharge capacity curves of lithium-ion batteries [21], and Zhang employed a multi-model fusion method based on image encoding of charging voltage and temperature data for predicting the health status of lithium-ion batteries [22]. Shao et al. proposed a method for predicting the discharge capacity of lithium-ion batteries based on a simplified electrochemical model aging mechanism [23]. The developed discharge capacity prediction method was verified at separate stages for batteries at 1C, 2C and 3C, with the average relative error of the full life cycle being no more than 4%. Guo et al. proposed a data model fusion method for the online power state estimation of lithium-ion batteries under high discharge rates in electric vehicles [24]. According to the experimental verification results, the proposed novel data model fusion method can provide high state of power estimation accuracy in a prediction window of up to 120 s, with the mean absolute error and root mean square error being less than 5% and 8%. He et al. used an electrochemical thermal model to numerically simulate the performance of cylindrical lithium-ion batteries during discharge [25]. Although chemical models had good predictive performance, the computational cost was high (approximately 154 h).
Although the above studies have evaluated the performance and safety of discharge with different methods [26], the research subjects are all single types of batteries, leading to a lack of performance comparisons between different types of batteries (especially commonly used lithium batteries). In response to this deficiency, this study simulates and compares the discharge performance of LFP and NCM lithium batteries under three operating conditions of NEDC, WLTP and CLTC-P for predictions in teaching experiments of safety simulation under different operating conditions.
2. The Principle of Battery Charging and Discharging and Its Equivalent Circuit Model
2.1. Principles of Battery Charging and Discharging
Lithium batteries are composed of positive electrodes, negative electrodes, an electrolyte, a separator and a battery casing. There is a difference in lithium-ion concentration and electrochemical potential between positive and negative electrode materials, which causes lithium ions to move between the positive and negative electrodes. Electrons cannot move in the electrolyte due to the barrier effect of the battery separator on electrons. The electron transfer moves towards the external circuit, which generates current and stores the chemical energy of the battery.
During the charging process of the lithium battery, the external power potential can separate the lithium ions and electrons in the positive electrode. Lithium ions move freely in the electrolyte to the negative electrode of the battery, and can pass through the battery separator and re-embed into the negative electrode. Free electrons can come from the external circuit to the negative electrode. When the lithium battery is discharged, lithium ions detach from the negative electrode material on the battery. Due to the difference in electrolyte concentration on both sides of the separator, lithium ions will dissociate from the negative electrode of the battery and embed into the positive electrode material. Charge-compensating electrons cannot pass through the diaphragm, and can only move through the external circuit to form the discharge current.
2.2. Equivalent Circuit Model of Lithium Batteries
The equivalent circuit model applies circuit components to describe the working characteristics of lithium batteries. The physical meaning is clear with a simple mathematical expression, which has a wide range of applications in battery simulation research. Common equivalent circuit models for lithium batteries include the PNGV (Partnership for a New Generation of Vehicles) model (a nonlinear battery equivalent model), the internal resistance model, the Thevenin model, the second-order Thevenin model and the multi-stage Thevenin model.
- (1)
- Thevenin model
The Thevenin model is based on the Thevenin theorem, which adds an RC loop to the internal resistance model to simulate the dynamic characteristics inside the battery to simulate the planned characteristics of the battery. The resistance is divided into the ohmic internal resistance and polarization internal resistance, which represent the chemical reactions inside the battery and the output indicators under working conditions. The circuit structure is given in Figure 1a.
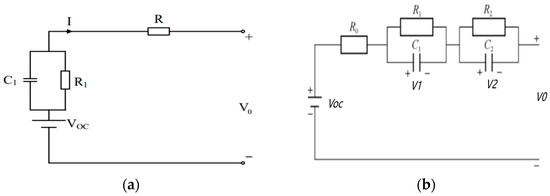
Figure 1.
Thevenin model and second-order Thevenin circuit model. (a) Thevenin circuit model. (b) Second-order Thevenin circuit model.
The circuit expression of the Thevenin model is displayed in Equation (1).
where Q0 is the rated capacity of the battery, Ah. C1 is the polarization capacitance, pF. R1 is the polarization resistance, Ω. V1 is the voltage of the RC, V.VOC is the open circuit voltage, V.
V0 is the battery terminal voltage, which can be calculated by Equation (2).
where R is the ohmic resistance, Ω. I is the current, A.
- (2)
- Second-order Thevenin model
The second-order Thevenin model is based on the Thevenin model and adds an RC loop as a manifestation of the battery concentration difference phenomenon, which can present the internal resistance characteristics of the battery. Figure 1b is the second-order Thevenin equivalent circuit model.
According to Kirchhoff’s voltage law, the second-order Thevenin model circuit can be described as Equation (3).
V0, V1 and V2 are given in Equation (4).
where C2 is the concentration polarization capacitance, pF. R1 is the electrochemical polarization resistance of batteries, Ω. R2 is the concentration resistance, Ω.
SOC can be defined in Equation (5).
where SOC(t) is the current battery level, Ah. SOC(0) is the initial charge of the battery, Ah. μ is the coulombic efficiency. CN is the maximum available capacity of the current battery, Ah.
The battery model needs to accurately simulate the working principle of the battery to describe the internal characteristics of the battery, which should also consider the complexity of parameter identification. The internal resistance model is too simple and can only provide a simple description of battery characteristics, while the model’s description of polarization characteristics is not comprehensive enough. There is a large error under constant current conditions in the PNGV. Multi-order Thevenin models can lead to a decrease in the computational speed of simulation models. This study chooses the Thevenin equivalent circuit model with the second-order RC equivalent circuit model, considering the accuracy and simulation time.
3. Battery Model and Electric Vehicle Model Establishment
3.1. Establishment and Verification of Lithium Battery Simulation Model
Based on the analysis and verification of the equivalent model of lithium batteries in the previous text, the mathematical model of the battery is displayed in Figure 2.
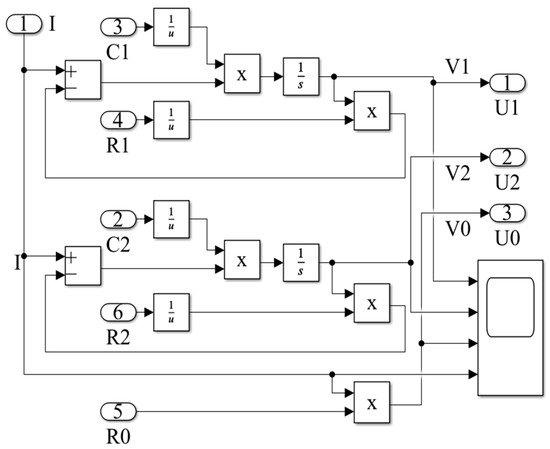
Figure 2.
Lithium battery mathematical model for simulation.
The input current is the current input to the lithium battery cell, and the above mathematical model is a single-cell model of a lithium battery. As shown in Figure 2, these numbers 1–6 are the input and output ports of the signal in MALTAB/Simulink, which are the components that come with the software. The physical quantities I represents the input current, U0, U1 and U2 represent output voltages of different parts. Due to the presence of Ohmic resistance (R0), polarization resistance (R1), polarization capacitance (C1), concentration resistance (R2) and concentration capacitance (C2), it is necessary to carry out measurements based on the actual usage of the battery and identify model parameters through calculation in the second-order Thevenin equivalent circuit simulation.
3.2. Establishment and Parameter Identification of a Model for LFP
Due to limitations in conditions, it is not possible to actually measure the parameters during battery discharge. The experiment data obtained by the authors in references [27,28] were used. Table 1 shows the basic parameters of a single LFP battery.

Table 1.
Basic parameters of a single LFP battery.
The relationship between the SOC and open circuit voltage is very important during the period of battery discharge. Due to the mathematical relationship between the open circuit voltage and battery SOC of the experiment in reference [25], this study obtained the quantitative relationship between LFP battery SOC and open circuit voltage (OCV) through real measurements, as given in Table 2.

Table 2.
The discrete data of LFP battery SOC and OCV.
The discrete data of Table 2 do not intuitively show the value of open circuit voltage at any point in the SOC, which is not conducive to the estimation research of SOC in the following text. Figure 3 is the relationship between the OCV and SOC of the LFP and NCM batteries.
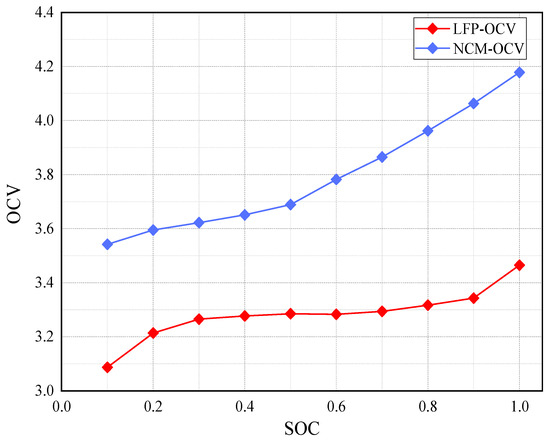
Figure 3.
The relationship between OCV and SOC of the LFP and NCM batteries.
From the relationship curve in Figure 3, it can be seen that the slope of the curve is the highest at the beginning and end of charging with great voltage changes. When the SOC is between 0.25 and 0.88, the OCV does not change much, which complies with the process of battery voltage changes. Based on the above data, the least squares method is used to fit the data with a fitting order of n = 6. The relationship of the LFP battery is obtained as Equation (6).
Table 3 is the identification of parameters for the LFP battery.

Table 3.
Identification of parameters for LFP battery.
Figure 4 is the identification of parameter contrast for the LFP and NCM batteries.
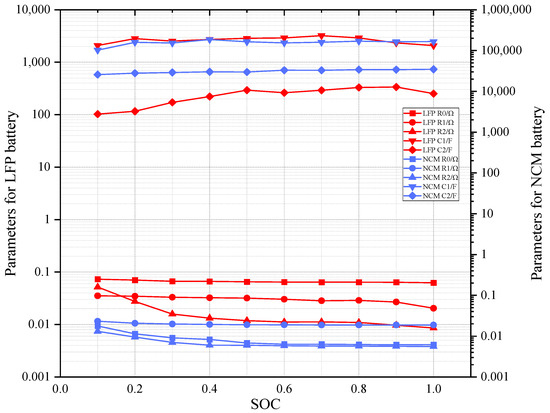
Figure 4.
Identification of parameter contrast for LFP and NCM batteries.
The above data were imported into Simulink to construct a model of an LFP battery pack, which is given in Figure 5. These numbers 1-4 are the input and output ports of the signal, which are the components that come with the software. I_in is the input current; SOC is an output quantity used to monitor the battery state of charge. Bat_cap_Ah is the battery capacity; Bat_terminal_volt1 is the battery terminal voltage.
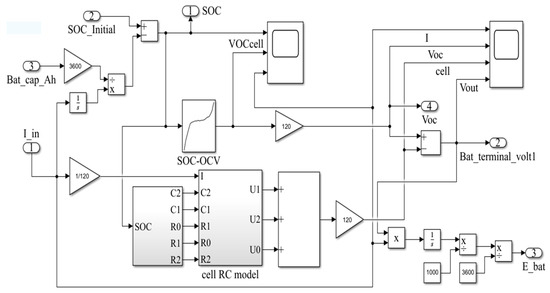
Figure 5.
LFP battery pack model.
3.3. Establishment and Parameter Identification of NCM Battery Model
The basic parameters of the NCM battery are listed in Table 4.

Table 4.
The basic parameters of a single NCM battery.
The relationship between the NCM battery SOC and OCV, identified through real measurements, is given in Table 5.

Table 5.
The relationship between NCM battery SOC and OCV.
Based on the above data, the least squares method is used to fit the data with a fitting order of n = 6. The relationship of the NCM battery is obtained as Equation (7).
Table 6 is the identification of parameters for the NCM battery.

Table 6.
Identification of parameters for NCM battery.
The above data were imported into Simulink to construct a model of an NCM battery pack, which is given in Figure 6.
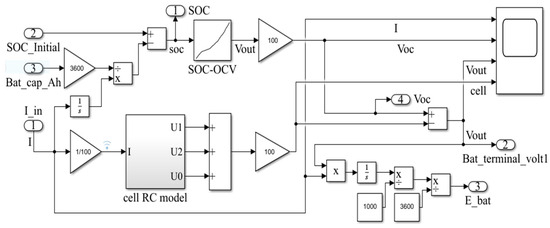
Figure 6.
NCM battery pack model.
3.4. Basic Parameters of Electric Vehicles
This paper used the model data and their basic parameters are shown in Table 7.

Table 7.
Basic parameters of electric vehicles of teaching experiment.
This study applied the Matlab/Simulink simulation software (2018) to establish the electric vehicle model, which included an electric vehicle, battery pack, motor, transmission and electric drive system. Figure 7 is the Simulink model of an electric vehicle.
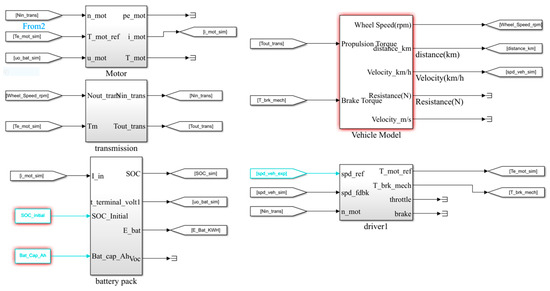
Figure 7.
Simulation diagram of electric vehicle model of Simulink.
4. Results and Analysis of Electric Vehicle Battery Discharge under Different Operating Conditions
This study adopts the NEDC, WLTP, and CLTC-P operating conditions. The initial SOC of the battery was set to 0.8 to test the discharge characteristics of the battery with the above three operating conditions.
4.1. NEDC Operating Condition
Figure 8 is the voltage time plots of two types of batteries under NEDC operating conditions. According to the analysis of output voltage, the amplitude of the output voltage variation of the two batteries shows a periodic variation under the NEDC operating condition, which is related to the speed of the operating condition.
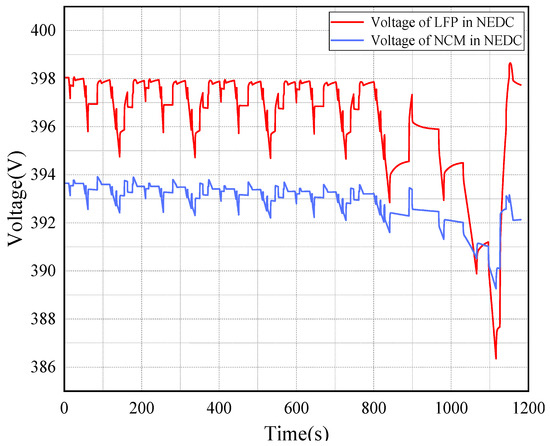
Figure 8.
Voltage of 2 types of batteries under NEDC operating conditions.
The voltage change trend is very similar, but the change values are different. When the LFP battery is in a stationary state, it has the highest voltage. But the output voltage of the NCM battery shows a significant downward trend.
Figure 9 is the SOC trend of the LFP and NCM batteries under NEDC operating conditions. The decrease trend of the SOC in both batteries is consistent during the operation of the NEDC. The magnitude of SOC decrease in the LFP battery is even greater.
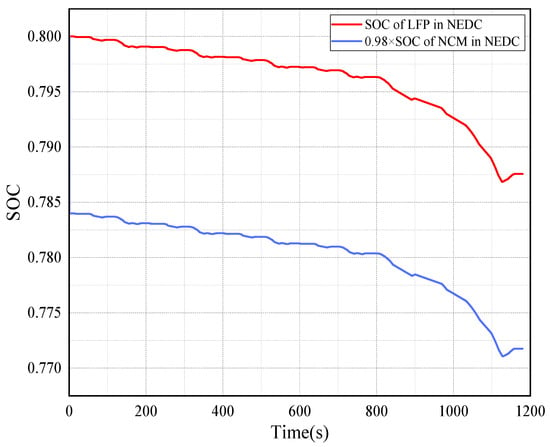
Figure 9.
The SOC trend of LFP and NCM battery under NEDC operating conditions.
4.2. WLTP Operating Condition
Figure 10 is the voltage plots of the LFP and NCM batteries under WLTP operating conditions. The curve of WLTP voltage change is completely different from that of the operating condition of the NEDC, the contrast of which is shown in Figure 9 and Figure 11. The voltage of both types of batteries shows an overall downward trend, but the magnitude of the decrease is not the same. The voltage decrease of the LFP battery is more pronounced at the end of the working condition. The voltage decrease value of the LFP battery reaches 13 V.
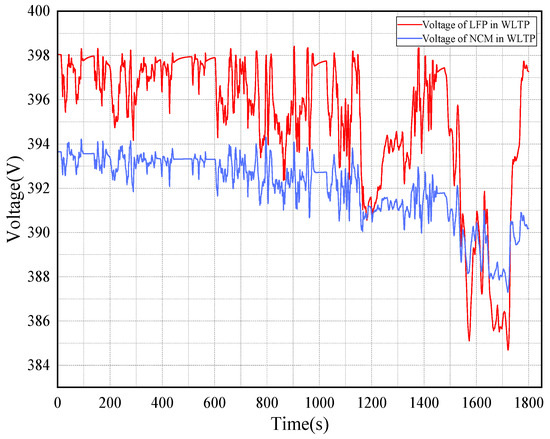
Figure 10.
Voltage of 2 types of batteries under WLTP operating conditions.
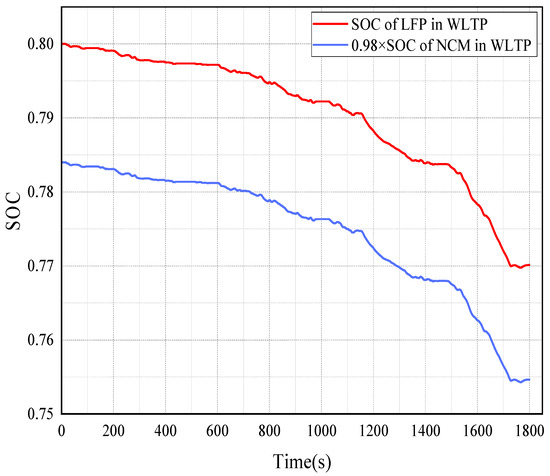
Figure 11.
The SOC trend of LFP and NCM batteries under WLTP operating conditions.
Figure 11 is the SOC trend of the LFP and NCM batteries under WLTP operating conditions. The SOC variation patterns of the two batteries are different from those of the NEDC. The decrease in the SOC of the LFP battery is greater than that of the NCM battery.
4.3. CLTC-P Operating Condition
When the operating under CLTC-P conditions, the highest voltage of both batteries after operation is lower than the conditions of NEDC and WLTP due to frequent changes in speed and significant changes in battery output voltage. The horizontal comparison of the LFP and NCM batteries is consistent with the above conditions, as given in Figure 12.
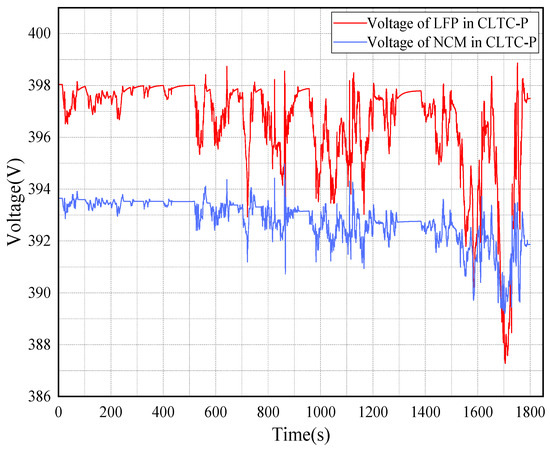
Figure 12.
Voltage of 2 types of batteries under CLTC-P operating conditions.
Figure 13 is the SOC trend of the LFP and NCM batteries under CLTC-P operating conditions.
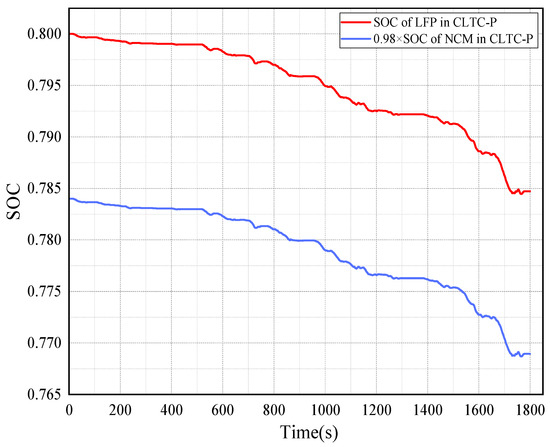
Figure 13.
The SOC trend of LFP and NCM batteries under CLTC-P operating conditions.
Under the CLTC-P operating condition, the SOC variation amplitude of the LFP and NCM batteries was initially slow but decreased rapidly in the latter half, which is related to the increase in speed, battery output voltage and current. The decrease in the SOC of the LFP battery is greater than that of the NCM battery. The data show that the LFP battery has good performance in maintaining the voltage plateau and discharge voltage stability, while the NCM battery has excellent energy density and long-term endurance.
Table 8 is the comparison of the maximum values of the three working conditions.

Table 8.
Comparison of the maximum values of 3 working conditions.
Under the same initial voltage conditions, the LFP battery has the higher maximum voltage and lower minimum voltage. The current values are relatively close, which received a significantly greater impact from the working conditions than that of the voltage. The maximum current of WLTP is significantly higher than NEDC and CLTC-P operating conditions (>20 A). Low current discharge conditions should be emulated in teaching simulation and experiments for safety reasons.
5. Conclusions
This study adopted the Thevenin equivalent circuit model with a second-order RC equivalent circuit model to construct the single battery and battery pack models of LFP and NCM batteries and the vehicle model. Simulations of the NEDC, WLTP and CLTC-P operating conditions were carried out. The main research conclusions are as follows.
- (1)
- LFP batteries have good performance in maintaining voltage plateau and discharge voltage stability, while the NCM battery has excellent energy density and long-term endurance.
- (2)
- The LFP battery has a higher maximum voltage and lower minimum voltage under the same initial voltage conditions. The maximum voltage difference variation is about 11 V.
- (3)
- The maximum current of WLTP is significantly higher than NEDC and CLTC-P operating conditions (>20 A). The low current discharge conditions should be emulated in teaching simulations and experiments for safety reasons.
Author Contributions
Methodology, M.G.; Software, J.C. (Jiatao Chen); Formal analysis, X.Z.; Investigation, J.C. (Jiatao Chen); Resources, M.G.; Data curation, J.C. (Jianming Chen); Visualization, J.C. (Jianming Chen); Project administration, X.Z.; Funding acquisition, X.Z. All authors have read and agreed to the published version of the manuscript.
Funding
This work is supported by the University–Industry collaborative education program (230800287172939), Research on composite heat flow enhanced heat dissipation of power batteries for new energy vehicles (40123280) and the Support of Jinan University’s Experimental Teaching System for the Construction of New Engineering Disciplines: A Survey and Analysis Based on Electrical Engineering and Automation Majors (82623223).
Data Availability Statement
Data are contained within the article.
Conflicts of Interest
The authors declare that they have no conflicts of interest regarding the publication of this paper.
References
- Kumar, R.; Das, K. Lithium battery prognostics and health management for electric vehicle application—A perspective review. Sustain. Energy Technol. Assess. 2024, 65, 103766. [Google Scholar] [CrossRef]
- Zhang, Z.; Chen, Z.; Zhu, W.; Li, H.; Liao, C.; Liu, Q.; Hou, J.; Yu, W.; Li, Y. Study of the effects of preheating on discharge characteristics and capacity benefit of Li-ion batteries in the cold. J. Energy Storage 2024, 86, 111228. [Google Scholar] [CrossRef]
- Yang, J.; Yu, Q.; Chen, S.; Yan, F.; Yu, Y. Analysis of discharge performance and thermo-electric conversion efficiency in thermally regenerative ammonia-based flow battery with foam copper electrode. Energy Convers. Manag. 2024, 311, 118523. [Google Scholar] [CrossRef]
- Sarchami, A.; Kiani, M.; Najafi, M.; Houshfar, E. Experimental investigation of the innovated indirect-cooling system for Li-ion battery packs under fast charging and discharging. J. Energy Storage 2023, 61, 106730. [Google Scholar] [CrossRef]
- Liao, H.; Huang, B.; Cui, Y.; Qin, H.; Liu, X.; Xu, H. Research on a fast detection method of self-discharge of lithium battery. J. Energy Storage 2022, 55, 105431. [Google Scholar] [CrossRef]
- Zhang, X.; Fan, J.; Zou, Y.; Sun, W. Realizing accurate battery capacity estimation using 4 min 1C discharging data. Energy 2023, 282, 128744. [Google Scholar] [CrossRef]
- Li, W.; Zeng, M.; Wang, B.; Chen, Y.; Markides, C.N. Characteristic analysis of lithium–oxygen batteries considering the discontinuous deposit and electrolyte degradation effects during discharge. J. Energy Storage 2024, 82, 110544. [Google Scholar] [CrossRef]
- Liu, Z.; He, H.; Xie, J.; Wang, K.; Huang, W. Self-discharge prediction method for lithium-ion batteries based on improved support vector machine. J. Energy Storage 2022, 55, 105571. [Google Scholar] [CrossRef]
- Chang, L.; Chen, W.; Mao, Z.; Huang, X.; Ren, T.; Zhang, Y.; Cai, Z. Experimental study on the effect of ambient temperature and discharge rate on the temperature field of prismatic batteries. J. Energy Storage 2023, 59, 106577. [Google Scholar] [CrossRef]
- Yao, J.C.; Chang, Z.H.; Han, T.; Tian, J.P. Semi-supervised adversarial deep learning for capacity estimation of battery energy storage systems. Energy, 2024; 294, 130882. [Google Scholar]
- Park, S.-J.; Song, Y.-W.; Kang, B.-S.; Kim, W.-J.; Choi, Y.-J.; Kim, C.; Hong, Y.-S. Depth of discharge characteristics and control strategy to optimize electric vehicle battery life. J. Energy Storage 2023, 59, 106477. [Google Scholar] [CrossRef]
- Lai, Y.-W.; Chi, K.-H.; Chung, Y.-H.; Liao, S.-W.; Shu, C.-M. Thermal hazard evaluation of 18650 lithium-ion batteries at various discharge rates. J. Loss Prev. Process Ind. 2024, 89, 105323. [Google Scholar] [CrossRef]
- Wang, S.; Ma, Z.; Zhao, W.; Guo, Z.; Zhao, H.; Ren, L. Deterioration mechanism of the wettability of a lithium-ion battery separator induced by low-temperature discharge. Appl. Energy 2024, 364, 123136. [Google Scholar] [CrossRef]
- Zhang, Y.; Liu, H.; Liu, S.; Pan, S.; Tian, C.; Hu, J. Prediction model of thermal behavior of lithium battery module under high charge-discharge rate. J. Energy Storage 2024, 74, 109366. [Google Scholar] [CrossRef]
- Khan, S.A.; Xiangrong, L.I.; Lau, K.T.; Dong, K.; He, S.; Wabaidur, S.M.; Thakur, A.K.; Zhao, J. Metallic PCM-based battery thermal management system for fast charging/discharging applications. Int. Commun. Heat Mass Transf. 2024, 155, 107473. [Google Scholar] [CrossRef]
- Hemavathi, S.; Srinivas, S.; Prakash, A.S. Performance evaluation of a hydrostatic flow immersion cooling system for high-current discharge Li-ion batteries. J. Energy Storage 2023, 72, 108560. [Google Scholar] [CrossRef]
- Tsafack, P.; Fru, S.E.; Nghemachi, A.V.; Tanyi, E. Impact of high constant charging current rates on the charge/discharge efficiency in lead acid batteries, for residential photovoltaic system applications. J. Energy Storage 2023, 63, 107013. [Google Scholar] [CrossRef]
- Ouyang, D.; Weng, J.; Chen, M.; Wang, J.; Wang, Z. Sensitivities of lithium-ion batteries with different capacities to overcharge/over-discharge. J. Energy Storage 2022, 52, 104997. [Google Scholar] [CrossRef]
- Li, X.; Zhang, Z.; Gong, L.; Zhang, Z.; Liu, G.; Tan, P. Revealing the mechanism of stress rebound during discharging in lithium-ion batteries. J. Energy Storage 2023, 58, 106454. [Google Scholar] [CrossRef]
- Meng, H.X.; Li, Y.F.; Zhang, C. Modeling of discharge voltage for lithium-ion batteries through orthogonal experiments at subzero environment. J. Energy Storage 2022, 52, 105058. [Google Scholar] [CrossRef]
- Yao, J.C.; Han, T. Data-driven battery capacity estimation based on partial discharging capacity curve for lithium-ion batteries. Energy 2023, 271, 127033. [Google Scholar] [CrossRef]
- Zhang, W.; He, H.; Li, T.; Yuan, J.; Xie, Y.; Long, Z. Lithium-ion battery state of health prognostication employing multi-model fusion approach based on image coding of charging voltage and temperature data. Energy 2024, 296, 131095. [Google Scholar] [CrossRef]
- Shao, J.; Li, J.; Yuan, W.; Dai, C.; Wang, Z.; Zhao, M.; Pecht, M. A novel method of discharge capacity prediction based on simplified electrochemical model-aging mechanism for lithium-ion batteries. J. Energy Storage 2023, 61, 106788. [Google Scholar] [CrossRef]
- Guo, R.H.; Shen, W.X. A data-model fusion method for online state of power estimation of lithium-ion batteries at high discharge rate in electric vehicles. Energy 2022, 254, 124270. [Google Scholar] [CrossRef]
- He, T.; Zhang, T.; Wang, Z.; Cai, Q. A comprehensive numerical study on electrochemical-thermal models of a cylindrical lithium-ion battery during discharge process. Appl. Energy 2022, 313, 118797. [Google Scholar] [CrossRef]
- Kavasoğullari, B.; Karagöz, M.E.; Yildiz, A.S.; Biçer, E. Numerical investigation of the performance of a hybrid battery thermal management system at high discharge rates. J. Energy Storage 2023, 73, 108982. [Google Scholar] [CrossRef]
- Fan, S. Research on the State of Charge of Lithium Iron Phosphate Batteries. Ph.D. Thesis, Anhui University of Science and Technology, Huainan, China, 2019. [Google Scholar]
- Zhang, Z.Q.; Wu, Z.B.; Weng, R.C.; Li, J. Simulation research on model of LiFePO4Li-ion power battery. Automob. Appl. Technol. 2016, 1, 93–95. [Google Scholar] [CrossRef]
Disclaimer/Publisher’s Note: The statements, opinions and data contained in all publications are solely those of the individual author(s) and contributor(s) and not of MDPI and/or the editor(s). MDPI and/or the editor(s) disclaim responsibility for any injury to people or property resulting from any ideas, methods, instructions or products referred to in the content. |
© 2024 by the authors. Licensee MDPI, Basel, Switzerland. This article is an open access article distributed under the terms and conditions of the Creative Commons Attribution (CC BY) license (https://creativecommons.org/licenses/by/4.0/).