Abstract
The integration of renewable energy is rapidly leading the existing grid systems toward modern hybrid power systems. These hybrid power systems are more complex due to the random and intermittent nature of RE and involve numerous operational challenges. This paper presents the operational model for solar integrated power systems to address the issues of economical operation, reliable solar share, energy deficit in case of contingency events, and the allocation of system spinning reserve. A mixed-integer optimization is formulated to minimize the overall cost of the system operation and to maximize the solar share under robust system spinning reserve limits as well as various other practical constraints. A Pareto-optimal solution for the maximization of the number of solar power plants and minimization of the solar cost is also presented for reliable solar share. Further, a decomposition framework is proposed to split the original problem into two sub-problems. The solution of joint optimization is obtained by exploiting a Lagrange relaxation method, a binary search Lambda iteration method, system spinning reserve analysis, and binary integer programming. The proposed model was implemented on an IEEE-RTS 26 units system and 40 solar plants.
1. Introduction
Today’s power systems are hybrid in nature, and the large scale integration of renewable energy (RE) sources is providing life extension to depleting conventional energy resources. Solar photovoltaic (PV) and wind turbines are commonly deployed RE sources in power systems, which exhibit an intermittent output power due to diverse weather conditions. The integration of RE to the grid system offers numerous benefits, such as reduced emissions, decreased dependence on fossil fuel, reduced fuel costs of thermal power units, decreasing the power system’s net present value (NPV), reduced annual energy purchased from the grid, and a lower cost of energy utilized [1]. However, the integration of RE with thermal power generation necessitates the scheduling of sufficient system spinning reserve (SSR) from thermal units such that a loss of load could be avoided in case of RE failure due to its intermittent nature. The allocation of necessary SSR forces the scheduled units to be deviated from their optimal points of dispatching powers and (or) some additional units may need to be committed, which may lead to a higher cost of operation. Thus, the advent of such RE sources to a conventional grid gives rise to new complexities, which make the optimal operation of the system to become a more challenging issue.
The optimal operation of a conventional power system, consisting of thermal generation units, involves the optimization of unit commitment (UC) and economic dispatch (ED). The UC and ED aim to determine appropriate combinations of units to be committed and optimal powers to be dispatched from the committed units respectively, as well as to minimize the overall cost of operation for a given set of load demand over a specified time period [2]. Thermal units may exhibit either convex cost functions or non-convex cost functions. Several constraints are involved in UC and ED optimization, such as power balance, the power limits of the generator, ramping limits, etc. In the literature, many conventional and artificial intelligence (AI) optimization schemes have been proposed to address ED optimization. Conventional ED optimization schemes involve gradient search, lambda iteration, Newton’s method, etc., whereas AI techniques involve algorithms such as the genetic algorithm [3], particle swarm optimization (PSO) [4], neural networks [5], tabu search [6], and evolutionary programming.
In conventional economic operations, an adequate SSR is desired to guarantee secure system operation in case of any thermal contingency event. The increasing tendency of the penetration of intermittent and price-responsive RE has posed new challenges to the allocation and formulation of SSR. In such power systems, the deficiency of a spinning reserve may result in the curtailment of RE as well as load shedding. Thus, an adequate SSR must be allocated to ensure reliable system operation in case of RE outage as well. Numerous methods have been proposed in the literature for allocating an optimal SSR to the committed thermal units. The allocated SSR has been formulated using deterministic, stochastic, and robust models [7]. The deterministic formulation of the SSR allocates a predetermined reserve power that is equal to a specified fraction of the peak load demand or the capacity of the largest committed generating unit. In a probabilistic formulation approach, the SSR is allocated based on the probability of failure of the thermal units as well as the intermittent behavior of RE generation. Thus, the optimal probabilistic reserve depends on the penetration level of the RE sources and their uncertainty models [8]. The robust SSR formulation allocates an 100%–upward SSR for the worst case scenario of the outage of RE sources while less conservative alternatives recommend lower margins according to their origin, scale, and dispersion [9,10]. In [11,12,13,14], a deterministic SSR of was allocated to RE-integrated power systems. However, the contingency events of thermal units were ignored, and thus, optimal reserve allocations to individual units were missing. The authors of [15] proposed deterministic SSR allocation via Lagrange relaxation (LR) while taking into account the thermal contingencies and adaptive semi-infinite program used in [16] to allocate the SSR based on uncertainty sets. Furthermore, the authors of [17] proposed an N-1 criterion for the allocation of deterministic SSR and solved the optimization using mixed-integer linear programming. However, the deterministic approach intrinsically ignores the actual reserve requirements as well as the uncertain behavior of RE sources [18]. Thus, a probabilistic approach has been adopted in the literature to overcome such issues.
Works [19,20] proposed a multi-step method in which the function of expected energy not served (EENS) was approximated as a linear function to determine the probabilistic optimal SSR for conventional as well as RE-integrated power systems. In [21], a probabilistic SSR model was adopted, and the optimal SSR was calculated for conventional power systems considering first-order and second-order thermal unit contingencies. In this work, the cost of dispatched power as well as the cost of EENS were modeled as a function of the SSR and the composite optimization of the dispatched power cost, and the EENS cost was solved for an optimal SSR using a cost–benefit analysis technique. Further, work [22] developed a new constraint known as the umbrella contingency constraint and carried out an umbrella contingency-constrained UC optimization to determine the probabilistic optimal SSR for conventional power systems. The security-constrained day-ahead economic operation of a solar PV-aided micro-grid was carried out in [23] to calculate the optimal probabilistic operating reserve. The PV uncertainty was assigned according to different scenarios and their probabilities of occurrence at each half hour. The authors of [24] proposed the simultaneous optimization of load shedding, RE curtailment, and the optimal SSR using priority list schemes as well as the genetic algorithm. In [25], stochastic programming was exploited to obtain a stochastic scenario-based SSR for wind-aided power systems. This work was further extended in [26], in which the authors achieved a scenario-based SSR for a hydro- and wind-integrated power system using weighted and improved PSO.
However, the probabilistic allocation of SSR does not ensure the continuity of system operation in the worst case scenarios of RE outages. Thus, most of the recent works have proposed robust models of the SSR for RE-integrated power systems, e.g., hybrid PSO in [27] and Gaussian-based Bayesian optimization in [28] for both PV- and wind-connected power system providing the robust SSR formulation. In [29], a cluster-based robust SSR model was developed for the economic operation of RE-integrated power system consisting of thermal generation units, solar PV, wind, biomass, and storage devices. This work was focused on investigating the impact of the storage system on the cost of the UC optimization with a robust allocation of the SSR. The work in [30] presented an operation model for autonomous RE-integrated power systems under additional frequency constraints and the frequency-based allocation of the spinning reserve. However, the work was limited to calculating the installed capacities of solar PVs as well as to a storage system for an autonomous plant with a nearly fixed power demand. Thus, the research could not address the challenges of actual power systems. Furthermore, the proposed optimization was approximated as a linear problem to reduce the computational effort. However, the accuracy of the results is compromised with such modeling. Work [31] developed a model for the grid-connected RE sources of an institution to reduce the power system’s NPV over its lifespan. However, the work was limited to the small-scale integration of RE, and the grid was supposed to be always available to deliver any reserve power in case of RE failure. In contrast, a sufficient SSR is desired in large-scale RE integration to avoid the loss of load.
From the above-cited literature, it can be deduced that the SSR is calculated using either a deterministic, probabilistic, or robust approach, and the reserve-constrained UC (RCUC) is carried out based on that pre-calculated SSR. However, such an allocation of the SSR cannot cover the simultaneous outage of RE sources and thermal units. Rather, whichever event occurs first is served by dispatching the allocated SSR. Thus, if the other event occurs at the same time, it may lead to either a partial loss of load or complete blackout, i.e., the failure of system operation. Furthermore, it may not be viable for the system operator to penetrate all the available RE due to system constraints. To the best of our knowledge based on the most recent and relevant literature, there has not yet been a comprehensive work that has dealt with such issues. Unlike the existing literature, e.g., works [30,31], this study proposes a two-step model for the reserve-constrained economic operation of solar-integrated power systems. In the first step, the optimal SSR is calculated, and then, the optimal reserve-constrained unit commitment (ORCUC) is executed. Next, the limits of the robust SSR are determined for the maximum penetration of the RE, and ED is carried out. Our proposed model is able to address the aforementioned problems of the existing literature by answering following research questions:
- (i)
- What are the limits of the robust SSR as well as of the corresponding RE share?
- (ii)
- To what level can the RE share be increased such that the allocated SSR lies within the robust range and is dedicated for thermal contingencies only?
- (iii)
- How much can the RE power share be supported by a set of committed thermal units under the robust SSR if is supposed to be dispatched for RE as well as thermal outages?
- (iv)
- What is the value of the maximum SSR that can be achieved with a set of committed thermal units?
The contributions of this paper are summarized as follows:
- (i)
- The solar share is maximized within the boundaries of a robust SSR such that the power deficit does not exist.
- (ii)
- The range of a robust SSR is determined that can accommodate an additional RE share provided that compromise on the power deficit is possible.
- (iii)
- This study minimizes the operational cost and maximizes the number of solar plants with an ON status in order to enhance the solar power availability.
- (iv)
- The proposed model was implemented and simulated on an IEEE-RTS 26-unit system.
- (v)
- The ORCUC was carried out using LR, and ED was executed through a Lambda iteration and using the binary search method [2]. Furthermore, a set of Pareto-optimal solutions was found for the selection of solar plants.
2. System Model and Problem Formulation
2.1. System Model
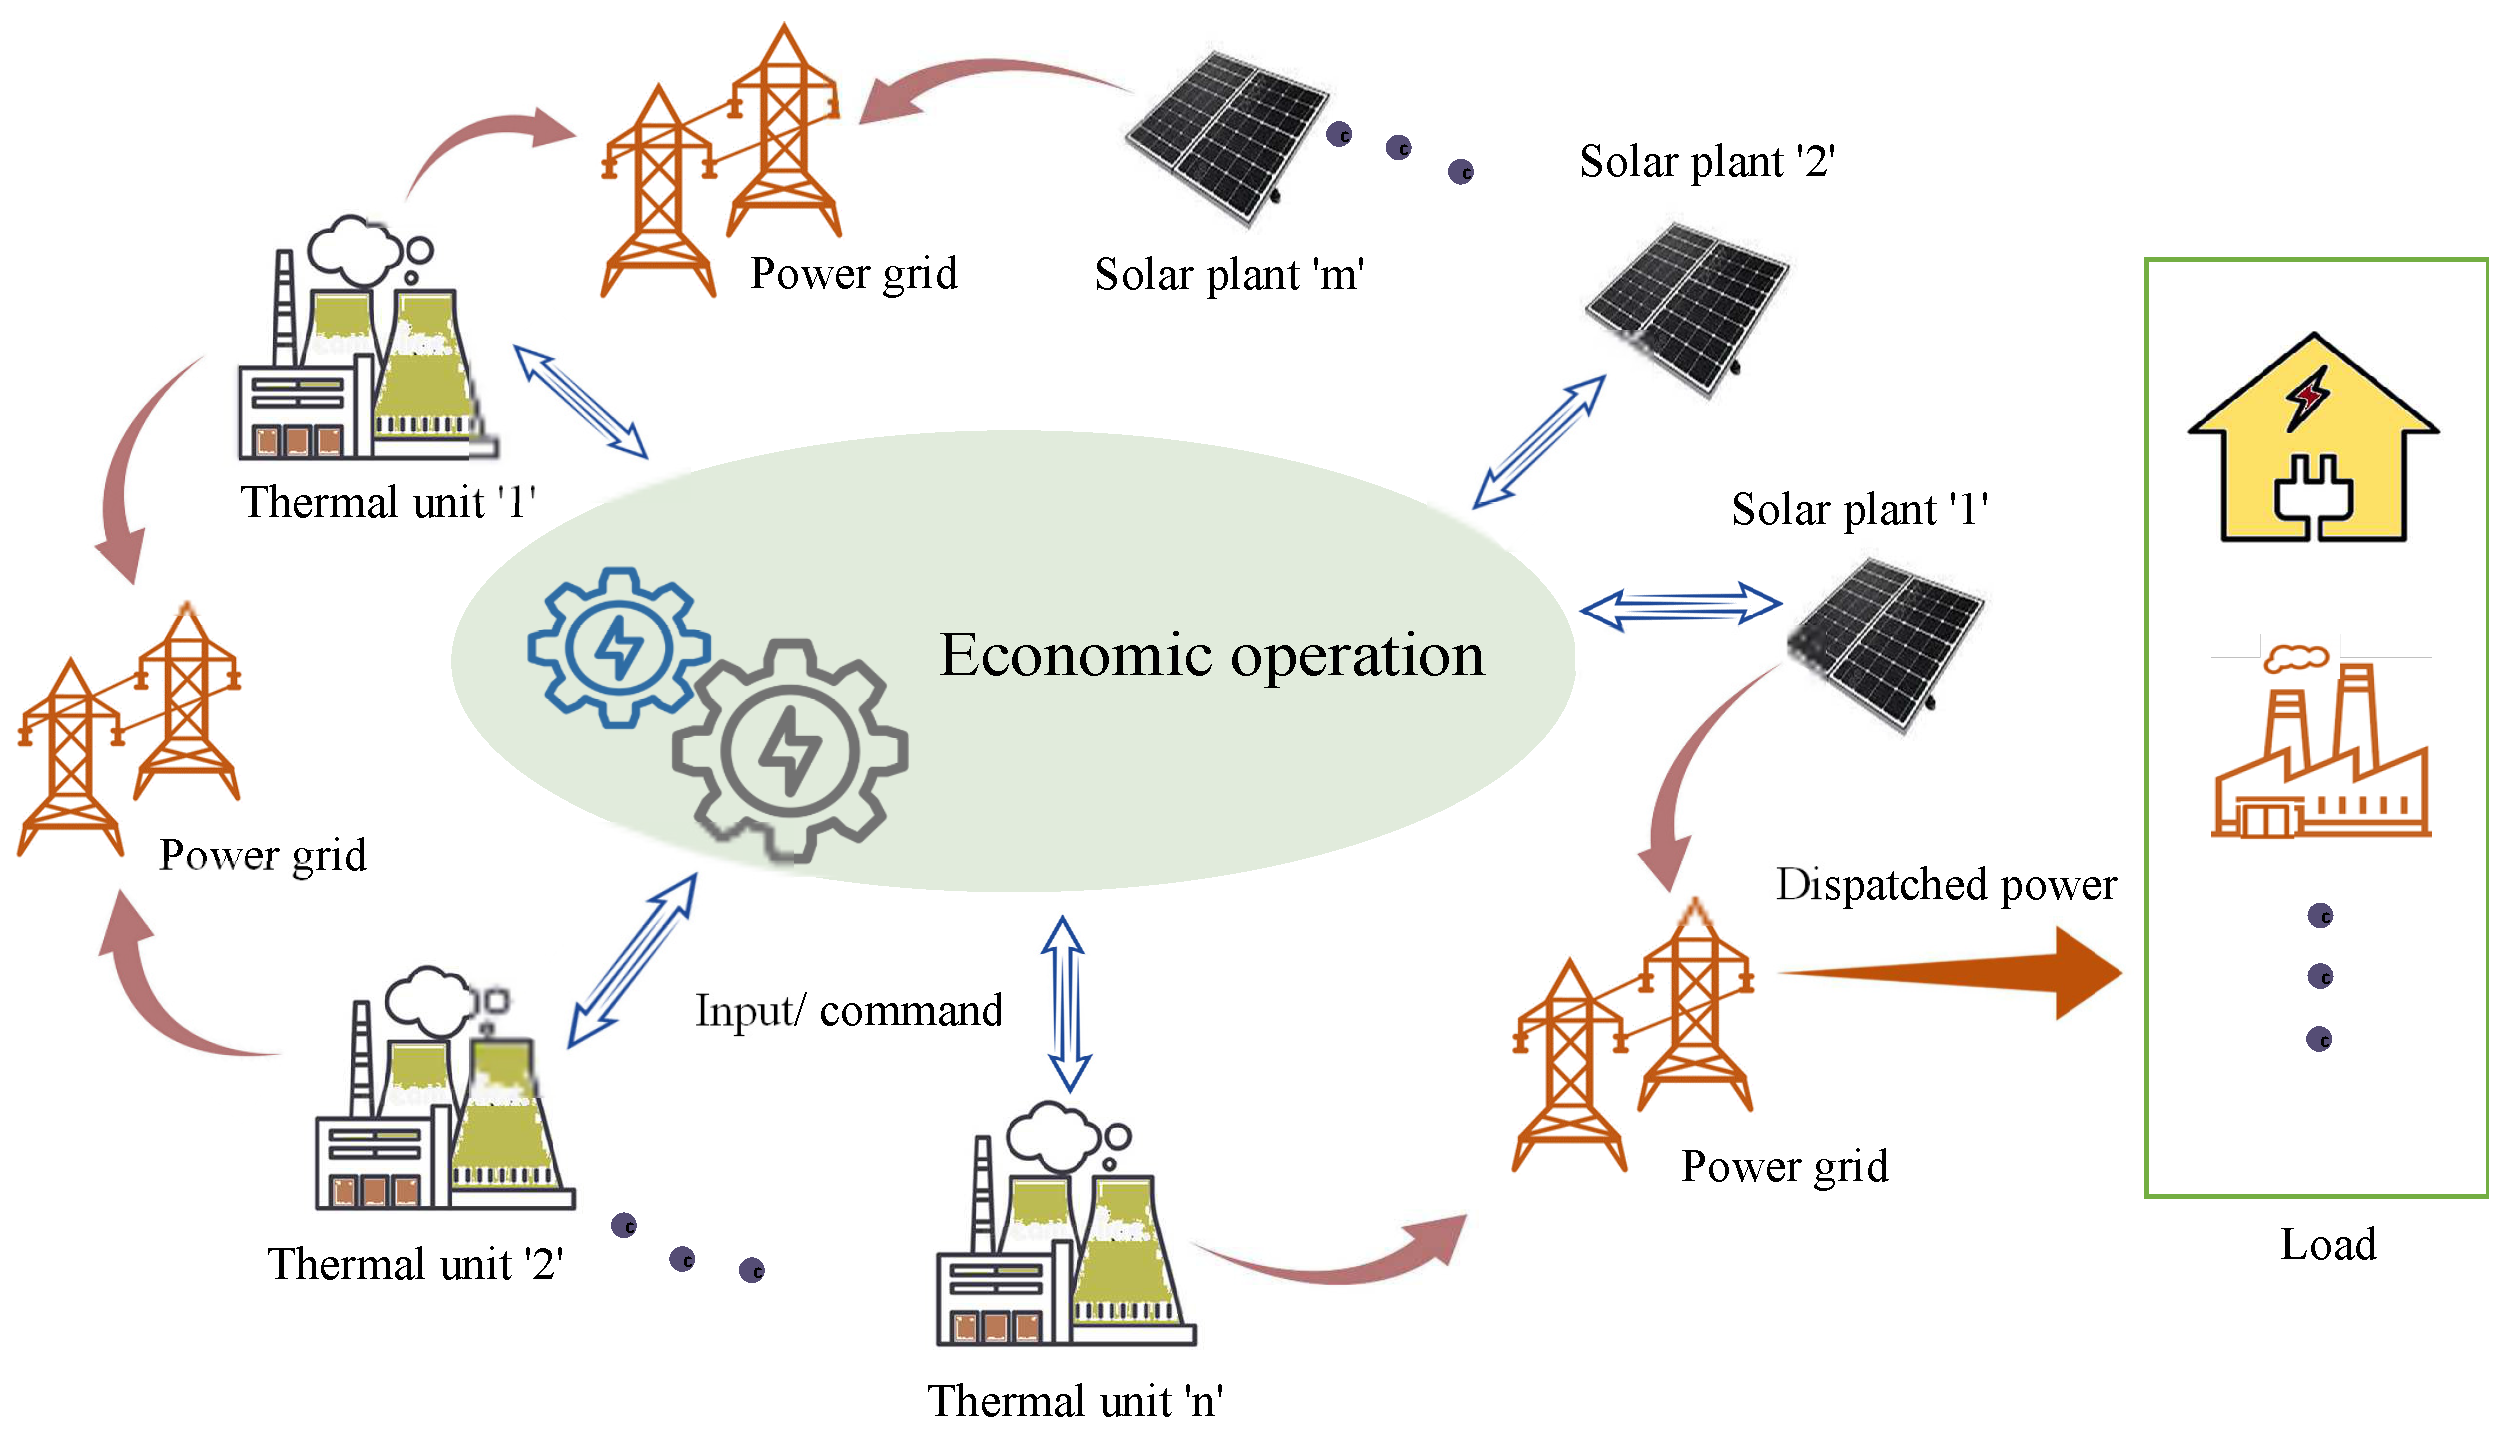
This study considers a hybrid power system (HPS) consisting of ‘n’ thermal units and ‘m’ solar plants supplying power to the connected loads, as shown in Figure 1. Let be the power generated by the i-th thermal generating unit. The fuel cost is given by
where , , and are the fuel cost coefficients of the i-th thermal unit. Any thermal generation unit may be desired to turn ON or OFF to fulfill the requirements of the system operation. A binary variable is introduced to denote the ON and OFF status of the i-th generating unit at any given time t. The ON/OFF status of the i-th unit is give by
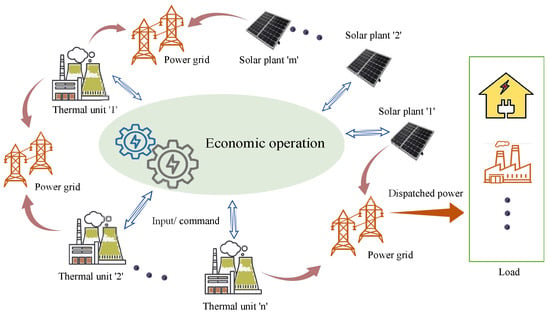
Figure 1.
System model.
Furthermore, must not exceed its upper and lower bounds, i.e.,
where and are the minimum power limit and maximum power limit of the i-th thermal generation unit, respectively.
A thermal generation unit cannot follow abrupt load variations to increase or decrease its power. Rather, the power can only be varied with certain ramp up and ramp down rates. Thus, the available up-reserve and down -reserve at any given time are limited by such ramping rates as
where , , and are the ramp-up rate, ramp-down rate, and time allowed for ramping, respectively. The individual reserves of the on-bar thermal units sum up to produce the SSR to be allocated, i.e.,
An adequate SSR must be allocated to guarantee continuous operation during contingency events. In case of thermal contingencies, the allocated SSR must satisfy
where is the predetermined optimal SSR for the first-order and second-order contingencies. Equation (7) determines the lower limit of the allocated SSR and states that the SSR must not be allocated to be less than the pre-calculated optimal SSR for the first- and second-order contingencies. Similarly, Equation (8) determines the upper limit of the SSR allocation, which states that the allocated SSR must not exceed the maximum of the on-bar reserve power.
The thermal generation units cannot be switched from one state of operation to another before the minimum time required by that state is elapsed. For instance, if a generation unit is turned ON at any given time, it cannot be turned OFF again until the minimum ON time is elapsed. Similarly, once a generation unit is turned OFF, it cannot be turned ON before the elapse of the minimum OFF time. Thus, for the transition of the i-th generation unit from one state to another, the following constraints must be satisfied:
where , , , and are the cumulative ON time, cumulative OFF time, minimum uptime, and minimum downtime of the i-th generation unit, respectively.
Between any two consecutive time slots, the power share of the i-th generation unit must not vary beyond certain ramping rates provided that the generation unit remains ON for those time slots. If the power is increased, it should not exceed the ramp-up rate, and if it is decreased, it should not exceed the ramp-down rate, i.e.,
Let the power of the j-th solar plant be denoted by . The cost at which the plant owner sells energy to the system operator at any given time t is given by
where is the per unit of the j-th solar plant. The solar power can be calculated using the watt model as follows [32]:
where is the rated power of the j-th solar plant, is the temperature coefficient, is the ambient temperature, is the reference cell temperature, and is the solar radiation at any given time t.
2.2. Problem Formulation
This work deals with the reserve-constrained economic operation of solar-integrated power systems. It aimed to minimize fuel costs, minimize solar costs, maximize solar shares, and maximize the number of solar plants under the provision of a robust SSR. At any time during operation, the robust approach ensures that the allocation of the 100%–upward SSR for any solar power outage. Thus, the system operation becomes more reliable, and the loss of load can be avoided. In contrast, the SSR evaluations from the probabilistic approach come out to be significantly less than the penetrated RE. As the solar energy exhibits an intermittent nature, there always exists a higher risk of loss of load in a probabilistic SSR, which may lead to the failure of the system operation. As the proposed model aims to maximize the solar share, the probabilistic allocation of SSR may increase this risk further in the case of total solar power outage. Furthermore, this work ignored the storage system for simplicity, which also makes the probabilistic approach less promising for the proposed model. Keeping in view such advantages, the authors adopted the robust approach to allocate the SSR.
Before formulating the problem, the questions posed in Section 1 must be answered as follows:
- Answer (i)
- The answer to question (i) defines the overall structure of the model in terms of a robust SSR and RE share.
- Answer (ii)
- This answer evaluates the RE share and range of a robust SSR for the scenario if the is dedicated for thermal contingencies. The evaluated RE share should be limited to make the system resilient to any RE outages.
- Answer (iii)
- This answer evaluates the RE share and the limits of a robust SSR for an undedicated scenario.
- Answer (iv)
- This answer evaluates the overall SSR, whether robust or non-robust, and the corresponding RE share.
The problem can be formulated as follows:
where denotes the penetrated solar power at any given time t, is the load demand, is the solar share based on the SSR, is the maximum limit of the solar share based on the available SSR, and is a binary variable used to represent the ON or OFF status of the j-th solar plant. Depending on operation requirements, the j-th solar plant may be turned ON to participate in system operation or may remain OFF otherwise. Equation (16) presents a power balance constraint that states that adequate generation must be committed at any given time to satisfy the load demand. Constraint (17) presents the solar share based on the SSR and states that a limited amount of solar power can be penetrated into the system, which must not exceed the limits prescribed by the SSR. The variable in problem (15) and constraint (18) correspond to answer (i). The maximum limits of the solar share based on the SSR are defined as follows:
where is the maximum limit of the solar share within a robust range of the SSR, and is the maximum solar share for the range ( to ) in which power deficit is experienced by the power system. Furthermore, the solar share also depends on the aggregate available solar power. Thus, the actual solar share must be limited by the aggregate available solar power. Constraint (18) states that the actual solar share must not exceed the minimum of the solar share based on the SSR and the total available solar power. Finally, constraint (19) states that the solar plants must be selected such that there exists enough on-bar solar power to obtain the desired solar share.
Prior to solving problem (15), the optimal reserve for the first- and second-order thermal contingency events, i.e., , must be evaluated first. To calculate the , the following optimization is solved:
where , , and are the total cost, running cost, and the EENS cost, respectively. The running cost for each load level must be minimized for a given SSR requirement. Thus,
The EENS cost is calculated as
with
where and denote the outage probability of a single unit, i.e., the i-th unit, and the loss of load due to this outage, respectively. Similarly, and denote the probability of the simultaneous outage of the i-th and j-th units and the loss of load due to this simultaneous outage, respectively. is the available up-reserve from the i-th unit, and VoLL represents the value of the lost load, which is a survey-based fixed value. The EENS is calculated for first-order and second-order thermal outage events only. The higher-order contingency events are neglected, as such events rarely occur in power systems. The first-order outage probability and second-order outage probability are calculated as follows [33]:
where and are the ON/OFF status and the outage replacement rate (ORR) of the .-th thermal generation unit, respectively. The ORR of the i-th generation unit is taken from [33], which is given by
where is the failure rate of the i-th unit, and T is the time duration of each optimization interval. It is assumed that unit failures are exponentially distributed and the time to repair is so long that if a unit is failed during an optimization period, it will not be available for the subsequent periods. The resulting is dispatched in case of the occurrence of first- and second-order thermal contingency events [21].
3. Proposed Solution
To solve optimization (15), the evaluation of is desired. Thus, first, problem (22) is solved to determine using the same method as detailed in [21]. Optimization (15) is a mixed-integer binary programming task that is hard to solve in its composite form because numerous objectives and constraints are involved. To simplify the solution, the decomposition of the problem is proposed. By definition, if any part of a problem is independent of the coupling constraints, it can be solved as an independent sub-problem without loss of optimality. Problem (15) involves four objectives and one coupling constraint, i.e., constraint (16). In looking at the problem carefully, it can be found that the last two objectives are independent of coupling constraint (16), as the decision variable does not belong to the coupling constraint. Amongst the rest of the constraints, this variable, i.e., , appears in constraint (19). Thus, the last two objectives of problem (15) can be detached and solved as an independent sub-problem subject to constraint (19). The rest of this problem is sorted out as sub-problem I. Thus, the structure of the problem allows us to decompose it into two independent sub-problems without the loss of optimality. The following subsections describe the nature and solution of these sub-problems.
3.1. Sub-Problem I
The first sub-problem aims to minimize the thermal cost (scheduling and dispatch costs) and to maximize the solar share. This sub-problem is given by
The questions posed in the Introduction section is addressed by solving problem (34). The steps carried out to solve problem (34) are as follows:
- (i)
- Set = 0 and carry out ORCUC via LR to minimize the scheduling cost and to allocate the SSR, i.e., . The Lagrangian function is formulated aswhere and are assigned as non-negative Lagrangian multipliers to coupling constraints (8) and (16). Power loss is ignored for simplicity in the power balance constraint. The LR method temporarily relaxes the coupling constraints, and then via dual optimization, the Lagrangian function is maximized as a function of Lagrangian multiplier and while minimizing as a function of control variables and ; that is,whereThe Lagrangian in Equation (36) can be rewritten asThe first term of Equation (39), i.e., , can be minimized separately for each thermal generation unit, whereas the second term of the equation is constant and can be dropped. Thus, the simplified problem is given by
- (ii)
- Once the units are committed, ED optimization is carried out to calculate optimal powers of the committed generation units using the binary search lambda iteration algorithm [2]. In this algorithm, the optimal power output of each unit is found on the basis of an incremental cost rate ().If , then , andif , then .Binary search proceeds as follows:The following conditions are verified, and is updated as follows:If , thenand .If , thenand , andIf tolerance, the algorithm is terminated.
- (iii)
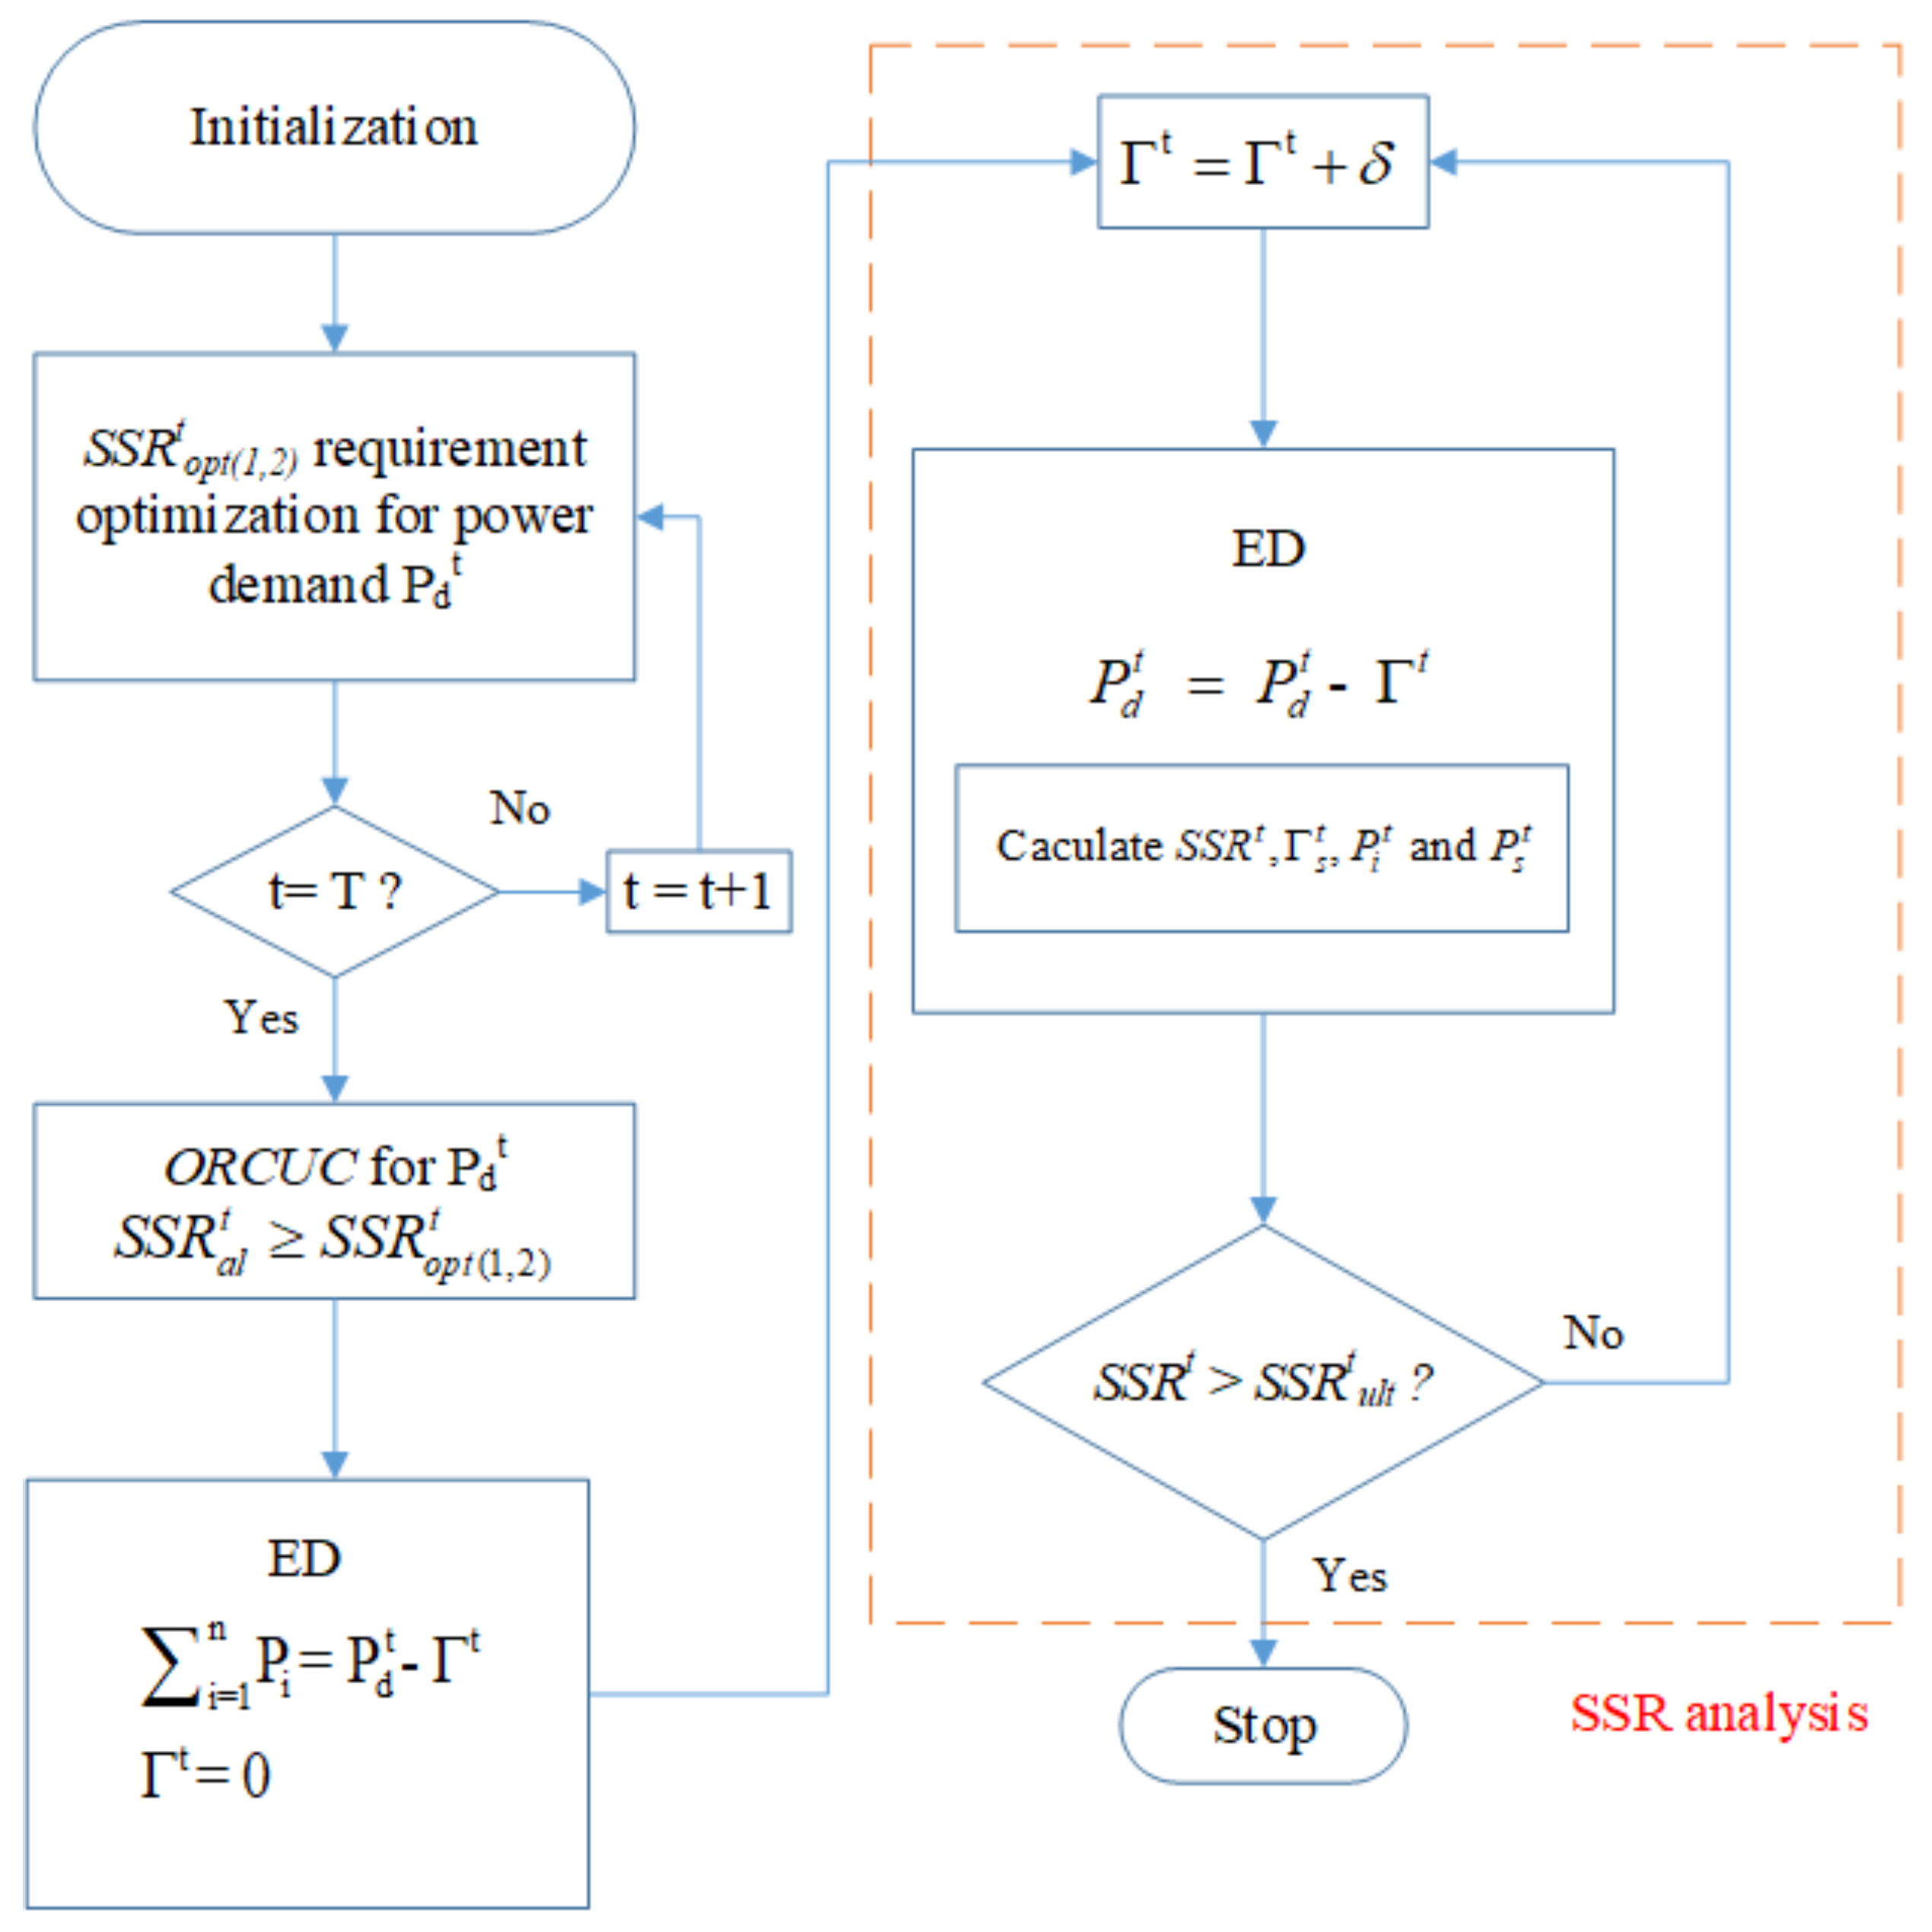
- For a set of committed thermal units, problem (34) is solved to maximize the solar share within the range of a robust SSR. To solve this problem, the SSR ranges must be defined, and as well as the solar share limit must be evaluated for each range. Thus, to answer the questions posed in the Introduction section, the data sets , , and are generated to define the SSR ranges for the answers (ii), (iii), and (iv), respectively. The solar share is initialized with a value equal to zero and increased iteratively with step size . For each iteration, ED is carried out to evaluate , , and . The resulting evaluations of are allocated to either of the previously defined ranges based on the following criteriaThe process is repeated until convergence. For any total number of iterations, say Y, the data sets are given bywhere D, S, and C are the maximum number of iterations for each range, respectively. The maximum limits of the robust SSR range and solar share are found when is dedicated to thermal contingencies only, i.e., the outcomes of answer (ii) are as follows:where is the index of the maximum value in , i.e.,Furthermore, the SSR for solar outage, i.e., , can be evaluated simply by subtracting the from . Similarly, the evaluations corresponding to answers (iii) and (iv) are given bywhere and are the indices of the maximum values in and , respectively, i.e.,In this way, the problem is solved to evaluate the robust SSR, and the procedure is called SSR analysis. The procedural flow of the solution of problem (34) is shown in Figure 2, in which the highlighted portion shows the SSR analysis. For further clarifications, a graphical illustration of the SSR analysis will be discussed in detail in Section 4.
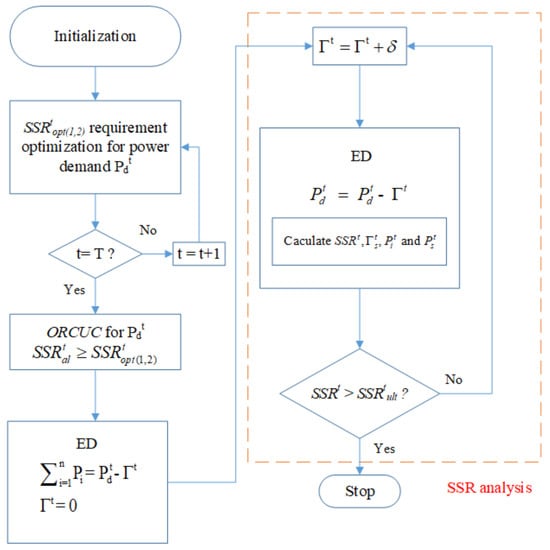 Figure 2. Proposed solution of sub-problem I.
3.2. Sub-Problem II
The objective of sub-problem II is to maximize the number of solar plants with ON status in order to increase reliability of solar power along with the minimization of solar cost. This problem has the following mathematical form for each hour:
where and are the weights assigned to the solar cost and number of committed solar plants, respectively. K is the parameter used to determine the significance of the maximization of the number of solar plants compared to the solar cost minimization. For the readers’ convenience, and are defined to denote the solar cost and the number of solar plants, respectively, and we rewrite problem (56) as follows:
with
The value of K is empirically set to make the fitness evaluation of the second objective compatible with that of the first objective . For more clarity, the relationship and the impact of the k-value on sub-problem II will be discussed in detail in Section 4.
4. Test System and Simulation Results
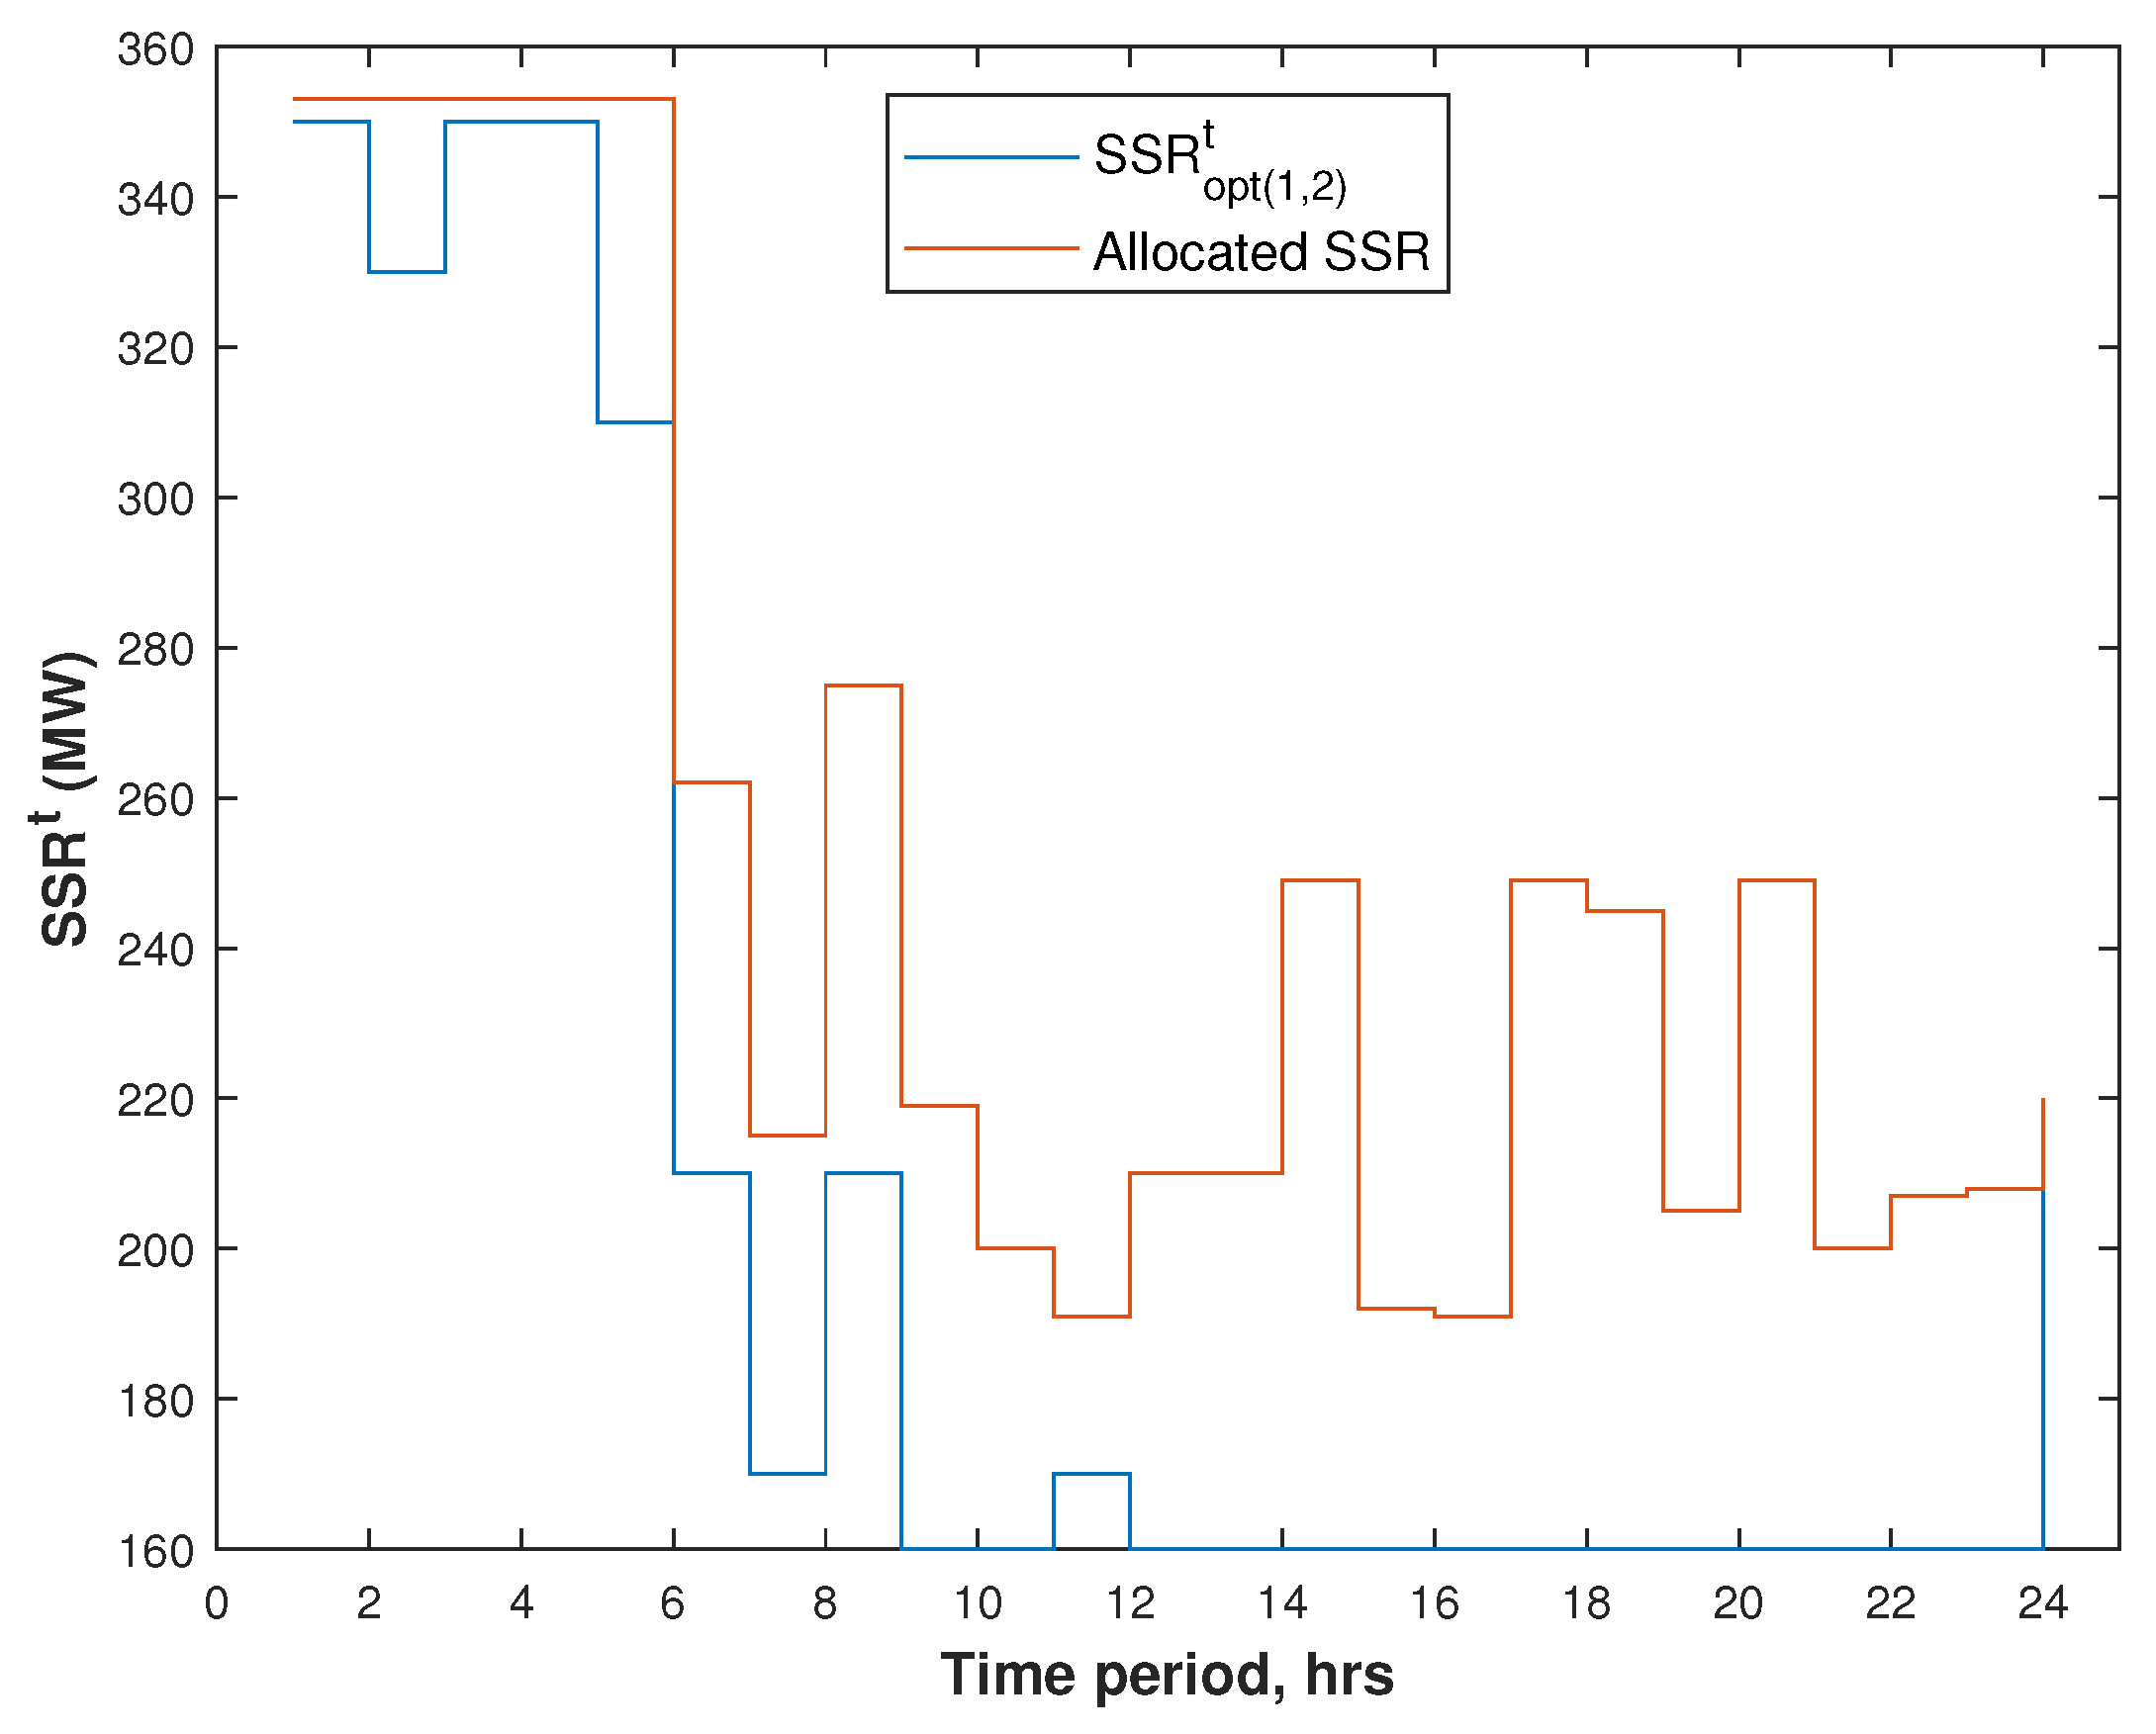
The test system involves 26 thermal units and 40 solar plants. The data for thermal units and load profile were obtained from [34]. Step 1 of the optimization is solved by executing ORCUC to determine the optimal scheduling of the thermal units and . The resulting optimal schedule of the thermal units is shown in Table 1. The load demand is given in Table 2, and evaluation results of the are shown in Figure 3 as well as in Table 3.

Table 1.
ORCUC schedule for 24 h.

Table 2.
Results of proposed solution from the 10-th hour to the 18-th hour of a day.
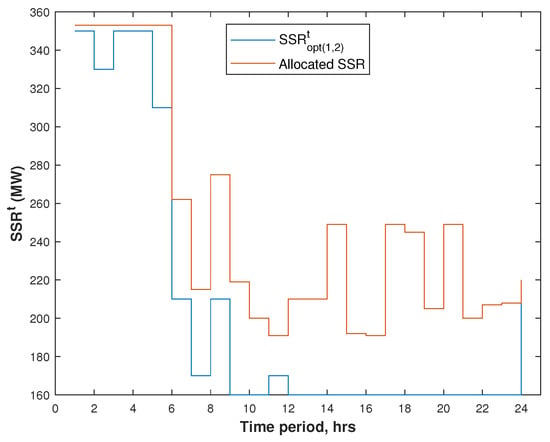
Figure 3.
SSR scheduled using ORCUC and with VOLL = 1000 $/MWh for 24 h.

Table 3.
Optimal and allocated with ORCUC.
A zero in Table 1 refers to the OFF status of a thermal generation unit, whereas a one means that the generation unit is ON. It is observed from Figure 3 that comes out to always be higher or equal to . This is due to the binary scheduling of the thermal generation units and their associated minimum power limits. Ideally, must follow , as can be observed during time slots 6, 7, 8, 9, and 24. However, it can be seen from the figure that varies regardless of the for the rest of the time slots. Such behavior is due to variations in load demand as well as the UC schedule. For instance, the load demand decreases from 2590 MW at time slot t = 13:00 to 2550 MW at time slot t = 14:00, as given in Table 2.
As a result, the is increased from 210 MW to 249 MW, as can be seen in Table 3.
This increase in the for a decreased load demand is due to the fact that the UC schedule has remained unchanged during respective time slots, as evident in Table 1. In contrast, is decreased as the load demand has been decreased at t = 19 because thermal units 6, 7, and 8 have been turned OFF at t = 19, and they were previously ON.
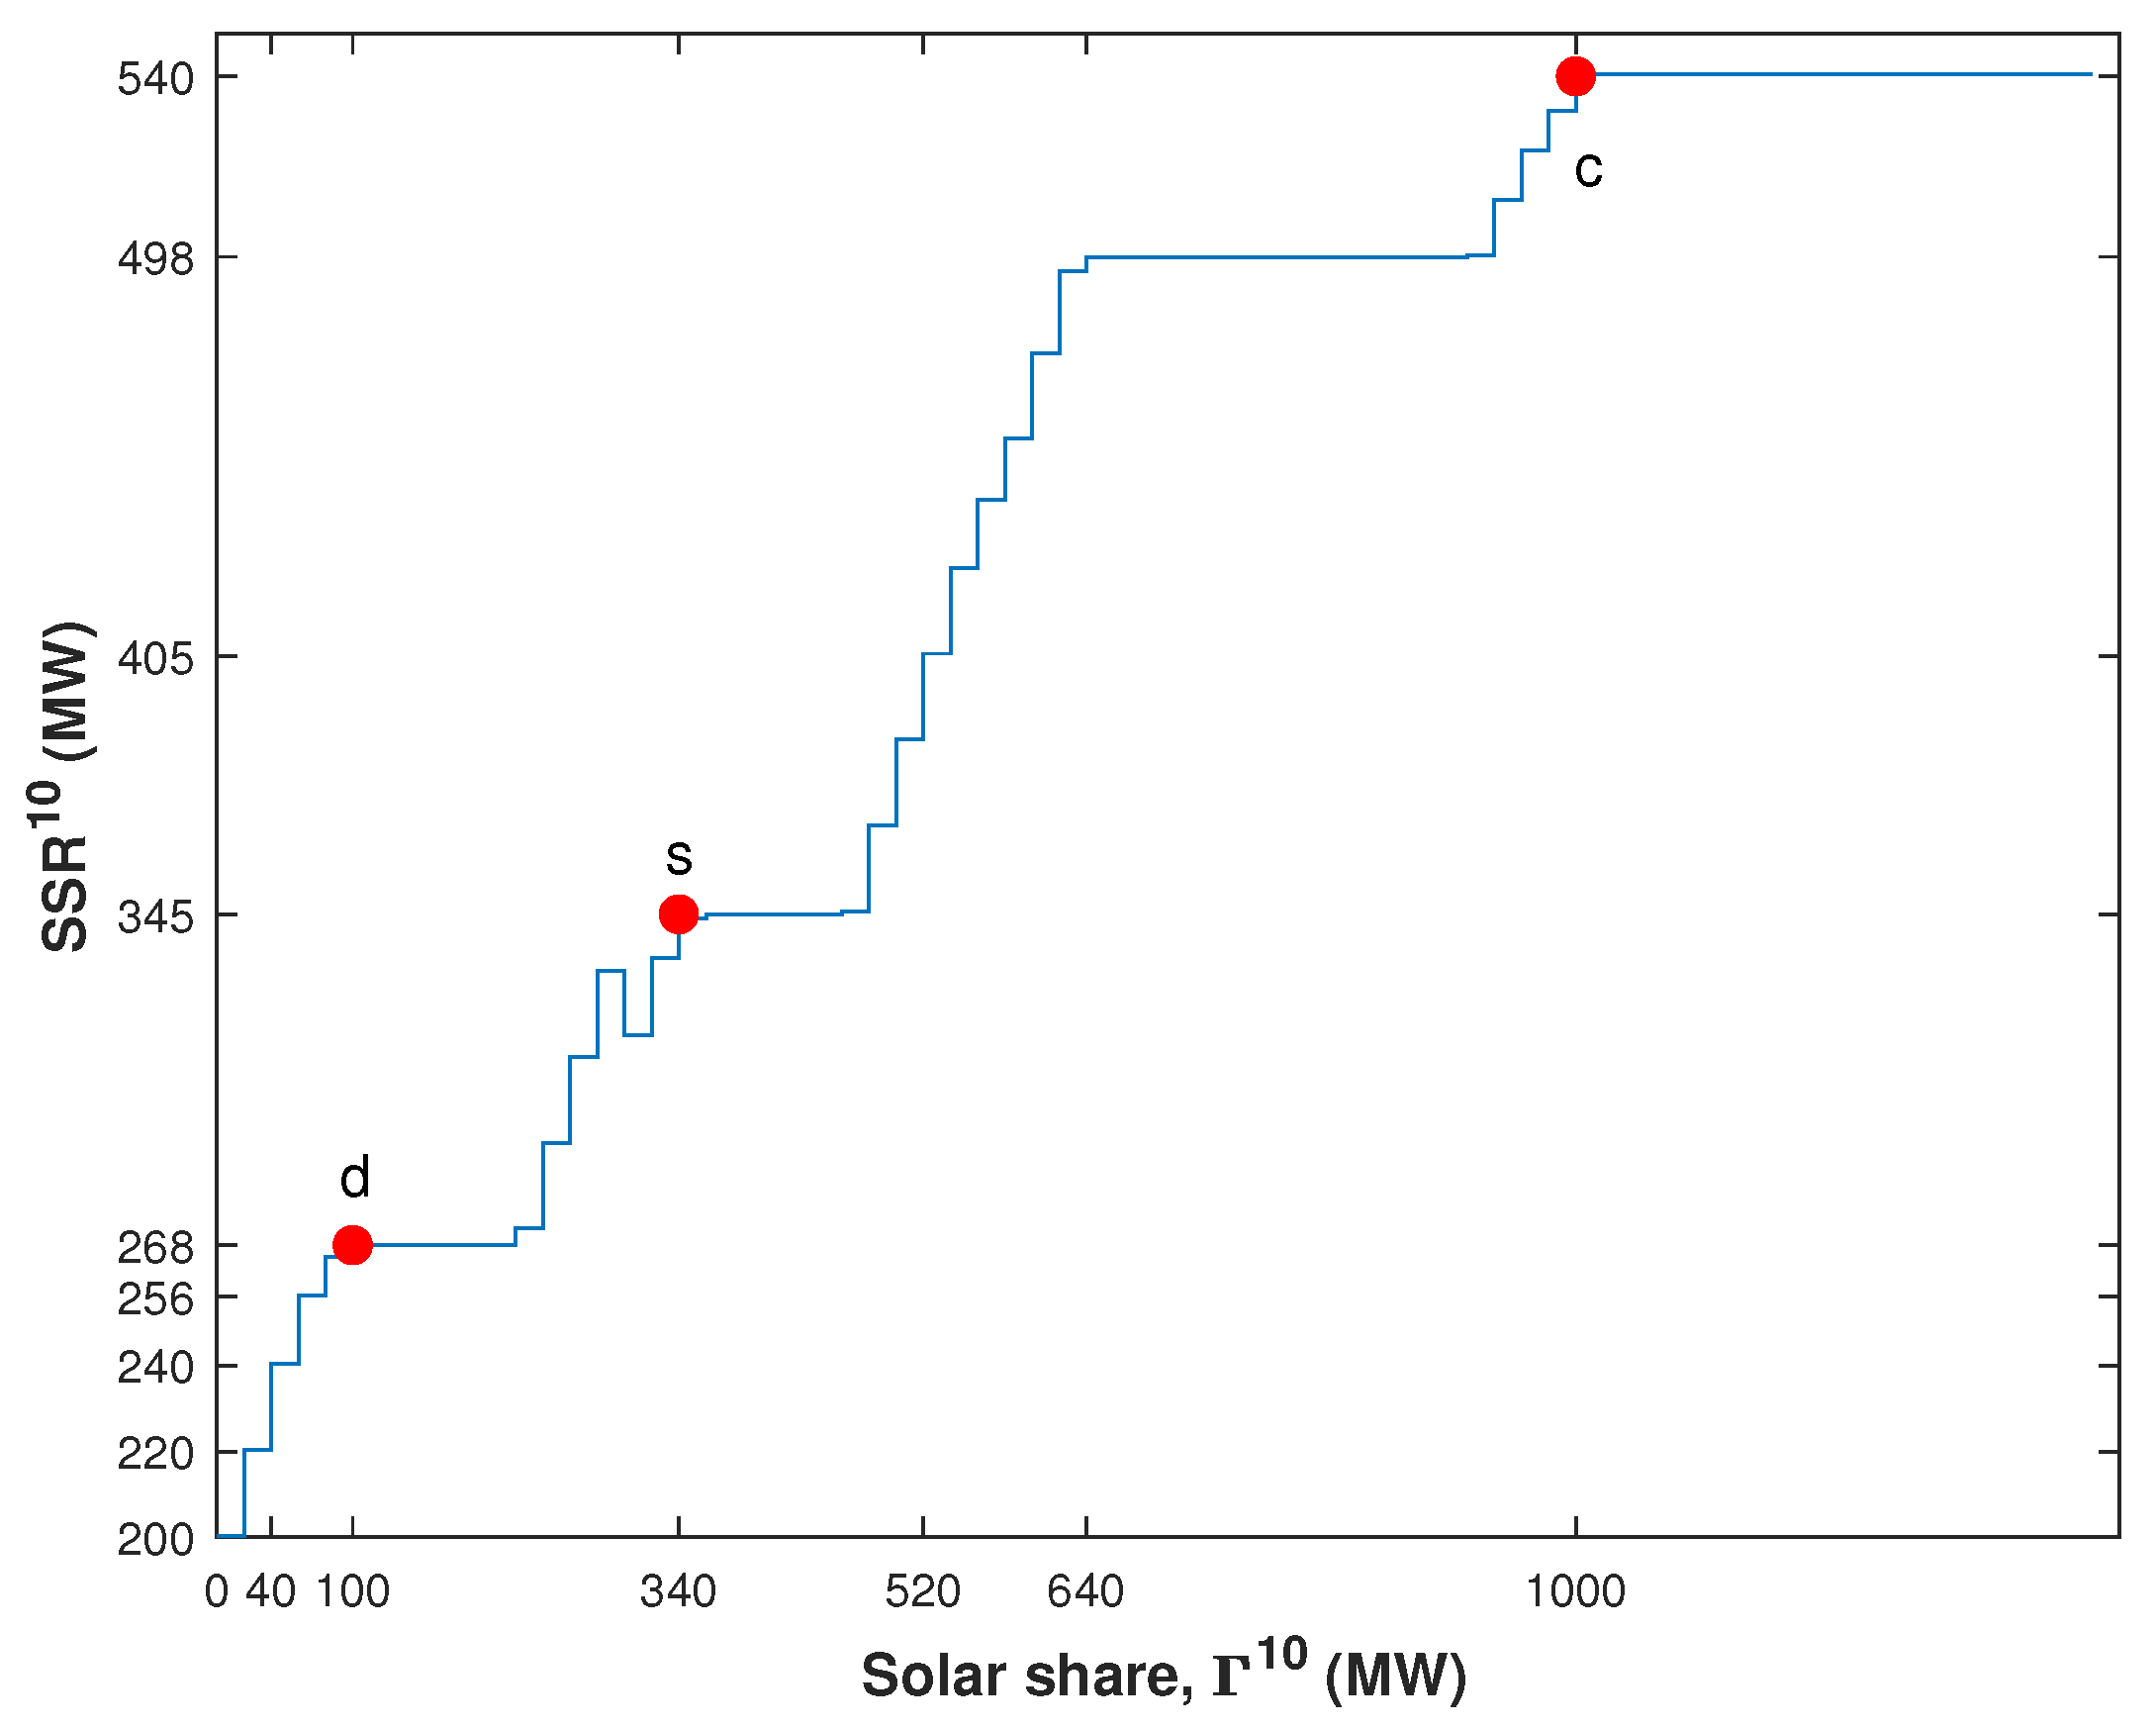
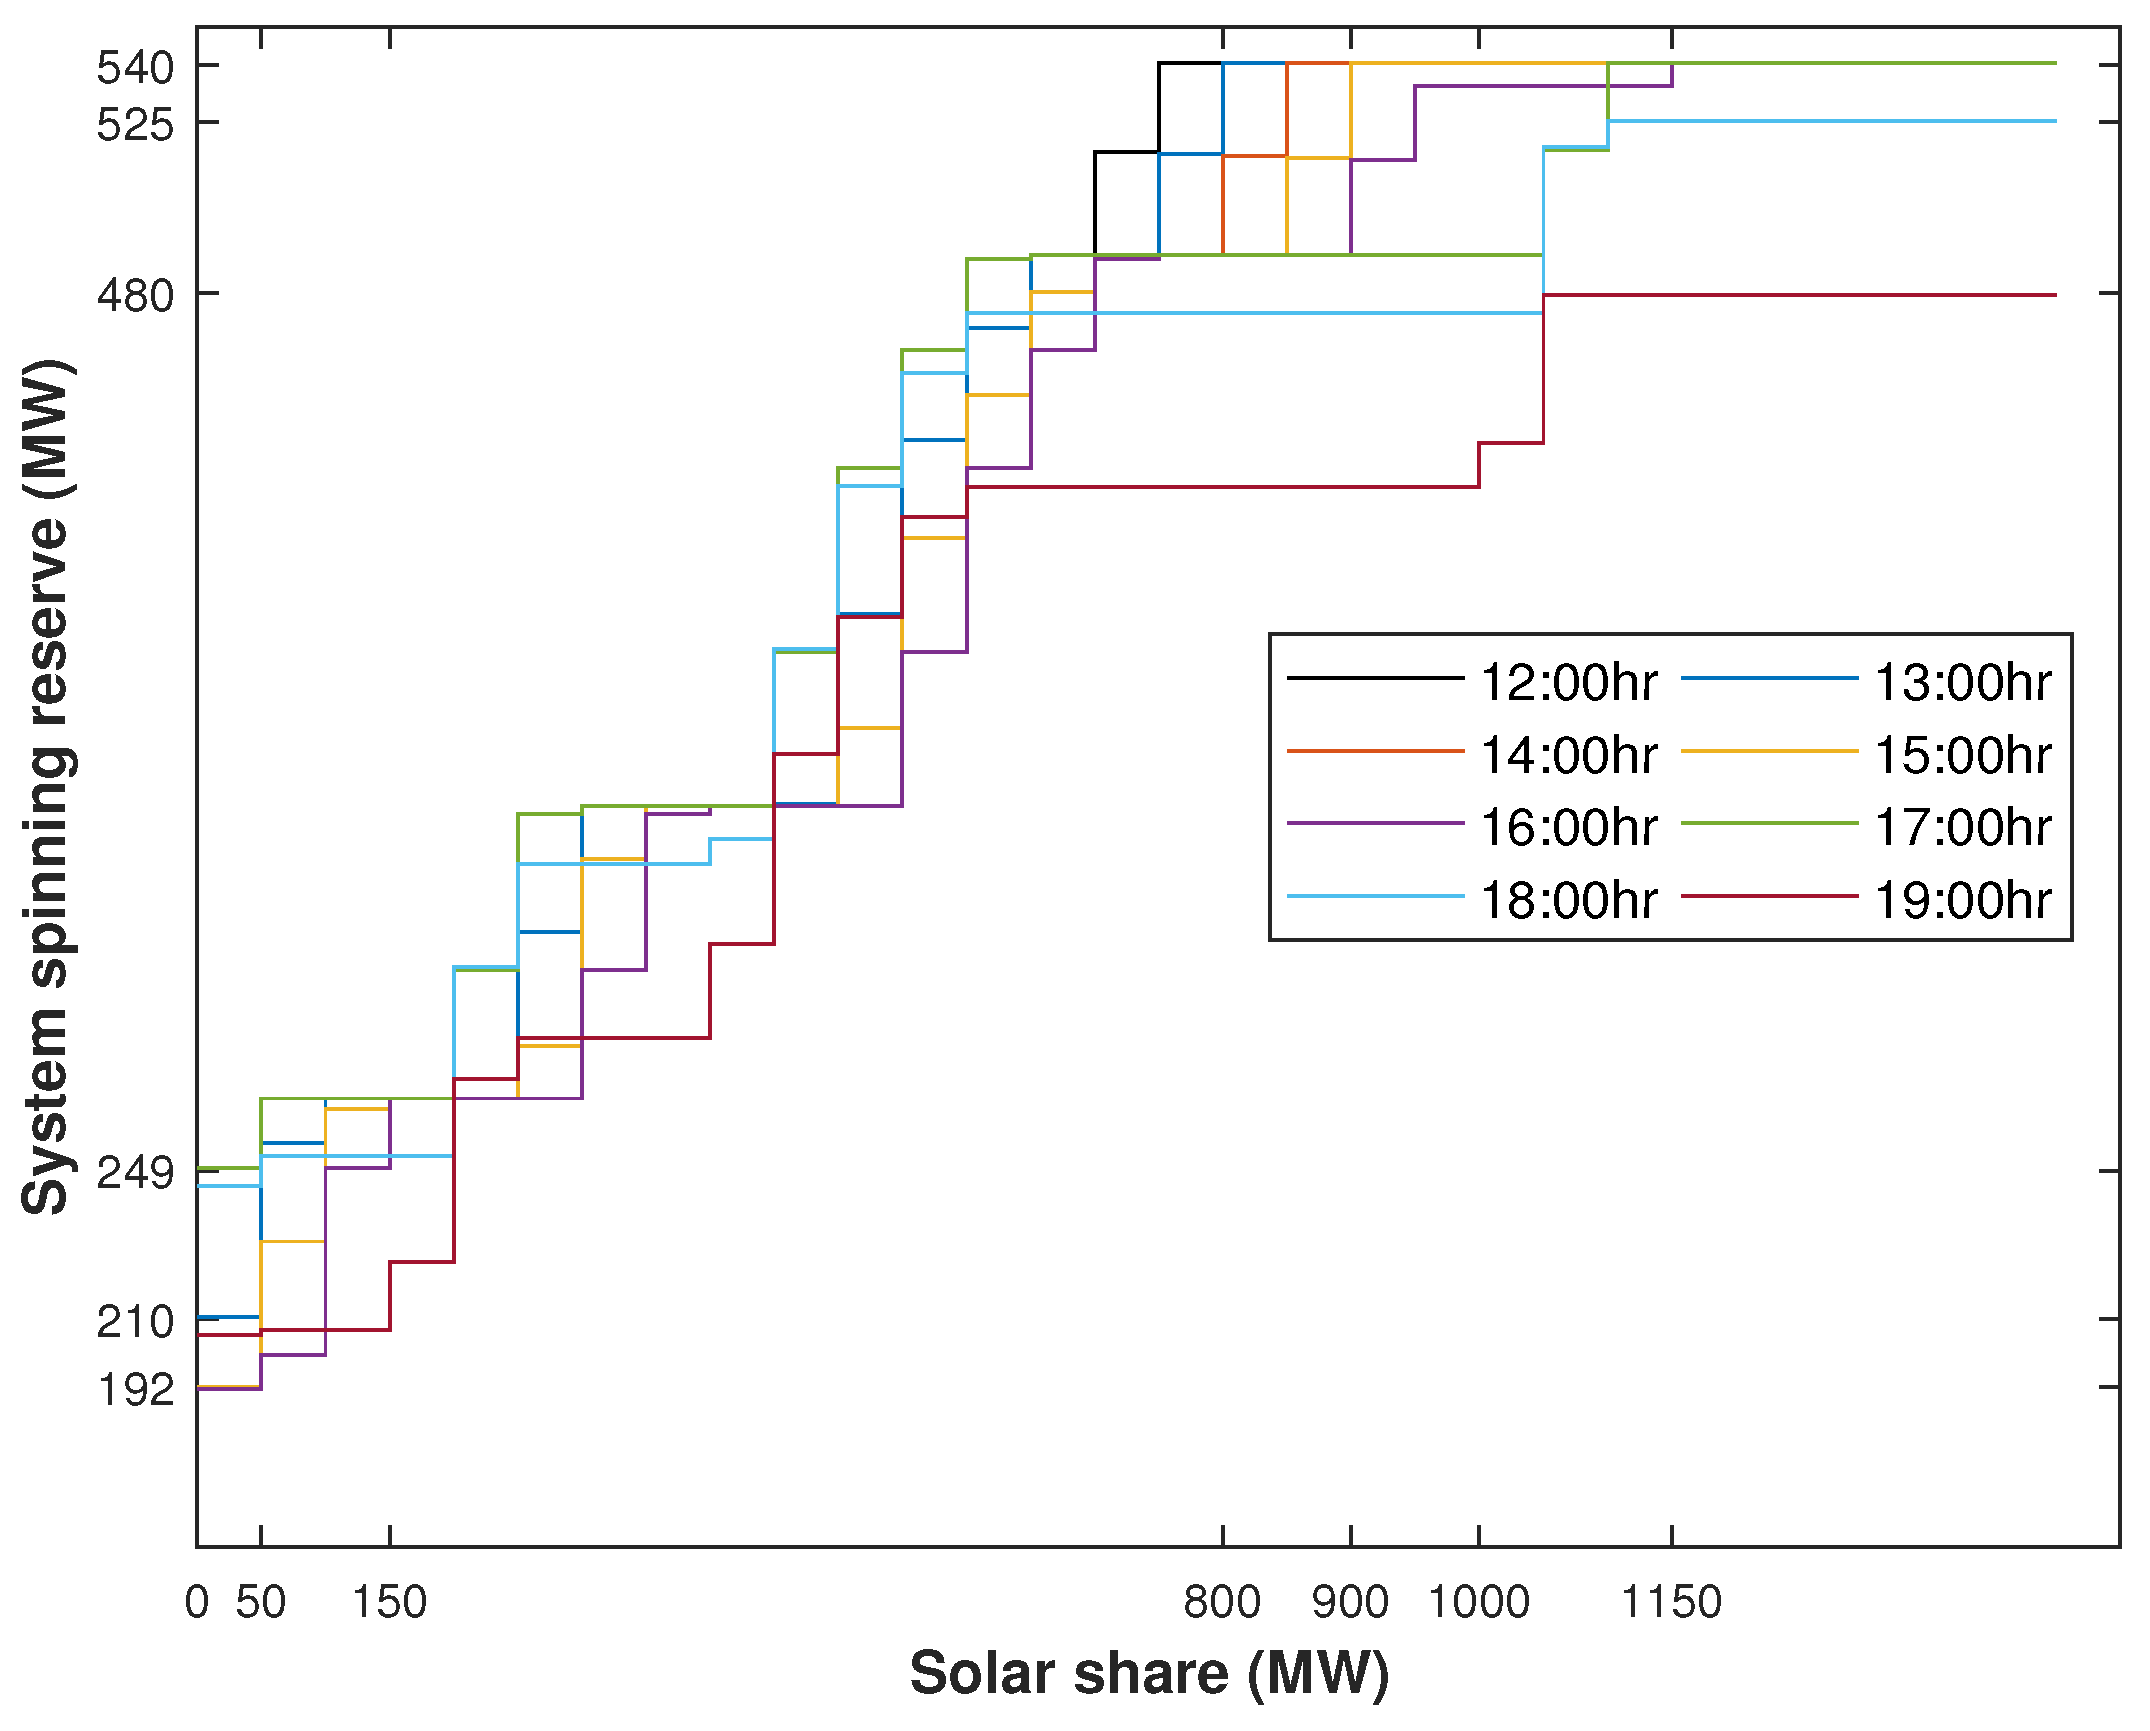
When the solar power penetrates into the system, the overall thermal share is reduced to satisfy the specified load demand, and the power outputs of individual thermal units are adjusted to new set points. As a result, the is increased, and it cannot exceed . As our objective is to maximize the solar share, the algorithm keeps on adding the solar power until the is reached or other constraints limit the level of the penetration of solar share. The variations and convergence of with changes in solar power share in the 10-th hour of a day are depicted in Figure 4. The SSR allocated with ORCUC in this hour, i.e., , is 200 MW. When the solar share of in the 10-th hour is included in the system with a step size of = 20 MW and when ED is executed for every step of the solar share inclusion, the starts to increase from its initially allocated value.
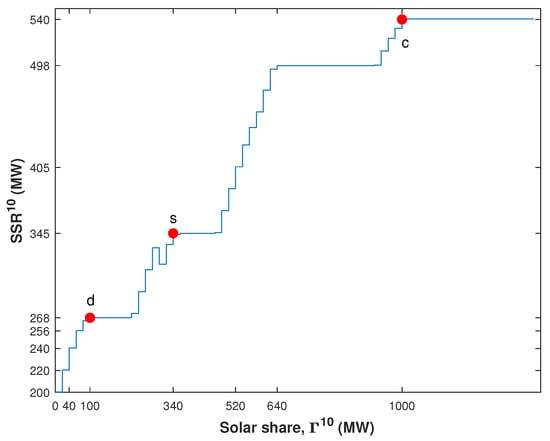
Figure 4.
SSR variation with respect to solar share at 10-th hour. d: and is not allowed to be dispatched for solar outage. s: and is allowed to be dispatched for solar outage. c: ultimate .
The and at points ‘c’, ‘d’, and ‘s’ are denoted as , , , , , and . At point ‘c’ the has been converged to the , and it does not increase further when the solar share is moved beyond the point due to the ramping-up constraint. The ‘s’ point is located where becomes equal or nearly equal to , and it is evident from Figure 4 that at point ‘s’, the = 345 MW is slightly greater than = 340 MW. Beyond this point, toward point ‘c’, the comes out to be less than , which reveals that the robust SSR can be allocated until this point ‘s’. Thus, the range of the robust SSR for the 10-th hour comes out to be within 0 MW 345 MW and the maximum solar share, i.e., () comes out to be 340 MW. Within this range of the robust SSR, the system has sufficient reserve power to compensate for the power deficit in case of the occurrence of either a thermal contingency event or complete/partial solar power outage, whichever event occurs first. However, the system will experience a power deficit if both events occur simultaneously. Similarly, the power deficit is experienced if is adjusted more than , i.e., the point of system operation is moved beyond point ‘s’ toward ‘c’. A scenario is considered in which the power system is being operated at point ‘x’ such that the solar share is MW >. Let the corresponding value of the SSR be MW and suppose that the complete outage of solar power occurs. For this outage of MW, the system is able to serve only MW, and the rest of the solar outage, i.e., MW, remains uncompensated. Thus, the power deficit is experienced by the system as given below:
For instance, if 520 MW of solar share is intended to be added in the system, the corresponding SSR comes out to be 405 MW, as can be seen in Figure 4. Thus, the power deficit for this solar outage will be 115 MW. To cope with the power deficit in case of the simultaneous outages of solar and thermal powers, a dedicated allocation to thermal, as well as solar contingencies, is proposed. The dedicated allocated to the thermal contingency events is and that for solar power outage is given as follows:
where is the SSR at point ‘d’ and calculated by executing ED repeatedly for every step increment of the solar share. For further illustration, Table 4 presents the values of and as functions of .

Table 4.
Variation in and .
It can be seen from the table that as well as increase as the increases. Furthermore, it is evident from the table that, initially, the robust comes out to be greater than the and becomes less than when increases beyond 100 MW. Thus, the upper limit of the robust SSR, which can handle simultaneous outages of thermal and solar powers, comes out to be 268 MW. In Figure 4, this value of the SSR is located at point ‘d’, i.e., , and the value of at this point is . Therefore, the limits of the robust SSR for simultaneous outages of thermal and solar powers are 200 MW 268 MW, and the solar share limit within the range of this robust appears to be 0 MW 100 MW. The variation in with a change in from the 11-th hour to the 19-th hour is presented in Figure 5.
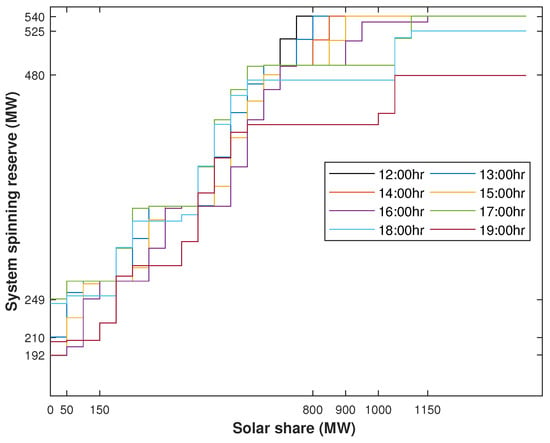
Figure 5.
Variation in the SSR with respect to the solar share from the 11-th to the 19-th hour of a day.
Table 2 presents the optimization results for the time window when solar power is available, i.e., from the 10-th hour to the 18-th hour. To elaborate on the results, the rows of the table are distributed in four parts. The first three parts of the table present the proposed ORCUC-based results, whereas the last part presents those without ORCUC. The first part of the table presents the resulting SSR for various conditions and corresponding solar share penetrations. It can be observed from the results that the robust SSR at point ‘s’, i.e., , always come out to be greater than the robust SSR at point ‘d’, i.e., . For instance, comes out to be 344 MW at the 10-th hour, where is 108 MW. This is due to fact that the SSR allocations in later condition are dedicated to respective outages, e.g., is not allowed to be dispatched if a solar outage occurs. As expected, similar relationships can be found in corresponding solar shares due to the same reason. The last row of this part presents the ultimate SSR, i.e., the maximum power outage supported by the system beyond which the failure of system operation occurs. The second part of the table presents the thermal shares at points ‘d’ and ‘s’. The thermal share at any point depends on the load demand and solar share at that point. The thermal share increases with an increase in load demand and decreases as the solar share is increased and vice versa. For instance, the load demand increases from 2600 MW at 10:00 h to 2670 MW at 11:00 h, and the solar share decreases from 340 MW to 260 MW. Thus, the thermal share is increased from 2260 MW to 2410 MW. The third portion of table presents the impact of the total solar outage () on the fuel cost at point ‘s’. In this case, the thermal power generation is supposed to meet the load demand without any energy deficit. Thus, for a given load demand, the fuel cost is increased in case of solar contingency. For simplicity, the similar results of point ‘d’ are not demonstrated. Finally, in the last part of the table, the resulting cost for the case if the optimal reserve is neglected in UC are presented. It can be seen that the fuel cost increased in this case because an excessive reserve cost was emerged due to an unoptimized reserve. To demonstrate the results more completely, the UC schedules of the thermal units are presented in Table 1, and the corresponding powers of the units, ED-optimized, are shown Table 5.

Table 5.
Dispatch results of thermal generation units.
The system has 40 solar plants of different power ratings that are assumed to be distributed across the power system and to take part in the system operation. The data for the solar plants are presented in Table 6.

Table 6.
Power ratings and PU costs of solar plants.
In this study, the power ratings of the solar plants were chosen arbitrarily. However, these power ratings may have many interesting impacts on the results of sub-problem II. For instance, the second objective of sub-problem II is to maximize the number of participating solar plants. If the installed solar capacity involves the plants of lower power ratings, more plants will be selected to participate in the dispatch for a specified solar share. In this case, if the solar outage occurs, the impact of such an outage will be lesser due to the lower power rating of the solar plant under contingency. On the other hand, solar costs will be increased. Furthermore, the lower power ratings of the solar plants ensure a more accurate convergence in terms of constraint (19). There may exist numerous other similar impacts; however, the evaluation of such impacts is beyond the scope of this study.
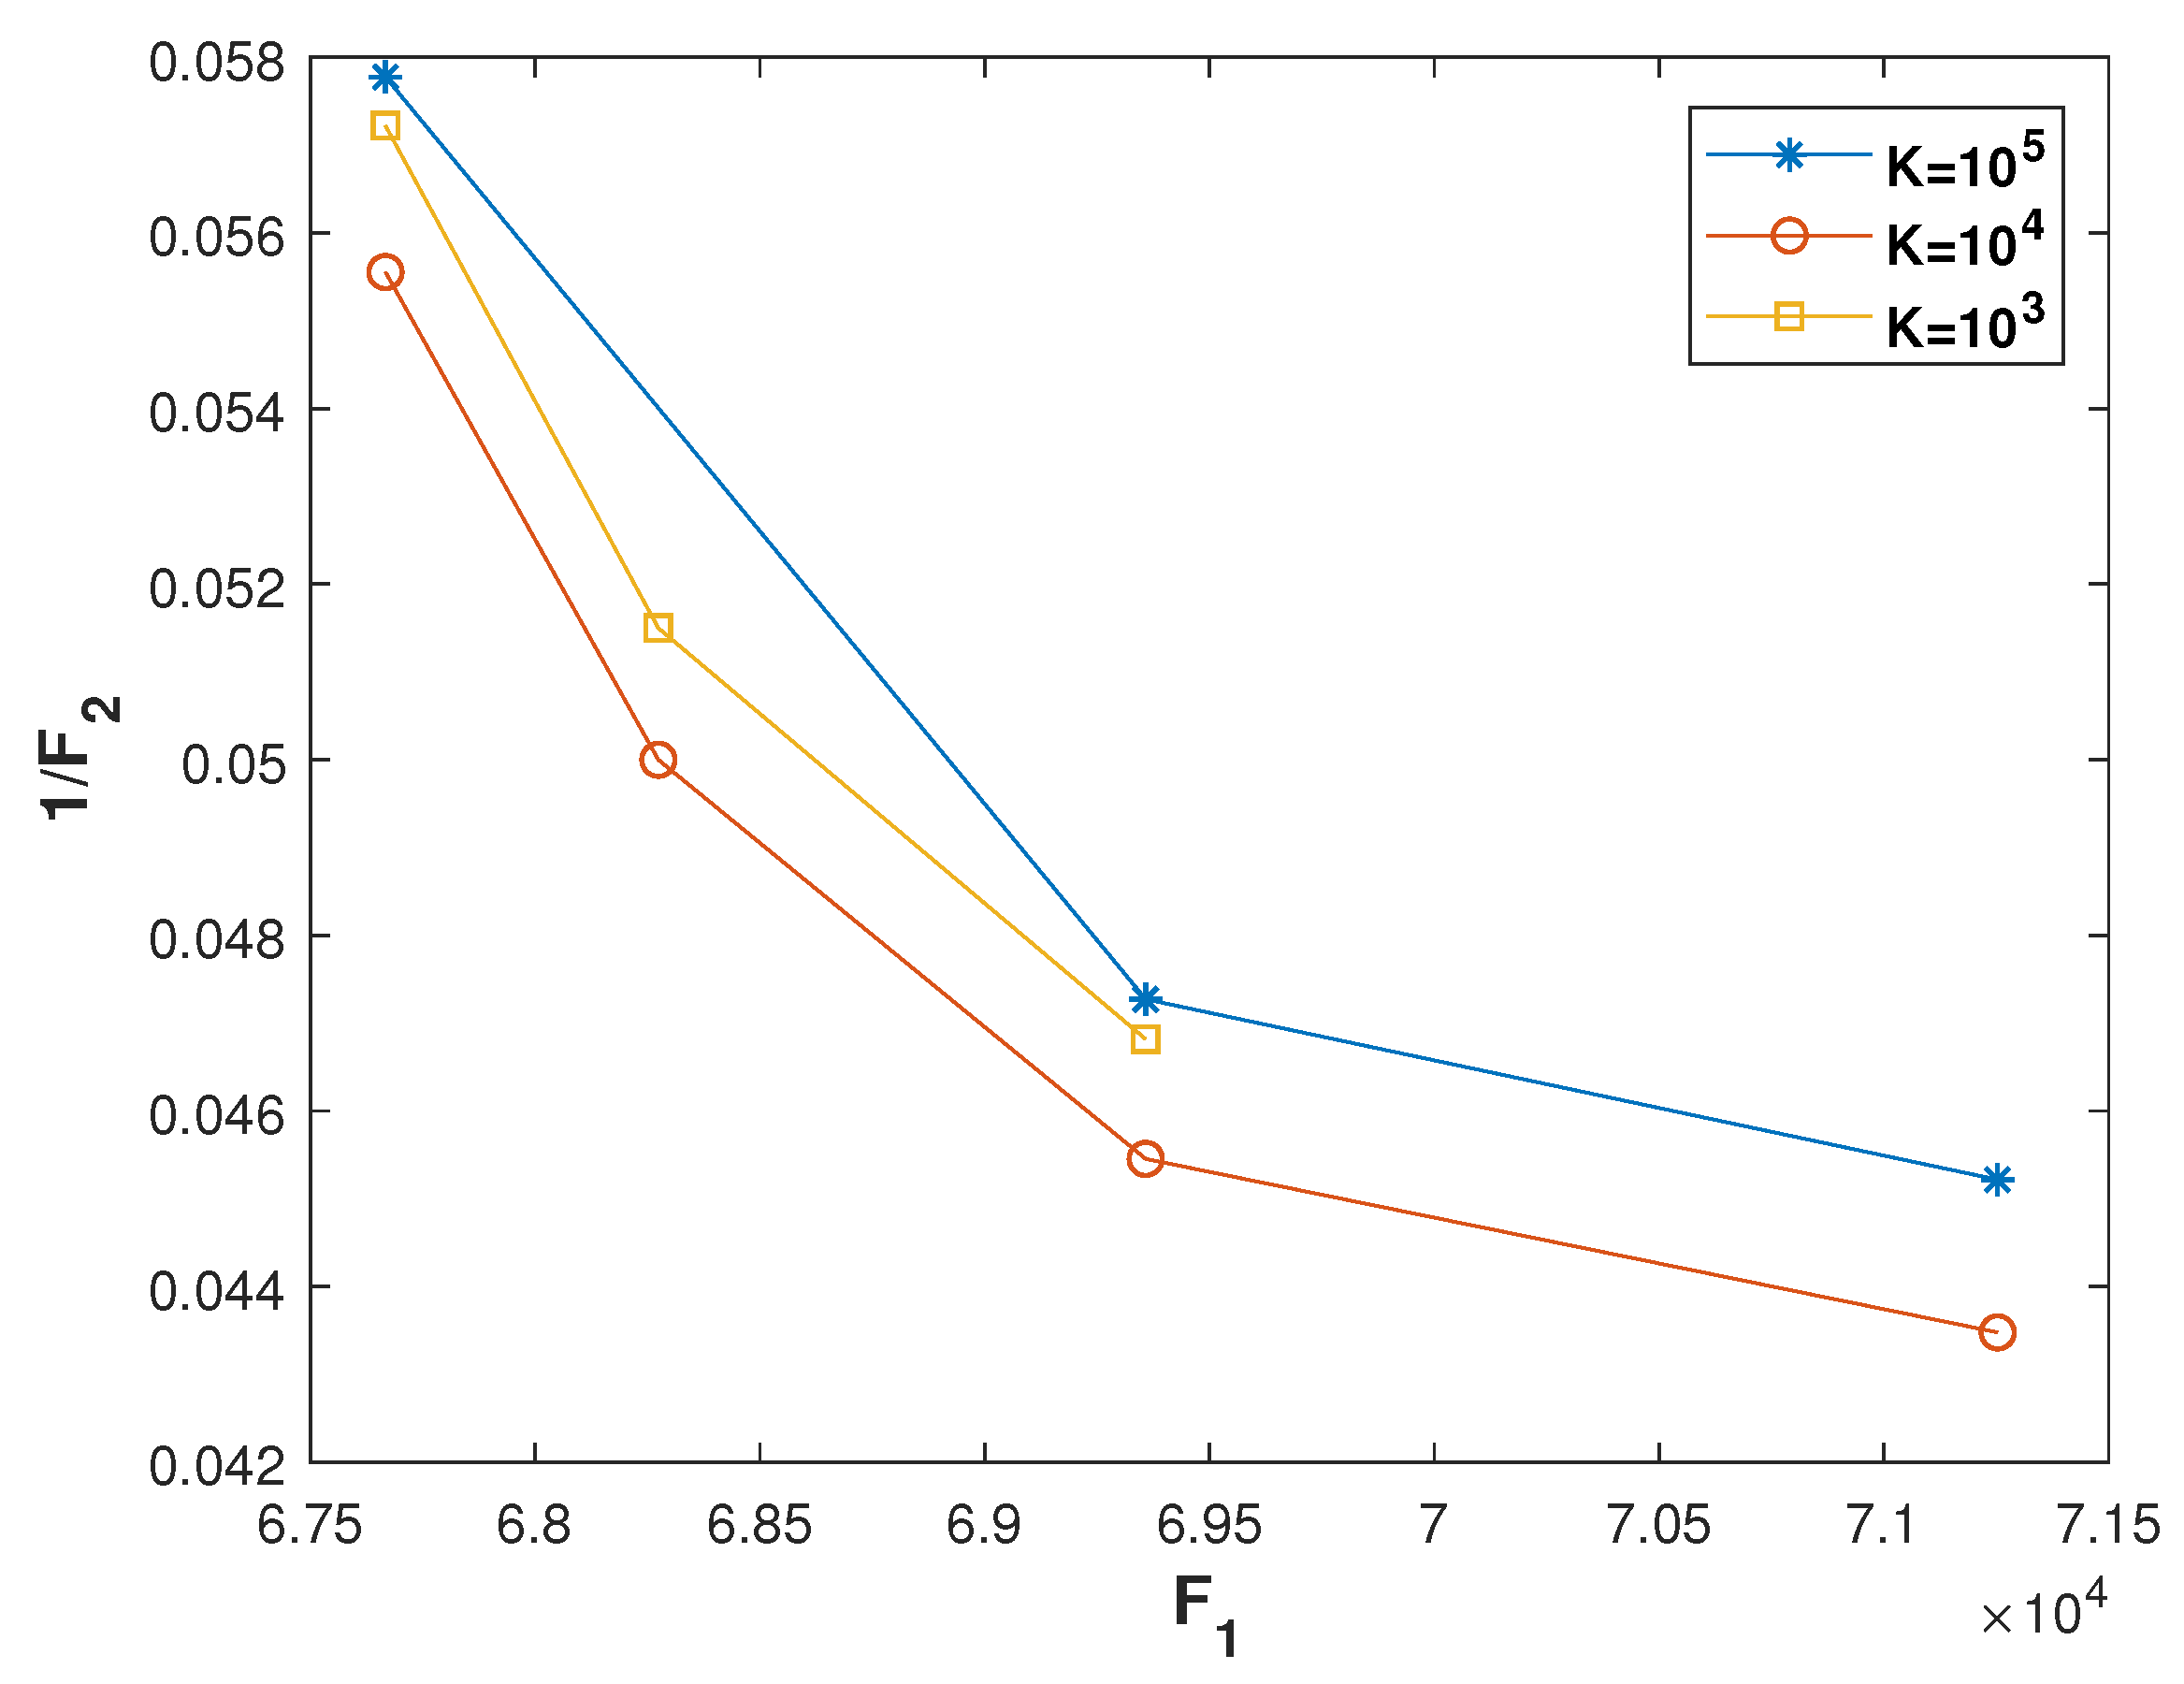
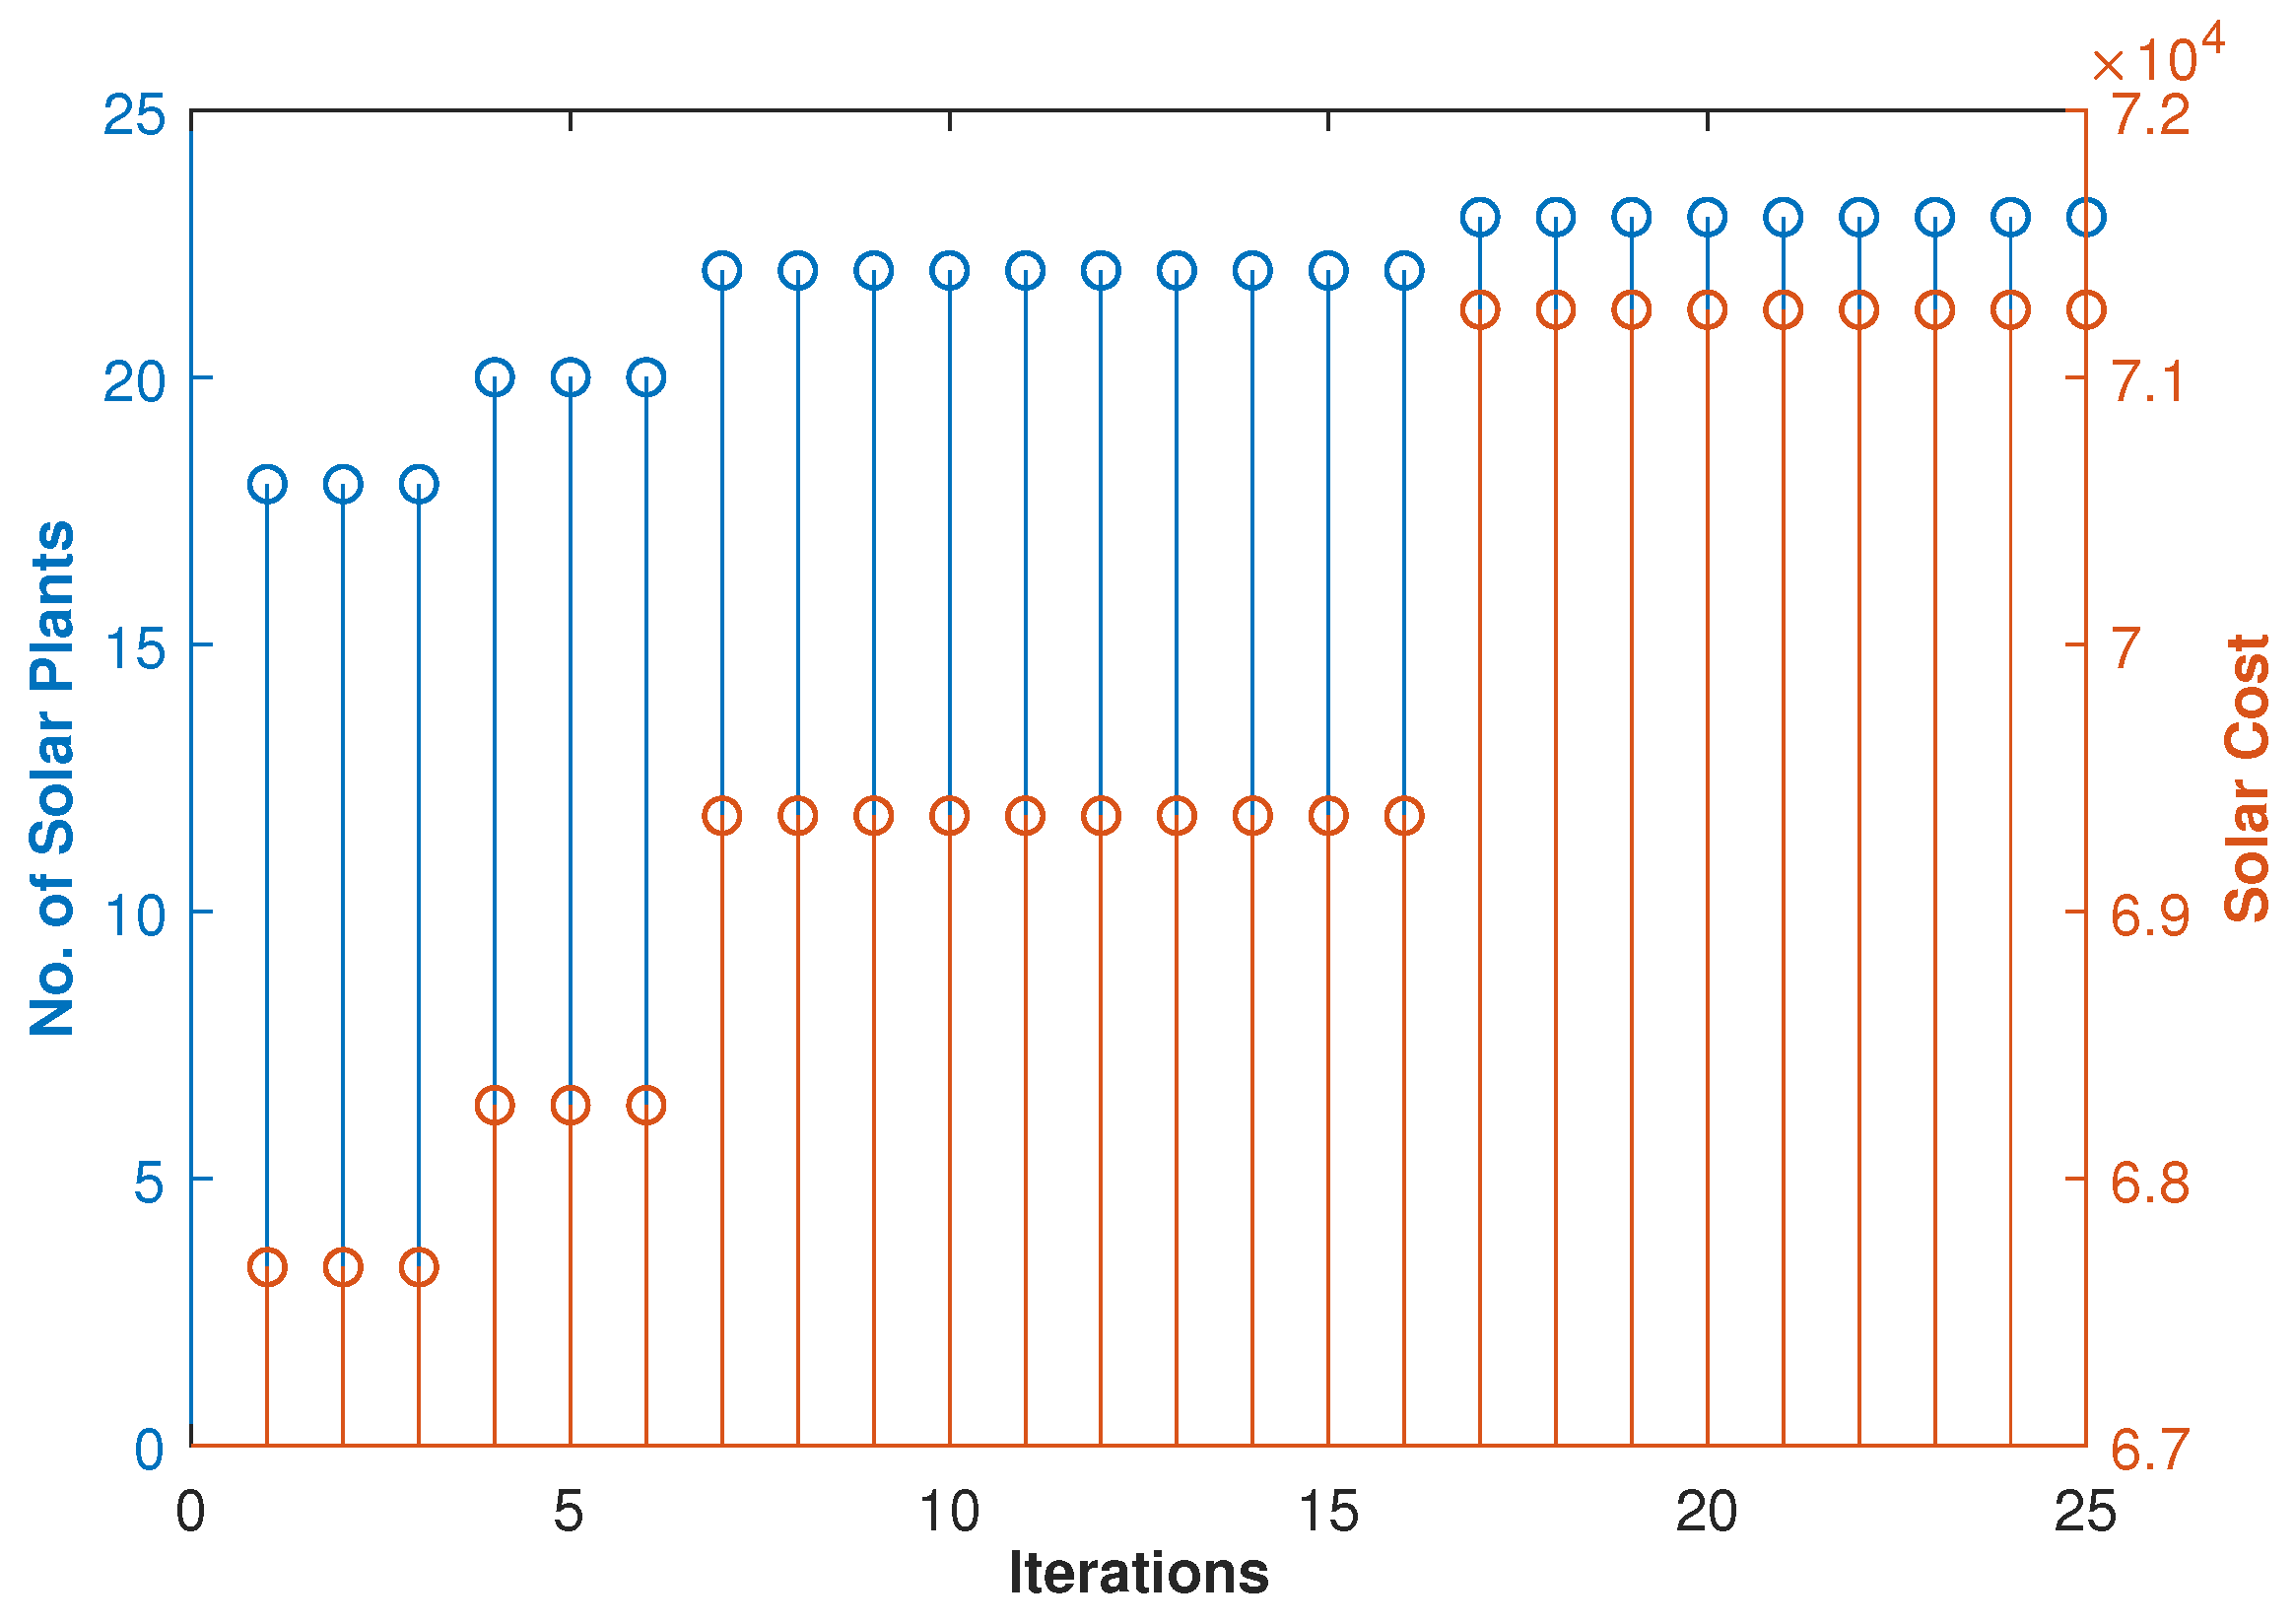
Weight is initially set to 1 and reduced successively with the iterations, while is increased accordingly, and the value of K is set to . Figure 6 depicts the impact of different values of K on the solution of sub-problem II for an arbitrarily chosen time slot t = 1000 h. In this figure, the horizontal axis represents the objective , and the vertical axis represents multiplicative inverse of the objective . It can be seen from the figure that the highest number of Pareto-optimal solutions are obtained with the value of K set to compared to the other values. As the algorithmic behavior is similar for all the time slots, the similar results for the rest of the time slots are not shown. Figure 7 shows the variations in and with respect to various settings of and . In this figure, the horizontal axis represents the number of iterations, where for each iteration, distinct values are assigned to and . The vertical axis on the left side shows the number of selected solar plants, and the vertical axis on the right side depicts the cost associated with the selected solar plants. It can be seen from the figure that, initially, less solar plants are selected for a specified solar share, and the number of plants is increased as further iterations are elapsed. Similarly, the solar cost is increased in the same manner with the passage of iterations. Such an increase in the number of solar plants as well as the solar cost are due to different values of and , respectively. For instance, the lesser plants are selected for initial iterations because is initiated with a low value. As our objective is to maximize the number of solar plants, higher values are assigned to with the passage of iterations, which increases the significance of the maximization of . As a result, more solar plants are selected for a higher number of iterations. On the other hand, the solar cost is increased as more iterations are elapsed because its associated weight is decreased successively. Since our objective is to minimize the solar cost, its significance is reduced with the passage of iterations, which results in an increase of the solar cost. Interestingly, the solar cost and the number of selected plants are discrete functions of the weights and , respectively. For instance, it can be observed from the figure that 18 solar plants are selected during the first three iterations, and an increase in the value of from 0.0100 to 0.0300 has no effect on the maximization of solar plants. At iteration number 4, the number of selected plants is increased to 20 when is assigned the value of 0.0400 and remains unchanged until = 0.0700 at iteration number 7. Such discrete variations are due to binary optimization. Thus, it is essential to note that only a few Pareto optimal solutions can be obtained with this optimization. Therefore, appropriate step sizes of weights and , as well as an appropriate number of iterations, must be chosen carefully in such an optimization. The step sizes of the weights were set empirically to be 0.0100 for our case.
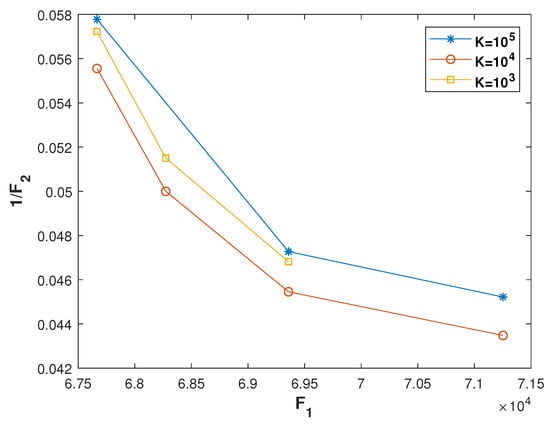
Figure 6.
Effect of ‘K’ on sub-problem II.
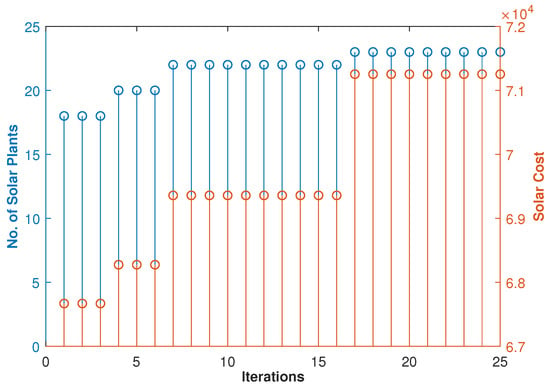
Figure 7.
Results of sub-problem II: number of selected solar plants vs. solar cost over 25 iterations.
Too small or too large a step size will result in a reduced number of solutions for a specified number of iterations. Similarly, too small a number of iterations results in a reduced number of solutions, whereas too large a number of iterations results in excessive computational effort without exploring any further solutions. It can be analyzed from Figure 7 that if the number of iterations is reduced, one may obtain less solutions. For instance, if the number of iterations is set to 10, the resulting number of solutions is reduced to 3, and so on.
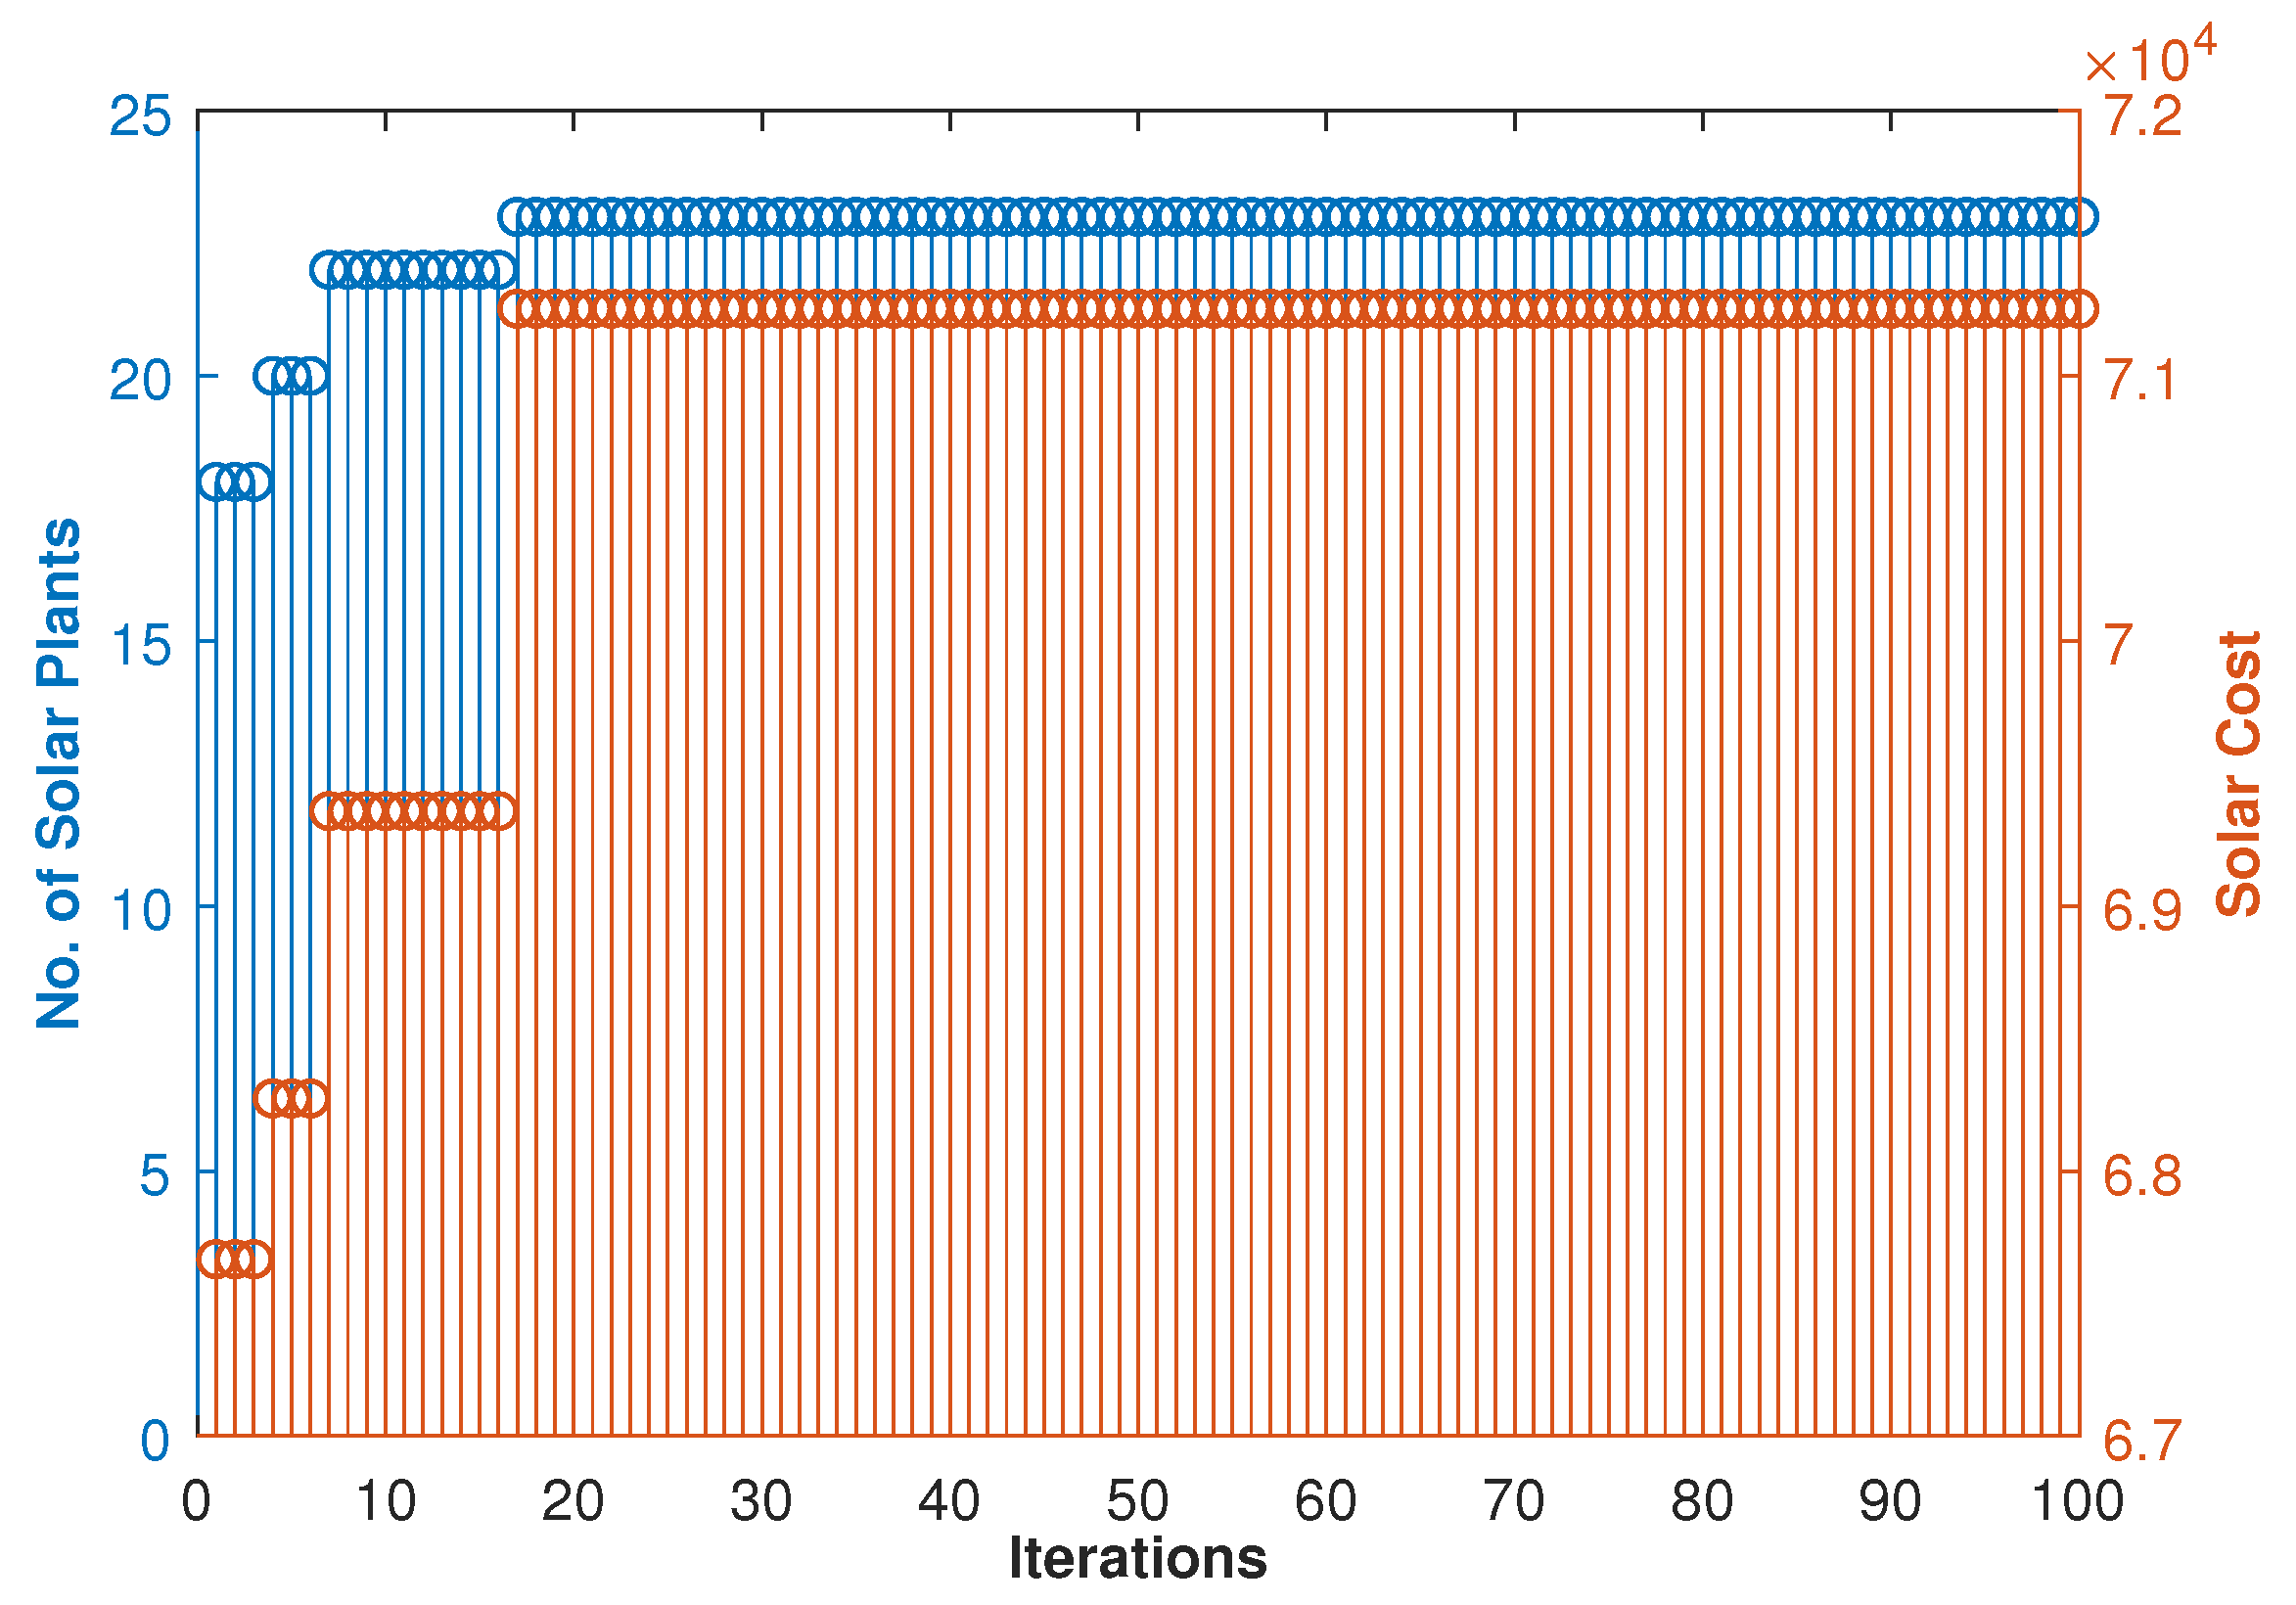
Figure 8 depicts the results for 100 iterations. In this figure, 100 iterations are implemented to ensue that and cover the entire range of possible values, i.e., 0 ≤ ≤ 1. In comparing Figure 7 and Figure 8, it can be observed that further solutions cannot be achieved after 25 iterations. The aforementioned discussions reveal that the solar share maximization and the solar cost minimization are contradictory objectives. Furthermore, as only a few Pareto-optimal solutions are possible, the choice of the final solution depends on the priorities established by the system operator. For instance, the system operator may choose an appropriate solution based on the priorities of the objectives. Different system operators may have different priorities based on the local energy market and the energy policies of the territory. For instance, some system operators may assign higher ranks to the cost of operation, while reliable system operation may be more significant for the others.
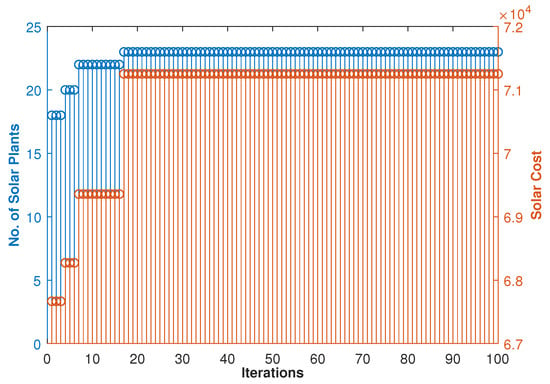
Figure 8.
Results of sub-problem II: number of selected solar plants vs. solar cost over 100 iterations.
5. Conclusions
In this study, a comprehensive model was developed for the economic operation of HPS, which is more robust against the loss of load in case of thermal contingencies as well as solar power outages. To facilitate the solution, a composite optimization was decomposed into two sub-problems. An ORC model for UC was proposed, and it adopted a new approach to allocate robust SSR as well as to determine the maximum limit of the solar share within the range of a robust SSR. The proposed model involved the computation of the limits of the robust SSR for the solar share, the maximum bound on the solar share within the limits of the robust SSR, and the ultimate SSR. Based on such evaluations, the optimization was solved for the committed thermal units to minimize fuel costs, maximize the solar share, maximize the number of participating solar plants, and minimize the solar cost. The following points have been concluded:
- (i)
- Committed thermal units could provide a limited robust SSR to facilitate a given solar share. Thus, the amount of penetrated solar share at any time was limited by the available robust reserve at that time. For instance, came out to be 345 MW and 108 MW for solar shares of 340 MW and 100 MW, respectively, depending on the condition whether was allowed to be dispatched or restricted for a solar power outage event. Beyond these allocations, the robust SSR starts to become smaller than the solar share; therefore, loss of load would be experienced by the power system for a complete outage of the solar share.
- (ii)
- A set of committed units in a time slot could provide a certain amount of the ultimate SSR, which is 540 MW in the case of the 10-th hour.
- (iii)
- Only a few such solutions were obtainable within the feasible binary search space when Pareto-optimal solutions were obtained for the contradictory objectives of solar cost minimization and the maximization of the number of solar plants. The highest number of such solutions were obtained with the value of parameter K empirically set to . Although this work investigated many critical issues of HPS, some aspects, such as network constraints, storage systems, and RE sources other than solar power, have not been covered.
Future directions to this work may involve the addition of dispatchable loads, a storage system, RE based hydrogen production, emissions, network constraints, and other RE sources to our proposed model. The inclusion of all these features will make our model more practical and more complete. Furthermore, the inclusion of a storage system will enhance the range of the robust SSR, and thus, the maximum limit of RE share under a robust SSR will be increased. However, the addition of all these features will result in a more challenging optimization.
Author Contributions
Conceptualization, R.M.M.S., N.A.K. and G.A.S.S.; Methodology, R.M.M.S. and M.A.B.; Software, R.M.M.S., N.A.K. and M.S.; Validation, N.A.K. and A.B.A.; Formal analysis, R.M.M.S., N.A.K., M.S., G.A.S.S. and A.B.A.; Resources, G.A.S.S.; Writing—original draft, R.M.M.S., N.A.K. and M.S.; Writing—review & editing, G.A.S.S., A.B.A. and M.A.B.; Supervision, G.A.S.S. and M.A.B.; Project administration, A.B.A. and M.A.B.; Funding acquisition, A.B.A. and M.A.B. All authors have read and agreed to the published version of the manuscript.
Funding
This research received no external funding.
Data Availability Statement
The original contributions presented in the study are included in the article, further inquiries can be directed to the corresponding author.
Acknowledgments
The authors express their sincere appreciation to the Surrey Institute for People-Centred Artificial Intelligence at the University of Surrey, Guildford, United Kingdom-GU2 7XH and Ajman University, Ajman, United Arab Emirates for their valuable support to accomplish and publish this research work.
Conflicts of Interest
The authors declare no conflicts of interest.
Abbreviations
The following abbreviations are used in this manuscript:
| Binary variable used to represent whether loss of load occurs when an
outage of the i-th unit occurs in period t; | |
| Binary variable used to represent whether loss of load occurs when a simultaneous outage of units i and j occurs during period t; | |
| Expected energy not served during time t; | |
| Power generated by the i-th thermal unit in time t; | |
| The minimum power of the i-th unit; | |
| The maximum power of the i-th unit; | |
| Penetrated solar power in time t; | |
| Power generated by the j-thsolar plant; | |
| Binary variable used to represent the ON and OFF status of a solar plant; | |
| Power demand in interval t; | |
| Outage probability of the i-th unit at time t; | |
| Probability of the simultaneous outage of the i-th and j-th unit at time t; | |
| Up-reserve power of the i-th unit in time t; | |
| Down-reserve power of the i-thunit in time t; | |
| Ramp-up rate of the i-th unit; | |
| Ramp-down rate of the i-th unit; | |
| Solar radiation at any given time t; | |
| System spinning reserve available at time t; | |
| Allocated SSR in time interval t; | |
| Optimal SSR for first- and second-order thermal contingency event; | |
| The ultimate in time interval t; | |
| T | Time duration of each optimization interval; |
| Ambient temperature; | |
| Consecutive cumulative ON time of the i-th unit until time t; | |
| Consecutive cumulative OFF time of the i-th unit until time t; | |
| The minimum uptime of the thermal generator; | |
| The minimum downtime of the thermal generator; | |
| Binary variable for the ON and OFF status of the i-th thermal unit at time t; | |
| Reference cell temperature; | |
| Value of lost load; | |
| Outage replacement rate of unit i; | |
| Temperature coefficient; | |
| Rated power of the j-th solar plant; | |
| The maximum allowable time for a thermal unit to ramp up or down; | |
| Per unit cost of the j-th solar plant; | |
| Step size for solar share increment; | |
| The maximum limit of the solar share within a robust range of the SSR; | |
| The maximum solar share for the range in which a power deficit is experienced by the power system; | |
| Solar share based on the SSR during time t; | |
| The maximum limit of the solar share during time t. |
References
- Adefarati, T.; Bansal, R.; Shongwe, T.; Naidoo, R.; Bettayeb, M.; Onaolapo, A. Optimal energy management, technical, economic, social, political and environmental benefit analysis of a grid-connected PV/WT/FC hybrid energy system. Energy Convers. Manag. 2023, 292, 117390. [Google Scholar] [CrossRef]
- Wood, A.J.; Wollenberg, B.F.; Sheblé, G.B. Power Generation, Operation, and Control; John Wiley & Sons: Hoboken, NJ, USA, 2013. [Google Scholar]
- Chiang, C.L. Genetic-based algorithm for power economic load dispatch. IET Gener. Transm. Distrib. 2007, 1, 261–269. [Google Scholar] [CrossRef]
- Jeyakumar, D.; Jayabarathi, T.; Raghunathan, T. Particle swarm optimization for various types of economic dispatch problems. Int. J. Electr. Power Energy Syst. 2006, 28, 36–42. [Google Scholar] [CrossRef]
- Lee, K.Y.; Sode-Yome, A.; Park, J.H. Adaptive Hopfield neural networks for economic load dispatch. IEEE Trans. Power Syst. 1998, 13, 519–526. [Google Scholar] [CrossRef]
- Mantawy, A.; Soliman, S.; El-Hawary, M. A new tabu search algorithm for the long-term hydro scheduling problem. In Proceedings of the LESCOPE’02—2002 Large Engineering Systems Conference on Power Engineering, Halifax, NS, Canada, 26–29 June 2002; pp. 29–34. [Google Scholar]
- Ardakani, F.F.; Mozafari, S.B.; Soleymani, S. Scheduling energy and spinning reserve based on linear chance constrained optimization for a wind integrated power system. Ain Shams Eng. J. 2022, 13, 101582. [Google Scholar] [CrossRef]
- Ahmadi-Khatir, A.; Bozorg, M.; Cherkaoui, R. Probabilistic spinning reserve provision model in multi-control zone power system. IEEE Trans. Power Syst. 2013, 28, 2819–2829. [Google Scholar] [CrossRef]
- Lee, C.; Liu, C.; Mehrotra, S.; Shahidehpour, M. Modeling transmission line constraints in two-stage robust unit commitment problem. IEEE Trans. Power Syst. 2013, 29, 1221–1231. [Google Scholar] [CrossRef]
- An, Y.; Zeng, B. Exploring the modeling capacity of two-stage robust optimization: Variants of robust unit commitment model. IEEE Trans. Power Syst. 2014, 30, 109–122. [Google Scholar] [CrossRef]
- Brini, S.; Abdallah, H.H.; Ouali, A. Economic dispatch for power system included wind and solar thermal energy. Leonardo J. Sci. 2009, 14, 204–220. [Google Scholar]
- Khan, N.A.; Sidhu, G.A.S.; Gao, F. Optimizing combined emission economic dispatch for solar integrated power systems. IEEE Access 2016, 4, 3340–3348. [Google Scholar] [CrossRef]
- Khan, N.A.; Sidhu, G.A.S.; Awan, A.B.; Ali, Z.; Mahmood, A. Modeling and operation optimization of RE integrated microgrids considering economic, energy, and environmental aspects. Int. J. Energy Res. 2019, 43, 6721–6739. [Google Scholar] [CrossRef]
- Khan, N.A.; Awan, A.B.; Mahmood, A.; Member, I.; Razzaq, S.; Zafar, A.; Sidhu, G.A.S. Combined emission economic dispatch of power system including solar photo voltaic generation. Energy Convers. Manag. 2015, 92, 82–91. [Google Scholar] [CrossRef]
- Nikolaidis, P.; Chatzis, S.; Poullikkas, A. Renewable energy integration through optimal unit commitment and electricity storage in weak power networks. Int. J. Sustain. Energy 2019, 38, 398–414. [Google Scholar] [CrossRef]
- Lorca, A.; Sun, X.A. Multistage robust unit commitment with dynamic uncertainty sets and energy storage. IEEE Trans. Power Syst. 2016, 32, 1678–1688. [Google Scholar] [CrossRef]
- Psarros, G.N.; Papathanassiou, S.A. Comparative assessment of priority listing and mixed integer linear programming unit commitment methods for non-interconnected island systems. Energies 2019, 12, 657. [Google Scholar] [CrossRef]
- Ortega-Vazquez, M.A.; Kirschen, D.S. Estimating the spinning reserve requirements in systems with significant wind power generation penetration. IEEE Trans. Power Syst. 2008, 24, 114–124. [Google Scholar] [CrossRef]
- Wang, M.; Gooi, H.; Chen, S. Optimising probabilistic spinning reserve using an analytical expected-energy-not-supplied formulation. IET Gener. Transm. Distrib. 2011, 5, 772–780. [Google Scholar] [CrossRef]
- Wang, M.Q.; Gooi, H. Spinning reserve estimation in microgrids. IEEE Trans. Power Syst. 2011, 26, 1164–1174. [Google Scholar] [CrossRef]
- Ortega-Vazquez, M.A.; Kirschen, D.S. Optimizing the spinning reserve requirements using a cost/benefit analysis. IEEE Trans. Power Syst. 2007, 22, 24–33. [Google Scholar] [CrossRef]
- Wang, M.; Yang, M.; Liu, Y.; Han, X.; Wu, Q. Optimizing probabilistic spinning reserve by an umbrella contingencies constrained unit commitment. Int. J. Electr. Power Energy Syst. 2019, 109, 187–197. [Google Scholar] [CrossRef]
- Wen, X.; Abbes, D.; Francois, B. Stochastic optimization for security-constrained day-ahead operational planning under pv production uncertainties: Reduction analysis of operating economic costs and carbon emissions. IEEE Access 2021, 9, 97039–97052. [Google Scholar] [CrossRef]
- Nikolaidis, P.; Poullikkas, A. Co-optimization of active power curtailment, load shedding and spinning reserve deficits through hybrid approach: Comparison of electrochemical storage technologies. IET Renew. Power Gener. 2022, 16, 92–104. [Google Scholar] [CrossRef]
- Håberg, M. Fundamentals and recent developments in stochastic unit commitment. Int. J. Electr. Power Energy Syst. 2019, 109, 38–48. [Google Scholar] [CrossRef]
- Shukla, A.; Singh, S.N. Multi-objective unit commitment with renewable energy using hybrid approach. IET Renew. Power Gener. 2016, 10, 327–338. [Google Scholar] [CrossRef]
- Boqtob, O.; El Moussaoui, H.; El Markhi, H.; Lamhamdi, T. Optimal robust unit commitment of microgrid using hybrid particle swarm optimization with sine cosine acceleration coefficients. Int. J. Renew. Energy Res. (IJRER) 2019, 9, 1125–1134. [Google Scholar]
- Nikolaidis, P.; Chatzis, S. Gaussian process-based Bayesian optimization for data-driven unit commitment. Int. J. Electr. Power Energy Syst. 2021, 130, 106930. [Google Scholar] [CrossRef]
- Nikolaidis, P.; Poullikkas, A. A novel cluster-based spinning reserve dynamic model for wind and PV power reinforcement. Energy 2021, 234, 121270. [Google Scholar] [CrossRef]
- Alves, E.F.; Polleux, L.; Guerassimoff, G.; Korpås, M.; Tedeschi, E. Allocation of Spinning Reserves in Autonomous Grids Considering Frequency Stability Constraints and Short-Term Solar Power Variations. IEEE Access 2023, 11, 29896–29908. [Google Scholar] [CrossRef]
- George, D.T.; Raj, R.E.; Rajkumar, A.; Mabel, M.C. Optimal sizing of solar-wind based hybrid energy system using modified dragonfly algorithm for an institution. Energy Convers. Manag. 2023, 283, 116938. [Google Scholar] [CrossRef]
- Idoko, L.; Anaya-Lara, O.; McDonald, A. Enhancing PV modules efficiency and power output using multi-concept cooling technique. Energy Rep. 2018, 4, 357–369. [Google Scholar] [CrossRef]
- Bouffard, F.; Galiana, F.D. An electricity market with a probabilistic spinning reserve criterion. IEEE Trans. Power Syst. 2004, 19, 300–307. [Google Scholar] [CrossRef]
- Wang, C.; Shahidehpour, S. Effects of ramp-rate limits on unit commitment and economic dispatch. IEEE Trans. Power Syst. 1993, 8, 1341–1350. [Google Scholar] [CrossRef]
Disclaimer/Publisher’s Note: The statements, opinions and data contained in all publications are solely those of the individual author(s) and contributor(s) and not of MDPI and/or the editor(s). MDPI and/or the editor(s) disclaim responsibility for any injury to people or property resulting from any ideas, methods, instructions or products referred to in the content. |
© 2024 by the authors. Licensee MDPI, Basel, Switzerland. This article is an open access article distributed under the terms and conditions of the Creative Commons Attribution (CC BY) license (https://creativecommons.org/licenses/by/4.0/).

