Article

A New Tailored Approach to Calculate the Optimal Number of Outdoor Air Changes in School Building HVAC Systems in the Post-COVID-19 Era

by
Diana D’Agostino
1,
Martina Di Mascolo
2,
Federico Minelli
1 and
Francesco Minichiello
1,*
1
Department of Industrial Engineering, University of Naples Federico II, 80125 Naples, Italy
2
Polytechnic and Basic Sciences School, University of Naples Federico II, 80125 Naples, Italy
*
Author to whom correspondence should be addressed.
Energies 2024, 17(11), 2769; https://doi.org/10.3390/en17112769
Submission received: 4 April 2024 / Revised: 28 May 2024 / Accepted: 28 May 2024 / Published: 5 June 2024
(This article belongs to the Section B: Energy and Environment)

Abstract

:
Air conditioning systems can play a positive or negative role in the spread of COVID-19 infection. The importance of sufficient outdoor air changes in buildings was highlighted by the World Health Organization, therefore these should be guaranteed by mechanical ventilation systems or adequate air conditioning systems. The proposed case study concerns the optimal number of outdoor air changes to limit COVID-19 contagion for a school building in Central Italy. The Wells–Riley model is used to assess the risk of airborne infection, while energy consumption is calculated by a dynamic energy simulation software. The scope of the paper offers an innovative method to define the optimal ventilation strategy for the building’s HVAC system design to reduce the risk of infection with limited increases in energy consumption and greenhouse gas emissions. Results show that the desirable approach is the one in which the same low value of contagion risk is set in all rooms. This new approach results in significant energy savings, compared to the most common ones (setting the same high outdoor air rates for all rooms) to counteract the risk of infection. Finally, the zero-emission building target is verified by introducing a suitable photovoltaic system to offset pollutant emissions.

1. Introduction

Nowadays, it is well known that it is necessary to find solutions that simultaneously allow energy efficiency and sustainability in the human environment, as highlighted by studies from several regions around world [1,2,3,4]. The “European Green Deal” [5] encourages the achievement of a climate-neutral Europe by 2050, with the challenging scope of enhancing energy efficiency and renewable energy penetration in all sectors [6]. Although decarbonisation is an intersectoral necessity [7], building operational energy efficiency must be considerably improved, as reported by various sources [8,9,10], since a high percentage of emissions actually come from this sector. The reduction in energy consumption and the optimisation of building systems are therefore needed as a crucial driver of sustainable development [11,12] and energy transition [13,14]. Paradigms like Net Zero Energy Buildings [15,16] and Zero Emission Buildings (ZEBs) [17] are expected to spread in Europe along with renewable energy exploitation [18,19,20] and energy flexibility enhancement [21,22,23].
ZEBs can be achieved by significantly lowering the operational greenhouse gas (GHG) emissions of a facility and offsetting the remainder by on-site energy production from renewable sources [24]. The integration of these technologies with a building-HVAC system should be carefully planned to ensure that the avoided emissions achieved through renewable energy production offset the actual building operational emissions [25].
However, the advent of the COVID-19 pandemic significantly affected the energy sector [26], with implications for building energy efficiency and GHG emissions as well. Indeed, the recent pandemic necessitated a reconsideration of commonly adopted health safety measures in human activities that led to an increase in the energy intensity of many processes [27,28], not least the operation of civil buildings. This could significantly threaten the achievement of European decarbonisation goals and, more broadly, the fight against the global climate change trend if the right countermeasures are not promptly taken.
Operational energy is most affected by COVID-19 countermeasures in buildings. Indeed, the pandemic brought attention to several aspects of building indoor environments [29,30,31], such as the improvement in indoor air quality (IAQ) [32]. Building indoor comfort and health-related safety require a significant expenditure of resources regarding operational energy consumption [33]. Air renewal, in particular, can account for a large share of GHG emissions of the building–plant system, and therefore, it needs special attention through exploiting heat recovery techniques and carefully evaluating ventilation rates [34].
As analysed in the following “literature review” section, several approaches were used to deal with the new building ventilation requirements in the post-pandemic era [35]. However, it is still difficult to provide adequate IAQ while guaranteeing long-term solutions in terms of economic expenses and GHG emissions [36]. Methods to manage trade-offs among IAQ, financial costs, and GHG emissions for HVAC operation strategies are an active investigation field [36].
Indoor environment quality in classrooms is very important and often has a strong relationship with energy issues [37]. Indeed, it is essential to provide students with the ideal indoor environment for face-to-face learning while maintaining their safety and health during or after a pandemic [38]. Therefore, IAQ in school buildings needs particular attention, especially in the post-COVID-19 era [39,40]. Studies that have addressed the ventilation effectiveness and contaminant removal effectiveness in classrooms are available in the literature, with reference to both pre-COVID-19 and post-COVID-19 periods. A review of CO2-based methods to determine ventilation rates in pre-COVID-19 period and their application in school classrooms is reported in [41]. A CFD analysis of the air supply rate influence on the aerosol dispersion in a university lecture room is provided in [42]. The experimental and numerical analysis of CO2 transport inside a university classroom is addressed in [43]. An infection risk-based ventilation design method is developed in [44] in order to complement an existing perceived air quality-based design method reported in the EN 16798-1:2019 [45] and ISO 17772-1:2017 [46] standards; point source ventilation effectiveness in classrooms is studied.
Currently, several approaches exist for the design of ventilation in buildings. In this paper, the approach proposed by the Italian Ministerial Decree (IMD) 18.12.1975 [47], still in force for school buildings; the one provided by the World Health Organization (WHO); the one proposed by the American Centers for Disease Control and Prevention (ACDCP) [48]; and a parametric approach based on a uniform increase in ventilation rate are analysed on a case study school building. The Wells–Riley model is used to assess the risk of airborne infection, while energy consumption is calculated by means of a dynamic energy simulation software (DesignBuilder v.6 [49]), based on the well-known and validated EnergyPlus simulation engine [50]. This paper presents a new tailored method, based on the use of the Wells–Riley model itself, to address the main drawbacks of the existing approaches (uncontrolled and uneven risk of virus infection, high energy consumption, and GHG emissions) and provide limited impacts on achieving the ZEB target. The case study building is a newly built school in Central Italy. Finally, the economic impact of the different analysed ventilation strategies on the attainment of the ZEB target is verified considering different sizes of the photovoltaic (PV) system needed to offset GHG emissions of the building. Indeed, PVs are highly profitable renewable energy production systems from a technical and economic point of view [51].

Aims and Innovations of This Study

The scope of this paper is to propose an innovative method to define the optimal ventilation strategy to be adopted in buildings’ HVAC plant system designs, considering suitable outdoor ACH (air changes per hour) in different school building rooms, to reduce the risk of infection with limited increases in energy consumption and greenhouse gas emissions.
The main novelty consists of proposing a new ventilation strategy that estimates outdoor ACH values to provide a low, even, and controlled virus infection risk to the occupants, basing on Wells–Riley model, also entailing limited energy consumption and GHG emissions. The ZEB target is verified for each ventilation approach by introducing an adequate PV system.
Main innovations of the study are as follows:
  • Four known approaches and one novel approach for the design of ventilation rates in buildings are analysed using the Wells–Riley method and the dynamic energy simulation to highlight the relationship between outdoor ACH values, risk of virus infection for occupants, building energy consumption, and GHG emissions. The four known approaches are:
    Italian regulatory approach described in Ministerial Decree 18.12.1975 [47] (IMD approach);
    World Health Organization (WHO) approach [52];
    American Centers for Disease Control and Prevention (ACDCP) approach proposed in [48];
    A parametric approach with increasing outdoor air changes.
  • A novel tailored approach for the design of ventilation rates in buildings is proposed to provide the low, controlled, and even risk of virus infection with limited increases in operational energy consumption and GHG emissions.
  • This proposed approach can be used for the assessment of the optimal number of hourly outdoor air changes and the risk of virus infection but also to redefine regulatory requirements in post-pandemic era.
  • The financial impact of the analysed strategies on the attainment of the ZEB target is assessed by considering the costs of a PV system designed to 100% compensate GHG emissions due to the different ventilation approaches, mainly in post-pandemic conditions.

2. Literature Review

Today, the identification of optimal ventilation strategies for new and existing buildings suitable to provide sufficient IAQ and significantly slow the development of any potential airborne infection is crucial and requires in-depth research [53]. The main issue is that infected individuals create respiratory droplets of varying sizes, some of which are so tiny that they are not influenced by gravity forces and remain suspended, generating a bio-aerosol that spreads the infection [54,55]. Therefore, the prompt removal of these particles is crucial in the mitigation of the spread of the virus among building occupants by providing adequate ventilation rates of the rooms [53]. For this purpose, a substantial rethinking of building design and operation strategies in post-pandemic era is needed [56].
Some studies have addressed architectural spatial features of the building to control air circulation in interior spaces while also maintaining basic performance standards [53]; other studies have focused on the innovation of HVAC systems, proposing new air recirculation concepts [57].
The need to improve HVAC systems to decrease the risk of virus infection is highlighted in [58], and guidelines have been produced in many countries for HVAC design and operation in regard to coping with COVID-19 risk reduction requirements [59,60,61]. A review of component designs for post-COVID-19 HVAC systems is reported in [62], while the re-thinking of engineering operation solutions for HVAC systems under pandemic conditions can be found in [63].
Existing studies address the problem of reducing infection risk in buildings under different scenarios and environmental conditions. From a broad point of view, some studies on infection risk examine operating room scenarios [64], such as the investigation protracted in [65], and address the effects of operating room layout and ventilation systems on ultrafine particle transport and deposition. With the advent of the COVID-19 pandemic, civil buildings have also been investigated. The Mediterranean climate is considered in [66], where a Spanish secondary school and university classrooms were analysed regarding IAQ and the risk of COVID-19 infection. A case study for an office building in a cold and dry climate is addressed in [67], providing a comprehensive analysis of model parameter uncertainty influence on the evaluation of HVAC operation to mitigate indoor virus spread. In a critical review of HVAC systems within the context of the global COVID-19 epidemic [68], case studies and risk mitigation approaches from different countries are reported with a systematic approach.
The majority of studies highly recommend room ventilation to aid in the dilution of contaminants [69]. Ventilation can be either natural or mechanical. Mechanical ventilation (MV) is commonly used in buildings, in combination with heating and cooling systems, to provide fresh air and dilute pollutants [70]. Its role in providing improved IAQ has been proved by several studies [71] that used in situ measurements and surveys to validate the results. The positive effects on health deriving from high levels of IAQ both in offices and school buildings are also confirmed in [72].
Natural ventilation is also an option, but the inability to integrate heat recovery techniques often makes it a worse alternative from an energy efficiency point of view. Nevertheless, when MV or an air handling unit partly recirculates indoor air, it can act as a medium for virus transmission if air filtration is not present [73]. Natural ventilation, however, does not have this issue. This drawback, typical of MV, can be solved avoiding exhaust air recirculation or implementing the adequate filtration of recirculated air [74].
Therefore, with these conditions in mind, controlled MV has been widely recognised as the best means to reduce airborne transmission of SARS-CoV-2 and any other airborne virus-containing micro-drips, simultaneously ensuring the optimal control of IAQ for the occupants [75,76]. However, it is possible that an inappropriate ventilation strategy will not sufficiently decrease the range of contaminants [77], especially in crowded buildings, like offices and schools. In these cases, high occupancy rates, in addition to causing poor IAQ, can provide optimal conditions for the rapid spread of airborne diseases [75].
Also, the increases in building operational energy consumption and GHG emissions, related to increased MV rates, are considered an issue by several studies. For this reason, HVAC and MV systems have been object of detailed study and analyses. Energy assessments, which include computational fluid dynamic (CFD) models of buildings’ HVAC plant systems, are utilised to evaluate these factors in [78]. CFD is commonly used in building design [79] and affine fields [80,81,82]. In the recent scientific literature, CFDs have also been used in the study of a university room [83], an operating room [84] and a passive house [85] to analyse the impacts of occupancy rate and volumetric air flow in relation to COVID-19 spread mitigation. CFD models, however, are very resource intensive.
In the literature, mathematical models are frequently employed to assess the risk of airborne infection. The Wells–Riley model (WRM) is a well-known method for statistically estimating the probability of contracting an airborne virus [86]. It was first developed in 1978 [87], utilising data from a measles outbreak in 1974. This model is used in [88] to conduct a research on ventilation rates and the evaluation of COVID-19 infection hazards in an outpatient facility, while in [78], the same approach is used together with a new method for obtaining the spatial distribution of the probability of infection.
Modified Wells–Riley models have been employed in [89,90] to assess the risk of airborne infection, and experimentations showed that these approaches efficiently assess the risk of airborne infection. Using a case study office building, the authors of [27] evaluate the energy and financial effects of improved ventilation techniques using the WRM. In [91], optimisation techniques are examined to address the needs of epidemic prevention and lower energy consumption, with reference to different building typologies, also utilising the WRM.
In [92], a novel demand-controlled ventilation strategy to limit the spread of COVID-19 in the indoor environment is proposed, but the approach requires CO2 sensors in every room. This restricts the implementation of the approach to buildings that already have these sensors installed. Otherwise, a retrofit of the building’s HVAC plant system is required.
The WRM is particularly suited to the present study since it does not require resource-intensive workflows and allows to obtain useful insights on optimal ventilation rates to limit the virus infection risk in all the design stages. Furthermore, it can be usefully integrated with dynamic energy simulations, allowing the assessment the impact of infection risk reduction measures on building energy consumption and GHG emissions.
For this purpose, some research activities that did not take into account actual building case studies were conducted to calculate optimal external air changes on generic control volumes [93,94].
The IAQ of a studio apartment with a mechanical exhaust system that the residents of the building manually manage is modelled in [95]. The enhancement of IAQ is used in [96] to verify the efficacy of an air terminal device with a variable geometry. Office buildings have also been the objects of study in the literature. In [27], the authors evaluated the impact of improved mechanical ventilation on energy consumption costs in an existing office building to help cope with the mitigation measures of airborne disease transmission. Operational energy consumption in the post-pandemic era has also been investigated in [97].
School buildings, however, have great potential for IAQ enhancement but also present many challenges, since high occupation levels are common in rooms such as classrooms. For this reason, in the present study, a zero-emission school building has been utilised as a case study.
In order to comply with the ZEB target, the renewable energy production by the PV system is taken into account. Renewable energy sources are indeed a common means employed to offset GHG emissions derived from human activities [98]. The most common renewable energy sources are wind-based [99] and solar-based [100,101]. Although used in many fields [102,103], PV systems are experiencing a wide diffusion within the built environment for harvesting solar radiation that reaches the building envelope, thus producing clean energy with a low environmental impact [104,105]. For this reason, the integration of PVs in the building envelope is a common strategy exploited in urbanised areas [106,107] and, therefore, is used in this study.

3. Methodology

This section presents the methodology used to investigate the impact of outdoor ACH optimization in post-pandemic conditions on operational energy consumption and GHG emissions of a new school ZEB. Section 3.1 reports details about the simulation-based approach to assess building energy consumption. In Section 3.2, the application of the WRM to assess the risk of virus infection is explained. Section 3.3 illustrates the five analysed ventilation strategy approaches. Lastly, a method to reach the ZEB target is provided in Section 3.4. An outline of the workflow employed in the present study is shown in Figure 1.

3.1. Building Energy Modelling

Energy consumption is assessed by using a simulative approach with the dynamic energy simulation software DesignBuilder, which is based on the EnergyPlus calculation engine [108]. EnergyPlus is one of the most widely used open-source energy simulation engines and was developed by the U.S. Government’s Department of Energy Efficiency and Renewable Energy (EERE). EnergyPlus has undergone validation in numerous studies, and there are several validation tests available for the building envelope and HVAC systems [50]. Therefore, by utilising DesignBuilder with the EnergyPlus engine, the energy performance of buildings can be effectively modelled and analysed to optimize energy efficiency measures.

3.2. The Wells–Riley Model

The WRM is a method for assessing the risk of airborne infection [86]. It uses the concept of “quantum” to implicitly consider the infectivity, the strength of the infectious source, and the biological decay of pathogens (a quantum is defined as the dose of airborne droplet nuclei needed to cause infection in 63% of susceptible people). As a result, the WRM has been widely used in studies on infectious respiratory diseases [86]. Although this model assumes that the distribution of pathogen-laden aerosols is spatially and temporally uniform, several studies regarding air conditioning systems applications have proven the adequacy of the WRM in analysing this type of phenomena [86,109].
For the quantitative assessment of the risk of transmission of SARS-CoV-2 infection, the present study includes four phases [77]:
  • assessment of the quantum emission rate;
  • assessment of the quantum concentration exposure in the microenvironment;
  • assessment of the quantum dose received by an exposed susceptible subject;
  • estimation of the probability of infection based on a dose–response model.
Equation (1) is used to determine the probability (a value between 0 and 1) of infection P:
P = 1 e p 0 T C I t d t
where:
  • the term p 0 T C I t d t represents the dose of “quanta” inhaled by a susceptible subject [86];
  • p : pulmonary respiration rate [m3/h];
  • C I t : instantaneous concentration of infective doses in the room [quanta/m3];
  • T : exposure time [h].
By applying the Gammatoni–Nucci method [86], it is possible to calculate CI:
C I = q I N V + n 0 V q I N V e N t
where:
  • q : emission of infectious doses by an asymptomatic subject [quanta∗h−1];
  • I : number of asymptomatic infected individuals;
  • V : volume of the room [m3];
  • n 0 = initial number of infective doses [quanta];
  • t : time [h];
  • N : overall removal factor in the environment N = λ + k + r n [h−1];
  • λ : removal factor due to inactivation of the virus in the environment [h−1];
  • k : removal factor for deposition in the environment [h−1];
  • r n : ventilation rate [h−1].
From Equations (1) and (2), considering that n 0 = 0 , it is possible to express the probability of infection as follows:
P = 1 e x p q I p V 1 N t e N t N 2
The value of q is derived from a study by Buonanno et al. [77], through the Monte Carlo method, and for “light physical activity”, q value is worth 26.3 quanta∗h−1.
Equations (4) and (5) are used to calculate the risk of infection and the reproduction index, respectively [110].
R = 1 e I   q   p N   t Q
where Q, fresh air flow, is replaced by n∗V or ventilation rate per volume, and
  • I: number of asymptomatic infected individuals;
  • q: number of quanta produced by an infected person in 1 h [h−1];
  • p N : average air flow rate per person’s breathing, set at 0.6 [m3/h];
  • T: time [h].
R * = P ( N s 1 )
where:
  • P = probability of infection;
  • Ns = number of people.
The significance of these three indices is herein briefly presented.
Probability of infection (P): the percentage probability of infection of an exposed susceptible occupant receiving a calculated dose of quanta generated by a fixed or certain quanta emission rate.
Risk of infection (R): the percentage probability of contracting the virus if the infected person remains in the environment for the entire duration of its time of use.
Reproduction index (R*): average number of susceptible individuals potentially infected by a contagious person.

3.3. Ventilation Rate Scenarios

Several building ventilation rate scenarios are analysed, consisting of three widespread existing approaches, a parametric approach that evenly increases the ventilation rate, and a new tailored approach, defined in this study.
Ministerial Decree 18.12.1975 [47] is currently in force in Italy for school ventilation rate design. Therefore, it is considered the baseline approach. It stipulates the number of hourly changes in outdoor air (outdoor ACH) depending on the intended use of the room. For kindergarten classrooms and cafeterias, the minimum outdoor air exchange required is 2.5 h−1, and 1.5 h−1 for hallways and offices.
WHO, instead, recommends a single minimum ventilation rate of 10 L/s per person in non-residential buildings [52].
In addition, the American Centers for Disease Control and Prevention (ACDCP) recommends a single value of ventilation rate, equal to five ACH [48].
Considering the HVAC system for the new case study school building, these three different approaches are simulated with the WRM to assess the risk of COVID-19 infection in each room, and the related total operational electric energy consumption and GHG emissions are evaluated.
The same analyses are performed considering even ventilation rate increments from one ACH to ten ACH. This is a parametric approach aimed to investigate the impact of evenly increased outdoor ACH on the risk of infection for occupants and building energy consumption and GHG emissions.
Lastly, a new approach that fixes the infection risk and calculates the ventilation rate for each room (expressed in ACH) is proposed. This is called the “tailored” approach by the authors since it provides the optimal ventilation rate for each room, tailoring the result to the actual conditions of occupancy and the spatial dimension of the room itself. This approach is designed to provide even and controlled risk across all the building rooms, as well as a reduction in energy consumption and GHG emissions.
Results are also compared in terms of economic impact on ZEB target attainment, by designing a PV system able to offset operational GHG emissions arising from the application of the investigated approaches.

3.4. Zero-Emission Building (ZEB) Target Attainment

A ZEB is a building that avoids GHG emissions as much as possible, especially GHGs derived from fossil fuels, and compensates any remaining emissions through on-site renewable energy production. The emission factor of the electric energy grid (0.445 kgCO2-eq/kWh) is used to evaluate the emissions related to the building operation. A rooftop PV system is introduced to provide the on-site production of renewable energy to compensate for the operational GHG emissions of the building. Rooftop PV systems are one of the most utilised means to increase renewable energy production in urban contexts [111].
The size of PV system capable of fully compensating for the operational emissions of a building is evaluated under the different ventilation scenarios. The impact of increased ventilation rates on the achievement of the ZEB target is expressed in terms of the variation in economic expenditures to provide an adequate renewable energy production system.
The annual production of a PV system was calculated for the studied locality, using PVGIS, an online tool that provides accurate data of solar radiation from satellite observations. The accuracy of these data in providing a trustworthy forecast of PV production has been verified by several studies [112,113].
The peak power of the PV system ( P P V ) is determined through compensating GHG emissions ( E C ) with the renewable energy produced by a PV system of 1 kWp power in the chosen locality, as follows:
P P V = E E C
where:
  • P P V : size of the PV system [kWp];
  • E : annual operational GHG emissions of the building–plant system [kgCO2-eq];
  • E C : annual compensated GHG emissions by PV renewable energy generated in loco with a system of unitary power (1 kWp) [kgCO2-eq/kWp].
Equation (6) allows the balance between the GHG emissions of the building–plant system and the GHG emissions avoided by using renewable energy sources (RES) to be equal to zero, meeting the ZEB target on annual basis.

4. Case Study

4.1. Locality and Climate

The case study concerns the new construction of a kindergarten school building located in Fondi (province of Latina, Central Italy). Table 1 reports the main geographic data of this locality. The climate is characterised by mild winters and hot summer. According to Koppen classification [114], Fondi is classified in climatic zone C (mild temperate climates, monthly average temperature of the warmest month equal or greater than 10 °C, monthly average temperature of the coldest month ranging from −3 °C to 18 °C), and sub-classification Csa (hot summer Mediterranean climate). According to the Italian Presidential Decree DPR 412/93 [115], Fondi is characterised by 1089 heating degree days and is classified in zone C.

4.2. Building Characteristics and Energy Model

The analysed building is a school that will be built in the expansion area of the city. It has two levels above ground, a total usable area of 1820 m2, and a net volume of 6150 m3. Other main building features are reported in Table 2.
The thermal transmittances of the opaque and glazed envelope elements are shown in Table 3. Windows are made by medium quality PVC frames and argon-filled double glazing. As can be deduced by the comparison with limit values reported in the Italian Ministerial Decree DM 26.06.2015 [116] for the climatic zone C (DPR 412/93 [115]), the building envelope has been designed to comply with the present Italian legislation on energy efficiency of buildings.
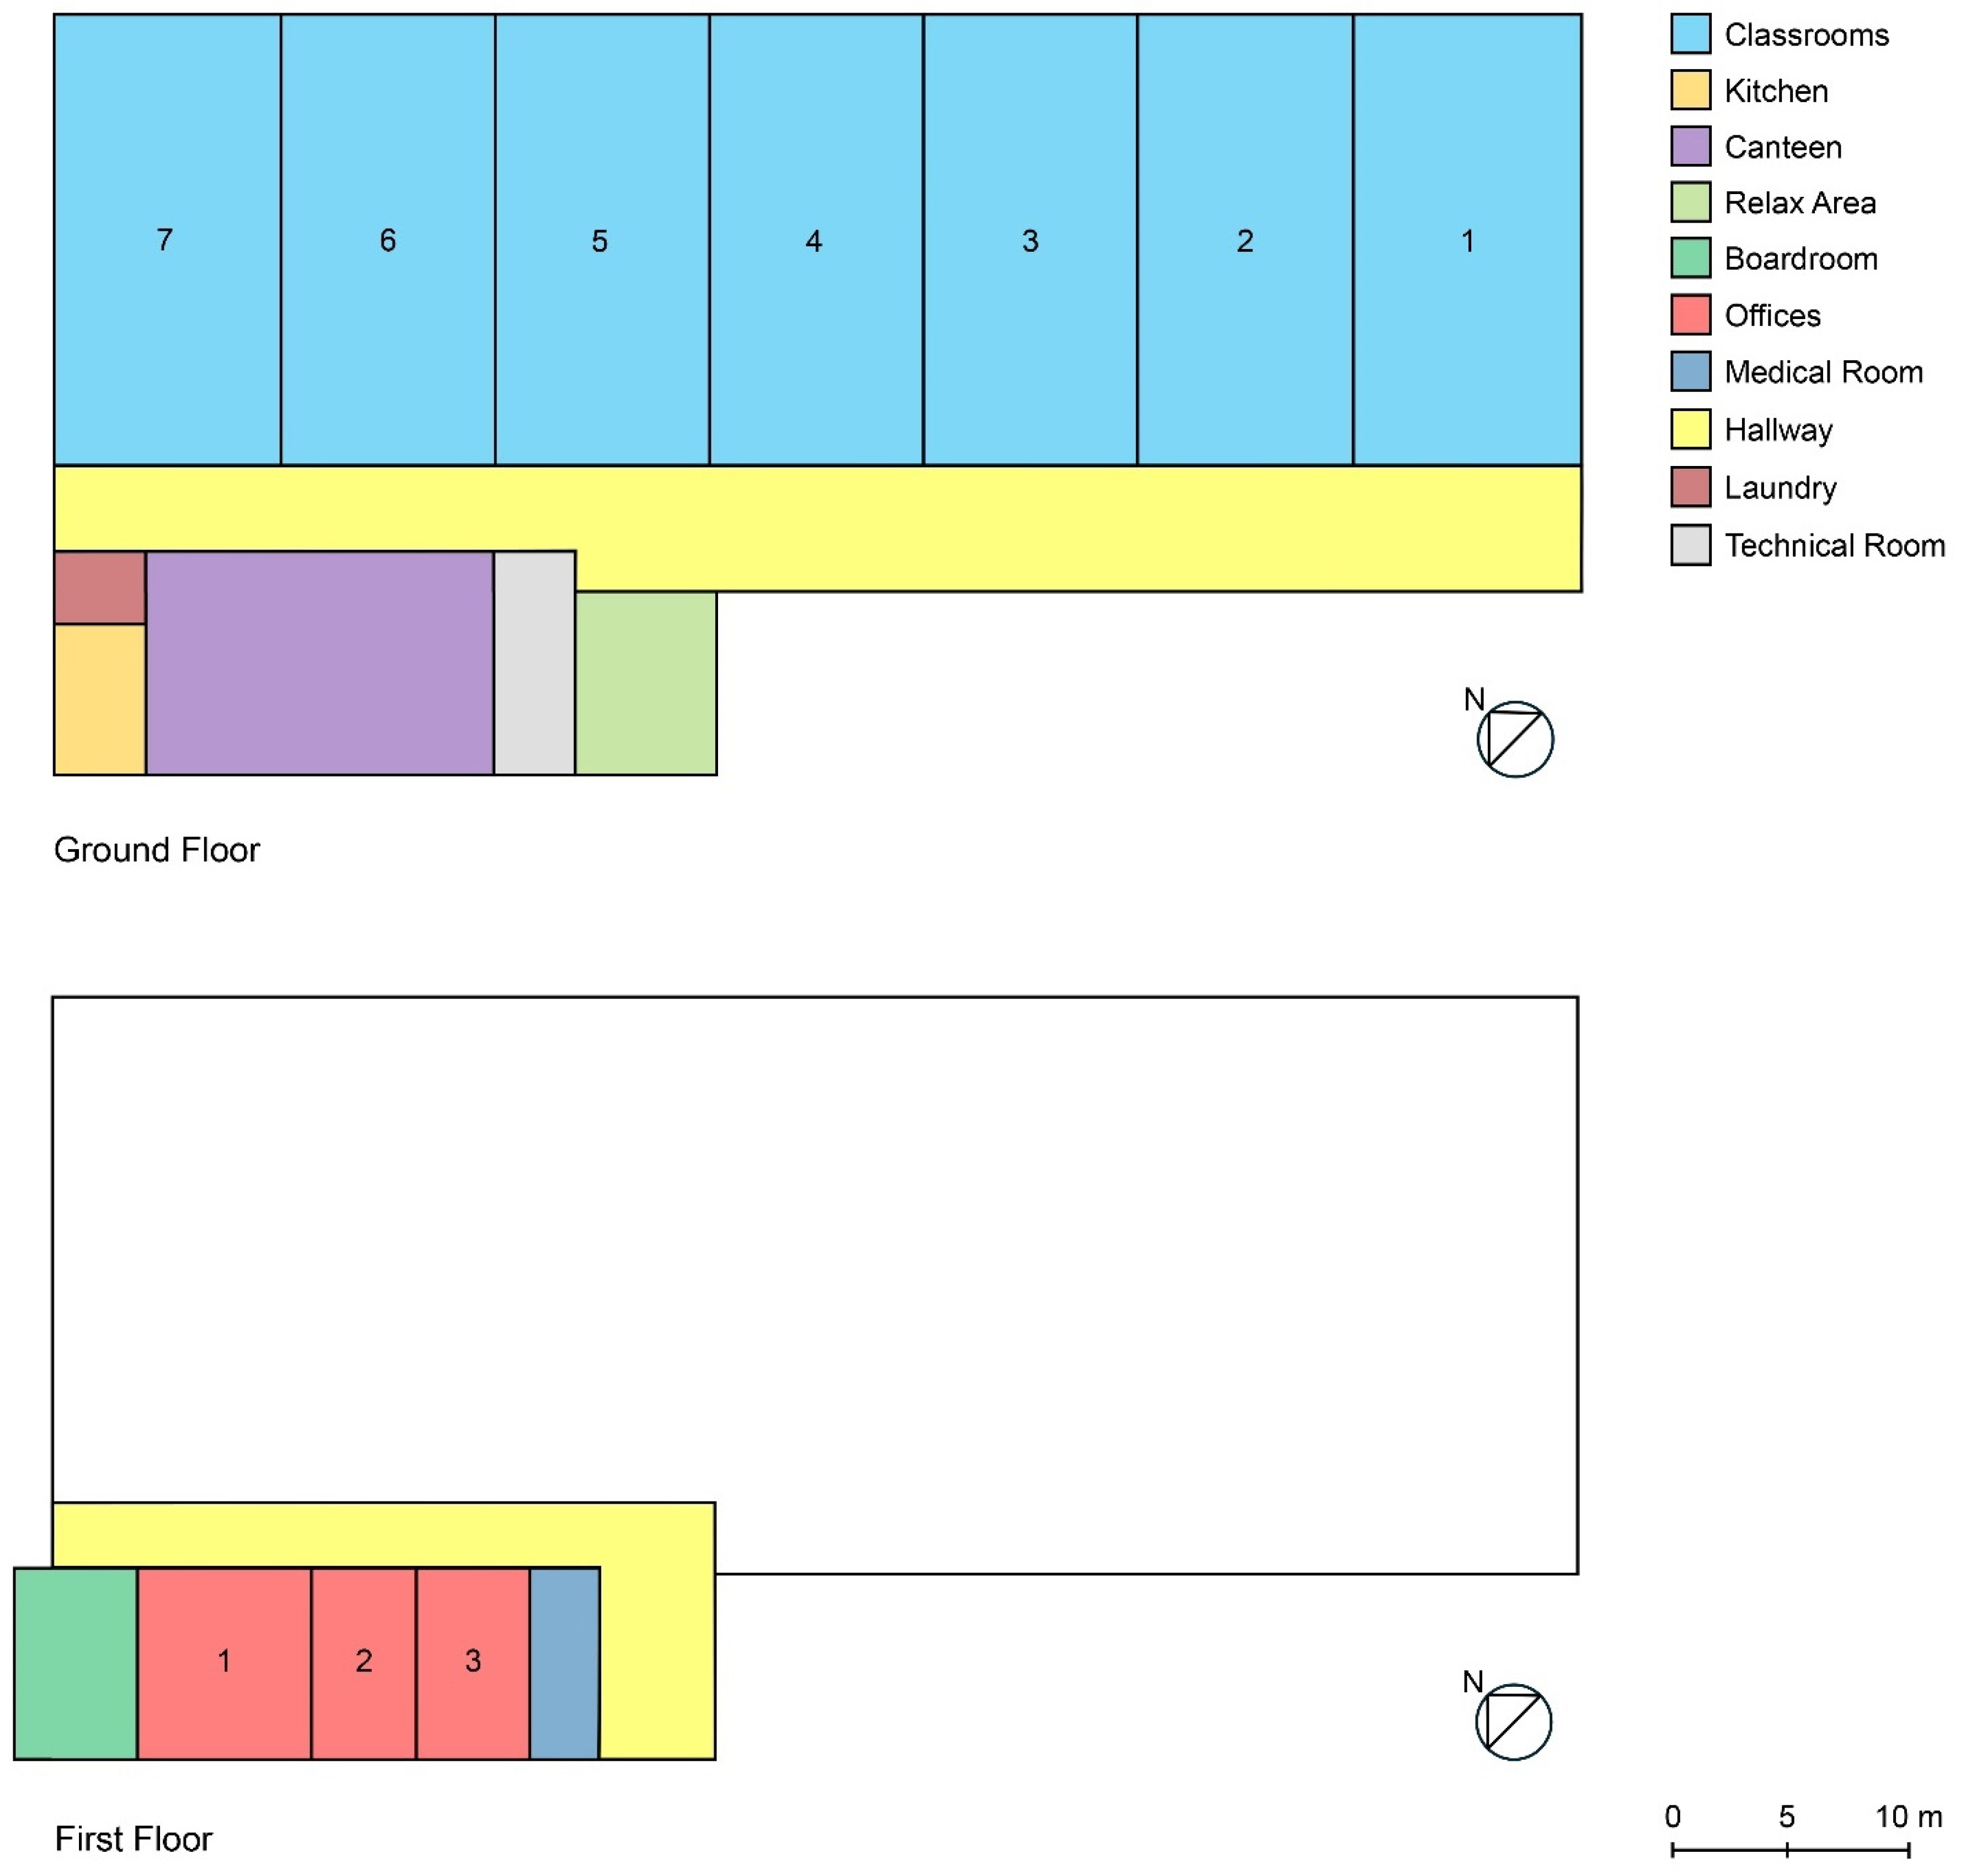
Building plans are reported in Figure 2, indicating of the intended use of the rooms.
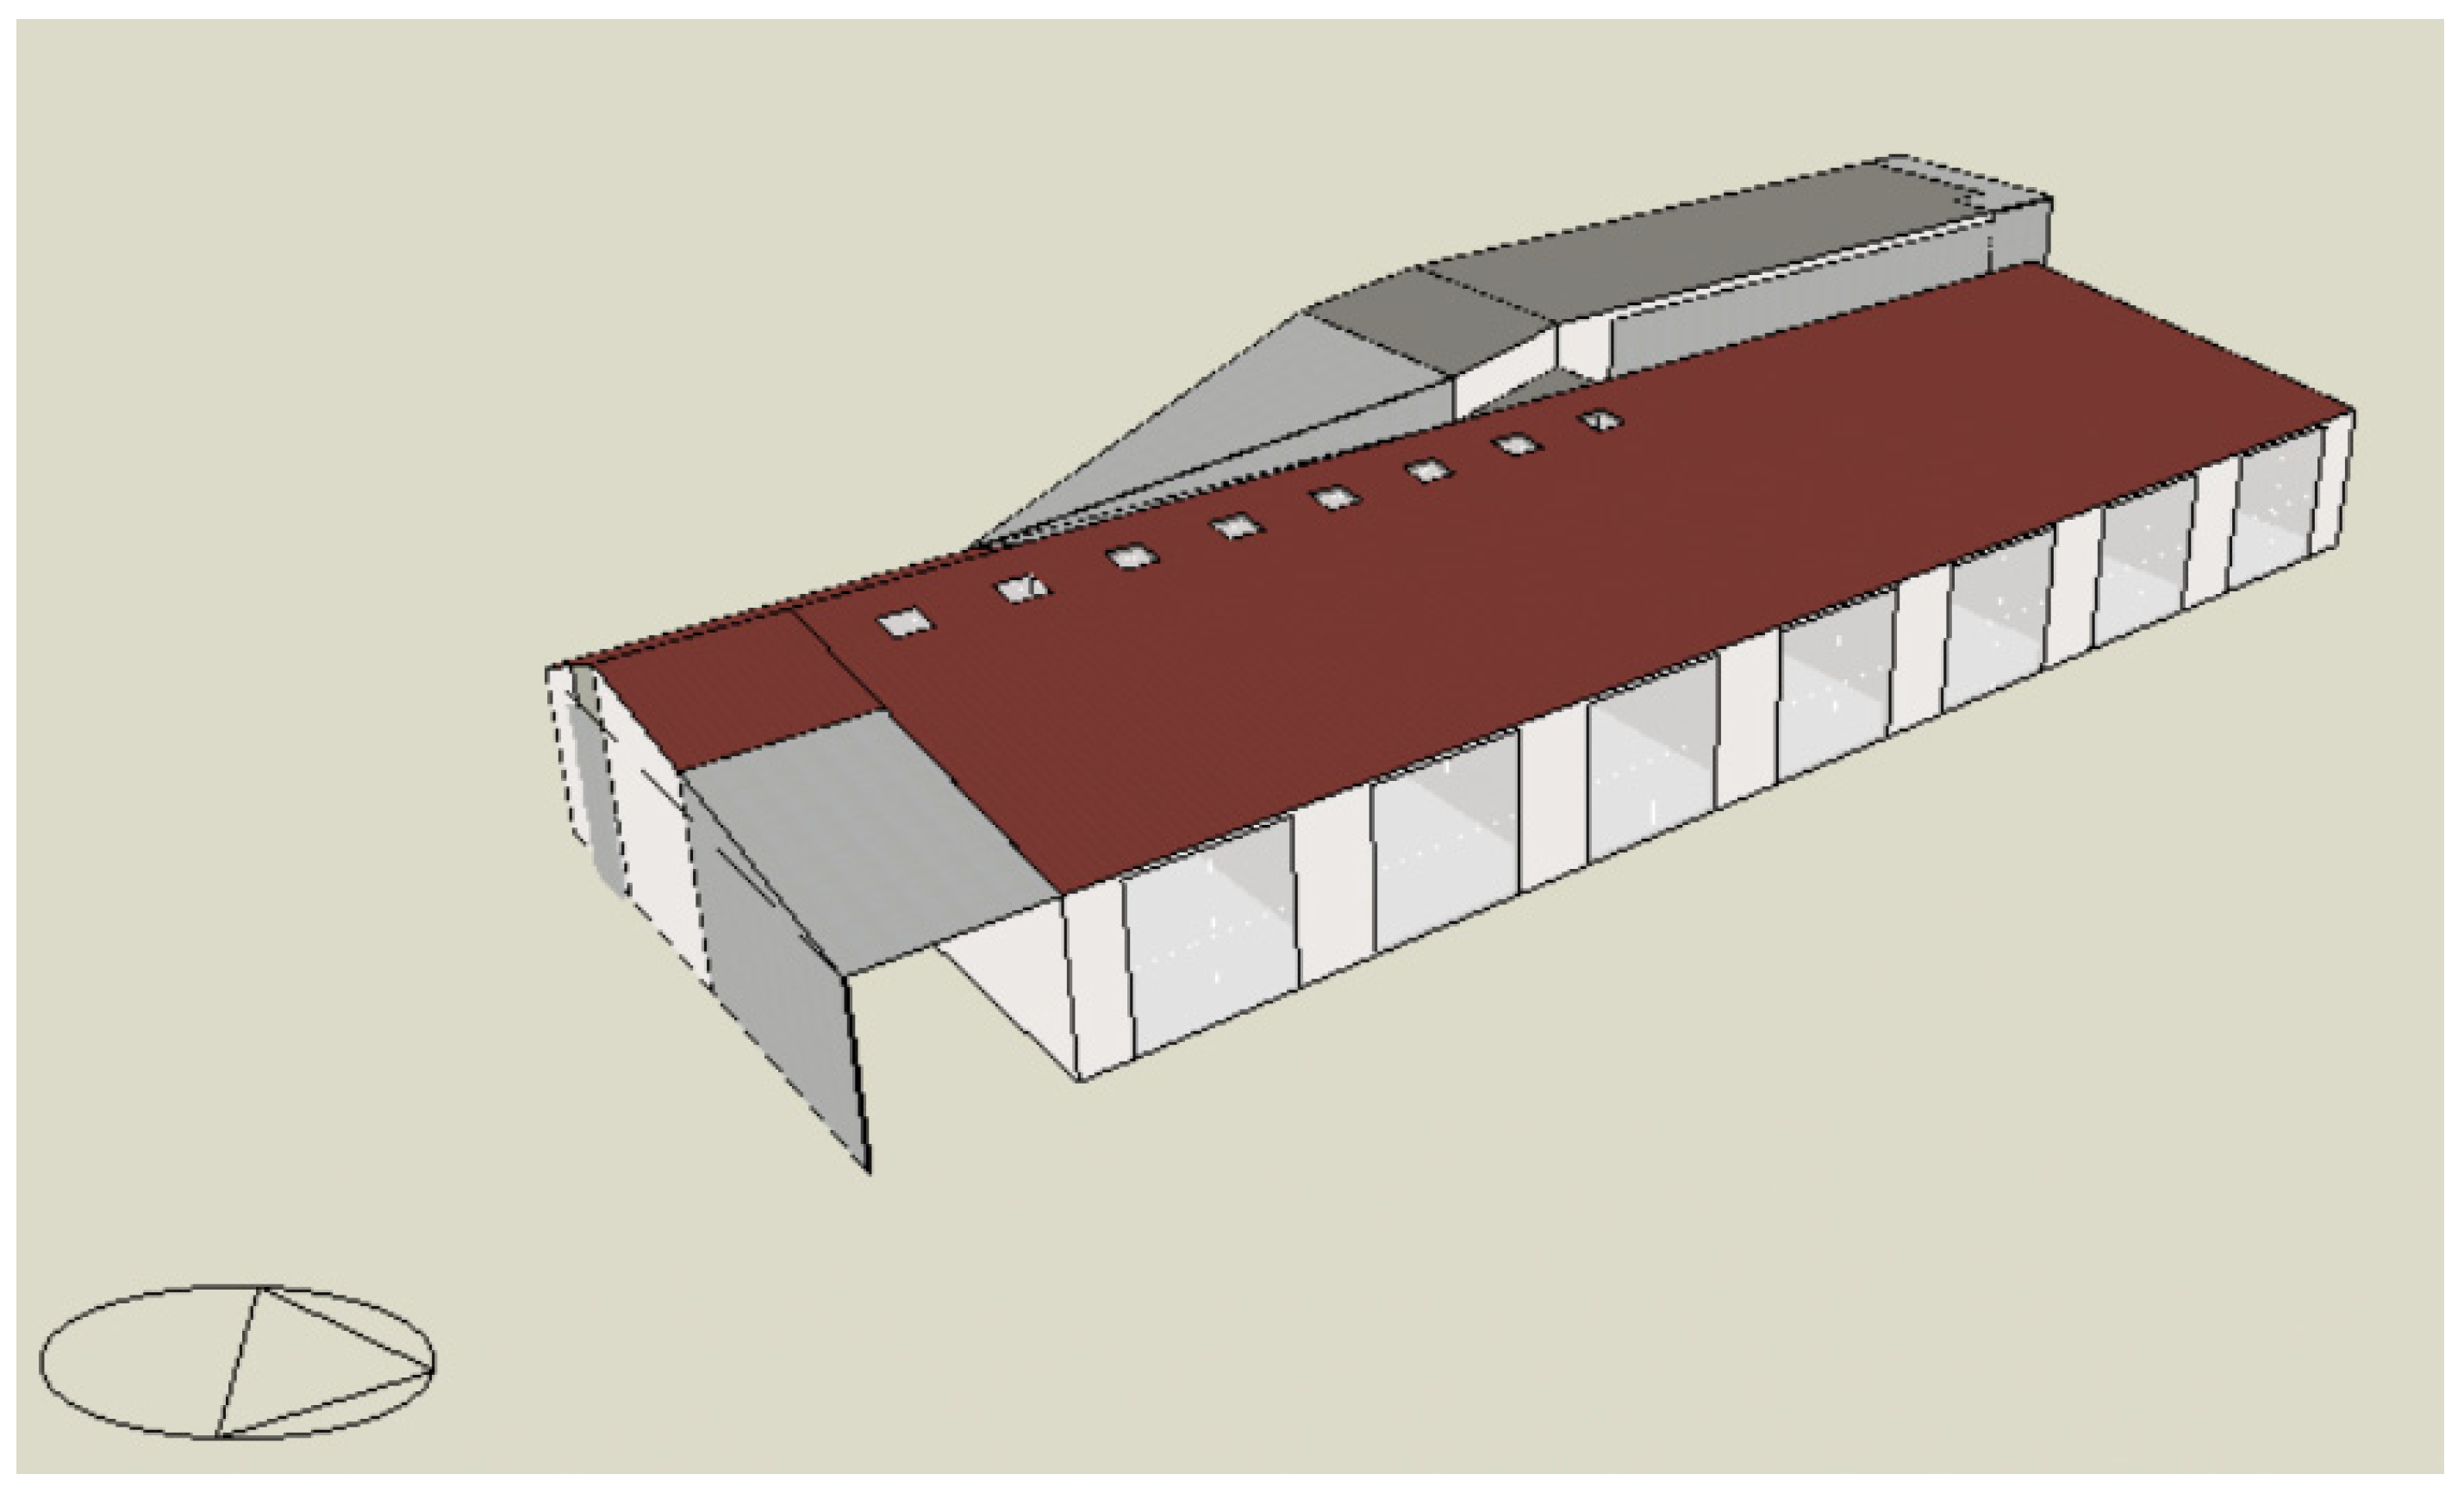
The characteristics of the building envelope and details on the building–plant system were obtained from the project data. Design data are input into the dynamic simulation software DesignBuilder to simulate and analyse the thermal behaviour and energy consumption of the building (Figure 3).
The heating system consists of radiant floor panels linked to electric air-to-water heat pumps. There is no cooling in summer; domestic hot water (DHW) is obtained by means of a dedicated electric air-to-water heat pump. There is also a mechanical ventilation system providing heat recovery with 85% efficiency.
According to Italian regulatory requirements, the operation period of the heating system for the C climatic zone is set from 15 November to 31 March, for a limited number of hours equal to 10 per day (07:00–17:00, Monday–Friday). The heat generators are two air-to-water heat pumps, with a total rated capacity of 160 kW. The distribution of the water is provided by insulated copper pipes, located within the building volume.
Supply external air flow rate is varied in the study according to the analysed ventilation scenarios. The main characteristics of the heating, ventilation, and the DHW systems are reported in Table 4. The case study building is analysed using the five ventilation strategies defined in section “Methodology”, highlighting their suitability in reducing the risk of virus infection and related operational energy consumption and GHG emissions.

4.3. Characteristics of the PV System for the ZEB Target Attainment

The case study building must reach the ZEB target, and this requires an extensive amount of energy produced from RES. Thus, the PV system features and design parameters are reported herein. For the evaluation of the ZEB target attainment under all the investigated scenarios, an annual comparison of GHG emissions of the building–plant system and saved emissions due to the production from RES is performed to guarantee total compensation. The installed peak power of the PV system is determined using Equation (6) for all the ventilation scenarios. The monocrystalline silicon PV modules of rated peak power equal to 400 Wp laid on a light metal support structure were utilised for system deployment. The costs of the PV system components were retrieved from Italian price lists for public works, which are up-to-date sources for economic estimations.
An emission factor of the electric energy grid equal to 0.445 kgCO2-eq/kWh was used to evaluate the emissions related to the building operation and saved emissions due to PV electric energy production. The energy produced by a PV system of 1.0 kWp in the locality of Fondi is equal to 1503 kWh/kWp, according to PVGIS. This value is equivalent to 669 kgCO2-eq, assuming that the produced energy would have had to be taken from the public electric energy grid if the PV system had not been present. The PV system faces south with an optimal tilt angle of 35°.

5. Results and Discussion

This section reports the results obtained from the analysis of the different ventilation rate design methods and provides a comparison with the outcomes of the proposed new tailored approach. The impact of IAQ optimisation on ZEB target attainment is also shown.
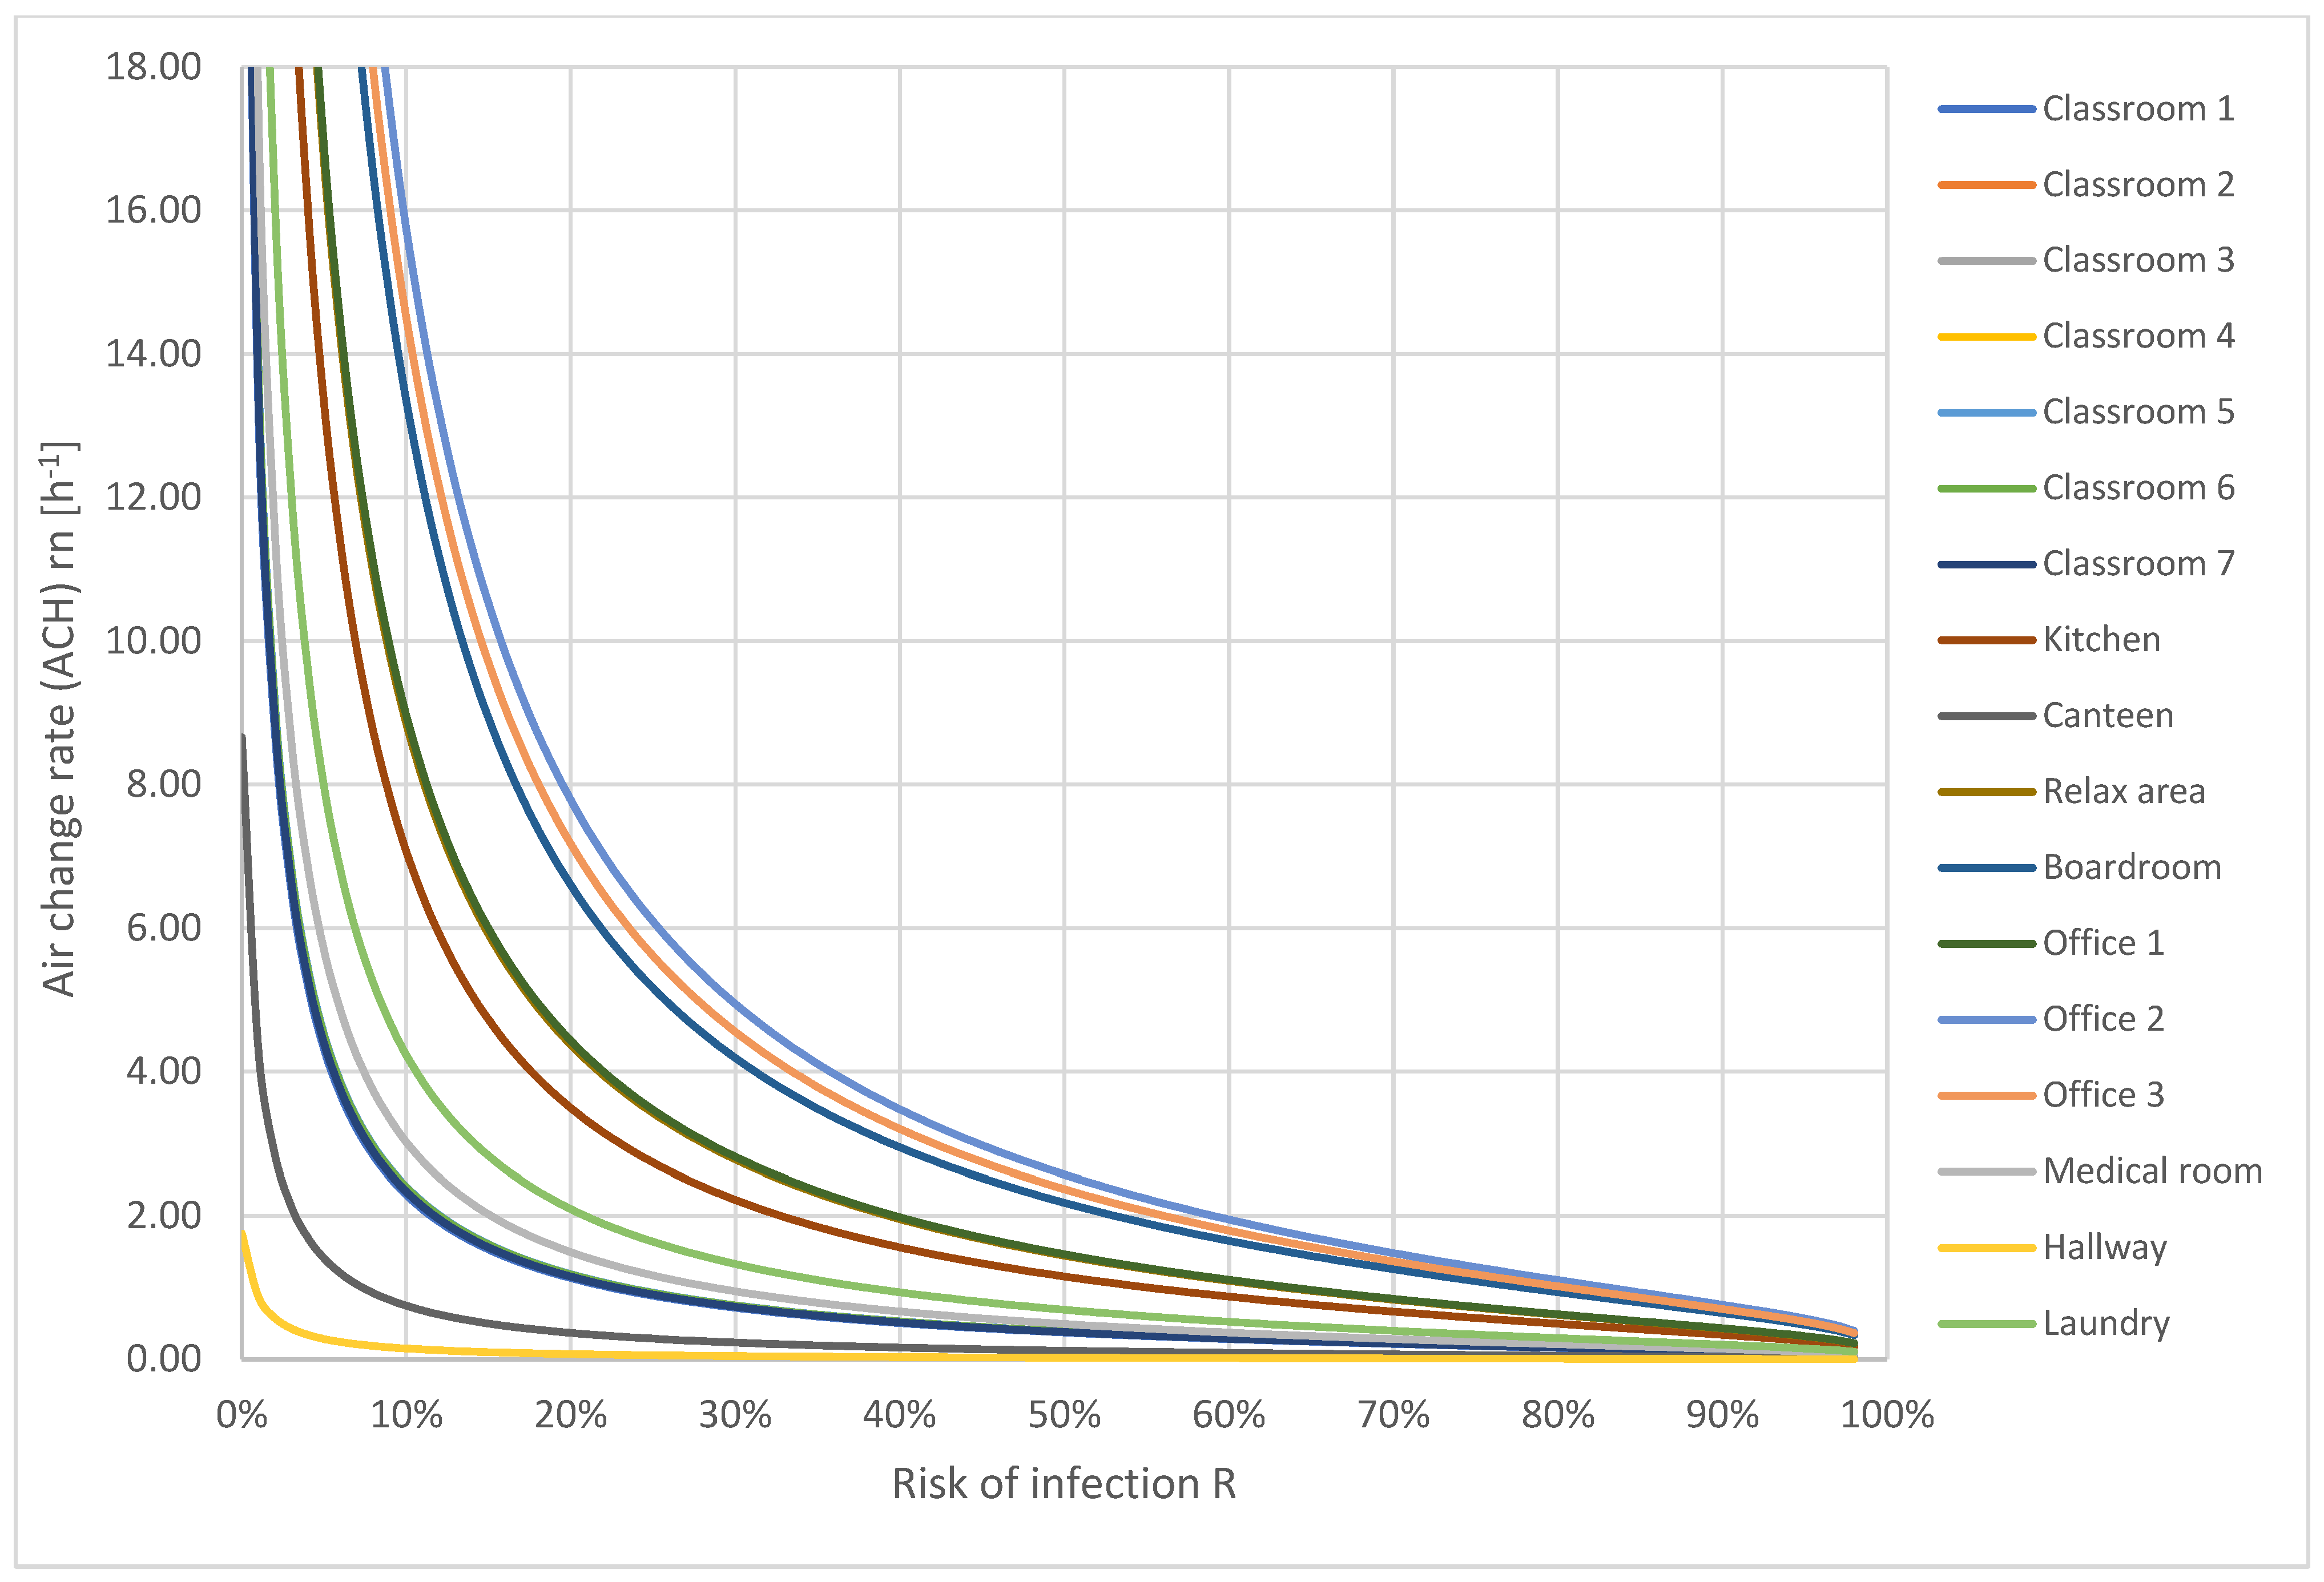
The risk of infection is calculated using the Wells–Riley model, obtaining the characteristic curves for all the building rooms, as shown in Figure 4. These curves are used in the following section to highlight the study outcomes under the different ventilation scenarios.

5.1. Italian Ministerial Decree Approach (IMD Approach)

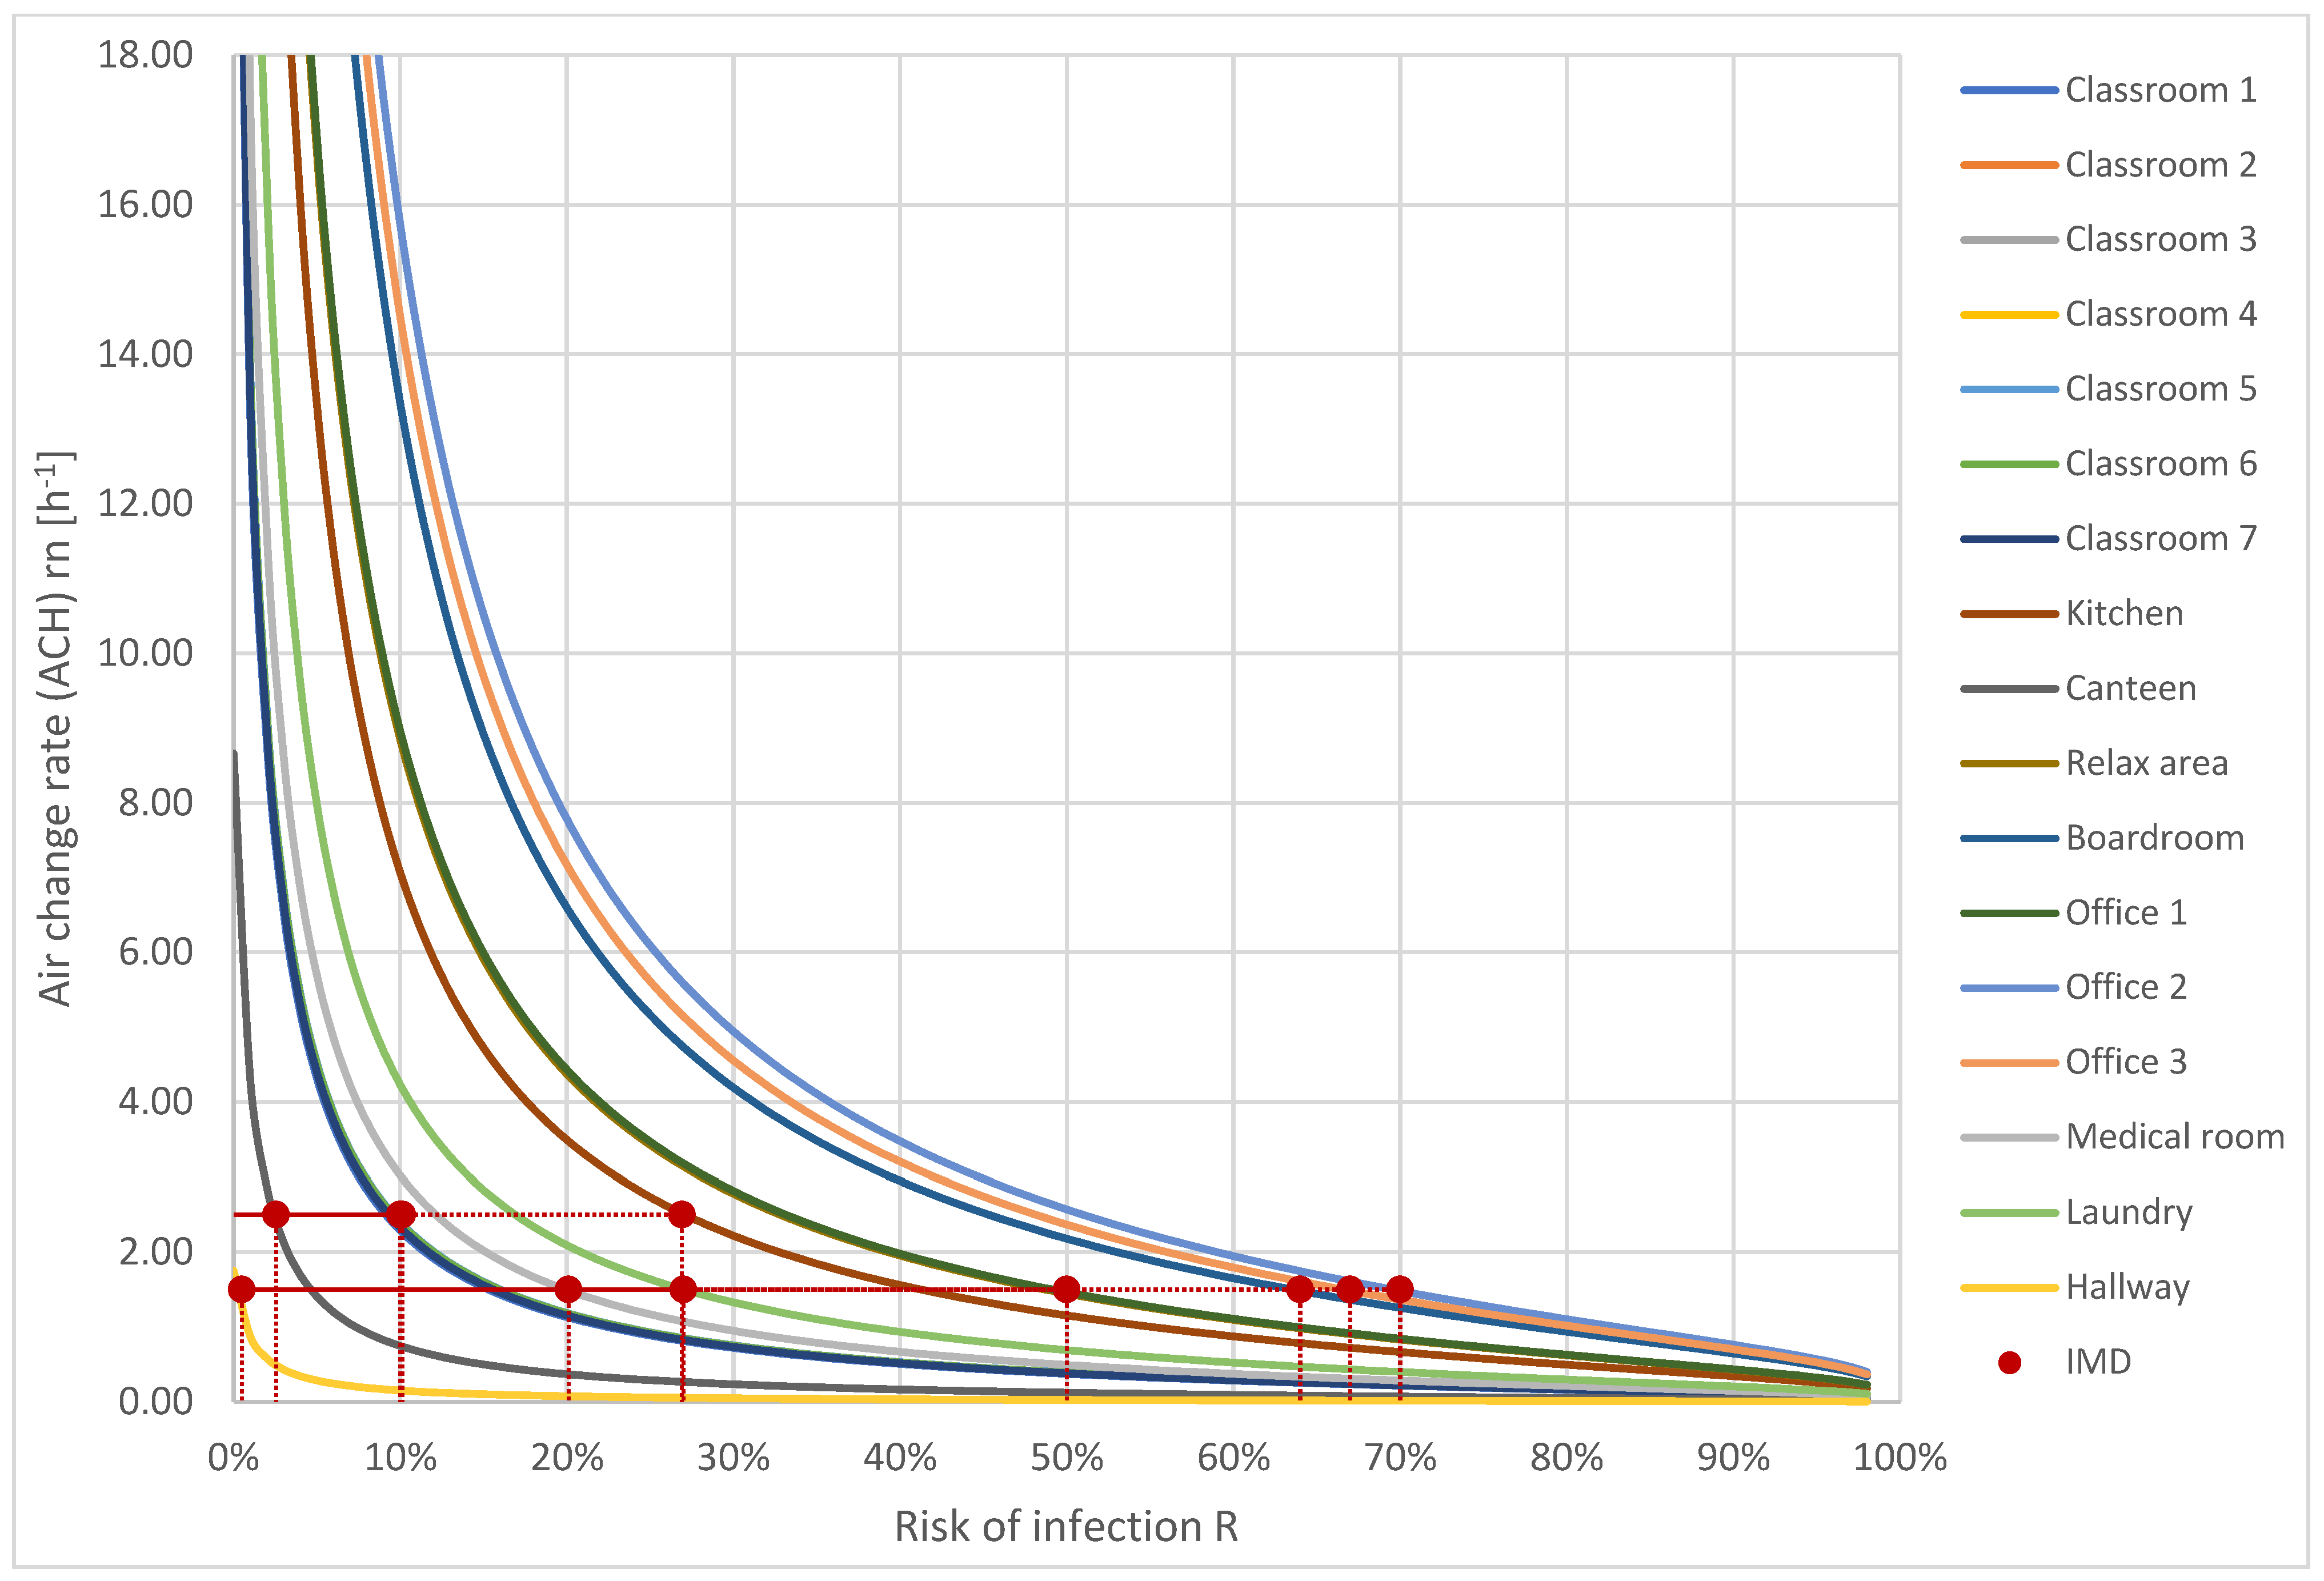
The approach of the Italian Ministerial Decree 18.12.1975 considers two fixed values of outdoor ACH, depending on the intended use of the room, i.e., 2.5 ACH and 1.5 ACH. The results were obtained from the application of the Wells–Riley model to the building-HVAC system, configured to provide these ventilation rates, which are reported in Figure 5. Points corresponding to the operative condition for each room are highlighted in red. In Table 5, the values of outdoor air volumetric flow rate and infection risk R attained by applying this approach are reported for each room of the school building.
From these results, it can be observed that the minimum risk of infection is in the hallway (1%). An acceptable risk of infection equal to 10% is present in classrooms. Higher values of infection risk occur in the remaining rooms, ranging from a minimum of 21% in the medical room to a maximum of 70% in Office 2. Offices, the boardroom, and the relaxing area are the most critical zones for infection diffusion. Even though classrooms have a relatively low value of infection risk, with this IMD approach, many other rooms show high or very high risk. Therefore, infection risk levels are very variable between different room types and are substantially uncontrolled by the building’s HVAC plant system designer.
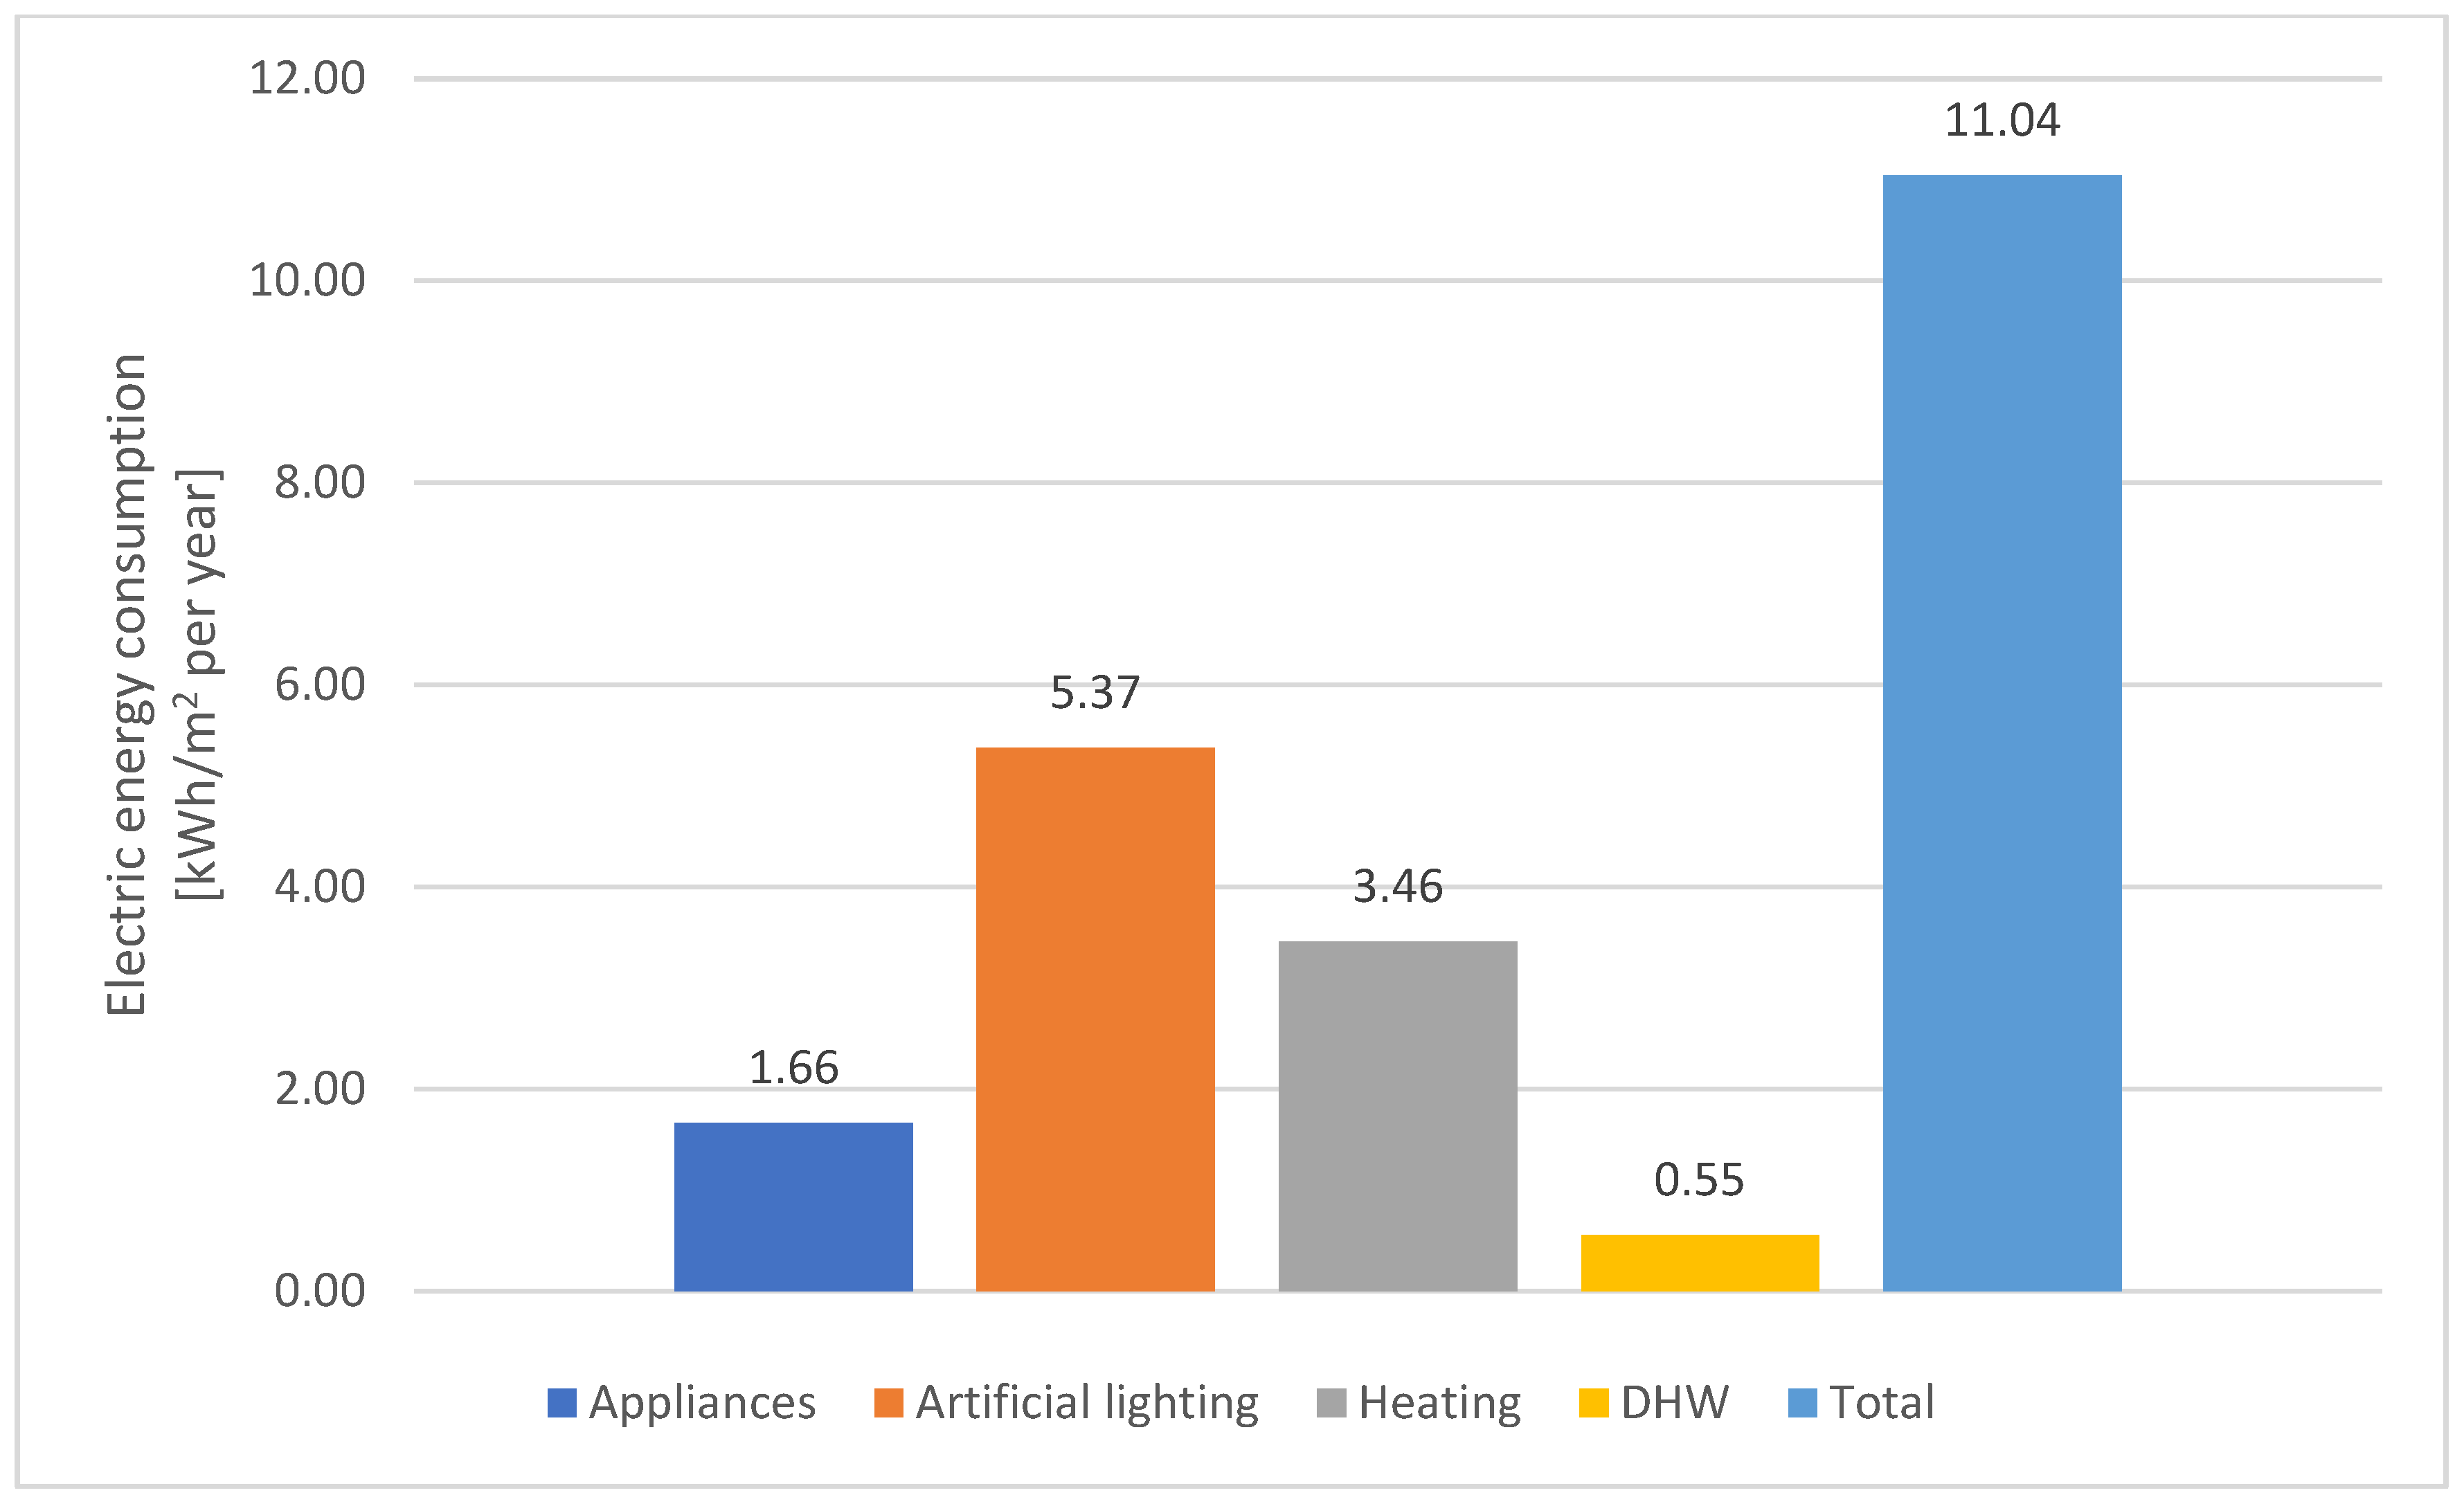
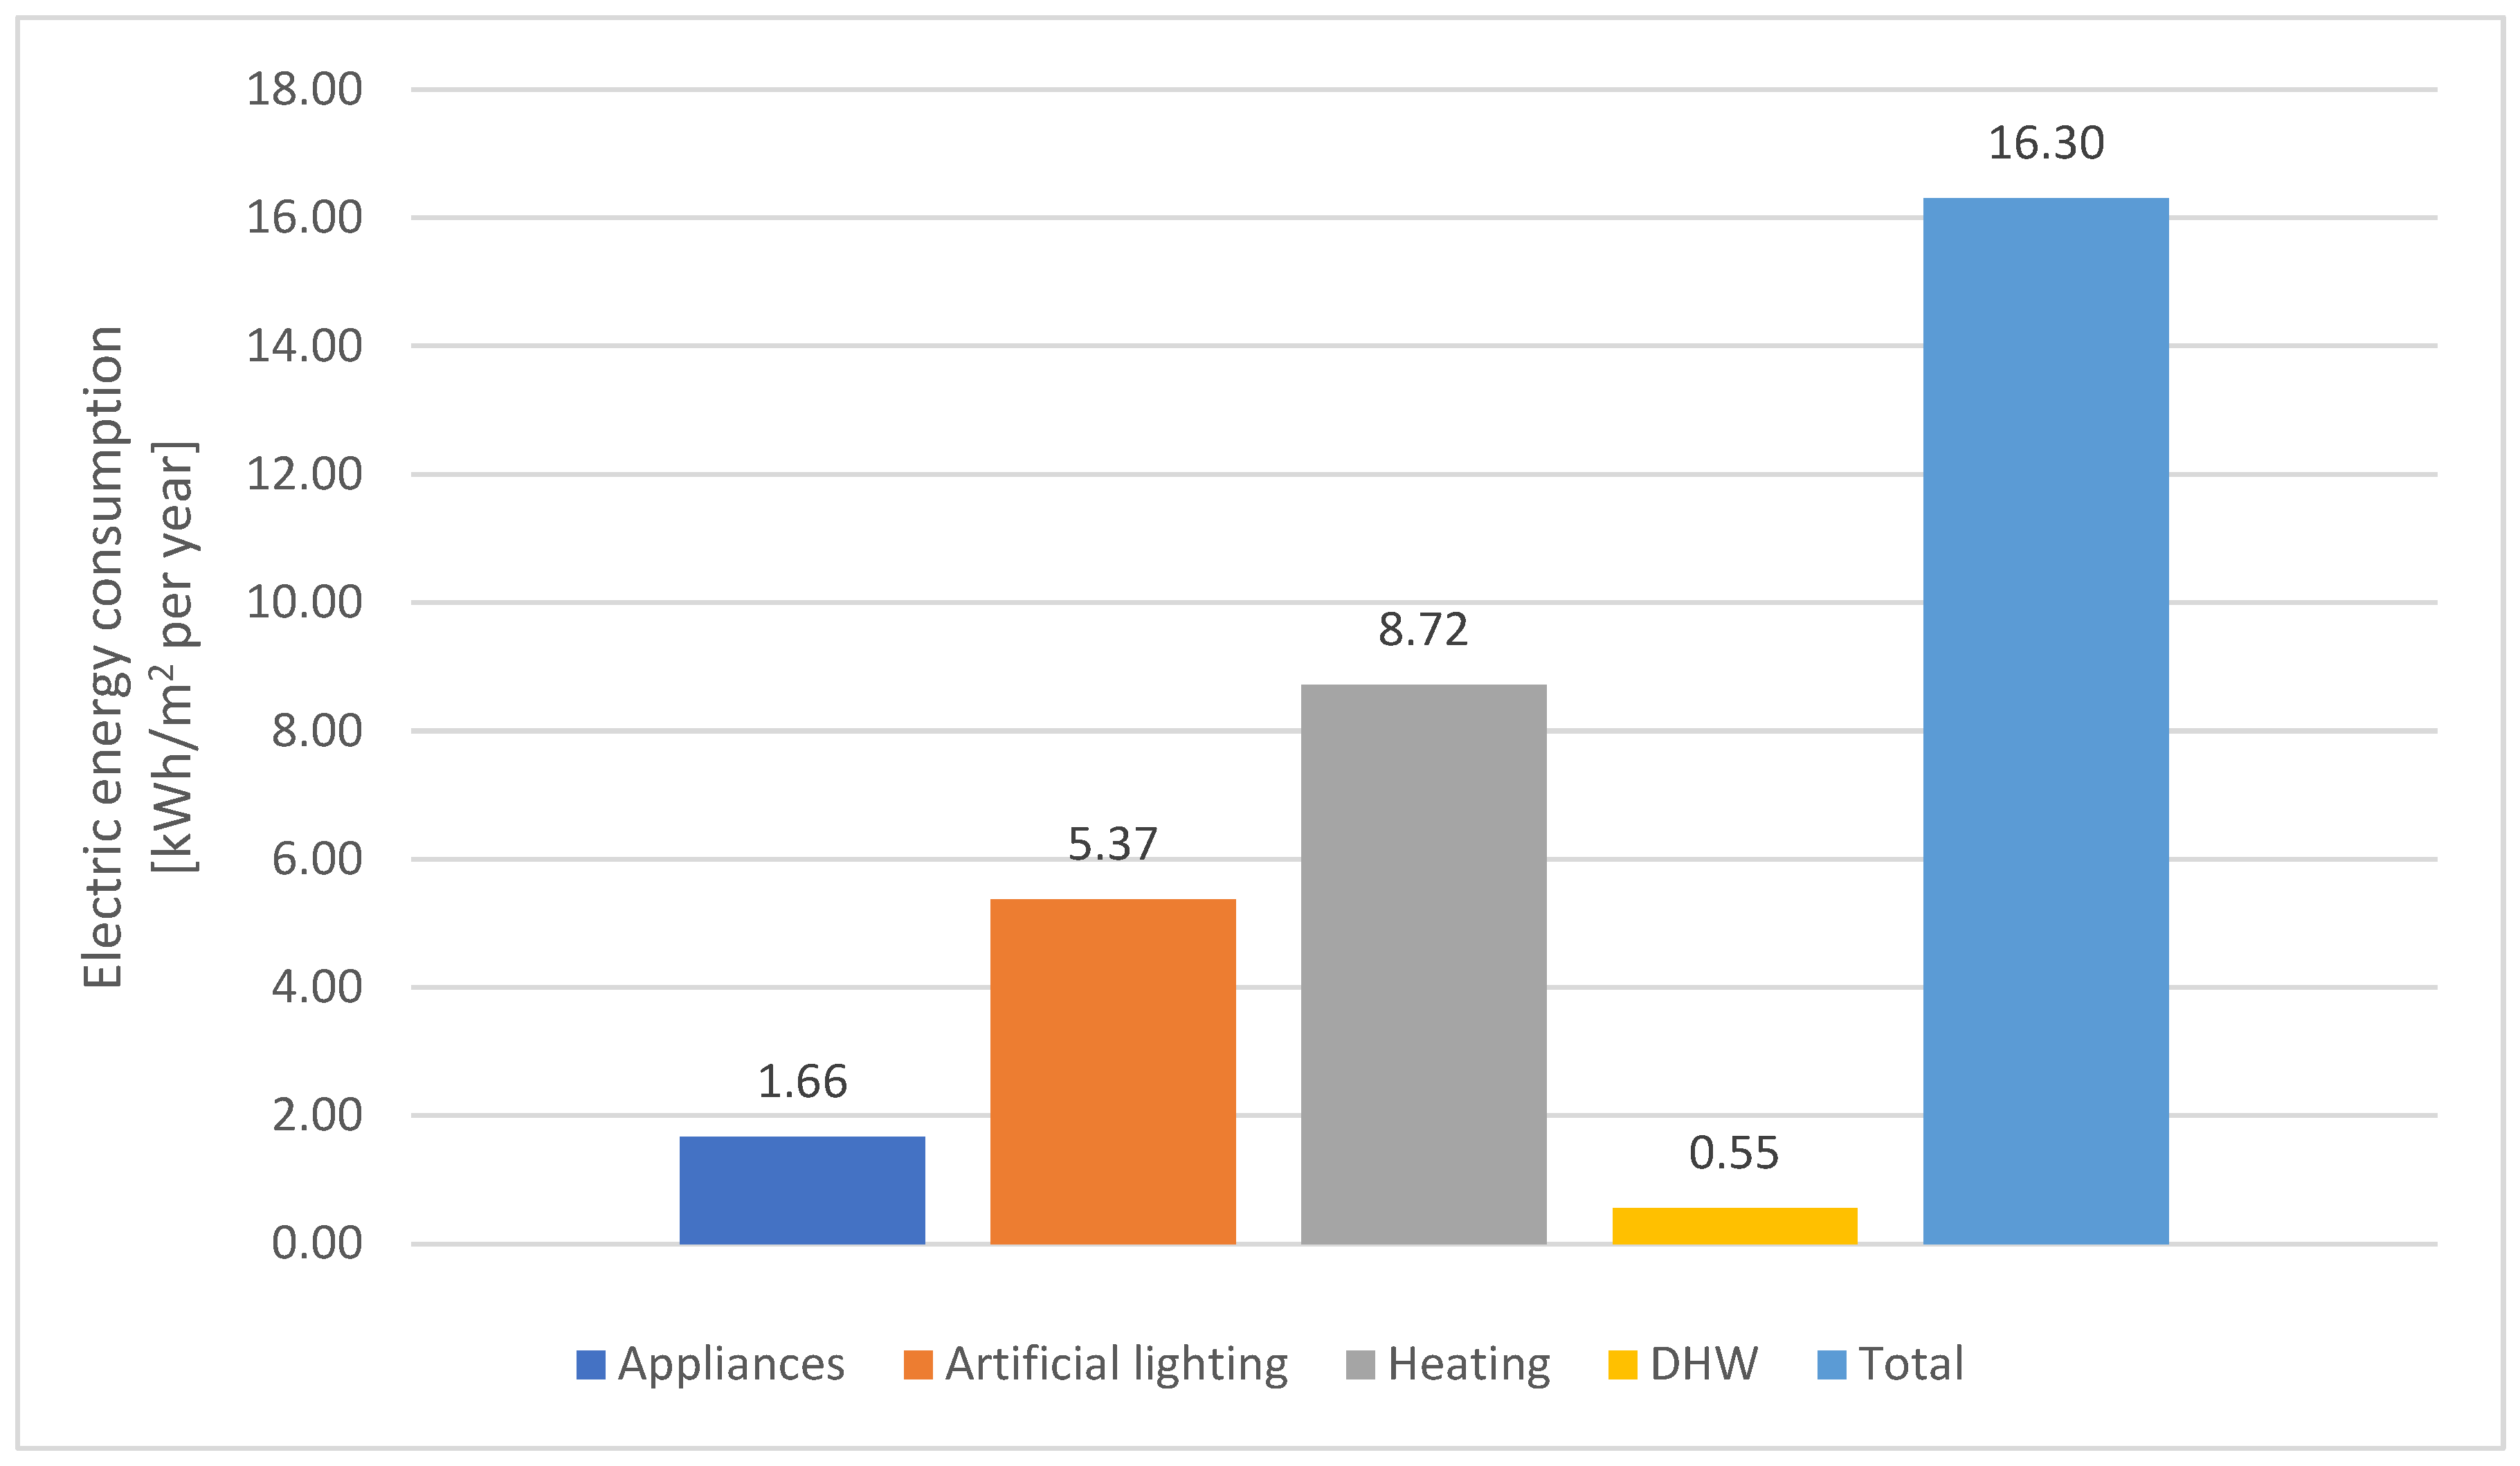
The results of the annual dynamic energy simulations of the building’s HVAC plant system performed with DesignBuilder are shown in Figure 6. A total electric energy consumption equal to 20,086 kWh (11.04 kWh/m2) per year is obtained when using the IMD approach. These are the values of electric energy consumed for:
-
building appliances: 3023 kWh per year or 1.66 kWh/m2 per year;
-
artificial lighting: 9774 kWh per year or 5.37 kWh/m2 per year;
-
DHW: 1000 kWh per year or 0.55 kWh/m2 per year;
-
heating + mechanical ventilation: 6289 kWh per year or 3.46 kWh/m2 per year.
Considering the emission factors of the Italian electric energy grid (0.445 kgCO2-eq/kWh), the total building operational GHG emissions related to this scenario are equal to 8938 kgCO2-eq (4.91 kgCO2eq/m2) per year.

5.2. World Health Organization Approach (WHO Approach)

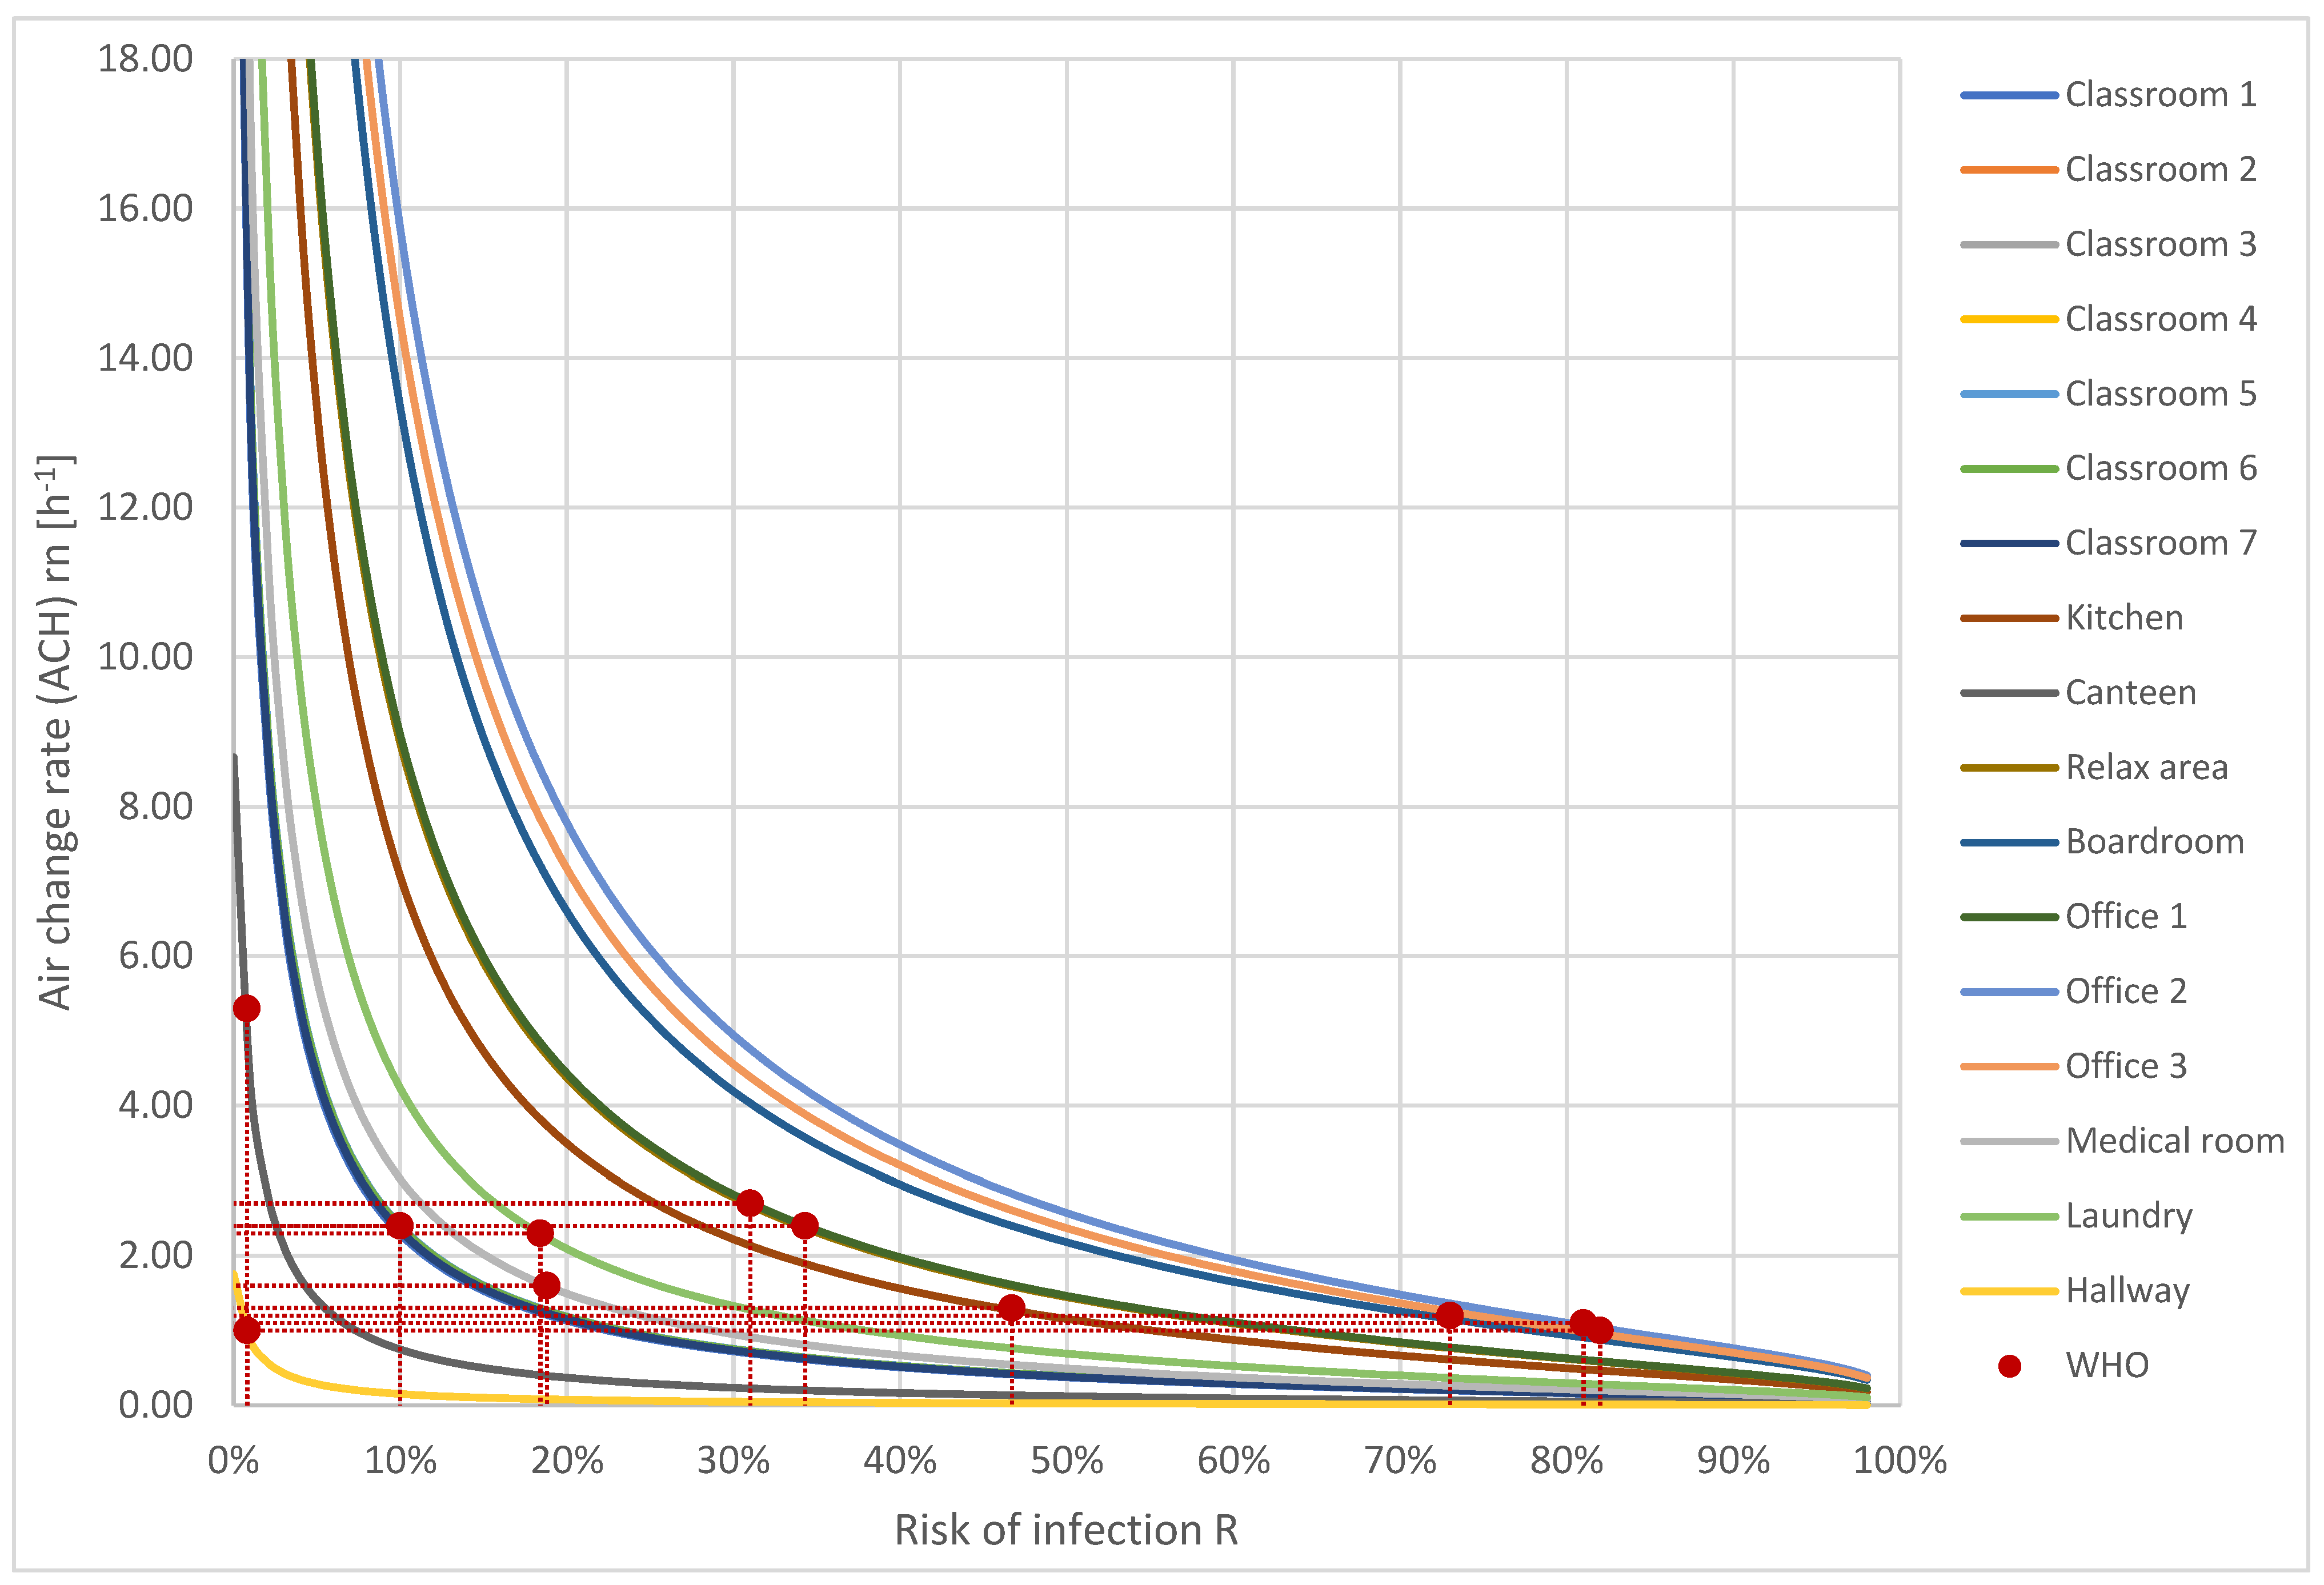
In order to reduce the risk of virus infection, the WHO recommends a minimum ventilation flow of 10 L/s per person in non-residential buildings. The ventilation rate (ACH) of each room is then calculated, considering the respective number of occupants. Figure 7 provides an overview of Wells–Riley method application to this ventilation rate design approach. Points corresponding to the operative condition for each room are highlighted in red. Outdoor air volumetric flow rates and related infection risk results obtained from the application of the Wells–Riley model are reported in Table 6.
It is also observed that, with this approach, a 10% virus infection risk is present in classrooms, i.e., outdoor air volumetric flow rates for these rooms are very similar to the ones obtained using the Italian Ministerial Decree (IMD) approach. The lowest risk of infection, equal to 2%, is present in the hallway. The maximum risk of infection at 82% is observed in Office 3, followed by Office 2 at 81% and Office 1 at 73%. Values ranging from 19% to 47% are found in other rooms. Ultimately, the WHO approach leads to low infection risk values in classrooms but very high ones in other rooms, especially in offices, which is similar to the IMD approach. Also, in this case, infection risk levels fluctuate drastically between different rooms and beyond the control of the building’s HVAC plant system design.
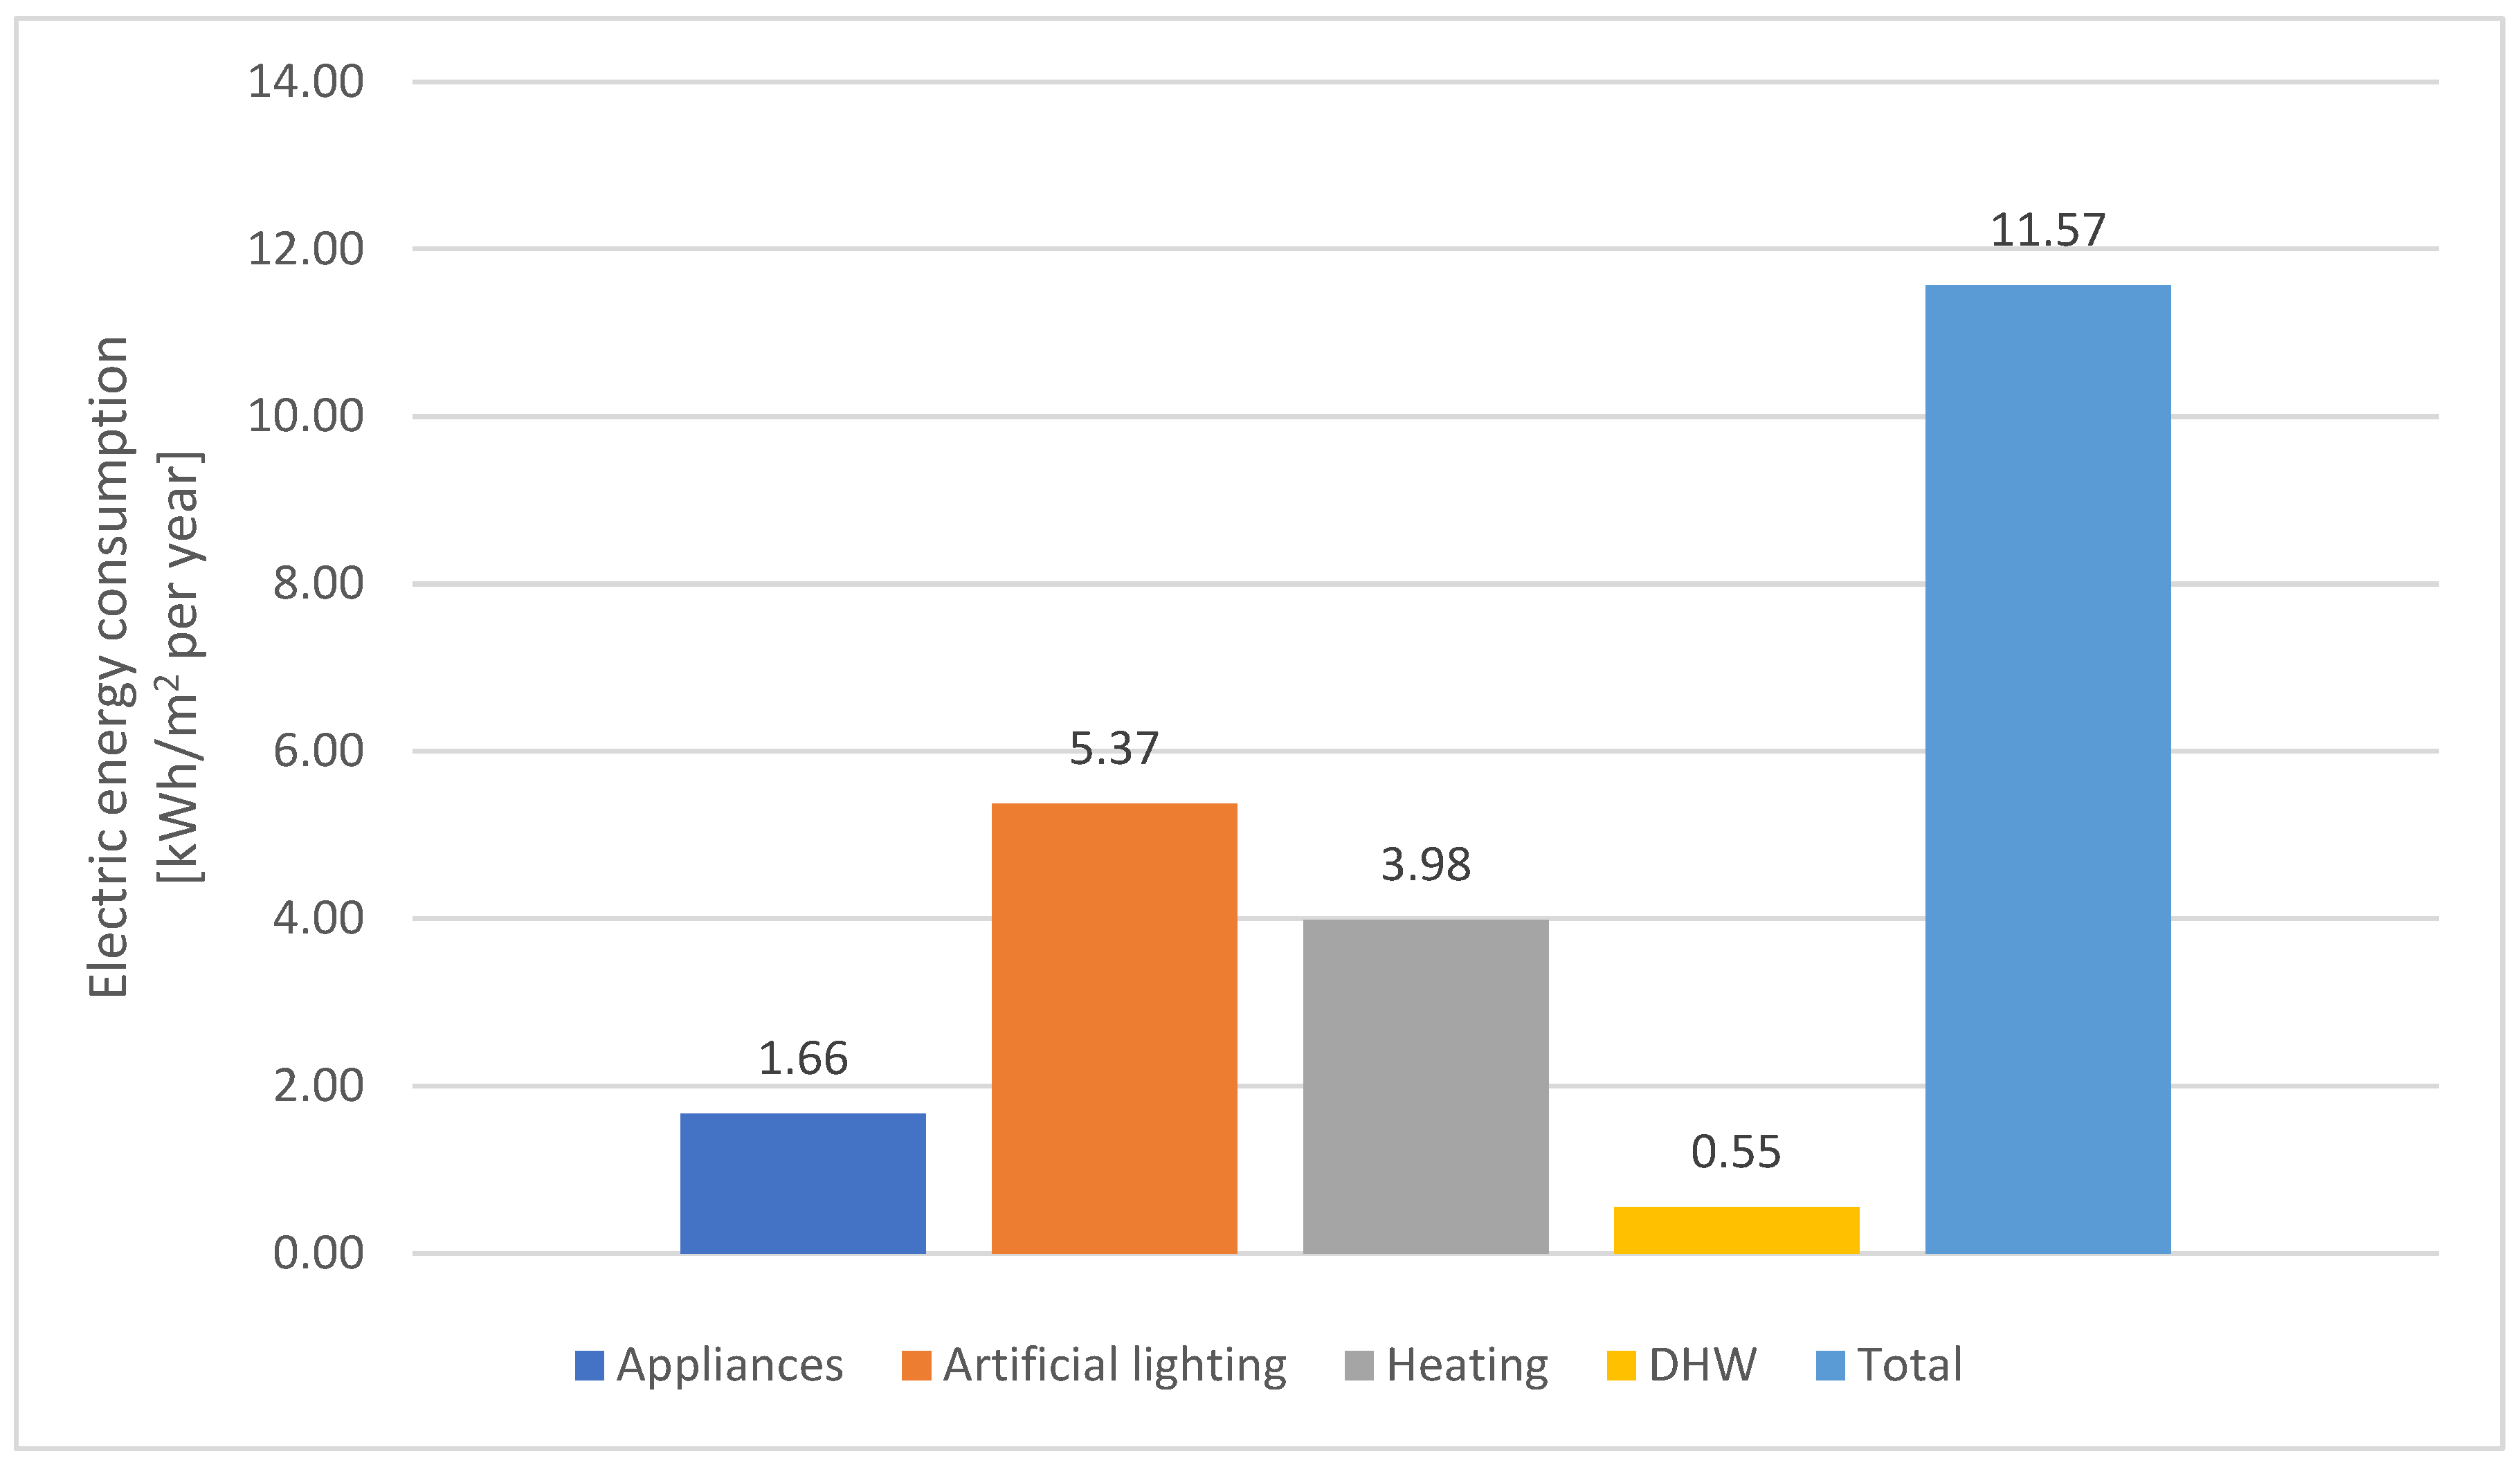
The annual electric energy consumption is also calculated using the WHO approach, and results are shown in Figure 8. A total electric energy consumption equal to 21,037 kWh (11.57 kWh/m2) per year is obtained using the WHO approach. Electric energy used for room appliances, lighting, and DHW is not affected by the change in ventilation rates, while that for heating accounts for 7239 kWh (3.98 kWh/m2) per year. Total energy consumption, in this case, slightly exceeds the consumption obtained with the IMD approach. The same occurs for total building operational GHG emissions related to this scenario, equal to 9361 kgCO2-eq (5.15 kgCO2-eq/m2) per year.

5.3. American Centers for Disease Control and Prevention Approach (ACDCP Approach)

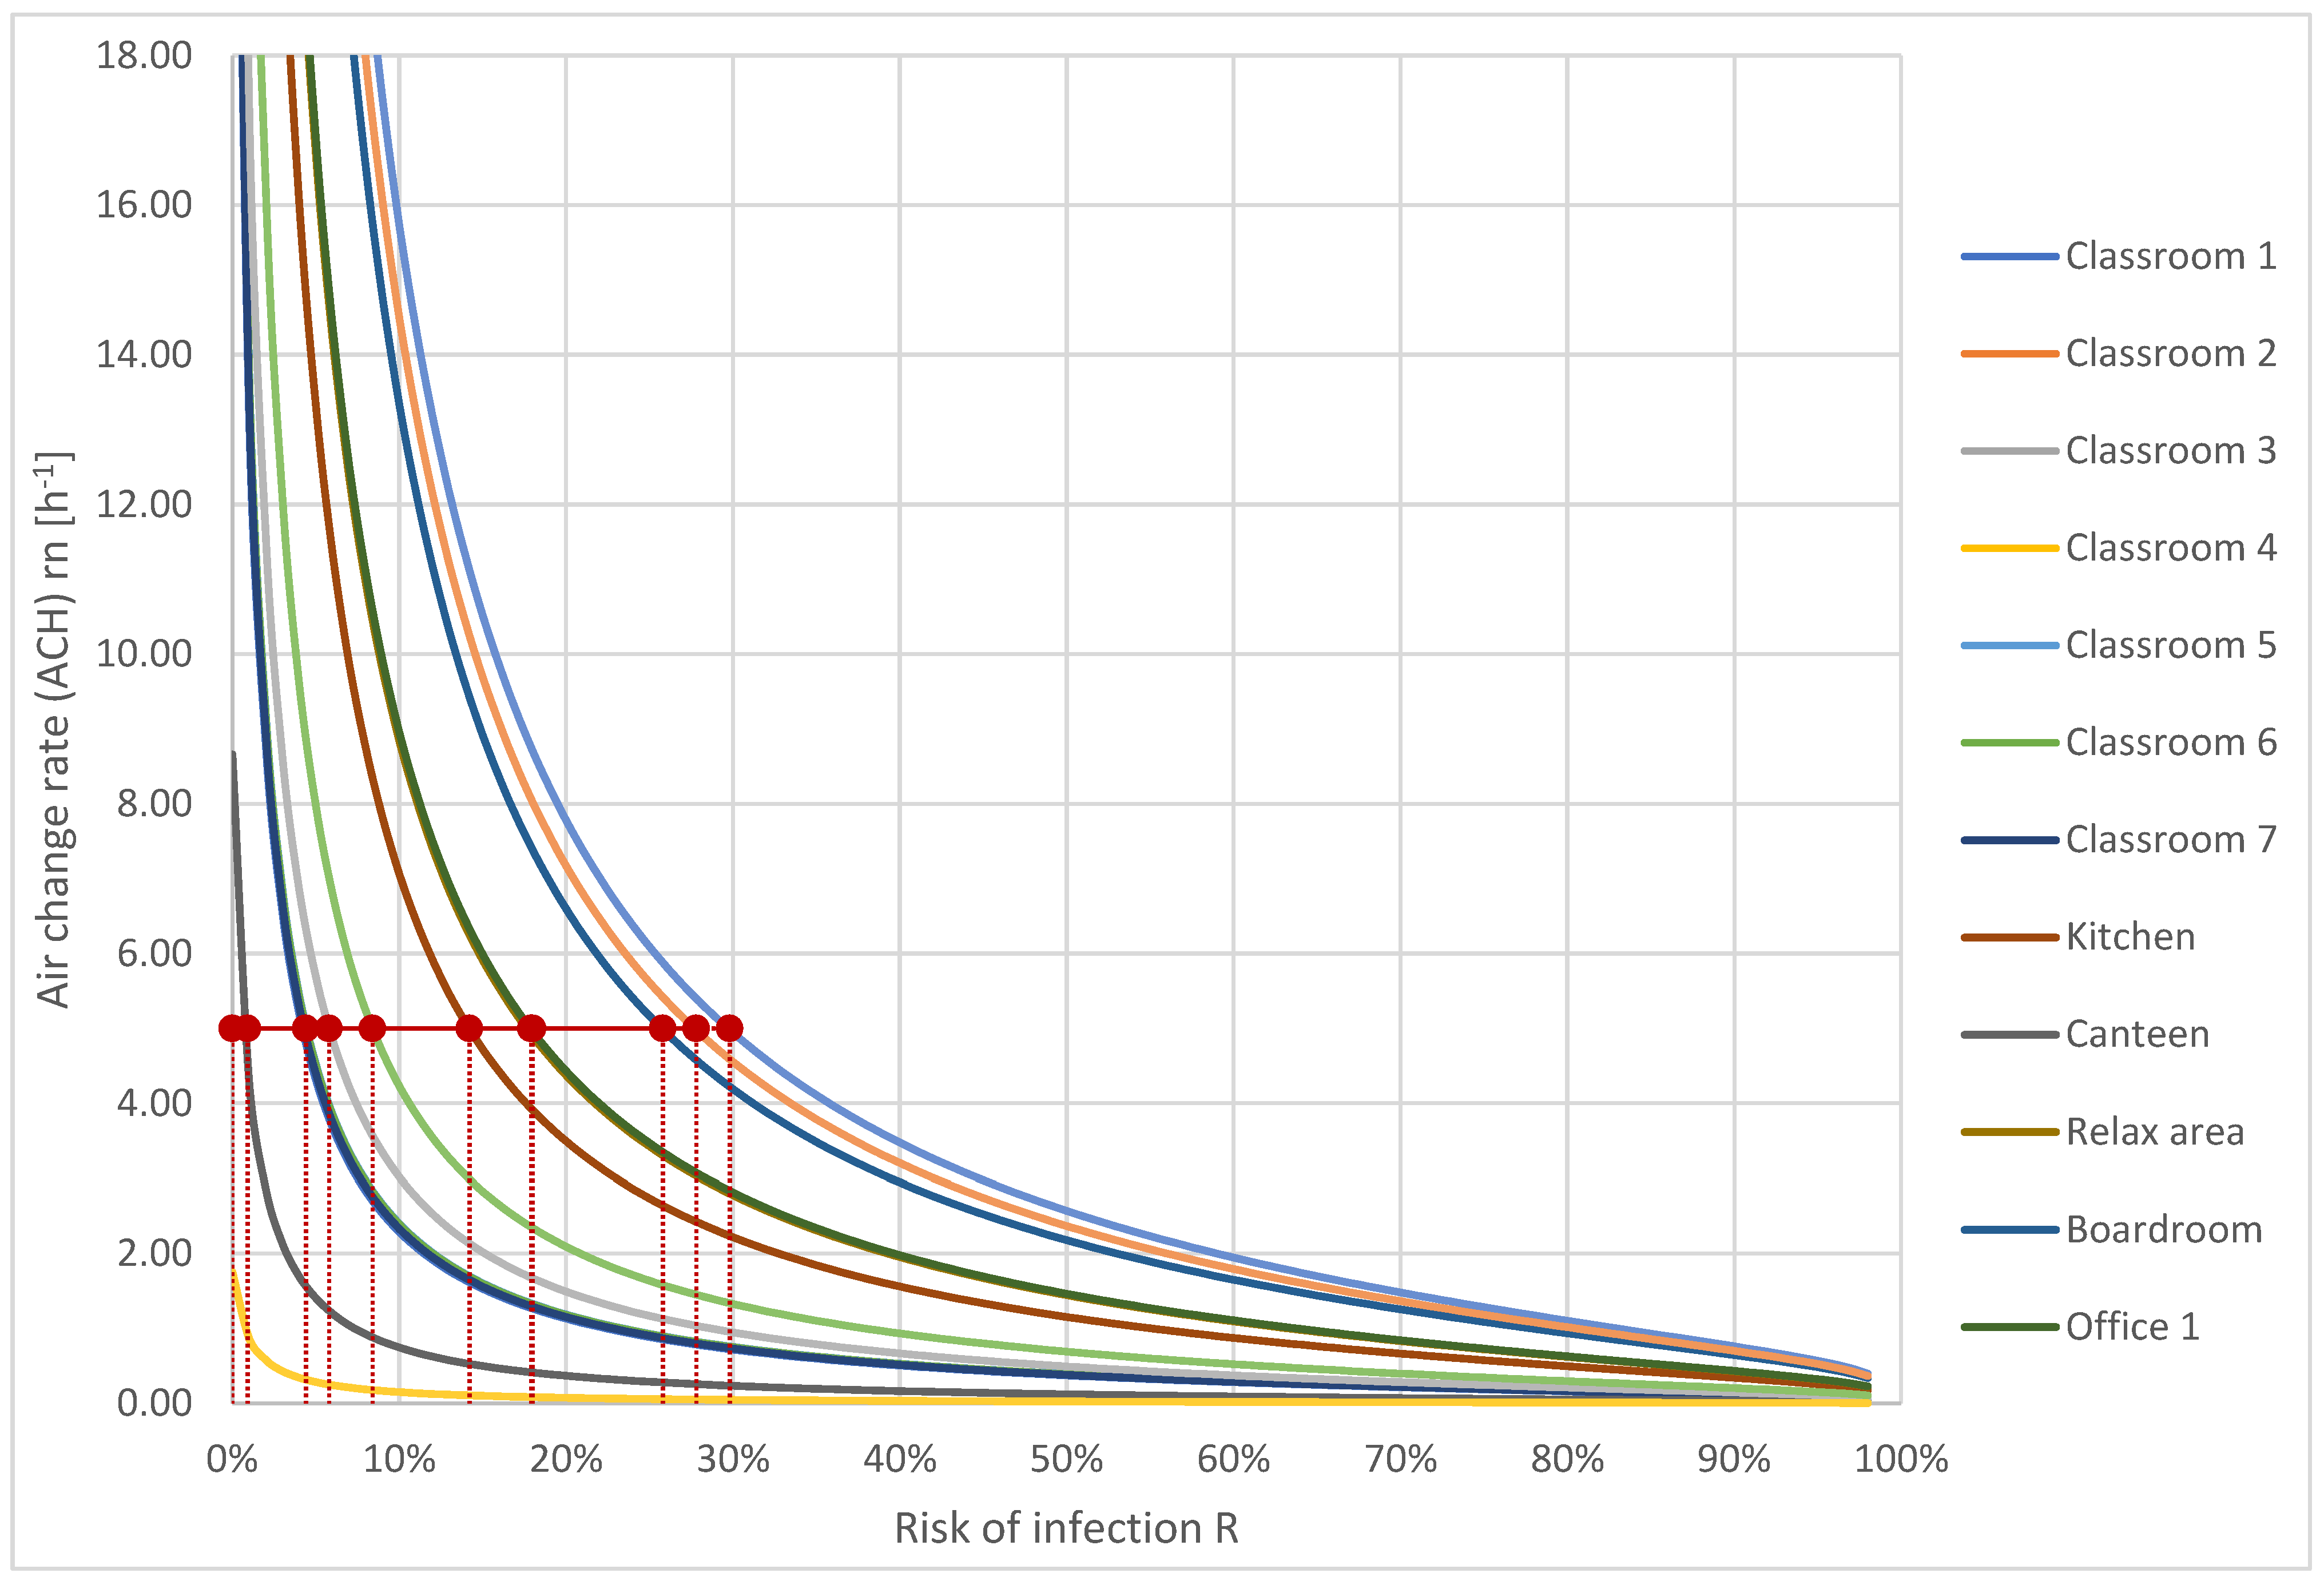
According to the approach recommended by the ACDCP, a constant value of five outdoor ACH should be considered for every room in the building. Figure 9 displays an overview of Wells–Riley method outcomes derived from the application of this method in determining outdoor ACH for rooms in the building and the resulting values of virus infection risk. Points corresponding to the operative condition for each room using the ACDCP approach are highlighted in red. The results are obtained from the application of the Wells–Riley model to the building’s HVAC plant system configured to provide five ACH in every room, according to the ACDCP, which are reported in Table 6 and Table 7.
Using the ACDCP approach, the risk of infection in classrooms is 5%. The hallway has a risk almost equal to 0. The highest risk is seen in Office 2 (30%), followed by Office 3 (28%), and the boardroom (26%). Other rooms exhibit an infection risk between 7% (medical room) and 19% (relaxing area and Office 1). Even in this case, the values of the infection risk, despite being significantly lower compared to the previous approaches, show inconstant behaviour across the different rooms.
Figure 10 shows the results of the annual dynamic energy simulation for the currently analysed approach. A total electric energy consumption equal to 29,650 kWh (16.30 kWh/m2) per year is obtained utilising the ACDCP approach. The electric energy used for room appliances, lighting, and DHW is not affected by the change in ventilation rates, while that for heating accounts for 15,853 kWh (8.72 kWh/m2) per year, approximatively double compared to the values in the IMD and WHO approaches. Also, total building operational GHG emissions related to this scenario increased significantly, up to 13,194 kgCO2-eq (7.25 kgCO2-eq/m2) per year.

5.4. Gradual Increase in Ventilation Approach (Parametric Analysis)

The impact of increasing the values of outdoor ACH is investigated by simulating 10 different scenarios of building ventilation, moving from one ACH to ten ACH. In each scenario, the number of ACH is considered equal in every room of the school building.
The results obtained from the application of the Wells–Riley model in all 10 ACH scenarios are shown in Table 8.
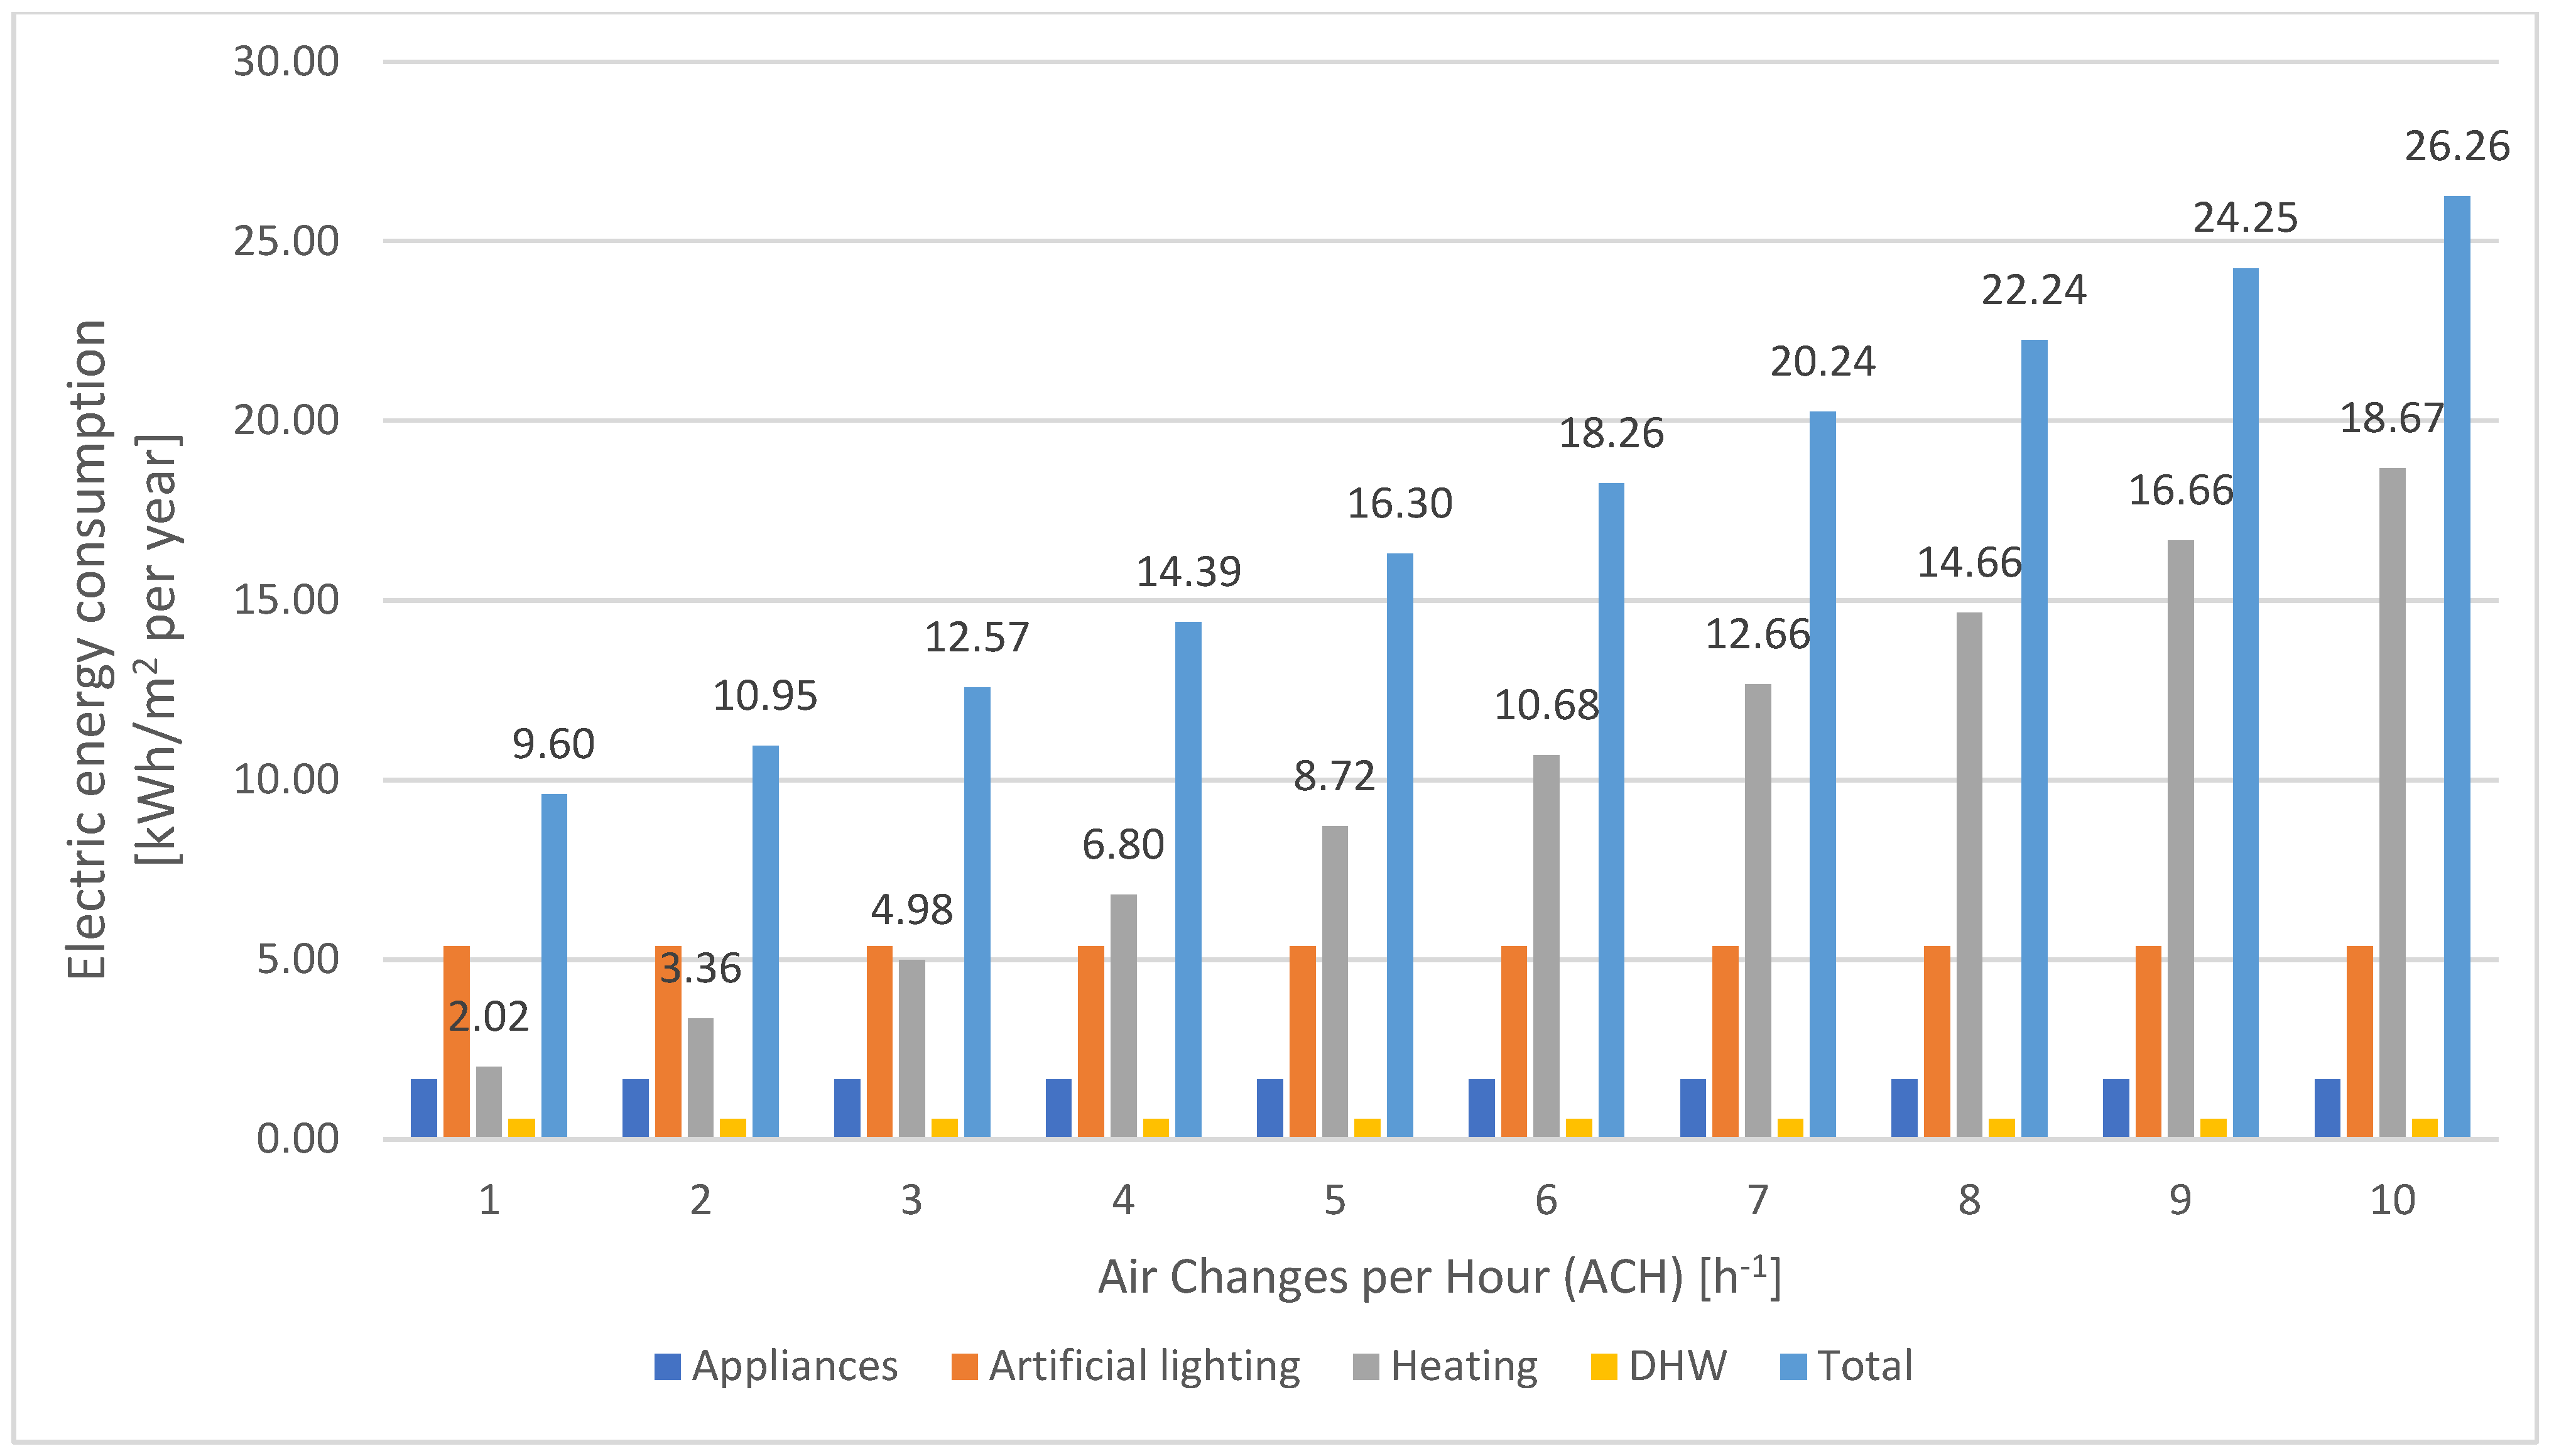
When analysing the results reported in Table 8 but also the curves of Figure 4, it can be observed that for ventilation rates lower than five to six ACH, significant differences in infection risk are present from one scenario to the next. However, increasing the ventilation rate over this boundary leads to only slightly lower risks of infection. This confirms the results of similar studies [117] and parametric analyses [27]. It is also observed that even with 10 ACH, the maximum risk of virus infection is still equal to 16–17% in some rooms (Office 3 and Office 2). Furthermore, attaining uniformity of infection risk in all rooms is still a long way off. This demonstrates that gradually increasing ventilation rates in a building’s rooms does not represent an optimal ventilation strategy from the point of view of infection risk control, and this is confirmed by observing the results of dynamic energy simulations performed for the 10 scenarios. The annual electric energy consumption is calculated for the 10 scenarios and results are reported in Figure 11. It is observed that electric energy consumption of the building increases linearly with ventilation rates from a minimum of 9.60 kWh/m2 per year in the case of one ACH to a maximum of 26.26 kWh/m2 per year in the case of ten ACH. Similarly, GHG emissions change from 4.27 kgCO2-eq/m2 to 11.69 kgCO2-eq/m2 per year. This variation is due to the increase in electric energy related to the heating + mechanical ventilation service, which moves from 2.02 kWh/m2 to 18.67 kWh/m2, significantly influencing the GHG operational emissions of the building’s HVAC plant system. Considering total electric energy consumption and operational GHG emissions (47,757 kWh and 21,252 kgCO2-eq per year, respectively, in the 10 ACH scenario), the gradual increase in ventilation rate approach also has some drawbacks from this point of view.
As can be seen from these results, increasing the outdoor ACH does not control the infection risk and can result in very high energy consumption and operational GHG emissions, while still leaving medium–high infection risk in certain rooms. This highlights the need for a new tailored approach, which is proposed in the following section.

5.5. New Tailored Approach (Controlled Maximum Infection Risk in All Rooms)

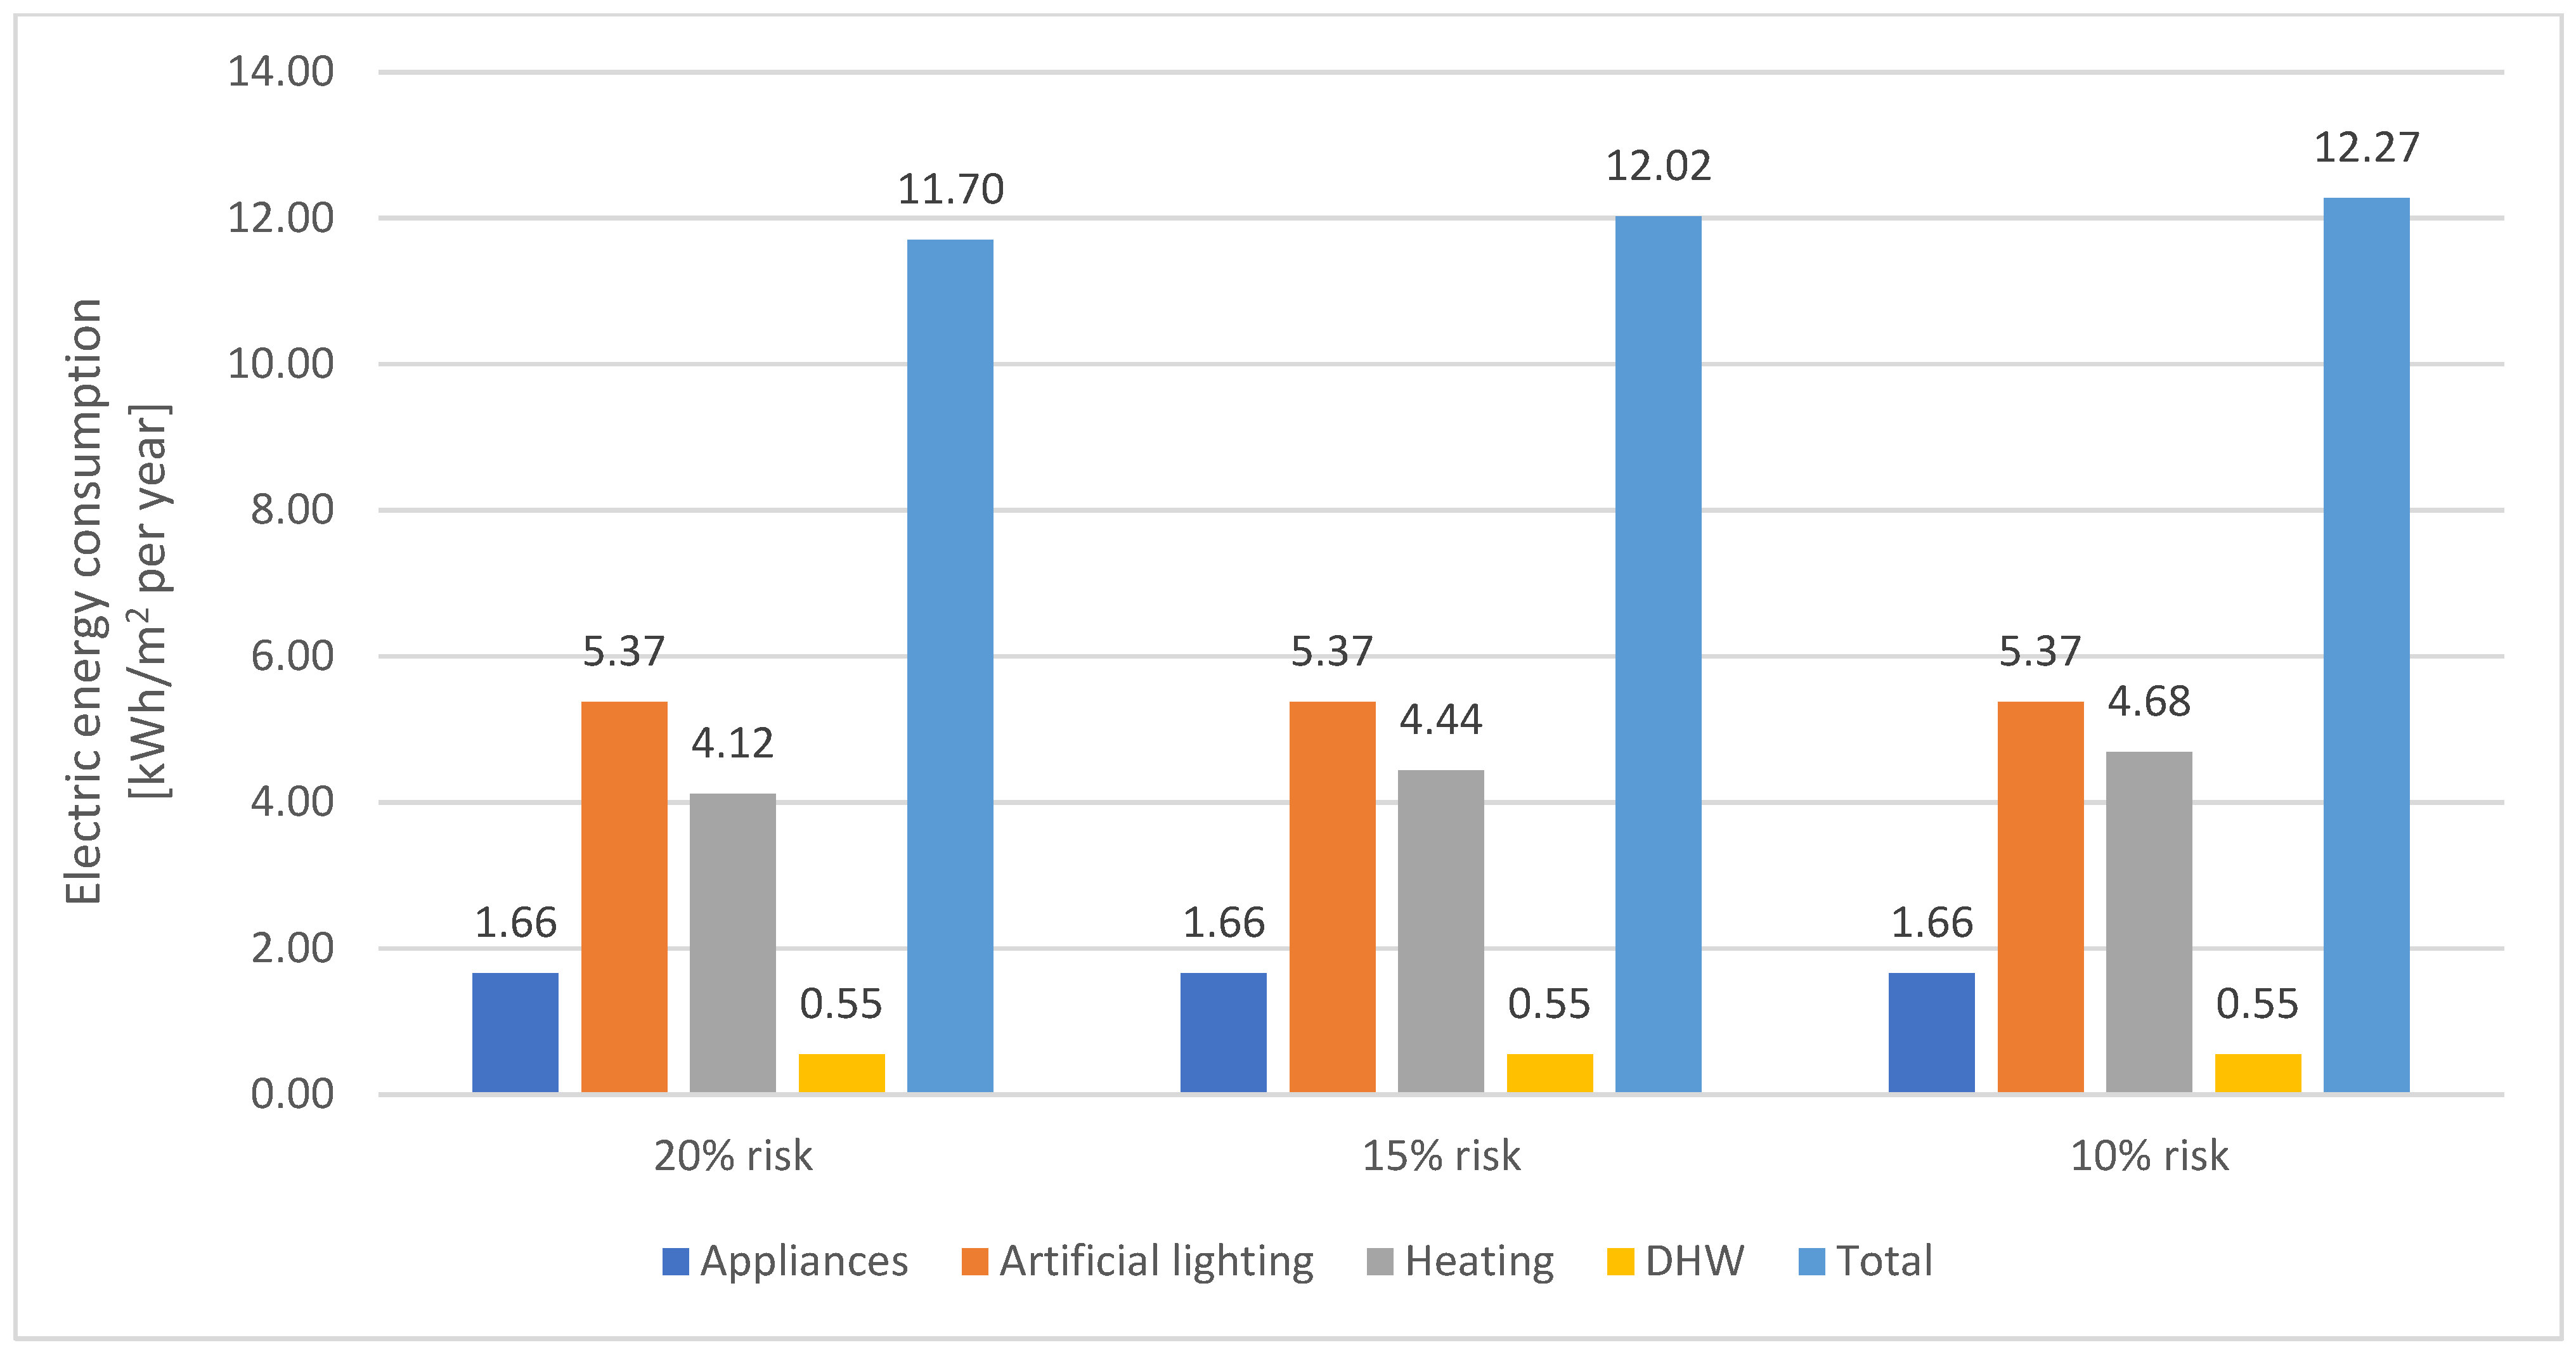
The proposed approach allows the maximum attainable risk to be set in all rooms and derives the related outdoor air volumetric flow rate using the Wells–Riley model. It allows us to “tailor” the ventilation rate to the specific infection risk for each room. An acceptable risk is not univocally definable but should instead be evaluated on a case-by-case basis. For this reason, the present study applies the proposed approach and utilises three infection risk thresholds of 20%, 15% and 10%. From each of these three risk values, the outdoor air flow rate (expressed in vol/h) is derived in order to attain a controlled and uniform risk in each room. An overview of the results of this analysis is shown in Figure 12.
Outdoor air volumetric flow rates for each room are calculated, and the results for 20%, 15%, and 10% infection risks are reported in Table 9, Table 10 and Table 11, respectively.
In cases of 20% infection risk, it was noted that the resulting outdoor ACH values vary from 0.1 h−1 in the hallway to 7.8 h−1 in Office 2. A value of 1.2 h−1 is obtained in classrooms. According to these results, Office 2 is the most critical room and requires the highest air change rate to lower the risk to just 20%.
In cases of a 15% infection risk, it was noted that outdoor ACH values vary from 0.1 h−1 in hallway to 10.6 h−1 in Office 2. Classrooms need a ventilation rate equal to 1.5 h−1, while other rooms exhibit intermediate values.
In cases of a 10% infection risk, it was noted that outdoor ACH values vary from 0.2 h−1 in the hallway to 16.0 h−1 in Office 2. Classrooms need a ventilation rate equal to 2.3 ACH, while other rooms exhibit intermediate values. Outdoor ACH for Offices 2 and 3 are much higher than 10 h−1 and, therefore, require special attention in the air inlet design to avoid excessive air velocity.
The dynamic energy simulations of the building’s HVAC plant system were performed considering outdoor ACH obtained in the three risk scenarios for the different rooms. The annual electric energy consumption of the building–plant system for infection risk scenarios of 20%, 15%, and 10% was calculated and is reported in Figure 13.
Electric energy consumption due to heating service ranges from 4.12 kWh/m2 or 7498 kWh per year in the case of a 20% risk of infection to 4.68 kWh/m2 or 8518 kWh in the case of a 10% risk of infection. Total electric energy consumption varies accordingly from 11.70 kWh/m2 or 21,294 kWh per year to 12.27 kWh/m2 or 22,331 kWh per year. These values correspond to operational GHG emissions of the building equal to 5.21 kgCO2-eq/m2 or 9482 kgCO2-eq per year and 5.46 kgCO2-eq/m2 or 9937 kgCO2-eq per year. These values are comparable to the ones obtained in IMD and WHO approaches but the infection risk is lower and is controlled by the design.
It is outside the scope of this article to define an acceptable value for infection risk. Therefore, this investigation limits the risk to 10% (this is the lowest attained in classrooms when applying the IMD and WHO approaches). In future studies, finding an acceptable value of virus infection risk may be pursued.

5.6. Comparison of the Analysed Approaches

This section compares the five approaches analysed to optimize IAQ and reduce the risk of infection in the case study school building, taking as a reference the results obtained with the IMD approach, which is currently in force in Italy.
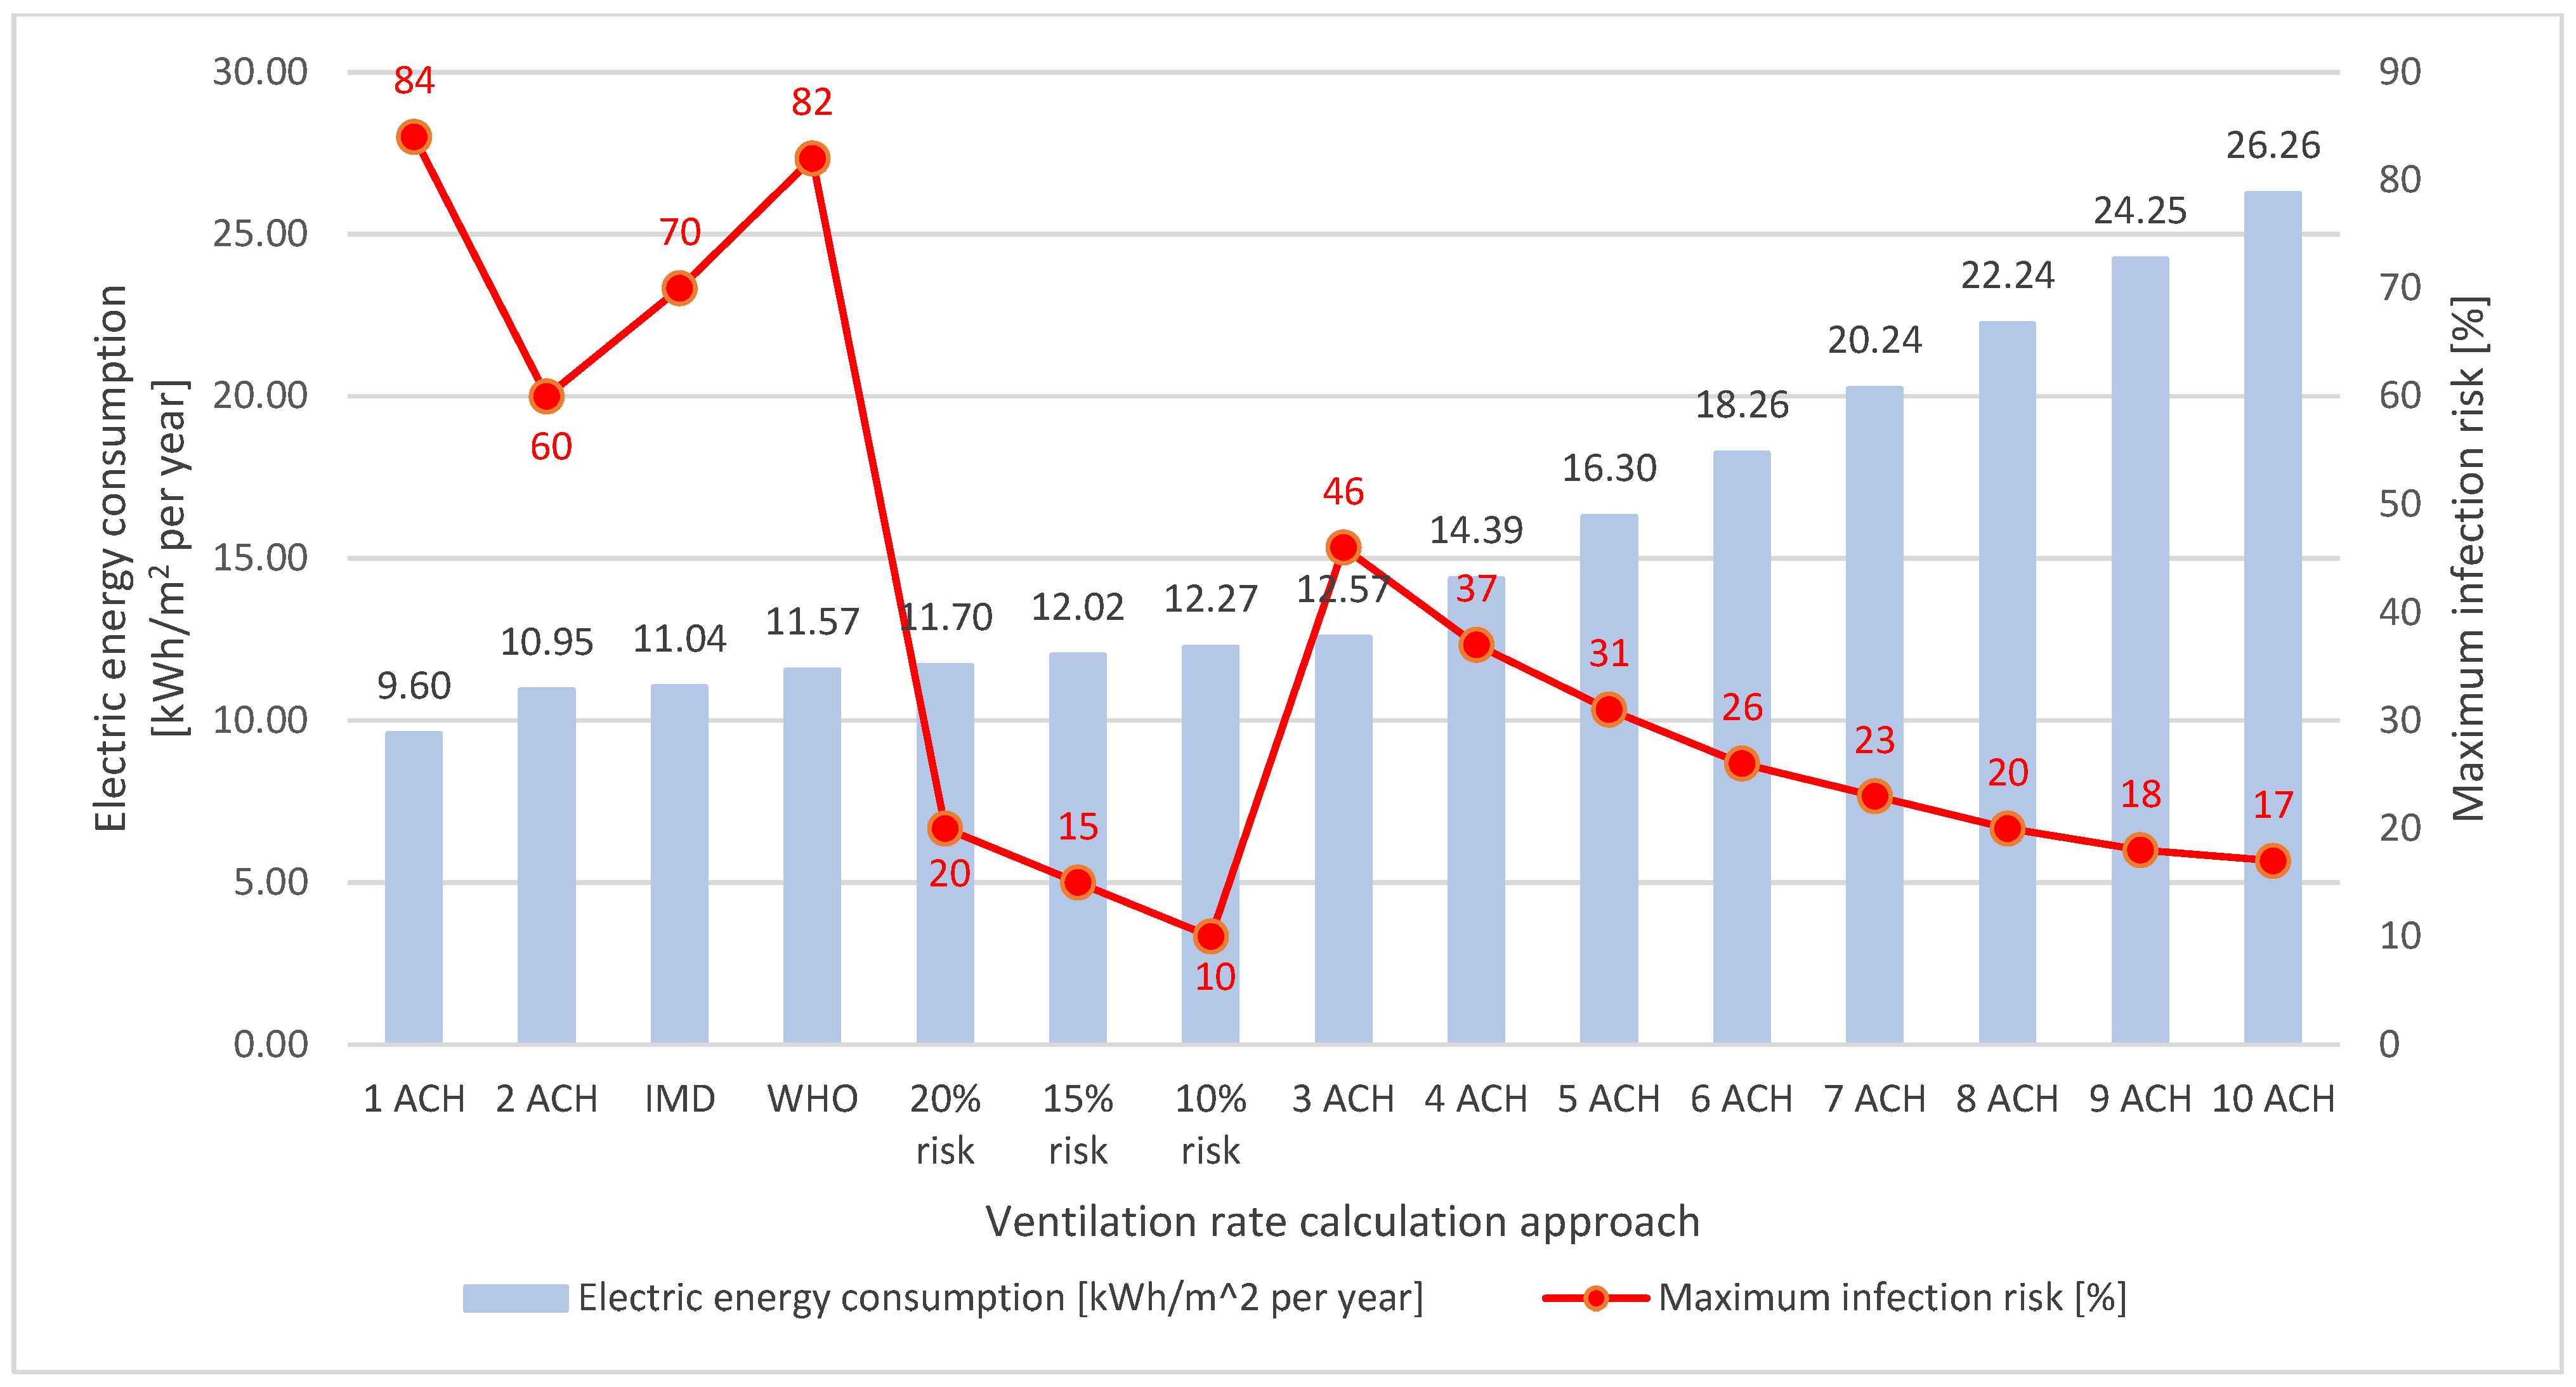
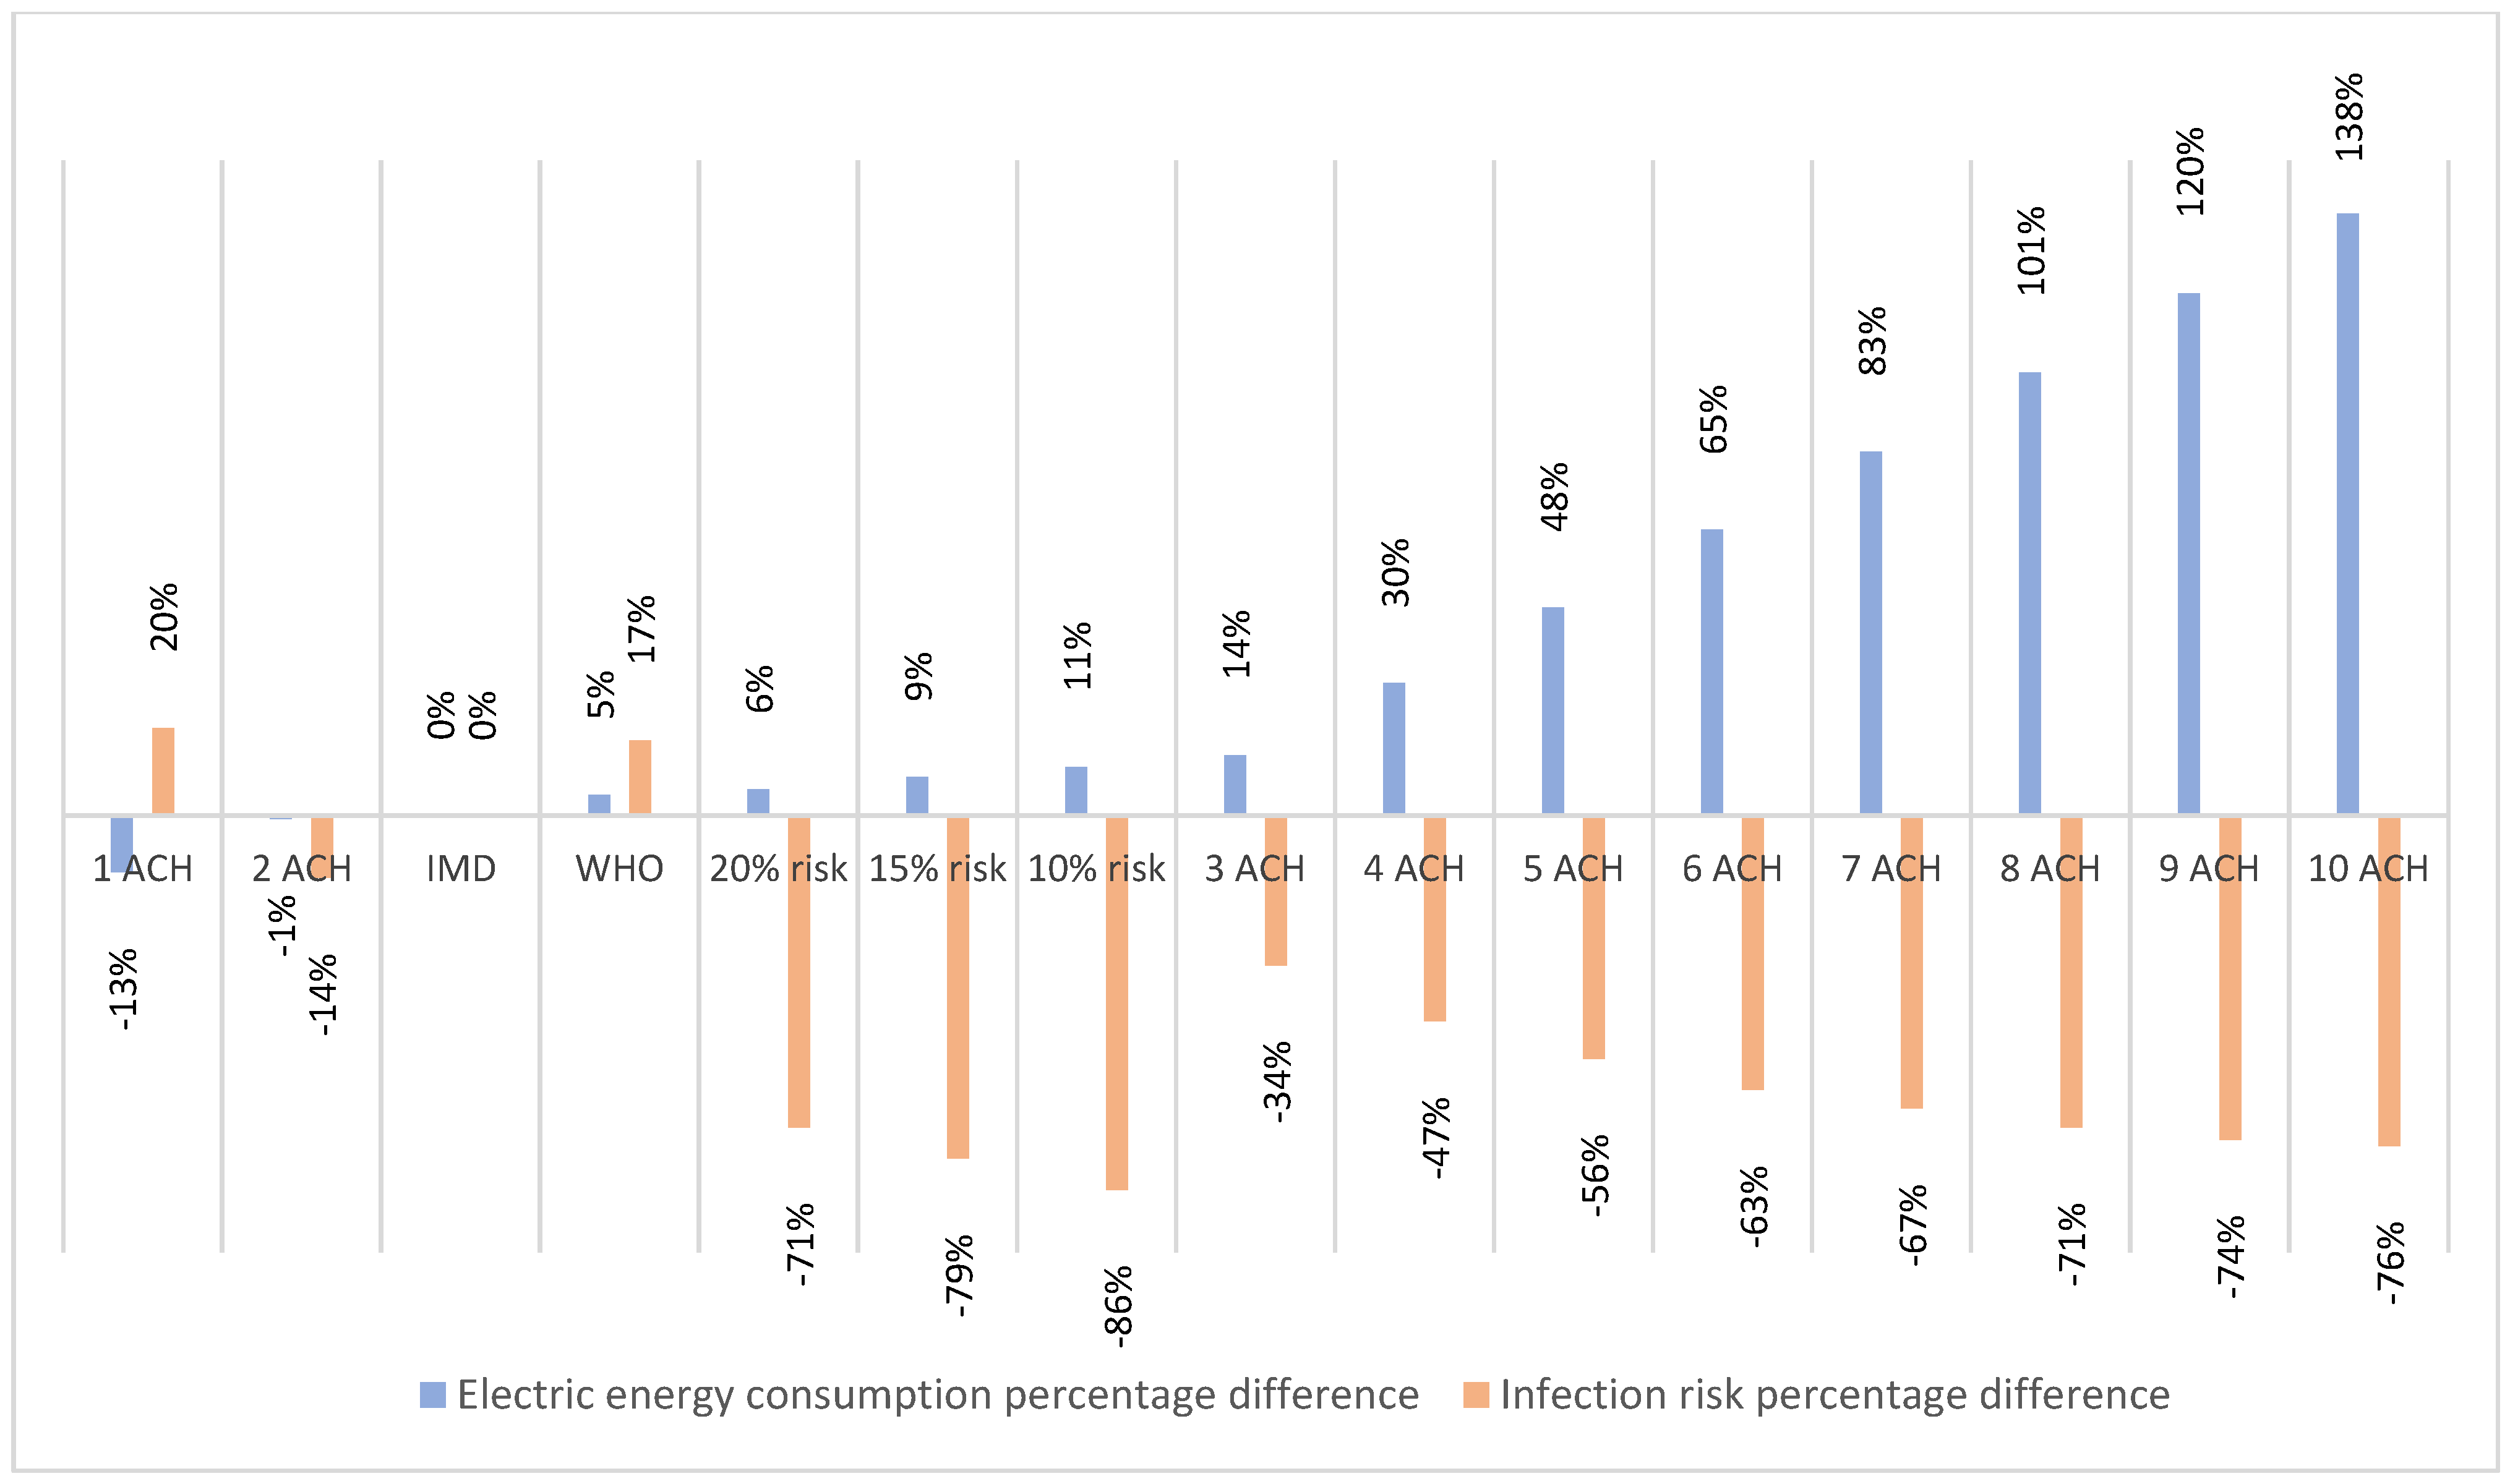
In Figure 14, the total electric energy consumption of the building–plant system and the maximum risk of virus infection attained in the rooms are shown, moving from the ventilation approach with lower energy consumption (one ACH) to the more intensive one (ten ACH).
The percentage variation of both the total electric energy consumption and the maximum risk of virus infection attained with each analysed ventilation rate design approach is calculated with respect to the IMD approach and shown in Figure 15. The results of the approaches from lower energy consumption (one ACH) to the more intensive consumption (ten ACH) are reported.
Considering these outcomes, the IMD and WHO approaches are among the least energy intensive ones. Total electric energy consumption related to the WHO approach (10 L/s per person) is approximately equal to that obtained with the IMD. However, the maximum risk of virus infection is very high, reaching 70% and 82%, respectively, in the most disadvantaged rooms.
Maximum infection risk significantly decreases when considering higher ACH values, but electric energy consumption shows an increasing trend that reaches the maximum percentage difference (+138%) in the case of 10 ACH, as reported in Figure 15.
On the other hand, regarding the proposed tailored approach, Figure 14 shows that the target values of the maximum 20–15–10% risks are attained with limited increases in energy consumption (6–9–11%) compared to the traditional IMD and WHO approaches.
Comparing the percentage variations of electric energy consumption and maximum infection risk attained in the rooms, the following conclusions can be drawn. Using the proposed tailored approach, compared to IMD approach, the maximum infection risk is reduced by 71% when using the 20% risk approach, by 79% when using 15% risk approach, and by 86% when using the 10% risk approach, with an increase in electric energy consumption of 6%, 9%, and 11%, respectively. A comparable maximum infection risk reduction is obtained with the gradual ventilation increase approach, but involving energy consumption increments higher than 100% compared to the IMD approach. This increase exceeds 50% when considering a ventilation rate higher than five ACH and reaches up to 138% in the case of ten ACH.
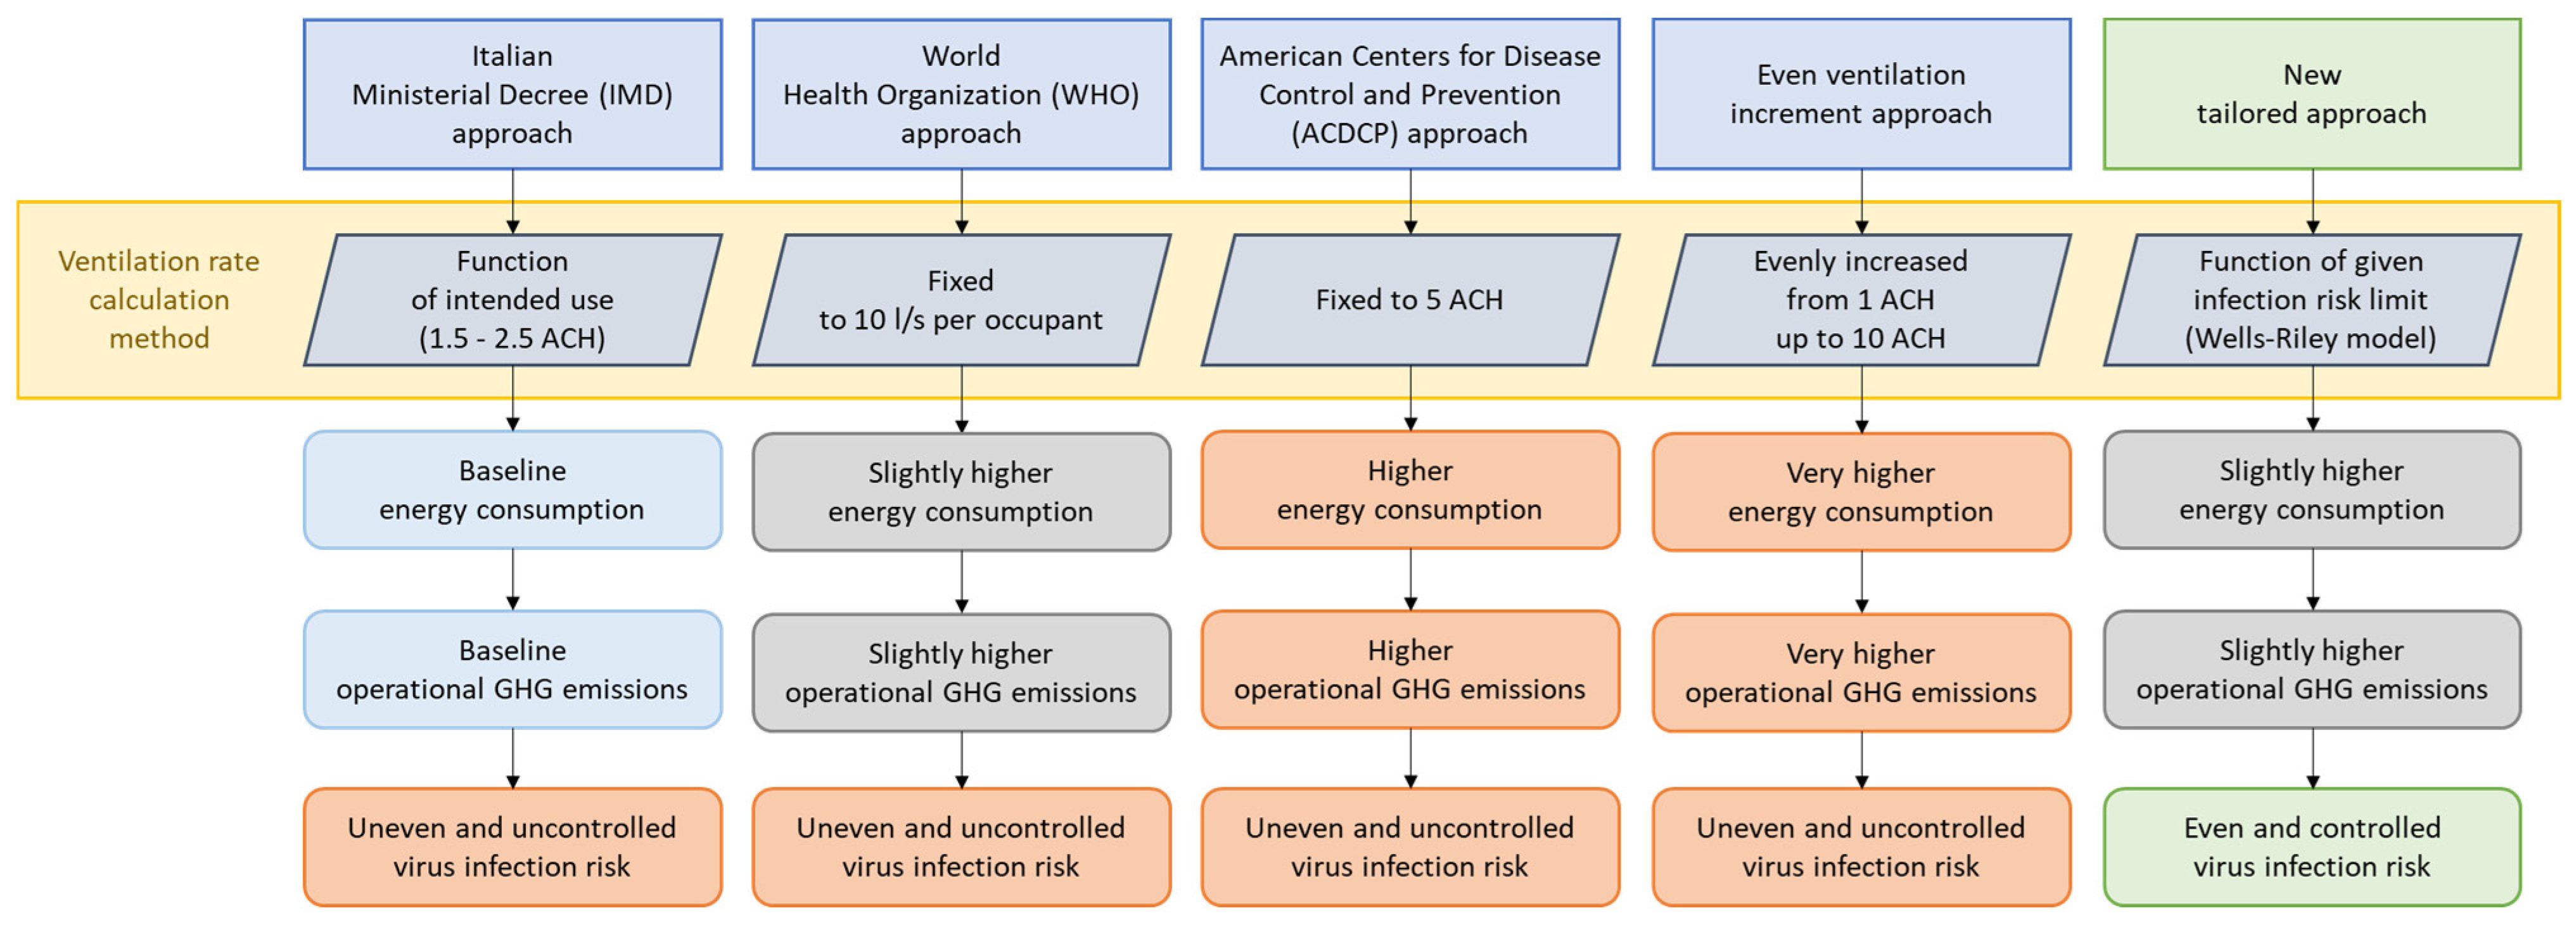
Therefore, the proposed tailored approach results in the substantial improvement of IAQ and reduction in virus infection risk with limited increases in operational energy consumption and related GHG emissions.
Furthermore, due to the small differences in energy consumption between the three risk scenarios, the one entailing the 10% risk can be selected as the optimal one, since it results in minimum risk values compared to IMD and WHO approaches, with much lower maximum risk values and comparable energy consumption and GHG emissions (an 11% increase compared to the IMD approach and a 6% increase compared to the WHO approach).
These findings indicate variability in results across individual rooms when using traditional approaches that may end in uncontrolled and unequal risk values across rooms with different intended uses and dimensions. Indeed, these approaches do not consider boundary conditions like room volume and occupancy level. On the other hand, the levels of infection risk using the proposed tailored approach are uniform across the different rooms and are controlled due to the implementation of the WRM.
Figure 16 depicts a graphic overview of the comparison between the five analysed approaches.

5.7. ZEB Target Attainment

As confirmed by the analysis provided in this study, IAQ optimisation may have a strong impact on the energy consumption of a building. In the parametric approach, gradually increasing ACH increased energy consumption to up to 138%, compared to existing guidelines and regulations. This results in higher operational GHG emissions being limited by using the new proposed tailored method for the ventilation rate design.
In order to reach the ZEB target, a suitable PV system is required for the analysed school building. Table 12 reports the economic analysis of PV systems required for the attainment of the ZEB target for the five analysed ventilation rate approaches.
In the first scenario, i.e., the IMD approach, the PV peak power that has to be installed to match the GHG emissions of the school building (8938 kgCO2-eq per year) with its PV electric energy production, assuming the annual emission balance is equal to 13.6 kWp (34 PV modules of 400 Wp rated power) with overall expenditures of 22,680 EUR. The WHO approach requires a slightly larger system, with a rated peak power of 14.0 kWp to offset 9361 kgCO2-eq per year. The cost does not differ much from the one obtained with the IMD approach. A greater difference is observed with the ACDCP approach that requires a 20.0 kWp PV system, costing 32,700 EUR and compensating for 13,194 kgCO2-eq per year. Maximum expenditures are required in the case of 10 ACH, with a 32.0 kWp PV system that costs 51,400 EUR and compensates for 21,252 kgCO2-eq per year. Lastly, the new tailored approach that considers a 10% risk causes an amount of GHG emissions equal to 9937 kgCO2-eq per year and requires a 15.2 kWp PV system to reach the ZEB target, with an economic expenditure of 25,260 EUR.
Considering these results, the 10% risk tailored approach provides uniform and low values of maximum infection risk, requiring only slightly higher economic expenditures to attain the NZEB target, compared to the IMD and WHO approaches. Also compared to the ten ACH and five ACH (ACDCP) ventilation rate approaches, the tailored approach performs better from a financial point of view with −51% and −23% costs for the offset of GHG emissions, respectively.
Lastly, it must be said that avoiding GHG emissions should always be considered better than offsetting them. For this reason, using a tailored approach to evaluate ventilation rates of the building’s HVAC plant system for IAQ optimisation and infection risk reduction can be considered a more sustainable choice.

5.8. Application, Challenges, and Costs

The innovative tailored proposed approach can be applied for determining the most suitable ventilation strategy to be utilised in the design of HVAC systems during all the stages of project development. In this way, the optimal values of outdoor ACH in the different school building rooms can be obtained to reduce the risk of infection with limited increases in energy consumption and greenhouse gas emissions.
It is also true that this method is based on complete and ideal air mixing and does not consider the actual configuration of spaces and air supply and extraction devices. Therefore, in the final phase of the project, CFD simulations could be used to verify the most convenient position of air inlets and outlets. Despite the presence of this drawback, the main advantage of the proposed method is the possibility of attaining an accurate estimate of ventilation rates, based on few input variables. One of the main challenges of the proposed method is the determination of the acceptable risk level to be used in order to calculate the minimum ventilation rate. Since a risk level equal to zero is not achievable, this should be evaluated on a case-by-case basis.
Costs related to the application of this methodology are referred to the development of a tool that allows practitioners to perform the calculations. However, the proposed method is much cheaper than a CFD simulation, that, instead, requires considerable user expertise and higher costs.
Compared to the other approaches analysed in this paper for ventilation rate estimation (IMD, WHO, ACDCP), in Figure 14, it can be seen that the user achieves higher cost/benefit ratios when using the tailored proposed approach due to comparable or lower energy expenses but much lower infection risk values. Furthermore, costs related to air handling units and air distribution systems are lower with respect to the ACDCP approach (due to lower outdoor ACH values), while they are comparable to IMD and WHO approaches (due to similar outdoor ACH).
Potential barriers related to the application of the proposed approach are only related to:
-
The increase in the outdoor ACH (and therefore the increase in the size of the air handling units and air distribution systems) and related energy consumption, but this barrier is common to all the approaches that rely on the increasing of outdoor ACH in the post-COVID-19 era;
-
The development and implementation of a specific commercial software for practitioners.

6. Conclusions

This paper aims to introduce a new tailored approach for determining the most suitable ventilation strategy to be utilised in the design of HVAC systems during all the stages of project development. The focus is on optimising IAQ in several school building spaces by considering tailored outdoor air volumetric flow rates for each room. The key innovation lies in proposing a ventilation strategy that calculates external air changes per hour (ACH) starting from a fixed maximum value of virus infection risk for occupants based on Wells–Riley model.
The new tailored approach was tested on the 20%, 15%, and 10% risk thresholds, and its performance is compared to four different traditional approaches for determining ventilation rates in a school building. The Wells–Riley method and dynamic energy simulation are employed to evaluate the impact of different outdoor airflow rates on the risk of virus transmission to occupants, as well as on building energy consumption and GHG emissions. The analysed traditional approaches include the regulatory framework outlined in Italian Ministerial Decree (IMD) 18.12.1975, the guidelines established by the World Health Organization (WHO), the recommendations provided by the American Centers for Disease Control and Prevention (ACDCP), and a parametric approach that explores the effects of uniformly increasing outdoor airflow rates on both the risk of infection and the energy consumption of the building.
The maximum risk levels of the IMD and WHO ventilation approaches are high, while they decrease significantly if a higher outdoor ACH is considered. However, ventilation approaches considering higher ACH values for all rooms (ACDCP approach and the other scenarios entailing gradually increased ventilation rates) show an increasing trend in energy consumption that reaches the maximum percentage difference (+138%) in the case of 10 ACH. On the other hand, using the new tailored approach with a fixed 10% risk in each room, the maximum infection risk is decreased by 86% compared to the IMD approach, with an increase of only 11% in the building’s electric energy consumption. Therefore, this can be defined as the optimal approach, since it provides smaller risk values compared to the traditional IMD and WHO approaches, with much lower maximum risk values and slightly higher energy consumption and GHG emissions.
Furthermore, the results show that traditional methods may lead to inconsistent risk values across individual rooms, resulting in uncontrolled and unequal risk levels between rooms of varying sizes and uses. These methods often overlook factors like room volumes and occupancy levels. In contrast, the new tailored approach proposed in this study maintains consistent and low levels of infection risk in all rooms by considering factors such as room dimensions and occupancy levels and implementing the Wells–Riley method to control and equalize the risk levels.
Finally, the achievement of zero emission building (ZEB) target in each ventilation scenario is verified through the integration of a suitable photovoltaic (PV) system, and the financial impact of this PV system is analysed. The results show that, in sizing the PV system to reach the ZEB target, the tailored approach with a 10% risk threshold requires similar economic investments as the IMD and WHO traditional approaches (but with much lower risk of infection). Additionally, compared to the ten ACH and five ACH (Centers for Disease Control and Prevention) ventilation rate strategies, the tailored approach proves to be more cost-effective, with cost savings of 51% and 23%, respectively, for offsetting GHG emissions.

7. Main Limitations of the Study and Future Developments

The main limitations of the proposed study are reported here.
-
The Wells–Riley model assumes steady-state conditions and the perfect mixing of air. This means that it assumes the distribution of pathogen-laden aerosols is spatially and temporally uniform, i.e., ideal conditions. Therefore, although several studies have demonstrated the suitability of this method for evaluating the effectiveness of outdoor air changes in reducing the risk of contagion, the airborne infection risk could be under- or overestimated using these ideal conditions.
-
Moreover, there are several COVID-19 strains as well as other various airborne respiratory infections. Based on this, the proposed study (to evaluate the optimal outdoor airflow rate in each room using only the infection risk-based ventilation airflow calculations) could be extended to also consider these factors.
Moreover, further investigations will be needed concerning the application of the Wells–Riley model across different environmental conditions; finally, an optimal value of different external air changes for each room for different values of q (emission of infectious doses by an asymptomatic subject) could be analysed.

Author Contributions

Conceptualization, D.D., F.M. (Federico Minelli), F.M. (Francesco Minichiello) and M.D.M.; Methodology, D.D., F.M. (Federico Minelli), F.M. (Francesco Minichiello) and M.D.M.; Software, D.D., F.M. (Federico Minelli), F.M. (Francesco Minichiello) and M.D.M.; Validation, D.D., F.M. (Federico Minelli), F.M. (Francesco Minichiello) and M.D.M.; Writing—original draft, D.D., F.M. (Federico Minelli), F.M. (Francesco Minichiello) and M.D.M. All authors have read and agreed to the published version of the manuscript.

Funding

This research received the support of the projects: “Sustainable Energy Systems for High Efficiency Buildings”, CUP E65F21003190003; “PRIN 2020: OPTIMISM—Optimal refurbishment design and management of small energy micro-grids”, funded by the Italian Ministry of University and Research (MUR)—CUP E69J2200110000; “Programma Operativo Nazionale Ricerca e Innovazione 2014–2020—Azione IV.5 Dottorati su tematiche Green”.

Data Availability Statement

The raw data supporting the conclusions of this article will be made available by the authors on request.

Acknowledgments

The authors gratefully acknowledge the support of the projects: “Sustainable Energy Systems for High Efficiency Buildings”, CUP E65F21003190003; “PRIN 2020: OPTIMISM—Optimal refurbishment design and management of small energy micro-grids”, funded by the Italian Ministry of University and Research (MUR)—CUP E69J2200110000; “Programma Operativo Nazionale Ricerca e Innovazione 2014–2020—Azione IV.5 Dottorati su tematiche Green”.

Conflicts of Interest

The authors declare no conflict of interest.

References

  1. Pejović, B.; Karadžić, V.; Dragašević, Z.; Backović, T. Economic Growth, Energy Consumption and CO2 Emissions in the Countries of the European Union and the Western Balkans. Energy Rep. 2021, 7, 2775–2783. [Google Scholar] [CrossRef]
  2. Lin, Y.; Zhong, S.; Yang, W.; Hao, X.; Li, C.Q. Towards Zero-Energy Buildings in China: A Systematic Literature Review. J. Clean. Prod. 2020, 276, 123297. [Google Scholar] [CrossRef]
  3. Chalgynbayeva, A.; Gabnai, Z.; Lengyel, P.; Pestisha, A.; Bai, A. Worldwide Research Trends in Agrivoltaic Systems—A Bibliometric Review. Energies 2023, 16, 611. [Google Scholar] [CrossRef]
  4. Shaikh, S.; Katyara, S.; Majeed, A.; Khand, Z.H.; Staszewski, L.; Shah, M.; Shaikh, M.F.; Bhan, V.; Memon, Q.; Majeed, U.; et al. Holistic and Scientific Perspectives of Energy Sector in Pakistan: Progression, Challenges and Opportunities. IEEE Access 2020, 8, 227232–227246. [Google Scholar] [CrossRef]
  5. European Commission. The European Green Deal; European Commission: Brussels, Belgium, 2019. [Google Scholar]
  6. Buckley, N.; Mills, G.; Reinhart, C.; Berzolla, Z.M. Using Urban Building Energy Modelling (UBEM) to Support the New European Union’s Green Deal: Case Study of Dublin Ireland. Energy Build. 2021, 247, 111115. [Google Scholar] [CrossRef]
  7. Reddy, V.J.; Hariram, N.P.; Maity, R.; Ghazali, M.F. Sustainable Vehicles for Decarbonizing the Transport Sector: A Comparison of Biofuel, Electric, Fuel Cell and Solar-Powered Vehicles. World Electr. Veh. J. 2024, 15, 93. [Google Scholar] [CrossRef]
  8. Belussi, L.; Barozzi, B.; Bellazzi, A.; Danza, L.; Devitofrancesco, A.; Fanciulli, C.; Ghellere, M.; Guazzi, G.; Meroni, I.; Salamone, F.; et al. A Review of Performance of Zero Energy Buildings and Energy Efficiency Solutions. J. Build. Eng. 2019, 25, 100772. [Google Scholar] [CrossRef]
  9. Charani Shandiz, S.; Rismanchi, B.; Foliente, G. Energy Master Planning for Net-Zero Emission Communities: State of the Art and Research Challenges. Renew. Sustain. Energy Rev. 2021, 137, 110600. [Google Scholar] [CrossRef]
  10. Izadi, M.; Taghavi, S.F.; Neshat Safavi, S.H.; Afsharpanah, F.; Yaïci, W. Thermal Management of Shelter Building Walls by PCM Macro-Encapsulation in Commercial Hollow Bricks. Case Stud. Therm. Eng. 2023, 47, 103081. [Google Scholar] [CrossRef]
  11. Østergaard, P.A.; Duic, N.; Noorollahi, Y.; Mikulcic, H.; Kalogirou, S. Sustainable Development Using Renewable Energy Technology. Renew. Energy 2020, 146, 2430–2437. [Google Scholar] [CrossRef]
  12. Agostinelli, S.; Neshat, M.; Majidi Nezhad, M.; Piras, G.; Astiaso Garcia, D. Integrating Renewable Energy Sources in Italian Port Areas towards Renewable Energy Communities. Sustainability 2022, 14, 13720. [Google Scholar] [CrossRef]
  13. Mohammed, B.U.; Wiysahnyuy, Y.S.; Ashraf, N.; Mempouo, B.; Mengata, G.M. Pathways for Efficient Transition into Net Zero Energy Buildings (NZEB) in Sub-Sahara Africa. Case Study: Cameroon, Senegal, and Côte d’Ivoire. Energy Build. 2023, 296, 113422. [Google Scholar] [CrossRef]
  14. Østergaard, P.A.; Duic, N.; Noorollahi, Y.; Kalogirou, S.A. Recent Advances in Renewable Energy Technology for the Energy Transition. Renew. Energy 2021, 179, 877–884. [Google Scholar] [CrossRef]
  15. Minelli, F.; Ciriello, I.; Minichiello, F.; D’Agostino, D. From Net Zero Energy Buildings to an Energy Sharing Model—The Role of NZEBs in Renewable Energy Communities. Renew. Energy 2024, 223, 120110. [Google Scholar] [CrossRef]
  16. Carpino, C.; Austin, M.C.; Mora, D.; Arcuri, N. Retrofit Measures for Achieving NZE Single-Family Houses in a Tropical Climate via Multi-Objective Optimization. Buildings 2024, 14, 566. [Google Scholar] [CrossRef]
  17. Maduta, C.; Melica, G.; D’Agostino, D.; Bertoldi, P. Towards a Decarbonised Building Stock by 2050: The Meaning and the Role of Zero Emission Buildings (ZEBs) in Europe. Energy Strategy Rev. 2022, 44, 101009. [Google Scholar] [CrossRef]
  18. Østergaard, P.A.; Duic, N.; Noorollahi, Y.; Kalogirou, S. Renewable Energy for Sustainable Development. Renew. Energy 2022, 199, 1145–1152. [Google Scholar] [CrossRef]
  19. Skandalos, N.; Wang, M.; Kapsalis, V.; D’Agostino, D.; Parker, D.; Bhuvad, S.S.; Udayraj; Peng, J.; Karamanis, D. Building PV Integration According to Regional Climate Conditions: BIPV Regional Adaptability Extending Köppen-Geiger Climate Classification against Urban and Climate-Related Temperature Increases. Renew. Sustain. Energy Rev. 2022, 169, 112950. [Google Scholar] [CrossRef]
  20. Coban, H.H. Hydropower Planning in Combination with Batteries and Solar Energy. Sustainability 2023, 15, 10002. [Google Scholar] [CrossRef]
  21. Kırant-Mitić, T.; Voss, K. Energy Flexibility Analysis of a University Building Using Rule Based Control and Model Predictive Control. In Proceedings of the BauSim 2022: 9th Conference of IBPSA-Germany and Austria, Weimar, Germany, 20–22 September 2022; Volume 9. [Google Scholar] [CrossRef]
  22. Coban, H.H.; Lewicki, W. Flexibility in Power Systems of Integrating Variable Renewable Energy Sources. J. Adv. Res. Nat. Appl. Sci. 2023, 9, 190–204. [Google Scholar] [CrossRef]
  23. Khan, S.; Sudhakar, K.; bin Yusof, M.H. Building Integrated Photovoltaics Powered Electric Vehicle Charging with Energy Storage for Residential Building: Design, Simulation, and Assessment. J. Energy Storage 2023, 63, 107050. [Google Scholar] [CrossRef]
  24. Thorvaldsen, K.E.; Korpås, M.; Lindberg, K.B.; Farahmand, H. A Stochastic Operational Planning Model for a Zero Emission Building with Emission Compensation. Appl. Energy 2021, 302, 117415. [Google Scholar] [CrossRef]
  25. Liang, X.; Chen, K.; Chen, S.; Zhu, X.; Jin, X.; Du, Z. IoT-Based Intelligent Energy Management System for Optimal Planning of HVAC Devices in Net-Zero Emissions PV-Battery Building Considering Demand Compliance. Energy Convers. Manag. 2023, 292, 117369. [Google Scholar] [CrossRef]
  26. Coban, H.H. How Is COVID-19 Affecting the Renewable Energy Sector and the Electric Power Grid? Eur. J. Sci. Technol. 2021, 27, 484–494. [Google Scholar] [CrossRef]
  27. D’Agostino, D.; Minelli, F.; Minichiello, F.; Musella, M. Improving the Indoor Air Quality of Office Buildings in the Post-Pandemic Era—Impact on Energy Consumption and Costs. Energies 2024, 17, 855. [Google Scholar] [CrossRef]
  28. Zheng, W.; Hu, J.; Wang, Z.; Li, J.; Fu, Z.; Li, H.; Jurasz, J.; Chou, S.K.; Yan, J. COVID-19 Impact on Operation and Energy Consumption of Heating, Ventilation and Air-Conditioning (HVAC) Systems. Adv. Appl. Energy 2021, 3, 100040. [Google Scholar] [CrossRef]
  29. Acosta, I.; Campano, M.Á.; Bellia, L.; Fragliasso, F.; Diglio, F.; Bustamante, P. Impact of Daylighting on Visual Comfort and on the Biological Clock for Teleworkers in Residential Buildings. Buildings 2023, 13, 2562. [Google Scholar] [CrossRef]
  30. Pirouz, B.; Palermo, S.A.; Naghib, S.N.; Mazzeo, D.; Turco, M.; Piro, P. The Role of HVAC Design and Windows on the Indoor Airflow Pattern and ACH. Sustainability 2021, 13, 7931. [Google Scholar] [CrossRef]
  31. Pérez-Urrestarazu, L.; Kaltsidi, M.P.; Nektarios, P.A.; Markakis, G.; Loges, V.; Perini, K.; Fernández-Cañero, R. Particularities of Having Plants at Home during the Confinement Due to the COVID-19 Pandemic. Urban For. Urban Green. 2021, 59, 126919. [Google Scholar] [CrossRef]
  32. Moghadam, T.T.; Ochoa Morales, C.E.; Lopez Zambrano, M.J.; Bruton, K.; O’Sullivan, D.T.J. Energy Efficient Ventilation and Indoor Air Quality in the Context of COVID-19—A Systematic Review. Renew. Sustain. Energy Rev. 2023, 182, 113356. [Google Scholar] [CrossRef]
  33. Bellia, L.; Błaszczak, U.; Diglio, F.; Fragliasso, F. Light-Environment Interactions and Integrative Lighting Design: Connecting Visual, Non-Visual and Energy Requirements in a Case Study Experiment. Build. Environ. 2024, 253, 111323. [Google Scholar] [CrossRef]
  34. Liu, P.; Justo Alonso, M.; Mathisen, H.M. Global Sensitivity Analysis and Optimal Design of Heat Recovery Ventilation for Zero Emission Buildings. Appl. Energy 2023, 329, 120237. [Google Scholar] [CrossRef]
  35. Stamatellou, A.M.; Zogou, O.; Stamatelos, A. Energy Cost Assessment and Optimization of Post-COVID-19 Building Ventilation Strategies. Sustainability 2023, 15, 3422. [Google Scholar] [CrossRef]
  36. Faulkner, C.A.; Castellini, J.E.; Lou, Y.; Zuo, W.; Lorenzetti, D.M.; Sohn, M.D. Tradeoffs among Indoor Air Quality, Financial Costs, and CO2 Emissions for HVAC Operation Strategies to Mitigate Indoor Virus in U.S. Office Buildings. Build. Environ. 2022, 221, 109282. [Google Scholar] [CrossRef] [PubMed]
  37. Lo Verso, V.R.M.; Giuliani, F.; Caffaro, F.; Basile, F.; Peron, F.; Dalla Mora, T.; Bellia, L.; Fragliasso, F.; Beccali, M.; Bonomolo, M.; et al. Questionnaires and Simulations to Assess Daylighting in Italian University Classrooms for IEQ and Energy Issues. Energy Build. 2021, 252, 111433. [Google Scholar] [CrossRef]
  38. Monge-Barrio, A.; Bes-Rastrollo, M.; Dorregaray-Oyaregui, S.; González-Martínez, P.; Martin-Calvo, N.; López-Hernández, D.; Arriazu-Ramos, A.; Sánchez-Ostiz, A. Encouraging Natural Ventilation to Improve Indoor Environmental Conditions at Schools. Case Studies in the North of Spain before and during COVID. Energy Build. 2022, 254, 111567. [Google Scholar] [CrossRef]
  39. Miao, S.; Gangolells, M.; Tejedor, B. A Comprehensive Assessment of Indoor Air Quality and Thermal Comfort in Educational Buildings in the Mediterranean Climate. Indoor Air 2023, 2023, 6649829. [Google Scholar] [CrossRef]
  40. Gaspar, K.; Gangolells, M.; Casals, M.; Pujadas, P.; Forcada, N.; Macarulla, M.; Tejedor, B. Assessing the Impact of the COVID-19 Lockdown on the Energy Consumption of University Buildings. Energy Build. 2022, 257, 111783. [Google Scholar] [CrossRef] [PubMed]
  41. Batterman, S. Review and Extension of CO2-Based Methods to Determine Ventilation Rates with Application to School Classrooms. Int. J. Environ. Res. Public Health 2017, 14, 145. [Google Scholar] [CrossRef]
  42. Arpino, F.; Cortellessa, G.; D’Alicandro, A.C.; Grossi, G.; Massarotti, N.; Mauro, A. CFD Analysis of the Air Supply Rate Influence on the Aerosol Dispersion in a University Lecture Room Air Change per Hour. Build. Environ. 2023, 235, 110257. [Google Scholar] [CrossRef]
  43. D’Alicandro, A.C.; Mauro, A. Experimental and Numerical Analysis of CO2 Transport inside a University Classroom: Effects of Turbulent Models. J. Build. Perform. Simul. 2023, 16, 434–459. [Google Scholar] [CrossRef]
  44. Kurnitski, J.; Kiil, M.; Mikola, A.; Võsa, K.V.; Aganovic, A.; Schild, P.; Seppänen, O. Post-COVID Ventilation Design: Infection Risk-Based Target Ventilation Rates and Point Source Ventilation Effectiveness. Energy Build. 2023, 296, 113386. [Google Scholar] [CrossRef]
  45. EN 16798-1:2019; Energy Performance of Buildings—Ventilation of Buildings—Part 1: Indoor Environmental Input Parameters for Design and Assessment of Energy Performance of Buildings Addressing Indoor Air Quality, Thermal Environment, Lighting and Acou. European Committee for Standardization (CEN): Brussels, Belgium, 2019.
  46. ISO 17772-1:2017; Energy Performance of Buildings—Indoor Environmental Quality—Part 1: Indoor Environmental Input Parameters for the Design and Assessment of Energy Performance of Buildings. International Organization for Standardization (ISO): Geneva, Switzerland, 2017.
  47. The Minister for Public Works in concert with the Minister for Public Education Decreto Ministeriale 18 Dicembre 1975, n.29—Norme Tecniche Aggiornate Relative All’edilizia Scolastica, Ivi Compresi Gli Indici Di Funzionalità Didattica, Edilizia Ed Urbanistica, Da Osservarsi Nella Esecuzione Di Opere Di Edilizia Scolastica (in Italia; Gazzetta Ufficiale della Repubblica Italiana 2 febbraio 1976 n. 29. 1975. Available online: https://www.indicenormativa.it/norma/urn%3Anir%3Aministero.lavori.pubblici%3Adecreto%3A1975-12-18#:~:text=Norme%20tecniche%20aggiornate%20relative%20all,di%20opere%20di%20edilizia%20scolastica (accessed on 27 May 2023).
  48. Centers for Disease Control and Prevention Improving Ventilation in Buildings. Available online: https://www.cdc.gov/coronavirus/2019-ncov/prevent-getting-sick/improving-ventilation-in-buildings.html (accessed on 22 November 2023).
  49. DesignBuilder. DesignBuilder Software, v 6 2019, imited Clarendon Court 1st Floor 54/56 London Rd Stroud, Gloucestershire GL5 2AD (UK). 2019. Available online: http://www.designbuilder.co.uk/i (accessed on 10 May 2024).
  50. EnergyPlus Testing with Building Thermal Envelope and Fabric Load Tests from ANSI/ASHRAE Standard 140-2007; EnergyPlus Version 6.0.0.023; U.S. Department of Energy: Washington, DC, USA, 2010.
  51. Shaikh, S.A.; Shaikh, A.M.; Shaikh, M.F.; Jiskani, S.A.; Memon, Q.A.; Ahmed, I. Technical and Economical Evaluation of Solar PV System for Domestic Load in Pakistan: An Overlook Contributor to High Tariff and Load Shedding. Sir Syed Univ. Res. J. Eng. Technol. 2022, 12, 23–30. [Google Scholar] [CrossRef]
  52. Istituto Superiore di Sanità—Gruppo di Lavoro ISS Ambiente e Qualità dell’Aria Indoor Indicazioni Ad Interim per La Prevenzione e Gestione Degli Ambienti Indoor in Relazione Alla Trasmissione Dell’infezione Da Virus SARS-CoV-2; 2021; Volume ii. Available online: https://www.iss.it/rapporti-covid-19/-/asset_publisher/btw1J82wtYzH/content/rapporto-iss-covid-19-n.-11-2021-indicazioni-ad-interim-per-la-prevenzione-e-gestione-degli-ambienti-indoor-in-relazione-alla-trasmissione-dell-infezione-da-virus-sars-cov-2.-aggiornamento-del-rapporto-iss-covid-19-n.-5-2020-rev.-2.-versione-del-18-aprile (accessed on 27 May 2024). (In Italian).
  53. Mikszewski, A.; Stabile, L.; Buonanno, G.; Morawska, L. The Airborne Contagiousness of Respiratory Viruses: A Comparative Analysis and Implications for Mitigation. Geosci. Front. 2022, 13, 101285. [Google Scholar] [CrossRef] [PubMed]
  54. Judson, S.D.; Munster, V.J. Nosocomial Transmission of Emerging Viruses via Aerosol-Generating Medical Procedures. Viruses 2019, 11, 940. [Google Scholar] [CrossRef] [PubMed]
  55. Li, Y.; Huang, X.; Yu, I.T.S.; Wong, T.W.; Qian, H. Role of Air Distribution in SARS Transmission during the Largest Nosocomial Outbreak in Hong Kong. Indoor Air 2004, 15, 83–95. [Google Scholar] [CrossRef] [PubMed]
  56. Megahed, N.A.; Ghoneim, E.M. Indoor Air Quality: Rethinking Rules of Building Design Strategies in Post-Pandemic Architecture. Environ. Res. 2021, 193, 110471. [Google Scholar] [CrossRef] [PubMed]
  57. Sodiq, A.; Khan, M.A.; Naas, M.; Amhamed, A. Addressing COVID-19 Contagion through the HVAC Systems by Reviewing Indoor Airborne Nature of Infectious Microbes: Will an Innovative Air Recirculation Concept Provide a Practical Solution? Environ. Res. 2021, 199, 111329. [Google Scholar] [CrossRef] [PubMed]
  58. Luongo, J.C.; Fennelly, K.P.; Keen, J.A.; Zhai, Z.J.; Jones, B.W.; Miller, S.L. Role of Mechanical Ventilation in the Airborne Transmission of Infectious Agents in Buildings. Indoor Air 2016, 26, 666–678. [Google Scholar] [CrossRef]
  59. Ye, J.; Lin, C.; Liu, J.; Ai, Z.; Zhang, G. Systematic Summary and Analysis of Chinese HVAC Guidelines Coping with COVID-19. Indoor Built Environ. 2022, 31, 1176–1192. [Google Scholar] [CrossRef]
  60. Bonadonna, L.; La Rosa, G.; Settimo, G.; Sorrentino, E.; Veschetti, E.; Bertinato, L. Rapporto ISS COVID-19 n.33/2020: Indicazioni Sugli Impianti Di Ventilazione/Climatizzazione in Strutture Comunitarie Non Sanitarie e in Ambienti Domestici in Relazione Alla Diffusione Del Virus SARS-CoV-2. 2020. Available online: https://www.iss.it/rapporti-covid-19/-/asset_publisher/btw1J82wtYzH/content/rapporto-iss-covid-19-n.-33-2020-indicazioni-sugli-impianti-di-ventilazione-climatizzazione-in-strutture-comunitarie-non-sanitarie-e-in-ambienti-domestici-in-relazione-alla-diffusione-del-virus-sars-cov-2.-versione-del-25-maggio-2020 (accessed on 27 May 2024). (In Italian).
  61. REHVA COVID-19 Guidance Document. How to Operate and Use Building Services in Order to Prevent the Spread of the Coronavirus Disease (COVID-19) Virus (SARS-CoV-2) in Workplaces; REHVA: Brussels, Belgium, 2020. [Google Scholar]
  62. Shamim, J.A.; Hsu, W.; Daiguji, H. Review of Component Designs for Post-COVID-19 HVAC Systems: Possibilities and Challenges. Heliyon 2022, 8, e09001. [Google Scholar] [CrossRef] [PubMed]
  63. Pan, Y.; Du, C.; Fu, Z.; Fu, M. Re-Thinking of Engineering Operation Solutions to HVAC Systems under the Emerging COVID-19 Pandemic. J. Build. Eng. 2021, 43, 102889. [Google Scholar] [CrossRef]
  64. D’Alicandro, A.C.; Massarotti, N.; Mauro, A. Aerosol Hazards in Operating Rooms: A Review of Numerical and Experimental Studies. J. Aerosol Sci. 2021, 158, 105823. [Google Scholar] [CrossRef]
  65. D’Alicandro, A.C.; Mauro, A. Effects of Operating Room Layout and Ventilation System on Ultrafine Particle Transport and Deposition. Atmos. Environ. 2022, 270, 118901. [Google Scholar] [CrossRef]
  66. Rodríguez, D.; Urbieta, I.R.; Velasco, Á.; Campano-Laborda, M.Á.; Jiménez, E. Assessment of Indoor Air Quality and Risk of COVID-19 Infection in Spanish Secondary School and University Classrooms. Build. Environ. 2022, 226, 109717. [Google Scholar] [CrossRef] [PubMed]
  67. Faulkner, C.A.; Castellini, J.E.; Zuo, W.; Sohn, M.D. Comprehensive Analysis of Model Parameter Uncertainty Influence on Evaluation of HVAC Operation to Mitigate Indoor Virus: A Case Study for an Office Building in a Cold and Dry Climate. Build. Environ. 2023, 238, 110314. [Google Scholar] [CrossRef]
  68. Elsaid, A.M.; Mohamed, H.A.; Abdelaziz, G.B.; Ahmed, M.S. A Critical Review of Heating, Ventilation, and Air Conditioning (HVAC) Systems within the Context of a Global SARS-CoV-2 Epidemic. Process Saf. Environ. Prot. 2021, 155, 230–261. [Google Scholar] [CrossRef] [PubMed]
  69. Yu, I.T.S.; Li, Y.; Wong, T.W.; Tam, W.; Chan, A.T.; Lee, J.H.W.; Leung, D.Y.C.; Ho, T. Evidence of Airborne Transmission of the Severe Acute Respiratory Syndrome Virus. N. Engl. J. Med. 2004, 350, 1731–1739. [Google Scholar] [CrossRef] [PubMed]
  70. Ferrara, M.; Peretti, C.; Fabrizio, E.; Corgnati, S.P. On the Multi-Domain Impacts of Coupling Mechanical Ventilation to Radiant Systems in Residential Buildings. Energies 2023, 16, 4870. [Google Scholar] [CrossRef]
  71. Quijada, M.C.; Solano, T.; Austin, M.C. Optimal Hybrid Ventilation Strategy to Assure Adequate Indoor Thermal Comfort and Air Quality in Educational Spaces under a Tropical Climate. J. Phys. Conf. Ser. 2022, 2385, 012095. [Google Scholar] [CrossRef]
  72. Sun, C.; Chen, J.; Hong, S.; Zhang, Y.; Kan, H.; Zhao, Z.; Deng, F.; Zeng, X.; Sun, Y.; Qian, H.; et al. Indoor Air Quality and Its Health Effects in Offices and School Buildings in the Yangtze River Delta. Air Qual. Atmos. Health 2023, 16, 1571–1586. [Google Scholar] [CrossRef]
  73. Knibbs, L.D.; Morawska, L.; Bell, S.C.; Grzybowski, P. Room Ventilation and the Risk of Airborne Infection Transmission in 3 Health Care Settings within a Large Teaching Hospital. Am. J. Infect. Control 2011, 39, 866–872. [Google Scholar] [CrossRef] [PubMed]
  74. Cavallini, A.; Busato, F.; Pregliasco, F. Remarks on the Air Recirculation in HVAC Systems during the SARS-CoV-2 Outbreak: The Case of All-Air Ducted Plants. AiCARR J. 2020, 63, 50–55. [Google Scholar]
  75. Ding, E.; Zhang, D.; Bluyssen, P.M. Ventilation Regimes of School Classrooms against Airborne Transmission of Infectious Respiratory Droplets: A Review. Build. Environ. 2022, 207, 108484. [Google Scholar] [CrossRef]
  76. Franceschini, P.B.; Neves, L.O. A Critical Review on Occupant Behaviour Modelling for Building Performance Simulation of Naturally Ventilated School Buildings and Potential Changes Due to the COVID-19 Pandemic. Energy Build. 2022, 258, 111831. [Google Scholar] [CrossRef]
  77. Buonanno, G.; Morawska, L.; Stabile, L. Quantitative Assessment of the Risk of Airborne Transmission of SARS-CoV-2 Infection: Prospective and Retrospective Applications. Environ. Int. 2020, 145, 106112. [Google Scholar] [CrossRef] [PubMed]
  78. Guo, Y.; Qian, H.; Sun, Z.; Cao, J.; Liu, F.; Luo, X.; Ling, R.; Weschler, L.B.; Mo, J.; Zhang, Y. Assessing and Controlling Infection Risk with Wells-Riley Model and Spatial Flow Impact Factor (SFIF). Sustain. Cities Soc. 2021, 67, 102719. [Google Scholar] [CrossRef] [PubMed]
  79. Elmalky, A.M.; Araji, M.T. Computational Fluid Dynamics Using Finite Volume Method: A Numerical Model for Double Skin Façades with Renewable Energy Source in Cold Climates. J. Build. Eng. 2022, 60, 105231. [Google Scholar] [CrossRef]
  80. Pirouz, B.; Mazzeo, D.; Palermo, S.A.; Naghib, S.N.; Turco, M.; Piro, P. CFD Investigation of Vehicle’s Ventilation Systems and Analysis of ACH in Typical Airplanes, Cars, and Buses. Sustainability 2021, 13, 6799. [Google Scholar] [CrossRef]
  81. Choudhary, B. Udayraj A Coupled CFD-Thermoregulation Model for Air Ventilation Clothing. Energy Build. 2022, 268, 112206. [Google Scholar] [CrossRef]
  82. Boutera, Y.; Boultif, N.; Moummi, N.; Arıcı, M.; SM Saleh, M.; Rouag, A.; Kethiri, M.A.; Beldjani, C. Evaluation of the Earth-Air Heat Exchanger’s Performance in Improving the Indoor Conditions of an Industrial Poultry House Using Computational Fluid Dynamics Verified with Field Tests. J. Clean. Prod. 2024, 434, 140218. [Google Scholar] [CrossRef]
  83. D’Alicandro, A.C.; Capozzoli, A.; Mauro, A. Thermofluid Dynamics and Droplets Transport inside a Large University Classroom: Effects of Occupancy Rate and Volumetric Airflow. J. Aerosol Sci. 2024, 175, 106285. [Google Scholar] [CrossRef]
  84. D’Alicandro, A.C.; Mauro, A. Air Change per Hour and Inlet Area: Effects on Ultrafine Particle Concentration and Thermal Comfort in an Operating Room. J. Aerosol Sci. 2023, 171, 106183. [Google Scholar] [CrossRef]
  85. Szczepanik, N.; Schnotale, J. CFD Simulations and Measurements of Carbon Dioxide Transport in a Passive House. In Proceedings of the ICR, The 24th IIR International Congress of Refrigeration: Improving Quality of Life, Preserving the Earth, Yokohama, Japan, 16–22 August 2015. [Google Scholar]
  86. Gammaitoni, L.; Nucci, M.C. Using a Mathematical Model to Evaluate the Efficacy of TB Control Measures. Emerg. Infect. Dis. 1997, 3, 335–342. [Google Scholar] [CrossRef] [PubMed]
  87. Riley, E.C.; Murphy, G.; Riley, R.L. Airborne Spread of Measles in a Suburban Elementary School. Am. J. Epidemiol. 1978, 107, 421–432. [Google Scholar] [CrossRef] [PubMed]
  88. Li, C.; Tang, H. Study on Ventilation Rates and Assessment of Infection Risks of COVID-19 in an Outpatient Building. J. Build. Eng. 2021, 42, 103090. [Google Scholar] [CrossRef]
  89. Yan, Y.; Li, X.; Fang, X.; Tao, Y.; Tu, J. A Spatiotemporal Assessment of Occupants’ Infection Risks in a Multi-Occupants Space Using Modified Wells–Riley Model. Build. Environ. 2023, 230, 110007. [Google Scholar] [CrossRef] [PubMed]
  90. Zhang, S.; Lin, Z. Dilution-Based Evaluation of Airborne Infection Risk—Thorough Expansion of Wells-Riley Model. Build. Environ. 2021, 194, 107674. [Google Scholar] [CrossRef] [PubMed]
  91. Hu, T.; Ji, Y.; Fei, F.; Zhu, M.; Jin, T.; Xue, P.; Zhang, N. Optimization of COVID-19 Prevention and Control with Low Building Energy Consumption. Build. Environ. 2022, 219, 109233. [Google Scholar] [CrossRef]
  92. Li, B.; Cai, W. A Novel CO2-Based Demand-Controlled Ventilation Strategy to Limit the Spread of COVID-19 in the Indoor Environment. Build. Environ. 2022, 219, 109232. [Google Scholar] [CrossRef]
  93. Aviv, D.; Chen, K.W.; Teitelbaum, E.; Sheppard, D.; Pantelic, J.; Rysanek, A.; Meggers, F. A Fresh (Air) Look at Ventilation for COVID-19: Estimating the Global Energy Savings Potential of Coupling Natural Ventilation with Novel Radiant Cooling Strategies. Appl. Energy 2021, 292, 116848. [Google Scholar] [CrossRef] [PubMed]
  94. Guo, Y.; Zhang, N.; Hu, T.; Wang, Z.; Zhang, Y. Optimization of Energy Efficiency and COVID-19 Pandemic Control in Different Indoor Environments. Energy Build. 2022, 261, 111954. [Google Scholar] [CrossRef] [PubMed]
  95. Szczepanik-Ścisło, N.; Flaga-Maryańczyk, A. Indoor Air Quality Modelling and Measurements of a Studio Apartment with a Mechanical Exhaust System. E3S Web Conf. 2018, 44, 00171. [Google Scholar] [CrossRef]
  96. Szczepanik-Scislo, N. Improving Household Safety via a Dynamic Air Terminal Device in Order to Decrease Carbon Monoxide Migration from a Gas Furnace. Int. J. Environ. Res. Public Health 2022, 19, 1676. [Google Scholar] [CrossRef] [PubMed]
  97. Mantesi, E.; Chmutina, K.; Goodier, C. The Office of the Future: Operational Energy Consumption in the Post-Pandemic Era. Energy Res. Soc. Sci. 2022, 87, 102472. [Google Scholar] [CrossRef] [PubMed]
  98. Chalgynbayeva, A.; Bai, A. The Most Relevant Factors and Trends in Energy Cooperation between Kazakhstan and China, Focused on Renewable Energy Sources (RES). Appl. Stud. Agribus. Commer. 2022, 15, 65–76. [Google Scholar] [CrossRef]
  99. Akbari, V.; Naghashzadegan, M.; Kouhikamali, R.; Afsharpanah, F.; Yaïci, W. Multi-Objective Optimization of a Small Horizontal-Axis Wind Turbine Blade for Generating the Maximum Startup Torque at Low Wind Speeds. Machines 2022, 10, 785. [Google Scholar] [CrossRef]
  100. Chalgynbayeva, A.; Mizik, T.; Bai, A. Cost–Benefit Analysis of Kaposvár Solar Photovoltaic Park Considering Agrivoltaic Systems. Clean Technol. 2022, 4, 1054–1070. [Google Scholar] [CrossRef]
  101. Afsharpanah, F.; Sheshpoli, A.Z.; Pakzad, K.; Ajarostaghi, S.S.M. Numerical Investigation of Non-Uniform Heat Transfer Enhancement in Parabolic Trough Solar Collectors Using Dual Modified Twisted-Tape Inserts. J. Therm. Eng. 2021, 7, 133–147. [Google Scholar] [CrossRef]
  102. Bhattacharya, S.; Goswami, A.; Sadhu, P.K. Design, Development and Performance Analysis of FSPV System for Powering Sustainable Energy Based Mini Micro-Grid. Microsyst. Technol. 2023, 29, 1465–1478. [Google Scholar] [CrossRef]
  103. Maity, R.; Sudhakar, K.; Abdul Razak, A.; Karthick, A.; Barbulescu, D. Agrivoltaic: A Strategic Assessment Using SWOT and TOWS Matrix. Energies 2023, 16, 3313. [Google Scholar] [CrossRef]
  104. Elmalky, A.M.; Araji, M.T. Computational Procedure of Solar Irradiation: A New Approach for High Performance Façades with Experimental Validation. Energy Build. 2023, 298, 113491. [Google Scholar] [CrossRef]
  105. Elmalky, A.M.; Araji, M.T. A New Trigonometric Model for Solar Radiation and Shading Factor: Varying Profiles of Building Façades and Urban Eccentricities. Energy Build. 2023, 282, 112803. [Google Scholar] [CrossRef]
  106. Bhattacharya, S.; Sadhu, P.K.; Sarkar, D. Performance Evaluation of Building Integrated Photovoltaic System Arrays (SP, TT, QT, and TCT) to Improve Maximum Power with Low Mismatch Loss under Partial Shading. Microsyst. Technol. 2023, 30, 583–597. [Google Scholar] [CrossRef]
  107. Rai, R.; Jamali, S.; Ahmed, K.; Zaidi, A.A.; Ali, M.; Memon, A.H. Development of a Small Scale Photovoltaic Thermal Hybrid (PV/T) System for Domestic Applications in Pakistan. Clean Energy Technol. J. 2023, 1, 60–70. [Google Scholar] [CrossRef]
  108. EnergyPlus Input Output Reference. The Encyclopedic Reference to EnergyPlus Input and Output; USA, Department of Energy: Washington, DC, USA, 2010; pp. 1996–2016.
  109. Sze To, G.N.; Chao, C.Y.H. Review and Comparison between the Wells-Riley and Dose-Response Approaches to Risk Assessment of Infectious Respiratory Diseases. Indoor Air 2010, 20, 2–16. [Google Scholar] [CrossRef]
  110. Buonanno, G.; Stabile, L.; Morawska, L. Estimation of Airborne Viral Emission: Quanta Emission Rate of SARS-CoV-2 for Infection Risk Assessment. Environ. Int. 2020, 141, 105794. [Google Scholar] [CrossRef]
  111. Maity, R.; Mathew, M.; Hossain, J. Increase in Power Production of Rooftop Solar Photovoltaic System Using Tracking. In Proceedings of the 2018 International Conference on Power Energy, Environment and Intelligent Control, Greater Noida, India, 13–14 April 2018; pp. 415–419. [Google Scholar] [CrossRef]
  112. Psiloglou, B.E.; Kambezidis, H.D.; Kaskaoutis, D.G.; Karagiannis, D.; Polo, J.M. Comparison between MRM Simulations, CAMS and PVGIS Databases with Measured Solar Radiation Components at the Methoni Station, Greece. Renew. Energy 2020, 146, 1372–1391. [Google Scholar] [CrossRef]
  113. Urraca, R.; Huld, T.; Martinez-de-Pison, F.J.; Sanz-Garcia, A. Sources of Uncertainty in Annual Global Horizontal Irradiance Data. Sol. Energy 2018, 170, 873–884. [Google Scholar] [CrossRef]
  114. Chen, D.; Chen, H.W. Using the Köppen Classification to Quantify Climate Variation and Change: An Example for 1901-2010. Environ. Dev. 2013, 6, 69–79. [Google Scholar] [CrossRef]
  115. President of the Italian Republic DPR 26 Agosto 1993 n.412. Regolamento Recante Norme per La Progettazione, l’installazione, l’esercizio e La Manutenzione Degli Impianti Termici Degli Edifici Ai Fini Del Contenimento Dei Consumi Di Energia; Gazzetta Ufficiale della Repubblica Italiana. 1993. Available online: https://www.bosettiegatti.eu/info/norme/statali/1993_0412.htm (accessed on 27 May 2024). (In Italian).
  116. Italian Ministry of Economic Development—Applicazione Delle Metodologie Di Calcolo Delle Prestazioni Energetiche e Definizione Delle Prescrizioni e Dei Requisiti Minimi Degli Edifici; Gazzetta Ufficiale della Repubblica Italiana. 2015. Available online: https://www.mimit.gov.it/index.php/it/normativa/decreti-interministeriali/decreto-interministeriale-26-giugno-2015-applicazione-delle-metodologie-di-calcolo-delle-prestazioni-energetiche-e-definizione-delle-prescrizioni-e-dei-requisiti-minimi-degli-edifici (accessed on 27 May 2024). (In Italian)
  117. Vio, M. Gli Impianti Di Climatizzazione e Il Rischio Di Contagio. AiCARR J. 2020, 34–40. (In Italian) [Google Scholar]
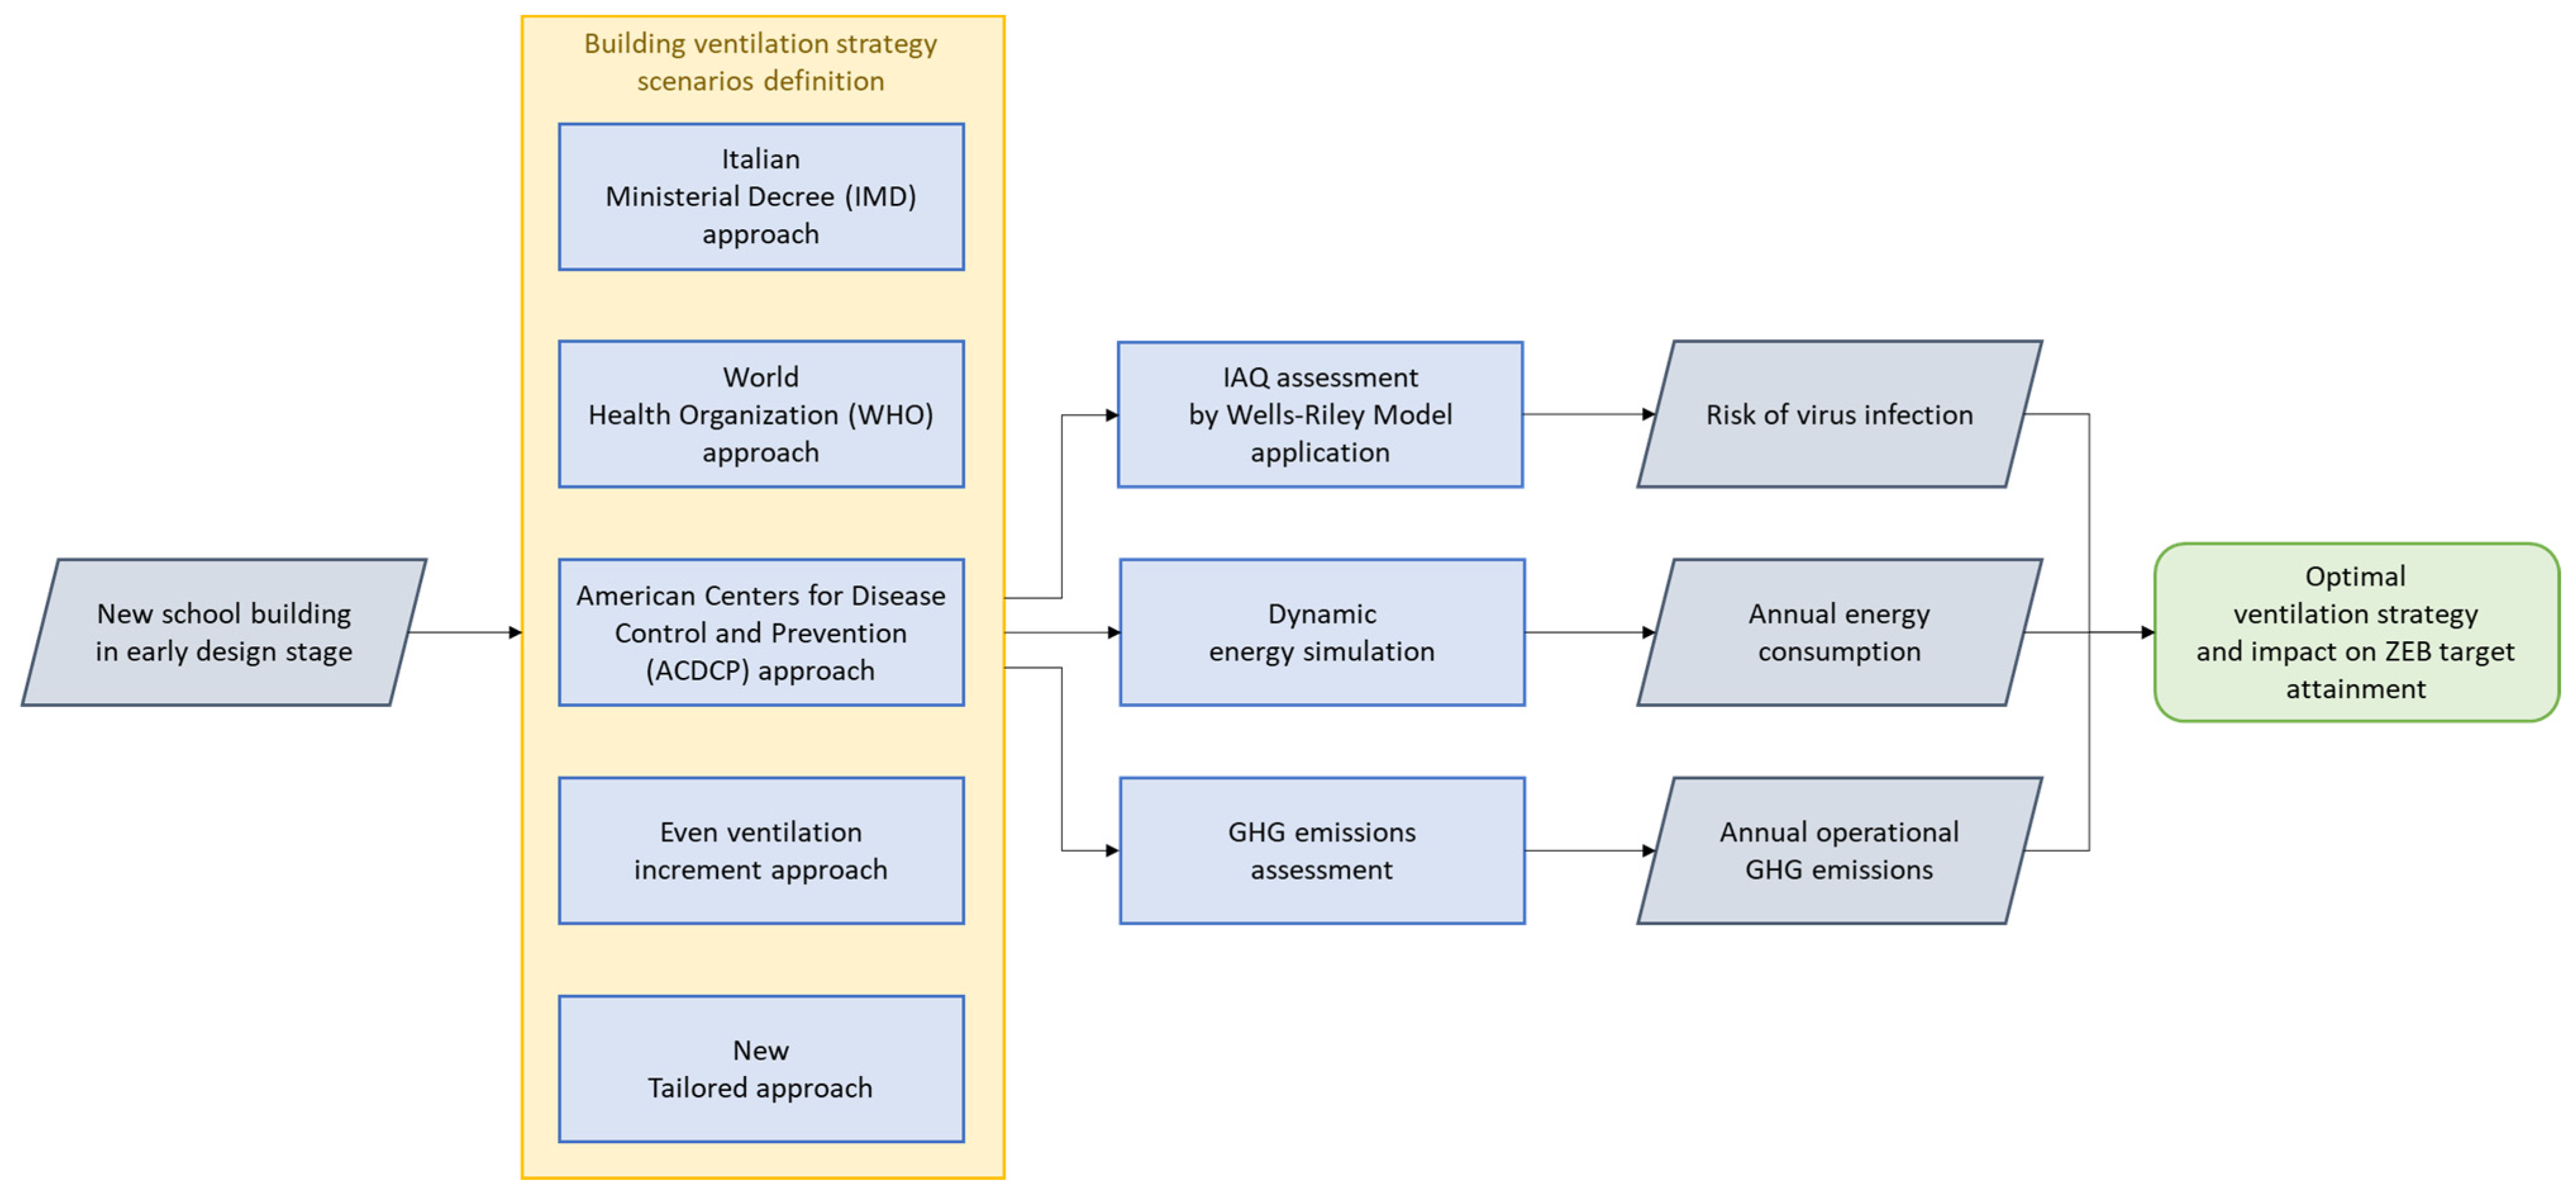
Figure 1. Workflow of the research methodology.
Energies 17 02769 g001
Figure 2. Plans of the school building: ground and first floors.
Energies 17 02769 g002
Figure 3. Energy model of the case study school building.
Energies 17 02769 g003
Figure 4. Characteristic curves of the building rooms describing the relationship between outdoor ACH and risk of virus infection, obtained using the Wells–Riley model.
Energies 17 02769 g004
Figure 5. Risk of virus infection as a function of ACH in building rooms, according to the requirements of the Italian Ministerial Decree 18.12.1975.
Energies 17 02769 g005
Figure 6. Annual electric energy consumption using the values of outdoor ACH based on the Italian Ministerial Decree 18.12.1975. Note: In this figure and in the following figures related to energy consumption, the energy for heating also includes that for mechanical ventilation. This is also valid for the text of the article.
Energies 17 02769 g006
Figure 7. Risk of virus infection as a function of ACH in building rooms, utilising the WHO approach.
Energies 17 02769 g007
Figure 8. Annual electric energy consumption utilising the WHO approach.
Energies 17 02769 g008
Figure 9. Risk of virus infection as a function of the ACH in the building’s rooms utilising the ACDCP approach.
Energies 17 02769 g009
Figure 10. Annual electric energy consumption utilising the ACDCP approach (five ACH).
Energies 17 02769 g010
Figure 11. Annual electric energy consumption for the 10 analysed ACH scenarios.
Energies 17 02769 g011
Figure 12. Outdoor ACH in rooms of the building as a function of a risk of infection equal to: (a) 20%; (b) 15%; (c) 10%.
Energies 17 02769 g012
Figure 13. Total annual electric energy consumption using the tailored approach scenario for a 20%, 15%, and 10% risk of virus infection.
Energies 17 02769 g013
Figure 14. Comparative graph of electric energy consumption and maximum infection risk for the analysed ventilation rate design strategies.
Energies 17 02769 g014
Figure 15. Annual electric energy consumption percentage variation and maximum infection risk percentage variation for different ventilation rate approaches, compared to the IMD approach.
Energies 17 02769 g015
Figure 16. Diagrammatic comparison between the five analysed ventilation approaches.
Energies 17 02769 g016
Table 1. Main geographic data of the locality of Fondi (province of Latina, Central Italy).
DescriptionValueMeasure Unit
Altitude8m
Latitude41°21′00′′ N-
Longitude13°25′00′′ E-
Koppen classificationC-
Italian climatic zone (DPR 412/93 [115])C-
Heating degree days1089HDD
Table 2. Main building features of the case study building.
DescriptionValueMeasure Unit
Total number of floors2-
Net floor area1820m2
Net volume6150m3
External wall area750m2
Window area490m2
Air infiltration, 50 Pa0.05h−1
Window-to-wall ratio (WWR)40%
Table 3. Thermal transmittance of building envelope components and limit values [109].
Building Envelope
Component
Thermal TransmittanceThermal Transmittance Limit Value
W/(m2K)W/(m2K)
Floor0.270.38
Roof0.260.33
Wall0.190.34
Windows1.702.20
Table 4. Main features of the heating, ventilation, and DHW systems.
ServiceDescriptionValueMeasure Unit
HeatingSystemHydronic radiant panels -
System typeHydronic-
GenerationTwo electric air-to-water heat pumps -
Heating capacity (rating conditions)160kW
COP (rating conditions)3.80-
DistributionCentralised-
Distribution efficiency0.98-
EmissionRadiant floor-
Emission efficiency0.99-
Control systemModulating -
Indoor air temperature/RH set-point20/50°C/%
System availability07:00–17:00 Monday–Friday
15 November–31 March
-
CoolingNot present
DHWSystemDedicated electric air-to-water heat pump with 300 L storage tank-
GenerationDedicated electric air-to-water heat pump-
Capacity (rating conditions)12kW
COP (rating conditions)3.50-
DistributionCentralised-
Distribution efficiency0.99-
System availability07:00–17:00 Monday–Friday
All year
-
Mechanical VentilationSupply external air flow rateVariableL/s or h−1
Fan power10kW
SFP (specific fan power)832W/(m3/s)
Heat recoveryCrossflow-
Heat recovery efficiency0.85-
System availability07:00–17:00 Monday–Friday
All year
-
Table 5. Ventilation rates are calculated according to the Italian Ministerial Decree approach and risk of infection.
#RoomVolumeNumber
of Occupants
Outdoor Air VolumeRisk of Infection
m3 L/sm3/hh−1%
1Classroom 1472.93633312002.510
2Classroom 2453.33431511332.510
3Classroom 3453.33431511332.510
4Classroom 4453.33431511332.510
5Classroom 5451.13431511332.510
6Classroom 6453.33431511332.510
7Classroom 7464.23532411672.510
8Kitchen57.52381382.528
9Canteen362.6532529072.53
10Relaxing area122.48511841.550
11Boardroom81.26331201.564
12Office 1120.94501801.550
13Office 268.8227981.570
14Office 374.72301081.567
15Medical room44.8219681.521
16Hallway895.52537313431.51
17Laundry32213481.528
Table 6. Ventilation rates calculated according to the WHO approach and risk of infection.
#RoomVolumeNumber
of Occupants
Outdoor Airflow VolumeRisk of Infection
m3 L/sm3/hh−1%
1Classroom 1472.93636012962.710
2Classroom 2453.33434012242.710
3Classroom 3453.33434012242.710
4Classroom 4453.33434012242.710
5Classroom 5451.13434012242.710
6Classroom 6453.33434012242.710
7Classroom 7464.23535012602.710
8Kitchen57.5220721.347
9Canteen362.65353019085.32
10Relaxing area122.48802882.435
11Boardroom81.26602162.732
12Office 1120.94401441.273
13Office 268.8220721.181
14Office 374.7220721.082
15Medical room44.8220721.620
16Hallway895.5252509001.02
17Laundry32220722.319
Table 7. Ventilation rates calculated according to the ACDCP approach and risk of infection.
#RoomVolumeNumber
of Occupants
Outdoor Airflow VolumeRisk of Infection
m3 L/sm3/hh−1%
1Classroom 1472.936657236555
2Classroom 2453.334629226655
3Classroom 3453.334629226655
4Classroom 4453.334629226655
5Classroom 5451.134629225655
6Classroom 6453.334629226655
7Classroom 7464.235645232155
8Kitchen57.5280287515
9Canteen362.653504181352
10Relaxing area122.48170612519
11Boardroom81.26113406526
12Office 1120.94168604519
13Office 268.8296344530
14Office 374.72104373528
15Medical room44.826222457
16Hallway895.525124444785~ 0
17Laundry3224416059
Table 8. Outdoor air volumetric flow rate and risk of infection for each room in the case of a gradual increase in ventilation rate (expressed in ACH).
#RoomVolumeNumber
of
Occupants
1 ACH2 ACH3 ACH4 ACH5 ACH6 ACH7 ACH8 ACH9 ACH10 ACH
ABABABABABABABABABAB
m3 m3/h%m3/h%m3/h%m3/h%m3/h%m3/h%m3/h%m3/h%m3/h%m3/h%
1Classroom 1472.93647323946121419918926236552838433104378334256347293
2Classroom 2453.33445324907131360918137226652720531734362634079345333
3Classroom 3453.33445324907131360918137226652720531734362634079345333
4Classroom 4453.33445324907131360918137226652720531734362634079345333
5Classroom 5451.13445124902131354918057225652707531584361034061345123
6Classroom 6453.33445324907131360918137226652720531734362634079345333
7Classroom 7464.23546424928131393918577232152785432504371434178346423
8Kitchen57.5257561153417224230192871534513402114601051795758
9Canteen362.653363872541088314502181322176125381290113263136261
10Relaxing area122.481226424540367294902361219734168571497912110211122410
11Boardroom81.268179162542444032532406264872356820649187311681214
12Office 1120.941216524241363294832360419725168461496712108811120910
13Office 268.826984138602064627537344304132648223551206191868817
14Office 374.727582149572244329934373284482552321598196721774716
15Medical room44.8245309016134111798224726963145359440344483
16Hallway895.525896217911268713582~04478~05373~06269~07164~08060~08955~0
17Laundry32232396422961512812160919282247256628853205
A: outdoor air volumetric flow rate; B: risk of infection.
Table 9. Ventilation rates calculated to a maximum infection risk of 20%.
#RoomVolumeNumber
of Occupants
Outdoor Airflow VolumeRisk of Infection
m3 L/sm3/hh−1%
1Classroom 1472.9361575671.220
2Classroom 2453.3341515441.220
3Classroom 3453.3341515441.220
4Classroom 4453.3341515441.220
5Classroom 5451.1341515441.220
6Classroom 6453.3341515441.220
7Classroom 7464.2351555571.220
8Kitchen57.52562013.520
9Canteen362.653401450.420
10Relaxing area122.481565634.520
11Boardroom81.261495366.620
12Office 1120.941515444.620
13Office 268.821495377.820
14Office 374.721495387.220
15Medical room44.8219671.520
16Hallway895.52525900.120
17Laundry32219702.220
Table 10. Ventilation rates calculated to a maximum infection risk of 15%.
#RoomVolumeNumber
of Occupants
Outdoor Airflow VolumeRisk of Infection
m3 L/sm3/hh−1%
1Classroom 1472.9361977091.515
2Classroom 2453.3341896801.515
3Classroom 3453.3341896801.515
4Classroom 4453.3341896801.515
5Classroom 5451.1341896801.515
6Classroom 6453.3341896801.515
7Classroom 7464.2351936961.515
8Kitchen57.52752704.815
9Canteen362.653501810.515
10Relaxing area122.482147716.015
11Boardroom81.262167889.815
12Office 1120.942017256.115
13Office 268.8221677710.615
14Office 374.721997179.015
15Medical room44.8225902.015
16Hallway895.52525900.115
17Laundry32227962.815
Table 11. Ventilation rates calculated to a maximum infection risk of 10%.
#RoomVolumeNumber
of Occupants
Outdoor Airflow VolumeRisk of Infection
m3 L/sm3/hh−1%
1Classroom 1472.93630210882.310
2Classroom 2453.33429010432.310
3Classroom 3453.33429010432.310
4Classroom 4453.33429010432.310
5Classroom 5451.13428810382.310
6Classroom 6453.33429010432.310
7Classroom 7464.23529010432.310
8Kitchen57.521174207.310
9Canteen362.653812900.810
10Relaxing area122.4833312009.010
11Boardroom81.26334120213.510
12Office 1120.9431211249.110
13Office 268.82332119716.010
14Office 374.72332119514.810
15Medical room44.82391393.110
16Hallway895.525501790.210
17Laundry32219704.310
Table 12. Cost analysis of the PV systems required for NZEB target attainment.
Ventilation RateCompensated GHG Emission PV System PowerSystem ComponentsCostTotal Cost
kgCO2-eq per YearkWp EUR EUR
IMD
approach
893813.6N°34 modules850022,680
Inverter3300
Support structure (68 m2)4080
Design and installation6800
WHO approach936114.0N°35 modules875023,250
Inverter3300
Support structure (70 m2)4200
Design and installation7000
ACDCP approach13,19420.0N°50 modules12,50032,700
Inverter4200
Support structure (100 m2)6000
Design and installation10,000
Gradual ventilation increment (case of 10 ACH)21,25232.0N°80 modules20,00051,400
Inverter4800
Support structure (160 m2)9600
Design and installation17,000
Tailored approach (case of 10% risk)993715.2N°38 modules950025,260
Inverter3600
Support structure (76 m2)4560
Design and installation7600
Disclaimer/Publisher’s Note: The statements, opinions and data contained in all publications are solely those of the individual author(s) and contributor(s) and not of MDPI and/or the editor(s). MDPI and/or the editor(s) disclaim responsibility for any injury to people or property resulting from any ideas, methods, instructions or products referred to in the content.