Article

Integrating Floating Photovoltaics with Hydroelectricity

Faculty of Electrical Engineering, University of Sarajevo, 71000 Sarajevo, Bosnia and Herzegovina
*
Author to whom correspondence should be addressed.
Energies 2024, 17(11), 2760; https://doi.org/10.3390/en17112760
Submission received: 23 April 2024 / Revised: 6 May 2024 / Accepted: 11 May 2024 / Published: 5 June 2024
(This article belongs to the Section A2: Solar Energy and Photovoltaic Systems)

Abstract

:
The transition process from fossil fuels to environmentally friendly renewable energy sources carries the risk of creating new environmental damages. Photovoltaic technology represents one of the alternatives with the least risk of harmful environmental impact. However, this technology has two important drawbacks: the significant land occupation for the installation of PV systems and the uncontrollability of production. By constructing floating photovoltaic plants on hydroelectric reservoirs, both of these problems can be reduced to an acceptable level. Some artificial reservoirs, originally built for hydroelectric power plants, have acquired a significant secondary function as recreational areas and fish breeding sites. Therefore, there is justified resistance from the local community to change the existing appearance and purpose of such reservoirs. This paper proposes a completely new concept of integrating the interests of the local community into such objects. In addition to preserving existing uses, the concept also offers new features. This can make the entire system environmentally friendly and sustainable. This paper details the technology behind the construction of floating photovoltaic power plants on artificial reservoirs and emphasizes their various advantages. These benefits include the non-utilization of cultivable land, the ease of assembly and construction, integration into existing power grids, and the potential to address electricity storage issues. For instance, Buško Lake, covering an area of 55.8 km2, may host 2.93 km2 of installed floating photovoltaic (FPV) facilities, enabling a total installed capacity of 240 MW. With an average of 5.5 h of daily sunshine, this totals 2007 annual hours, equivalent to a 55 MW thermal power plant. An analysis showed that, with losses of 18.2%, the average annual production stands at 302 G W h , translating to an annual production value of 18 million € at 60 €/MWh. The integration of this production into an existing hydroelectric power plant featuring an artificial reservoir might boost its output by 91%. The available transmission line capacity of 237 MW is shared between the hydroelectric power plant (HPP) and FPV; hence during the FPV maximum power generation time, the HPP halts its production. HPP Orlovac operates a small number of hours annually at full capacity (1489 h); therefore in combination with the FPV, this number can be increased to 2852 h. This integration maintains the lake’s functions in tourism and fishing while expanding its capabilities without environmental harm.

1. Introduction

The fundamental problem of existing electricity generation technologies is their harmful impact on the environment [1]. Another equally important issue is the limited availability of fossil fuels. As a solution, technologies based on renewable energy sources are currently being offered. Photovoltaic (PV) technology is considered highly promising [2,3] so that in the last 20 years PV technology has been treated as key in the process of replacing fossil fuels. As of 2022, over 1000 GW of PV installations have been installed worldwide, marking a significant milestone in the global shift towards sustainable and renewable energy solutions, with the capacity to power homes, businesses, and communities while reducing our reliance on traditional energy sources [4].
In the same year, according to research conducted by the International Renewable Energy Agency (IRENA) [5], the production cost of one MWh of electricity from PV installations amounted to 48 € with the highest decreasing trend. For comparison, the production cost of one MWh of electricity from other renewable sources was as follows: 48 € for hydroelectric power, 33 € for wind energy, and 67 € for biomass energy (Figure 1) [5].
The advantages of this technology include an infinite source, environmentally friendly impact, simple construction, and easy maintenance. The disadvantages include occupying useful (often cultivable) land, large daily production variations, and production unpredictability. As a solution to the problem of occupying cultivable land, floating photovoltaic (FPV) systems are being implemented [6,7,8]. This approach involves installing PV systems on already occupied surfaces of natural or artificial water bodies such as hydroelectric reservoirs, irrigation canals, water reservoirs, natural lakes, river streams, marine surfaces, etc. This technology is in a state of continuous development with a constant trend of decreasing production costs and increasing efficiency, so it is expected that the production cost will be competitive with that of thermal power plants [5,9]. In the period from 2010 to 2020, a total of 2.6 GW of FPV capacity was installed worldwide [10]. Leading countries in FPV installations during this period included China with 1.3 GW, Taiwan with 312 MW, Japan with 260 MW, Vietnam with 156 MW, South Korea with 130 MW, India with 104 MW, Netherlands with 104 MW, Israel with 104 MW, and all other countries with 78 MW [10]. The advantages offered by floating solar power plant technology are as follows [11]: improved efficiency, no use of valuable arable land, reduction of water evaporation, utilization of existing electrical infrastructure, complementary operation with hydro reservoirs, reduction of algae growth, a new source of revenue for the owner-user of the water surface, less-soiling of solar panels, easier cleaning, cooling potential, and simpler installation.
Although PV technology is considered an environmentally friendly form of energy transition, its impact on the environment is not neutral. Many studies have been conducted highlighting the pros and cons of this technology [12,13,14,15,16]. All of these studies clearly emphasize the advantage of PV technology over coal but also warn of other dangers of harmful environmental impact. The following problems related to the application of PV technology and its impact on the environment are particularly mentioned in these and other papers: land use [13,17,18], alteration of landscape appearance [19,20], deforestation [15,21], potential fire hazards [22,23], increased demand for rare materials [24,25], recycling issues [26,27,28], and the use of harmful materials in the production of photovoltaic modules [14,29]. As a result of the potential adverse environmental impact of PV plants, resistance from the local community to the construction of these plants arises [20]. One solution to such a problem could be the harmonized operation of two principles: acceptable environmental disruption and alignment of the interests of the local community with those of the investors.
The variability and unpredictability of production from PV plants pose important technological challenges for the application of PV electricity production [30,31,32]. Various energy storage system management techniques are proposed to ensure continuous supply of electricity to consumers and provide the necessary quality of electricity [33,34,35,36,37]. One solution is the integration of PV plants into the production system of hydroelectric power plants (HPPs) [38,39,40,41,42,43,44,45,46,47,48,49,50,51]. The existence of HPP reservoirs enables efficient and inexpensive energy storage, which can contribute to solving the problem of production unpredictability and variability of PV. HPPs with large installed capacities (>100 MW), possessing large-capacity hydro reservoirs (>100,000,000 m3) and large lake areas (>10 km2), are usually connected to the power grid. This means that there is already infrastructure capable of absorbing power from PV plants comparable to the power of HPPs (>100 MW). Properly selected management strategies for the integrated HPP and PV system can result in significant gains in terms of increased production and/or increased profits compared to separately managing the HPP and PV systems [38]. The following paragraph provides an overview of works that stand out in covering the combination of hydroelectric power plants with floating photovoltaic power plants.
In paper [40], the authors explored the overall potential of integrating FPV into HPPs with reservoirs worldwide. The total capacities of HPPs with reservoirs amount to 842 GW, covering a total reservoir area of 265,700 m2. By utilizing just 25 % of these areas, it is possible to install 4400 GW of FPV. Paper [38] analyzed the potential for integrating FPV into the 20 largest hydroelectric power plants in the world. It was shown that covering 10 % of the reservoir area increases the energy production of HPPs by 65 % . In the paper [39], the authors investigated the possibility and potential of installing floating photovoltaic systems in existing hydroelectric power plants in Greece. It was estimated that 24 existing hydroelectric power plants in Greece, along with their reservoirs, have the potential to install FPV on 10 % of the reservoir area, totaling 3861 MW with an annual production of 5212.35 GWh. The paper [41] highlighted the benefit of using FPV installed on reservoirs in locations where droughts occasionally occur, which makes permanent energy production from hydroelectric plants impossible. This is particularly evident from the increase in capacity factor by 17.3 % when FPV is placed on the analyzed accumulation. Paper [42] points out the possibility of complementing hydroelectric power plants and FPV for daytime peak electricity demand using the linear optimization method. The authors particularly emphasized the effect of cooling the FPV due to the water from the reservoir, which leads to an increase in the efficiency of the system and greater production of electricity. Paper [43] discusses the integration of floating photovoltaic (FPV) systems with hydroelectric power plants, focusing on the specific example of the Ghazi Barotha Dam in Pakistan. It analyzes the challenges of installing large-scale FPV plants far from populated areas, which can increase transmission and distribution costs. By utilizing water bodies for FPV installation, this approach offers advantages such as leveraging existing infrastructure and reducing greenhouse gas emissions from the construction sector. Paper [44] presents the design and evaluation of Pumped Hydroelectric Energy Storage Systems (PHESS) integrated with a PV system for self-consumption at Mutah University in an area with high solar radiation potential in Jordan. The study determines optimal energy storage and system sizing, achieving an annual energy production of 9230.89 MWh annually, thus meeting the university’s demand and resulting in significant cost savings. The authors in [45] explored the impact of battery energy storage on energy systems consisting of renewable energy sources, which is crucial for transitioning from fossil fuels to renewable energy. By modeling an energy system integrating solar, hydroelectric power plants, and batteries in Turkish cities, the implications of energy storage are assessed through a stochastic nonlinear optimization approach. The study reveals that adding battery storage devices enhances the flexibility and reliability of the system, influencing profitability and hydroenergy planning. Studies like [46,47] have looked into the advantages and technical possibilities of combining hydropower infrastructure with floating photovoltaics (FPV) in Europe. The potential for installing FPV on 337 hydropower reservoirs in the European Union was evaluated [46]. They projected a yearly energy output of 42.31   T W h and potential water savings of up to 557 million cubic meters. They also highlighted that by covering only 2.3 % of the surface of the analyzed reservoirs in the European Union, they obtained an additional 68 % of energy compared to the energy of hydropower plants. In Africa, the paper [48] highlights even more how FPV integration with hydropower reservoirs might help with water and energy problems. According to their study of 146 reservoirs in Africa, the implementation of FPV has the potential to greatly boost electricity generation by possibly up to 58 % . Furthermore, depending on the situation and the FPV technology employed, the decrease in evaporation brought on by FPV installation may result in significant water savings and open the door to further hydroelectricity generation up to 170 GWh. In the paper [49], the potential of pumped hydroelectric storage in Spain for the integration of FPV was analyzed. All hydro accumulations were considered, and a classification was carried out in terms of defined criteria: energy efficiency, nominal power of FPV, solar potential, and accumulation capacity. The obtained results show that only 8 out of 25 considered accumulations are suitable for FPV. In the work [50], optimal operational strategies for managing the FPV and pumped hydroelectric system in the electricity market with day-ahead planning were identified. The identified strategy provides an economic gain of up to 35 % in the scenario of penalties for deviations from planned production amounts if both plants are treated as one system. In the work [51], the example of a hydro accumulation in Italy is discussed in terms of increasing the electricity production of a hybrid FPV-HPP system. With 25 % coverage of the accumulation due to the reduction in water evaporation, the increase in HPP electricity production is up to 3.56 % , while with installed FPV, the total production increases by 391 % . In paper [52], an innovative approach to designing hybrid renewable energy systems (HRES) for remote communities emphasizes the integration of pumped hydro energy storage systems (PHES) alongside batteries to enhance reliability and minimize costs. Through the application of smart grid principles and demand-side management techniques, including a dynamic tariff based on fuzzy logic, the proposed HRES aims to achieve the lowest cost of energy and maximum reliability, with a projected payback period of 7 years. The findings highlight significant improvements in convergence time and a 53% reduction in the levelized cost of energy (LCOE) compared to traditional flat-rate pricing tariffs. In [53], the authors focused on techno-economic analysis of FPV power plants and their comparison to standard land PV power plants. Their analysis showed that the usage of FPV power plants resulted in a reduction of the levelized tariff of FPV to 39% less than land-based PV power plants.
This paper presents a study considering the construction of a floating solar plant on Lake Buško, Bosnia and Herzegovina. The considered plant is of a modular type. The basic module, covering an area of 36,705 m2, provides an installed capacity of 3 MW PV and 7200 m2 of useful space for business development, primarily in the hospitality and tourism activities. Eight basic modules are grouped with one central pool, and five of these clusters form an L-shaped configuration, comprising one group. Two groups constitute an integrated system. The integrated system comprises 80 basic modules, 80 business offering platforms, and 10 multi-purpose pools. A kayak pool is situated between the two groups. The complete platform can accommodate up to 3200 guests at one time and employ up to 240 staff members. The total potential installed capacity of all 80 modules amounts to 240 MW. The integration of FPV into the 237 MW installed capacity of the Orlovac HPP is considered. This enables the use of existing power grid infrastructure to connect FPV to the transmission grid. It also allows for the complete absorption of FPV production by managing the excess energy production in Lake Buško through the operation of the Orlovac HPP.
The novelty of this paper is the approach to the design and calculation of hydroelectric and FPV systems, addressing a significant gap in the existing body of research. Despite thorough investigation, the authors identified that current literature predominantly concentrates on the economic ramifications or on optimizing the capacity factor for energy generation within these systems. This conspicuous absence of comprehensive solutions that integrate both system design and necessary calculations for hydroelectric and FPV systems underlines the pioneering nature of this work. By venturing beyond the traditional focal points of economic considerations and capacity enhancement, this paper introduces an innovative framework that promises to advance the field by providing a more holistic understanding of the complexities involved in the successful implementation of hydroelectric and FPV systems.
The contribution of this paper can be highlighted as the following:
-
development of a modular concept facilitating the involvement of multiple investors in the construction of FPV systems and promotion of the integration of new energy sources into the business opportunities of local communities, fostering sustainable development and renewable energy initiatives;
-
integration of FPV into the Orlovac HPP, establishing essential infrastructure for effectively harnessing the energy generated by FPV, with the introduction of flexibility in production scheduling for the Orlovac HPP-FPV Buško Lake system, thus enhancing operational adaptability.
The rest of paper is structured as follows: Section 2 provides an overview of the existing Orlovac hydroelectric power plant and its reservoir, Buško lake, identified as a suitable site for the installation of a floating photovoltaic power plant. Section 3 details the design of the modular photovoltaic system, elucidating each component comprehensively. In Section 4, a thorough techno-economic analysis of the proposed photovoltaic system is conducted. Lastly, Section 5 encapsulates the key insights derived from this study.

2. System of HPP Orlovac-Buško Lake

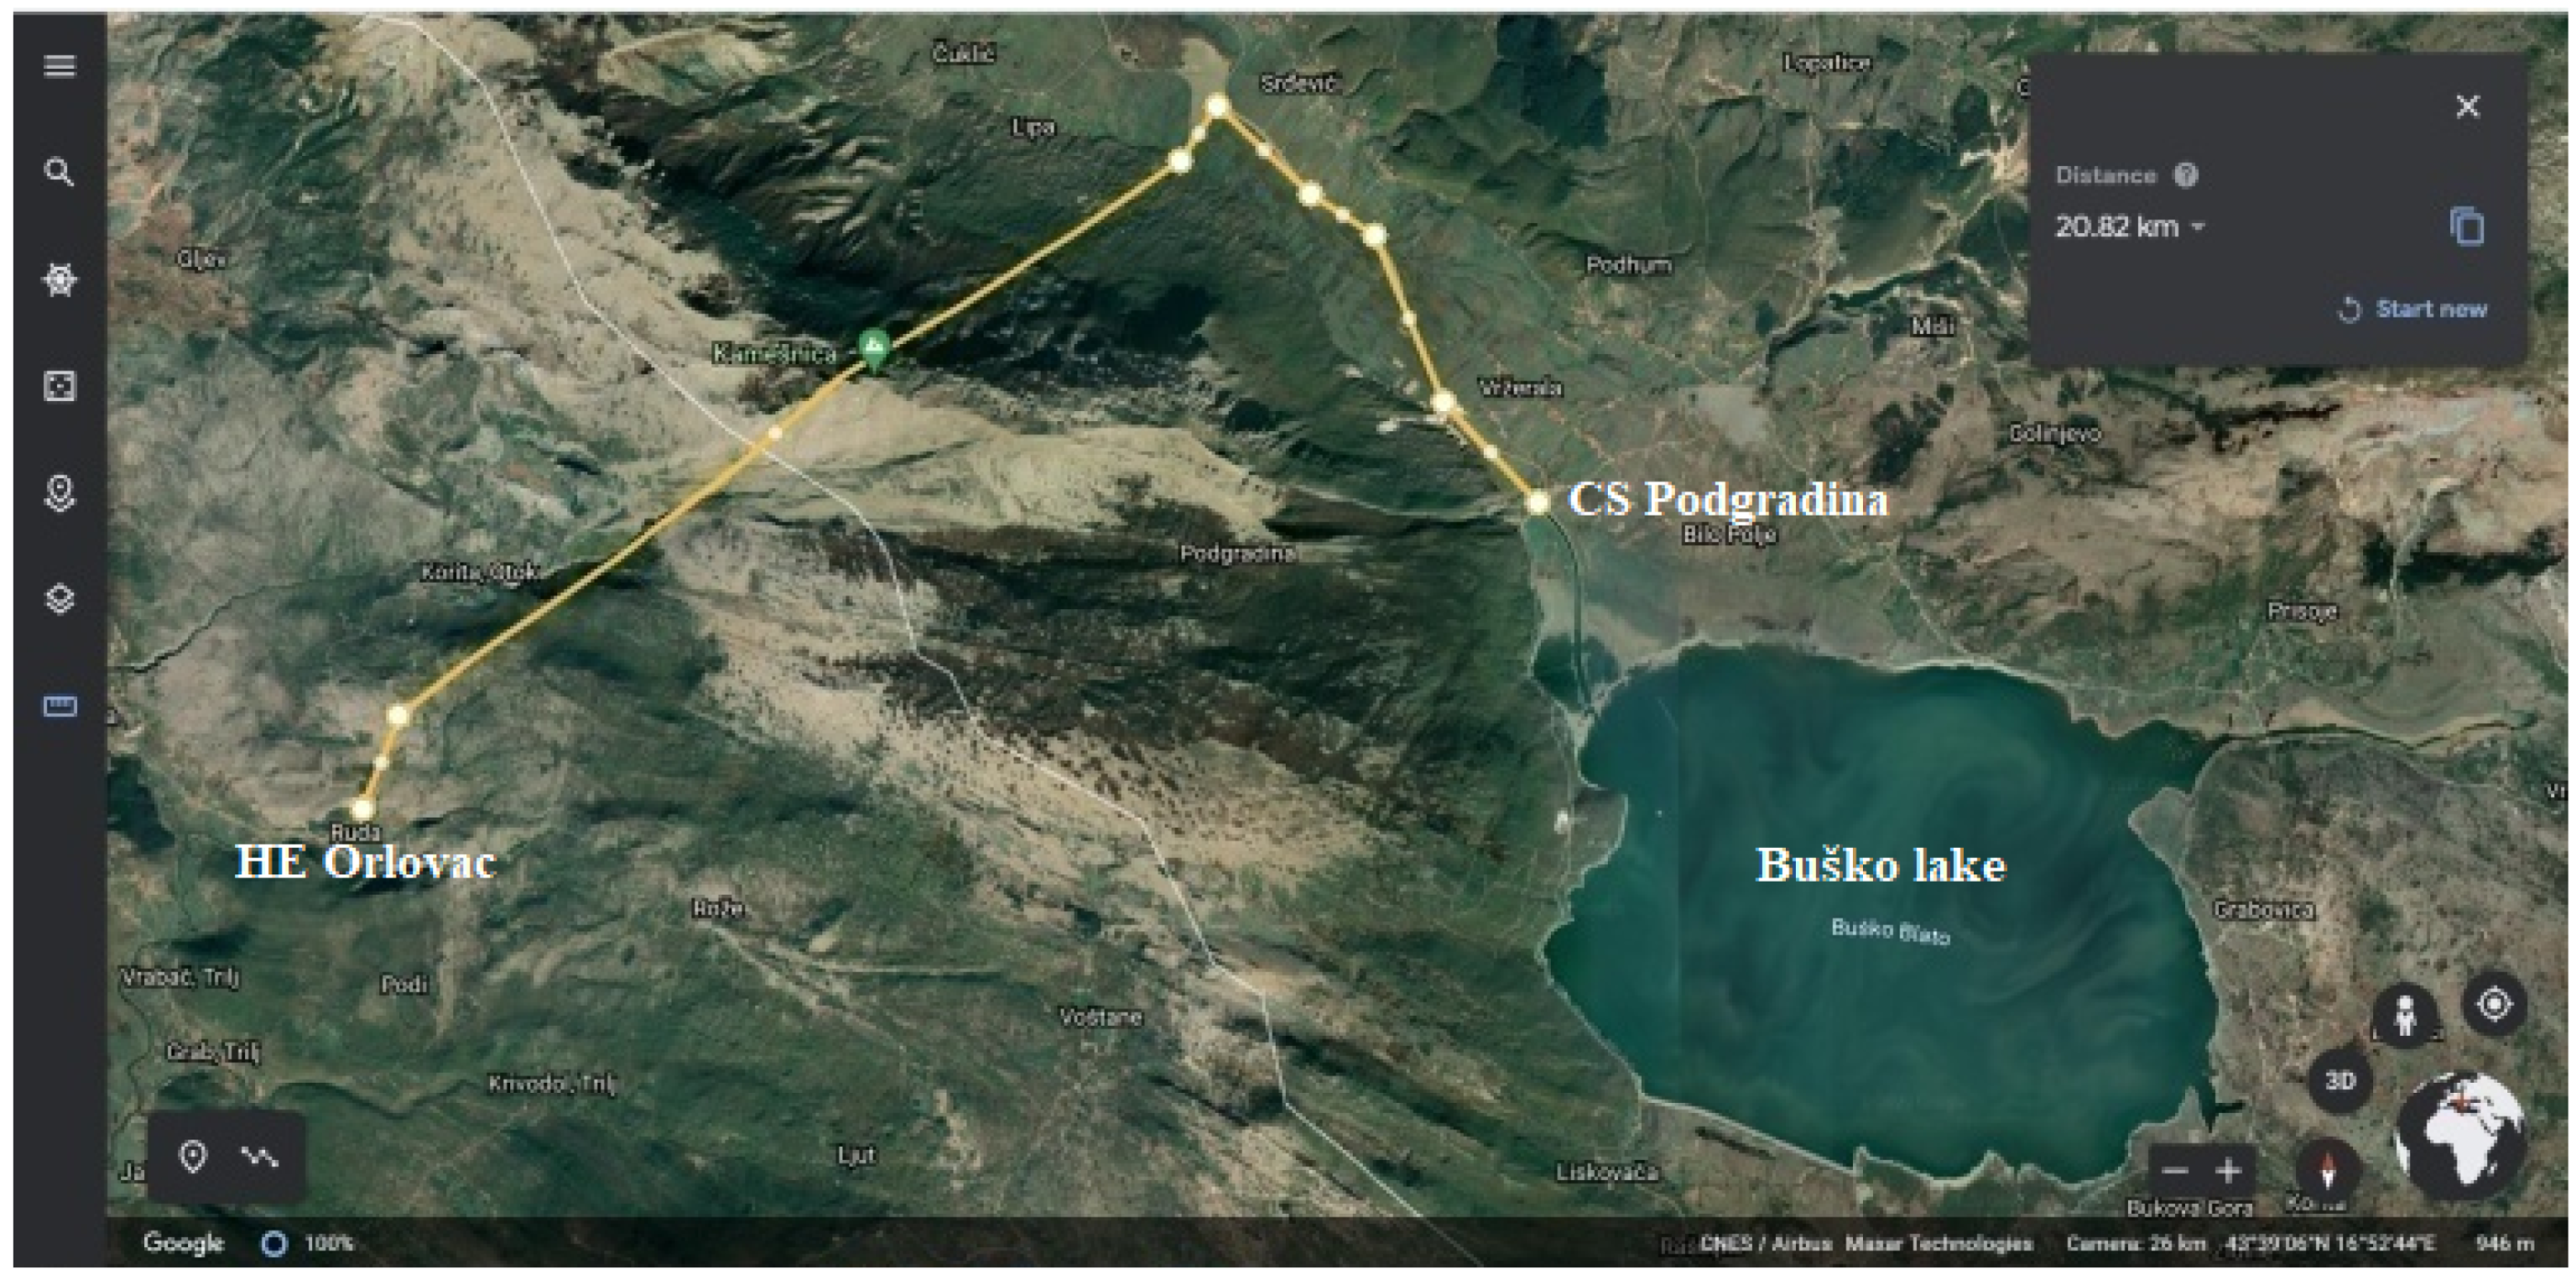
Buško Lake represents one of the largest artificial reservoirs in Europe. It was constructed in 1970 as a joint project between the Socialist Republic of Bosnia and Herzegovina and the Socialist Republic of Croatia to serve the needs of the Orlovac Hydroelectric Power Plant (Orlovac HPP). It is located within the municipalities of Livno and Tomislavgrad. The lake covers an area of 55.8   k m2 and is situated at an elevation of 700 m (at its bottom), with the water surface varying from 712 to 718 m depending on rainfall. During the winter, the surface often freezes, while in the summer, it is used for activities such as swimming and fishing. The lake is home to various fish species, including trout, carp, pike, etc. The Orlovac HPP is located in the town of Ruda, Croatia, next to the Ruda River (Figure 2).
It is situated approximately 14.5 km in a straight line from the Buško Lake hydro reservoir. Water is transported to the power plant through a network of canals spanning 25 km and tunnels stretching 12 km in length. The installed capacity of the Orlovac Hydroelectric Power Plant is 237 MW and utilizes three Francis turbines, each with a capacity of 79 MW. The installed flow rate is 70 m3/ s , and the usable elevation difference relative to the reservoir is 380 m . The average annual production is 353 GWh [54]. HPP Orlovac is connected to the power grid via a 220 k V transmission line. Within the Orlovac HPP complex, there are several components, including the Buško Lake reservoir with a capacity of 800 million m3, the Lipa reservoir with a capacity of 1.38 million m3, and the Podgradina reversible pump-turbine power station with an installed capacity of 10.2/ 4.8 MW (consisting of three motor-generators), all located in Bosnia and Herzegovina. The Podgradina pumping station (Podgradina PS) is located on a 7 k m long channel that connects the accumulation basin of Buško Lake and the compensation basin of Lipa. The network of channels collects water from the catchment area of the Livanjsko field into the compensation basin of Lipa, from where the water is led through a tunnel to the turbines of HPP Orlovac. The Podgradina PS is equipped with three Kaplan pump/turbine units with a total power of 10.5 MW. In pumping mode, they transfer excess water from the Lipa basin to Buško Lake, and in turbine mode, they release water from Buško Lake into the Lipa basin, during which they produce electricity. It is connected to the power grid via a 110 k V line. The installed flow rate of all three turbines of PS Podgradina is aligned with the installed flow rate of the turbines within HPP Orlovac and sums up to 70 m3 s−1.

3. Floating Photovoltaic System Design

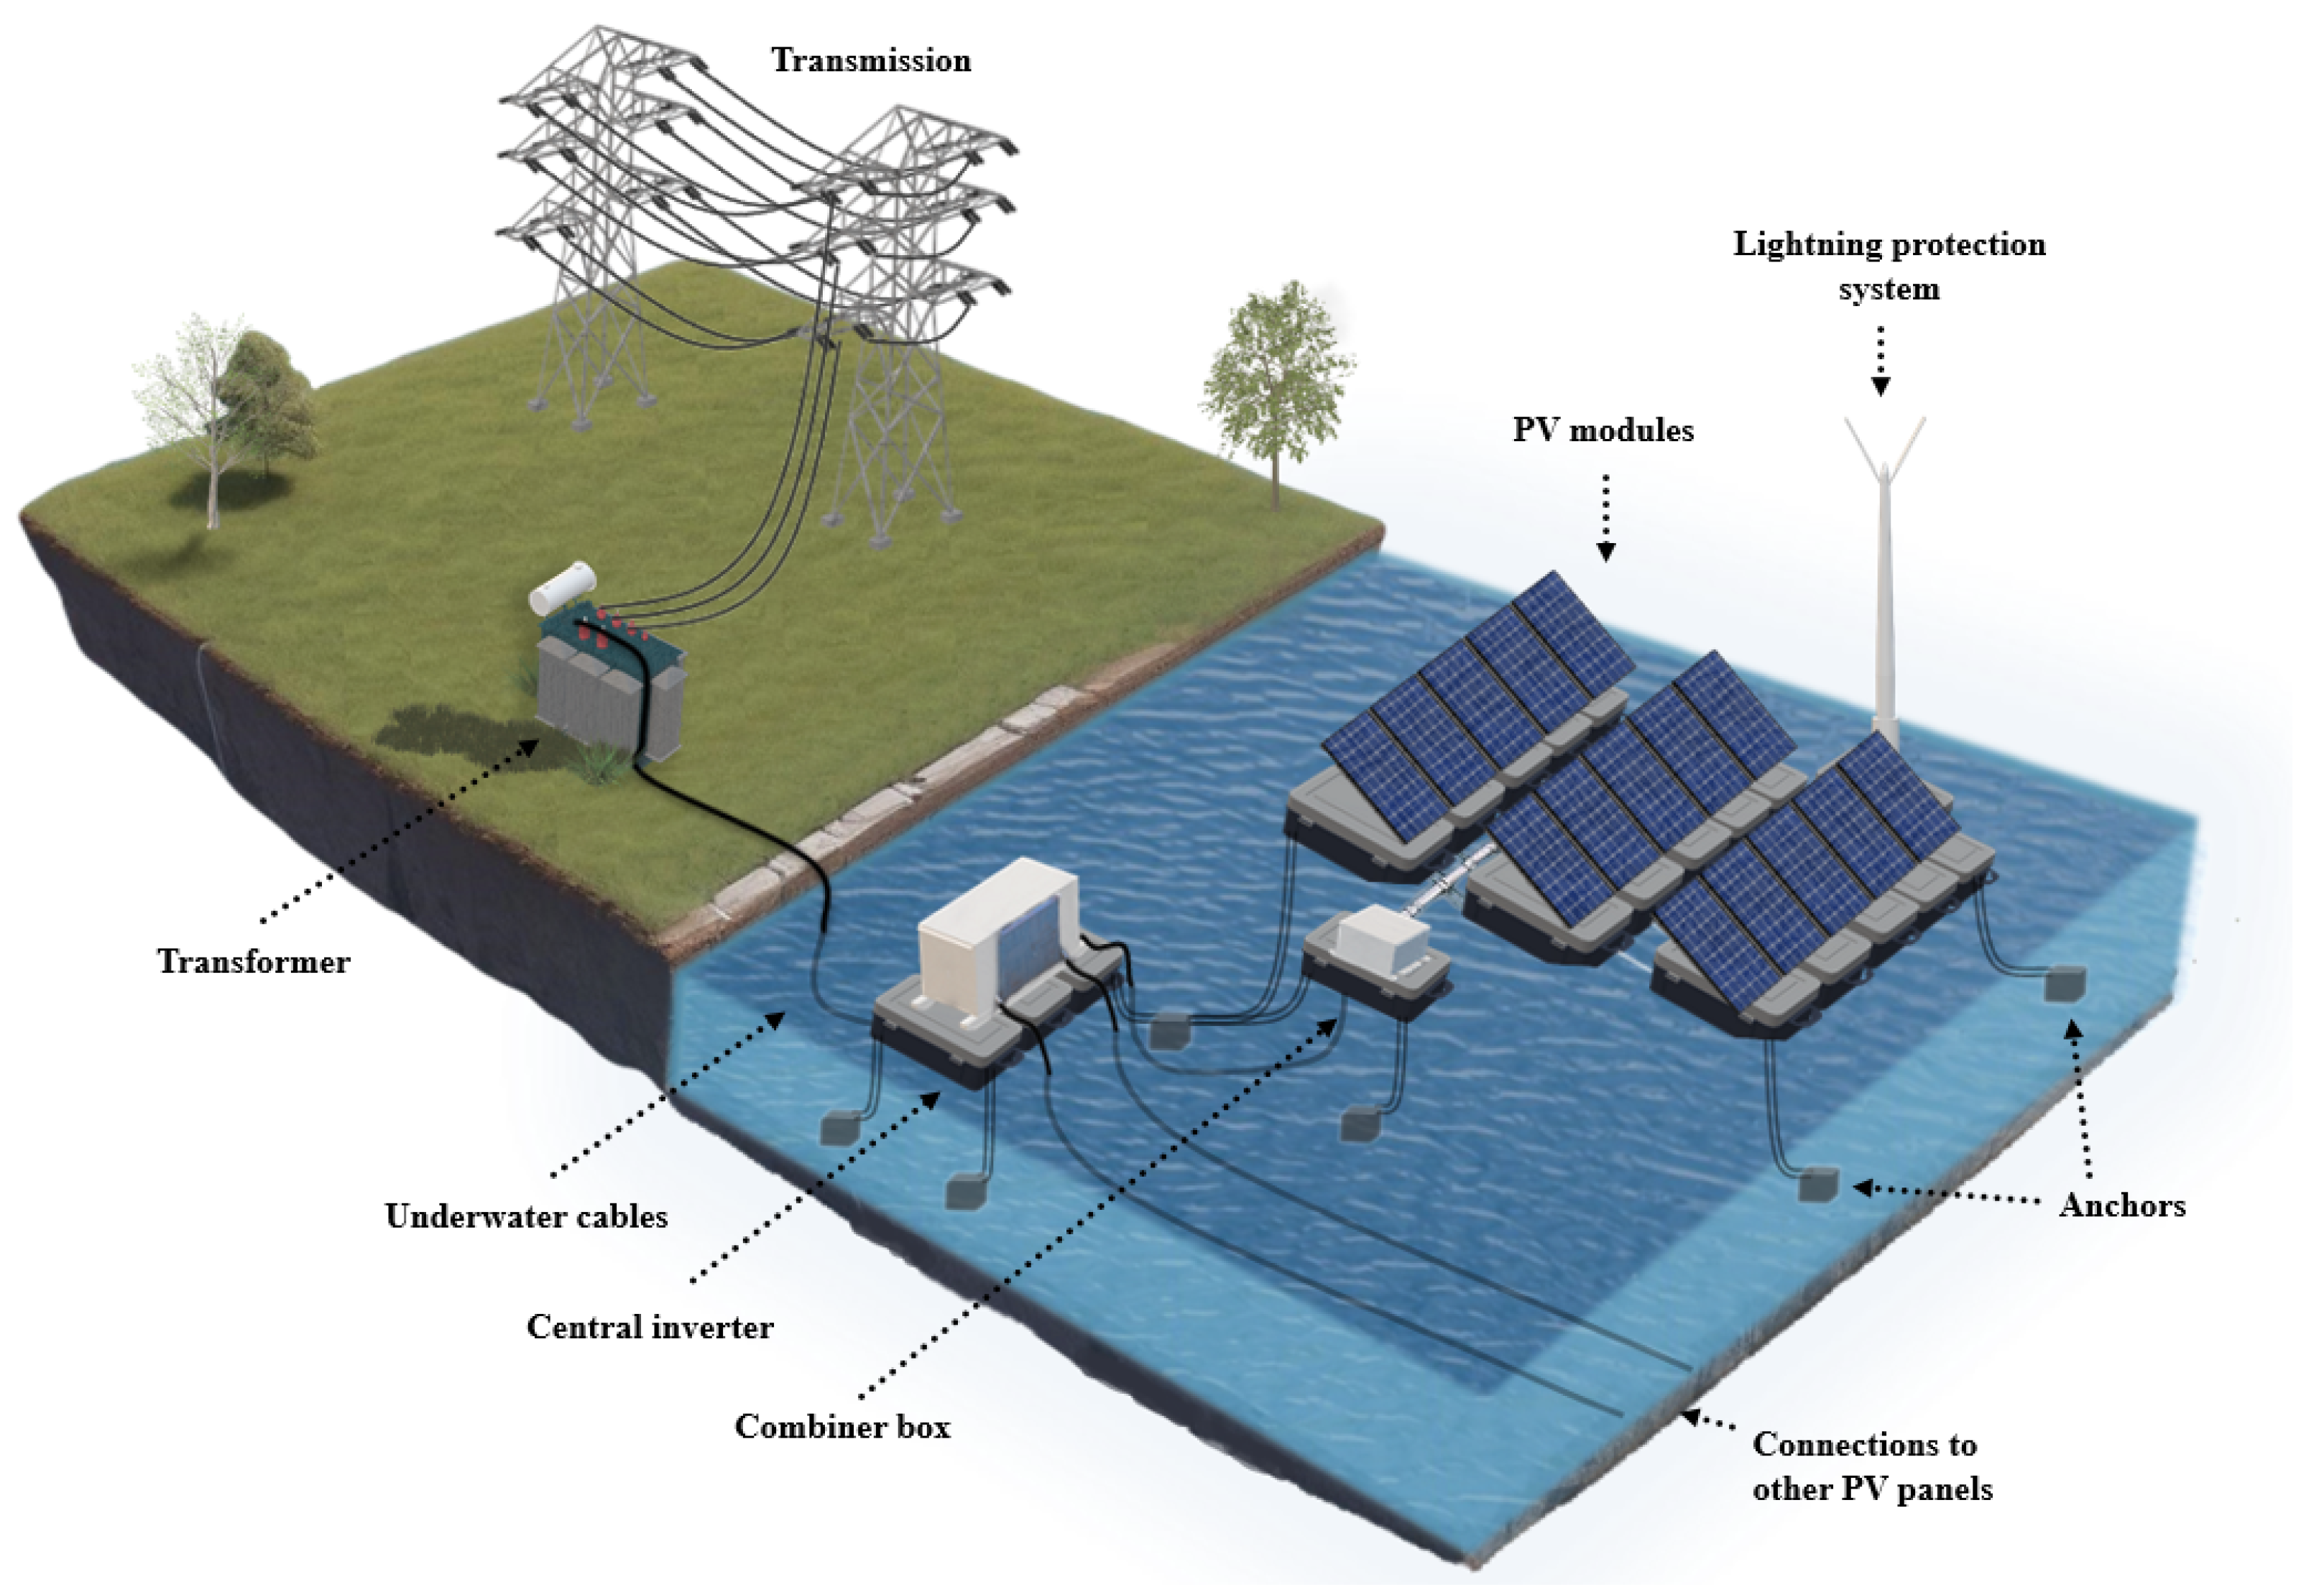
The essential components of an FPV system include PV modules, a floating support structure, an anchoring system, a cabling system, inverters, a grounding system with lightning protection, and a measurement and transformer system. The structure of an FPV system is depicted in Figure 3.
The plant is made from lightweight, waterproof materials resistant to UV radiation and wind speeds of up to 210 km/ h . Standard versions have a fixed tilt angle of 10°, 15°, or 22°. Several manufacturers offer modular supports for mounting solar panels on water surfaces [55,56,57]. Typically, these supports consist of panel bases and connectors.
Montage of the plant is carried out on the shore. During this process, operations such as securing panels to the supports, connecting strings, wiring, and installing inverters for the strings are performed. The assembled row (which may contain one or more strings) is then floated on the water, and the next row is attached to it. Once the assembly is complete, the entire platform (floated on the water) is transported to its destination using boats [58].
The installed FPV will start its work with the maximum production capacity that the power grid system can accommodate without the need for system expansion. Without delving into the specifics of the power grid’s capabilities, data on the installed capacity of the Orlovac HPP will be used. The considered concept is where the Buško Lake FPV and the Orlovac HPP function as a unified electricity source. In this concept, the Orlovac Hydroelectric Power Plant reduces or completely halts its production when the Buško Lake FPV is generating power. The installed capacity of the Orlovac HPP, which is 237 MW, will serve as the upper limit for the installed capacity of the FPV system (rounded up to 240 MW). FPV system will be designed using a modular approach by providing a detailed description of the design for one module, which can then be multiplied for all other modules. The module size will be chosen so that the investment cost is not dependent on the number of modules. In other words, the aim is to allow for the possibility of one investor funding the entire FPV system or multiple investors with a certain number of modules each. This approach enables the construction of the entire system in phases. Analyses show that the cost per kW of installed PV capacity for systems above 2 MW is not significantly affected by capacity. Without going into a detailed analysis, it will be assumed that the capacity of the basic module is 3 MW.

3.1. Structure of the Basic 3 MW Module

To conduct a techno-economic analysis, key components of the system will be selected from the current market offerings. In doing so, it will opt for top-level technical performance. For the PV solar panel, the JKM470M-7RL3-V type from the Chinese manufacturer JinKO Solar (Shanghai, China) will be chosen [59].
The technical specifications of the selected solar panel are provided in Table 1 [59].
For the inverters in the string, the SMA Sunny Tripower 20000TL (Niestetal, Germany) is selected. The technical characteristics of the selected inverter are provided in Table 2 [60].
The number of solar panels in a string is calculated using the following expression (rounded down to the nearest whole number):
N SP = U max , MPP + U min , MPP 2 U mp = 12 ,
where U max , MPP is the maximum DC voltage at the input of the inverter (800 V) for which the inverter provides maximum power transfer (MPP point), U min , MPP is the minimum DC voltage at the input of the inverter (320 V) for which the inverter provides maximum power transfer (MPP point), and U mp is the operating voltage of the solar panel at the maximum power point tracking MPPT point ( 43.28 V).
The number of strings connected in parallel to one inverter is calculated as follows:
N S = P INV N SP P max + 1 = 4 ,
where P INV is the maximum power of the selected inverter, N SP is the number of solar panels in a string, and P max is the maximum power of a solar panel.
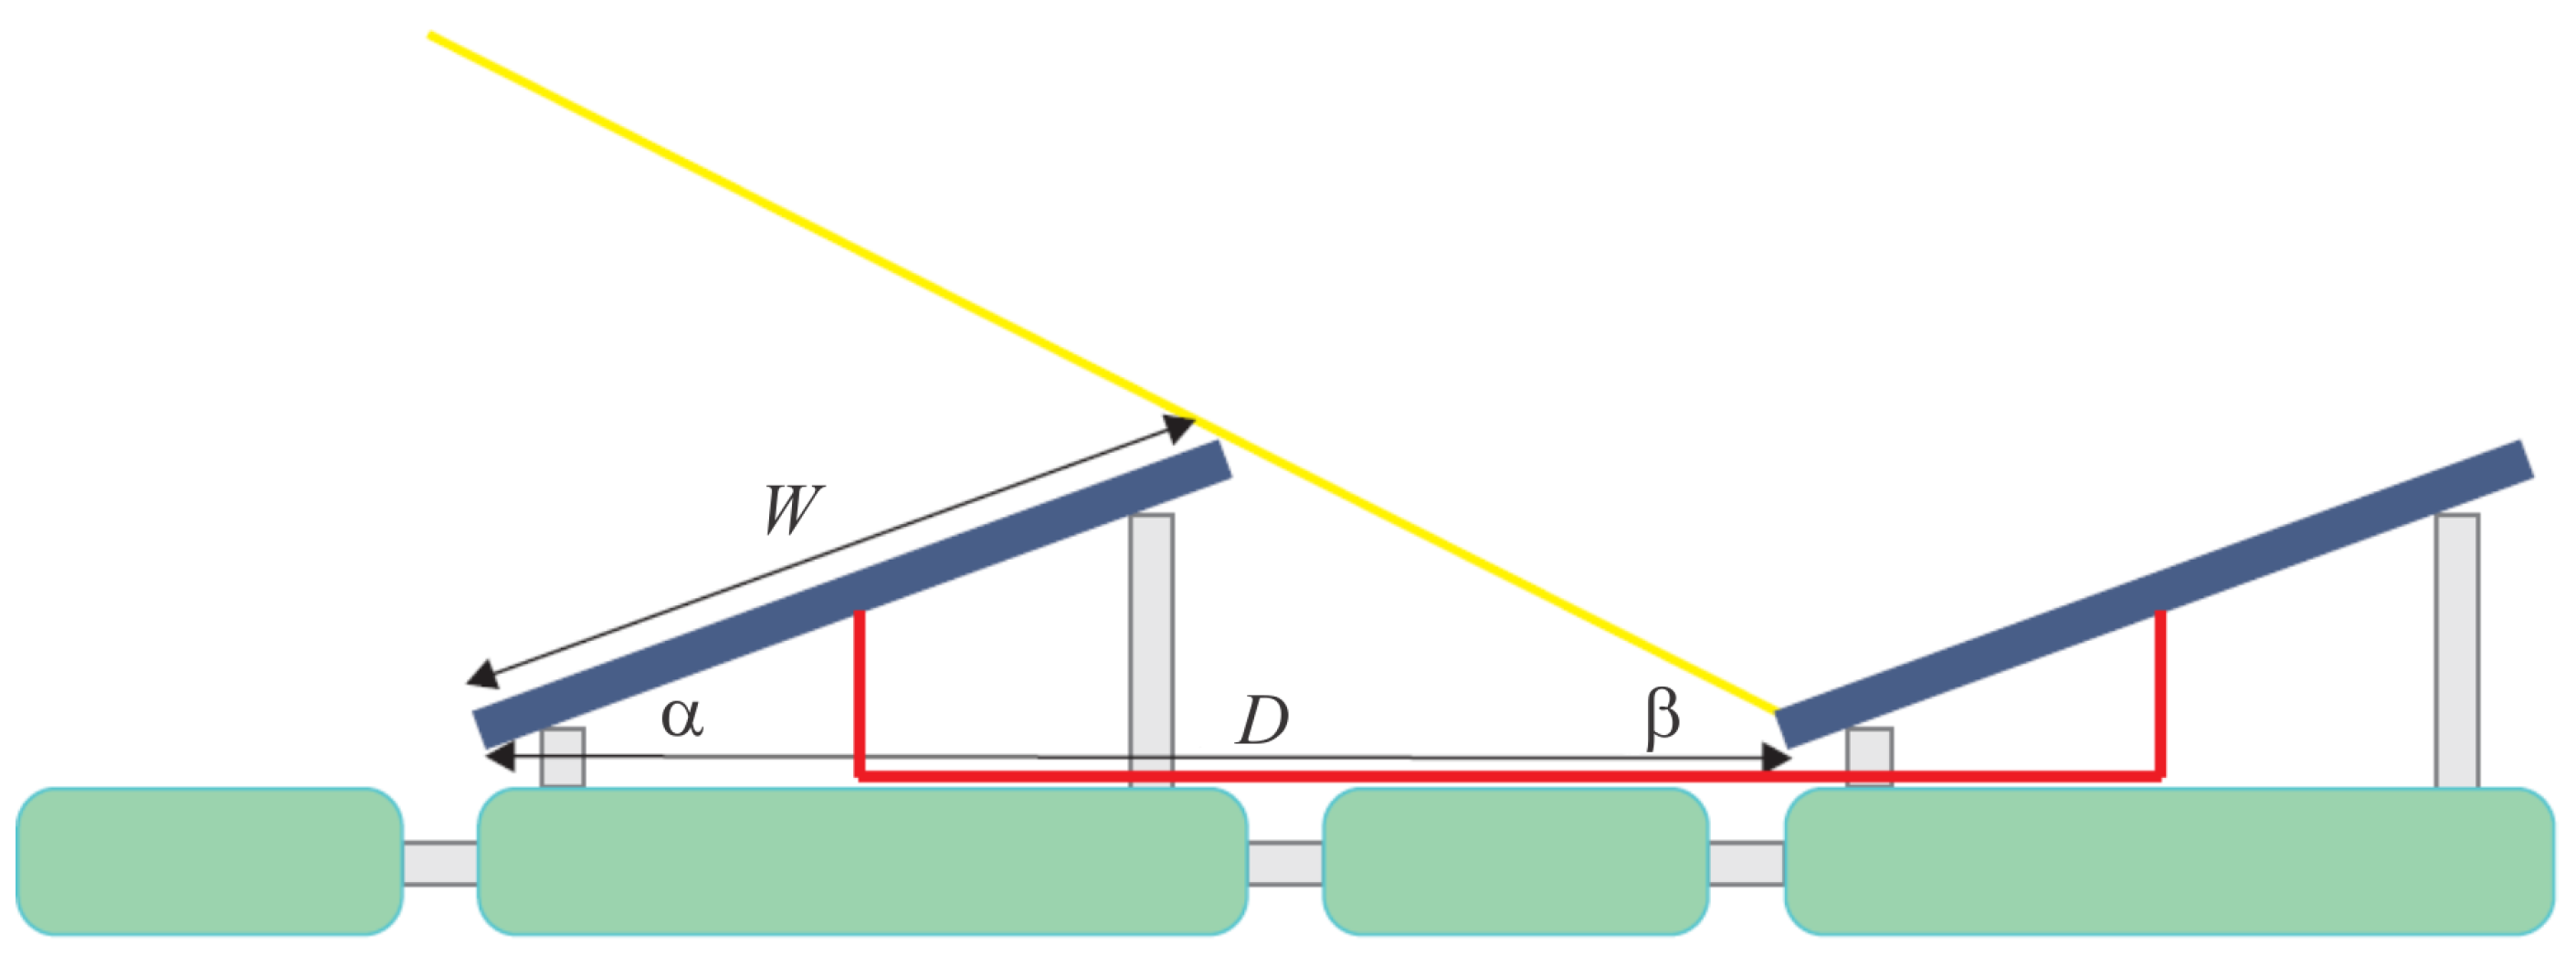
With this configuration, it is ensured that one inverter is connected to 48 panels, specifically two pairs of two parallel-connected strings, each with 12 panels. The maximum voltage at the inverter input under no load ( I out = 0   A ) is 625.68 V, the nominal operating voltage at the inverter input is 519.36 V, and the operating current at the inverter input is two times 21.72 A ( 21.72 A for each input A and B on the inverter). The maximum DC power of the PV array (4 strings of 12 panels each) is 22,560 W. For the selected inverter with a maximum AC power of 20 kW, this results in a DC to AC ratio of 1.128. The required surface area depends on the tilt angle at which the solar panels are installed (Figure 4).
The spacing between rows where the solar panels are set at an angle to avoid shading is calculated according to [61]:
D = W cos α + sin α tan β ,
where W is the width of the solar panel, α is the tilt angle, i.e., angle of the solar panel relative to the horizon, β = α at + 23.5 °, where α at is the geographic latitude of the location. In our case W = 1.029 m and α at = 43.65 °. The optimal tilt angle of the solar panel towards the horizon for the selected location is 33 °. However, due to the effect of the wind, floating systems are installed at a lower tilt angle ( α = 22 °) compared to ground-based systems. Using these data, it is obtained that D = 1.884 m.
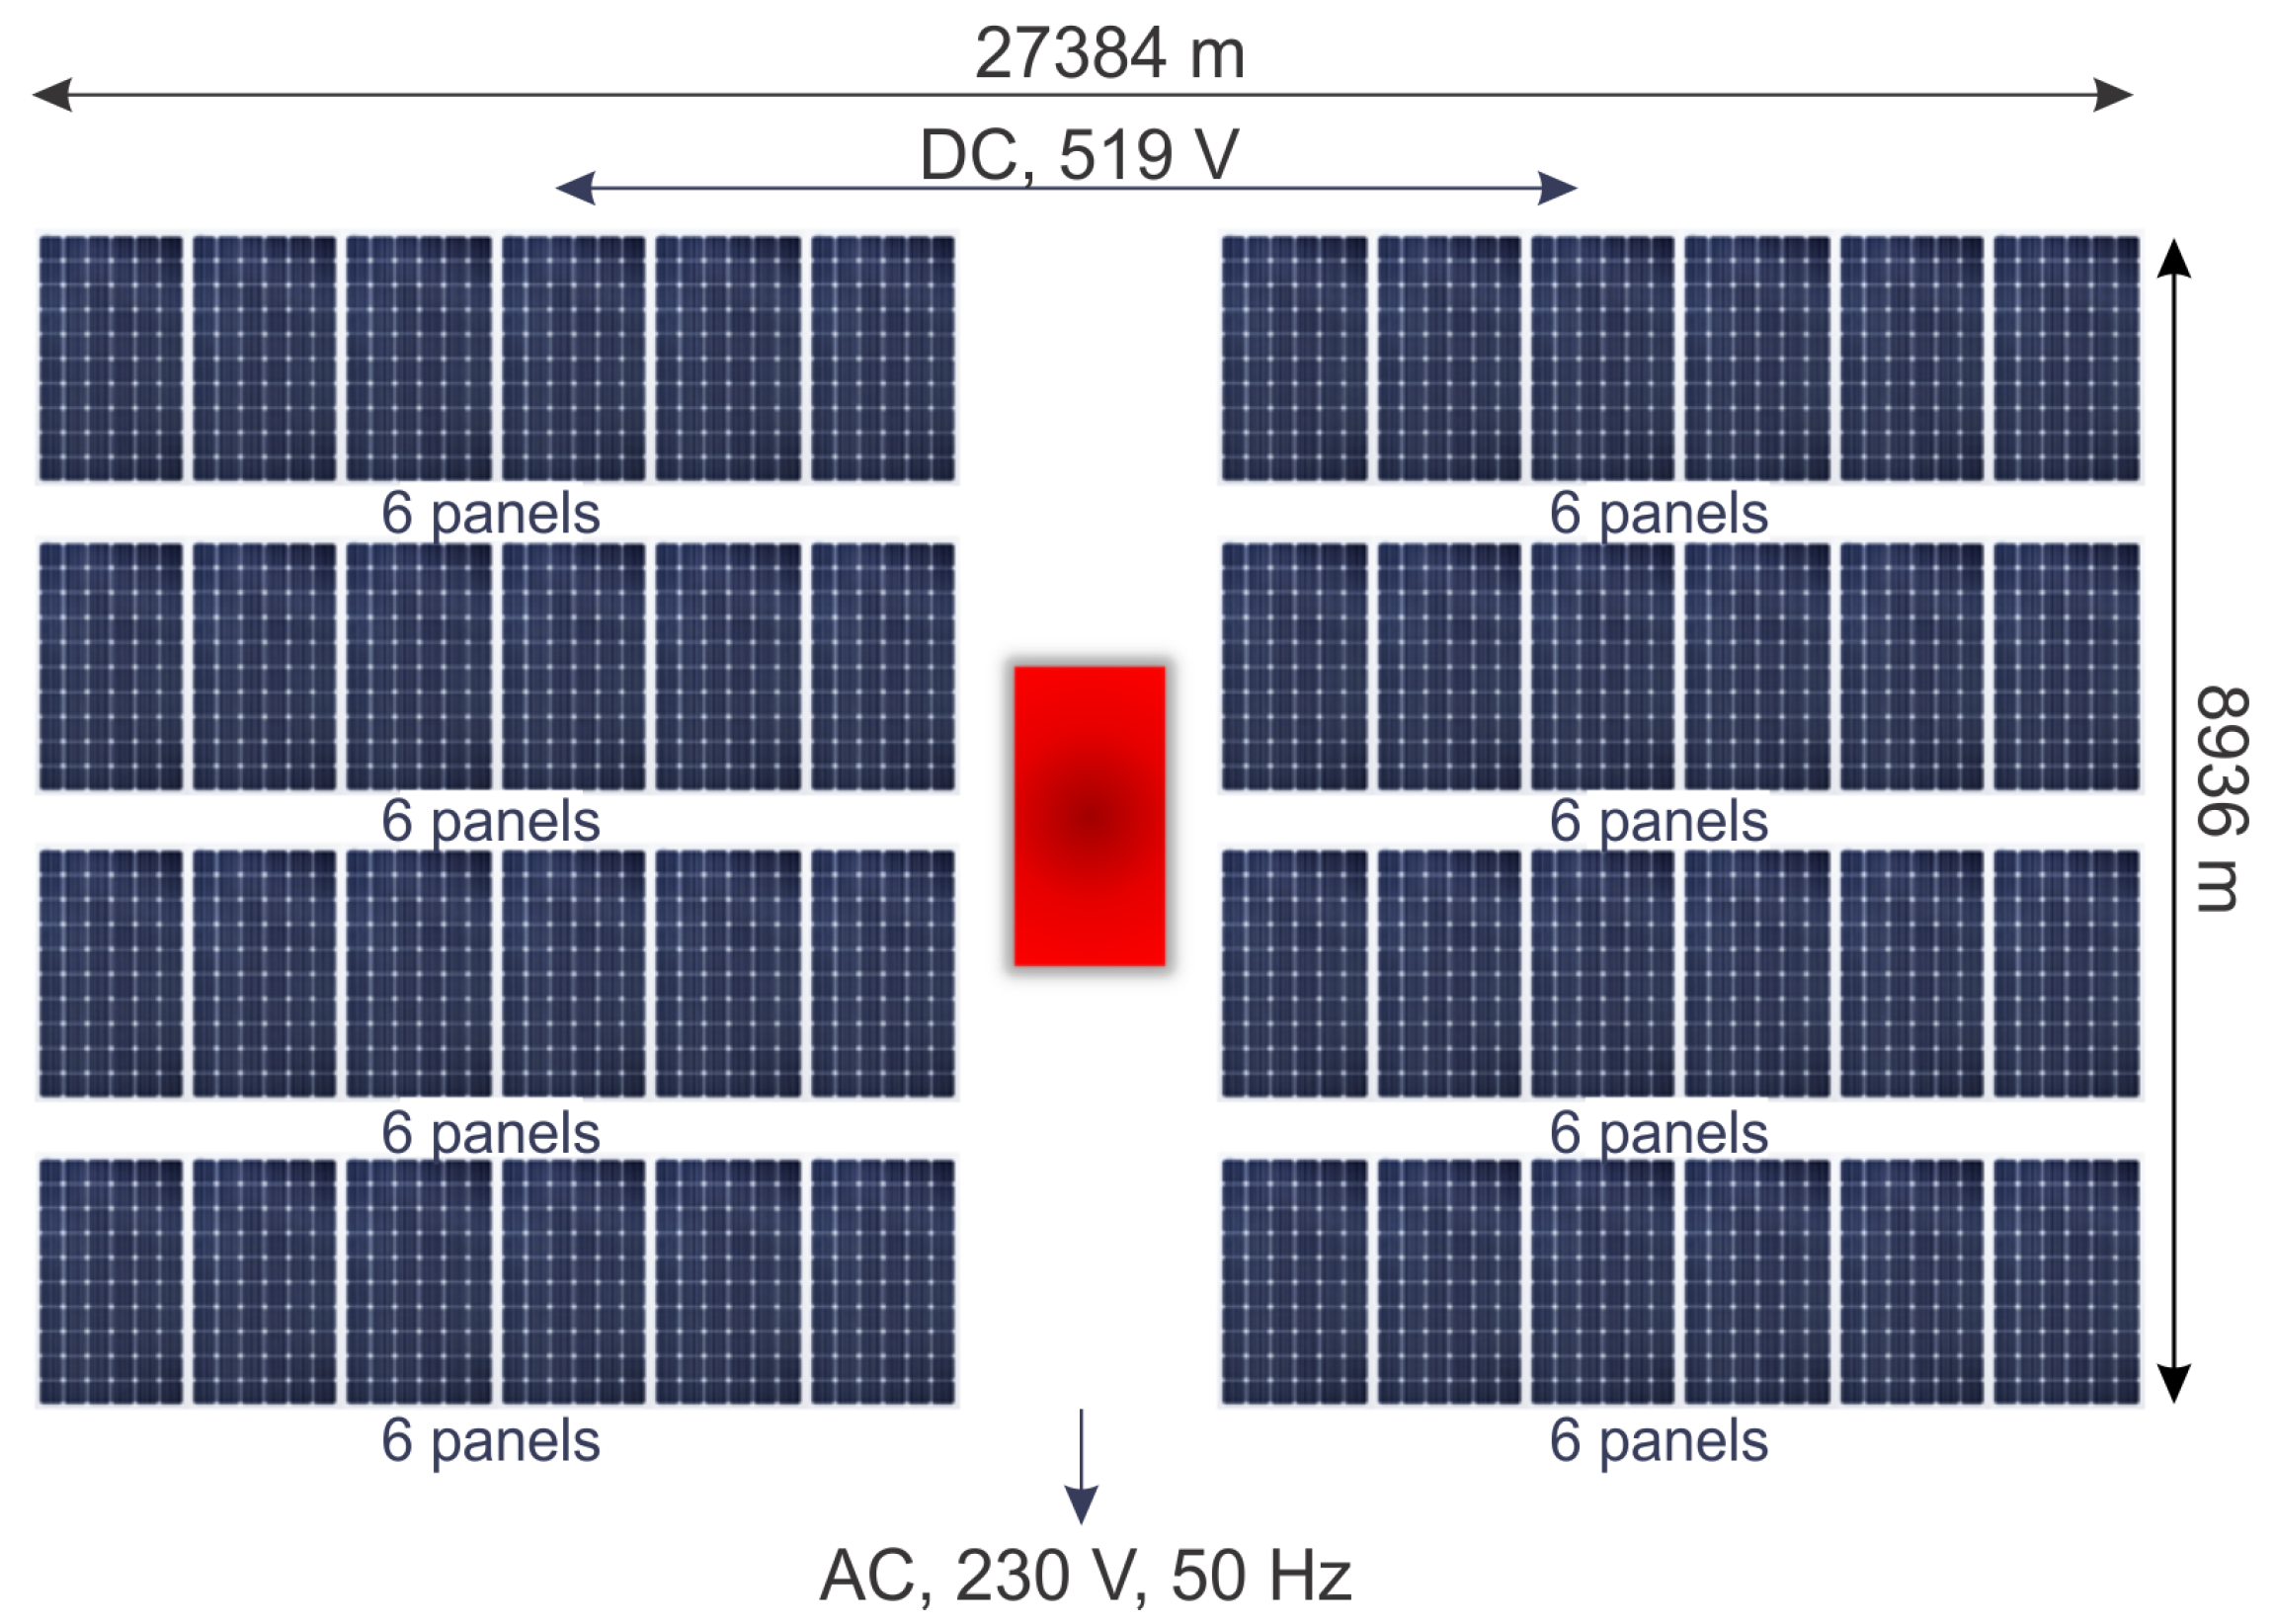
One field can be configured as a rectangle (number of rows n r times the number of panels n p , i.e., n r × n p ): 2 × 24 , 4 × 12 , and 8 × 6 . With these configurations, the use of available space is optimized and the lengths of DC cables are minimized. The total area for one field (the area covered by one inverter) is calculated as follows:
A p = a · b = [ ( D + 0.1 ) · n r ] b = = [ n p · ( L + 0.1 ) + 1 ] ,
where L = 2.182 m is the length of the solar panel and D = 1.884 m is the spacing between rows. Due to the vibration of the structure on the water, 10 as the spacing between panels in a row is added and 10 as the minimum spacing between rows. Length of 1 m is also added for the channel for AC cables and inverter placement. The occupied area of one field with a 4 × 12 configuration is 244.7 m2 (Figure 5).
The required number of fields, or the number of inverters, is determined based on the total power requirement (3 MW) and the power of one field (20 kW) as follows:
N P = P P P .
The required area for a 3 MW PV plant is determined as follows:
A = N P · A p = 36 , 705 m 2 .
The hexagonal platform design is chosen with the idea of multifunctional use of the floating platform, which in addition to generating electrical energy from the PV plant, will offer other amenities. Therefore, for the total area of the hexagonal platform, the previously obtained A extended for edges, combined with AT, where AT is the area intended for commercial and recreational activities, will be considered. The choice of AT will be adjusted in this phase to the geometry of the platform and the format of the PV field defined by one inverter for easy installation of the plant. Now, determining the side length of the platform (R) boils down to solving the task: determine the minimum R that provides the required area for the PV plant (A) and the length of the side that equals a whole number of half the length of one inverter PV field ( 4 × 12 ). This half is included because a 6 × 8 configuration is also planned. The solution to this task yields R = 137 m. Now, the total area of the platform is 48,162.48 m2.
The length of DC cable required for wiring one field (one inverter, 48 panels) is calculated as follows:
L DC = N S N SP ( L + 0.4 ) + N S r ¯ = 144   m ,
where N S = 4 is the number of strings, N SP = 12 is the number of solar panels in a string, L = 2.182   m is the length of a panel, r ¯ = 5   m is the average distance between DC terminals of the inverter from the ( + , ) ends of individual strings. To the length L required to connect two panels, 0.4 m is added for thermal and mechanical cable stress. To have r ¯ at a minimum, it is necessary to connect the strings in a field according to the example shown in Figure 6.
Several configurations, based on six solar modules in a string that will provide good space filling, are possible. This way, the length of DC cables is minimized [62].
The total length of DC cables for a 3 MW module is as follows:
L DCU = N P L DC = 21 , 600 m .
The type of DC cable is chosen based on the voltage and current characteristics on the DC side [63]. For the purposes of this work, TUV 1 × 4 mm2 cable is selected.
The characteristics of the DC cable are given in Table 3 [64].
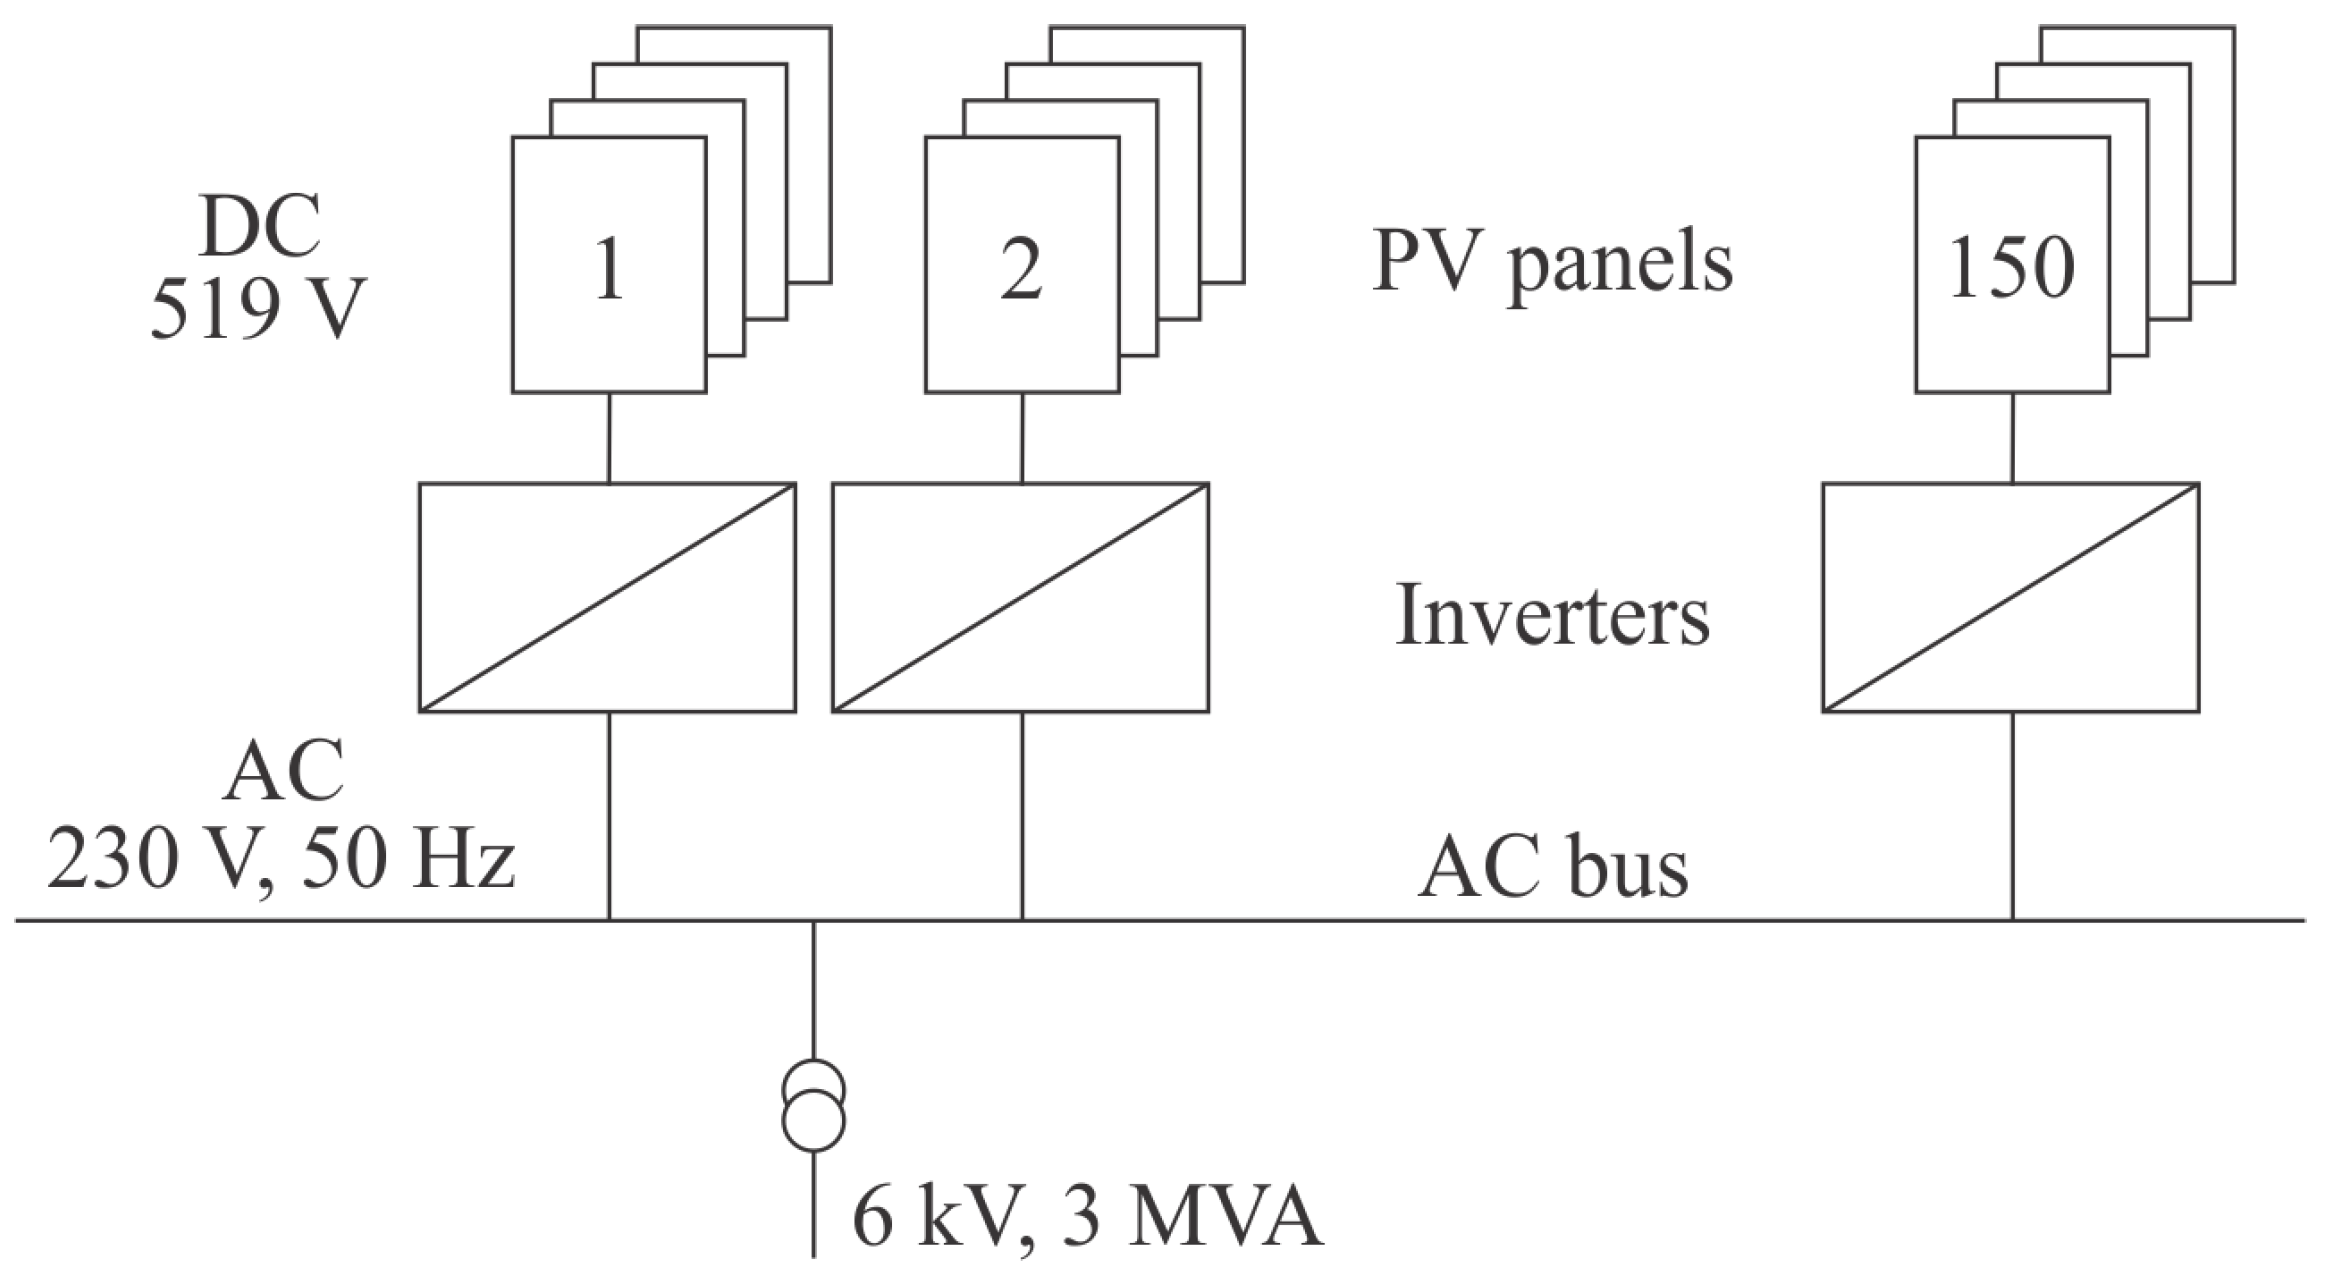
Transformers 230 V/6 KV, 3 MVA are installed as close to the plant as possible to reduce losses. The maximum usable output power of the inverter is 20 kVA, which gives a maximum current per phase of 28.98 A for a voltage of 230 V. Based on this current increased by 2, AC cables are chosen. Cable H07BN4-F is selected, the characteristics of which are given in Table 4 [65].
This is a flexible multi-core cable with a nominal current of 50 A.
The total length of AC cables is calculated using the formula:
L AC = N P S ,
where N P is the number of inverters (the number of fields), and S is the average distance from an individual inverter to the transformer station.
The transformer can be positioned within the circle that describes the hexagonal platform, ensuring a distance of at least 2 m from the platform to provide flexibility for platform movement due to water fluctuation. Additionally, there should be some flexibility in the cable connection between the platform and the substation to accommodate longer cable lengths and allow for movement.
The average cable length can be calculated using the formula:
S = d 0 + x ¯ + y ¯ ,
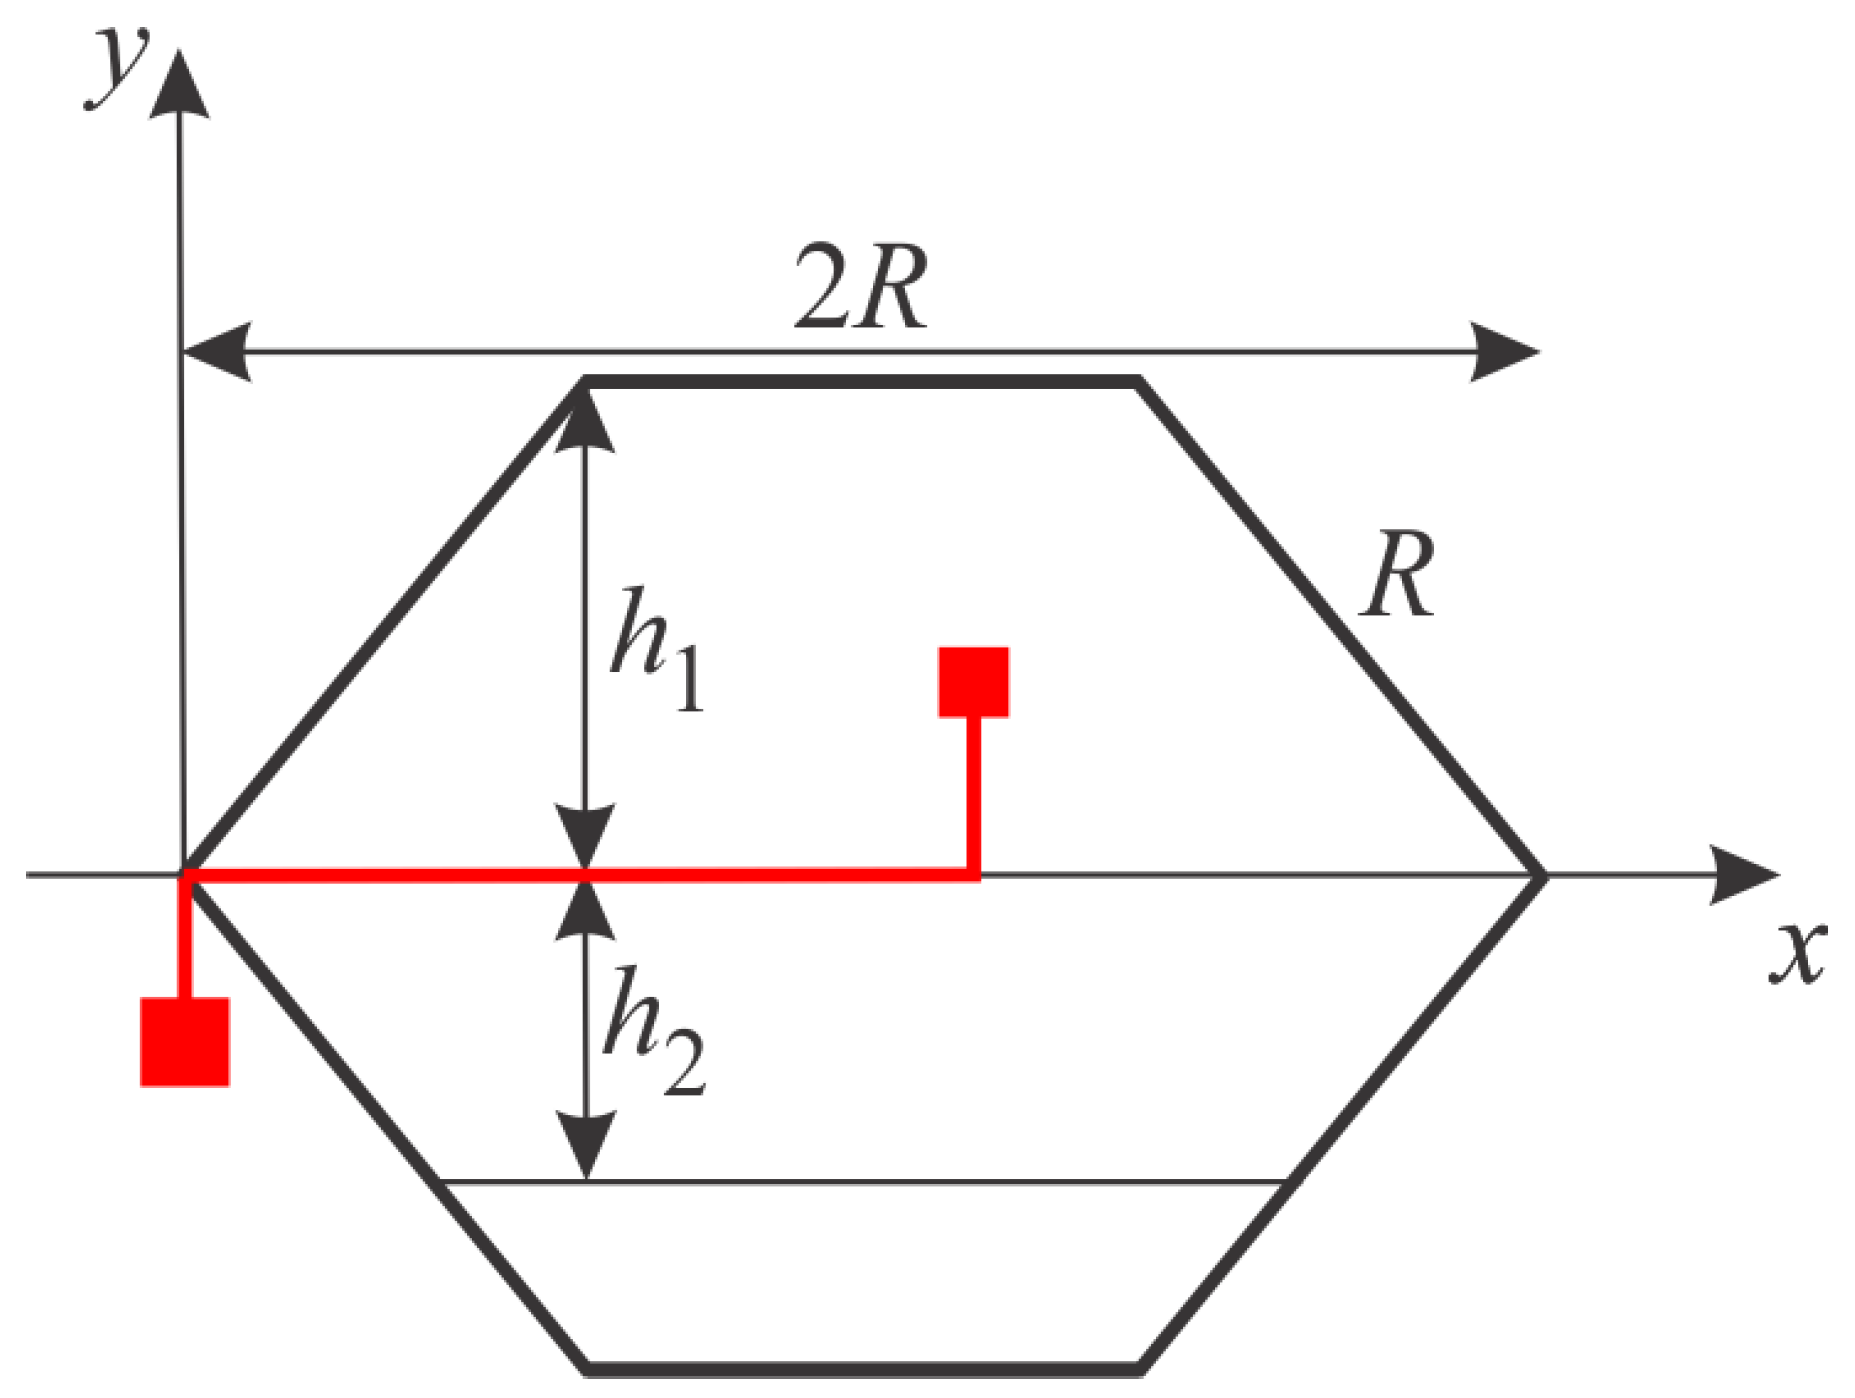
where d 0 is the distance from the edge of the platform to the substation platform (assuming 5 m), x ¯ is the average cable distance along the conductor and y ¯ is the average cable distance along the axis normal to the conductor (as shown in Figure 7).
If there is a large number of inverters that are evenly distributed over the area of interest, then without making a significant error, the problem is considered in the continuous domain. Now, the average distance between evenly spaced points along the x-axis within a length of 2 R is given as an integral (sum) of all lengths over 2 R divided by the total length of 2 R . This yields:
x ¯ = 1 2 R 0 R x d x = R .
Similarly, the distances along the y-axis depend on x ( y = f ( x ) ), and the average distances along the x-axis with respect to y are integrated. Finally, it is divided by the total number of points or the area of interest. This results in the following:
y ¯ = 1 2 0 2 R f ( x ) 2 d x 0 2 R f ( x ) d x .
By incorporating f ( x ) (the boundary of the platform) for the upper and lower surfaces, it yields:
y ¯ u = 0.375 R , y ¯ d = 0.302 R , S u = d 0 + x ¯ + y ¯ u = d 0 + 1.375 R = 193.37   m , S d = d 0 + x ¯ + y ¯ d = d 0 + 1.302 R = 183.37   m , L ACu   = N Pu S u = 89 S u = 17 , 209.93 m , L ACd   = N Pd S d = 61 S u = 11 , 185.57 m , L AC   = L ACu + L ACd = 28 , 395.5 m .
The selected inverters on the AC side provide an alternating voltage of 230 V, 50 Hz synchronized with the grid to which they are connected. Since this is a high-power plant (3 MW), the connection to the grid will be made through a 230 V/6 KV transformer with a capacity of 3 MVA (Figure 8).
Further connections can be made from 6 KV/35 KV to the distribution network or 6 KV/110 KV to the transmission network, but these aspects will not be discussed here.

3.2. System Geometry

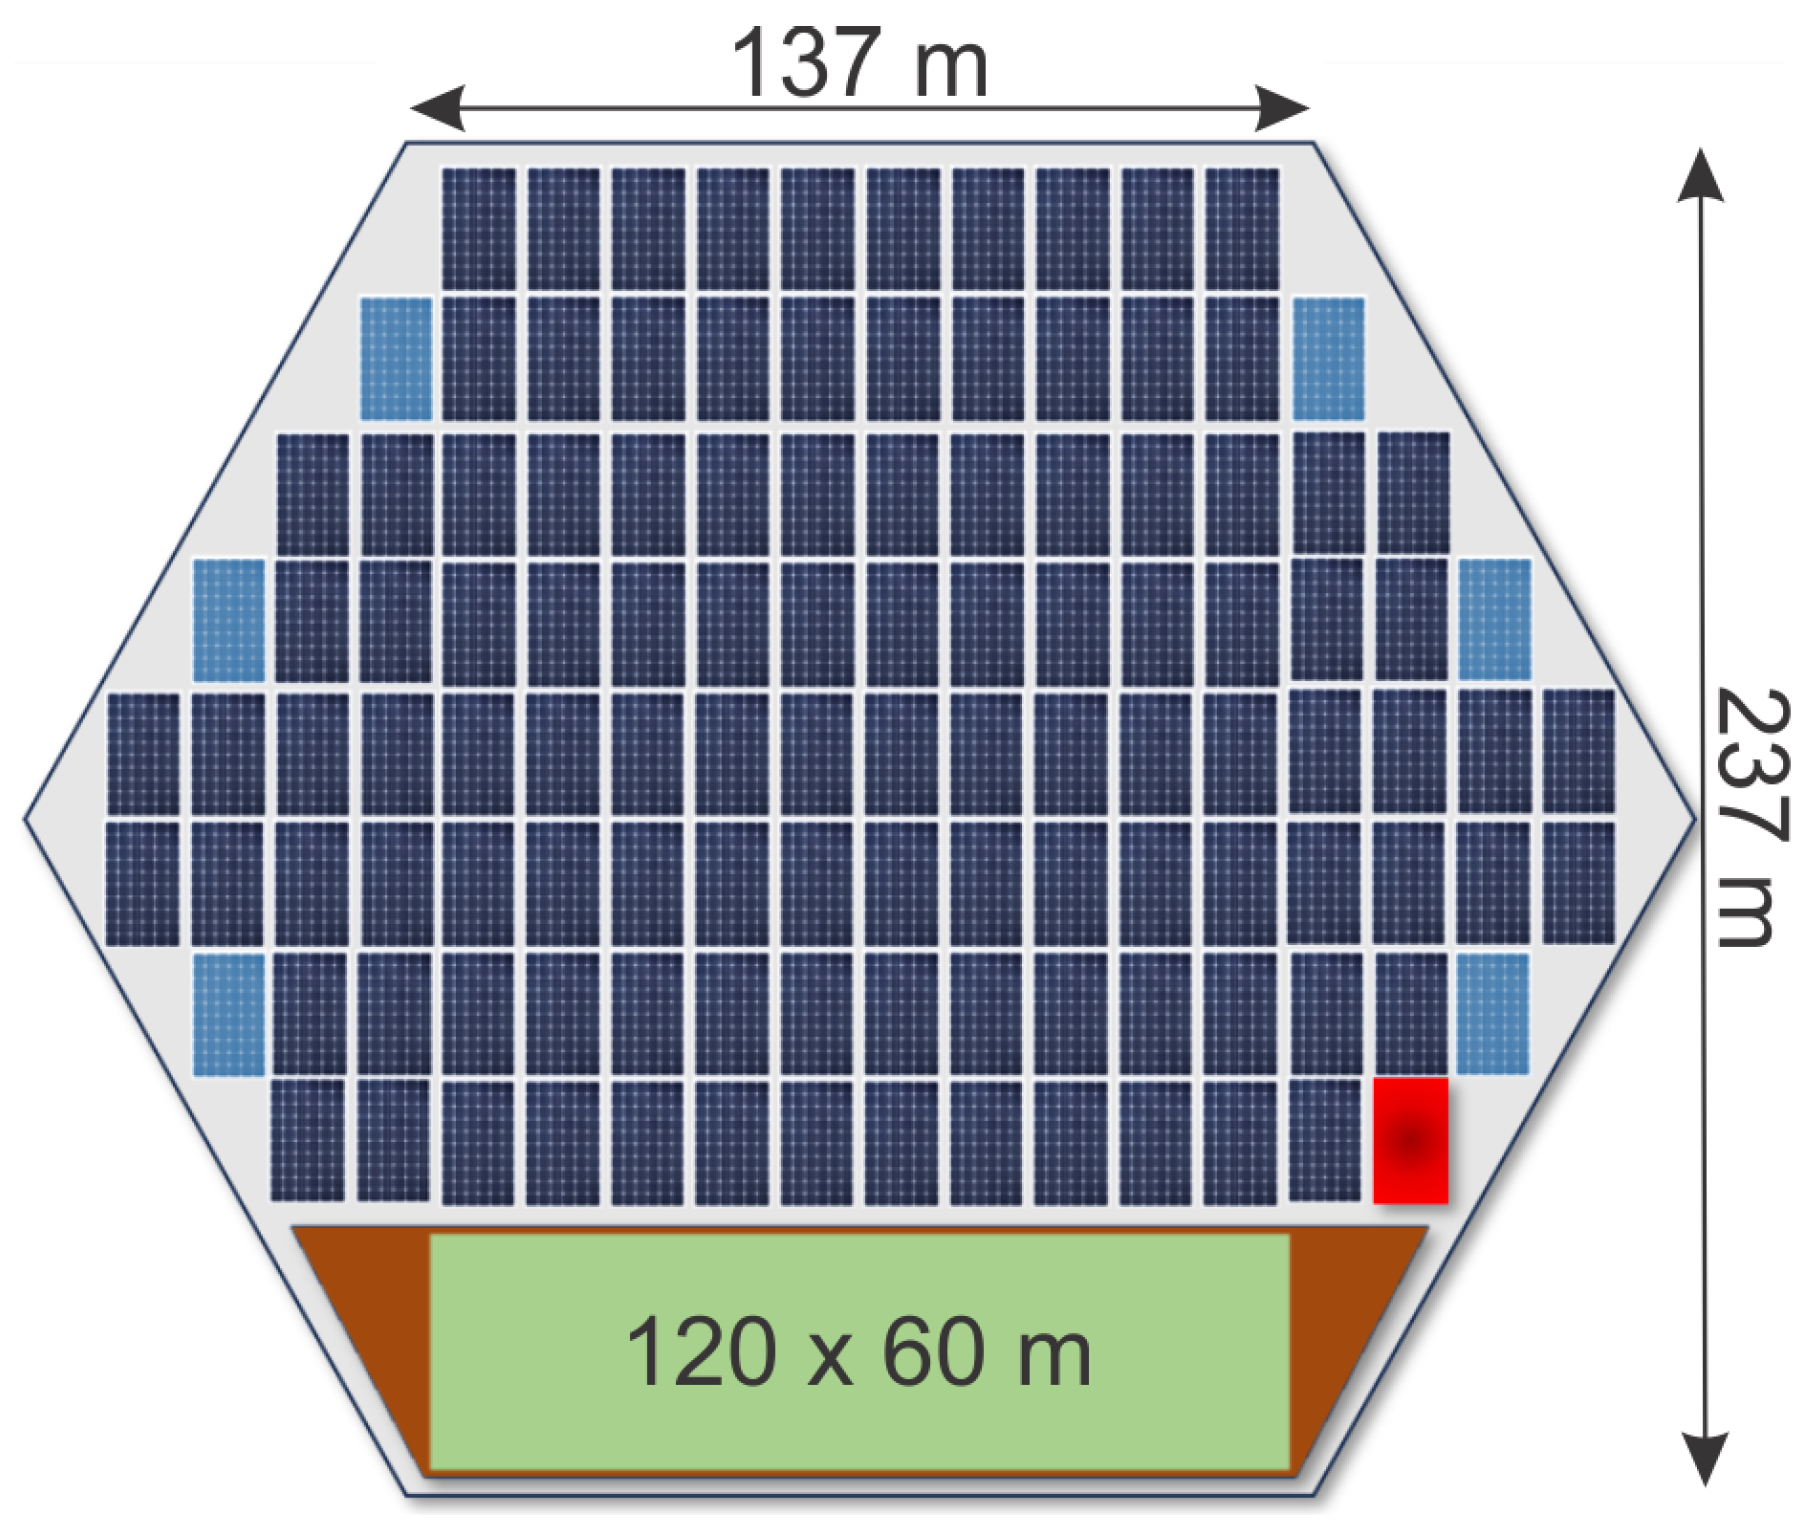
The considered PV system is of a modular type. Each module is hexagonal, as shown in Figure 9.
The base of the module measures 137 m. The module’s surface area is 48,162.48 m2, of which 36,705 m2 are dedicated to the PV installation, 7200 m 2 are allocated for recreational and tourist hospitality services, 4237 m 2 for protective zones and pathways. The recreational space is formed by interconnected links, covered with waterproof veneers where tables, lounge chairs, umbrellas, seating, sports facilities, bleachers, and similar amenities can be placed.
Eight basic modules are connected to form a cluster. Six of these modules create a ring with a pool (lake water) at its center, covering an area of 48,162 m2. The total area of the cluster, including the pool, amounts to 433,485 m2. This complex can accommodate up to 320 guests, gathering around various activities such as concerts, bleachers, competitions, yoga, discos, and more.
The economic segment (E) is rectangular, measuring 60 × 120   m . Within the 60 × 80   m r area inside the economic segment, most sports courts can be established, including tennis, small football, volleyball, handball, basketball, and others. With the appropriate netting to prevent balls from leaving the playing area, this space offers a potentially cost-effective and suitable venue for various sports. Since the surface is not completely fixed and will vibrate by the water movement, it introduces an element of uncertainty into ball movement, making the outcomes more unpredictable and therefore more engaging for participants.
There are numerous business opportunities associated with this concept. With a quality business initiative and the support of the local community, everyone can find interest in such a project. Generating green energy, reducing CO2 emissions, providing space for business ideas, increasing employment, encouraging population growth, offering cultural and sports activities, and spending time outdoors are some of the key points that can help promote such projects within the local community.
Figure 10 shows the structure of one cluster with the corresponding dimensions.
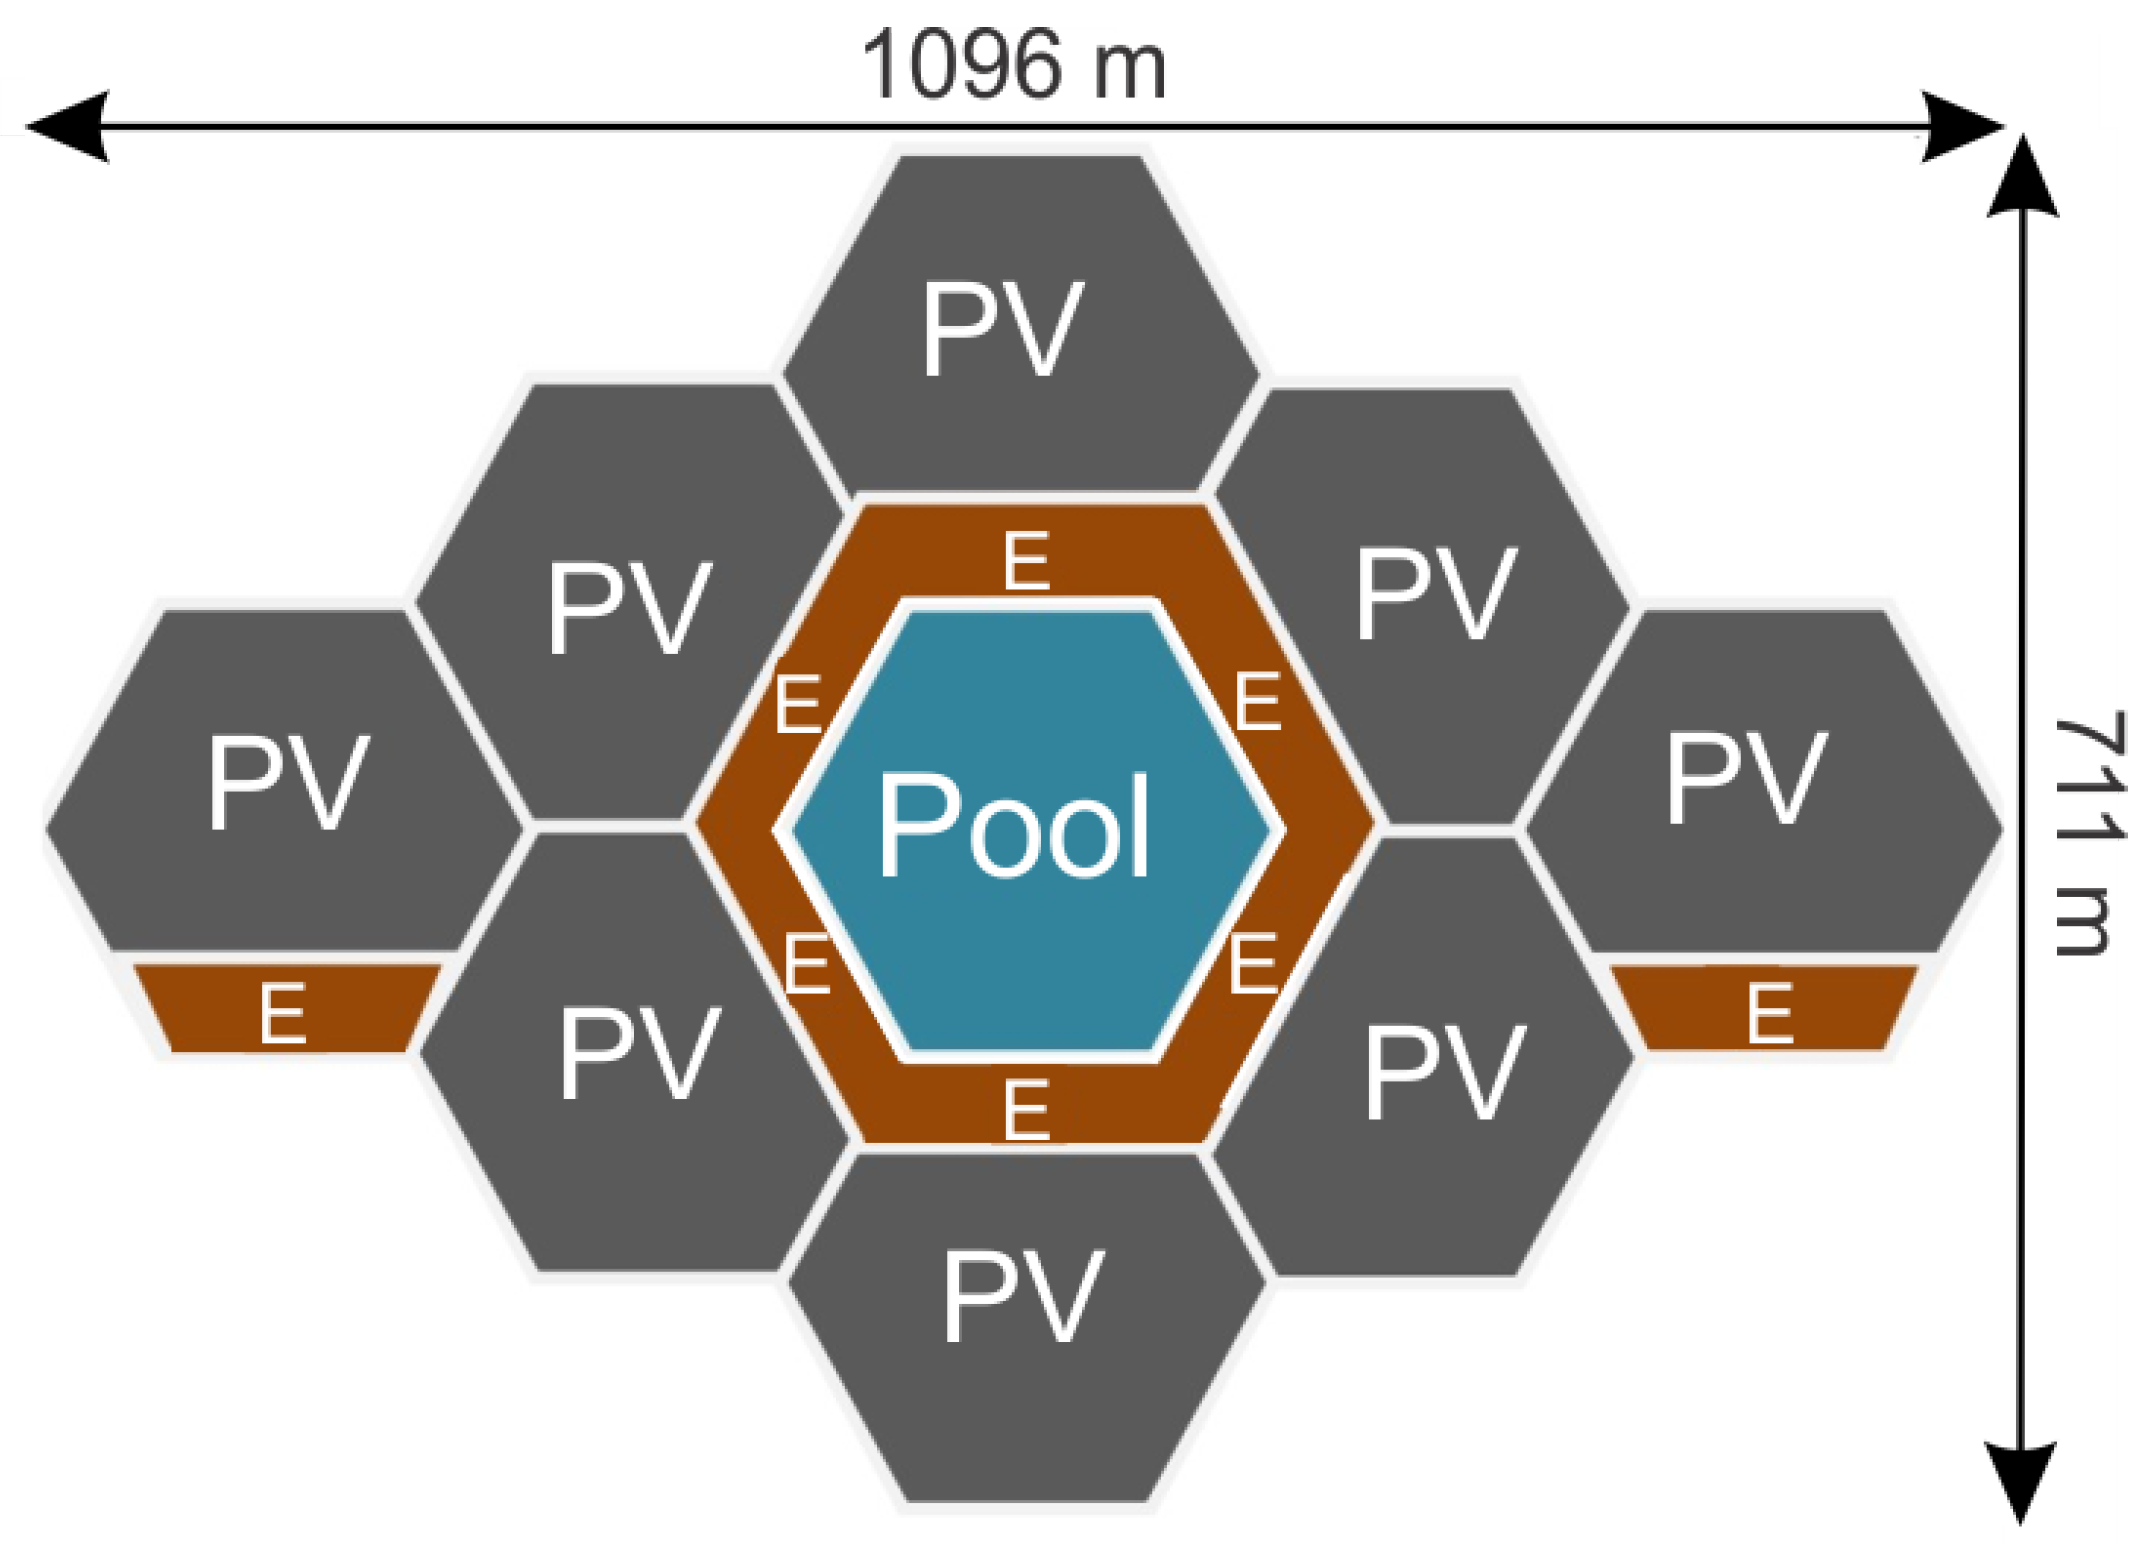
Figure 11 displays the structure of the complete system with the corresponding dimensions.
The entire system, including the water surface of the water channel situated between two L-shaped complexes, covers an area of 6234 km2, which represents less than 12% of the total lake area.
Figure 12 illustrates the system’s position on the lake with its connection to the power grid (EES).

4. Techno-Economic Analysis of the Designed System

Aggregate parameters for the base module of 3 MW are presented in Table 5.
The investment cost is determined as the sum of all construction expenses, including design, permitting, assembly, materials, supervision, and insurance [4,5,10]. Table 6 provides the relative relationship between individual items for installations > 2   MW of this kind.
In the previous calculation, the cost of equipment is obtained, which includes panels, inverters, and cables. Using the relative ratios for other costs according to Table 6, it is possible to plan the remaining costs according to Table 7.
In the wiring item, in addition to the cost of DC and AC cables, costs for connectors, surge arresters, grounding, lightning protection, and overcurrent protection are included.
As a measure of the relative efficiency of a PV plant, the Levelized Cost of Electricity (LCoE) is used, which represents the levelized unit cost of producing one kilowatt-hour of electrical energy. LCoE can be calculated from Life Cycle Cost (LCC) and Life Cycle Energy Production (LCEP)
LCoE = LCC LCEP ,
with
LCC = I + i = 1 r C i + i = 1 N C 0 ,
LCEP = i = 1 N EP i ,
where I is the investment value, r is the loan repayment period, N is the operational period of the PV system, C i is the annual interest amount, C 0 is the annual maintenance cost, EP i is the annual production. According to the report generated by Solargis, with such technical characteristics, the PV system can produce 94,637,385.58 MWh of electrical energy over a 25-year operational period. Considering the available equipment prices (panels, inverters, cables) and adhering to the proportional relationships of other investment costs, the total investment value is 3,097,750 €. With 20% equity capital, a repayment period of 12 years, and an interest rate of 3.2%, the credit costs (interest) amount to 1,138,335 €, and the maintenance costs are 1,176,750 €. The maintenance costs include annual expenses of 30,000 € (cleaning, visual inspection, etc.) and additional costs for replacing all 150 inverters once during the operational period. The LCoE now amounts to 0.05719 €/kWh.
An analysis of the operation of the hybrid system HPP Orlovac and the designed FPV Buško Lake has been carried out. HPP Orlovac is used within HPP for daily, weekly, and seasonal power balancing. It is also used for tertiary regulation. According to the production plan or at the operator’s request for the activation of tertiary reserves, HPP Orlovac activates the necessary power, which ranges within the available scope from 0 MW to 237 MW. HPP Orlovac is connected to the Croatian power system via a 220 k V transmission line. It is assumed that the capacity of this line is dimensioned according to the maximum production of HPP Orlovac, so it amounts to 237 MW. The maximum power that the hybrid HPP+FPV system can deliver to the power system is 237 MW. The minimum and maximum accumulation levels of Buško Lake are 712 m and 718 m . With an accumulation area of 55.8   k m 2, the theoretical usable accumulation is 334.8 × 10⁶ m 3 . In reality, the usable accumulation is somewhat lower due to water evaporation and underground leakage.
The number of working hours of HPP at maximum power is as follows:
NH HPP = W HPP P rHPP = 1489   h ,
where W HPP is the annual generated electrical energy, and P rHPP is the rated power of the HPP.
The number of working hours of FPV at maximum power is as follows:
NH FPV = W FPV P rFPV = 1347   h ,
where W FPV is the annual generated electrical energy, and P rFPV is the rated power of the FPV.
The average flow rate of the turbines at HPP Orlovac is 11.89   m 3 s−1. The level of the hydro accumulation of Buško Lake will vary depending on the production of the hybrid system and the inflow. If production at HPP stops completely in a certain period and the natural inflow is equal to the annual average, then the daily rise in the lake level is 18 c m . This allows for a maximum accumulation of 33 days at average inflow when HPP production is halted. Similarly, the number of days the total accumulation can be depleted at maximum production for 12 h outside the FPV production period is 110 days.
A special advantage of the hybrid system is the ability to plan production with a high degree of reliability. Figure 13 shows the production planning situation for three characteristic cases: a sunny day, a cloudy day, and a partly cloudy day. For a sunny day, the possibility of predicting production from FPV is feasible with a high degree of match. On a cloudy day, the dominant component of solar radiation is the diffuse component, whose contribution does not exceed 20% of the maximum [67]. In this case, for the prediction of FPV, 20% of the amount for a sunny day can be taken, and the difference that appears can be compensated from HPP. This ensures excellent predictability. On a partly cloudy day, the prediction for FPV can be taken the same as on a sunny day, and the difference that appears is compensated by HPP. Such an approach is needed to ensure quality hourly production forecasting because the weather forecast for this case cannot determine the hourly periods of sunshine and cloudiness with sufficient reliability. The diagrams in Figure 13 show the planned production of FPV+HPP, realized production of FPV, required production of HPP, available tertiary reserve of HPP.
In Table 8, the aggregate data comparison of FPV and HPP in separate operations versus the hybrid operation of HPP+FPV is shown. Compared to standalone HPP, the hybrid system:
-
increases production by 91%,
-
keeps the maximum production the same, conditioned by the available capacity of the transmission line,
-
increases the number of full load working hours (237 MW) to 2852, or by 91.5%,
-
achieves excellent predictability compared to standalone FPV, which has poor predictability,
-
sees the daily period of available tertiary reserve decrease by 12 h, corresponding to the period when FPV production is expected.
Although this may seem like a drawback, in reality, during the operation period of FPV in the power system in which the presence of PV is significant, the need for tertiary reserve is small. Typically, this can lead to an excess of electrical energy.

5. Conclusions

In this paper, a meticulous design of a 240 MW hybrid and modular Floating Photovoltaic (FPV) system on Buško Lake was undertaken. This innovative system integrates solar energy production with tourist and recreational facilities, presenting a sustainable approach to energy development. The modular design, with a fundamental module of 3 MW, fosters participation from multiple investors and ensures scalability and adaptability. The analysis indicates a competitive production cost of electricity per kilowatt-hour (LCoE) at 0.05719 €/kWh, affirming the economic viability of the FPV system. With a footprint below 12 % of the lake’s surface, minimal disruption to the ecosystem is ensured. Integration with the Orlovac HPP optimizes resource utilization and enhances the available number of hours of the integrated system in a maximum power regime. This synergy enables efficient energy management, enhancing overall system reliability. The research introduces a modular concept, fostering diversified investment and broader involvement in renewable energy projects. Integration with existing infrastructure enhances energy production capacity and resource optimization. Flexible production planning ensures efficient operation, adapting to demand fluctuations. Integration of renewable energy sources stimulates local economic growth and promotes sustainable development. In conclusion, this study underscores the potential of FPV systems to revolutionize the energy landscape, offering a sustainable, economically viable, and socially inclusive solution for meeting regional energy needs. Through innovative integration and prudent resource management, a brighter sustainable future powered by renewable energy is envisioned.

Author Contributions

Conceptualization, M.M. and A.A.; methodology, S.K. and S.G.; software, V.H. and A.F.; validation, A.A., S.G. and M.M.; formal analysis, V.H. and M.M.; investigation, M.M.; resources, S.G.; data curation, M.M. and A.F.; writing—original draft preparation, M.M. and A.A.; writing—review and editing, S.K., S.G. and V.H.; visualization, A.F.; supervision, S.K.; project administration, S.G.; funding acquisition, A.A. All authors have read and agreed to the published version of the manuscript.

Funding

This research received no external funding.

Institutional Review Board Statement

Not applicable.

Data Availability Statement

The data that support the findings of this study are available from the corresponding author upon reasonable request.

Conflicts of Interest

The authors declare no conflicts of interest.

Abbreviations

The following abbreviations are used in this manuscript:
FPVfloating photovoltaic
PVphotovoltaic
HPPhydroelectric power plant
PSpumping station
IRENAInternational Renewable Energy Agency
PHESSPumped Hydroelectric Energy Storage Systems
UVultra-violet
MPPTmaximum power point tracking
DCdirect current
ACalternating current
BoSbalance of system
LCoElevelized cost of electricity
LLClife cycle cost
LCEPlife cycle energy production

References

  1. Rahman, S.; de Castro, A. Environmental impacts of electricity generation: A global perspective. IEEE Trans. Energy Convers. 1995, 10, 307–314. [Google Scholar] [CrossRef]
  2. Wilson, G.M.; Al-Jassim, M.; Metzger, W.K.; Glunz, S.W.; Verlinden, P.; Xiong, G.; Mansfield, L.M.; Stanbery, B.J.; Zhu, K.; Yan, Y.; et al. The 2020 photovoltaic technologies roadmap. J. Phys. Appl. Phys. 2020, 53, 493001. [Google Scholar] [CrossRef]
  3. Hemeida, M.G.; Hemeida, A.M.; Senjyu, T.; Osheba, D. Renewable Energy Resources Technologies and Life Cycle Assessment: Review. Energies 2022, 15, 9417. [Google Scholar] [CrossRef]
  4. Hannah, R.; Max, R.; Rosado, P. Renewable Energy, Our World in Data. 2020. Available online: https://ourworldindata.org/renewable-energy (accessed on 15 January 2024).
  5. IRENA. Renewable Power Generation Costs in 2021; International Renewable Energy Agency: Abu Dhabi, United Arab Emirates, 2022. [Google Scholar]
  6. Pašalić, S.; Akšamović, A.; Avdaković, S. Floating Photovoltaic Plants on Artificial Accumulations — Example of Jablanica Lake. In Proceedings of the 2018 IEEE International Energy Conference (ENERGYCON), Limassol, Cyprus, 3–7 June 2018; pp. 1–6. [Google Scholar] [CrossRef]
  7. Durković, V.; Đurišić, Ž. Analysis of the Potential for Use of Floating PV Power Plant on the Skadar Lake for Electricity Supply of Aluminium Plant in Montenegro. Energies 2017, 10, 1505. [Google Scholar] [CrossRef]
  8. Nguyen, N.H.; Le, B.C.; Nguyen, L.N.; Bui, T.T. Technical Analysis of the Large Capacity Grid-Connected Floating Photovoltaic System on the Hydropower Reservoir. Energies 2023, 16, 3780. [Google Scholar] [CrossRef]
  9. Gorjian, S.; Sharon, H.; Ebadi, H.; Kant, K.; Scavo, F.B.; Tina, G.M. Recent technical advancements, economics and environmental impacts of floating photovoltaic solar energy conversion systems. J. Clean. Prod. 2021, 278, 124285. [Google Scholar] [CrossRef]
  10. Ramasamy, V.; Margolis, R. Floating Photovoltaic System Cost Benchmark: Q1 2021 Installations on Artificial Water Bodies; National Renewable Energy Lab. (NREL): Golden, CO, USA, 2021. [CrossRef]
  11. Gadzanku, S.; Mirletz, H.; Lee, N.; Daw, J.; Warren, A. Benefits and Critical Knowledge Gaps in Determining the Role of Floating Photovoltaics in the Energy-Water-Food Nexus. Sustainability 2021, 13, 4317. [Google Scholar] [CrossRef]
  12. Bošnjaković, M.; Santa, R.; Crnac, Z.; Bošnjaković, T. Environmental Impact of PV Power Systems. Sustainability 2023, 15, 11888. [Google Scholar] [CrossRef]
  13. Šantić, A.; Aksamovic, A. Photovoltaic plants in Bosnia and Herzegovina — State and perspectives. In Proceedings of the 2018 41st International Convention on Information and Communication Technology, Electronics and Microelectronics (MIPRO), Opatija, Croatia, 21–25 May 2018; pp. 1501–1506. [Google Scholar] [CrossRef]
  14. Tawalbeh, M.; Al-Othman, A.; Kafiah, F.; Abdelsalam, E.; Almomani, F.; Alkasrawi, M. Environmental impacts of solar photovoltaic systems: A critical review of recent progress and future outlook. Sci. Total Environ. 2021, 759, 143528. [Google Scholar] [CrossRef]
  15. Abid, M.K.; Kumar, M.V.; Raj, V.A.; Dhas, M.D.K. Environmental Impacts of the Solar Photovoltaic Systems in the Context of Globalization. Ecol. Eng. Environ. Technol. 2023, 24, 231–240. [Google Scholar] [CrossRef]
  16. Turney, D.; Fthenakis, V. Environmental impacts from the installation and operation of large-scale solar power plants. Renew. Sustain. Energy Rev. 2011, 15, 3261–3270. [Google Scholar] [CrossRef]
  17. Goldberg, Z.A. Solar energy development on farmland: Three prevalent perspectives of conflict, synergy and compromise in the United States. Energy Res. Soc. Sci. 2023, 101, 103145. [Google Scholar] [CrossRef]
  18. van de Ven, D.-J.; Capellan-Peréz, I.; Arto, I.; Cazcarro, I.; De Castro, C.; Patel, P.; Gonzalez-Eguino, M. The potential land requirements and related land use change emissions of solar energy. Sci. Rep. 2021, 11, 2907. [Google Scholar] [CrossRef] [PubMed]
  19. Bevk, T.; Golobič, M. Contentious eye-catchers: Perceptions of landscapes changed by solar power plants in Slovenia. Renew. Energy 2020, 152, 999–1010. [Google Scholar] [CrossRef]
  20. Vuichard, P.; Stauch, A.; Wüstenhagen, R. Keep it local and low-key: Social acceptance of alpine solar power projects. Renew. Sustain. Energy Rev. 2021, 138, 110516. [Google Scholar] [CrossRef]
  21. Zhang, P.; Yue, C.; Li, Y.; Tang, X.; Liu, B.; Xu, M.; Wang, M.; Wang, L. Revisiting the land use conflicts between forests and solar farms through energy efficiency. J. Clean. Prod. 2024, 434, 139958. [Google Scholar] [CrossRef]
  22. Fiorentini, L.; Marmo, L.; Danzi, E.; Puccia, V. Fire risk assessment of photovoltaic plants. A case study moving from two large fires: From accident investigation and forensic engineering to fire risk assessment for reconstruction and permitting purposes. Chem. Eng. Trans. 2016, 48, 427–432. [Google Scholar]
  23. Ong, N.A.F.M.N.; Sadiq, M.A.; Said, M.S.M.; Jomaas, G.; Tohir, M.Z.M.; Kristensen, J.S. Fault tree analysis of fires on rooftops with photovoltaic systems. J. Build. Eng. 2022, 46, 103752. [Google Scholar]
  24. Liang, Y.; Kleijn, R.; van der Voet, E. Increase in demand for critical materials under IEA Net-Zero emission by 2050 scenario. Appl. Energy 2023, 346, 121400. [Google Scholar] [CrossRef]
  25. Carrara, S.; Alves Dias, P.; Plazzotta, B.; Pavel, C. Raw Materials Demand for Wind and Solar PV Technologies in the Transition Towards a Decarbonised Energy System; Publications Office of the European Union: Luxembourg, 2020. [Google Scholar]
  26. Faircloth, C.C.; Wagner, K.H.; Woodward, K.E.; Rakkwamsuk, P.; Gheewala, S.H. The environmental and economic impacts of photovoltaic waste management in Thailand. Resour. Conserv. Recycl. 2019, 143, 260–272. [Google Scholar] [CrossRef]
  27. Lunardi, M.M.; Alvarez-Gaitan, J.P.; Bilbao, J.I.; Corkish, R. A review of recycling processes for photovoltaic modules. In Solar Panels and Photovoltaic Materials; InTech: London, UK, 2018; Volume 30. [Google Scholar]
  28. Isherwood, P.J. Reshaping the module: The path to comprehensive photovoltaic panel recycling. Sustainability 2022, 14, 1676. [Google Scholar] [CrossRef]
  29. Nkuissi, H.J.T.; Konan, F.K.; Hartiti, B.; Ndjaka, J.M. Toxic materials used in thin film photovoltaics and their impacts on environment. In Reliability and Ecological Aspects of Photovoltaic Modules; IntechOpen: Rijeka, Croatia, 2020. [Google Scholar]
  30. Keeratimahat, K.; Bruce, A.; MacGill, I. Analysis of short-term operational forecast deviations and controllability of utility-scale photovoltaic plants. Renew. Energy 2021, 167, 343–358. [Google Scholar] [CrossRef]
  31. Gao, M.; Li, J.; Hong, F.; Long, D. Short-term forecasting of power production in a large-scale photovoltaic plant based on LSTM. Appl. Sci. 2019, 9, 3192. [Google Scholar] [CrossRef]
  32. Alcañiz, A.; Grzebyk, D.; Ziar, H.; Isabella, O. Trends and gaps in photovoltaic power forecasting with machine learning. Energy Rep. 2023, 9, 447–471. [Google Scholar] [CrossRef]
  33. Polleux, L.; Guerassimoff, G.; Marmorat, J.P.; Sandoval-Moreno, J.; Schuhler, T. An overview of the challenges of solar power integration in isolated industrial microgrids with reliability constraints. Renew. Sustain. Energy Rev. 2022, 155, 111955. [Google Scholar] [CrossRef]
  34. Tajjour, S.; Chandel, S.S. Experimental investigation of a novel smart energy management system for performance enhancement of conventional solar photovoltaic microgrids. Discov. Energy 2023, 3, 8. [Google Scholar] [CrossRef]
  35. Mansouri, N.; Lashab, A.; Guerrero, J.M.; Cherif, A. Photovoltaic power plants in electrical distribution networks: A review on their impact and solutions. IET Renew. Power Gener. 2020, 14, 2114–2125. [Google Scholar] [CrossRef]
  36. Cerchio, M.; Gullí, F.; Repetto, M.; Sanfilippo, A. Hybrid energy network management: Simulation and optimisation of large scale PV coupled with hydrogen generation. Electronics 2020, 9, 1734. [Google Scholar] [CrossRef]
  37. Li, W.; Ren, H.; Chen, P.; Wang, Y.; Qi, H. Key operational issues on the integration of large-scale solar power generation—A literature review. Energies 2020, 13, 5951. [Google Scholar] [CrossRef]
  38. Cazzaniga, R.; Rosa-Clot, M.; Rosa-Clot, P.; Tina, G.M. Integration of PV floating with hydroelectric power plants. Heliyon 2019, 5. [Google Scholar] [CrossRef]
  39. Vourdoubas, J. Integration of Floating Solar Photovoltaic Systems with Hydropower Plants in Greece. Eur. J. Eng. Technol. Res. 2023, 8, 6–12. [Google Scholar] [CrossRef]
  40. Farfan, J.; Breyer, C. Combining floating solar photovoltaic power plants and hydropower reservoirs: A virtual battery of great global potential. Energy Procedia 2018, 155, 403–411. [Google Scholar] [CrossRef]
  41. Silvério, N.M.; Barros, R.M.; Tiago Filho, G.L.; Redón-Santafé, M.; dos Santos, I.F.S.; de Mello Valerio, V.E. Use of floating PV plants for coordinated operation with hydropower plants: Case study of the hydroelectric plants of the São Francisco River basin. Energy Convers. Manag. 2018, 171, 339–349. [Google Scholar] [CrossRef]
  42. Rauf, H.; Gull, M.S.; Arshad, N. Complementing hydroelectric power with floating solar PV for daytime peak electricity demand. Renew. Energy 2020, 162, 1227–1242. [Google Scholar] [CrossRef]
  43. Rauf, H.; Gull, M.S.; Arshad, N. Integrating floating solar PV with hydroelectric power plant: Analysis of Ghazi barotha reservoir in Pakistan. Energy Procedia 2019, 158, 816–821. [Google Scholar] [CrossRef]
  44. Zeidan, M.; Al-soud, M.; Dmour, M.; Alakayleh, Z.; Al-Qawabah, S. Integrating a Solar PV System with Pumped Hydroelectric Storage at the Mutah University of Jordan. Energies 2023, 16, 5769. [Google Scholar] [CrossRef]
  45. Coban, H.H. Hydropower Planning in Combination with Batteries and Solar Energy. Sustainability 2023, 15, 10002. [Google Scholar] [CrossRef]
  46. Kakoulaki, G.; Sanchez, R.G.; Amillo, A.G.; Szabó, S.; De Felice, M.; Farinosi, F.; De Felice, L.; Bisselink, B.; Seliger, R.; Kougias, I.; et al. Benefits of pairing floating solar photovoltaics with hydropower reservoirs in Europe. Renew. Sustain. Energy Rev. 2023, 171, 112989. [Google Scholar] [CrossRef]
  47. Quaranta, E.; Aggidis, G.; Boes, R.M.; Comoglio, C.; De Michele, C.; Patro, E.R.; Georgievskaia, E.; Harby, A.; Kougias, I.; Muntean, S.; et al. Assessing the energy potential of modernizing the European hydropower fleet. Energy Convers. Manag. 2021, 246, 114655. [Google Scholar] [CrossRef]
  48. Sanchez, R.G.; Kougias, I.; Moner-Girona, M.; Fahl, F.; Jäger-Waldau, A. Assessment of floating solar photovoltaics potential in existing hydropower reservoirs in Africa. Renew. Energy 2021, 169, 687–699. [Google Scholar] [CrossRef]
  49. Barbón, A.; Rodríguez-Fernández, C.; Bayón, L.; Aparicio-Bermejo, J. Evaluating the Potential of Floating Photovoltaic Plants in Pumped Hydropower Reservoirs in Spain. Electronics 2024, 13, 832. [Google Scholar] [CrossRef]
  50. Barbón, A.; Gutiérrez, Á.; Bayón, L.; Bayón-Cueli, C.; Aparicio-Bermejo, J. Economic analysis of a pumped hydroelectric storage-integrated floating PV system in the day-ahead Iberian electricity market. Energies 2023, 16, 1705. [Google Scholar] [CrossRef]
  51. Venturini, P.; Gagliardi, G.G.; Agati, G.; Cedola, L.; Migliarese Caputi, M.V.; Borello, D. Integration of Floating Photovoltaic Panels with an Italian Hydroelectric Power Plant. Energies 2024, 17, 851. [Google Scholar] [CrossRef]
  52. Eltamaly, A.M. A novel energy storage and demand side management for entire green smart grid system for NEOM city in Saudi Arabia. Energy Storage 2024, 6, e515. [Google Scholar] [CrossRef]
  53. Goswami, A.; Sadhu, P.; Goswami, U.; Sadhu, P.K. Floating solar power plant for sustainable development: A techno-economic analysis. Environ. Prog. Sustain. Energy 2019, 38, e13268. [Google Scholar] [CrossRef]
  54. Orlovac Hydroelectric Power Plant. Available online: https://bit.ly/OrlovacProduction (accessed on 22 November 2023).
  55. Thin Film Solar Panel Mid Clamp/CE. Available online: https://bit.ly/SICSOLAR (accessed on 16 November 2023).
  56. Floating Solar a Bold and Innovative Solution. Available online: https://bit.ly/CieletTerre (accessed on 22 November 2023).
  57. Sungrow Floating PV. Available online: https://bit.ly/SungrowFPV (accessed on 22 November 2023).
  58. Sungrow Floating Solar Installation. Available online: https://bit.ly/SungrowFPVinstallation (accessed on 22 November 2023).
  59. Jinko Solar Panel Tiger 475 W Mono-Facial. Available online: https://bit.ly/3ujuAfN (accessed on 22 November 2023).
  60. SMA Sunny Tripower 20000TL-3 Phases PV. Available online: https://bit.ly/SMASolar (accessed on 22 November 2023).
  61. Song, J.; Choi, Y. Analysis of the Potential for Use of Floating Photovoltaic Systems on Mine Pit Lakes: Case Study at the Ssangyong Open-Pit Limestone Mine in Korea. Energies 2016, 9, 102. [Google Scholar] [CrossRef]
  62. Akšamović, A.; Konjicija, S.; Odžak, S.; Pašalić, S.; Grebović, S. DC cabling of large-scale photovoltaic power plants. Appl. Sci. 2022, 12, 4500. [Google Scholar] [CrossRef]
  63. Akšamović, A.; Odžak, S.; Tihak, A.; Grebović, S.; Konjicija, S. DC cable cross-section selection for PV plants. In Journal of Physics: Conference Series; IOP Publishing: Bristol, UK, 2022; Volume 2339, p. 012001. [Google Scholar]
  64. 4 mm Single Core TUV H1Z2Z2-K Solar Cable For Solar Panel and Inverter. Available online: https://bit.ly/TUVH1Z2Z2-K (accessed on 16 November 2023).
  65. H07BN4-F (6381TQ) EN 50525-2-21 Flexible Rubber Cable. Available online: https://www.elandcables.com/media/38328/h07bn4-f-6381tq-en-50525-2-21-flexible-rubber-cable.pdf (accessed on 16 November 2023).
  66. Acharya, M.; Devraj, S. Floating Solar Photovoltaic (FSPV): A Third Pillar to Solar PV Sector; The Energy and Resources Institute: New Delhi, India, 2019. [Google Scholar]
  67. Aksamovic, A.; Odžak, S.; Fejzić, A. Measurement of the Diffuse Component of Solar Radiation. In Proceedings of the International Conference on Physical Aspects of Environment, Zrenjanin, Serbia, 24–26 August 2023; p. 11. [Google Scholar]
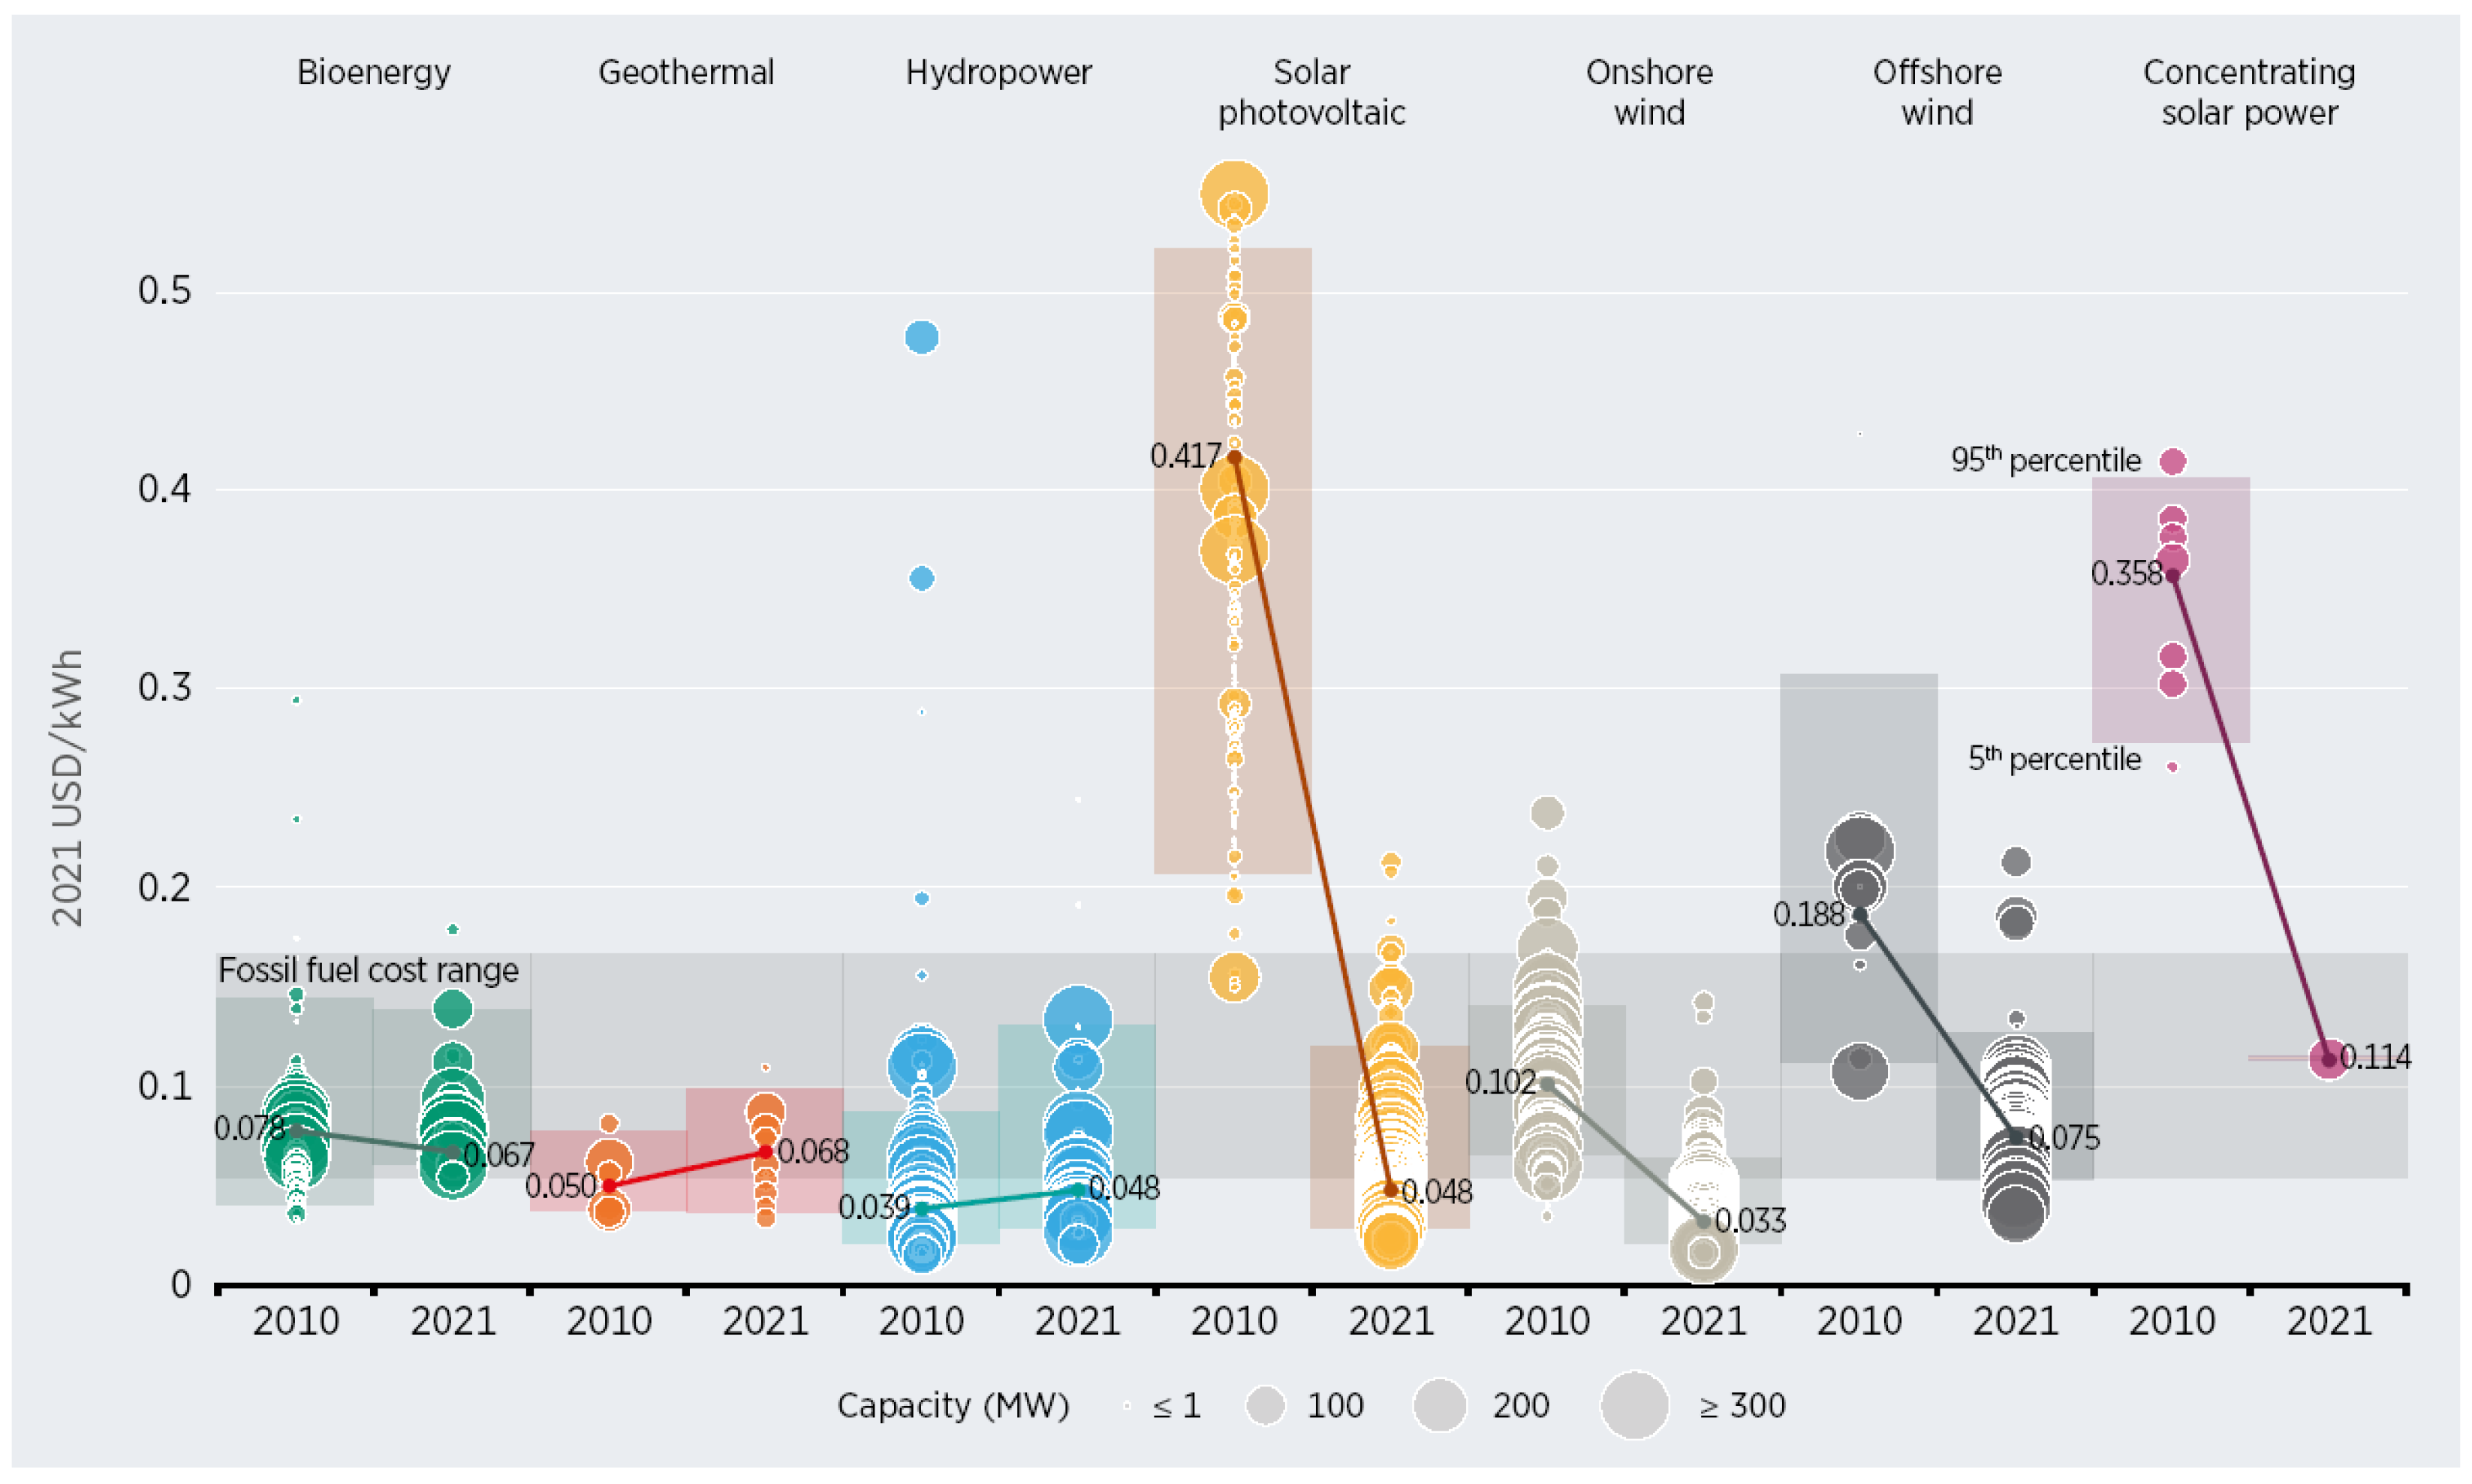
Figure 1. Trends in the production cost of electricity from various renewable sources in the period 2010–2021 [5].
Energies 17 02760 g001
Figure 2. Hydroenergy System of the Orlovac HPP-Buško lake.
Energies 17 02760 g002
Figure 3. Schematic of a typical large-scale FPV system.
Energies 17 02760 g003
Figure 4. Spacing between rows (D) to avoid shading.
Energies 17 02760 g004
Figure 5. Field with one inverter in a 4 × 12 configuration.
Energies 17 02760 g005
Figure 6. Connecting modules within one field in a 4 × 12 configuration.
Energies 17 02760 g006
Figure 7. Calculating the average length of the AC cable.
Energies 17 02760 g007
Figure 8. Single-line diagram of the basic 3 MW module.
Energies 17 02760 g008
Figure 9. Structure of the base module.
Energies 17 02760 g009
Figure 10. Structure of one cluster.
Energies 17 02760 g010
Figure 11. Geometry of the entire facility.
Energies 17 02760 g011
Figure 12. Integration of the entire facility into the Orlovac HPP.
Energies 17 02760 g012
Figure 13. Three typical days (a) sunny day, (b) cloudy day, (c) partly cloudy day, with values of planned production (PP) of FPV+HPP, realized production of FPV (FPV), required production of HPP (HPP), available tertiary reserve (TR).
Energies 17 02760 g013
Table 1. Technical specifications of the JKM470M-7RL3-V solar panel.
ParameterValue
Maximum Power ( P max )470 W
Maximum Power Voltage ( U mp ) 43.28 V
Maximum Power Current ( I mp ) 10.86 A
Open-circuit Voltage ( U oc ) 52.14 V
Short-circuit Current ( I sc ) 11.68 A
Module Efficiency STC (%)20.93%
Operating Temperature 40 °C to 80 °C
Maximum System Voltage1000 V DC
Nominal Operating Cell
Temperature (NOCT)
45 °C ± 2 °C
Dimensions 2182 × 1029 × 40 mm
Mass26.1 kg
Output CablesTUV 1 × 4   m m 2
(+): 290 mm
(−): 145 mm
Price155 €
Table 2. Technical specifications of the SMA Sunny Tripower 20000TL-3 Phases PV inverter.
ParameterValue
Maximum efficiency98.4%
DC input voltage up to1000 V
Power20 kW
U mp voltage range/rated input voltage320 V to 800 V/600 V
Max. input current
input A/input B
33 A/33 A
Module Efficiency STC (%)20.93%
Operating Temperature[ 40 °C, 80 °C]
Maximum System Voltage1000 V DC
Nominal Operating Cell
Temperature (NOCT)
45 °C ± 2 °C
Dimensions (W/H/D)661/682/264 mm
Mass61 k g
Operating temperature range 25 °C to 60 °C
Degree of protectionIP65
Price2845 €
Table 3. Technical specifications of TUV 1 × 4 mm2 DC cable [64].
ParameterValue
Cross section4 mm2
Rate voltage1000 V
Rated current30 A (4 mm2)
Protect degreeIP67
Operating Temperature 40 °C to 90 °C
Contact resistance
of plug connectors
≤5 m Ω
Conductor resistance Ω km −15.09
Price0.22 €/m
Table 4. Technical specifications of AC cable H07BN4-F 5 × 4 mm2 [65].
ParameterValue
Cross section4 mm2
Rate voltage750 V
Rated current50 A (4 mm2)
Protect degreeIP67
Operating Temperature 40 °C to 90 °C
Conductor resistance Ω km −14.95
Price5.02 €/m
Table 5. Summary parameters for the base module of 3 MW model.
ParameterQuantityPrice (€)Total (€)
Number of
inverters
1502845426,750
Number of
panels
72001551,116,000
P max 3 MW
Area of PV36,705 m2
Area of E7200 m2
Total area48,162 m2
Length137 m
Mass
(inverters
& panels)
197,070 kg
DC cable
(1 × 4 mm2)
21,600 m0.224752
AC cable
(4 × 4 mm2)
28,395.5 m5.02142,545.41
Table 6. Relative cost breakdown of FPV plant construction [66].
ParameterValue
Modules35–40%
Inverters8–12%
Wiring10–12%
Anchoring and mooring2%
Floating platform28–35%
BoS (Balance of System)4%
Assembly2%
Table 7. Planned investment costs.
ParameterValue (€)Percentage (%)
Modules1,116,00036.0
Inverters426,75013.8
Wiring350,00011.3
Anchoring and mooring65,0002.1
Floating platform950,00030.7
BoS (Balance of System)125,0004.0
Assembly65,0002.1
Total3,097,750100.0
Table 8. Comparison of hybrid HPP+FPV system and standalone HPP and FPV.
ParameterStandalone FPVStandalone HPPHybrid HPP & FPV
Average annual generation ( GWh )323353676 (+91.5%)
Maximal Power ( MW )240237237 (0%)
Annual working hour at maximal power134514892852 (+91.53%)
Possibility of production planninglowgreatgreat
Daily period of available tertiary reserve0−00−240−6 and 18−24 (−50%)
Disclaimer/Publisher’s Note: The statements, opinions and data contained in all publications are solely those of the individual author(s) and contributor(s) and not of MDPI and/or the editor(s). MDPI and/or the editor(s) disclaim responsibility for any injury to people or property resulting from any ideas, methods, instructions or products referred to in the content.