Article

Self-Scheduling Virtual Power Plant for Peak Management

by
Hossein Shokouhinejad
* and
Eduardo Castillo Guerra
Department of Electrical & Computer Engineering, University of New Brunswick (UNB), Fredericton, NB E3B 5A3, Canada
*
Author to whom correspondence should be addressed.
Energies 2024, 17(11), 2705; https://doi.org/10.3390/en17112705
Submission received: 13 May 2024 / Revised: 29 May 2024 / Accepted: 29 May 2024 / Published: 3 June 2024
(This article belongs to the Special Issue Data Mining Approaches for Smart Grids)

Abstract

:
An efficient and reliable management system for a cluster of distributed energy resources (DERs) is essential for the sustainable and cost-effective peak management (PM) operation of the power grid. The virtual power plant (VPP) provides an efficient way to manage a variety of DERs for the PM process. This paper proposes a VPP framework for PM of local distribution companies by optimizing the self-scheduling of available resources, considering uncertainties and constraints. The study examines two separate scenarios and introduces novel algorithms for determining threshold values in each scenario. An approach is suggested for the transaction between VPP and the aggregator models. The proposed technique intends to determine the optimal amount of capacity that aggregators can allocate for the day-ahead PM procedure while accounting for both thermostatically controlled and non-thermostatically controlled loads. The proposed VPP framework shows promising results for reducing demand charges and optimizing energy resources for PM.

1. Introduction

Peak management (PM) is a fundamental demand-side management (DSM) function to optimize electricity usage during peak demand hours. This tactic provides significant benefits to both utilities and large electricity users. For utilities, PM is applied to maintain the balance between generation and demand, resulting in improved load factor and economical operation of generation. It also provides improved system efficiency and reliability of a power network. Monthly electricity bills of major electricity consumers such as local distribution companies are greatly impacted by the amount of electricity consumption during peak hours. Therefore, implementing PM strategies can significantly reduce costs for these large consumers of electricity.
In general, load shifting and peak shaving are two methods of PM. Load shifting shifts the energy usage to more optimal timeslots. During load shifting, overall electricity consumption stays the same. Flexible loads like thermostatically controlled loads (TCLs) are a group of demand-side resources that can be utilized for load shifting [1,2,3]. On the other hand, peak shaving reduces electricity consumption by adding resources of energy during times of high demand [4]. Conservation voltage reduction (CVR) technique and diesel generators (DGs) are two common resources applied in peak shaving mechanisms [5,6].
Combining and administering all available resources might be a solution to supply energy for PM. Such a solution can be provided by a virtual power plant (VPP), which can be defined as an aggregation of different distributed energy resources (DERs) that operate as a single entity with the aim of optimizing the energy resources [7]. VPPs are categorized into two main classes including technical VPPs and commercial VPPs. A technical VPP is responsible for guaranteeing the technical performance of the power network in order to have a safe, reliable, controllable, and secure operation. It interacts directly with the distribution system operator for power network management purposes. In contrast, a commercial VPP integrates demand response programs and directly interacts with the electricity market. Services or functions from a commercial VPP include trading in the wholesale energy market, balancing trading portfolios, and providing services to the transmission system operator [8].
A considerable number of studies have focused on different methods to deal with the scheduling problem of technical and commercial VPPs [9,10,11,12,13,14,15,16,17,18]. In [9], authors have combined adaptive robust optimization and stochastic programming methods to tackle the optimization problem of a VPP that participates in day-ahead and real-time energy markets. Reference [10] proposes an optimal scheduling for a VPP by formulating the problem as a mixed integer linear programming (MILP). In this study, the virtual power plant consists of a conventional generator, photovoltaic panel, wind turbine, photovoltaic thermal panel, combined heat and power, energy storage system, and boiler. Moreover, the uncertainty of renewable energy resources, market price, and electrical and thermal loads is considered in the scheduling problem. A coordinated control strategy for a VPP contribution to load frequency control is proposed in [11]. In this paper, a multi-objective optimization framework is developed to identify the optimal distribution coefficients of the VPP with a fuzzy satisfying strategy. Game theory is another approach that authors in [12,13] have proposed to deal with the scheduling problem of the VPP. The work of [14] proposes a method to evaluate the aggregated power flexibility of a VPP by formulating the VPP as a virtual generator and a virtual battery. The authors in [15] propose an aggregated low-order model to capture the transient response of a VPP with respect to the contingencies of a power system. Reference [16] proposes a robust optimization model to obtain parameters of the VPP that do not depend on the information of day-ahead energy markets, such as time-varying power bounds and ramp rates. A deep reinforcement learning-based model for a VPP is another approach investigated in [17] in order to optimize the scheduling of DERs, and the bidding strategy for participation in the electricity market. Reference [18] proposes an energy management system to optimize both the day ahead market bidding process and the real-time operation of a VPP, involving photovoltaic (PV) production, a battery energy storage system, and charging stations for electric vehicles.
While several works have focused on different aspects of VPPs (e.g., energy market and frequency regulation), there is no practical framework for self-scheduling and dispatching VPP resources for their participation in PM. The aim of this study is to design a VPP for local distribution networks in order to reduce demand charge by optimal self-scheduling of available resources in the presence of inevitable uncertainties and constraints. To achieve this objective, the initial responsibility of the VPP entails establishing a suitable threshold value, serving as a criterion. This threshold value plays a pivotal role in ascertaining the extent of peak management required during each distinct PM process. Subsequently, VPPs undertake the optimal allocation of their available resources for the purpose of PM, guided by the determined threshold.
The key novelty and contributions of the work developed in this work can be summarized as follows:
  • Two distinct scenarios for PM are outlined and novel algorithms are introduced to ascertain the appropriate threshold value for each scenario.
  • A new proposal is presented for the transaction between VPPs and aggregators through the use of mathematical models that describe the dynamic behavior of aggregators. The proposal introduces an algorithm that identifies the optimal capacity that aggregators can commit for the day-ahead PM process. This approach considers both TCL and non-TCL aggregators.
  • A novel robust optimization framework is developed for the self-scheduling of VPP resources, which determines their contribution to the day-ahead PM process.
The structure of this paper is presented as follows: In Section 2, the materials and methods employed in the study are elaborated upon, encompassing the hypothesis, the design of experiments, the VPP resources, and their corresponding mathematical model. Section 3 introduces a new VPP framework, consisting of algorithms for threshold value determination and day-ahead self-scheduling for PM operation. The results from two experimental analyses are presented and discussed in Section 4. Finally, Section 5 concludes the study.
Notation: The subscripts c, d, u, e, b, h and rb are employed to refer to CVR, diesel generator, utility-scale battery, electric water heater, baseboard heater, heat pump and residential battery, respectively.

2. Materials and Methods

2.1. Hypothesis

The proposed self-scheduling virtual power plant (VPP) framework for PM using robust optimization will result in a significant reduction in electricity bills for local distribution companies. This reduction will be achieved by optimizing the dispatching of available distributed energy resources (DERs) in the VPP while accounting for uncertainties and constraints.
The paper will present two scenarios for PM: one that focuses on managing peak demand every day of the billing cycle, and another that centers on managing peak demand only on specific days of the billing cycle.
The expected outcome of this study is to demonstrate that the proposed VPP framework is a practical and effective solution for local distribution companies to reduce electricity bills and optimize their energy usage during peak demand hours. The study will use simulation models and data to evaluate the efficiency, reliability, and cost-effectiveness of the proposed VPP. The results of this study will contribute to the advancement of the field of demand side management (DSM) and provide valuable insights for utilities and large electricity users.

2.2. Design of Experiments

In this study, we examine two distinct scenarios for PM so that our proposed VPP framework can effectively schedule the available resources in both scenarios.

2.2.1. Scenario 1

In this particular scenario, the VPP has the responsibility of effectively scheduling all the resources that are available to them, with the aim of reducing the daily peak load as much as possible. The billing mechanism used in this case is based on a variable rate plan, which means that the cost of electricity varies depending on the time of day, with higher rates during peak hours and lower rates at other times.

2.2.2. Scenario 2

The monthly electricity bill in this scenario is split into two parts, the energy charge and the demand charge. The energy charge is based on the total amount of energy (KWh) used during a billing cycle, while the demand charge is calculated considering the highest peak (KW) during that cycle. Demand charges in this scenario can account for a significant percentage of a monthly electricity bill that seriously impacts the costs; hence, PM can contribute to considerably reducing the costs of large electricity consumers. Only the days with the highest peaks during the billing cycle should be taken into account by the VPP in this scenario. Consequently, the number of days required to manage peak is reduced.

2.2.3. System Description: VPP Structure

In the literature, numerous VPP structures have been proposed, as evidenced by references [8,19]. Each of these structures is characterized by its unique materials and resources, tailored to specific operational requirements and technological capabilities. The framework of our proposed VPP is illustrated in Figure 1. The VPP has several resources at its disposal, including the CVR technique, utility-scale battery (UB), diesel generator (DG), three TCL aggregators and one non-TCL aggregator. TCL aggregators comprise electric water heater (EWH) aggregator, baseboard heater (BH) aggregator, and heat pump (HP) aggregator. The non-TCL aggregator includes a residential battery (RB) aggregator.
Moreover, the VPP has access to daily-released forecast data (one-day ahead load forecast, one-month ahead load forecast, one-day ahead weather forecast and one-day ahead hot water demand forecast) provided by forecast units that are trained with historical load data.
Assume tomorrow will be a day involved in the PM process. The VPP begins transactions with the models of resources based on a one-day-ahead load forecast and a threshold value. Following that, the VPP receives profiles from each of the models outlining the available resources, which include the maximum capacity that they can commit to contribute towards managing the peak demand for the following day. The VPP then provides an optimal scheduling for the contribution of all available resources, taking into account priorities, uncertainties, and constraints.

2.3. VPP Resources

2.3.1. CVR Technique

CVR is a technique widely used in the power industry to reduce the voltage supplied to a distribution system during periods of peak demand [5]. CVR effects can be evaluated by a CVR factor which is a quantitative indicator of demand load reductions with respect to voltage changes. The CVR factor ( C V R f ) is defined as the percentage of load reduction ( Δ P ( % ) ) with respect to the percentage of voltage change ( Δ V ( % ) ) as follows:
C V R f = Δ P ( % ) Δ V ( % )
The on-load tap changer (OLTC) stands out as the more efficient and frequently utilized method among various methods of CVR technique. The OLTC regulates the voltage ratio of an electrical transformer without interrupting the load current. Assume t a p indicates the tap position of transformers then we have the following:
T A P m i n t a p T A P m a x
where T A P m i n and T A P m a x are the minimum and maximum tap positions, respectively. A specific amount of voltage reduction is assigned to each tap position. Thus, the range of CVR technique capabilities for reducing peak demand, arranged in ascending order from low to high, is described as follows:
Θ = { P c , m i n , , P c , m a x }
where, for example, P c , m a x is the maximum capacity of the CVR technique obtained as follows:
P c , m a x = C V R f Δ V m a x × 100
which Δ V m a x is the voltage difference caused by t a p = T A P m a x .

2.3.2. Utility-Scale Battery

A utility-scale battery (UB) is a large energy storage system designed to store and release electricity on a massive scale. These batteries are typically used to help balance the electrical grid by storing excess electricity when demand is low and releasing it when demand is high. They are very flexible and can quickly adapt to peak characteristics in PM applications. They can also provide backup power during outages or emergencies. UBs are becoming increasingly popular as renewable energy sources such as solar and wind power become more widespread. By storing the excess energy generated by these sources, UBs can help ensure that renewable energy is available when it is needed the most, even when the sun is not shining, or the wind is not blowing.
The most commonly used model for battery energy storage systems, such as UBs, tracks the change in the state of charge (SOC) of the battery due to power flowing in or out of the battery. The SOC is the most widely used metric for assessing the energy level of the battery, ranging from 0% for a completely discharged battery to 100% for a fully charged battery. The definition of SOC is the level of charge of a battery relative to its capacity. An increment of SOC indicates the charging process of the batteries, while a decrement of SOC denotes its discharging process. This procedure evaluates the charging and discharging efficiencies, η u , c and η u , d , respectively. It is summarized mathematically by Equation (5).
S O C u ( t + Δ t ) = S O C u ( t ) + P u , c ( t ) η u , c Δ t E u , charging mode S O C u ( t ) + P u , d ( t ) η u , d Δ t E u , discharging mode
where 0 P u , c ( t ) P u , r and 0 P u , d ( t ) P u , r denote the charging and discharging power of the UB, respectively, during Δ t . Also, P u , r and E u represent the rated power and the maximum energy capacity of the UB, respectively.
The power that the UB can provide for PM, P u ( t ) , at any given time can be described as:
P u ( t ) = P u , d ( t ) , S O C u , m i n S O C u ( t ) S O C u , m a x 0 , otherwise
For which S O C u , m i n is the minimum SOC level of the UB and refers to the minimum amount of charge that should be left in the UB to maintain its health and longevity. Also, S O C u , m a x is the maximum SOC level of the UB refers to the maximum amount of charge that the battery can hold without causing damage or reducing its lifespan.

2.3.3. TCL Aggregators

TCLs possess inherent thermal storage and transfer characteristics, which allow for the scheduling of their electricity usage while meeting the desired temperature needs of the end-user. As a result, they hold tremendous potential to participate in power system services such as load shifting, thanks to their substantial capacity and rapid response. A single TCL has an insignificant impact on a power system, so an aggregator is required to aggregate a considerable number of TCLs before interacting with a power network and participating in ancillary services.

Electric Water Heater

Electric water heaters (EWHs) can be considered suitable options for controllable loads for two reasons: firstly, their aggregated power consumption makes a significant contribution to the overall load, and secondly, their daily power usage pattern is similar to that of the total load. Therefore, modifying the pattern of EWH load can have an impact on the overall consumption pattern [20]. One of the most popular differential equation models of the thermal characteristics of each electric water heater (indexed by k ) with a single element is [21]:
θ ˙ k ( t ) = 1 R e k C e k ( R e k m e k ( t ) P e , r k ( θ k ( t ) θ out k ( t ) ) ρ w c p R e k ω k ( t ) ( θ k ( t ) θ in k ( t ) ) )
where θ k ( t ) is the temperature of the water in the kth tank of EWH (°C); θ out k ( t ) is the ambient air temperature outside tank (°C); θ in k ( t ) is the incoming water temperature (°C); R e k is the thermal resistance of tank (°C/W); C e k is the thermal capacitance (J/°C); ρ w is the density of water (kg/m3); c p is the specific heat of water (J/(kg °C)); ω k ( t ) is the hot water demand profile as a function of time (m3/s); P e , r k is the rated power of element (W); m e k ( t ) is a dimensionless binary variable that indicates the operating state of EWH (1 when it is On and 0 when it is Off). Each EWH has a temperature setpoint θ set k with a hysteretic On/Off local thermostat control so that the operating state of m e k ( t ) is as follows:
m e k ( t + ) = 1 , θ k ( t ) < θ set k δ e k 0 , θ k ( t ) > θ set k + δ e k m e k ( t ) , otherwise
where δ e k is half of the hysteresis bandwidth of the local EWH thermostat and t + denotes the next time step. The impact of θ out k ( t ) on the temperature of the EWH’s tank is negligible, as these tanks are generally insulated from the external environment. On the other hand, ω k ( t ) and θ in k ( t ) have a notable impact on the water temperature of the EWH’s tank. As a result, it is imperative to consider these two factors to develop an accurate model of EWHs. While θ in k ( t ) can be assumed to be constant seasonally, ω k ( t ) must be determined accurately. Fortunately, various techniques have been proposed in the literature for forecasting hot water demand profiles [22].
This model can accurately provide the behavior of aggregated EWHs for the upcoming day by having a one-day ahead forecast of the hot water demand profile as well as other measured parameters.

Baseboard Heater

Baseboard heaters are a common heating solution used in a wide range of residential and commercial settings. They are known for their quiet operation and their ability to provide consistent heat throughout a room, making them a reliable and efficient choice for customers. The rate of temperature change in a room caused by a baseboard heater can be stated as:
T ˙ b k ( t ) = 1 R b k C b k ( R b k η b k m b k ( t ) P b , r k + R b k ρ s I k A w k ( T b k ( t ) T out k ( t ) ) R b k W n k V k ( T b k ( t ) T out k ( t ) ) )
where T b k ( t ) is the room temperature affected by BH (°C), m b k ( t ) is the On/Off state of each BH imposed by the local thermostatic controller operation like Equation (8), η b k is the BH efficiency, P b , r k is the rated power of the heating element of BH (W), ρ s represents the Solar Heat Gain Coefficient (SHGC), I k is the solar radiation (W/m2), and A w k is the area of the window (m2). T out k ( t ) is the outdoor temperature, R b k is the thermal resistance of the room (°C/W), C b k is the thermal capacitance of the room (J/°C), W = 0.33 is the energy required to raise one cubic meter of air through one Celsius (Wh/(m3 °C)), n k is the number of air changes per hour (1/h), and V k is the volume of the room (m3). It is assumed that the forecasting unit can generate a one-day ahead outdoor temperature forecast and one-day ahead solar radiation forecast. This model is capable of generating a satisfactory performance in predicting the behavior of the one-day ahead BH aggregator with these two forecasts along with other aforementioned measured parameters.

Heat Pump

A heat pump (HP) is a device that can transfer heat from one location to another. It works by circulating a refrigerant through a closed loop system, absorbing heat energy from one source, such as the outside air, and releasing it to another, such as the inside of a building. It can be used for both heating and cooling. HPs have become increasingly popular in recent years due to their energy efficiency and environmental benefits. They are now widely installed in both residential and commercial buildings as a replacement for traditional heating and cooling systems.
The dynamics of room temperature affected by a HP in heating mode is described by Equation (9) but, in cooling mode, it can be described as follows:
T ˙ h k ( t ) = 1 R h k C h k ( R h k η h k m h k ( t ) P h , r k R h k ρ s I k A w k + ( T h k ( t ) T out k ( t ) ) + R h k W n k V k ( T h k ( t ) T out k ( t ) ) )
where T h k ( t ) is the room temperature affected by HP (°C), η h k is the HP efficiency, P h , r k is the rated power of HP (W), R h k is the thermal resistance of the room (°C/W), and C h k is the thermal capacitance of the room (J/°C). Moreover, Equation (11) is used to determine the next On/Off state of the HP that depends on room temperature, setpoint temperature, and thermostat hysteresis dead-band for cooling mode of operation.
m h k ( t + ) = 0 , T h k ( t ) < T h , s e t k δ h k 1 , T h k ( t ) > T h , s e t k + δ h k m h k ( t ) , otherwise
where δ h k represents half of the hysteresis bandwidth of the local HP thermostat and T h , s e t k is the setpoint temperature of each HP. Similar to the BH model, this model can produce a satisfactory performance of a HP aggregator when provided with a one-day advance forecast of outdoor temperature, one-day advance forecast of solar radiation, and other mentioned measured variables in this model.

Control Strategy for TCL Aggregators

It is presumed that all TCLs are equipped with smart thermostats which have two capabilities: first, they can transmit temperature data (such as the temperature of the water in the EWH tank); second, they can receive external control signals that could potentially override the thermostat’s On/Off status. Additionally, it is assumed that end users have given permission for utilities or local distribution companies to access these smart thermostats and override their On/Off status without affecting the user’s comfort.
The aggregated power consumption of TCL aggregators at time t ( P i , a g g ( t ) ) is given by:
P i , a g g ( t ) = k = 1 N i m i k ( t ) P i , r k , i { e , b , h }
where N i indicates the number of TCLs in the corresponding aggregator. There are three time periods that a TCL aggregator controller should consider:
  • Pre-Charging period: TCLs should be almost fully charged to maximize the benefits of aggregators to the network and provide sufficient capacity to achieve the best load-shifting performance. Aggregator controllers estimate the required time and generate a reference signal for charging TCLs during the pre-charging period based on the time/duration of the peak period determined by the VPP.
  • Peak period: The VPP provides a reference power profile to each TCL aggregator, which specifies the desired amount of demand reduction during this period to decrease the total demand load by turning off TCLs without compromising the user’s comfort.
  • Payback effect or rebound period: Controlling a large population of TCLs during peak hours may result in a change in nominal power consumption. A substantial power consumption peak may occur as soon as the controllers allow units to charge again at the end of the peak phase. This is referred to as the rebound or payback effect. The rebound effect’s amplitude and duration depend on the ambient temperature, user behavior, peak duration, control algorithms and pre-charging time. The payback effect control should be dynamic, involving the generation of reference power and selecting the end of controlling the rebound. The controller releases the control when the aggregated power (with control) reaches or approaches the baseline (aggregated power without control).
TCL aggregators utilize a feedback control approach known as the priority stack control strategy during these three periods in this paper. This controller overrides On/Off state of local thermostats such that the aggregated power P i , a g g ( t ) reaches or approaches the reference power. Detailed information about the priority stack control strategy can be found in [23].

2.3.4. Residential Battery Aggregator

Residential batteries (RBs) are one of the most applied energy storage resources for PM due to their fast response, efficiency, and high energy density. RBs can be considered non-TCL aggregators such that one can design a centralized control approach to schedule their charging and discharging periods. The pre-charging phase for an RB aggregator, unlike TCL aggregators, does not necessarily have to occur right before the peak period. This is because the RBs can retain their stored energy for an extended period without experiencing significant energy losses. Additionally, RBs do not experience the payback effect since they do not require immediate recharging after the peak period.
The model of RB utilized in this study is based on SOC, similar to Equation (5), in the following manner:
SOC r b k ( t + Δ t ) = SOC r b k ( t ) + P r b , c k ( t ) η r b , c k Δ t E r , r b k , charging mode SOC r k ( t ) + P r b , d k ( t ) Δ t η r b , d k E r b , d k , discharging mode
The expressions 0 P r b , c k ( t ) P r b , r k and 0 P r b , d k ( t ) P r b , r k represent the charging and discharging power of the kth RB during Δ t , while P r b , r k and E r b k denote the rated power and maximum energy capacity of the kth RB, respectively. The aggregated power of RBs in discharging mode ( P r b , a g g ( t ) ) can be defined as follows:
P r b , a g g ( t ) = k = 1 N r b m r b k ( t ) P r b , d k ( t )
where N r b is the number of RBs and m r b k ( t ) is defined as follows:
m r b k ( t ) = 1 , S O C r b , m i n k S O C r b k ( t ) S O C r b , m a x k 0 , otherwise
The control strategy for this aggregator in this paper is similar to the priority stack control approach by overriding the m r b k ( t ) during the peak period but with a notable distinction being that the priority ranking is established based on SOC criteria. RBs possessing a greater SOC are given higher priority and are discharged first during periods of peak demand.

2.3.5. Diesel Generator

A diesel generator (DG) is a highly reliable resource of power that can be activated during peak demand periods to meet energy demand. However, compared to other resources, such as UB or aggregators, the cost of using DG for PM is generally higher. As a result, DG is typically considered a last resort for contributing to PM.
DGs are designed to operate at a specific power output, which is typically their rated power. While it is possible to operate a DG at more or less than its rated power, it is generally not recommended. Operating a DG at a lower power output than its rating can lead to several issues. Firstly, the generator may not operate efficiently, which can lead to higher fuel consumption and increased operating costs. Secondly, running a diesel generator at a lower power output than its rating can cause it to experience “wet stacking”, which is a build-up of unburned fuel and oil in the exhaust system. This can cause the engine to operate inefficiently and potentially damage the generator [24,25]. On the other hand, exceeding the rated power output can cause the generator to overheat, which can damage the engine and other components of the generator. Moreover, operating at a higher power output can also cause the generator to consume more fuel and reduce its overall efficiency. Therefore, it is assumed in this paper that the output power of DG is constant at its rated power ( P d , r ).
Moreover, due to the high cost of DG, it may not be economically feasible to utilize this resource indiscriminately for PM processes. Thus, it is necessary to impose predetermined runtime constraints for this resource within a billing cycle. The DG’s maximum energy capacity, which is E d , m a x , corresponds to its maximum runtime of T d , m a x during one PM process. The authors in [26] investigate the profitability and reliability of a VPP incorporating a DG within the day-ahead and intra-day power markets.

3. Proposed VPP

This section presents three sub-sections that deal with our proposed VPP design for both PM scenarios. The first sub-sectionpresents a threshold value determination algorithm that enables efficient decision-making on the participation of resources in the VPP. The second sub-section discusses the transaction mechanism between proposed VPP components to ensure optimal operation of the VPP. The third sub-section proposes a robust optimization approach for day-ahead scheduling, which ensures that the VPP meets the forecasted demand while maintaining operational constraints.

3.1. Threshold Value Determination Algorithm

A criterion or threshold value must be established for each day in order to determine the starting point and duration of peak demand, as well as the level of each resource contribution needed for effective PM. Choosing the proper threshold value for PM is crucial to ensure that the demand charge-saving measures are activated at the right time and that the overall performance of the system is optimized. If the threshold value is set too high, the peak energy demand may not be reduced sufficiently, resulting in higher demand costs. Conversely, if the threshold value is set too low, PM may be triggered during non-peak hours, resulting in an unnecessary reduction in consumption at the outset. This can lead to a loss of the available capacity of the VPP resources during the late peak period. We suggest two algorithms in this section to establish threshold values for the two PM scenarios mentioned earlier.

3.1.1. Threshold Value Determination for Scenario 1

In this scenario, the VPP should have an estimation of the maximum capacity that all available resources can provide for the upcoming day’s PM. The upper bound capacity of available VPP resources ( P ¯ v p p ) can be calculated as follows:
P ¯ v p p = P c , m a x + P u , r + P d , r + i k = 1 N i P i , r k , i { e , b , h , r b }
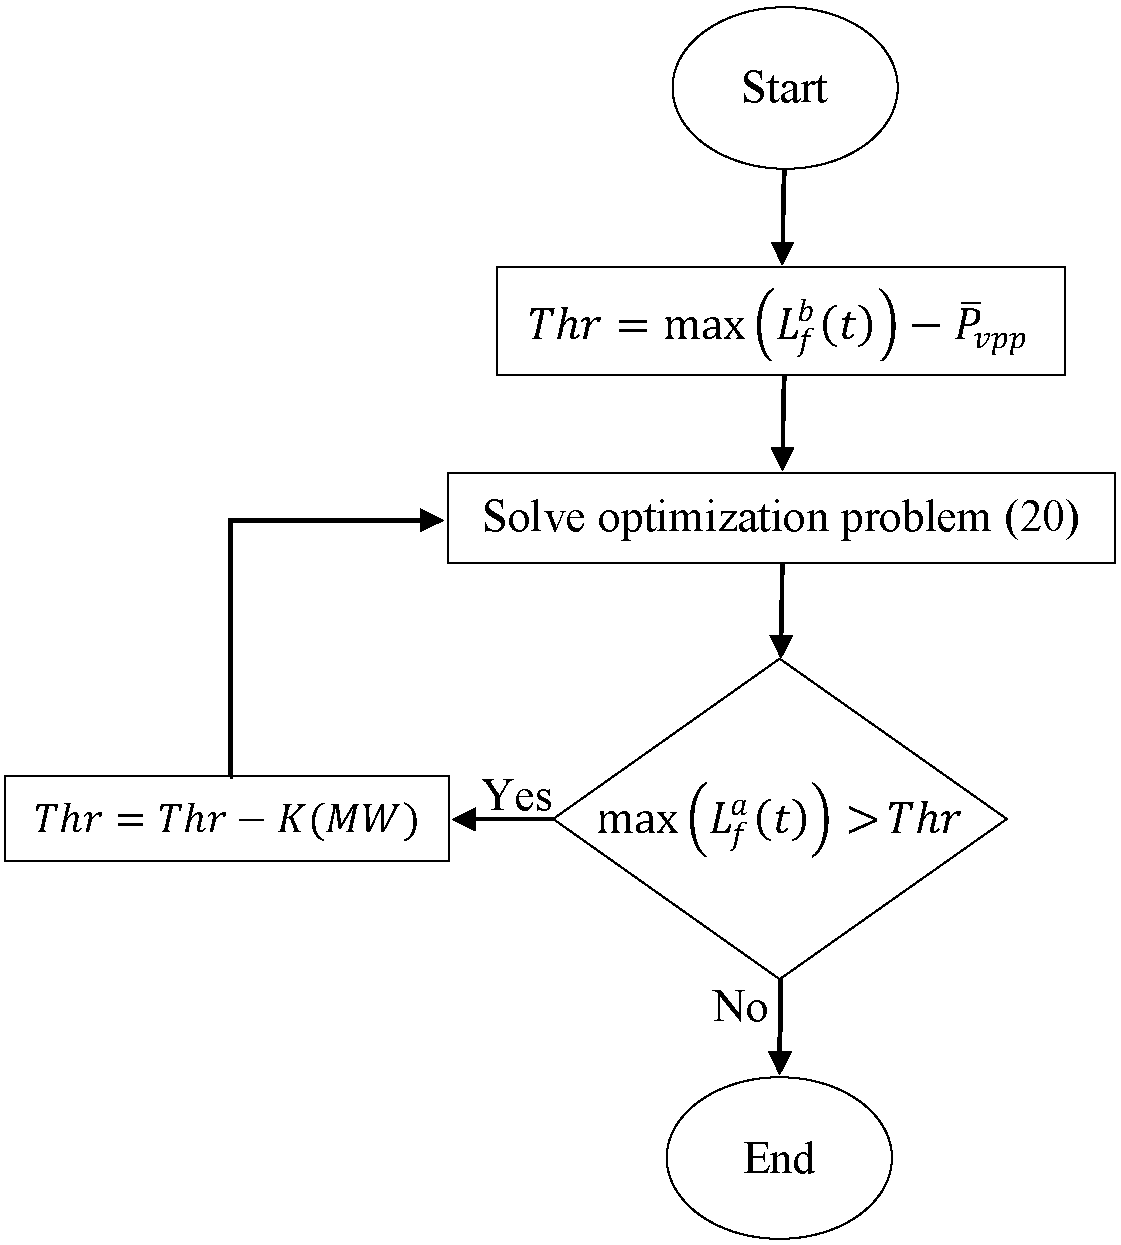
Figure 2 provides an algorithm to determine the threshold value for this scenario. P ¯ v p p is selected as the starting point of the threshold value. L f b ( t ) is the load forecast of the next day before applying the PM process provided by the forecast unit, and L f a ( t ) is the load forecast after applying the PM process by solving the robust optimization problem (20).
The parameter K in this algorithm is the learning rate that determines how large of a step the algorithm takes in each iteration toward the best solution. A higher K can result in faster convergence but may cause less accuracy, while a lower K can lead to slower convergence but may provide more accurate results.

3.1.2. Threshold Value Determination for Scenario 2

Determining the initial threshold value is a crucial step in this scenario since only days with the highest peaks are engaged in the process of PM. This approach results in saving resources since only the highest peak will determine the demand charge of the bill in this scenario. The initial threshold value should be set at the beginning of the billing cycle. This value for each billing cycle is estimated with the following data:
  • Actual historic load data of the top five days with the highest peaks in the same billing cycle of previous years.
  • Load forecast data for days that display the five highest peaks in the most recent one-month-ahead load forecast provided by the forecast unit.
Let L m ( t ) represent the one-day load data obtained by calculating the mean value of the load data at each point across all of the selected days mentioned above. Our initial threshold value for this scenario is obtained by replacing L f b ( t ) with L m ( t ) in the algorithm proposed for scenario 1.
The initial day selected for PM during the current billing cycle is the first day where any parts of its L f b ( t ) exceed the initial threshold value. The objective of this scenario is to reduce the highest peaks within a billing cycle. Therefore, the threshold value needs to be updated after each PM process for subsequent days. The purpose of this section is to describe how the threshold value can be updated, and the procedure is as follows: Assuming that L a a ( t ) represents the actual load of the current day after applying PM, if the maximum value of L a a ( t ) is greater than the current threshold value ( T h r ), then the new threshold value will be updated to this maximum value.
It should be noted that it may not be cost-effective to use all the available resources on some of the days when the load demand is below the threshold. This is given by the billing mechanism used in this scenario.

3.2. Transaction between Proposed VPP Components

The CVR technique is one of the most cost-effective resources in the system and is given first priority in the PM process followed by the UB which is utilized if needed after the application of the CVR technique. DG is used as a final option due to its cost (fuel, installation and maintenance). The rated power contributed by the DGs considered in this study requires operating the generators for a certain amount of time before being available for grid support. Therefore, DGs require a predetermined start time notification (selected to 15 min in this study).
Out of all the resources available in our proposed VPP, TCL aggregators are not able to commit a set amount of capacity for every day they participate in PM activities. Their capacity is contingent upon various factors, such as weather patterns, duration of pre-charging, and end-user behaviors. However, we can approximate the maximum capacity that they can commit to contribute to each PM process by utilizing an accurate model of these resources. This is achieved through a transaction initiated by the VPP with each aggregator model. The VPP transmits a reference power profile to each aggregator model during this transaction that provides a time series specifying the expected capacity at each time interval during the peak period, along with the start time and duration of the peak period. Subsequently, each aggregator proposes a new profile to the VPP according to the existing charge conditions using an algorithm discussed in detail later. These profiles contain the maximum capacity they can offer at each time interval in order to maximize their contribution to peak shaving.
We will now provide a detailed explanation of how the VPP generates a reference power profile for the aggregator models, followed by a description of our proposed algorithm to estimate the optimal capacity of aggregators.

3.2.1. Reference Power Genertion

The VPP is responsible for generating a reference power signal for each aggregator during the peak period. The aggregator controllers (priority stack controllers) utilize this reference power to track the capacity requested by the VPP and ensure that customer comfort is not compromised. This investigation assigns lower priority to the contribution of the aggregators than to the contribution of the CVR and UB modules. Therefore, determining their appropriate reference power involves first solving a robust multi-objective optimization problem (17) to determine the contribution of the CVR and UB modules. If these two resources provide sufficient contribution, generating reference power for the aggregators is unnecessary. The VPP must generate the reference power for each aggregator when needed according to the following constraints:
minimize α f L ^ f a ( t ) Thr + α c P ^ c ( t ) + α u P ^ u ( t ) subject to : L ^ f a ( t ) = L f b ( t ) P ^ c ( t ) P ^ u ( t ) P ^ c ( t ) Θ 0 P ^ u ( t ) P r , u SOC u , m i n SOC u ( t ) SOC u , m a x
The expression L ^ f a ( t ) is the one-day-ahead load forecast after conducting the optimization. The weights of the objectives α i > 0 are for assigning priority to the contribution of resources. The profiles P ^ c ( t ) and P ^ u ( t ) are determined through the solution of this problem, and they serve to demonstrate the provisional impact of the CVR and UB modules during the current stage of the design process. When portions of L ^ f a ( t ) are still higher than the predetermined threshold value, the VPP generates a profile r ( t ) that incorporates the points of L ^ f a ( t ) above the threshold, while points below the threshold are assigned zero. The reference power for both TCL and non-TCL aggregators can then be obtained as follows:
P i , r e f ( t ) = P i , b a s e ( t ) γ i P i , a g g ( T p 1 ) r ( t ) , i { e , b , h , r b }
where P i , r e f ( t ) is the reference power and P i , b a s e ( t ) is the baseline. T p refers to the start time of the peak period. The upcoming section will cover the discussion and determination of the parameter 0 γ i 1 .

3.2.2. Optimal Offered Capacity of Aggregators

The models of aggregators use their corresponding control strategy (priority stack control) to ensure their aggregated power tracks their reference power profile during the peak period. However, if the reference power of each aggregator, determined using Equation (18) with γ i = 1 , enforces the aggregator to deplete all available capacity at the beginning of the peak period, there may be no capacity left for the rest of the peak period and subsequently, aggregators may not contribute their optimal capacity to the PM. Figure 3 displays the aggregated power profile of 500 EWHs for two different values of γ e ( γ e = 1 and γ e = 0.6 ) to illustrate this issue. The aggregated power is not able to track the reference power after 09:00 AM because all the available capacity has been used to track the reference power from 08:00 AM to 09:00 AM due to the high demand reduction forced by the reference power with γ e = 1 . Conversely, the aggregated power can accurately track the reference power with γ e = 0.6 , and therefore, provides a consistent capacity for PM during the peak period.
To address this issue, we suggest an iterative optimization algorithm to ascertain the best value of γ i . The methodology involves adjusting parameter γ i in Equation (20) to modify the reference power of each aggregator, followed by implementing the priority stack control strategy for each revised reference power. The objective is to identify the best value of γ i for each aggregator that results in the most favorable reduction in peak load demand. Figure 4 shows a flowchart describing the optimization algorithm. The term P γ i ( t ) is a profile provided by each aggregator at each step containing the corresponding value of γ i calculated with Equation (19).
P γ i ( t ) = P i , b a s e ( t ) P ^ i , a g g ( t ) , i { e , b , h , r b }
The term P ^ i , a g g ( t ) represents the aggregated power of each aggregator when the priority stack control is applied based on the calculated value of γ i . Also, γ i , b e s t indicates the value of γ i with the best performance. The parameter ϵ is the learning rate.
Each aggregator model will transmit the profile P γ i , b e s t ( t ) indicating the maximum capacity they can commit during the peak period of the upcoming day once γ i , b e s t has been determined.

3.3. Day-Ahead Scheduling: Robust Optimization Approach

Uncertainty, in mathematical models of VPP resources, refers to the inherent limitations in our ability to precisely predict the behavior of the resources. These limitations arise due to various factors, such as the complexity of the resources, the presence of random or unpredictable inputs, or errors in measurements and data. Moreover, uncertainty in load forecasting is unavoidable due to several reasons. One major source of uncertainty in load forecasting is weather variability. Weather conditions can significantly impact electricity consumption, as people tend to use more electricity for cooling or heating during extreme weather conditions. Another source of uncertainty is introduced by the changes in consumer behavior or electricity usage patterns. Additionally, other factors such as economic conditions, equipment failures, outages, or natural disasters can also impact electricity consumption, leading to additional uncertainties. It is crucial to consider all uncertainties when scheduling the contribution of available network resources for PM purposes. Self-scheduling of all available resources of the proposed VPP for the day-ahead PM process can be determined by solving the robust multi-objective optimization problem stated in Equation (20).
minimize β f L f a ( t ) Thr + i { c , u , e , b , h , r b , d } β i P i ( t ) , subject to : L f a ( t ) = L f b ( t ) + δ ( t ) i { c , u , e , b , h , r b , d } P i ( t ) , | δ ( t ) | < Δ , P c ( t ) Θ , 0 P u ( t ) P ( r , u ) , SOC ( u , m i n ) SOC u ( t ) SOC ( u , m a x ) , 0 P i ( t ) P ( γ ( i , b e s t ) ) ( t ) , i { e , b , h , r b } , P d ( t ) { 0 , P ( r , d ) } , 0 E d ( t ) E ( d , m a x ) .
Term δ ( t ) in Equation (20) represents all the inevitable uncertainties and Δ is a known parameter that meets the condition | δ ( t ) | < Δ . Parameters β i are determined for prioritizing the objectives. For instance, a resource that has the lowest β i value will be given the highest contribution priority to the PM. The solution to this problem involves the derivation of distinct profiles P i ( t ) pertaining to each of the available resources of the VPP. These profiles specify the extent of the contribution of resources during each time interval of the day-ahead PM process.

4. Results and Discussion

The results derived from the simulation of our proposed VPP are presented in this section for a typical local distribution company of eastern Canada with about 40,000 customers and the type of resources discussed earlier. This company is committed to providing power for the residential, commercial, and industrial sectors of a city. The region experiences significant seasonal variations, impacting energy consumption patterns. Commonly, the daily peak occurs around 8 AM due to several factors:
  • Residential Activity: Many residents start their day around this time, leading to increased usage of electrical appliances for breakfast preparation, heating, and lighting.
  • Commercial Operations: Businesses and offices typically begin operations around 8 AM, contributing to a surge in energy demand as lights, computers, and other equipment are turned on.
  • Industrial Processes: Some industrial facilities also ramp up production activities around this time, further adding to the peak load.
The specifics regarding the resources of this company for PM are elaborated below.
The CVR mechanism is set up to execute in five tap positions where position ‘1’ is where CVR is in off mode, and stage 5 would be full CVR applied. Voltage reduction percentages related to these five tap positions are shown in Table 1. The CVR factor is CVR f = 1 ; therefore, the power reduction percentage Δ P ( % ) is equal to the voltage reduction percentage Δ V ( % ) . Table 2 outlines the parameters of the UB. The parameters of TCL aggregators and RB aggregators are summarized in Table 3 and Table 4, respectively. Moreover, the parameters utilized in the implementation of DG are P d , r = 1 MW and T d , max = 2 h.
The values for the weights of the objectives ( α i and β i ) have been chosen according to the information in Table 5 for both scenarios.
All the simulations were conducted using MATLAB (MathWorks, Natick, MA, USA).

4.1. Results and Discussion of Experiment 1

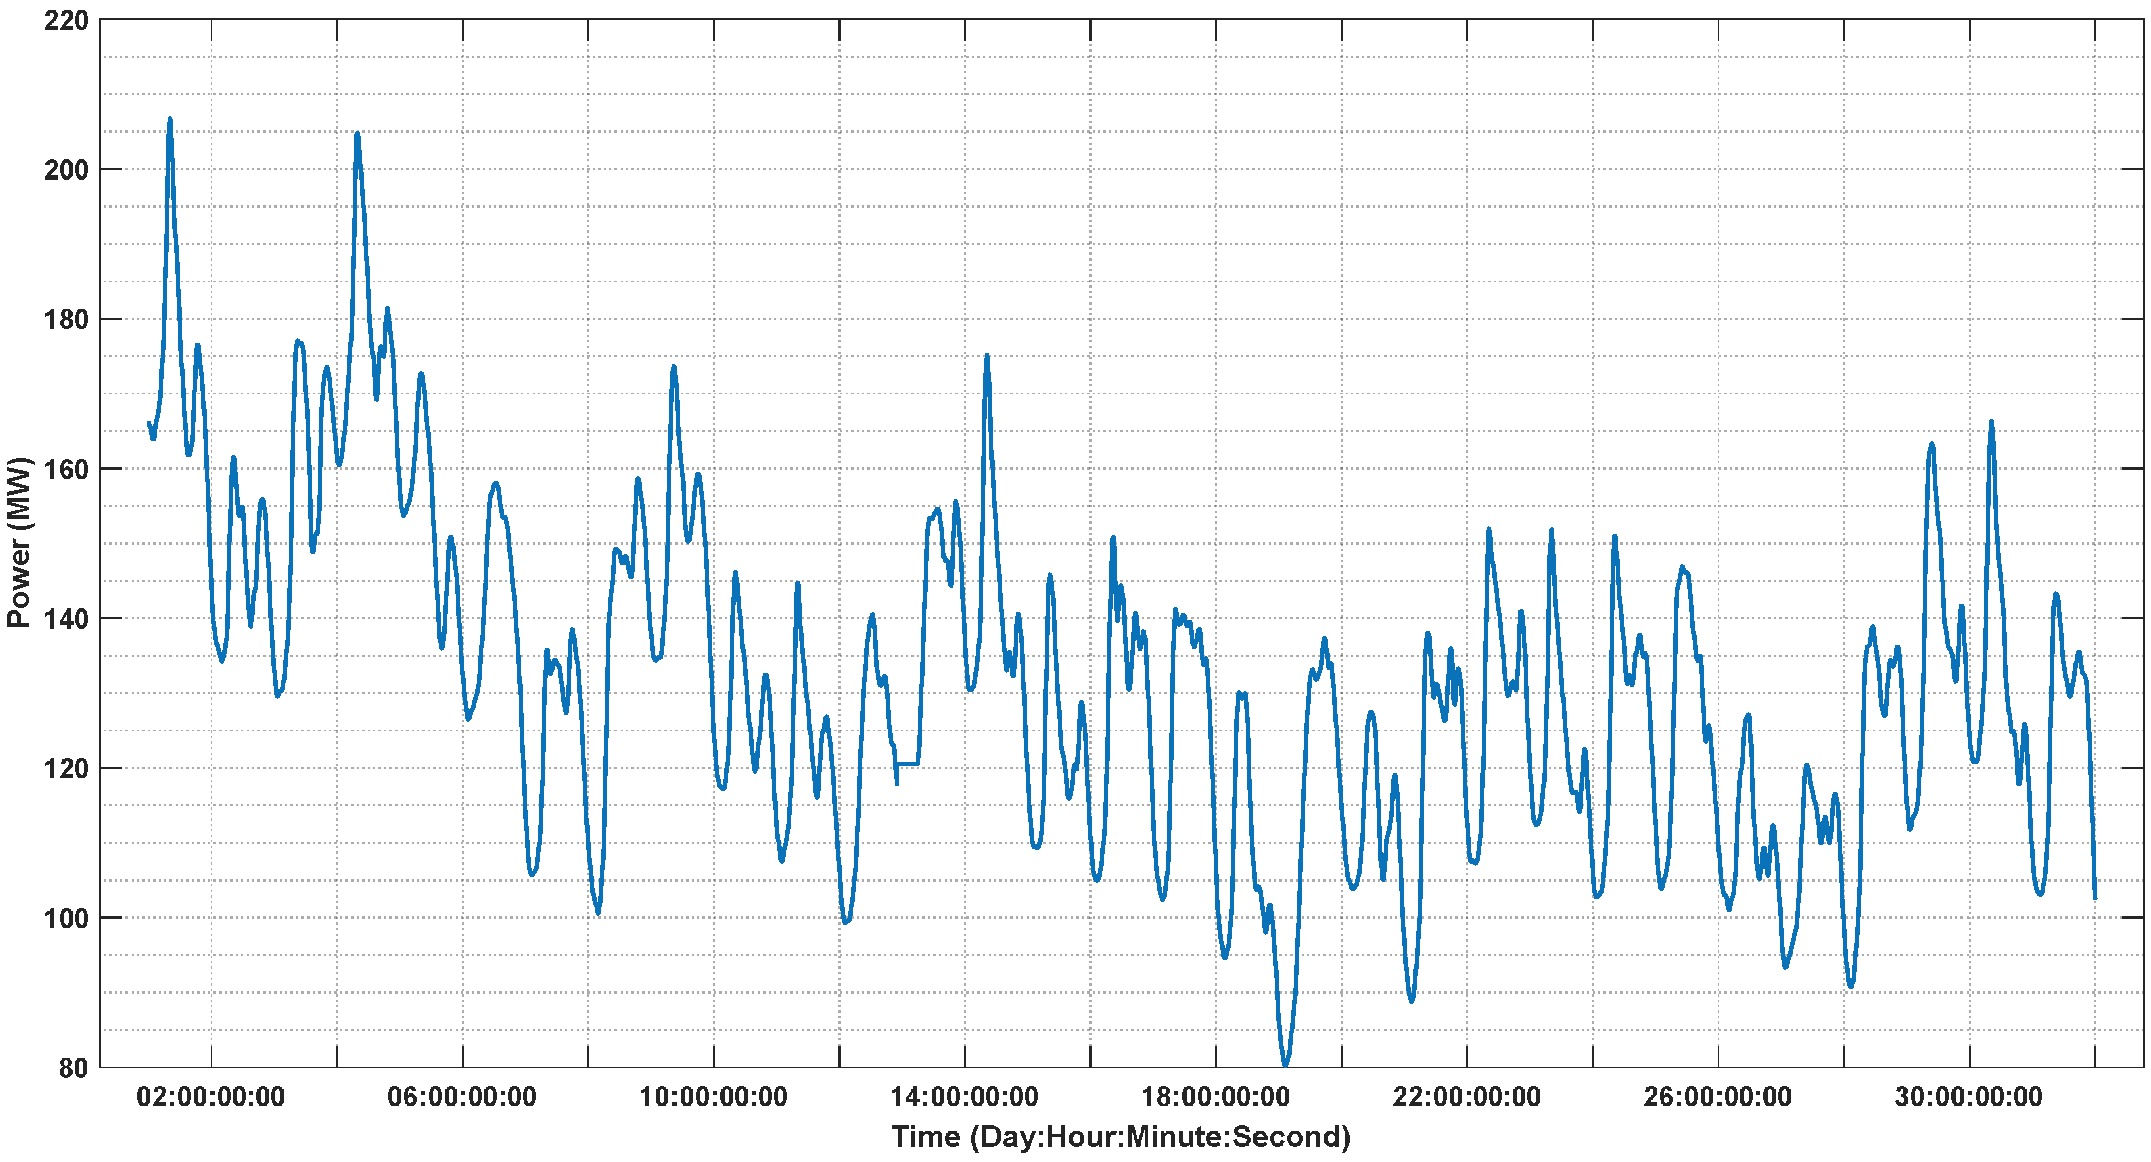
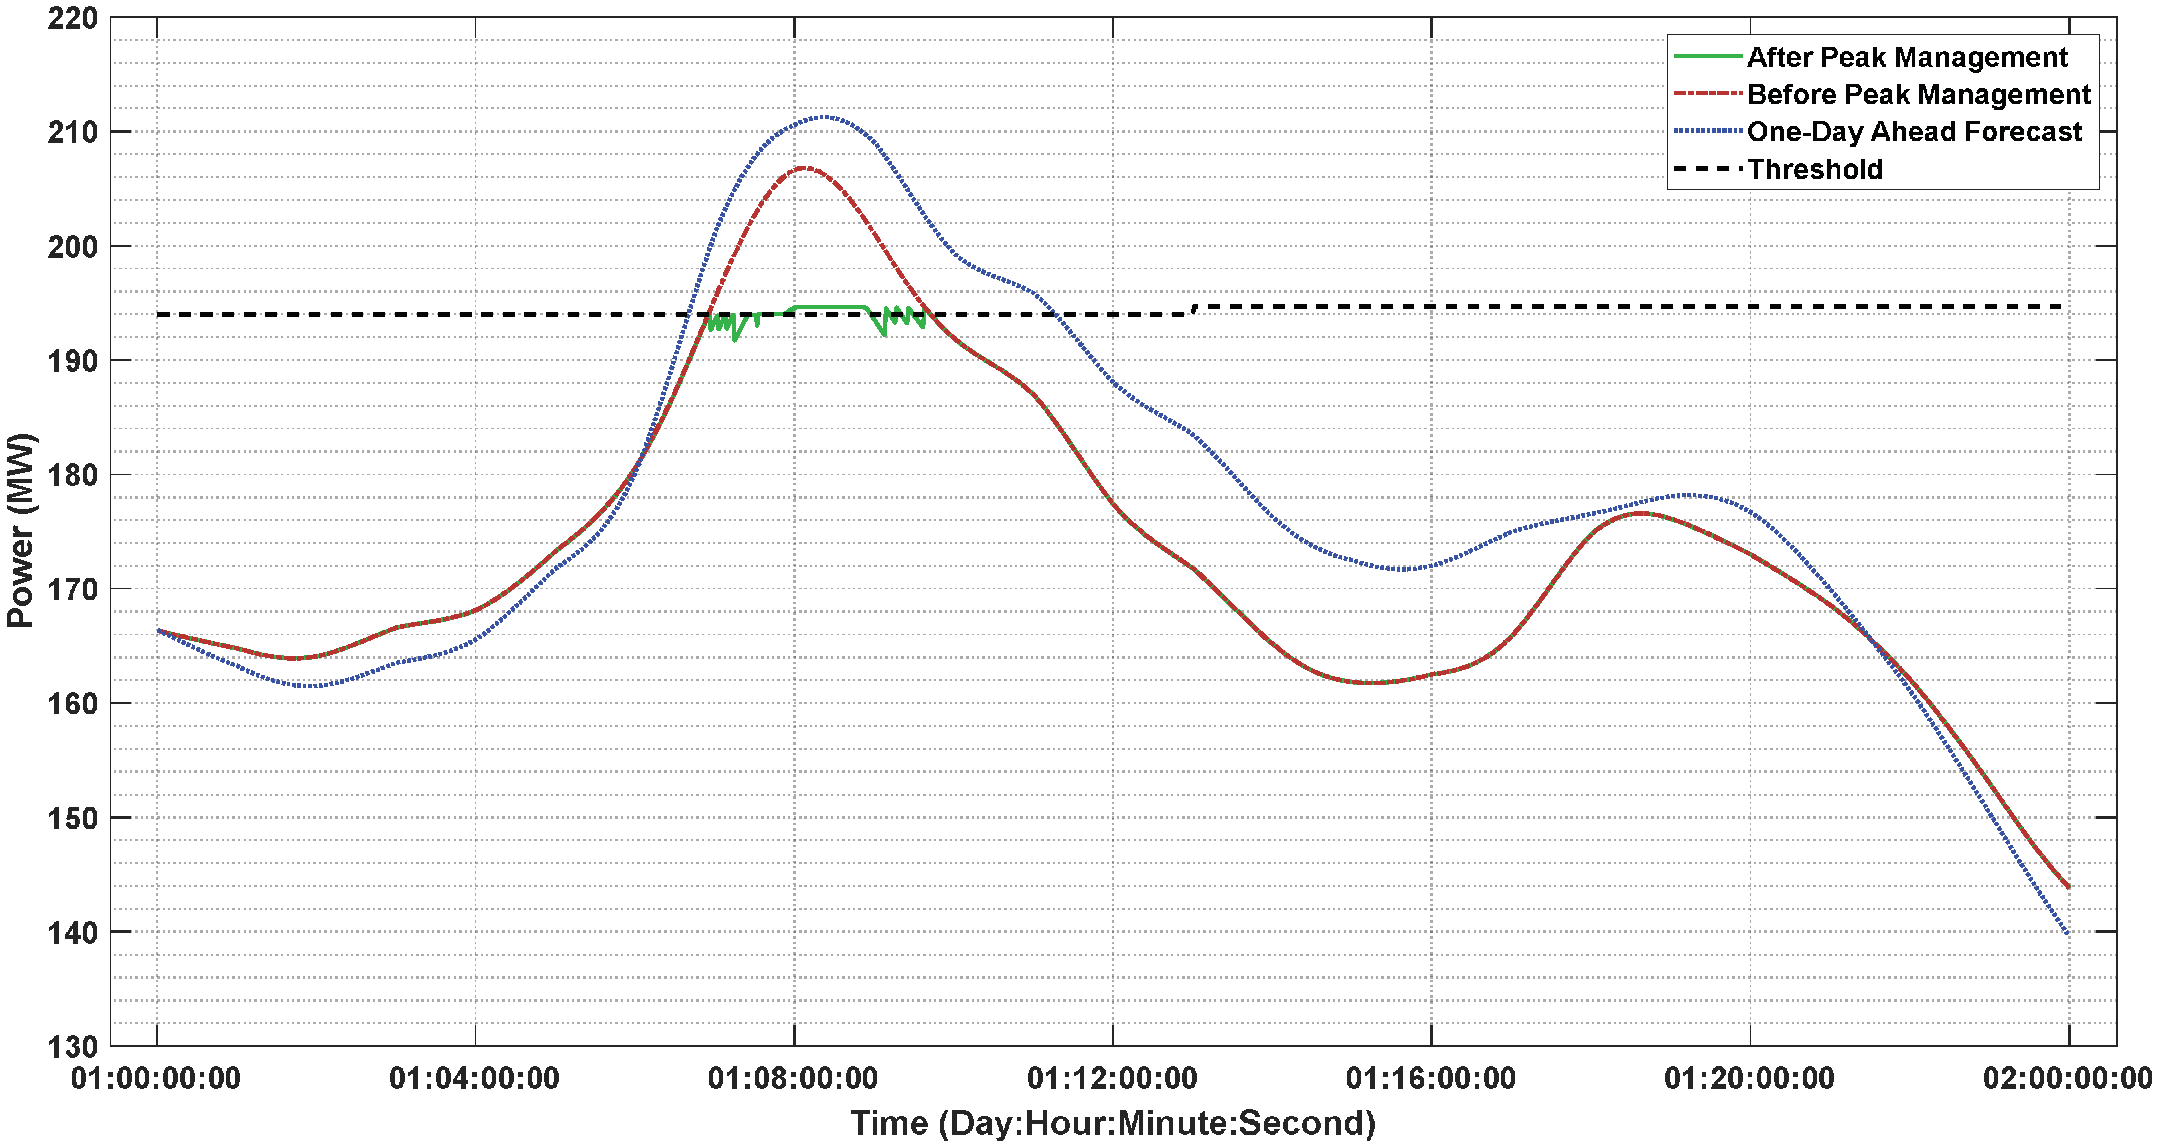
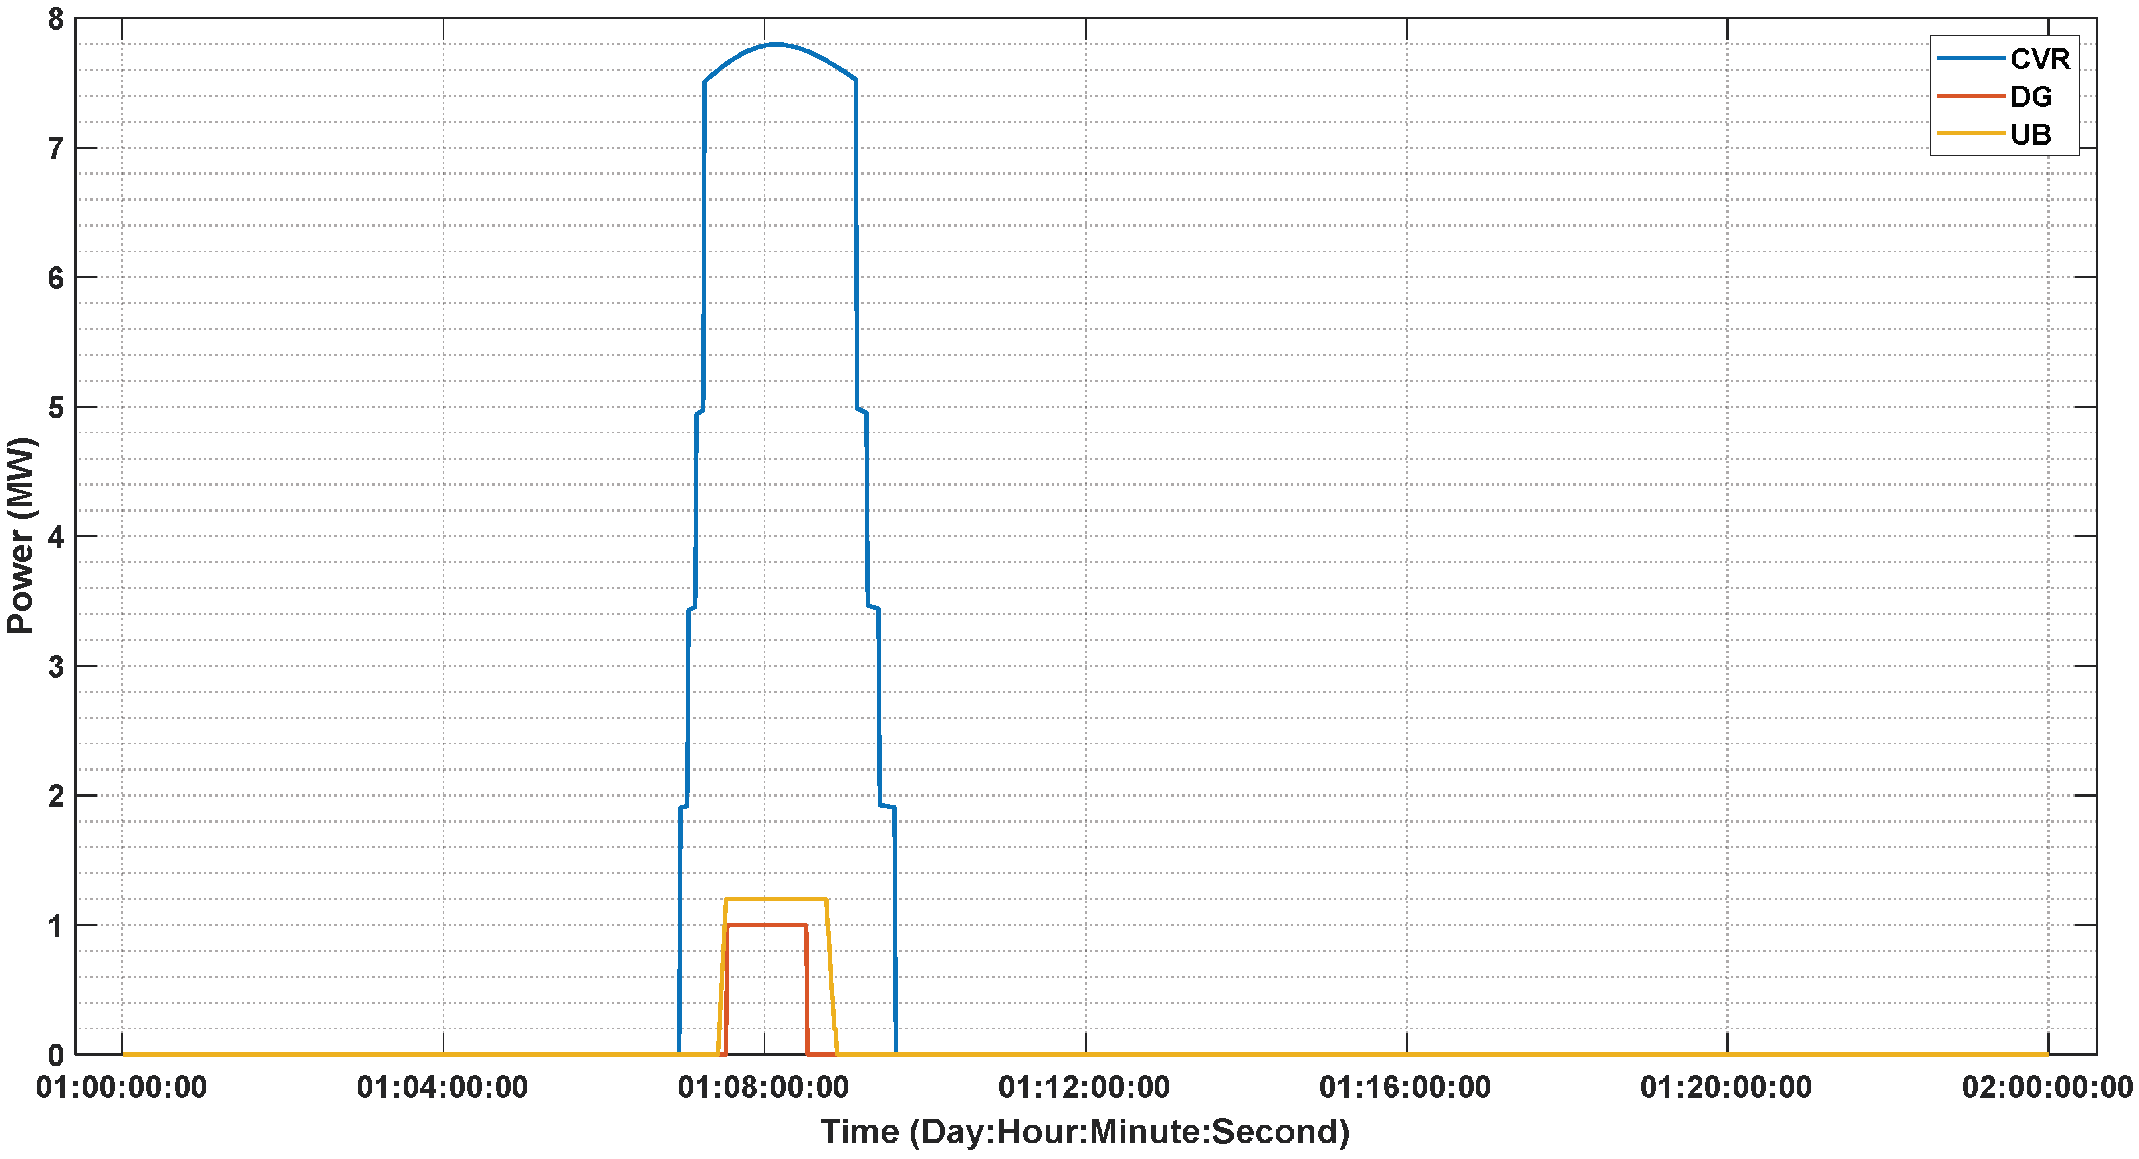
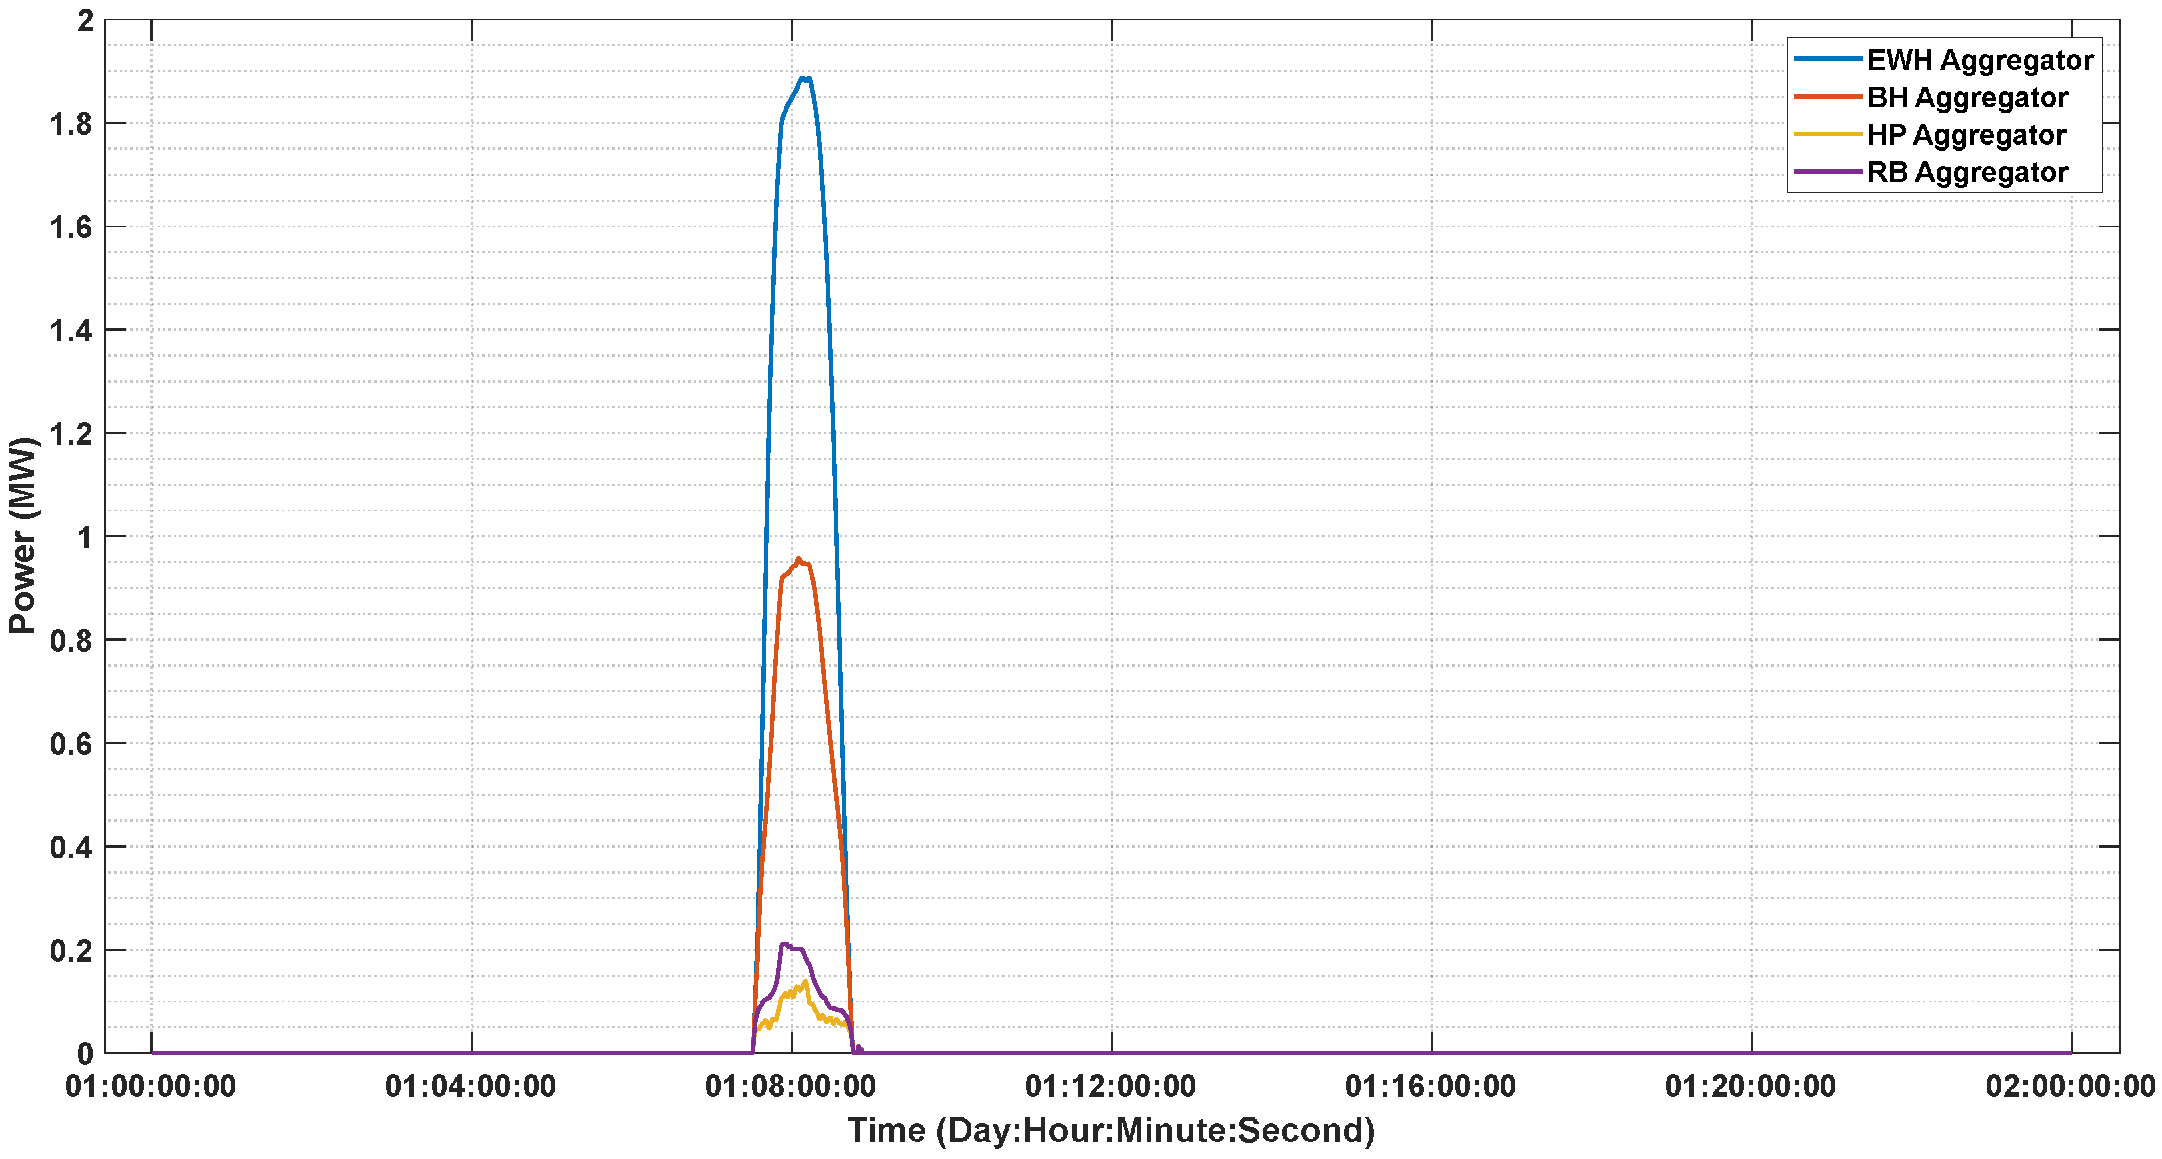
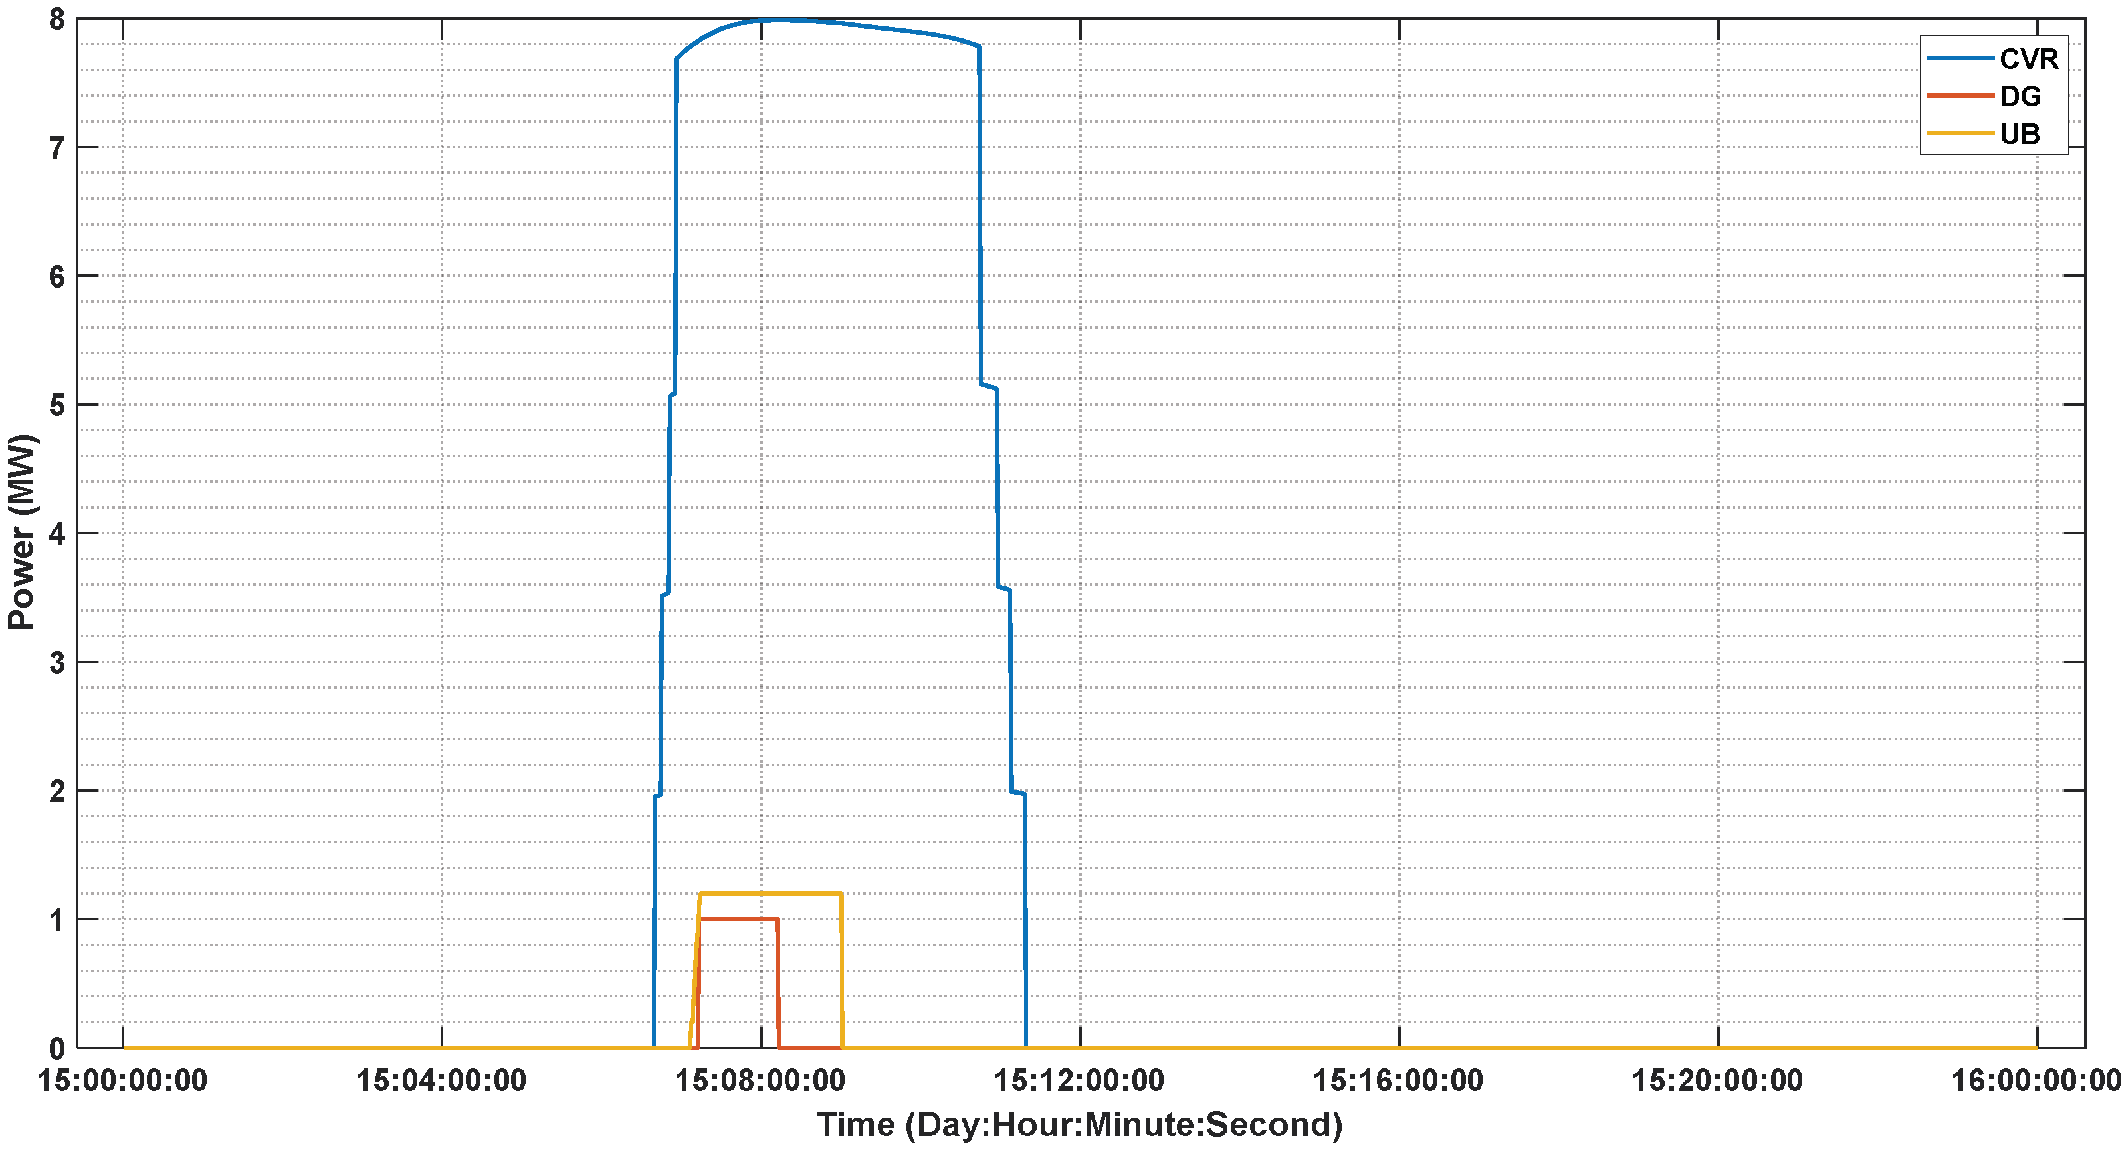
The simulation outcomes for this specific scenario pertain to the period of 2022-03-01 through 2022-03-31, during which PM activities were conducted on a daily basis. Our approach and algorithms are designed to be general and robust, and capable of handling data from any time period. Therefore, the choice of these specific time frames was not driven by any particular intention and does not affect the overall conclusions and applicability of our research. The actual load for this billing cycle, prior to the PM procedure, is presented in Figure 5. Figure 6 displays daily data on the quantity of energy-reduced during each billing cycle day. The results of the PM process for a specified day (the first day) of this billing cycle are illustrated in Figure 7. This figure displays the actual load before and after PM, the one-day-ahead load forecast, and the threshold value. By utilizing the proposed algorithm, the threshold value of T h r = 194 MW was attained for this day. Our proposed algorithm resulted in shaving off 21.93 MWh of energy for this day, and a total of 503.26 MWh for the entire billing cycle. Figure 8 and Figure 9 and Table 6 depict the contributions of all the resources during the first day of this billing cycle.

4.2. Results and Discussion of Experiment 2

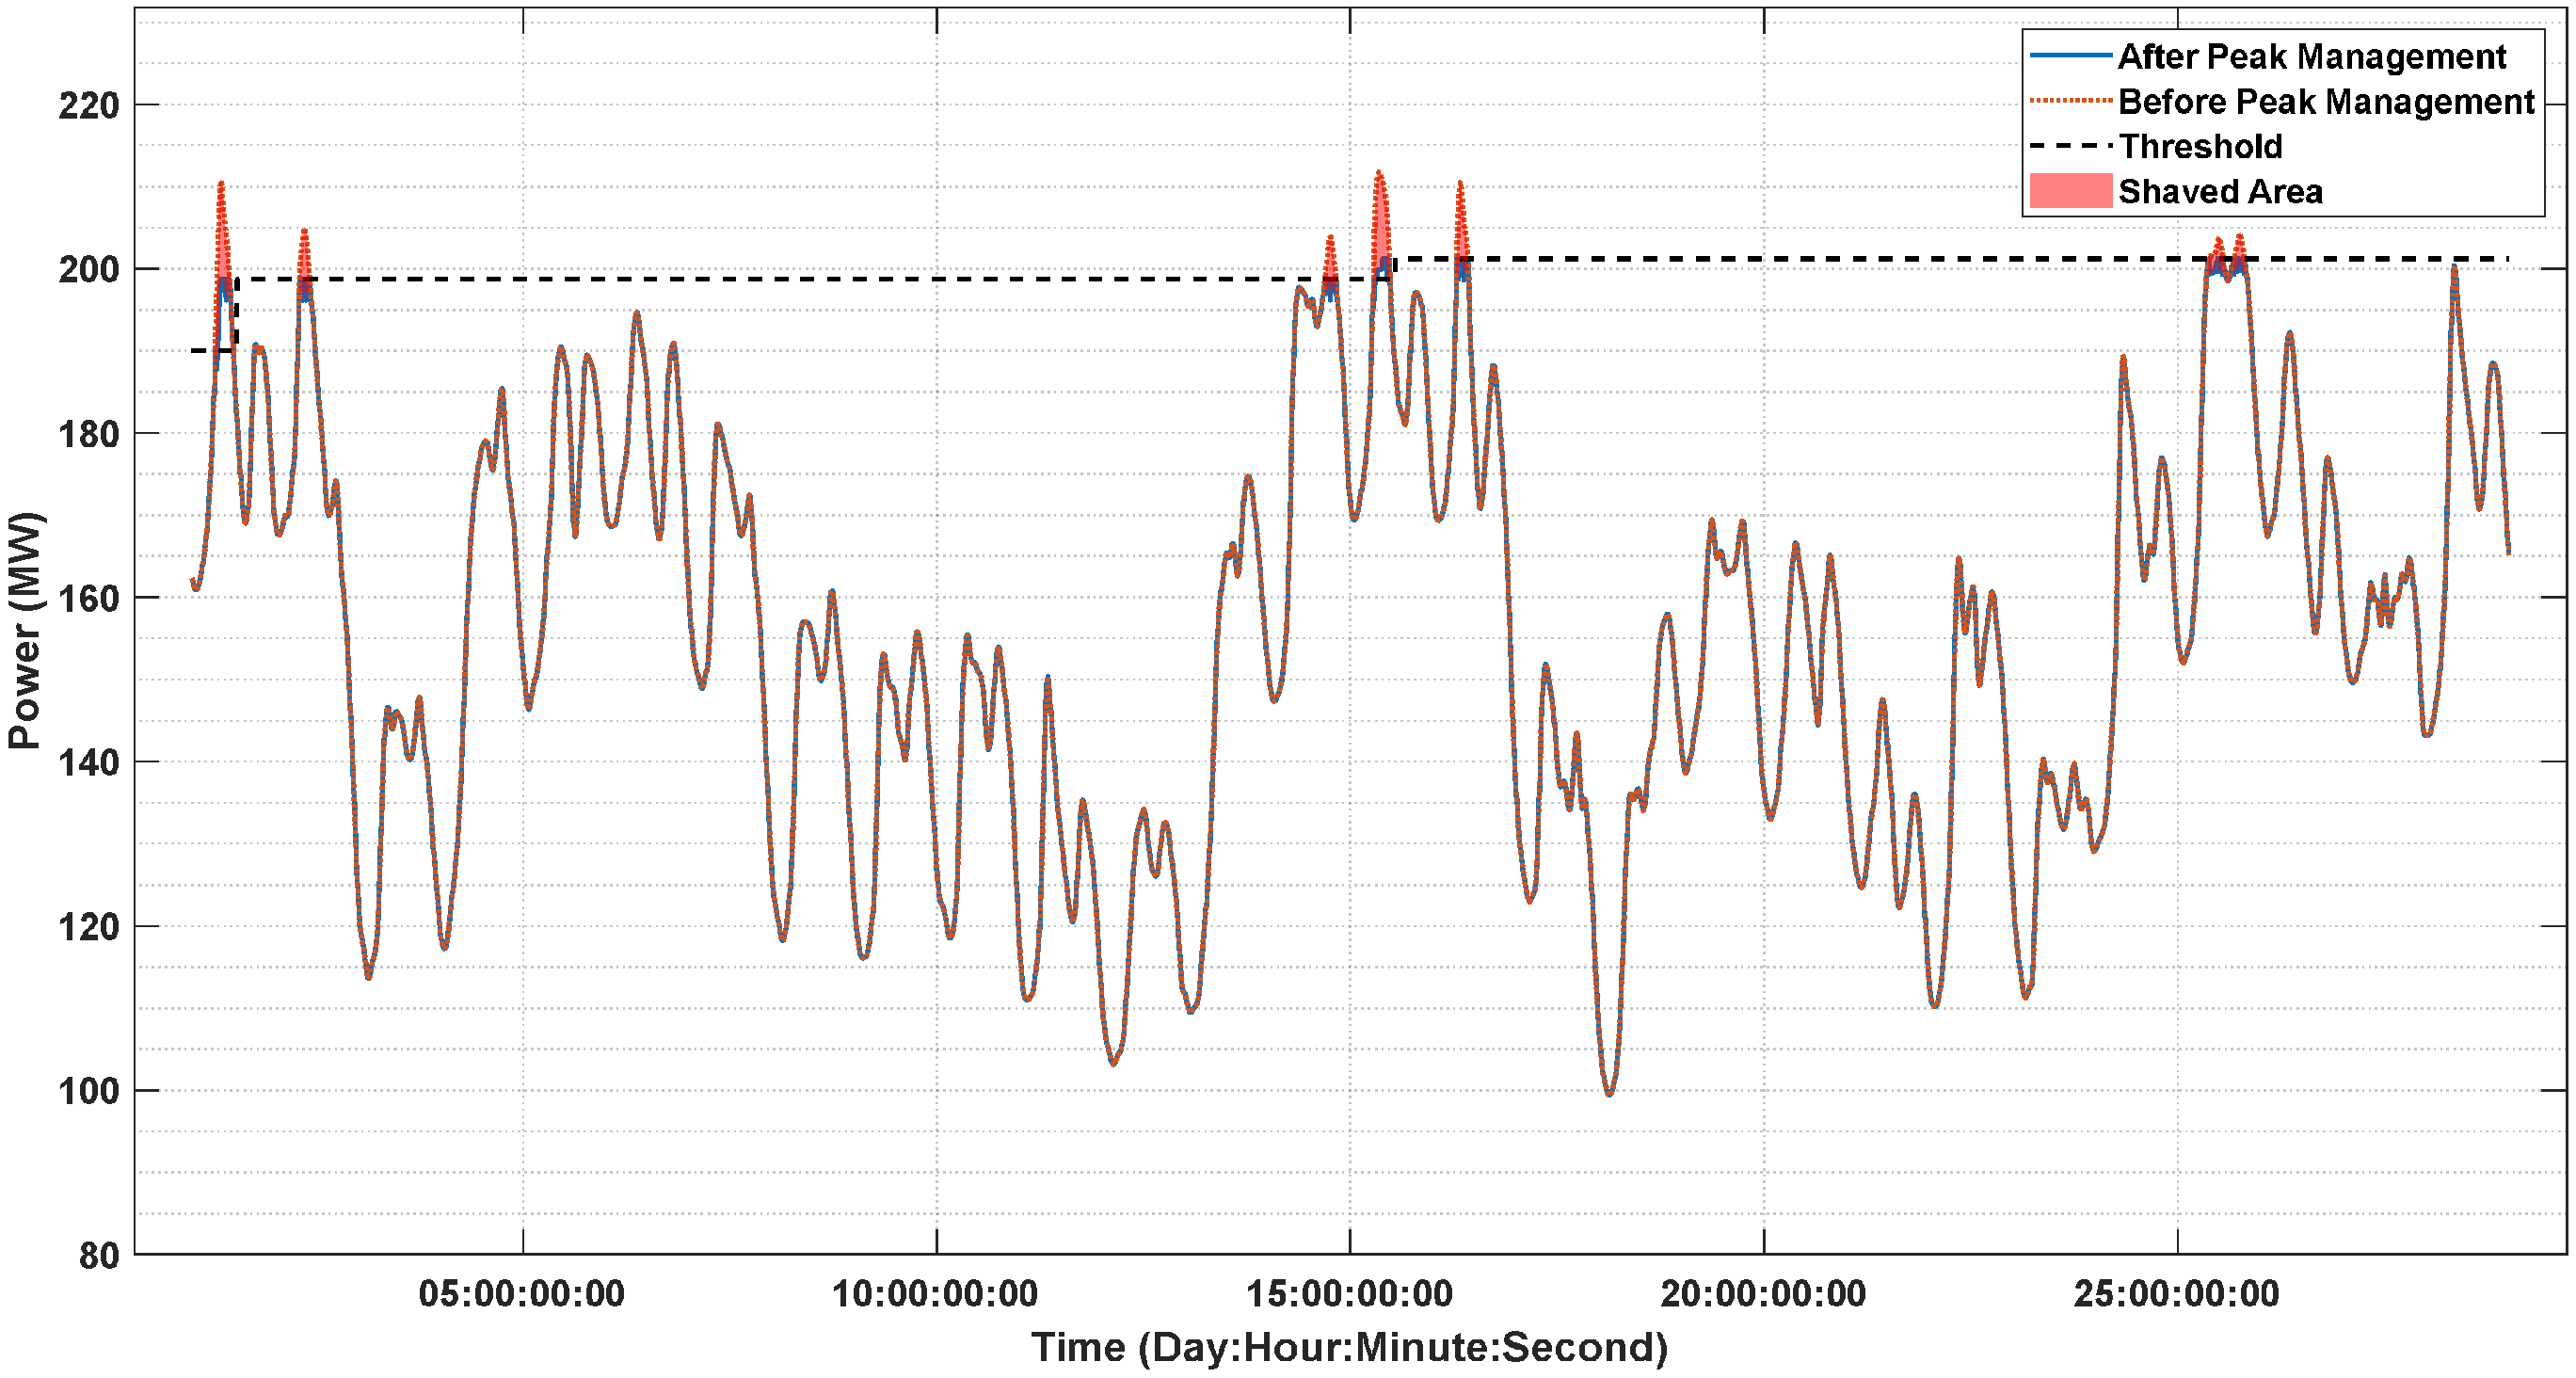
The results of the simulation for scenario 2 pertain to the billing cycle spanning from 2022-02-01 to 2022-02-28. Figure 10 provides an outline of the results related to the PM process during this billing cycle. The peak power observed between 2022-02-15, and 2022-02-17, prior to Peak Management, can be attributed to specific weather conditions. During this period, the area experienced unusually cold temperatures, leading to increased heating demands. This sudden rise in energy consumption required further explanation to highlight the nature of the area’s climate and its impact on energy usage patterns. The proposed algorithm is used to obtain the initial threshold value, which is equivalent to T h r = 190 MW. Six days are engaged in PM in this billing cycle and the threshold value is updated twice. The utilization of the proposed method for PM in this billing cycle and scenario led to a peak reduction of 10.49 MW.
The contributions of the VPP resources for the engaged days of this billing cycle are listed in Table 7. The most prominent peak during the billing cycle under study is observed on the date of 2022-02-15. A detailed account of the PM process for this day is depicted in Figure 11, Figure 12 and Figure 13, using the methodology proposed by our research.

5. Conclusions and Future Work

This article presented a self-scheduling VPP framework for PM of local distribution networks by optimizing the available resources while considering uncertainties and constraints. This framework is adaptable enough to be applied in two introduced billing scenarios. The proposed approach provides an efficient and reliable management system for a cluster of DERs for sustainable and cost-effective PM operation of the power grid. The research presented novel algorithms for determining threshold values and an approach for the transaction between VPPs and the model of aggregators. A robust optimization framework was proposed for self-scheduling all VPP resources for PM operation. The simulated implementation of the proposed VPP framework within a local distribution company yielded noteworthy outcomes. The framework in the first billing scenario demonstrated its effectiveness by successfully reducing energy consumption by an impressive 503.26 MWh during peak hours over a single billing cycle. Additionally, when applied to the second billing scenario, the VPP achieved a substantial peak reduction of 10.49 MW within a billing cycle. These compelling reductions in both scenarios signify a significant stride toward a more sustainable and cost-efficient operation of the power grid.
Future work on the proposed VPP framework should focus on integrating advanced forecasting techniques to improve the accuracy of energy consumption and renewable generation predictions. Enhancing the scalability and flexibility of the framework is essential to ensure its applicability across diverse and larger distribution networks. Additionally, comprehensive uncertainty modeling should be incorporated to better account for the variability and unpredictability associated with renewable energy sources and demand response behaviors. By addressing these areas, the VPP framework can be further refined to achieve more reliable and efficient peak management in power grids.

Author Contributions

Conceptualization, H.S. and E.C.G.; methodology, H.S. and E.C.G.; software, H.S.; validation, H.S.; formal analysis, H.S.; investigation, H.S.; resources, H.S.; data curation, H.S. and E.C.G.; writing—original draft preparation, H.S.; writing—review and editing, E.C.G.; visualization, H.S.; supervision, E.C.G.; project administration, E.C.G.; funding acquisition, E.C.G. All authors have read and agreed to the published version of the manuscript.

Funding

This research was funded by NSERC Collaborative Research and Development under Project CRDPJ537347-18.

Data Availability Statement

Data are contained within the article.

Conflicts of Interest

The authors declare no conflicts of interest.

References

  1. Chen, L.; Xu, Q.; Yang, Y.; Song, J. Optimal energy management of smart building for peak shaving considering multi-energy flexibility measures. Energy Build. 2021, 241, 110932. [Google Scholar] [CrossRef]
  2. Guo, W.; Liu, D.; Liu, M.; Zhang, H.; Wang, G.; Fan, B.; Xu, W. Demand-side resource response characteristics and peak shaving scheduling response model. Energy Rep. 2022, 8, 586–593. [Google Scholar] [CrossRef]
  3. Li, L.L.; Ji, B.X.; Liu, G.C.; Yuan, J.P.; Tseng, S.W.; Lim, M.K.; Tseng, M.L. Grid-connected multi-microgrid system operational scheduling optimization: A hierarchical improved marine predators algorithm. Energy 2024, 294, 130905. [Google Scholar] [CrossRef]
  4. Rafayal, S.; Alnaggar, A.; Cevik, M. Optimizing electricity peak shaving through stochastic programming and probabilistic time series forecasting. J. Build. Eng. 2024, 88, 109163. [Google Scholar] [CrossRef]
  5. Wang, Z.; Wang, J. Review on Implementation and Assessment of Conservation Voltage Reduction. IEEE Trans. Power Syst. 2013, 29, 1306–1315. [Google Scholar] [CrossRef]
  6. Chapaloglou, S.; Nesiadis, A.; Iliadis, P.; Atsonios, K.; Nikolopoulos, N.; Grammelis, P.; Yiakopoulos, C.; Antoniadis, I.; Kakaras, E. Smart energy management algorithm for load smoothing and peak shaving based on load forecasting of an island’s power system. Appl. Energy 2019, 238, 627–642. [Google Scholar] [CrossRef]
  7. Baringo, A.; Baringo, L.; Arroyo, J. Day-Ahead Self-Scheduling of a Virtual Power Plant in Energy and Reserve Electricity Markets Under Uncertainty. IEEE Trans. Power Syst. 2018, 34, 1881–1894. [Google Scholar] [CrossRef]
  8. Rouzbahani, H.M.; Karimipour, H.; Lei, L. A review on virtual power plant for energy management. Sustain. Energy Technol. Assess. 2021, 47, 101370. [Google Scholar] [CrossRef]
  9. Baringo, A.; Baringo, L. A Stochastic Adaptive Robust Optimization Approach for the Offering Strategy of a Virtual Power Plant. IEEE Trans. Power Syst. 2016, 32, 3492–3504. [Google Scholar] [CrossRef]
  10. Rahimi, M.; Ardakani, F.J.; Ardakani, A.J. Optimal stochastic scheduling of electrical and thermal renewable and non-renewable resources in virtual power plant. Int. J. Electr. Power Energy Syst. 2021, 127, 106658. [Google Scholar] [CrossRef]
  11. Oshnoei, A.; Kheradmandi, M.; Blaabjerg, F.; Hatziargyriou, N.D.; Muyeen, S.M.; Anvari-Moghaddam, A. Coordinated control scheme for provision of frequency regulation service by virtual power plants. Appl. Energy 2022, 325, 119734. [Google Scholar] [CrossRef]
  12. Wang, Y.; Gao, W.; Qian, F.; Li, Y. Evaluation of economic benefits of virtual power plant between demand and plant sides based on cooperative game theory. Energy Convers. Manag. 2021, 238, 114180. [Google Scholar] [CrossRef]
  13. Liu, W.; Xu, H.; Wang, X.; Zhang, S.; Hu, T. Optimal dispatch strategy of virtual power plants using potential game theory. Energy Rep. 2022, 8, 1069–1079. [Google Scholar] [CrossRef]
  14. Wang, S.; Wu, W. Aggregate Flexibility of Virtual Power Plants with Temporal Coupling Constraints. IEEE Trans. Smart Grid 2021, 12, 5043–5051. [Google Scholar] [CrossRef]
  15. Chen, J.; Liu, M.; Milano, F. Aggregated Model of Virtual Power Plants for Transient Frequency and Voltage Stability Analysis. IEEE Trans. Power Syst. 2021, 36, 4366–4375. [Google Scholar] [CrossRef]
  16. Li, Z.; Liu, M.; Xie, M.; Zhu, J. Robust optimization approach with acceleration strategies to aggregate an active distribution system as a virtual power plant. Int. J. Electr. Power Energy Syst. 2022, 142, 108316. [Google Scholar] [CrossRef]
  17. Wang, J.; Guo, C.; Yu, C.; Liang, Y. Virtual power plant containing electric vehicles scheduling strategies based on deep reinforcement learning. Electr. Power Syst. Res. 2022, 205, 107714. [Google Scholar] [CrossRef]
  18. Falabretti, D.; Gulotta, F.; Siface, D. Scheduling and operation of RES-based virtual power plants with e-mobility: A novel integrated stochastic model. Electr. Power Energy Syst. 2023, 144, 108604. [Google Scholar] [CrossRef]
  19. Dong, Z.; Zhang, Z.; Huang, M.; Yang, S.; Zhu, J.; Zhang, M.; Chen, D. Research on day-ahead optimal dispatching of virtual power plants considering the coordinated operation of diverse flexible loads and new energy. Energy 2024, 297, 131235. [Google Scholar] [CrossRef]
  20. Shad, M.; Momeni, A.; Errouissi, R.; Diduch, C.P.; Kaye, M.E.; Chang, L. Identification and Estimation for Electric Water Heaters in Direct Load Control Programs. IEEE Trans. Smart Grid 2015, 8, 947–955. [Google Scholar] [CrossRef]
  21. Arafat, I.; Shokouhinejad, H.; Guerra, E.C.; Meng, J.; Barrera, J.C. Maximum Reserved Capacity of Aggregated Electric Water Heaters Virtual Battery for Peak Management. IEEE Access 2024, 12, 67574–67588. [Google Scholar] [CrossRef]
  22. Pérez-Fargallo, A.; Bienvenido-Huertas, D.; Contreras-Espinoza, S.; Marín-Restrepo, L. Domestic hot water consumption prediction models suited for dwellings in central-southern parts of Chile. J. Build. Eng. 2022, 49, 104024. [Google Scholar] [CrossRef]
  23. Hao, H.; Sanandaji, B.M.; Poolla, K.; Vincent, T.L. Aggregate Flexibility of Thermostatically Controlled Loads. IEEE Trans. Power Syst. 2014, 30, 189–198. [Google Scholar] [CrossRef]
  24. Hamilton, J.; Negnevitsky, M.; Wang, X. The potential of variable speed diesel application in increasing renewable energy source penetration. Energy Procedia 2019, 160, 558–565. [Google Scholar] [CrossRef]
  25. Trevizan, R.D.; Headley, A.J.; Geer, R.; Atcitty, S.; Gyuk, I. Integration of energy storage with diesel generation in remote communities. MRS Energy Sustain. 2021, 8, 57–74. [Google Scholar] [CrossRef]
  26. Nadimi, R.; Takahashi, M.; Tokimatsu, K.; Goto, M. The Reliability and Profitability of Virtual Power Plant with Short-Term Power Market Trading and Non-Spinning Reserve Diesel Generator. Energies 2024, 17, 2121. [Google Scholar] [CrossRef]
Figure 1. Structure of proposed VPP.
Energies 17 02705 g001
Figure 2. Flowchart of proposed algorithm to determine threshold value for scenario 1.
Energies 17 02705 g002
Figure 3. Aggregated power consumption of 500 EWT for two different values γ e .
Energies 17 02705 g003
Figure 4. Flowchart of the proposed algorithm to determine the best value of γ i .
Energies 17 02705 g004
Figure 5. Actual load profile before PM from 2022-03-01 to 2022-03-31.
Energies 17 02705 g005
Figure 6. The outcomes of reducing energy consumption on a daily basis for Scenario 1.
Energies 17 02705 g006
Figure 7. Results of applying Scenario 1 on 2022-03-01.
Energies 17 02705 g007
Figure 8. The Contribution of CVR, DG and UB towards managing peak demand on 2022-03-01.
Energies 17 02705 g008
Figure 9. The Contribution of the aggregators towards managing peak demand on 2022-03-01.
Energies 17 02705 g009
Figure 10. Summary of outcomes related to PM process for scenario 2.
Energies 17 02705 g010
Figure 11. The results of PM process on 2022-02-15.
Energies 17 02705 g011
Figure 12. Contribution profiles of CVR, DG and UB on 2022-02-15.
Energies 17 02705 g012
Figure 13. Contribution profiles of the aggregators on 2022-02-15.
Energies 17 02705 g013
Table 1. Voltage reduction percentage of CVR technique.
Tap Position12345
Δ V ( % ) 00.981.752.53.77
Table 2. Parameters of UB.
E u P u , r SOC u , min SOC u , max η u , c η u , d
2.5 (MWh)1.25 (MW)10%90%0.950.95
Table 3. Parameters of TCL aggregator.
EWH AggregatorBH AggregatorHP Aggregator
N e = 5000 N b = 1200 N h = 200
P e , r = 1.5–4.5 (KW) P b , r = 1–2.5 (KW) P h , r = 4 (KW)
C e = 0.17–0.35 (KWh/°C) C b = 1.5–3 (KWs/°C) C h = 3–4 (KWs/°C)
R e = 0.78–1.46 (°C/W) R b = 4–7 (°C/KW) R h = 2.4–3.4 (°C/KW)
Table 4. Parameters of RB aggregator.
N rb E rb P rb , r SOC rb , min SOC rb , max η rb , c η rb , d
507.7–19.4 (KWh)2.5–9.7 (KW)10%90%0.920.92
Table 5. Weights of the objectives.
α f = 100 α c = 1 α u = 2 -----
β f = 100 β c = 1 β u = 2 β e = 5 β b = 5 β h = 5 β r b = 5 β d = 10
Table 6. Energy reduction contribution of the VPP resources.
CVRUBEWHBHHPRBDG
17.37 (MWh)1.66 (MWh)1.84 (MWh)0.81 (MWh)0.096 (MWh)0.16 (MWh)1.02 (MWh)
Table 7. The extent to which VPP resources contributed during the days they were engaged in PM.
Date-ResourceCVRUBEWHBHHPRBDG
2022-02-0126.7 (MWh)2.2 (MWh)2.49 (MWh)1.3 (MWh)0.078 (MWh)0.22 (MWh)1 (MWh)
2022-02-0215.14 (MWh)------
2022-02-1412.33 (MWh)------
2022-02-1533.21 (MWh)2.2 (MWh)3.53 (MWh)1.67 (MWh)0.15 (MWh)0.29 (MWh)1.1 (MWh)
2022-02-1618.47 (MWh)0.76 (MWh)-----
2022-02-2517.63 (MWh)------
Disclaimer/Publisher’s Note: The statements, opinions and data contained in all publications are solely those of the individual author(s) and contributor(s) and not of MDPI and/or the editor(s). MDPI and/or the editor(s) disclaim responsibility for any injury to people or property resulting from any ideas, methods, instructions or products referred to in the content.