1. Introduction
At a certain stage in the production life, artificial lift or tertiary recovery systems become inevitable for oil and gas wells worldwide. The main target for every operator company from the exploration to development phase is to optimize drilling and production of a well. When the natural reservoir pressure declines, artificial lift equipment are installed within the primary recovery stage to extract hydrocarbon from reservoir. Artificial lift systems play a pivotal role in ensuring the continued extraction of hydrocarbons from reservoirs that have undergone pressure depletion. Various forms of artificial lift equipment, such as sucker rod pumps (SRPs) or beam pumps, electrical submersible pumps (ESPs), plunger lifts, and progressive cavity pumps (PCPs), are selected based on specific operating conditions. The performance of these technologies is significantly impacted by the presence of gas in the production fluid, which can diminish the efficiency of the equipment and lead to increased non-productive time (NPT). A downhole gas separator is a device designed to separate gas from the liquid–gas mixture stream within the subsurface environment. It effectively channels gas into the casing–tubing annulus to be brought to the surface, while directing the liquid into the pump and up through the tubing string. By segregating gas from liquids, the separator enhances the effectiveness of artificial lift systems, boosts the productivity of the wellbore, and minimizes non-productive time [
1,
2].
Gas separator technology initially started as a water management tool and, with time, advanced significantly. Ref. [
3] mentioned that gas separators, also known as gas anchors, were used to separate oil and gas from the produced water downhole, discharging the oil and gas mixture into the fluid stream and injecting produced water into the disposal zones. Hydrocyclone and gravity processes were used to segregate fluids in these separators. Also, if separating gas in the downhole is challenging, less efficient methods like hydraulic pump and gas lift methods could be used, rather than electrical submersible pump (ESP) of high flowrate capacity. Ref. [
4] mentioned that gas separators expand the operating window for ESP, especially in high gas–oil ratio (GOR) wells. Natural gas separators, poor boy separators, modified poor boy separators, packer-type separators, and special separators are some of the most common downhole separators used in oil and gas wells. The oldest and most efficient separators are natural gas separators, and further research was conducted by modifying their shape and evaluating their separation efficiency [
5,
6,
7,
8]. Almost all types of separators work on the principle of gravity. A major disadvantage of gravitational separators is the time consumed during the separation. Modifying the design of separators, for instance by adding a centrifugal section in the separator that uses centrifugal force, enhances and accelerates the process. Stokes’ law governs the physical mechanism of gas–liquid separation [
9]. This law describes how a particle (or bubble) travels through a fluid, depending on its size, viscosity, and density. Centrifugal separators force an inflowing stream into a swirling motion to create a vortex-type phenomenon. This movement can be obtained by abruptly changing the direction of the fluid tangentially or by using helical elements or designs such as augers [
9].
In the past, different types of downhole separators have been experimentally investigated. Ref. [
10] presented a detailed laboratory investigation into the efficiency of different downhole gas separator designs, challenging common industry assumptions with experimental data. The study highlights the importance of separator entry port placement, dip tube length, and the innovative use of centrifugal forces in enhancing gas–liquid separation efficiency [
10]. Similarly, Refs. [
1,
2] conducted a study on the effectiveness of a prototype centrifugal packer-type downhole separator, examining its performance under different liquid and gas flow rates. Through laboratory experiments using a multiphase flow setup, it was discovered that the separator’s average gas separation efficiency was notably high, particularly at medium liquid flow rates [
1,
2]. Ref. [
11] conducted multiple tests to evaluate a newly designed centrifugal packer-type downhole separator for artificial lift systems in oil and gas wells. The research found the separator consistently achieved over 90% liquid separation efficiency across various conditions, although efficiency slightly dropped at higher liquid rates. This highlights the separator’s potential to significantly reduce gas-related issues in pumping systems, marking a notable advancement in artificial lift technologies [
11]. Ref. [
12] conducted a comparative analysis between centrifugal and gravitational downhole separators, evaluating the performance of each through over 150 tests for centrifugal separators and 55 tests for gravitational separators. Their findings indicated that centrifugal separators outperformed gravitational separators in terms of separation efficiency. The research aimed to assess the impact of flow rates on the performance and stability of a newly developed packer-type centrifugal separator, contrasting it with that of a gravitational separator [
12]. Ref. [
13] developed and validated a numerical model to evaluate a hybrid separator combined with a piston pump, utilizing two-phase turbulent CFD analysis. The study examines the impact of piston speed and gas/liquid ratio on the separator’s performance, highlighting that higher piston speeds decrease efficiency due to greater pressure drops. It also introduces a correlation for predicting separator efficiency, providing key insights for optimizing downhole separator design and operation [
13]. Ref. [
14] reviewed advancements, limitations, and applications of downhole liquid–gas separators in oil and gas operations, emphasizing their importance in enhancing artificial lift systems. The study provides insights into optimizing separator designs for improved performance in unconventional wells, underlining the need for further research to address current challenges and enhance separator efficiency [
14].
Machine learning (ML) has previously been applied to drilling, reservoir, and production data to enhance drilling and production efficiency of oil and gas wells. However, only two past works have conducted studies on gas separation efficiency of downhole separator by employing ML. Ref. [
15] showed that centrifugal separators utilize this principle by inducing a swirling motion in an incoming flow to create a vortex effect. Stokes’ law outlines the behavior of a particle (or bubble) moving through a fluid, influenced by its size, viscosity, and density. This action is achieved by either abruptly altering the fluid’s direction tangentially or employing helical structures [
15]. Operating on a basis similar to gravitational separators, centrifugal separators leverage the difference in densities between gas and liquid. The centrifugal force propels the denser liquid toward the vortex’s outer edge, while the gas remains closer to the center [
15]. Ref. [
16] study advances the understanding of downhole centrifugal separators in oil and gas extraction by leveraging ML and dimensional analysis to pinpoint critical efficiency factors. The research, grounded on a comprehensive database from prior studies, shows separators can reach over 79% efficiency under certain conditions, though this declines with higher fluid rates. It introduces a predictive model emphasizing the importance of the Weber and gas Reynolds numbers, offering valuable insights for enhancing artificial lift system designs [
15,
17].
In the past, machine learning has been applied to predict separation efficiency of the downhole gas separator in a limited number of studies using multiple independent variables. However, prediction of separation efficiency of the downhole gas separator with blind test has not been performed in the past using supervised machine learning method by incorporating only two independent variables. In this study, a model was trained using experimental test data from a centrifugal-type downhole separator and then tested on a gravity-based downhole gas separator experimental test data in what is referred to as a blind test. To quantify the separators’ efficiency, the gas volume flow per minute at the outlet was predicted based on the liquid and gas volume flows at the inlet, from which the gas separation efficiency was subsequently calculated. The formula to calculate gas separation efficiency is shown below.
3. Facility Design to Test Downhole Separator
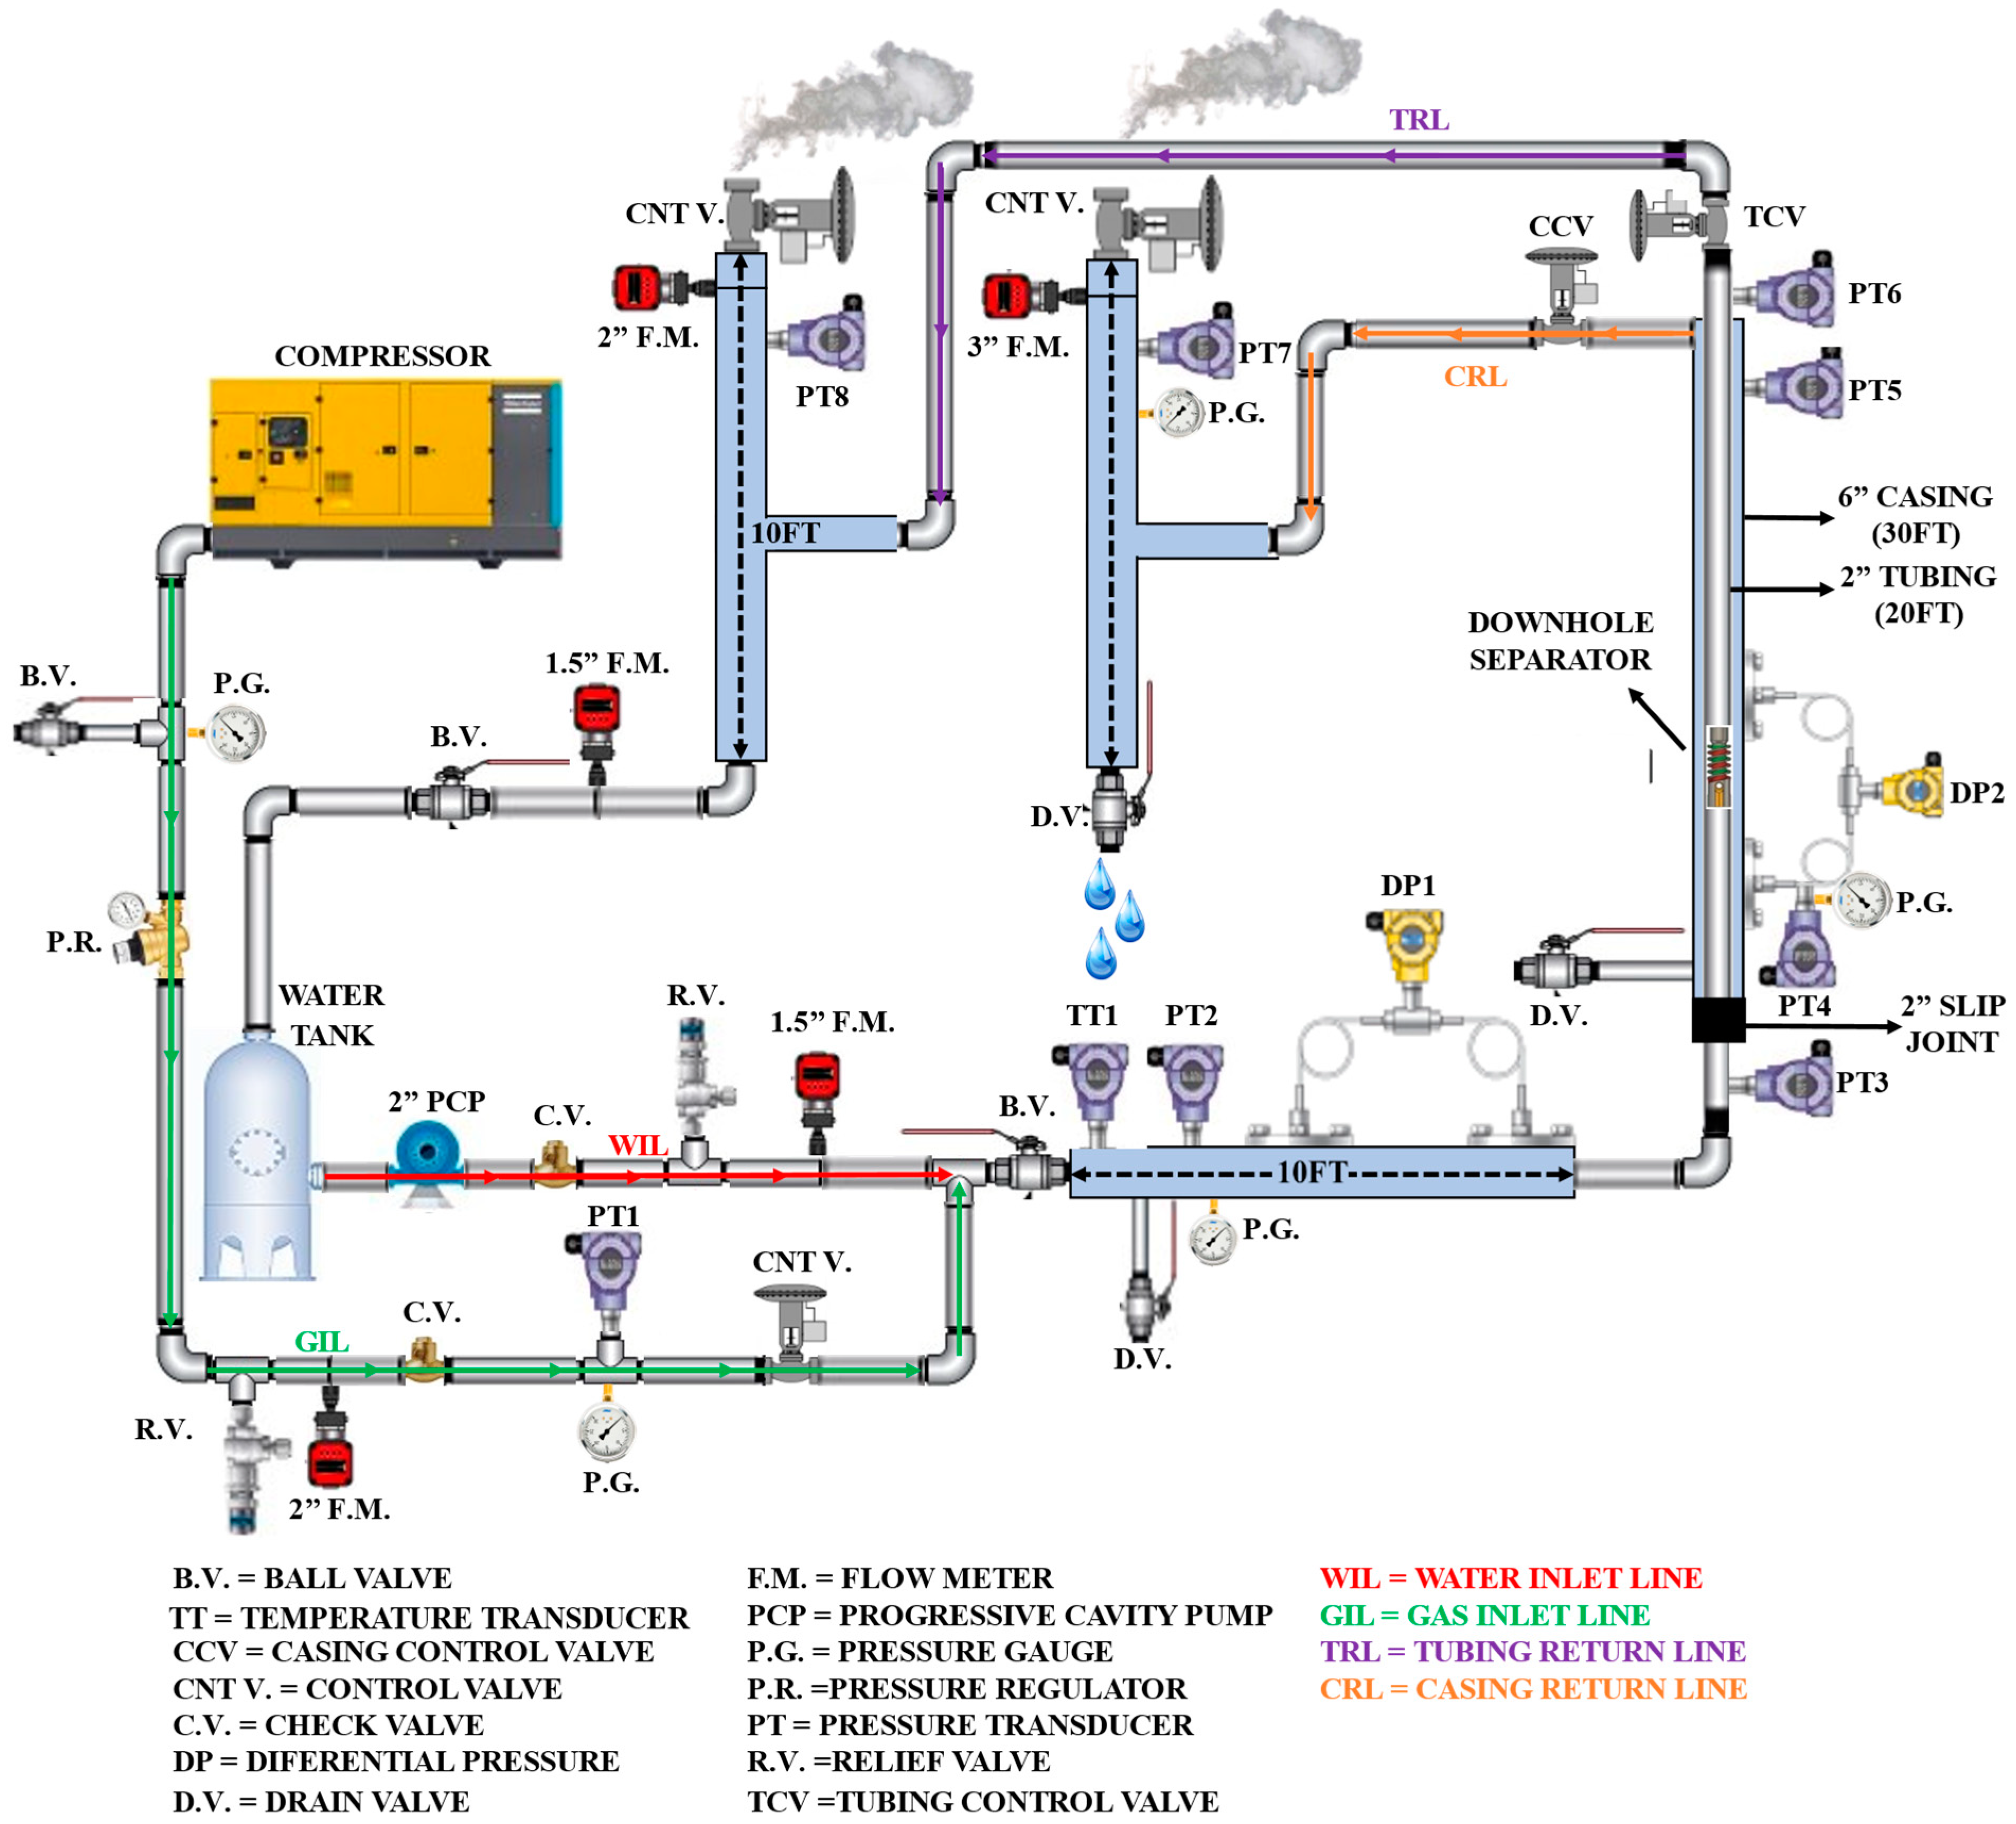
A comprehensive multiphase flow system was constructed for this purpose, extending 31 feet in length horizontally and rising 27 feet vertically. The centrifugal downhole gas separator was provided by Echometer Company, located in Texas, United States. As depicted in
Figure 1, the system encompasses the gas and water inlet lines, horizontal and vertical sections, and both tubing and casing return lines, comprising the full multiphase flow setup. Instrumentation within the configuration includes five Coriolis flowmeters, five control valves, and eight pressure transducers, supplemented by various manual pressure gauges and two differential pressure gauges. These instruments are all connected to a central data acquisition system (DAQ) for real-time monitoring and control of the flow parameters, with the DAQ cards being operated via Visual Basic software. In each experiment, the setup, featuring over 20 pieces of equipment, captures more than 30 different variables, such as pressure, temperature, density, and flow rates. As detailed in
Figure 1, the tubing return line (TRL) connects to the tubing flow path, while the casing return line (CRL) links to the casing–tubing annulus flow path. Through the forces of gravity and centrifugal motion, the downhole gas separator segregates the liquid and gas within the vertical section, directing the liquid or water through the tubing to the TRL and the gas through the annulus to the CRL. Consequently, the flowmeter at the top of the CRL measures the gas, and the flowmeter at the bottom of the TRL measures the liquid or water. The flowmeter installed at the top of TRL measures gas flow, if there is any gas flow from the tubing. The gas volume flow per minute at the outlet (GVFO), which is the CRL, is utilized to forecast the efficiency of the downhole separator, calculated based on the liquid and gas volume flow per minute at the inlet (LVFI and GVFI) located at the T-section.
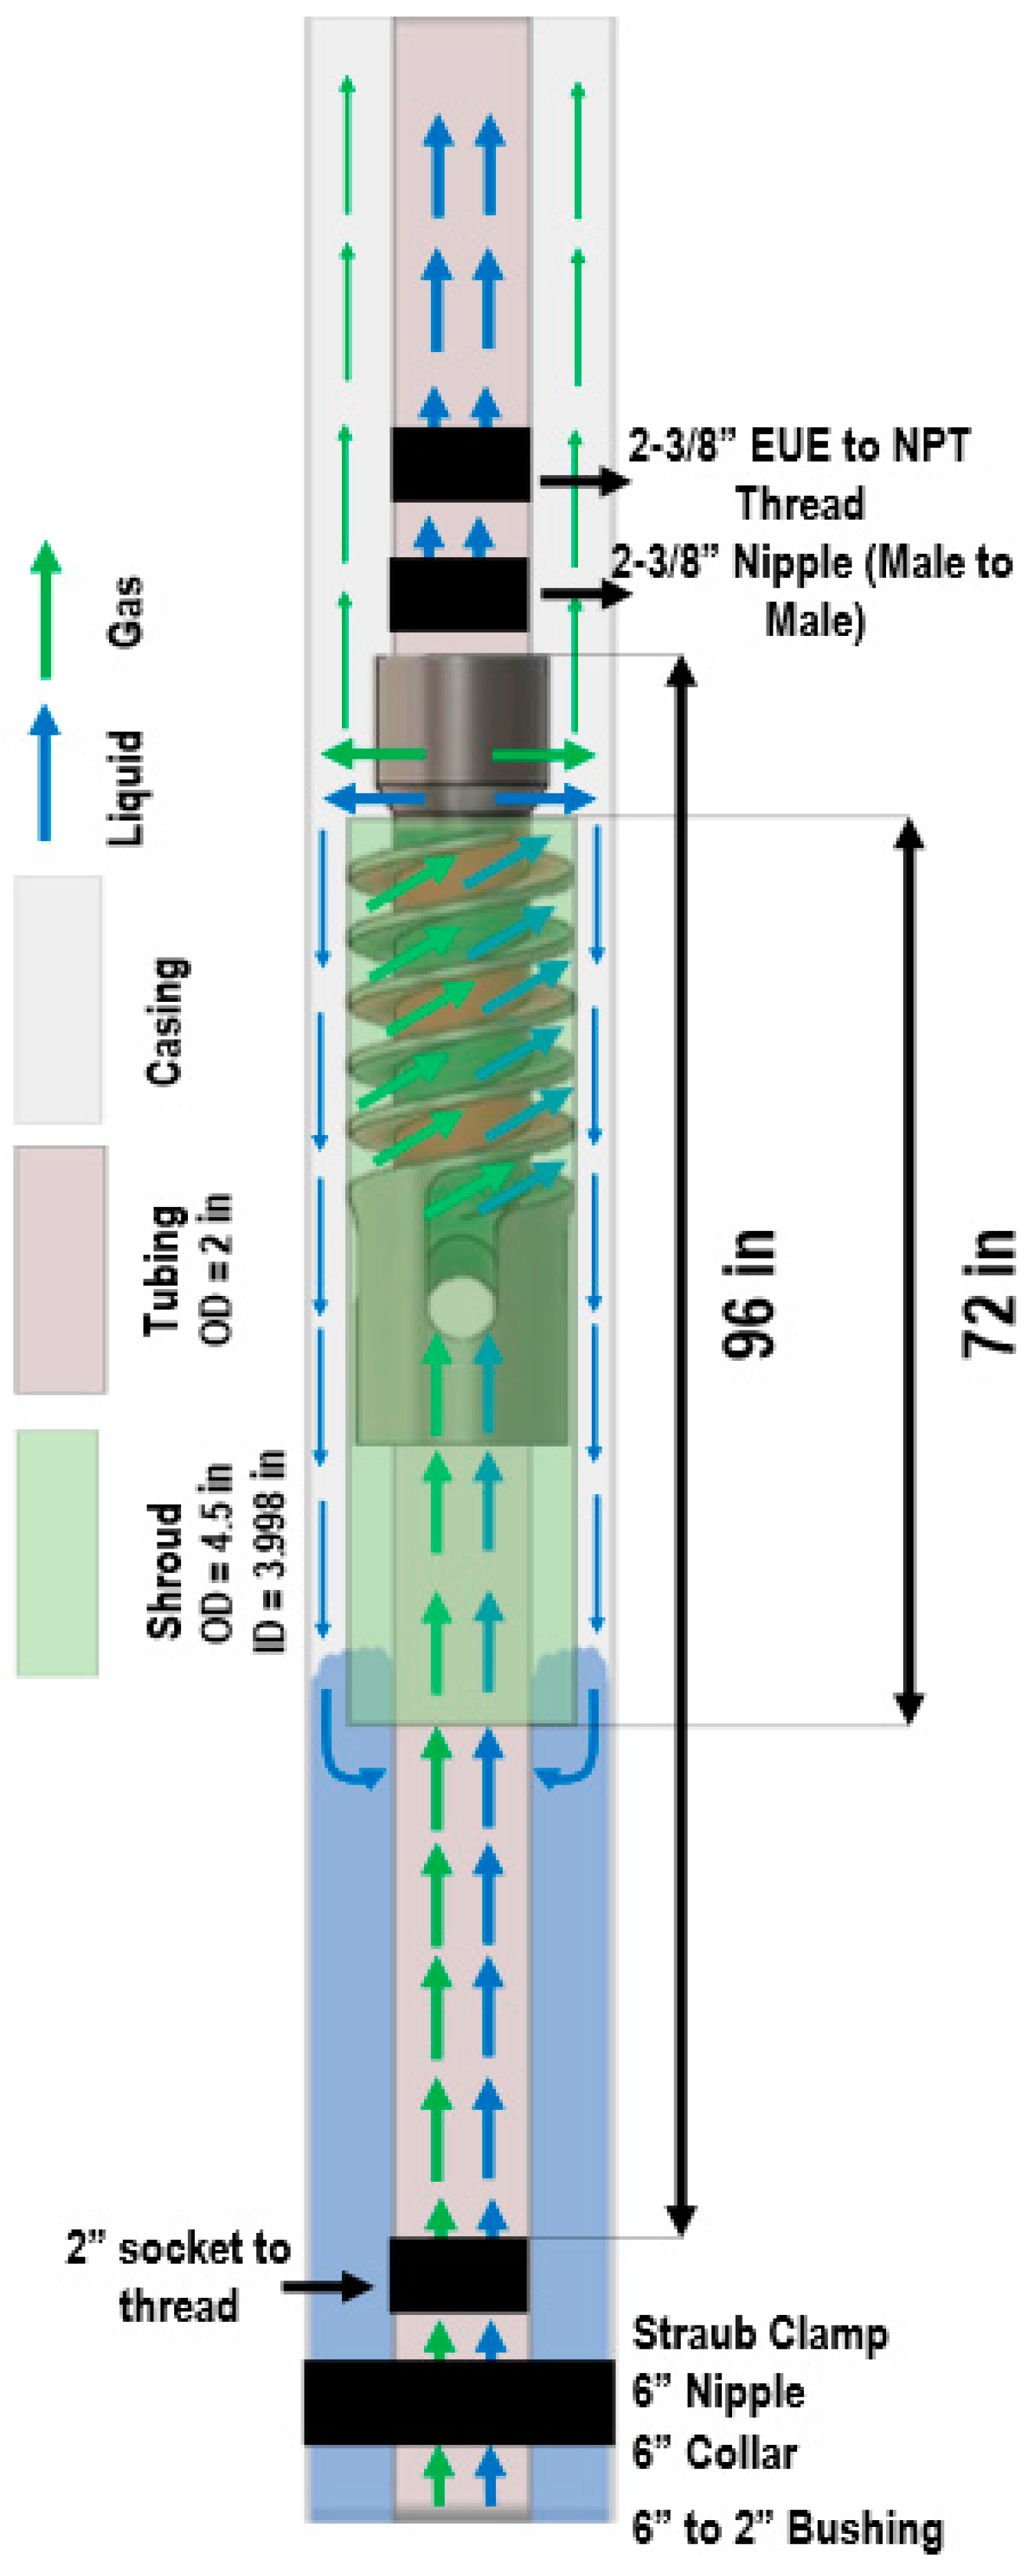
The gas separator provided by Echometer Company is shown in
Figure 2, showcasing a design concept for a static centrifugal packer-type downhole separator. This separator is particularly beneficial in wells with high gas-to-oil ratios, effectively addressing issues such as diminished artificial lift performance and gas lock. A key advantage of this gas separator is its lack of moving parts (static), which significantly reduces maintenance requirements and can help operating companies minimize non-productive time. The separator’s design allows for the entry of the gas–liquid mixture through two ports, depicted in green and red in
Figure 2. The rotational motion generated by the spiral section, coupled with the centrifugal force at the outlet, forces liquid droplets to impinge against the casing’s inner wall, thereby enhancing liquid and gas separation at the outlet. The separated liquid, under gravity, descends into the casing–tubing annulus and is channeled into the separator’s shroud, subsequently ascending through the tubing-shroud annulus into the two intake ports.
4. Methodology
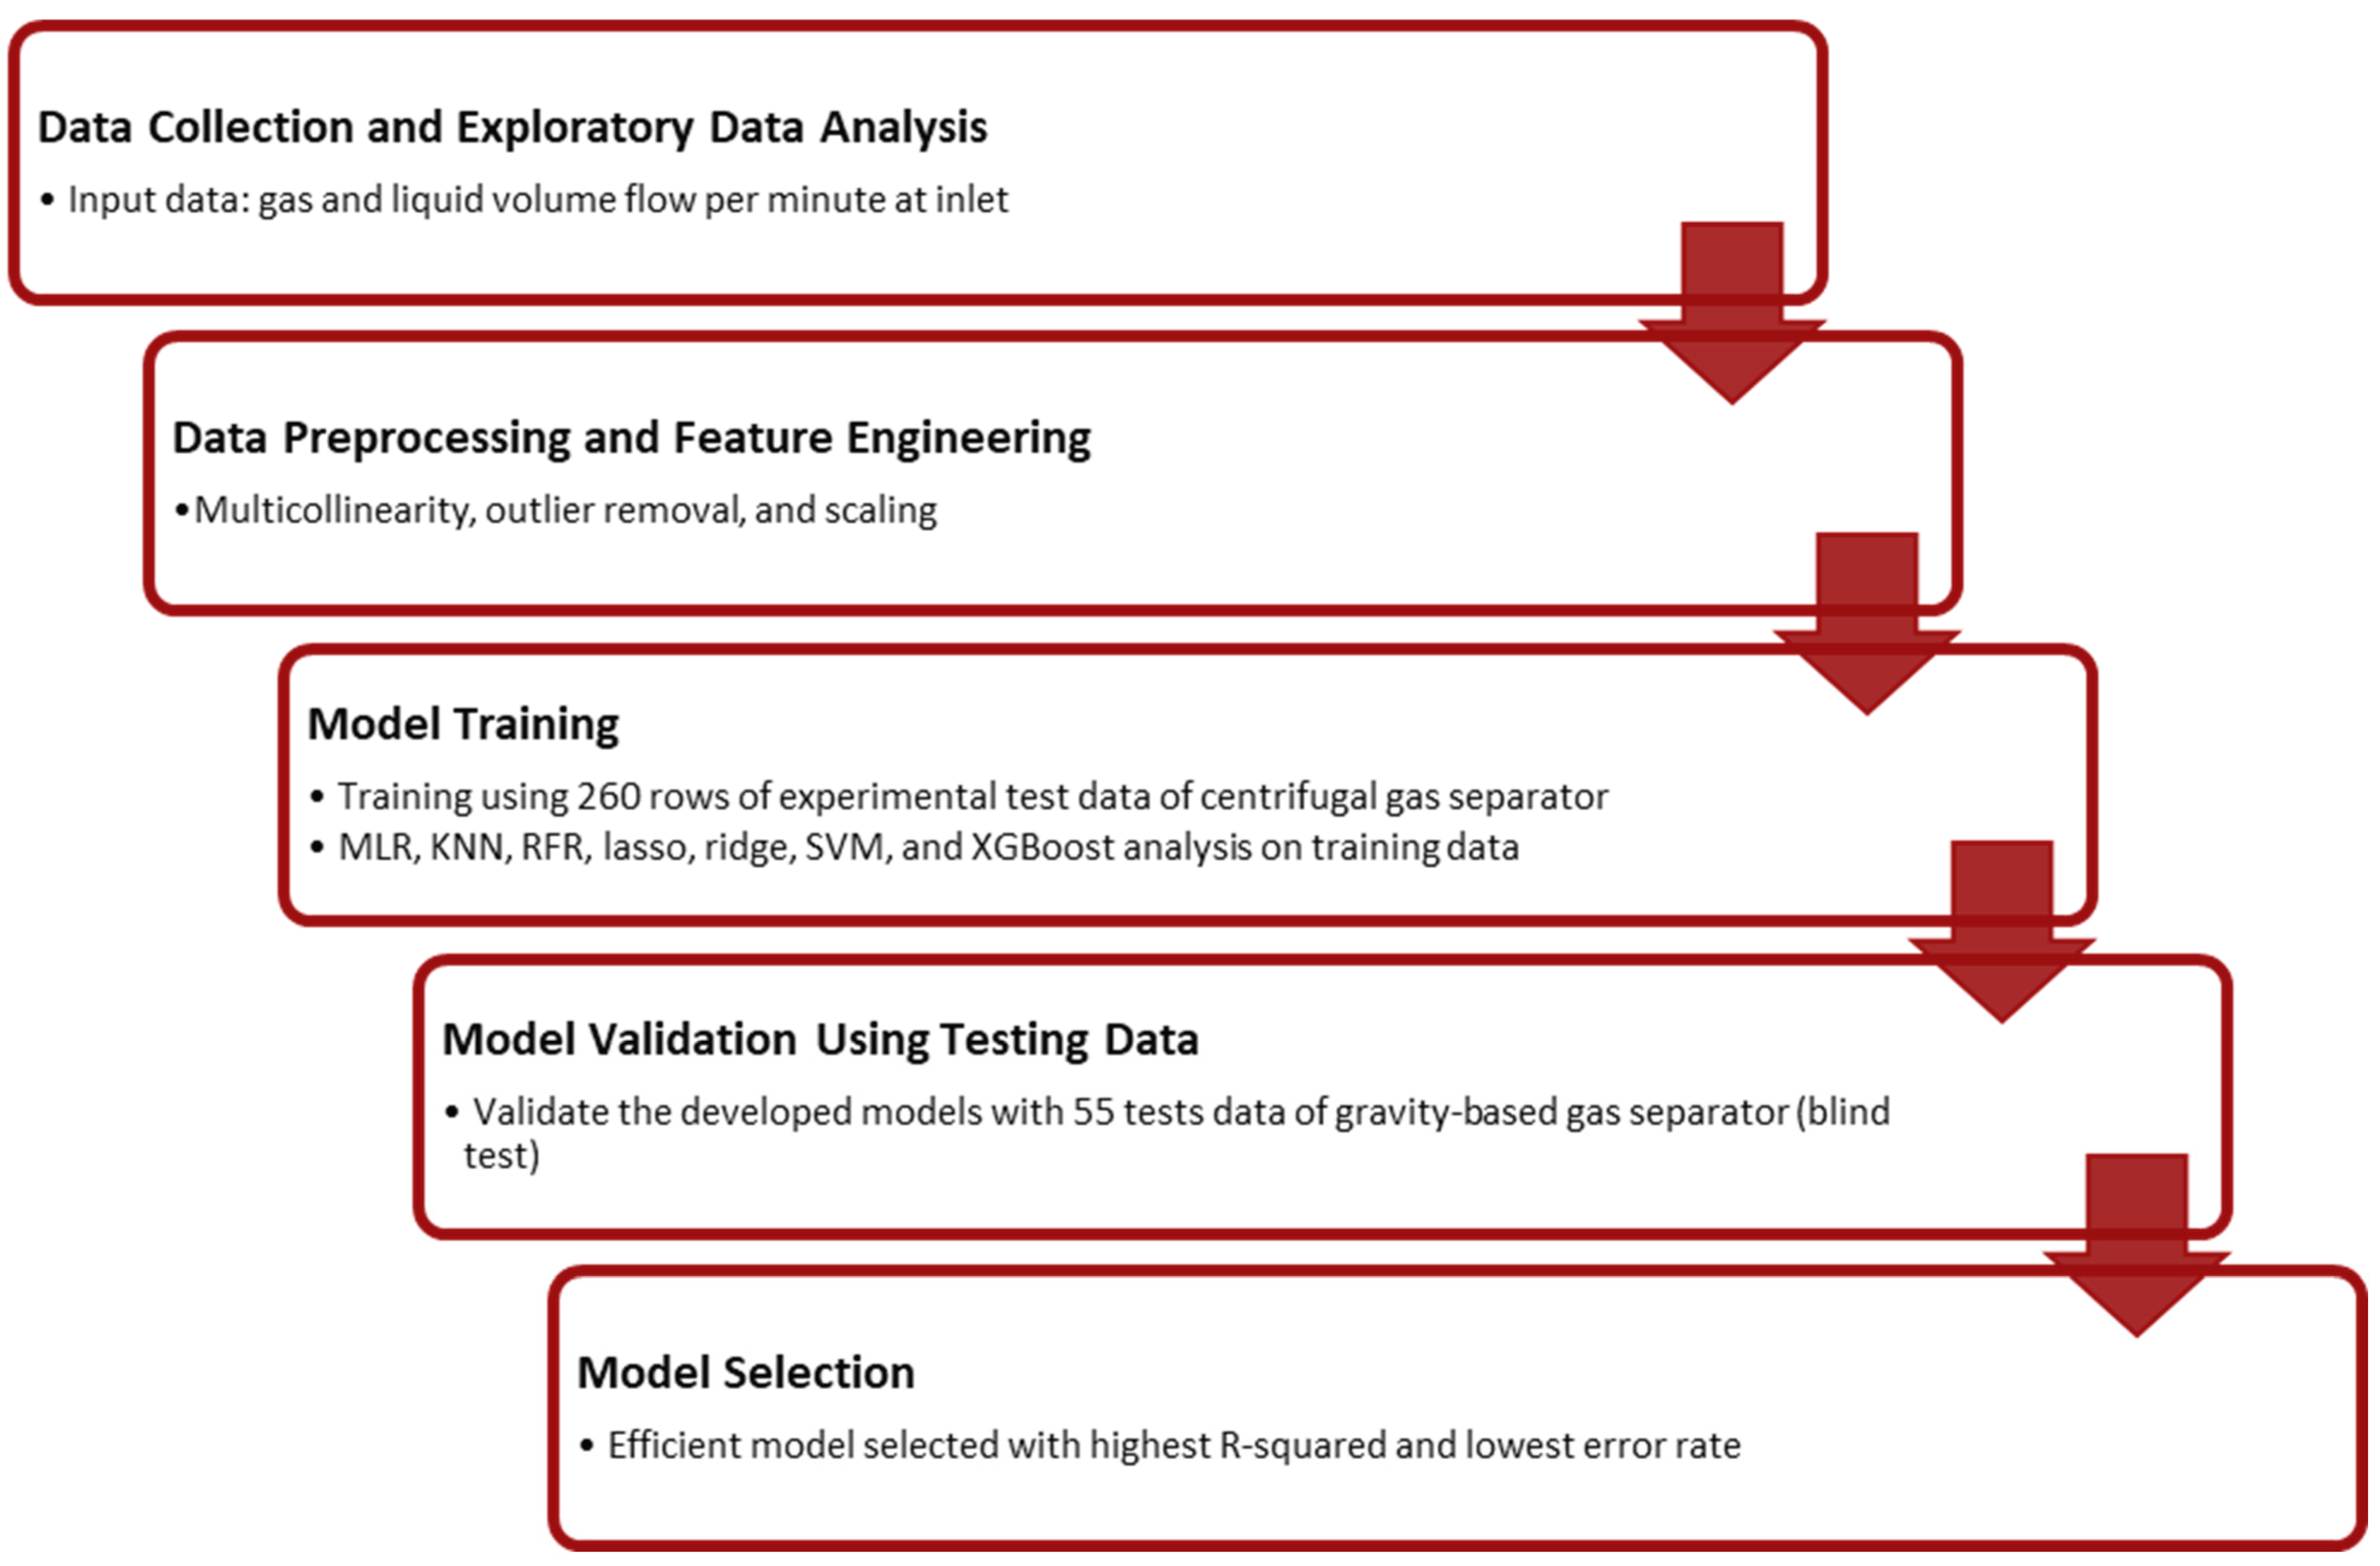
This section outlines the development and application of various ML algorithms, including multiple linear regression (MLR), k-nearest neighbors (KNN), random forest regression (RFR), support vector machine (SVM), ridge, lasso, and XGBoost, with the objective of forecasting the gas separation efficiency in downhole separators. The workflow is visually represented in
Figure 3, which illustrates the comprehensive steps involved: data collection, data processing, model training and testing, followed by efficient model selection. The comparative analysis of all regression models is performed based on the R-squared and error metrics as mentioned in [
19,
20,
21] for efficient model selection.
The experimental setup, comprising over 20 different pieces of apparatus, records more than 30 distinct variables such as pressure, temperature, and flow rates in each test run. Given the extensive nature of this dataset, it is crucial to judiciously select independent variables that predict the separator’s efficiency. This selection process relies on methods such as scatter and correlation plotting, alongside multicollinearity analysis. Further elaboration on input parameter selection and multicollinearity assessment is provided in subsequent sections. Prior to being included in model training and testing, the selected independent variables undergo scaling and outlier removal. The dataset used for training and testing the ML models comprises 260 rows of data collected from experimental testing of centrifugal separator efficiency, and 55 rows of data collected from experimental testing of gravity-based downhole separator efficiency, respectively.
In this research, the effectiveness of the models was compared and assessed using metrics such as the coefficient of determination (R-squared), root mean square error (RMSE), and mean absolute percentage error (MAPE). Models with low R-squared values and high error rates were eliminated. The model demonstrating the highest R-squared and the lowest error rates was ultimately selected as the most reliable for predicting the efficiency of the downhole separator. This approach not only ensures accuracy but also contributes to optimizing the separator’s performance in practical scenarios.
Data Preprocessing and Feature Engineering
In this study, two critical independent variables were identified for predicting the gas volume flow per minute at the outlet (GVFO), the gas volume flow (GVFI) and the liquid volume flow per minute (LVFI), both measured at the inlet. A thorough analysis of the experimental data was conducted, including examination for multicollinearity, as discussed later in this section. This analysis determined that GVFI and LVFI were the most impactful predictors, ensuring that the final model was not adversely affected by collinearity between variables.
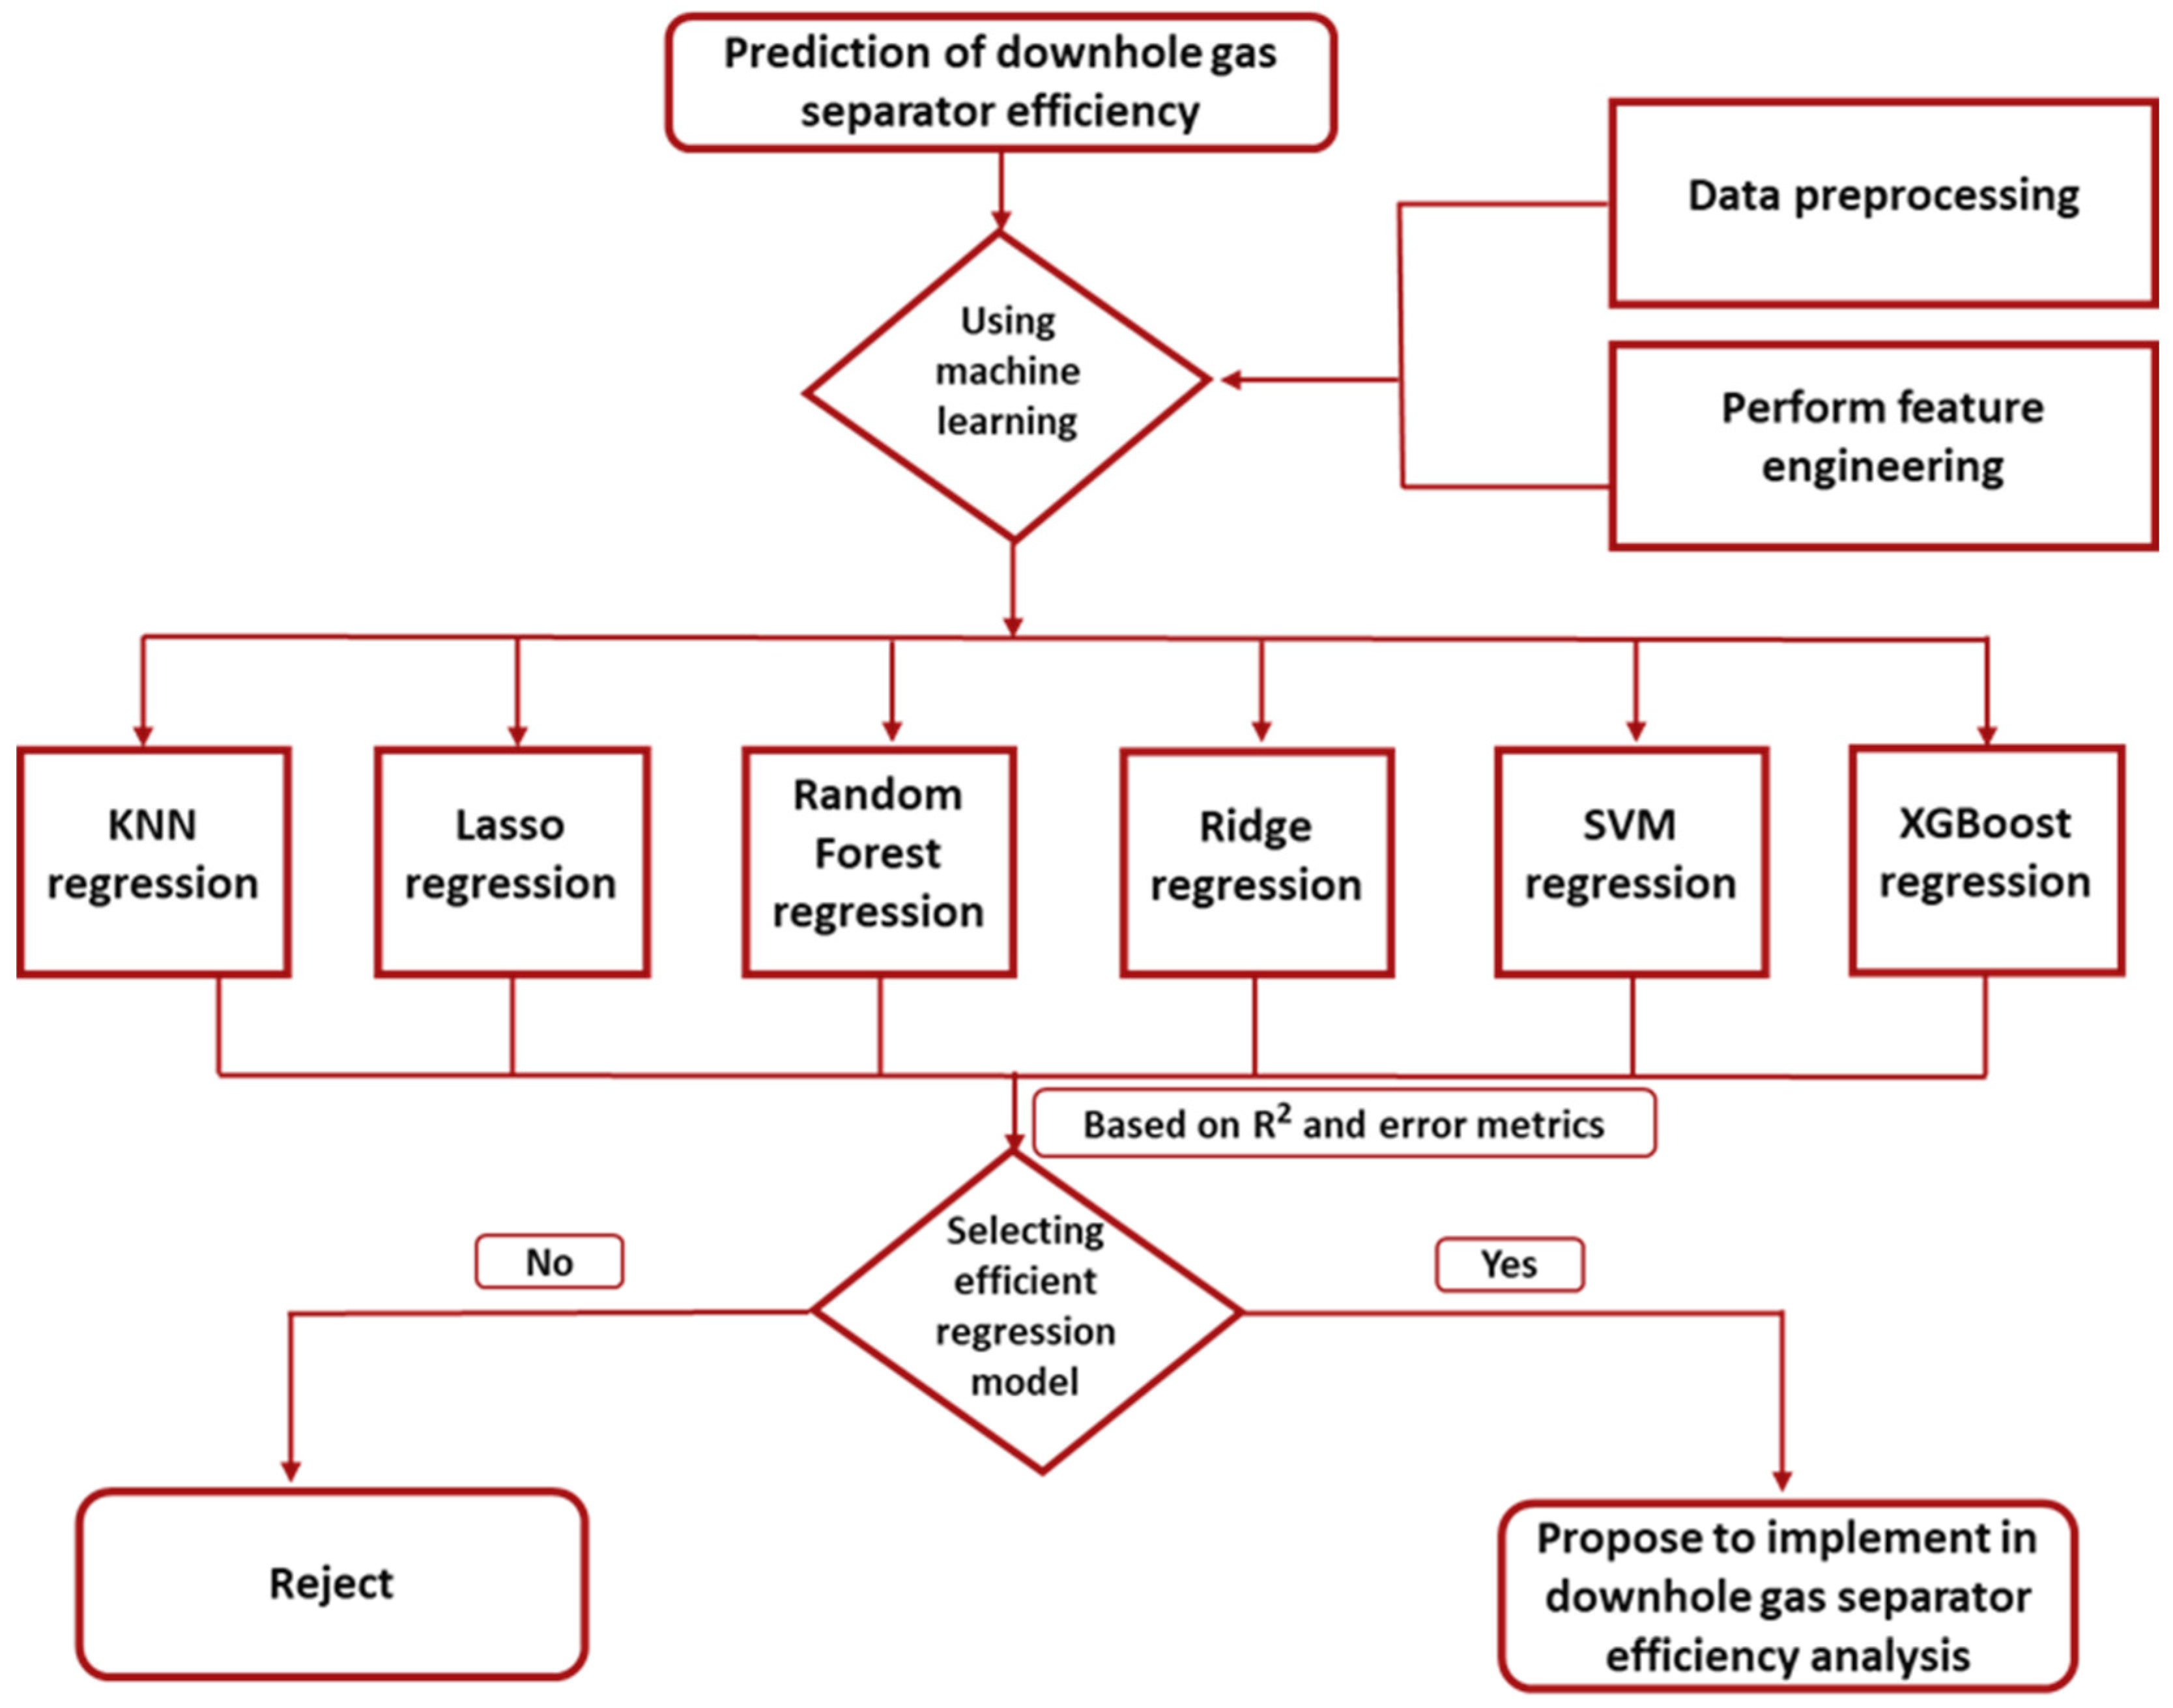
To construct the most accurate model for predicting GVFO, seven regression algorithms were incorporated for analysis: KNN, lasso, MLR, RFR, ridge, SVM, and XGBoost regression. We conducted hyperparameter tuning for each model using a grid search method combined with cross-validation. Specifically, for the random forest model, we optimized parameters such as the number of trees (ntree = 500), maximum depth which is controlled indirectly through the “mtry” parameter, which represents the number of variables randomly sampled as candidate at each split, minimum samples split, and minimum samples leaf. The tuning process involved a five-fold cross-validation on the training dataset to identify the optimal hyperparameters that minimize prediction error. Each model’s performance was meticulously evaluated based on its R-squared value and error metrics. The selection process was data-driven, with a clear focus on minimizing prediction errors. The optimal model, as depicted in
Figure 4, was chosen for its superior performance, marked by the lowest error values among the contenders and MLR is considered as the base case in the comparative analysis. This rigorous selection methodology ensures that the implemented model for downhole separator efficiency analysis is robust and reliable.
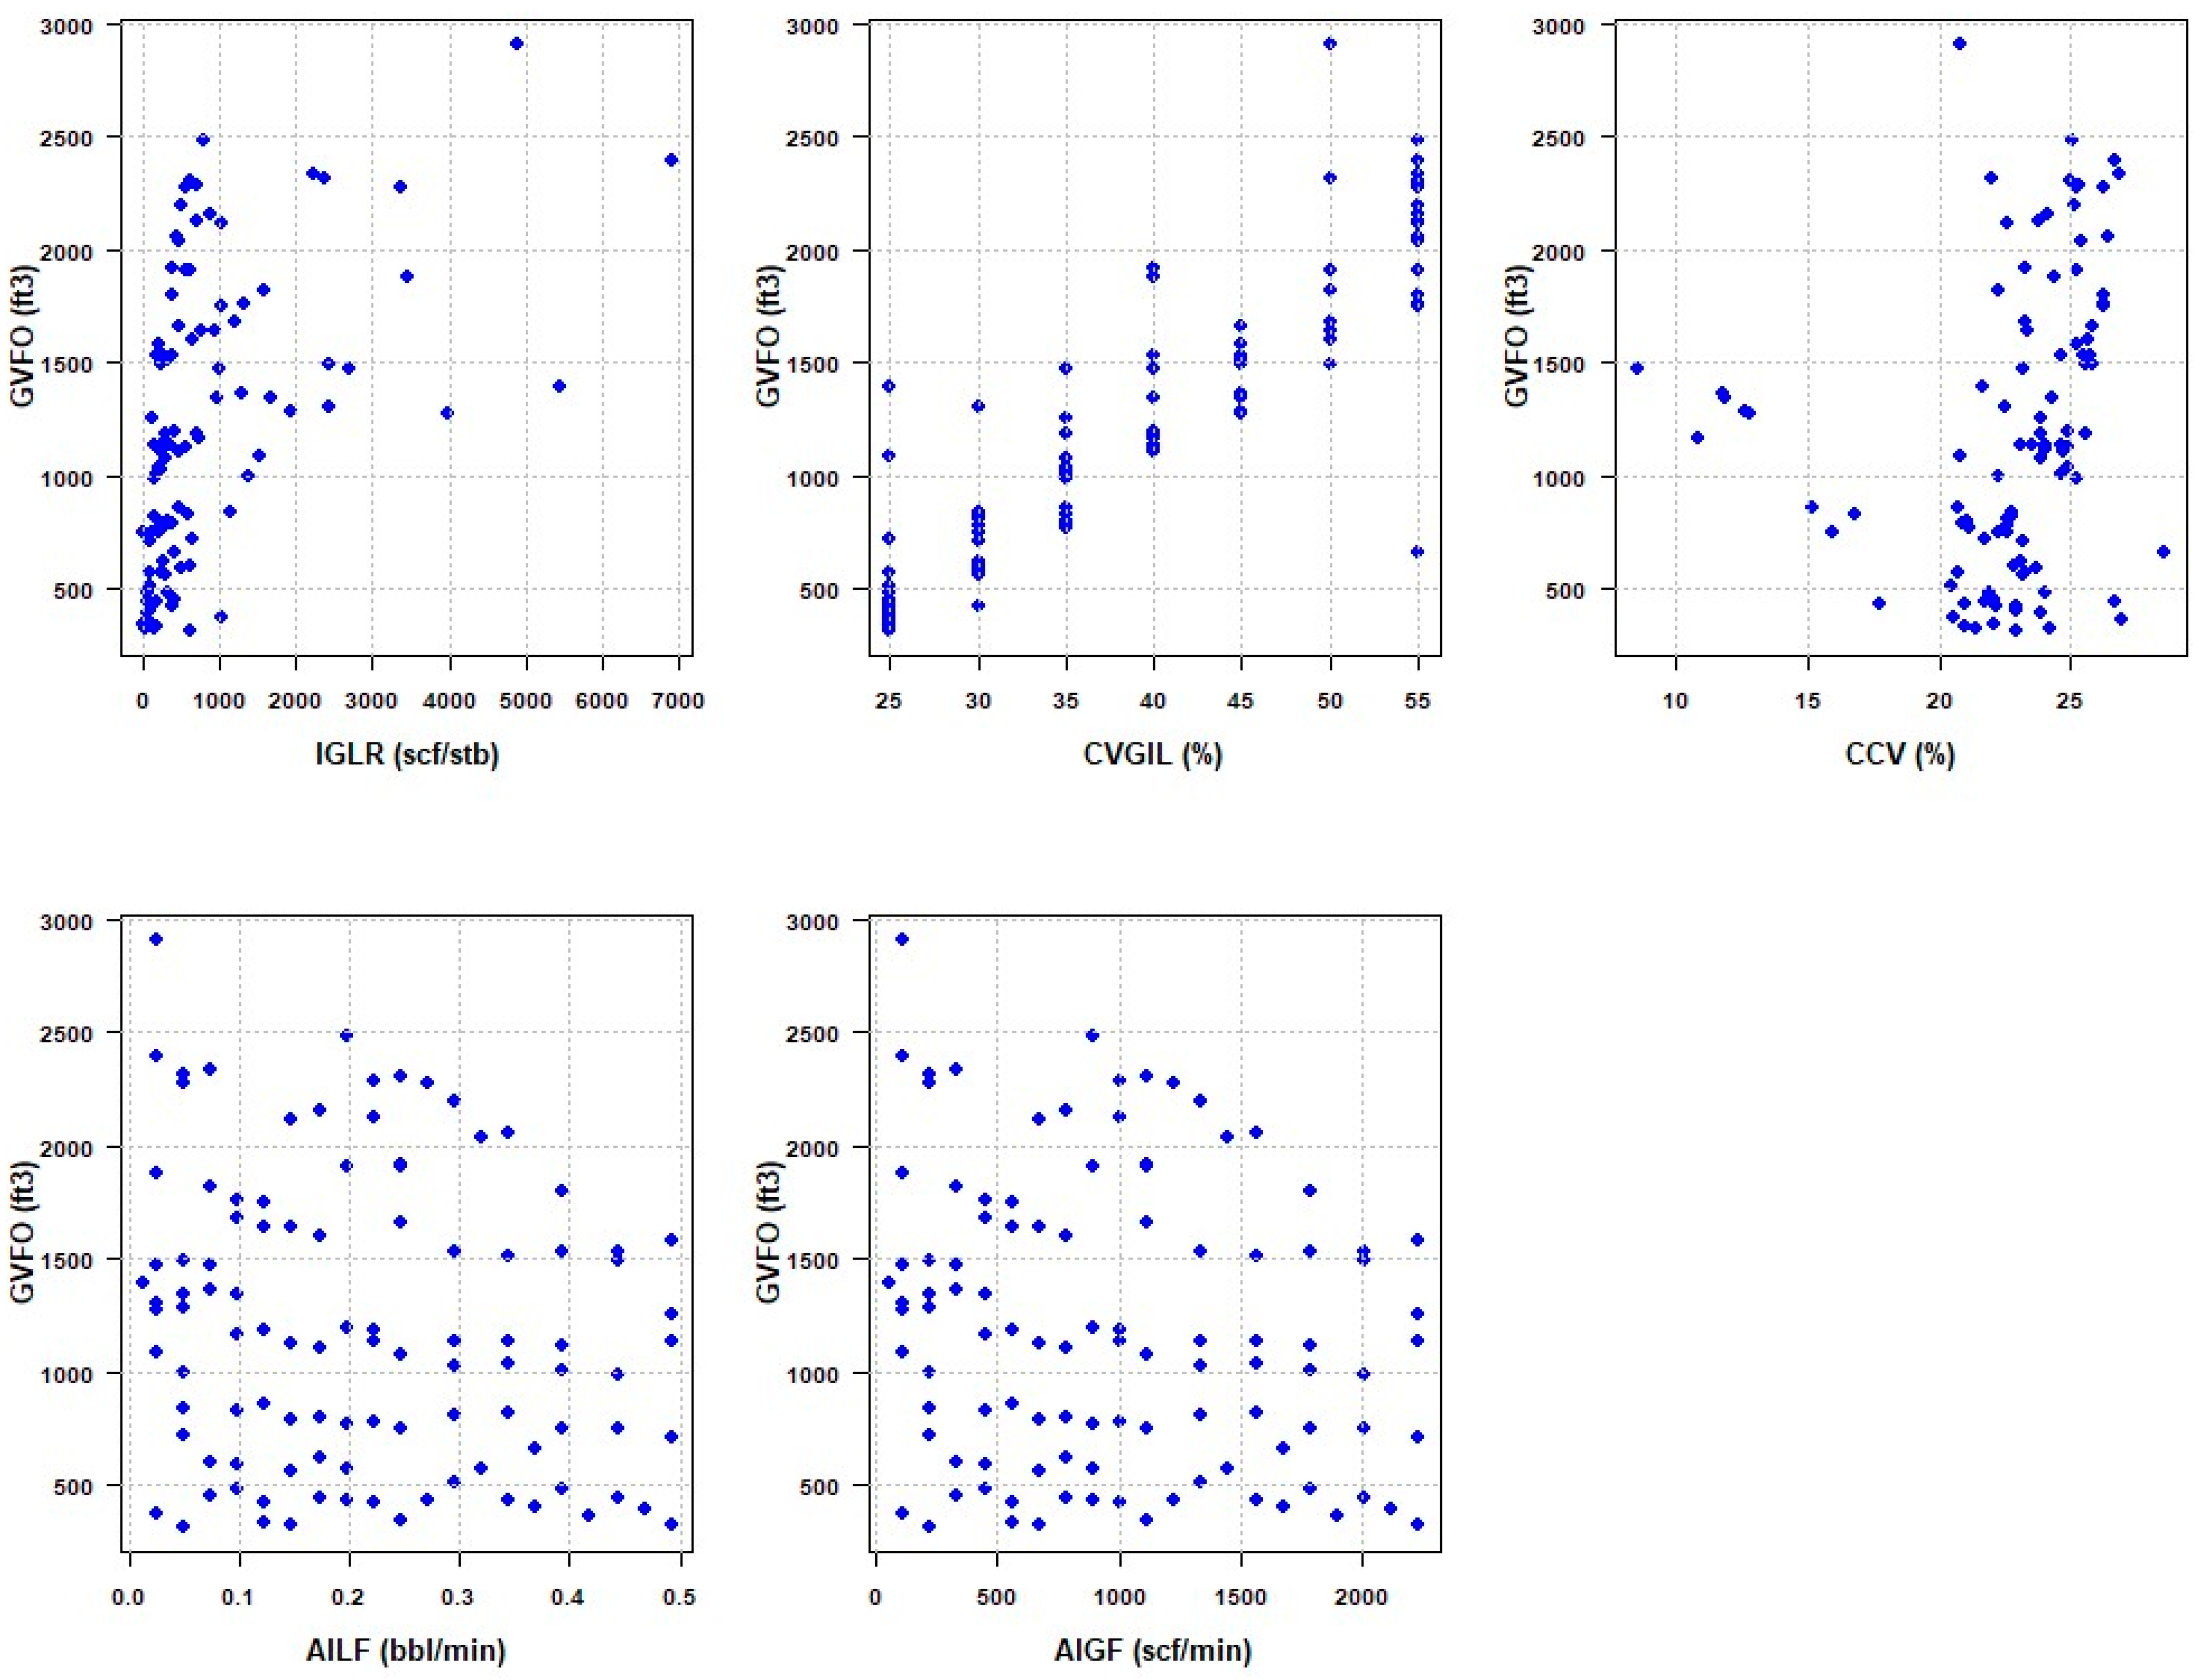
The preprocessing of the data, including the selection of relevant parameters, involved both univariate and bivariate analyses. Box plots were used for each parameter to detect outliers, and the analysis concluded that the experimental data did not contain any outlier values. Similarly, bivariate analysis was conducted to understand the relationship between the dependent variable, GVFO, and the available independent parameters, with the findings shown in
Figure 5. According to
Figure 5, there is an observable trend where GVFO tends to increase in conjunction with rises in gas–liquid ratio at inlet (IGLR), control valve opening percentage installed at gas inlet line (CVGIL), and casing control valve (CCV), while it does not change much with increases in average inlet gas flow rate (AIGF) and average inlet liquid flow rate (AILF). To refine the model, further exploration is necessary to examine the correlations between the response variable and independent parameters, which will aid in selecting the optimal set of independent variables for accurate GVFO prediction.
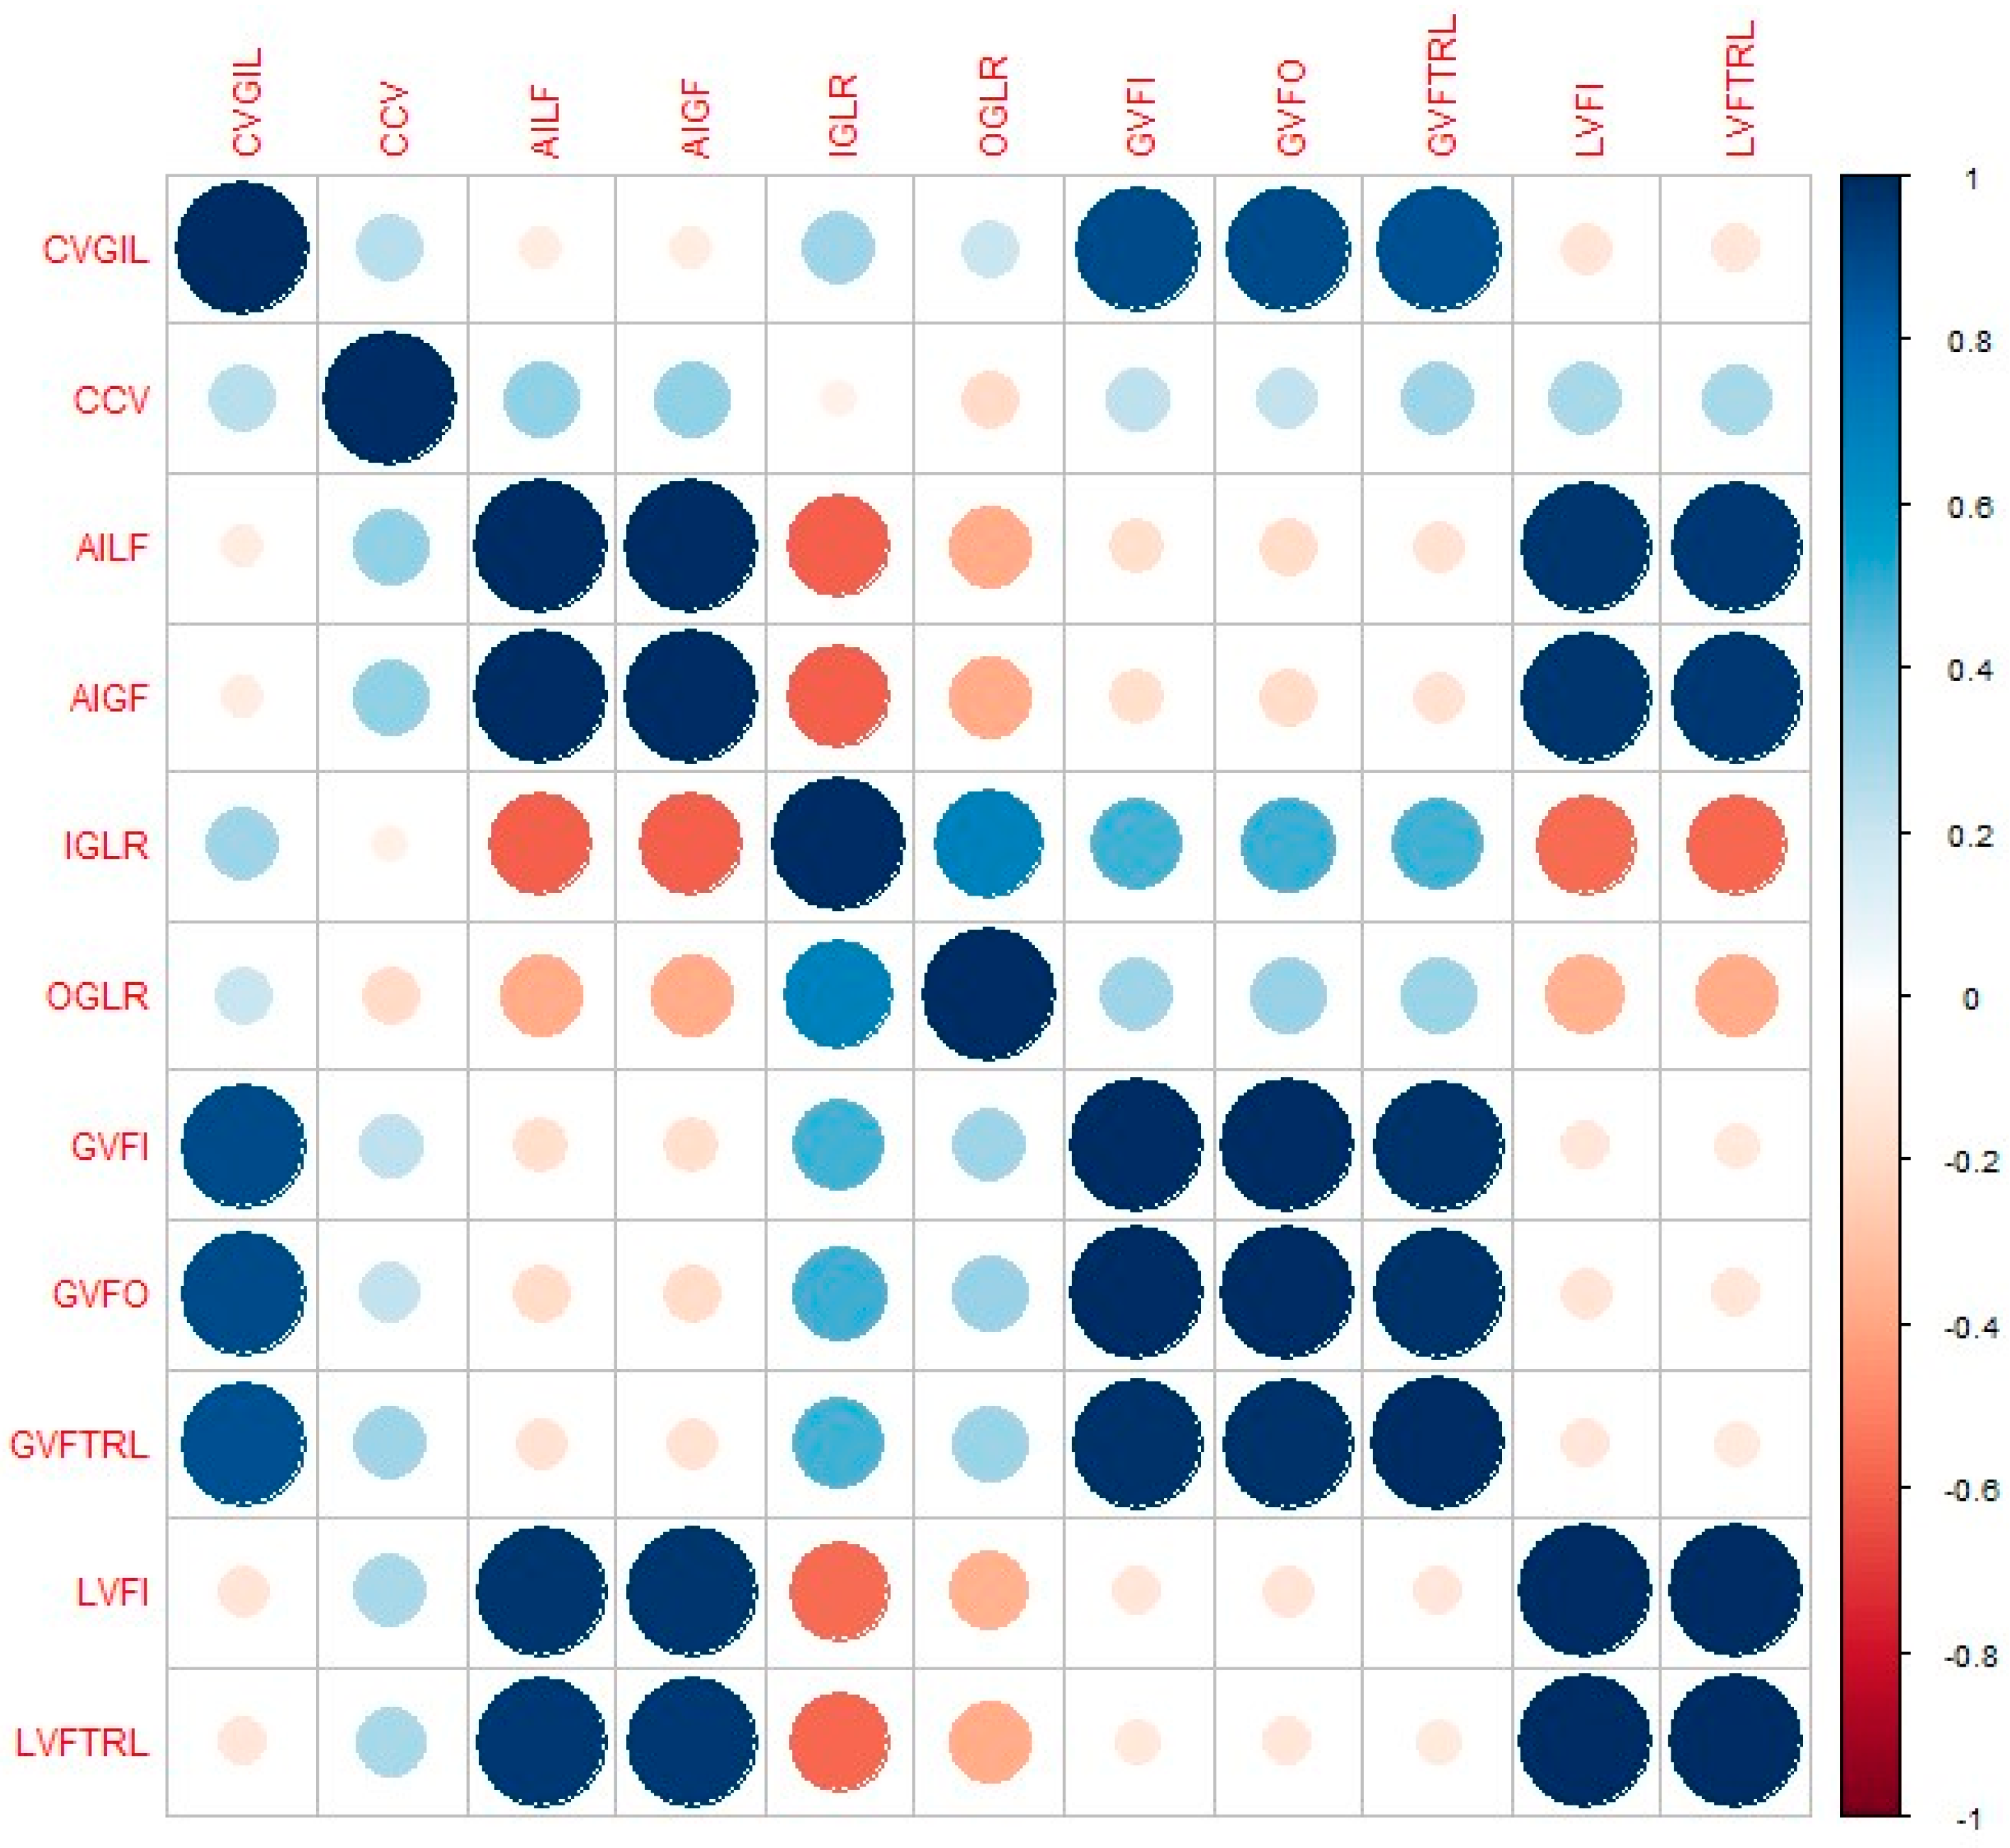
Figure 6 presents a correlation matrix that visually maps out the relationships between the dependent variable, gas volume flow at the outlet (GVFO), and various independent variables, alongside the intercorrelations among the independent variables themselves. The visualization reveals a high correlation of GVFO with parameters such as CVGIL, gas volume flow per minute at inlet (GVFI), and gas volume flow at tubing return line (GVFTRL), indicating strong predictive relationships. Conversely, GVFO is moderately associated with CCV, IGLR, and gas–liquid ratio at outlet (OGLR), while sharing a low degree of correlation with AILF, AIGF, liquid volume flow per minute at inlet (LVFI), and gas volume flow at tubing return (LVFTRL). This graphical representation also indicates significant correlations between several independent variables, an observation that shows a more detailed analysis. To ensure the integrity of the regression model and to mitigate the risk of multicollinearity, a subsequent application of the variable inflation factor (VIF) is recommended for the meticulous selection of independent variables. By doing so, the analysis will eliminate redundant variables, ensuring that the model’s predictive accuracy is not compromised by highly interdependent predictors.
Examining
Figure 6 underscores the importance of assessing multicollinearity to understand the interdependencies among chosen predictor variables. The variable inflation factor (VIF) was utilized to evaluate the degree of correlation between the independent variables within the regression analysis. The VIF essentially quantifies the extent to which multicollinearity has amplified the variance of an estimated regression coefficient. Referring to
Table 1, it is evident that the VIF scores for regression model is consistent, reflecting the uniformity of input variables used in the estimations of GVFO. VIF values below 1 imply the absence of correlation, those ranging from 1 to 5 denote a moderate level of correlation, and values exceeding 5 reveal a strong correlation amongst the predictors. The selected two independent variables have moderate VIF, indicating moderate level of correlation.
Following a detailed examination of scatter plots and correlation matrices, along with the implementation of the stepAIC function, the variables GVFI and LVFI were chosen as the input parameters. To facilitate a faster convergence and enhance the efficiency of the machine learning algorithms, these variables underwent a scaling process to ensure uniformity in their range. Subsequently, the dataset from experimental testing of centrifugal separator was used for model training and the dataset from experimental testing of gravity-based separator (data not used in model training) was used for model testing. This blind test was essential to check how well the model predicts and how it performs on unseen data.
6. Discussion
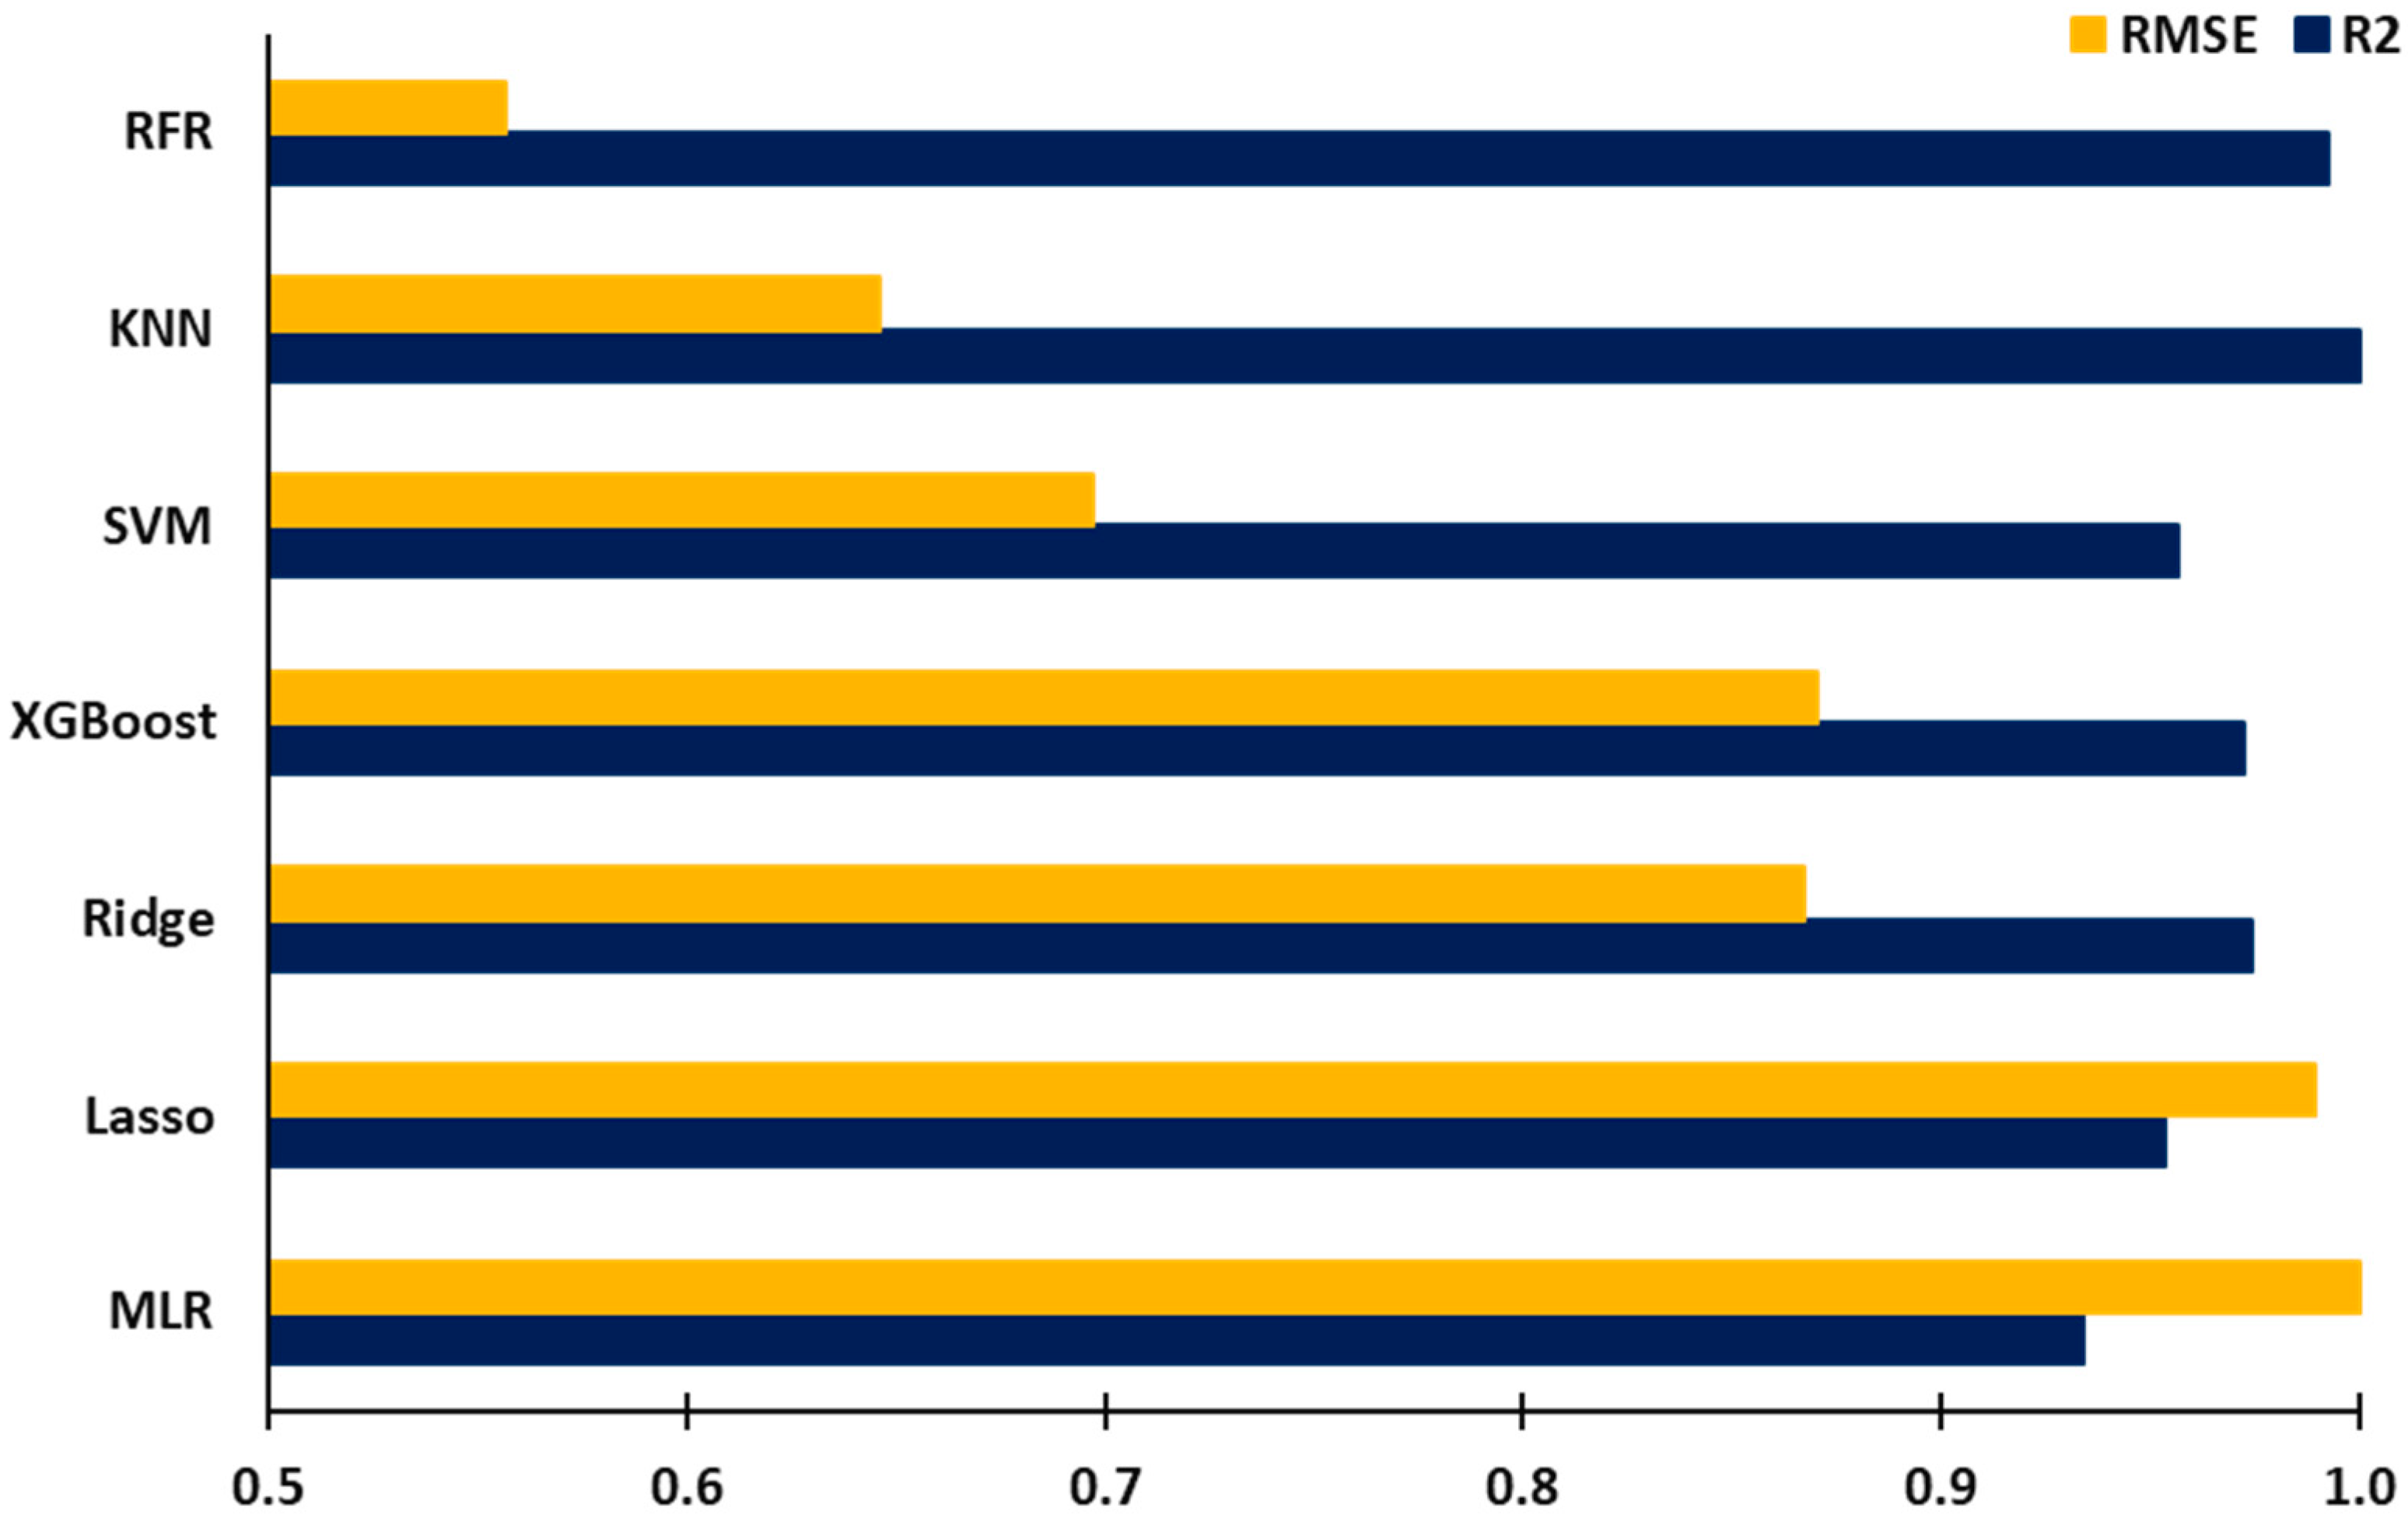
The result section above shows the efficacy of machine learning techniques in forecasting the gas volume flow per minute at the outlet (GVFO), a key performance indicator for the liquid–gas separation efficiency of downhole centrifugal separators. As delineated in
Table 2, the random forest regression approach exhibits the most favorable R-squared value, signifying its superior predictive capacity for GVFO, while the multilinear regression method registers the least. Concurrently,
Figure 13 shows the selection criteria for the optimal model, which is predicated on achieving the lowest error alongside the highest R-squared value for GVFO prediction. The R-squared and RMSE values were normalized with the maximum value and plotted as shown in
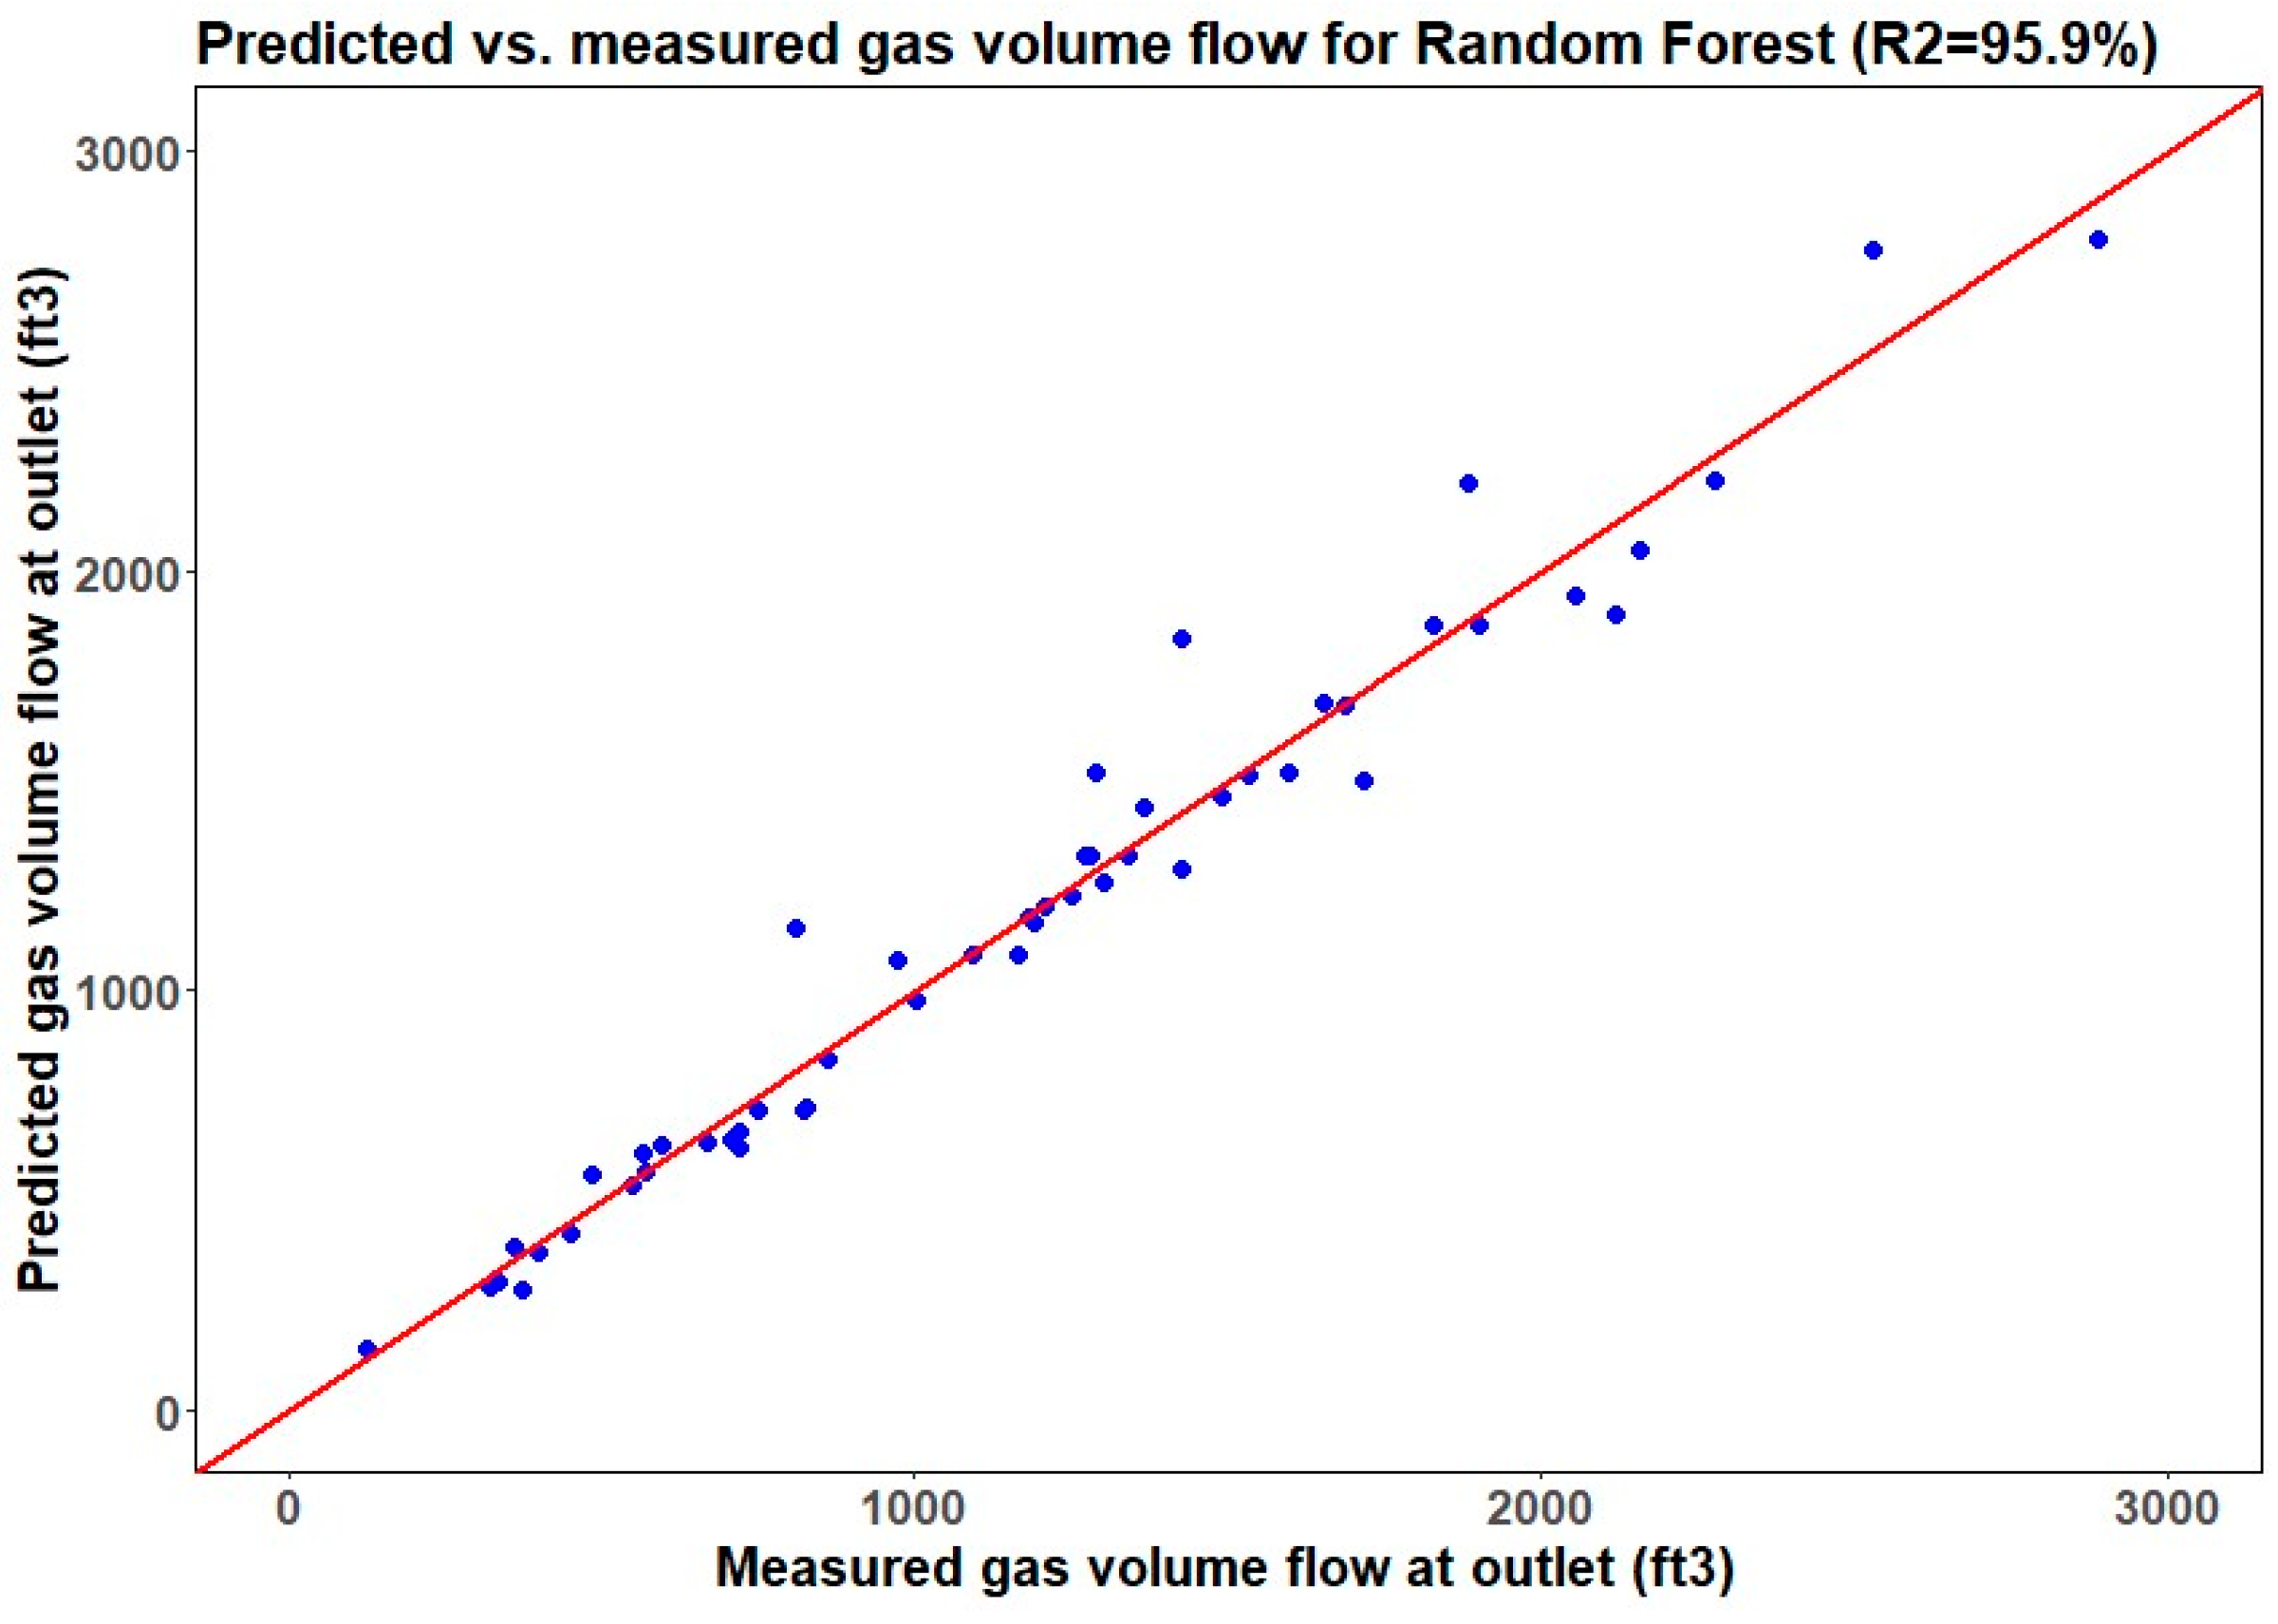
Figure 13, indicating the random forest regression model as the most precise, characterized by the highest R-squared and the lowest RMSE. The results showed that the random forest model provided superior predictive performance due to its ability to handle complex interactions between variables and mitigate overfitting through the bagging approach. All seven models’ comparisons are mentioned in
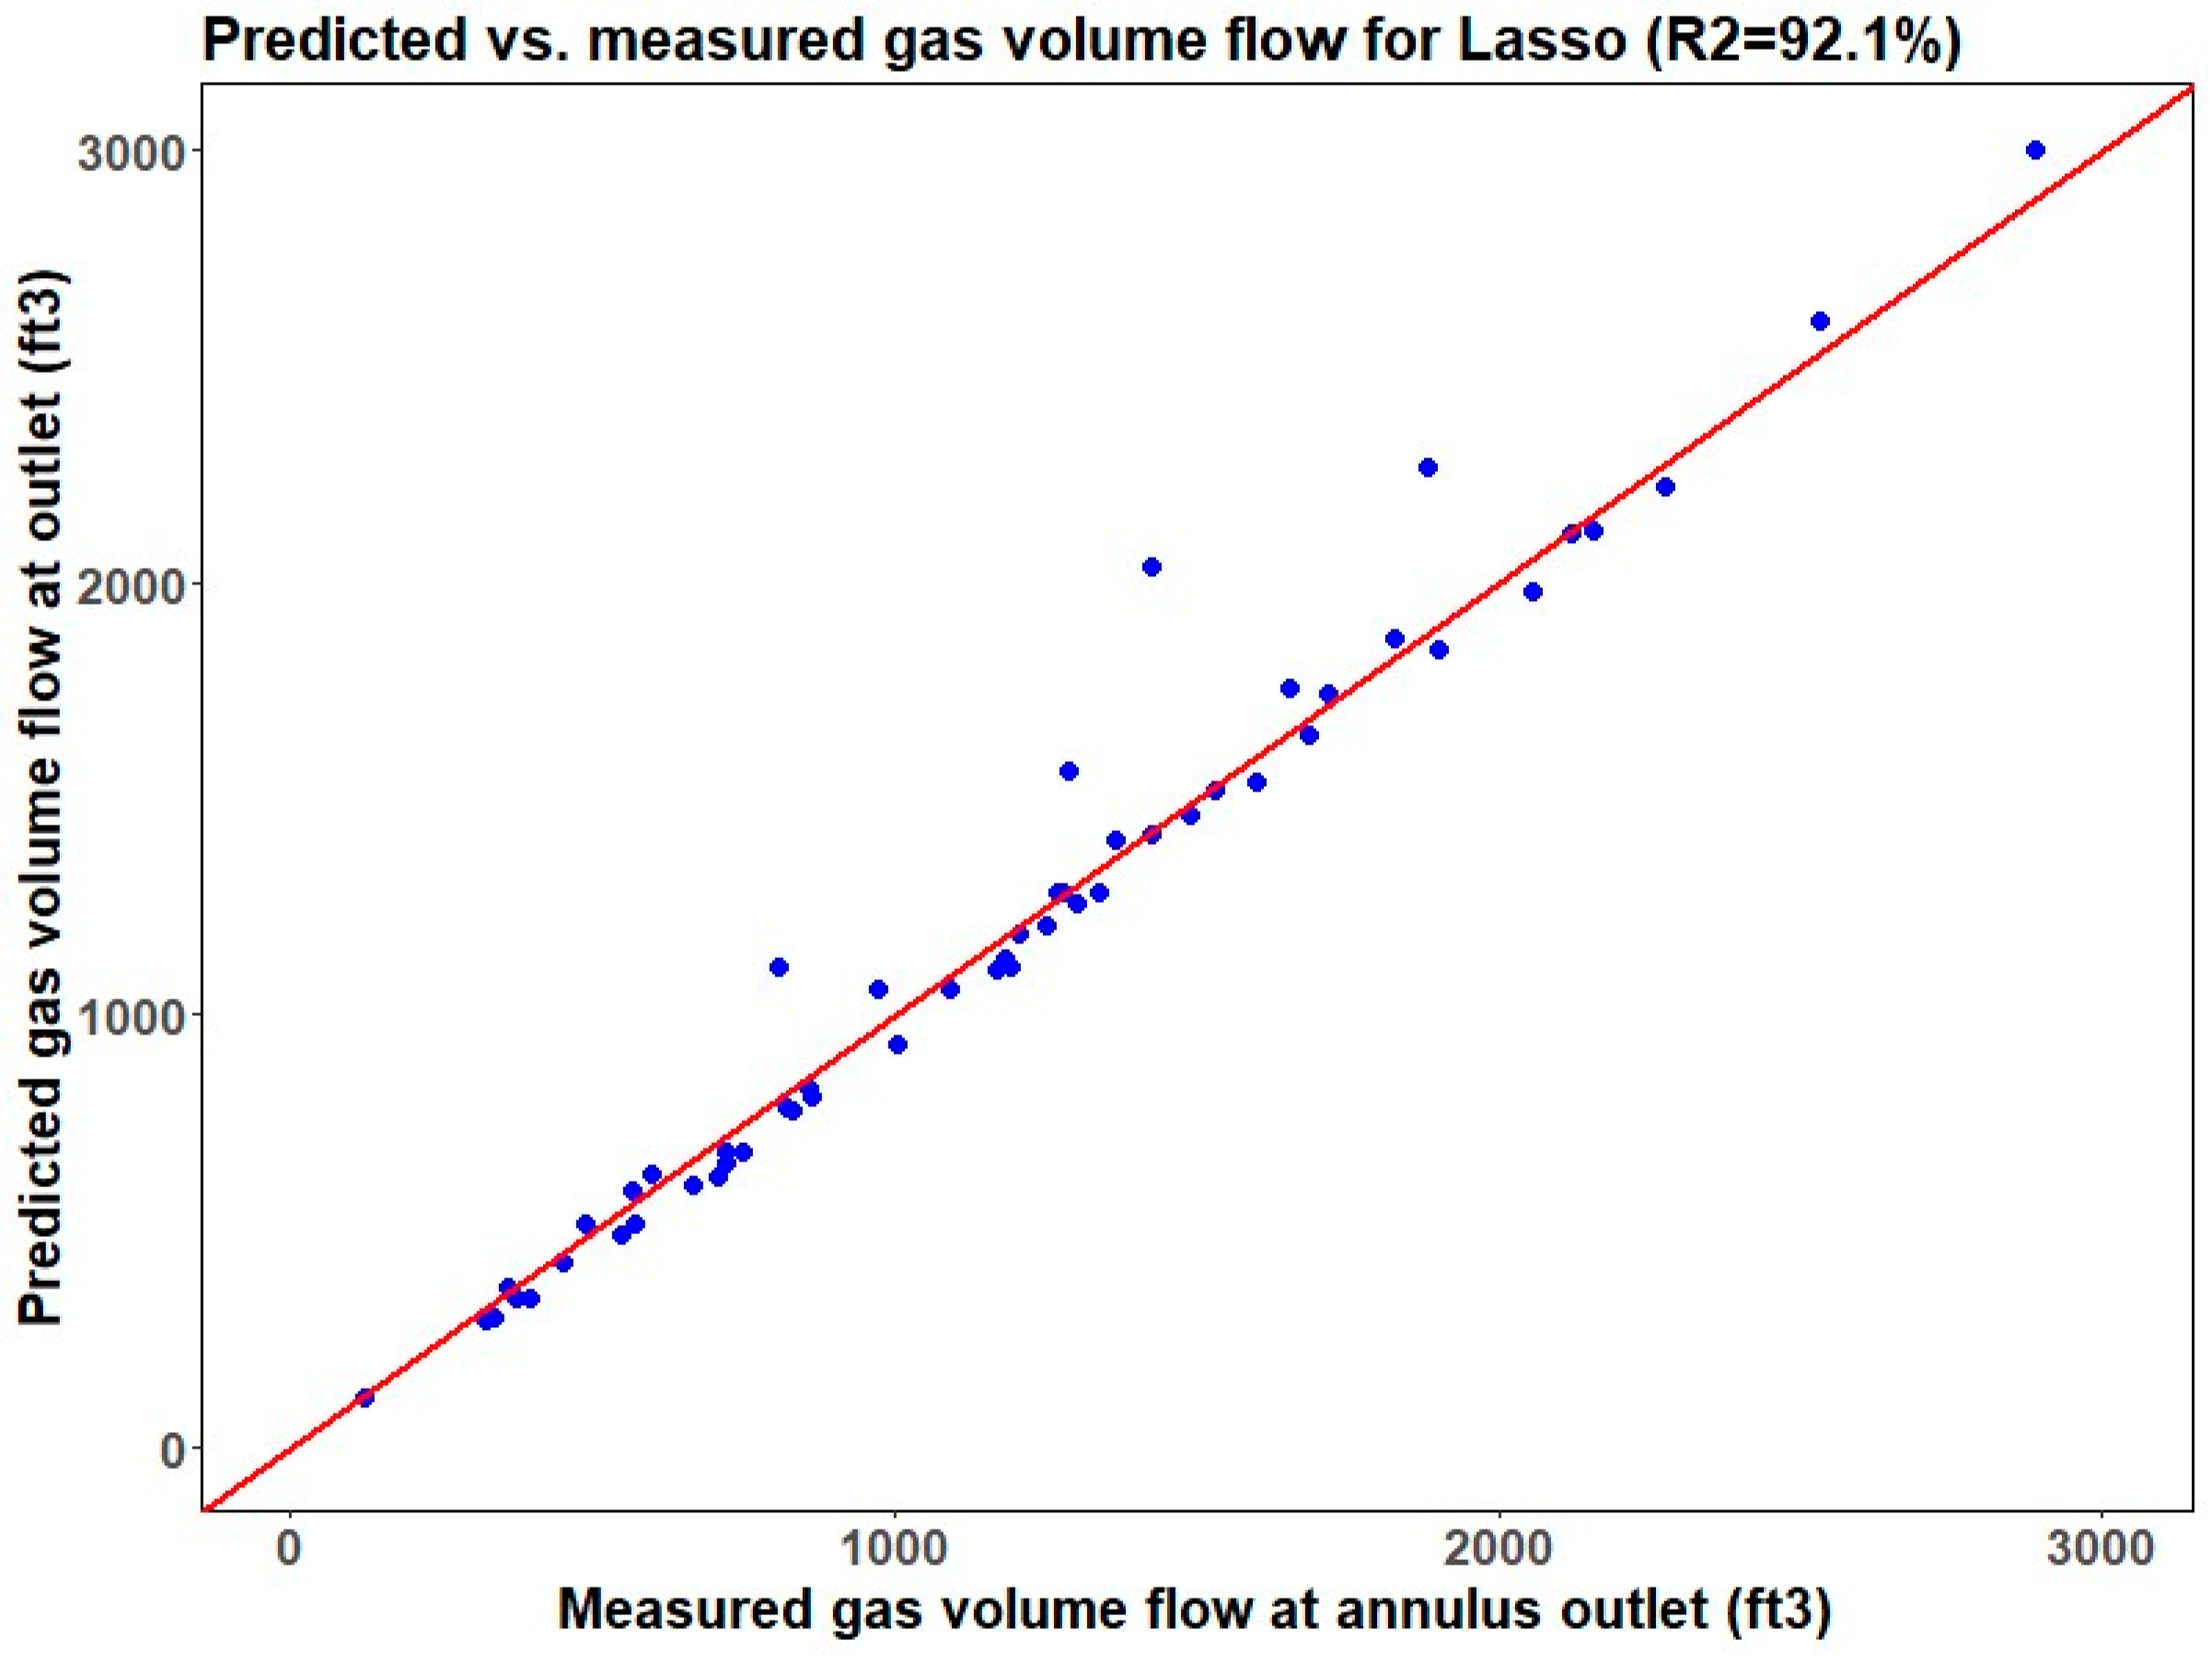
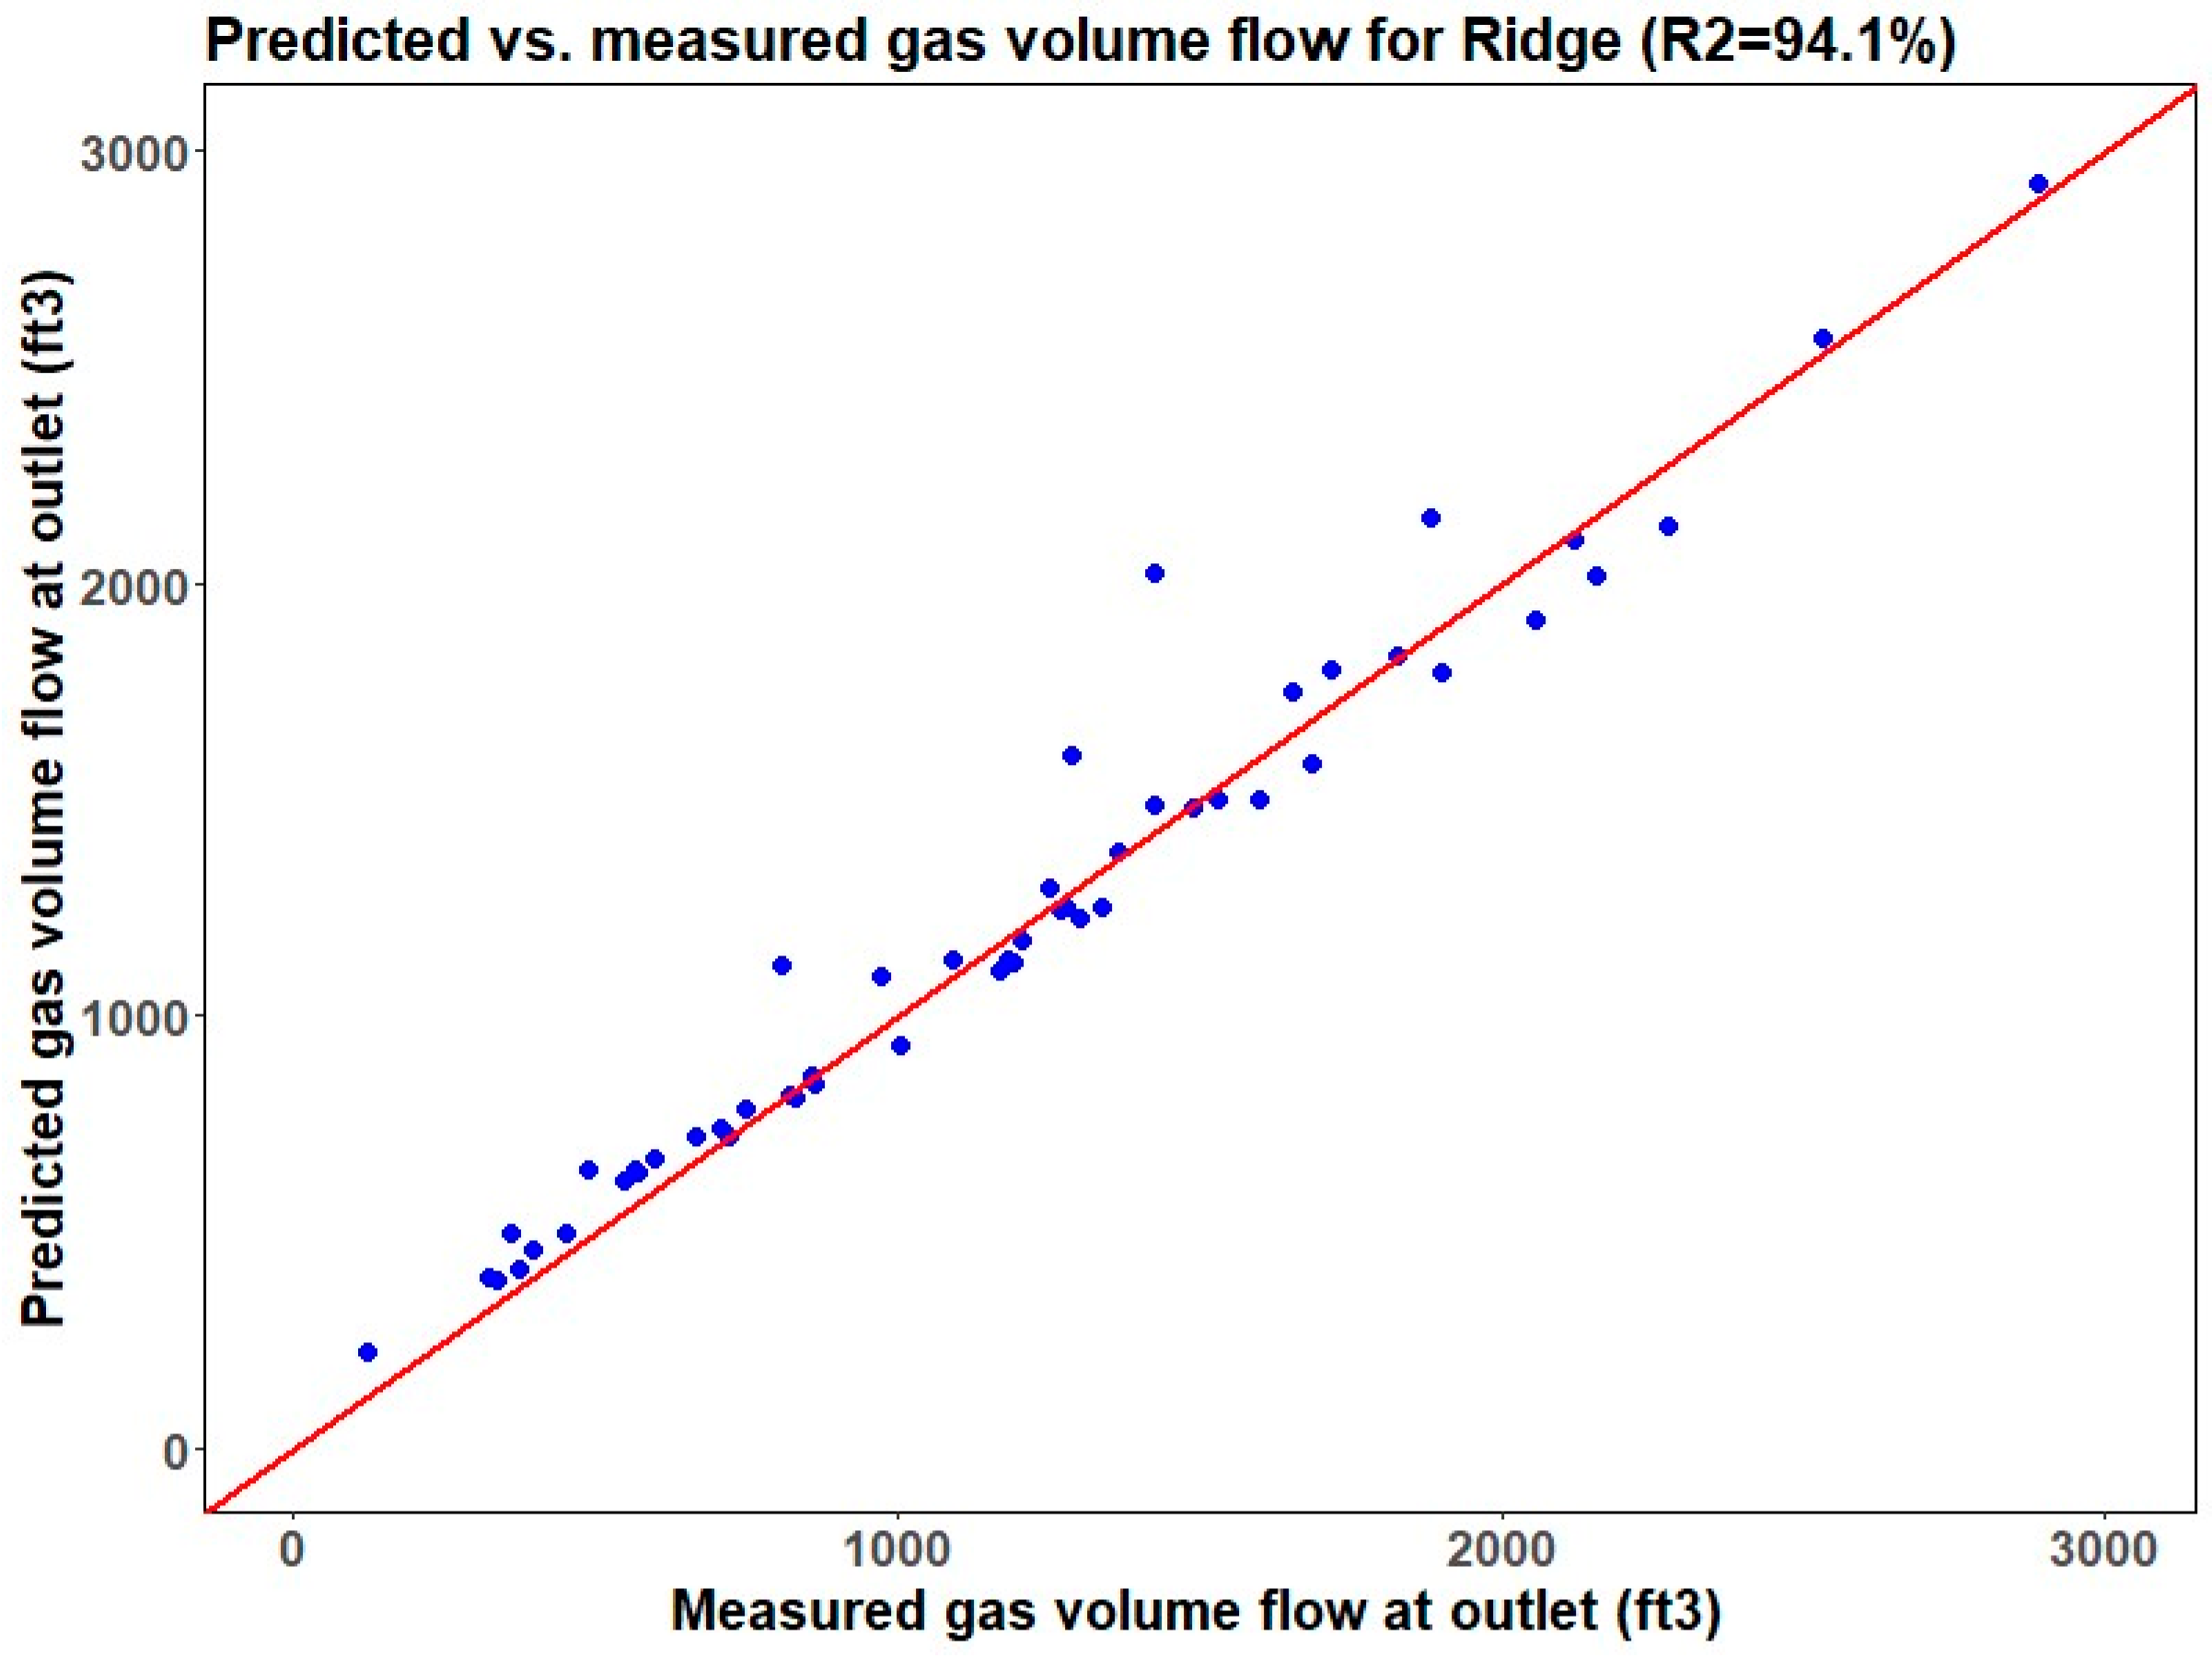
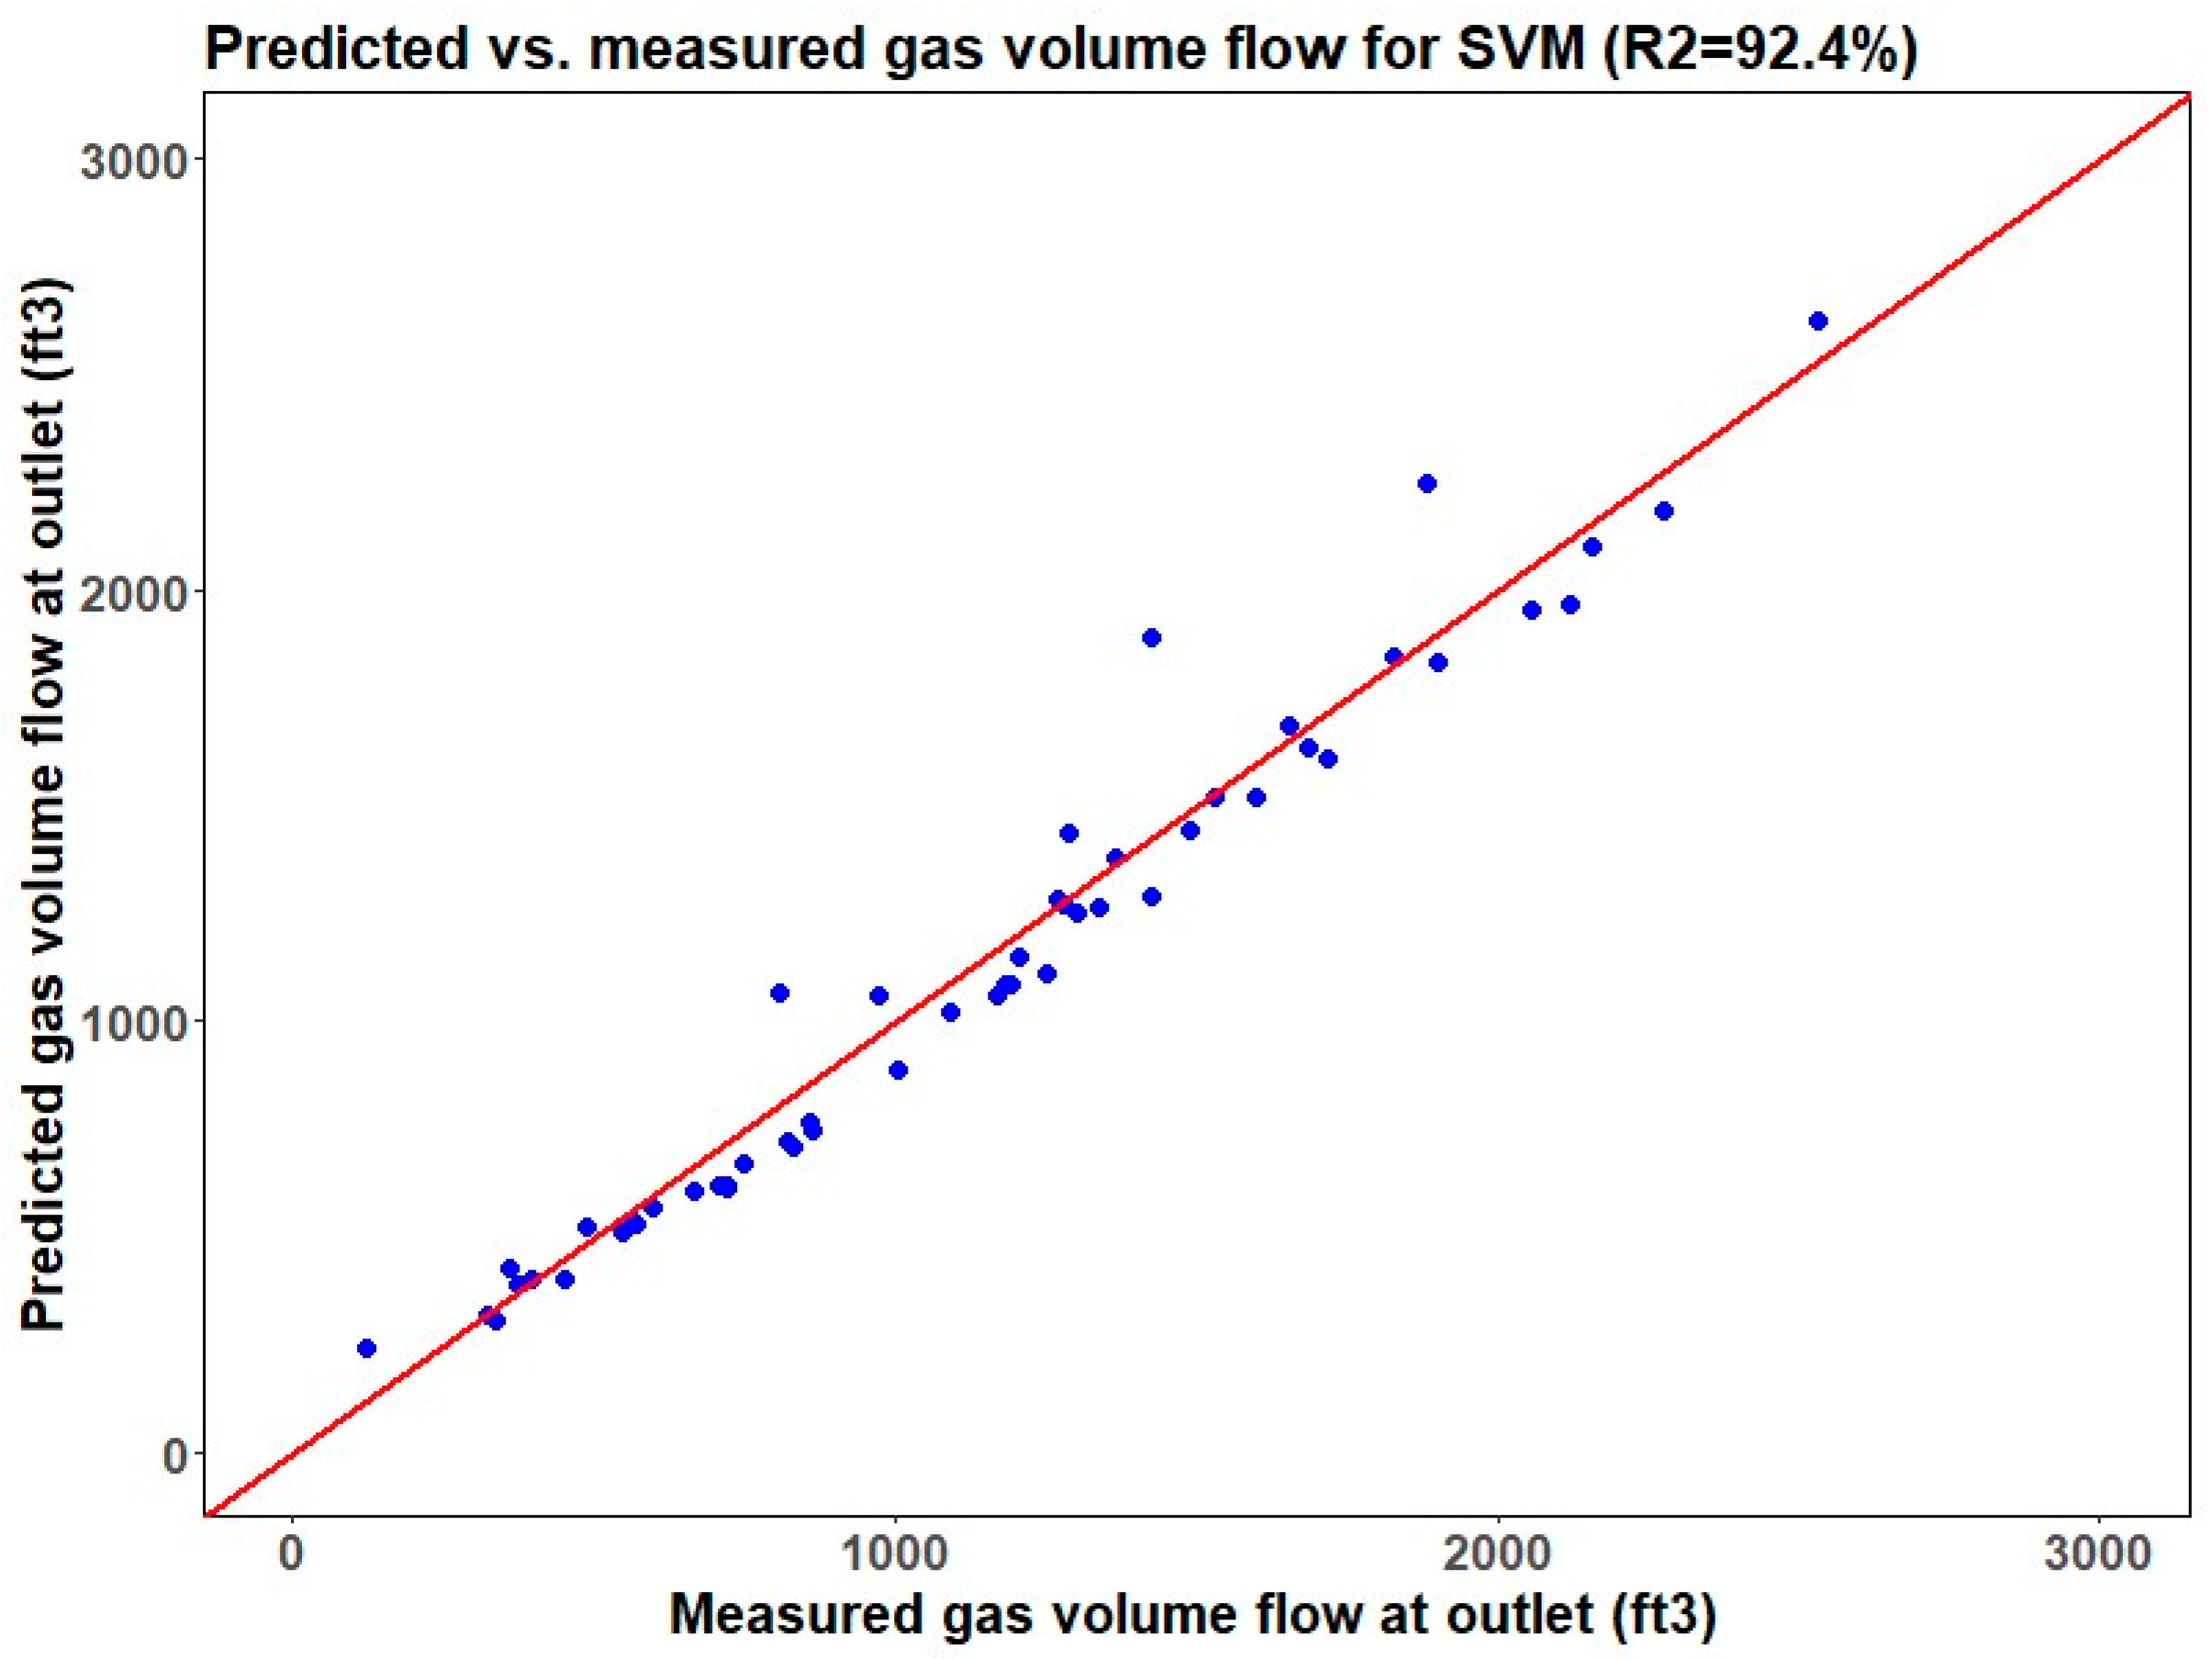
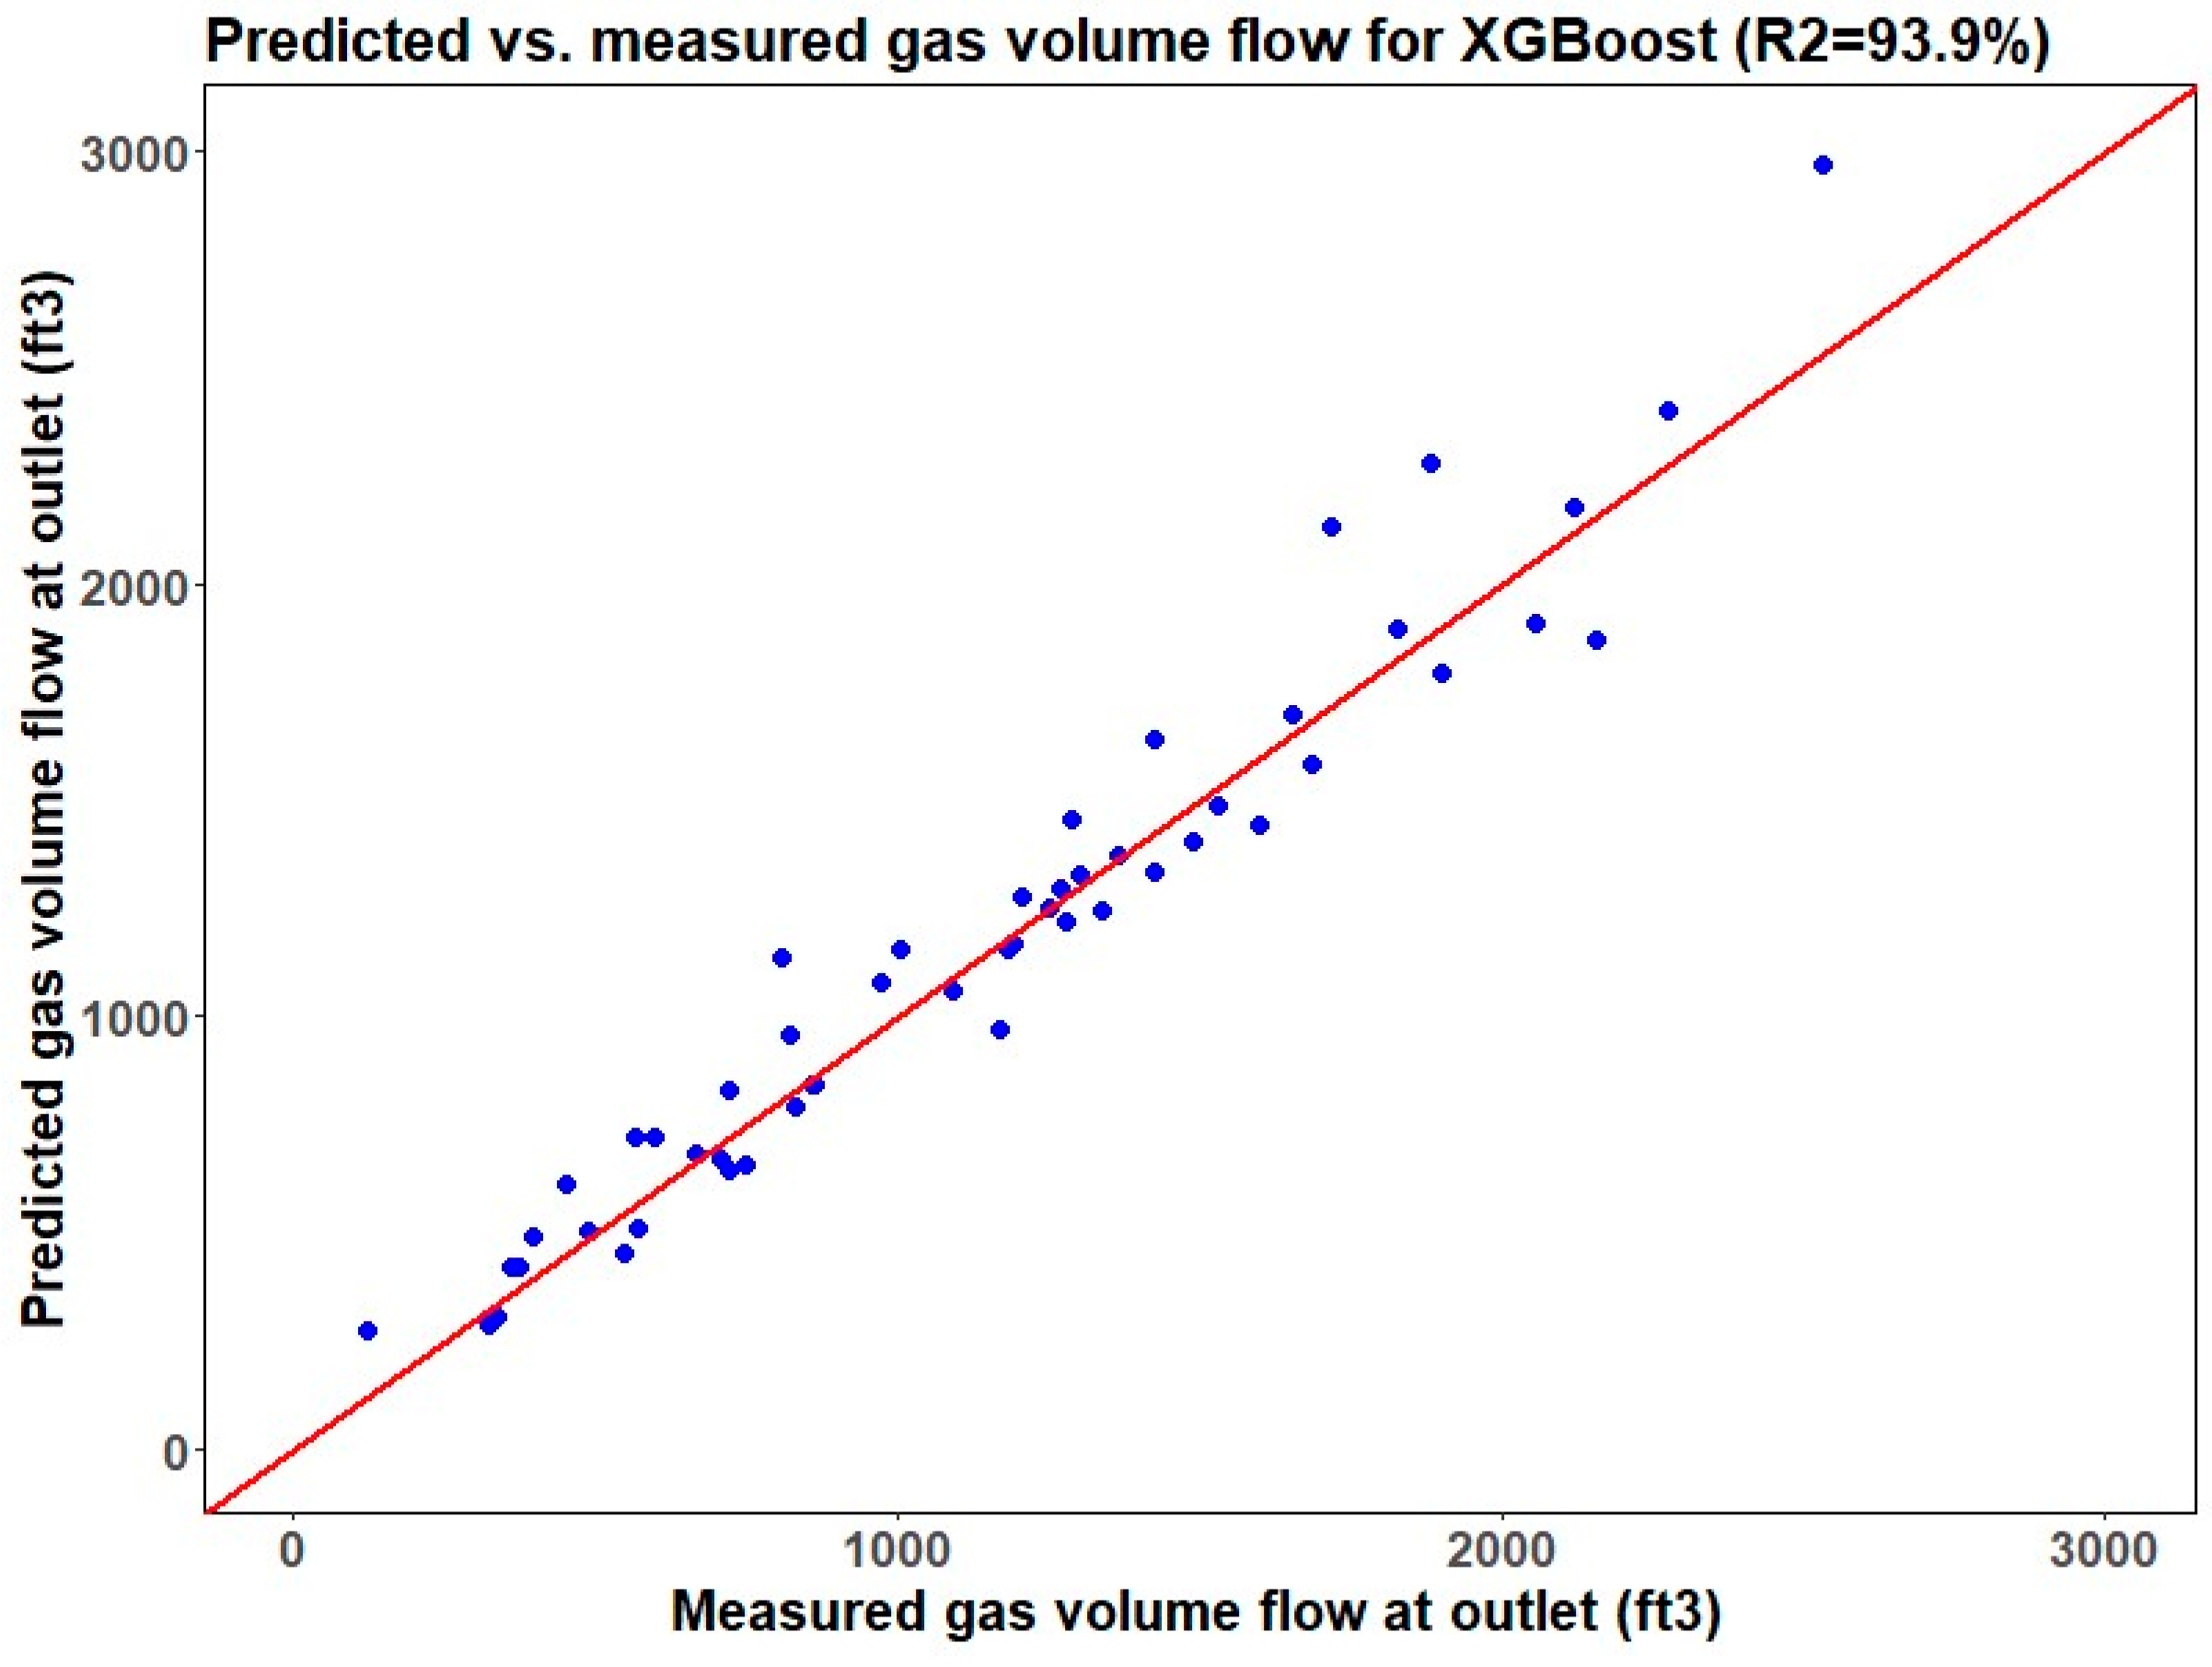
Table 2 based on their error metrics. Furthermore, when scrutinizing the R-squared values, both the RFR and KNN regression models demonstrate good predictive proficiency with R-squared values of 95.9% and 96.6%, respectively. The RFR model, in particular, outperformed others in terms of RMSE on the testing dataset (blind test), whereas the multilinear regression model lags behind, registering the highest RMSE. It is noteworthy that the support vector machine algorithm, typically favored for classification tasks, also shows better performance in predicting GVFO, more than the multilinear and lasso regression models. In summation, upon considering the collective metrics, the random forest regression model emerges as the preeminent choice for GVFO prediction. Its distinguished R-squared and minimal RMSE values corroborate its aptitude to accurately predict GVFO from experimental data with minimal error, thereby substantiating its adoption in the analysis of downhole separator efficiency.
7. Conclusions
This investigation aimed to forecast the gas volume flow per minute at the outlet (GVFO) for gravity-based separators using experimental test data measuring the efficiency for centrifugal downhole separators. Seven distinct regression techniques were developed and evaluated: k-nearest neighbors, lasso, multilinear, random forest, ridge, support vector machine, and XGBoost. These models utilized gas volume flow per minute at the inlet (GVFI) and liquid volume flow per minute at the inlet (LVFI) as input parameters, selected after data preprocessing and feature engineering. Their performance was quantified by comparing R-squared and error statistics. Among these models, the random forest regression algorithm emerged as the most precise in predicting GVFO, outperforming its counterparts. Comparative analysis revealed R-squared values for the k-nearest neighbors, lasso, multilinear, random forest, ridge, support vector machine, and XGBoost models at 96.6%, 92.1%, 90.2%, 95.9%, 94.1%, 92.4%, and 93.9% respectively, with corresponding RMSE scores of 130, 199, 201, 112, 174, 140, and 175. The analysis indicates that the random forest regression method demonstrates superior performance in predicting GVFO, closely followed by the KNN regression model. The findings strongly advocate for the use of random forest regression in predicting the efficiency of downhole gas separators, with the model accounting for 96.6% of the variability in gas efficiency data and a prediction error of 7.5%. The random forest model’s robustness to overfitting, ability to handle non-linear relationships, and effectiveness in variable importance assessment are key factors contributing to its superior performance. The primary difference between centrifugal and gravity-based separators is the spiral section found exclusively in the centrifugal separator. Furthermore, the gravity-based separator boasts a length of 10 inches, contrasting with the 15-inch length of the centrifugal separator. The seven regression models were developed using experimental test data conducted to evaluate the separation efficiency of centrifugal downhole separators, while blind testing was conducted using experimental data to evaluate the separation efficiency of gravity-based separators. The model testing indicated that changes in the shape and size of the separator did not significantly affect the prediction quality of the models. These insights from machine learning will aid in optimizing production using artificial lift methods.
