Abstract
Viscous slickwater has a higher viscosity and better sand-carrying ability than conventional slickwater at the same concentration. At a concentration of 0.4 wt.%, the viscosity of the viscous slickwater is 4.7 times that of the conventional slickwater. It is generally believed that viscosity is one of the main influencing factors on the sand-carrying ability of the fluid. However, this study has shown that the good sand-carrying ability of the viscous slickwater is more attributed to its viscoelasticity. Through rheology and sand-carrying tests, it has been found that the viscoelastic properties vary when fluids have the same viscosity; this then leads to a significant difference in the settling rate of sand and the sand-carrying threshold of the fluid in a fracture at a certain flow rate. The routine method of characterizing the viscoelastic property of the slickwater was to observe the cross point of the elastic modulus (G′) and viscous modulus (G″) curves. The smaller the frequency of the cross point, the better the viscoelastic property of the fluid. However, it has been found in experiments that even when the cross point is the same, there is still a significant difference in the sand-carrying ability of fluids. Therefore, sand-carrying experiments are conducted under a similar cross point and different magnitudes of modulus, of which the results indicate that as the elastic modulus increases, the settling rate of sand decreases. The flow rate threshold occurring as sand settles obtained from laboratory experiments is compared with the field condition during hydraulic fracturing. From laboratory experiments, the threshold of inner-fracture flow rate that prevents the sand settling is found to be 8.02 m/min for 0.6 wt.% viscous slickwater with a sand ratio of 30%. In the field operation, the operation conditions meet the sand-carrying threshold obtained from laboratory experiments. Observations from the field test confirm the applicability of the threshold plot proposed according to laboratory measurements, which can provide guidance for optimizing the fracturing scheme in the field.
1. Introduction
Shale oil is stored in a tight reservoir. In the fracturing process, traditional guar gum fracturing faces several issues, such as high frictional resistance leading to low injection displacement and poor fracture creation, making it difficult to form a complex fracture network. Additionally, the residue after gel breaking causes significant damage to the formation [1]. Therefore, an alternative fracturing fluid system is urgently needed in the tight reservoir stimulation. The main component of slickwater is polyacrylamide [2]. Its low viscosity, low damage, and high friction reduction rate have resulted in its gradual application in field fracturing operations [3]. In 2004, over 30% of unconventional reservoirs in North America were fractured using slickwater, and as of 2017, the number had exceeded 80% [4]. With China’s increased development of shale oil and gas in recent years, slickwater has also begun to be applied in various oil fields in China.
Conventional slickwater, due to its low viscosity, can easily form complex fractures, but its sand-carrying ability is poor [5]. Therefore, in the field operation, slickwater is generally used as a pad to create complex fractures, while the crosslinked guar gum is mainly used to carry proppants to create fractures. These two fracturing fluids make the field operation procedures complex. Furthermore, even after the crosslinked guar gum is broken, it still leaves a significant amount of residues, causing substantial damage to the formation [6].
In order to improve the sand-carrying ability of slickwater, hydrophobic copolymerized polyacrylamide is used, with partially introduced hydrophobic monomers along its molecular chain [7]. Because the hydrophobic monomer is not soluble in water, it tends to aggregate or combine. This transformation changes its original linear structure into a mesh-like structure, resulting in increased viscosity and viscoelasticity. This type of slickwater is referred to as viscous slickwater. During sand settling with and without a horizontal flow rate, its vertical settling velocities are different. The settling rate of the sand with a horizontal flow rate is much lower than that of the settling rate without a horizontal flow rate. Yao et al. [8] found that the smaller the frequency corresponding to the cross point of the elastic modulus (G′) and viscous modulus (G″), the better the sand-carrying ability in a rough fracture and the slower the settling rate. The cross point of the elastic modulus (G′) and viscous modulus (G″) marks the beginning of the dominance of elasticity, and the area to the right of the cross point is referred to as the elastic sand-carrying region. It is generally believed that the smaller the frequency at the cross point of the elastic modulus (G′) and viscous modulus (G″), the better the sand-carrying ability. The larger the elastic sand-carrying region, the better the sand-carrying ability [9].
However, even though the cross point of G″ and G′ is a means of characterizing the quality of the fluid, it does not fully explain the actual mechanism. The shear rate of the slurry flowing within the fractures is higher than the shear rate at the cross point of G″ and G′ [10,11]. Even for conventional slickwater, the cross point of G″ and G′ is lower than the actual shear rate during flow. This implies that both conventional slickwater and viscous slickwater fall within the elastic sand-carrying region under actual flow conditions. However, there are still notable differences in the actual sand-carrying ability at different shear rates. Furthermore, through this article’s experimental results, it was discovered that even when the frequency of the cross point of G″ and G′ is similar, there are still disparities in the actual sand-carrying ability. Therefore, relying solely on the observation of the cross point of G″ and G′ as an evaluation method proves to be too limited.
Yuan et al. [12] conducted sand settling experiments without a horizontal flow rate in different liquids and found that the slower the settling rate of the sand, the smaller the cross point of G″ and G′. The article written by Yuan uses relaxation time to characterize the quality of viscoelasticity, where relaxation time is the reciprocal of the cross point of G″ and G′. The experimental results show that lower sand settling rates correspond to longer relaxation times. However, during the actual fracturing operation process, the sand is always in a state of high-speed horizontal flow. The article written by Yuan does not consider the impact of viscoelasticity on settling rates under horizontal flow conditions.
Biheri et al. [13] pointed out that at high shear rates, the viscosity is lower, and therefore, during field operation, sand transport with a horizontal flow rate mainly relies on elasticity. However, the article written by Biheri did not consider shear rate as a variable to investigate the effect of elasticity on sand transport. The sand transport effects discussed in the article varied with temperature, and the article written by Biheri attributed it to the influence of temperature on elasticity, thereby affecting the results. However, temperature not only affects elasticity but also has a significant impact on viscosity. The differences in sand-carrying abilities observed in the article could also be attributed to variations in viscosity. Additionally, the article written by Biheri conducted sand-carrying tests at low flow rates and low shear rates, resulting in a significant difference in viscosity between guar gum and slickwater. As a result, the experimental results were greatly influenced by viscosity and did not reflect the impact of elasticity on sand transport. Therefore, the article written by Biheri did not perform sand transport tests on slurry with different elastic properties at the same viscosity, thereby failing to highlight the ability of elasticity in sand transport.
This article confirms through various experiments that viscoelasticity plays an important role in decreasing the settling rate of sand. In order to assess the quality of viscoelasticity of viscous slickwater, this paper also proposes a new method for judging the viscoelasticity of viscous slickwater. In order to make the work of this paper more practically applicable, this paper obtains the sand-carrying threshold through experiments to predict whether sand blockage will occur during fracturing operations. A field test is carried out under the guidance of the sand-carrying threshold, and the operation of sand addition proceeds smoothly, meeting the expected results.
This work’s laboratory experiments analyzed the sand-carrying test for different conditions. The conditions include the same viscosity but with varied cross points of G″ and G′, and the cross point of G″ and G′ is close but with the elastic modulus and viscous modulus being different. This article considers both the frequency of the cross point of G″ and G′ and the magnitude of the elastic modulus and viscous modulus to evaluate slickwater properties.
During the experiment, it was found that under the same experimental conditions, when the flow rate inside the fracture is below a certain value, the settling rate of the sand in a fracture will significantly increase (referred to as the flow velocity threshold of sand settling). When the emulsion concentration and sand ratio change, the flow velocity threshold of sand settling also changes. Therefore, various thresholds under different field scales were obtained through experiments. When the flow rate threshold occurring during sand settling is converted to field displacement for field experimentation, sand plugging does not occur during the field operation. The flow rate threshold occurring during sand settling has significant guiding significance for field fracturing operations in avoiding sand plugging.
2. Experimental Materials and Methods
2.1. Experimental Material
Slickwater within the same system has significant differences in its sand-carrying ability. For this experiment, two types of systems were selected: conventional slickwater (DR-800) and viscous slickwater (DR-900). Viscous slickwater can be quicker to achieve peak viscosity through hydrophobic bonding, and has a higher viscosity and better viscoelastic properties compared to the same emulsion concentration of conventional slickwater. The viscoelastic properties of viscous slickwater water are better, which is mainly reflected in the frequency of the cross point of G″ and G′, which is smaller, and the elastic modulus and viscous modulus are bigger. To achieve the same viscoelastic properties as viscous slickwater, common slickwater requires a higher concentration.
Two types of water with different mineral levels were used during the experiment. The high salinity water had a mineral content of 15,711.66 mg/L, while the tap water (low-salinity water) had a mineral content of 50 mg/L.
During the field hydraulic fracturing operation, large-sized sand was used to support the main fractures, while small-sized sand was used to support microfractures. In this study, 50/140 mesh quartz sand was used, like ones applied in the field. As observed in the Figure 1, sand of 60/70 mesh accounts for nearly half of the distribution, while 70/100 mesh and 100–140 mesh sand accounts for approximately one-fourth.
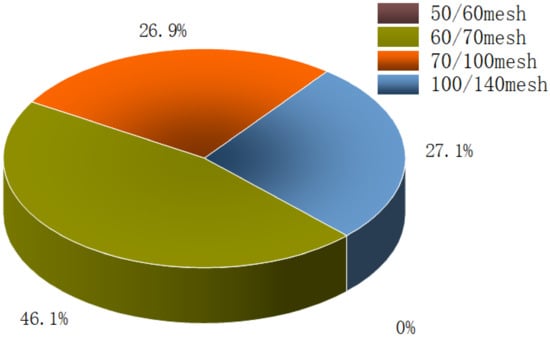
Figure 1.
Particle size distribution of 50/140 mesh sands.
A field test was carried out in the Mahu Block of Xinjiang Oilfield. The fracturing operation for this test was hydraulic fracturing of a horizontal well. The target reservoir was the Triassic Baikouquan Formation. The entire fracturing process uses slickwater for hydraulic fracturing. The pumping rate was controlled between 10.0 and 12.0 m3/min throughout the operation.
2.2. Experimental Methods
2.2.1. Viscosity Measurement
During the migration process of the sand, viscosity plays a relatively important role. The higher the viscosity, the better the sand-carrying ability, the slower the settling speed of the sand, and the longer the migration distance. At the same time, since slickwater is a polymer and has shear-thinning properties, its viscosity changes with the shear rate [14]. Therefore, during the migration of the sand, the viscosity also changes with the flow rate. A HAAKE rheometer is used to measure the viscosity of the fluid, where the shear rate changes within a range of 0.1–1000 s−1. When using slickwater in the field, three viscosity levels are generally used, where the slickwater concentrations are 0.2 wt.%, 0.4 wt.%, and 0.6 wt.%, respectively.
2.2.2. Measurement of Viscoelastic Property
Using the dynamic frequency scanning model of the HAAKE rheometer, the elastic modulus and viscous modulus of different emulsion concentrations of slickwater can be measured at different frequencies. Firstly, the stress value in the linear viscoelastic region is determined through stress scanning with the HAAKE rheometer. Then, the elastic modulus and viscous modulus are tested under the corresponding stress condition, and measurements are conducted within the frequency range from 0.01 to 10 Hz.
2.2.3. Laboratory Sand Settling Test without a Horizontal Flow Rate
In general, sand settling tests without a horizontal flow rate have been measured for a single particle and multiple particles to study the impact of particle concentration on the settling rate. Both measurements are conducted in a graduated cylinder. The pre-prepared slickwater is poured into the cylinder and a single sand particle is placed at the top of the liquid surface to observe its settling rate. The pre-prepared slickwater is poured into the cylinder and multiple particles with a certain sand ratio are added. After sand is placed in the graduated cylinder, it is well mixed and placed for observations of the sand settling across time.
In this article’s experiment, slurry with a sand ratio of 30% and a flow rate of 18 m/min is injected into the rough fracture to simulate slurry being sheared. After waiting for 1 min, sand injection is stopped, and the settling of the sand is observed from that moment. The settling rate at that particular time is recorded.
2.2.4. Laboratory Sand-Carrying Experiment
Hydraulic fractures typically have narrow widths of only a few millimeters, and the wall surface is rough; this is significantly different from the graduated cylinder that is typically used for sand settling tests [15,16,17,18]. Therefore, this experiment aims to observe the settling of the sand on a rough surface.
The sand-carrying experiment was conducted using a visualized rough fracture model for observing sand migration [19]. The model consists of a flow meter, a mixing tank, a visualized rough fracture model, a centrifugal pump, and a camera. The visualized model has a height of 300 mm, a width of 6 mm, and a length of 900 mm. The maximum pump rate of the centrifugal pump during water displacement is 0.059 m3/min, and the maximum volume in the bucket is 110 L. Sand of 50/140 mesh quartz at 10%, 20%, and 30% sand ratios is used to conduct experiments, respectively.
The visualized model was made of epoxy resin, which provides good visual effects and facilitates the observation of the fracture conditions when illuminated (as show in Figure 2). In order to realistically simulate underground conditions, a large shale block was employed. After using true triaxial fracturing, two transparent epoxy resin pieces were placed on different rough fracture surfaces to form the rough fracture surface. Then, the above transparent epoxy resin was then fixed together with a 6 mm fracture width.
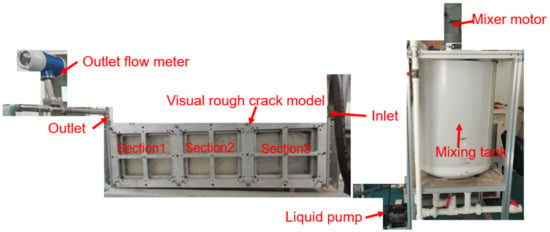
Figure 2.
Visualized rough fracture model for observing the sand migration.
When the slurry is freshly prepared, its viscosity is low. However, the viscosity gradually increases as the time increases. The field slurry generally takes 5–8 min to travel from the wellhead to the bottom of the well. Therefore, before the experiment, the slurry is first stirred for 8 min using the mixer motor in the mixing tank. After that, the slurry is injected into the visual rough fracture model. The flow rate in a rough fracture ranges from 3.88 m/min to 33.22 m/min.
The flow rate of the slurry refers to its concentration without any sand. The sand ratio is determined by dividing the volume of sand by the total volume of the slurry. For instance, in an experiment consisting of 50 L of slurry and 5 L of sand, the sand ratio at this point would be 10%.
3. Result Analysis
3.1. Viscosity Measurement Results
Viscous slickwater is a kind of non-Newtonian fluid, therefore exhibiting shear-thinning behavior, where viscosity decreases with increasing shear rate. However, different types of slickwater can have different viscosities under the same slickwater concentration conditions. The experiment selected two types of slickwater, DR900 (viscous slickwater) and DR800 (conventional slickwater), and measured their viscosities using a rheometer at three mass concentrations: 0.2 wt.%, 0.4 wt.%, and 0.6 wt.%. The shear rates ranged from 0.1 to 1000 s−1.
Figure 3 and Table 1 reveals that for DR800 (conventional viscous slickwater) at high shear rates, the viscosity is below 10 mPa·s for the three different mass concentrations. In contrast, for DR900 (viscous slickwater) at a mass concentration of 0.2 wt.%, the viscosity is around 10 mPa·s at high shear rates, while the remaining viscosities are higher.
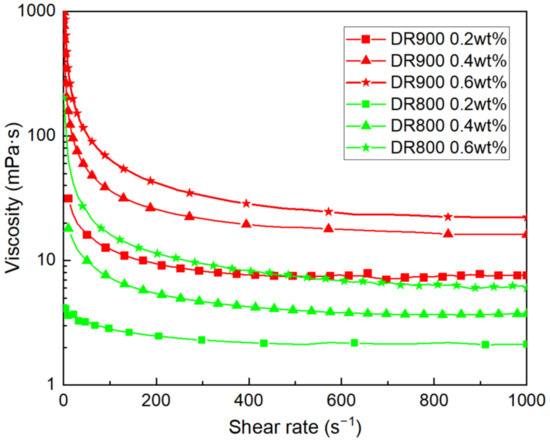
Figure 3.
Change in viscosity with shear rate (DR900: viscous slickwater; DR800: conventional slickwater).

Table 1.
Viscosity of DR900 (viscous slickwater) and DR800 (conventional slickwater) at different shear rates.
3.2. The Difference between Sand Settling Tests with and without a Horizontal Flow Rate in Viscous Slickwater
3.2.1. Sand Settling Test without a Horizontal Flow Rate in Viscous Slickwater
A sand settling test without a horizontal flow rate refers to the suspension of particles in a liquid without any flow, relying on viscosity. In this study, a sand settling test without a horizontal flow rate uses sheared slurry. Initially, the slurry is pumped into a visualized rough fracture model at a certain flow rate, and then the pump is stopped so as to measure the time required for the complete settling of the sand.
Figure 4 shows the sand settling of 70/140 mesh quartz sand, with a sand concentration of 10%, within a rough fracture when the slurry viscosity is 10 mPa·s. The pump was stopped for 28 s to observe the settling. Before stopping pumping, the liquid flowed from section 3 to section 1 at a velocity of 18 m/min.
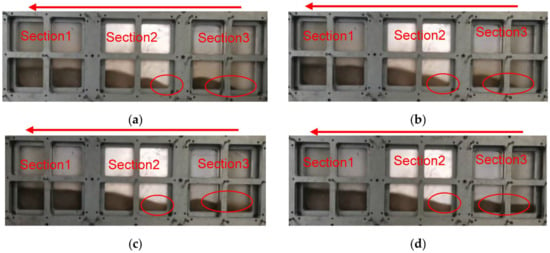
Figure 4.
Schematic diagram of sand settling without a horizontal flow rate in a rough fracture (0.3 wt.% emulsion concentration; 10% sand ratio). The area of red ovals is used to observe whether the sandbank has obvious changes. (a) 0 s after stop pumping; (b) 3 s after stop pumping; (c) 10 s after stop pumping; (d) 28 s after stop pumping. Arrow is the injection direction.
After 3 s of stopping pumping, the settling was not noticeable to the naked eye. After 10 s of stopping pumping, it was clearly observed that there is settling at the connection between sections 2 and 3 (as shown in the red oval areas in Figure 4c), and the height of the sand bank in the middle of section 2 has increased. There was a noticeable accumulation of sand in section 3 (as shown in the red oval areas in Figure 4a,c) before and after stopping pumping. Additionally, at the connection between sections 2 and 3, a significant change in sand bank height was observed after 10 s of stopping pumping (as shown in the red oval areas in Figure 4c).
After 28 s of stopping pumping, the liquid inside the fracture appeared milky white with no suspended yellow particles, and the sand bank had a clear shape. This indicates that settling had ended at 28 s (as shown in the red oval areas in Figure 4d). The settling in section 3 was slower, and when the pump had been shut down for 10 s, the slurry continued to remain murky, and the height of the sand bank changed (as shown in the red oval areas in Figure 4c). This phenomenon may be due to the dense concentration of sand in that area, causing the sand particles to collide with each other and preventing complete settling in that section.
3.2.2. Sand Settling Test with a Horizontal Flow Rate in Viscous Slickwater
Sand settling test with a horizontal flow rate refers to the observation of the settling rate of sand during the fluid flow. In the experiment, a slurry is pumped into a visualized rough fracture model at a certain flow rate, and the settling rate of the sand bank is measured after continuous pumping for 1 min.
The fluid flows from section 3 to section 1 at a flow rate of 8.8 m/min with a sand ratio of 10%. From Figure 5, it can be observed that after 1 min, sand settling only occurs in section, and the settling height is low. The equilibrium height with a horizontal flow rate of the sand bank is smaller than the equilibrium height without a horizontal flow rate of the settling sand bank.

Figure 5.
Schematic diagram of settling with a horizontal flow rate in rough fractures. (a) Initial state; (b) after pumping for 1 min. Arrow is the injection direction.
The sand is uniformly distributed within the fractures, and the height of sand descent cannot be determined. Therefore, the calculation method for the settling rate with a horizontal flow rate cannot be the same as that without a horizontal flow rate. The settling rate with a horizontal flow rate is calculated by dividing the height of the sand bank by time. In a setting with a horizontal flow rate, the equilibrium height of the sand bank decreases by approximately 6 cm within 1 min. The result of the settling rate with a horizontal flow rate is 0.1 cm/s. In a setting without a horizontal flow rate, the settling height of sand cannot be uniformly measured. Therefore, the settling rate is calculated as height divided by settling time. With an apparatus height of 30 cm, the settling is completed within 28 s, resulting in a settling rate of 0.933 cm/s.
The significant difference between the settling rate without a horizontal flow rate, which relies solely on viscosity, and the settling rate with a horizontal flow rate indicates that sand transport within fractures is not purely dependent on viscosity but also relies on velocity. This suggests that for viscous slickwater within fractures, the rate of sand transport is influenced by both viscosity and velocity.
3.3. Comparison between Stokes Model and Actual Settling Rate
Stokes proposed in the 1850s that solid spherical particles experience viscous resistance during fluid movement. This resistance depends on the radius and velocity of the particles. Based on this observation, he derived a predictive equation for the settling rate of a single particle in still water [20]. However, this equation can only predict the settling of single particle, and there is a significant discrepancy between experimental results for the settling of multiple particles and the predictions of the Stokes equation. He et al. [21] have modified this equation and proposed a predictive equation for the settling rate of multiple particles in still water.
where dp is the particle size of the sand, m; wf is the fracture width, m; φ is the sand ratio, dimensionless; ρs is the true density of the sand, kg/m3; ρ is the density of the liquid, kg/m3; Vs is the Stokes settling rate, m/s; Vsetting is the settling rate of the sand, m/s; g is the gravitational acceleration, cm/s2; and φ is the viscosity, Pa·s.
The calculated result using this formula is shown in Figure 6. Although this formula takes into account the influence of fracture width, particle size, and sand ratio, the data used to fit the formula were obtained under non-shear experimental conditions. The flow rate of the sand during the descent is low, resulting in little liquid shear and high viscosity.
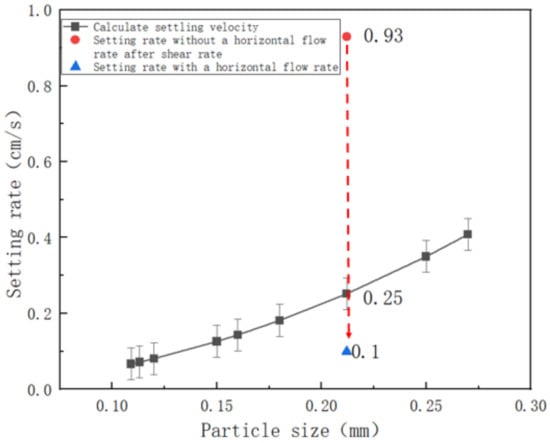
Figure 6.
Comparison of settling rate results.
In this study, the liquid was sheared at a certain flow rate. So, the shear rate is much higher than the shear rate during settling without a horizontal flow rate. Due to shear thinning, the viscosity after shearing at a certain flow rate is lower than the viscosity during settling without a horizontal flow rate. Therefore, the actual observed settling rate is higher than the result calculated by Equation (2).
When slurry is pumped into the fracture at a flow rate of 8.8 m/min, the vertical settling rate is only 0.1 cm/s, which is only one-ninth of that under the condition without a horizontal flow rate. This result indicates that the settling rate will decrease greatly if there is a horizontal flow rate for slurry, which means that sand can be transported further.
3.4. Sand Settling Test Results at Different Horizontal Flow Rates
Experimental findings have shown that the settling rate of sand is also related to the flow rate. Therefore, experiments are conducted at different horizontal flow rates.
The experimental conditions were the same as those of the sand-carrying experiment, with different flow rates used to observe sand-carrying ability. From Figure 7, it can be observed that there is a significant difference in the settling height of the sand banks under different flow velocities. There were no sand banks that appeared at a flow velocity of 21 m/min (as shown in Figure 7a). As the flow rate decreased, sand banks gradually appeared. When the flow rate dropped to 8 m/min (as shown in Figure 7d), the sand banks in different locations settled rapidly and the sand settling rate increased. The sand settled as soon as it entered the rough fracture, indicating bad sand-carrying ability in this flow rate. Although the flow velocity can carry sand, the sand-carrying ability is extremely poor below a certain flow velocity.
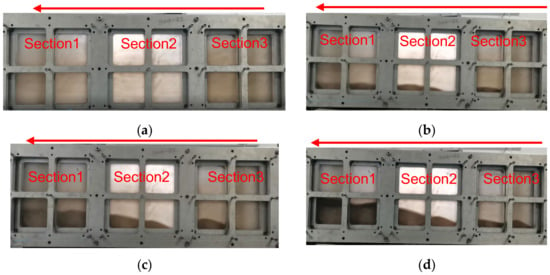
Figure 7.
Sand-carrying ability with a different horizontal flow rate in rough fractures (0.4 wt.% emulsion concentration of conventional slickwater; 10% sand ratio). (a) 21 m/min; (b) 16 m/min; (c) 12 m/min; (d) 8 m/min. Arrow is the injection direction.
3.5. Factors Influencing Viscoelasticity
When subjected to external forces, viscoelasticity is the strain response of a material under shear stress. A bigger elastic modulus indicates that it is harder to cause deformation under shear stress. The relaxation time, which is the time required for the material to return to its equilibrium state, is the reciprocal of the frequency [22]. It is generally believed that a longer relaxation time or lower frequency represents a better sand-carrying ability. The elastic modulus, known as the storage modulus, is represented by G′, while the viscous modulus, known as the loss modulus, is represented by G″. When G′ is greater than G″, elasticity begins to dominate, indicating a significant improvement in the strength of the structure as compared to before.
From Figure 8, it can be observed that the cross point of G″ and G′ is similarly related to the concentration. The higher the emulsion concentration, the higher the viscous modulus and elastic modulus, and the frequency of the cross point of G″ and G′ is smaller. It is generally believed that when the cross point of G′ and G″ is less than 1 Hz, it indicates good viscoelastic property.
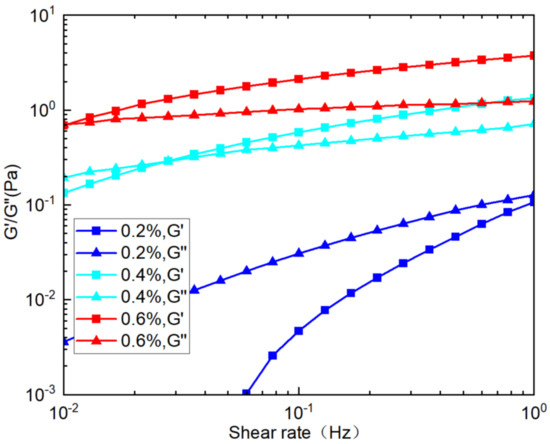
Figure 8.
Viscous modulus and elastic modulus curves of viscous slickwater at different concentrations.
In Figure 9, the elastic modulus and viscous modulus of viscous slickwater and conventional slickwater with the same concentration are compared. The viscous modulus difference between DN900 and DN800 is 6 times at a shear rate of 0.01 Hz, while the elastic modulus difference is 70 times. However, as the frequency increases, the disparity between the viscous modulus and the elastic modulus gradually decreases. At 1 Hz, viscous slickwater has an elastic modulus 11.8 times higher than that of conventional slickwater and a viscous modulus 3.53 times higher than that of conventional slickwater.
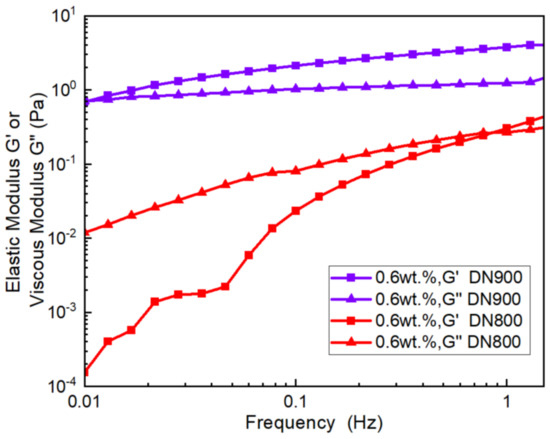
Figure 9.
Comparison of viscous modulus and elastic modulus curves for different types of slickwater (DR900: viscous slickwater; DR800: conventional slickwater).
Therefore, the magnitude of the elastic modulus and viscous modulus, and the cross point of G″ and G′ are not only dependent on the concentration but also closely related to the slickwater itself.
3.6. The Effect of Viscoelasticity on Sand-Carrying Ability
The settling rates of sand with or without a horizontal flow rate are different. With a horizontal flow rate, the settling rate of the sand is small, which allows for sand carrying over a longer distance and a better sand-spreading effect. From Section 3.3, it can be known that when the slickwater flows at a certain velocity, the settling velocity of the sand decreases, which means the sand settles more slowly and has a better sand-carrying ability. The reason why the sand settling rate with a horizontal flow rate is slower than the sand settling rate without a horizontal flow rate is generally believed to be due to the viscoelasticity of the slickwater.
The cross point of G′ and G″ is the point where elasticity takes dominance, and the shear rate of this transition significantly affects sand-carrying ability. Additionally, the magnitude of the elastic modulus and viscous modulus also has a significant impact on sand-carrying ability.
3.6.1. Influence of Cross Point of G′ and G″ on Sand-Carrying Ability
When the elastic modulus (G′) exceeds the viscous modulus (G″), the strength of the structure is higher than the original structure, resulting in better sand-carrying ability. To investigate the impact of different cross points of G′ and G″ on sand-carrying ability, experiments were conducted using water with varying degrees of mineralization. The degree of mineralization affects the viscosity and the elastic modulus and viscous modulus, so the concentration of slickwater in high salinity water was adjusted to match the viscosity of tap water.
Figure 10 shows the two types of slickwater prepared using high salinity water and tap water separately. This experiment involved preparing viscous slickwater at two different mineralization levels. By adding different concentrations of viscous slickwater to water with different mineralization levels, the aim is to achieve the same viscosity. The cross point of G′ and G″ for the viscous slickwater prepared with tap water was at 0.2783 Hz, while the cross point for the slickwater prepared with high salinity water was at 1.468 Hz. The frequency at the cross point increased by 5.27 times.
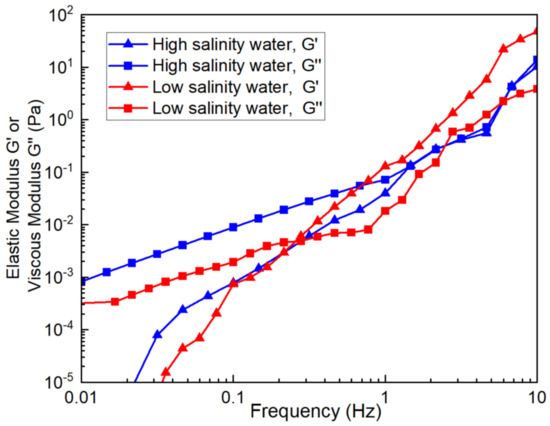
Figure 10.
Elastic modulus and viscous modulus of viscous slickwater with different mineralization degrees under the same viscosity.
In Figure 11, the sand-carrying ability of viscous slickwater prepared under different mineralization levels at a flow velocity of 12.22 m/s is illustrated. Section 1 of Figure 11 shows that the equilibrium height of the sand bank exceeds 15 cm at high mineralization levels (as shown in Figure 11a), whereas it is only 12 cm under tap water conditions (as shown in Figure 11b). In section 2, the equilibrium height of the sand bank is 8 cm for high mineralization levels (as shown in Figure 11a), compared to 6 cm for tap water (as shown in Figure 11b). Furthermore, the sand bank’s leading edge formed by high mineralization slurry in section 2 has already connected with section 3, while the sand bank formed by tap water has only surpassed the middle section. Finally, in section 3, where slurry with high mineralization is used, the sand bank’s equilibrium height is higher, and the leading edge of the sand bank is closer to the inlet end (as shown in Figure 11a).

Figure 11.
Comparison of sand-carrying ability under different cross points of G′ and G″ with the same viscosity and same velocity conditions. (a) High salinity water. (b) Tap water. Arrow is the injection direction.
Therefore, through this experiment, it can be observed that with the same viscosity, the smaller the cross point of the G′ and G″, the better the sand-carrying ability. The frequency of the cross point of G′ and G″ influences sand-carrying ability.
3.6.2. Influence of Magnitude of Elastic Modulus and Viscous Modulus on Sand-Carrying Ability
Sand-carrying ability is not only related to the cross point of G′ and G″, but the magnitude of the elastic modulus also has a certain impact on sand-carrying ability. In this experiment, the elastic modulus and viscous modulus of conventional slickwater were measured (as shown in Figure 12). It was found that at concentrations of 0.2 wt.% and 0.4 wt.%, the frequencies at the cross point of G′ and G″ were similar, around 1 Hz. However, there was a significant difference in the magnitudes of the elastic modulus. At 1 Hz, the elastic modulus of the 0.4 wt.% concentration was 0.0825 Pa, while for the 0.6 wt.% concentration, it was 0.3012 Pa. At 1 Hz, the elastic modulus of 0.6 wt.% was 3.65 times that of 0.4 wt.%.
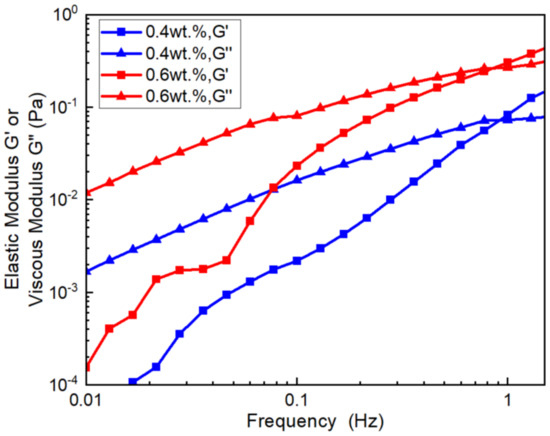
Figure 12.
Elastic modulus and viscous modulus of conventional slickwater.
For the experiment, solution A, the slurry with a high elastic modulus and viscous modulus, and solution B, the slurry with a low elastic modulus and viscous modulus, were used. The sand ratio for the experiment was 10% and the flow velocity was set at 12 m/min. In section 1, the equilibrium height of the sand bank in solution B was measured to be 15 cm (as shown in Figure 13a), while in solution A, it was measured to be 13 cm (as shown in Figure 13b). In section 2, the height of the sand bank in solution B was not only significantly higher than that of solution A, but its leading edge was also closer to section 3. In section 3, although the sand bank of solution A was higher than that of solution B in some areas, solution B had a larger sand-covered area. Overall, solution B had a higher equilibrium sand bank height and a larger sand bank area.

Figure 13.
The sand-carrying ability of conventional slickwater at different concentrations. (a) 0.2 wt.%, 10% sand ratio, and 12 m/min; (b) 0.4 wt.%, 10% sand ratio, and 12 m/min. Arrow is the injection direction.
The higher the elastic modulus and viscous modulus, the more difficult it is for the sand to settle. The magnitude of the elastic modulus and viscous modulus greatly affects the flow rate threshold occurring during sand settling in fractures.
3.7. Sand-Carrying Ability of Different Types of Slickwater
The magnitude of the elastic modulus and viscous modulus, and the cross point of G′ and G″ have an impact on sand-carrying ability. The cross point of slickwater is more to the left, indicating a better elastic sand-carrying ability. Therefore, this study compares sand-carrying ability through sand-carrying experiments in fractures using two types of fluids: viscous slickwater and conventional slickwater. The settling results were obtained for a 0.2 wt.% slickwater concentration and a 10% sand ratio at different flow velocities. The results are showen in Table 2.

Table 2.
Comparison of settling results between viscous slickwater and conventional slickwater.
Considering the settling rate of sand, the sand-carrying ability of viscous slickwater is better than conventional slickwater. This supports the viewpoint that the cross point of G′ and G″ is more to the left and the higher viscous modulus and elastic modulus, the better the sand-carrying ability.
3.8. Sand-Carrying Threshold in Rough Fractures
The sand-carrying threshold in rough fractures is obtained by the flow rate threshold occurring during sand settling under different flow rates and at different sand ratios. The experimental results in Section 3.4 showed that when the flow rate is below a certain value, the settling rate of sand increases suddenly. In order to obtain the flow rate threshold occurring during sand settling at different sand ratios and under different flow velocity conditions, separate experiments were conducted in this study.
Figure 14 presents the results of the experiments conducted under the condition of a slickwater concentration of 0.2 wt.%, where the sand ratio and flow velocity were varied. The experimental results indicate that at a sand ratio of 10%, when the flow velocity within the fracture exceeds 8.0 m/s, the slurry has good sand-carrying ability and the sand remains consistently suspended. As the sand ratio continues to increase, the flow rate threshold occurring during sand settling of the sand increases. The flow rate threshold occurring during sand settling for a 20% sand ratio is 12.2 m/s, and for a 30% sand ratio, it is 16.4 m/s.
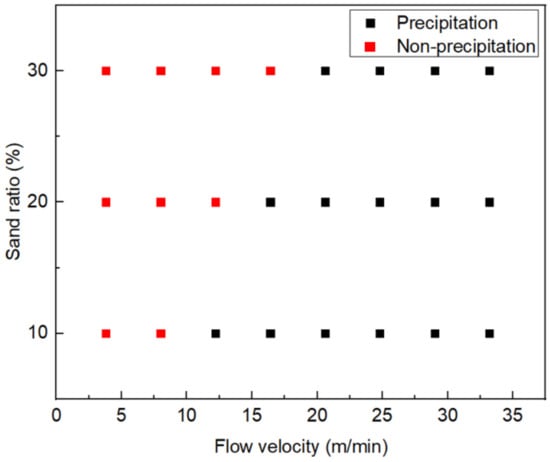
Figure 14.
Sand-carrying threshold in rough fractures.
4. Application of Sand-Carrying Threshold in the Field
4.1. Scaling from the Laboratory to the Field
In laboratory experiments, it was found that when the slickwater concentration is 0.4 wt.%, the sand ratio is 20%, and the flow rate inside the fracture is 8.02 m/min, the sand does not experience settling and is transported to the bottom of the fracture. When the slickwater concentration is 0.6 wt.%, the sand ratio is 30%, and the flow rate inside the fracture is 8.02 m/min, the sand does not settle and the slurry carries the sand to the bottom.
The sand-carrying threshold obtained from indoor experiments can be converted into an on-site pumping rate using the following formula:
where V represents flow velocity in m/min; Qlab represents laboratory displacement in m3/min; W1 is the laboratory fracture width in meters; h is the laboratory fracture height in meters; Qon-site is the field displacement in m3/min; W2 is the field fracture width in meters; H is the laboratory fracture height in meters; N represents the number of field fracturing clusters, dimensionless.
The field fracture width is 6 mm and the fracture height is 30 m. When the internal flow velocity is 12.22 m/min, the field displacement is 13 m3/min. When the internal flow velocity is 8.02 m/min, the field displacement is 8.7 m3/min.
4.2. Field Test
Through field experimental data, it has been concluded that at a concentration of 0.6 wt.% slickwater, there is no sand blockage when the displacement exceeds 11 m3/min and the concentration carried is less than 450 kg/m3 (corresponding to a sand ratio of 30%). At a concentration of 0.4 wt.% slickwater, there is no sand blockage in the field when the displacement exceeds 8.7 m3/min and sand concentration carried is less than 300 kg/m3 (corresponding to a sand ratio of 20%).
To upscale the laboratory findings and field tests, the operations are conducted under two kinds of conditions. The first condition is a 0.6 wt.% slickwater concentration, a maximum sand concentration of 360 kg/m3 (corresponding to a sand ratio of 24%), and a displacement rate of 11.07 m3/min. The second condition is a 0.4 wt.% emulsion concentration, a maximum sand concentration of 180 kg/m3 (sand ratio of 12%), and an operation displacement rate of 11.07 m3/min. No sand blockage occurred during the sand addition process. The operation parameters are shown in Figure 15.
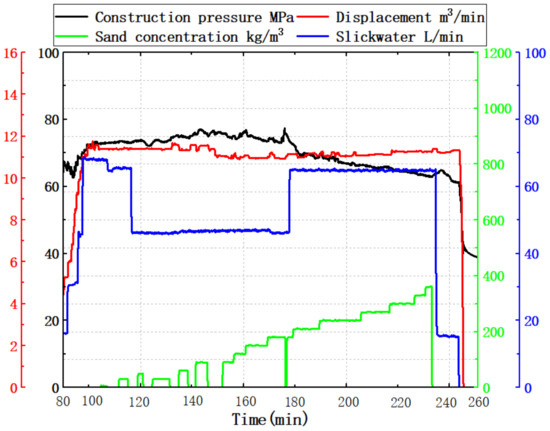
Figure 15.
Field pressure operation curve.
4.3. Operation Summary
Based on the laboratory results, guidance is provided for the fracturing operation of the Triassic Baikouquan Formation in the Mahu oilfield. The well in operation is horizontal, and viscous slickwater is employed for fracturing. The fracturing job consists of 21 stages, and this paper selects a relatively typical stage, namely, stage 9.
From Figure 16, it can be observed that during the field fracturing process, the slickwater concentration is generally 0.58 wt.% and 0.4 wt.%. When the sand concentration reaches its maximum at 370 kg/m3 (corresponding to a sand ratio of 24.6%), the corresponding slickwater concentration is 0.58 wt.%. The maximum sand concentration at a slickwater concentration of 0.4 wt.% is 180 kg/m3. The process of adding sand went smoothly, and the field operation results were consistent with the laboratory experimental ones.
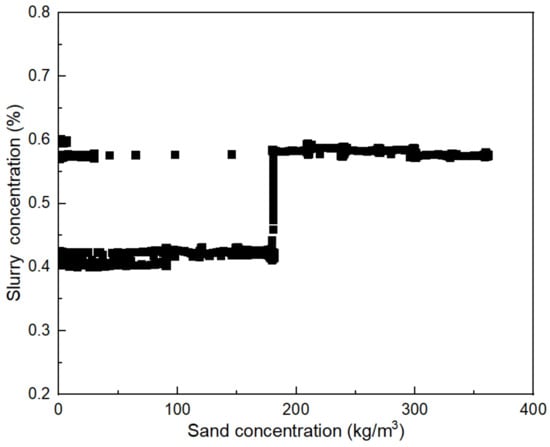
Figure 16.
Slickwater concentration corresponding to different sand concentrations during field operation at a displacement rate of 11.07 m3/min.
5. Conclusions
- (1)
- Viscosity is one of the factors that affect the settling rate of sand, but if the slurry flows with a horizontal flow rate, viscoelasticity also plays an important role.
- (2)
- Compared to the sand settling rate in slurry without a horizontal flow rate, the sand settling rate in slurry with a horizontal flow rate is significantly decreased, allowing sand to be transported further.
- (3)
- Sand settling is negligible when the concentration and flow velocity are relatively low. On the other hand, conventional slickwater has a poor sand-carrying ability and tends to settle when the concentration is low but flow velocity is relatively high.
- (4)
- The main reason for the difference in settling rates between the two types of slickwater is due to the viscoelastic properties of the polymers. The viscoelastic properties are mainly reflected in two aspects: (1) the shear rate at the cross point of G′ and G″, and (2) the magnitude of the elastic modulus and viscous modulus. When the shear rate corresponding to the cross point of G′ and G″ is smaller, the elastic sand-carrying region is larger, resulting in a better sand-carrying ability. The larger the viscous modulus and elastic modulus, the better the sand-carrying ability of the slickwater.
- (5)
- When the inner-fracture flow rate reaches the sand-carrying threshold found through the laboratory measurements, sand blockage can be hindered during the field operation.
Author Contributions
Conceptualization, J.W. and T.L.; Methodology, X.H., J.W. and J.L.; Investigation, X.H., Y.J., Y.L., B.X. and H.Y.; Resources, X.C.; Writing—original draft, X.H., J.W. and Y.J.; Writing—review & editing, T.L.; Supervision, T.L. and H.Y.; Formal analysis, J.L.; Data curation, J.L.; Validation, J.L.; Project administration, B.X. and X.C.; Funding acquisition, B.X.; Project administration, X.C.; Writing—review, H.Y.; Writing—review & review, T.L. All authors have read and agreed to the published version of the manuscript.
Funding
This work was financially supported by the General Program Grant from the National Natural Science Foundation of China (No. 52274051), the Development Project of Xinjiang Conglomerate Reservoir Laboratory (No. 2020D04045), and the Strategic Cooperation Technology Projects of CNPC and CUPB (Grant No. ZLZX2020-01).
Data Availability Statement
The data presented in this study are available on request from the corresponding author (accurately indicate status).
Conflicts of Interest
Authors Xianzhu Han, Yongjun Ji, Jinjun Liu, Yang Liu, Bobo Xie, Xianjiang Chen and Hui Yin were employed by the company PetroChina. The remaining authors declare that the research was conducted in the absence of any commercial or financial relationships that could be construed as a potential conflict of interest.
References
- Yang, B.; Zhao, J.; Mao, J.; Tan, H.; Zhang, Y.; Song, Z. Review of Friction Reducers Used in Slickwater Fracturing Fluids for Shale Gas Reservoirs. J. Nat. Gas Sci. Eng. 2019, 62, 302–313. [Google Scholar] [CrossRef]
- Xu, H.; Li, Y.; Zhou, F.; Su, H.; Yao, E.; Hu, J.; Chen, Z. Adsorption Characteristics, Isotherm, Kinetics, and Diffusion of Nanoemulsion in Tight Sandstone Reservoir. Chem. Eng. J. 2023, 470, 144070. [Google Scholar] [CrossRef]
- Yamashiro, B.D.; Tomac, I. Fracture Roughness Effects on Slickwater Proppant Slurry Settling Attenuation. Powder Technol. 2022, 395, 516–533. [Google Scholar] [CrossRef]
- Shen, L.; Vigderman, L.; Heller, D.; Fu, D. Can Friction Reducers Transport Sand During Fracturing Treatment? In Proceedings of the 6th Unconventional Resources Technology Conference, Houston, TX, USA, 23–25 July 2018; American Association of Petroleum Geologists: Houston, TX, USA, 2018. [Google Scholar] [CrossRef]
- Bai, H.; Zhou, F.; Zhang, M.; Gao, X.; Xu, H.; Yao, E.; Wang, J.; Li, Y. Optimization and Friction Reduction Study of a New Type of Viscoelastic Slickwater System. J. Mol. Liq. 2021, 344, 117876. [Google Scholar] [CrossRef]
- Cheng, B.; Li, J.; Li, J.; Su, H.; Tang, L.; Yu, F.; Jiang, H. Pore-Scale Formation Damage Caused by Fracturing Fluids in Low-Permeability Sandy Conglomerate Reservoirs. J. Pet. Sci. Eng. 2022, 208, 109301. [Google Scholar] [CrossRef]
- Jing, X.; Fu, Z.; Liu, Y. Effect of Anionic Surfactant on the Properties of Nonionic Hydrophobically Associating Polymer Based Slick Water. J. Dispers. Sci. Technol. 2023, 44, 342–348. [Google Scholar] [CrossRef]
- Yao, E.; Bai, H.; Zhou, F.; Zhang, M.; Wang, J.; Li, F. Performance Evaluation of the Multifunctional Variable-Viscosity Slick Water for Fracturing in Unconventional Reservoirs. ACS Omega 2021, 6, 20822–20832. [Google Scholar] [CrossRef] [PubMed]
- Gomaa, A.M.; Gupta, D.V.S.; Carman, P.; Hughes, B. Proppant Transport? Viscosity Is Not All It’s Cracked up to Be. In Proceedings of the SPE Hydraulic Fracturing Technology Conference, The Woodlands, TX, USA, 3–5 February 2015. [Google Scholar]
- Hu, Y.T.; Chung, H.; Maxey, J. What Is More Important for Proppant Transport, Viscosity or Elasticity? In Proceedings of the SPE Hydraulic Fracturing Technology Conference, The Woodlands, TX, USA, 3–5 February 2015. [Google Scholar]
- Huang, H.; Babadagli, T.; Li, H.A.; Develi, K.; Wei, G. Effect of Injection Parameters on Proppant Transport in Rough Vertical Fractures: An Experimental Analysis on Visual Models. J. Pet. Sci. Eng. 2019, 180, 380–395. [Google Scholar] [CrossRef]
- Yuan, S.; Zhou, F.; Li, Y.; Sheng, L.; Liang, T.; Tang, X.; Liang, X. A Comprehensive Study on the Enhancements of Rheological Property and Application Performances for High Viscous Drag Reducer by Adding Diluted Microemulsion. Geoenergy Sci. Eng. 2023, 227, 211770. [Google Scholar] [CrossRef]
- Biheri, G.; Imqam, A. Proppant Transport Using High-Viscosity Friction Reducer Fracture Fluids at High-Temperature Environment. SPE J. 2022, 27, 60–76. [Google Scholar] [CrossRef]
- Xu, H.; Li, Y.; Yu, G.-L.; Yang, S.-S.; Li, B.-J.; Zhou, F.-J.; Yao, E.-D.; Bai, H.; Liu, Z.-Y. The Enhancement of Performance and Imbibition Effect of Slickwater-Based Fracturing Fluid by Using MoS2 Nanosheets. Pet. Sci. 2022, 20, 2187–2201. [Google Scholar] [CrossRef]
- Novotny, E.J. Proppant Transport. In Proceedings of the SPE Annual Fall Technical Conference and Exhibition, Denver, CO, USA, 9–12 October 1977. [Google Scholar] [CrossRef]
- Liu, Y.; Sharma, M.M. Effect of Fracture Width and Fluid Rheology on Proppant Settling and Retardation: An Experimental Study. In Proceedings of the SPE Annual Technical Conference and Exhibition, Dallas, TX, USA, 9–12 October 2005. [Google Scholar] [CrossRef]
- Luo, L.; Tomac, I. Experimental Investigation of Particle Agglomeration Effects on Slurry Settling in Viscous Fluid. Transp. Porous Media 2018, 121, 333–352. [Google Scholar] [CrossRef]
- Alotaibi, M.A.; Miskimins, J.L. Slickwater Proppant Transport in Hydraulic Fractures: New Experimental Findings and Scalable Correlation. SPE Prod. Oper. 2018, 33, 164–178. [Google Scholar] [CrossRef]
- Qu, H.; Xu, Y.; Hong, J.; Chen, X.; Li, C.; Liu, X. Experimental and Visual Analysis of Proppant-Slickwater Flow in a Large-Scaled Rough Fracture. SPE J. 2023, 28, 477–495. [Google Scholar] [CrossRef]
- Zhang, G.; Li, M.; Guo, T.; Li, Y.; Chen, Z. Characterization of Proppant Effective Settlement Diameter Falling in Non-Newtonian Fracturing Fluids. Adv. Powder Technol. 2016, 27, 486–495. [Google Scholar] [CrossRef]
- He, X.; Wei, D.; Yu, H.; Bai, B.; Chen, A.; Liang, T. Proppant Migration within a Rough Hydraulic Fracture. J. Porous Media 2023, 26, 1–15. [Google Scholar] [CrossRef]
- Ba Geri, M.; Imqam, A.; Bogdan, A.; Shen, L. Investigate The Rheological Behavior of High Viscosity Friction Reducer Fracture Fluid and Its Impact on Proppant Static Settling Velocity. In Proceedings of the SPE Oklahoma City Oil and Gas Symposium, Oklahoma City, OK, USA, 9–10 April 2019; p. D021S004R003. [Google Scholar] [CrossRef]
Disclaimer/Publisher’s Note: The statements, opinions and data contained in all publications are solely those of the individual author(s) and contributor(s) and not of MDPI and/or the editor(s). MDPI and/or the editor(s) disclaim responsibility for any injury to people or property resulting from any ideas, methods, instructions or products referred to in the content. |
© 2024 by the authors. Licensee MDPI, Basel, Switzerland. This article is an open access article distributed under the terms and conditions of the Creative Commons Attribution (CC BY) license (https://creativecommons.org/licenses/by/4.0/).