Article

Examining the Spillover Effects of Renewable Energy Policies on China’s Traditional Energy Industries and Stock Markets

1
Médicis Business School, 75013 Paris, France
2
School of Mathematics and Information Science, Guangzhou University, Guangzhou 510006, China
3
Business School, Hunan First Normal University, Changsha 410205, China
4
School of Economics, Jinan University, Guangzhou 510006, China
*
Author to whom correspondence should be addressed.
Energies 2024, 17(11), 2563; https://doi.org/10.3390/en17112563
Submission received: 12 April 2024 / Revised: 5 May 2024 / Accepted: 13 May 2024 / Published: 25 May 2024
(This article belongs to the Section C: Energy Economics and Policy)

Abstract

:
With the development and refinement of the carbon emissions trading market, the relationship between the carbon market and the stock market has grown increasingly intertwined. This has led to a surge in research investigating the interactions between the carbon market and related sectors. This study examines the intensity and direction of spillover effects among ten industries associated with carbon emissions, spanning traditional and emerging energy sectors. Through static analysis, we find that spillover effects between industries in the carbon and stock markets are bidirectional and asymmetric. Dynamic analysis reveals that the carbon market, acting as the primary recipient of spillover effects, is notably influenced by traditional energy industries such as coal and oil, followed by photovoltaics, new energy vehicles, and others. The magnitude of these spillover effects is subject to fluctuations influenced by energy crises and events like the COVID-19 pandemic, while policy interventions can alter the overall trends in net spillover effects across various industries.

1. Introduction

Since the implementation of carbon emissions trading in China, the participation of companies across various industries in emission reduction initiatives has steadily increased. These companies engage in trading within the carbon emission rights market, thereby attracting significant investments from a multitude of investors. Subsequently, these funds are allocated within the stock market. Enterprises involved in emission reduction activities invest and finance within the stock market, thereby facilitating the flow of funds between the carbon market and the stock market. Consequently, both domestic and international scholars have extensively researched the interplay between the carbon market and the stock market. Numerous studies have revealed that fluctuations in carbon emissions trading prices transmit signals to investors, consequently influencing their investment decisions within the stock market. In essence, fluctuations in carbon market prices can propagate to the stock market, with the effects primarily manifested in energy-related industries. This is because energy utilization serves as the primary source of carbon emissions. Fluctuations in energy sector prices within the stock market can precipitate changes in industrial carbon dioxide emissions, subsequently impacting the trading volume of carbon emission quotas. This, in turn, influences price fluctuations within the carbon market. Notably, when prices fluctuate within the carbon market, industries with significant carbon emissions and dependencies on carbon emission quotas, such as the energy sector, are the first to be affected. These industries respond by enhancing energy efficiency and adjusting energy structures, such as increasing the utilization of clean, low-carbon energy sources while reducing reliance on traditional fossil fuels and adopting emission reduction technologies to mitigate the effects of carbon market price fluctuations. In summary, given the inherent correlation between the carbon market and the energy industry, this article aims to investigate the spillover effects between the carbon emissions market and the stock market, with particular emphasis on the impact of the carbon emissions market on traditional and new energy sectors.
The subsequent sections of this paper are structured as follows. Section 2 conducts a review of the pertinent literature. Section 3 outlines the methodology employed in this study. Section 4 presents the data used and provides summary statistics. In Section 5, the primary empirical findings are presented. Finally, Section 6 concludes the paper and discusses the implications of the empirical results.
This paper contributes significantly in two key aspects. Firstly, it adopts a dynamic research framework to explore the connection between carbon and energy markets, using the Diebold and Yilmaz (2014) [1] methodology to analyze spillovers. This approach effectively captures market inter-dependencies and quantifies the dynamic relationship between carbon and energy markets. Secondly, this paper focuses on the relationship between carbon and energy markets in China, which has received relatively limited attention in the existing literature. While previous studies have explored the link between the carbon market and energy stocks, as shown in the literature review part, there is a dearth of research unifying three components—the Chinese carbon market, traditional energy, and new energy market stocks—for in-depth analysis. Therefore, this paper fills this gap by comprehensively studying China’s carbon market alongside traditional and new energy market stocks. This holistic research approach enhances our understanding of the interactions and impact of these different asset classes in China’s financial markets.
The findings of this study reveal crucial insights into the dynamics of these markets. Notably, the spillover effects between the carbon market and the stock market suggest a strong linkage between the two markets. In terms of spillover direction, the carbon market is identified as a net recipient, while in terms of intensity, spillover performance varies and is asymmetric across sectoral markets. Particularly, the traditional energy sector exhibits the largest spillover effect on the carbon market. This dynamic study further demonstrates that each market exhibits unique time-varying characteristics. These dynamic empirical results underscore the importance of understanding the intricate and evolving relationship between carbon markets and traditional and new energy markets.

2. Literature Review

Regarding the relationship between the carbon market and the energy stock market, a large number of scholars have carried out relevant research, which can be divided into the following aspects.
Firstly, a wealth of literature research indicates a close relationship between carbon markets and stock markets. It was found that there is a significant negative long-term and short-term asymmetric relationship between China’s carbon emissions trading market and the overall stock market. Among them, carbon emission trading prices are significantly related to the stock markets of some energy-intensive industries and financial industries. However, China’s stock index has no significant impact on the transmission of carbon emissions trading prices [2]. It was also revealed that the stock market generally leads the Chinese carbon emissions trading market, with the relationship reversing when carbon market returns are significantly negative. Moreover, exogenous shocks, including government policy and the COVID-19 outbreak, have varying effects on the lead-lag relationship between the carbon market and different stock market sectors [3].
Secondly, there are also corresponding studies on the spillover effects between carbon markets and traditional energy stocks [4,5,6,7,8,9,10,11]. It was found that the correlation between the EU carbon market and the crude oil market exhibits symmetry, with fluctuations in dependence observed across different stages. Particularly, during periods characterized by crisis and instability, there is an amplified interdependence between the two markets [11]. Other studies found that in Europe, the spillover effects of the carbon market are directly transmitted to the electricity market through prices rather than yields, and the energy market plays a bridge role in promoting the coupling of the carbon and electricity markets [4].
Thirdly, more studies focus on the correlation between the carbon market and renewable energy markets [8,12,13,14,15,16,17,18,19]. It has been illustrated that in the context of Europe’s low-carbon environment, the interconnection between the carbon market, stock market, and renewable energy market is increasingly pronounced. In the short term, the carbon market positively impacts the renewable energy market, although this influence gradually diminishes over time. However, in the long term, the correlation between the carbon market and both the stock market and the renewable energy market is nearly negligible. Comparing the period of the European Green Deal with COVID-19, the negative impact of the carbon market on the renewable energy market is more substantial during the latter [5]. By utilizing the TVP-VAR method, some researchers investigated return spillovers among different markets. It was revealed that the clean energy stock market predominantly influences carbon prices and the green bond market. Furthermore, it serves as the primary net transmitter of shocks throughout the entire network, while the green bond and wind energy markets are emerging as the principal recipients of shocks within the system [15].
The analysis of interconnectedness among financial assets has gained popularity in recent years [20,21,22,23,24,25,26]. In the realm of model-based research, prominent methodologies include VAR and its extensions [13,27,28,29,30], GARCH and its extensions [31,32,33], the Diebold–Yilmaz spillover index model [34,35], and so on. In terms of measuring connectedness, Diebold and Yilmaz [35] pioneered the use of a time-varying spillover to quantify it, laying the foundation for subsequent research. The advantages of the Diebold and Yilmaz spillover index model lie in its comprehensive consideration of bidirectional influences among different markets, enabling a thorough capture of spillover effects among assets in financial markets. Additionally, the model’s reliance on time-varying methods allows for the dynamic tracking of spillover effects in financial markets, facilitating a more accurate understanding of changing trends and characteristics in the interrelations among markets. Furthermore, this spillover index model provides intuitive metrics to measure spillover effects among different assets, aiding decision makers in formulating appropriate risk management strategies.
Drawing inspiration from prior research on spillover effects between the carbon market and both the stock market and energy markets, this study innovatively delves deeper into the relevant energy sectors within the stock market. Improvements in the systematic and comprehensive selection of data have been made, ensuring a more robust analysis framework. Furthermore, the incorporation of the COVID-19 pandemic as a temporal marker adds a novel dimension to the investigation, enabling an examination of how spillover effects between the two markets have evolved before and after the outbreak, thereby enriching the understanding of market dynamics amidst significant global events.

3. Research Methods

DY Spillover Index Model Construction

This study primarily employs the Diebold and Yilmaz (DY) spillover index model [35], complemented by the generalized vector autoregression (VAR) method, to address potential issues arising from the lag order dependency of variables. This model is a framework used to measure volatility spillover effects between financial markets. Initially proposed by Diebold and Yilmaz in 2009 [36], this model has been widely adopted to analyze the degree of correlation and risk transmission mechanisms among international financial markets. The model is based on a multivariate GARCH (MV-GARCH) framework, which captures the volatility of each financial market by estimating conditional variances. The DY spillover index model primarily focuses on the volatility transmission effects between two financial markets, known as spillovers. It calculates the spillover index by computing the conditional variance-covariance matrix between the two financial markets. This index indicates how changes in volatility in one market affect another, providing insights into the strength and direction of volatility transmission between them. The advantage of the DY spillover index model lies in its ability to offer an intuitive approach to quantifying volatility spillover effects between different financial markets, aiding investors in better understanding and managing cross-market risks.
Additionally, it quantifies directional spillovers between various markets, providing a comprehensive understanding of intermarket dynamics. The building steps are as follows:
First, construct a stationary N dimension P order vector autoregressive model,
X t = i = 1 p φ i x t i + ε t
where ε t ( 0 ,   Σ ) is an independent and identically distributed vector. The moving average process is
X t = i = 0 M i ε t i
where the coefficient matrix M i satisfies the following recursion equation:
M i = φ 1 M i 1 + φ 2 M i 2 + + φ p M i p
where M 0 is an identity matrix of N × N. If i < 0 , set M 0 = 0 ; if i = 0 , then M 0 is the identity matrix with an N dimension.
The estimated value of the spillover effect is θ ~ i j g ( H ) , which means the part caused from X j to X i with an H-step prediction error. For H = 1 ,   2 ,     ,   K , we can calculate θ ~ i j g ( H ) as follows:
θ ~ i j g ( H ) = σ j j h = 0 H 1 ( e i M h e j ) 2 h = 0 H 1 e i M h e j
where Σ is the covariance matrix of the error vector ε . σ j j is the j th standard error of the error term of the equation, and e i is the selection vector; that is, except for the i th elements that have a value of 1, other elements are all 0. To calculate the overflow index, we standardize each variance decomposition matrix by column as follows:
        θ ~ i j g H = θ i j g H j = 1 N θ i j g H
where j = 1 N θ i j g H =1, i , j = 1 N θ ~ i j g H =N. Based on the fundamental equations above, we can derive the total spillover effect index, directional spillover index, and net spillover index.
The total spillover index characterizes the contribution of spillover effects among variables in the vector to the total prediction error variance. It can be calculated as follows:
T S = S g ( H ) = i , j = 1 i j N θ ~ i j g H i , j = 1 N θ ~ i j g H × 100 = i , j = 1 i j N θ ~ i j g H N × 100    
In a generalized VAR model, directional spillover effects received by variable i from all other variables j can be further computed by standardizing the generalized variance decomposition matrix, given by
S i j g ( H ) = j = 1 i j N θ ~ i j g H i , j = 1 N θ ~ i j g H × 100
Alternatively, directional spillover effects generated by variable i on other variables j can be calculated as
S i j g ( H ) = j = 1 i j N θ ~ j i g H i , j = 1 N θ ~ j i g H × 100
Finally, the net spillover effect of variable i on other variables is given by S i j g S i j g .

4. Data and Variable Description

The Shenzhen Emissions Trading Scheme (ETS) is the first carbon emissions trading exchange established in China. It has the longest operating time, the most comprehensive trading data, and the most representative carbon emission trading prices in the country. This study selects the trading prices from 4 January 2017 to 30 December 2022, comprising a total of 1266 trading days on the Shenzhen ETS. All data were processed using MATLAB 2021b.The trading prices are processed to derive returns as follows:
      s = ( l n p t 1 l n p t ) × 100
where p t represents the trading price on the t th day.
In addition, ten industry stock indices are selected as the research objects. The datasets are from the wind database. On the one hand, the selection of stock indices is based on the fact that the fluctuations in stock indices reflect the economic changes in a country over a while. According to the Efficient Market Hypothesis, the price volatility of stocks expresses a signal, thereby influencing investors’ investment choices in both the carbon market and the energy market. On the other hand, based on the classification standards of the energy industry, these ten industries represent both traditional and new energy sectors and hold significant shares in the stock market. In recent years, carbon emissions from the electricity industry account for approximately 48% of the national total emissions, industrial process emissions account for around 36%, and emissions from the transportation and construction sectors, respectively, contribute 8% and 5%. Therefore, four industries related to electricity generation sources, including coal (CO), petroleum and natural gas (PE), basic chemicals (CH), and photovoltaics (PH), are selected, along with three industries primarily involved in industrial processes with steel (ST), non-ferrous metals (NO), and new energy metals (ME). Additionally, two industries related to transportation, namely new energy vehicles (VE) and new energy batteries (BA), are chosen, along with the environmental protection industry (PR), which aims to achieve low-carbon emissions through energy conservation and emission reduction measures. It is evident from the selections above that all ten industries are closely related to carbon emission indicators.
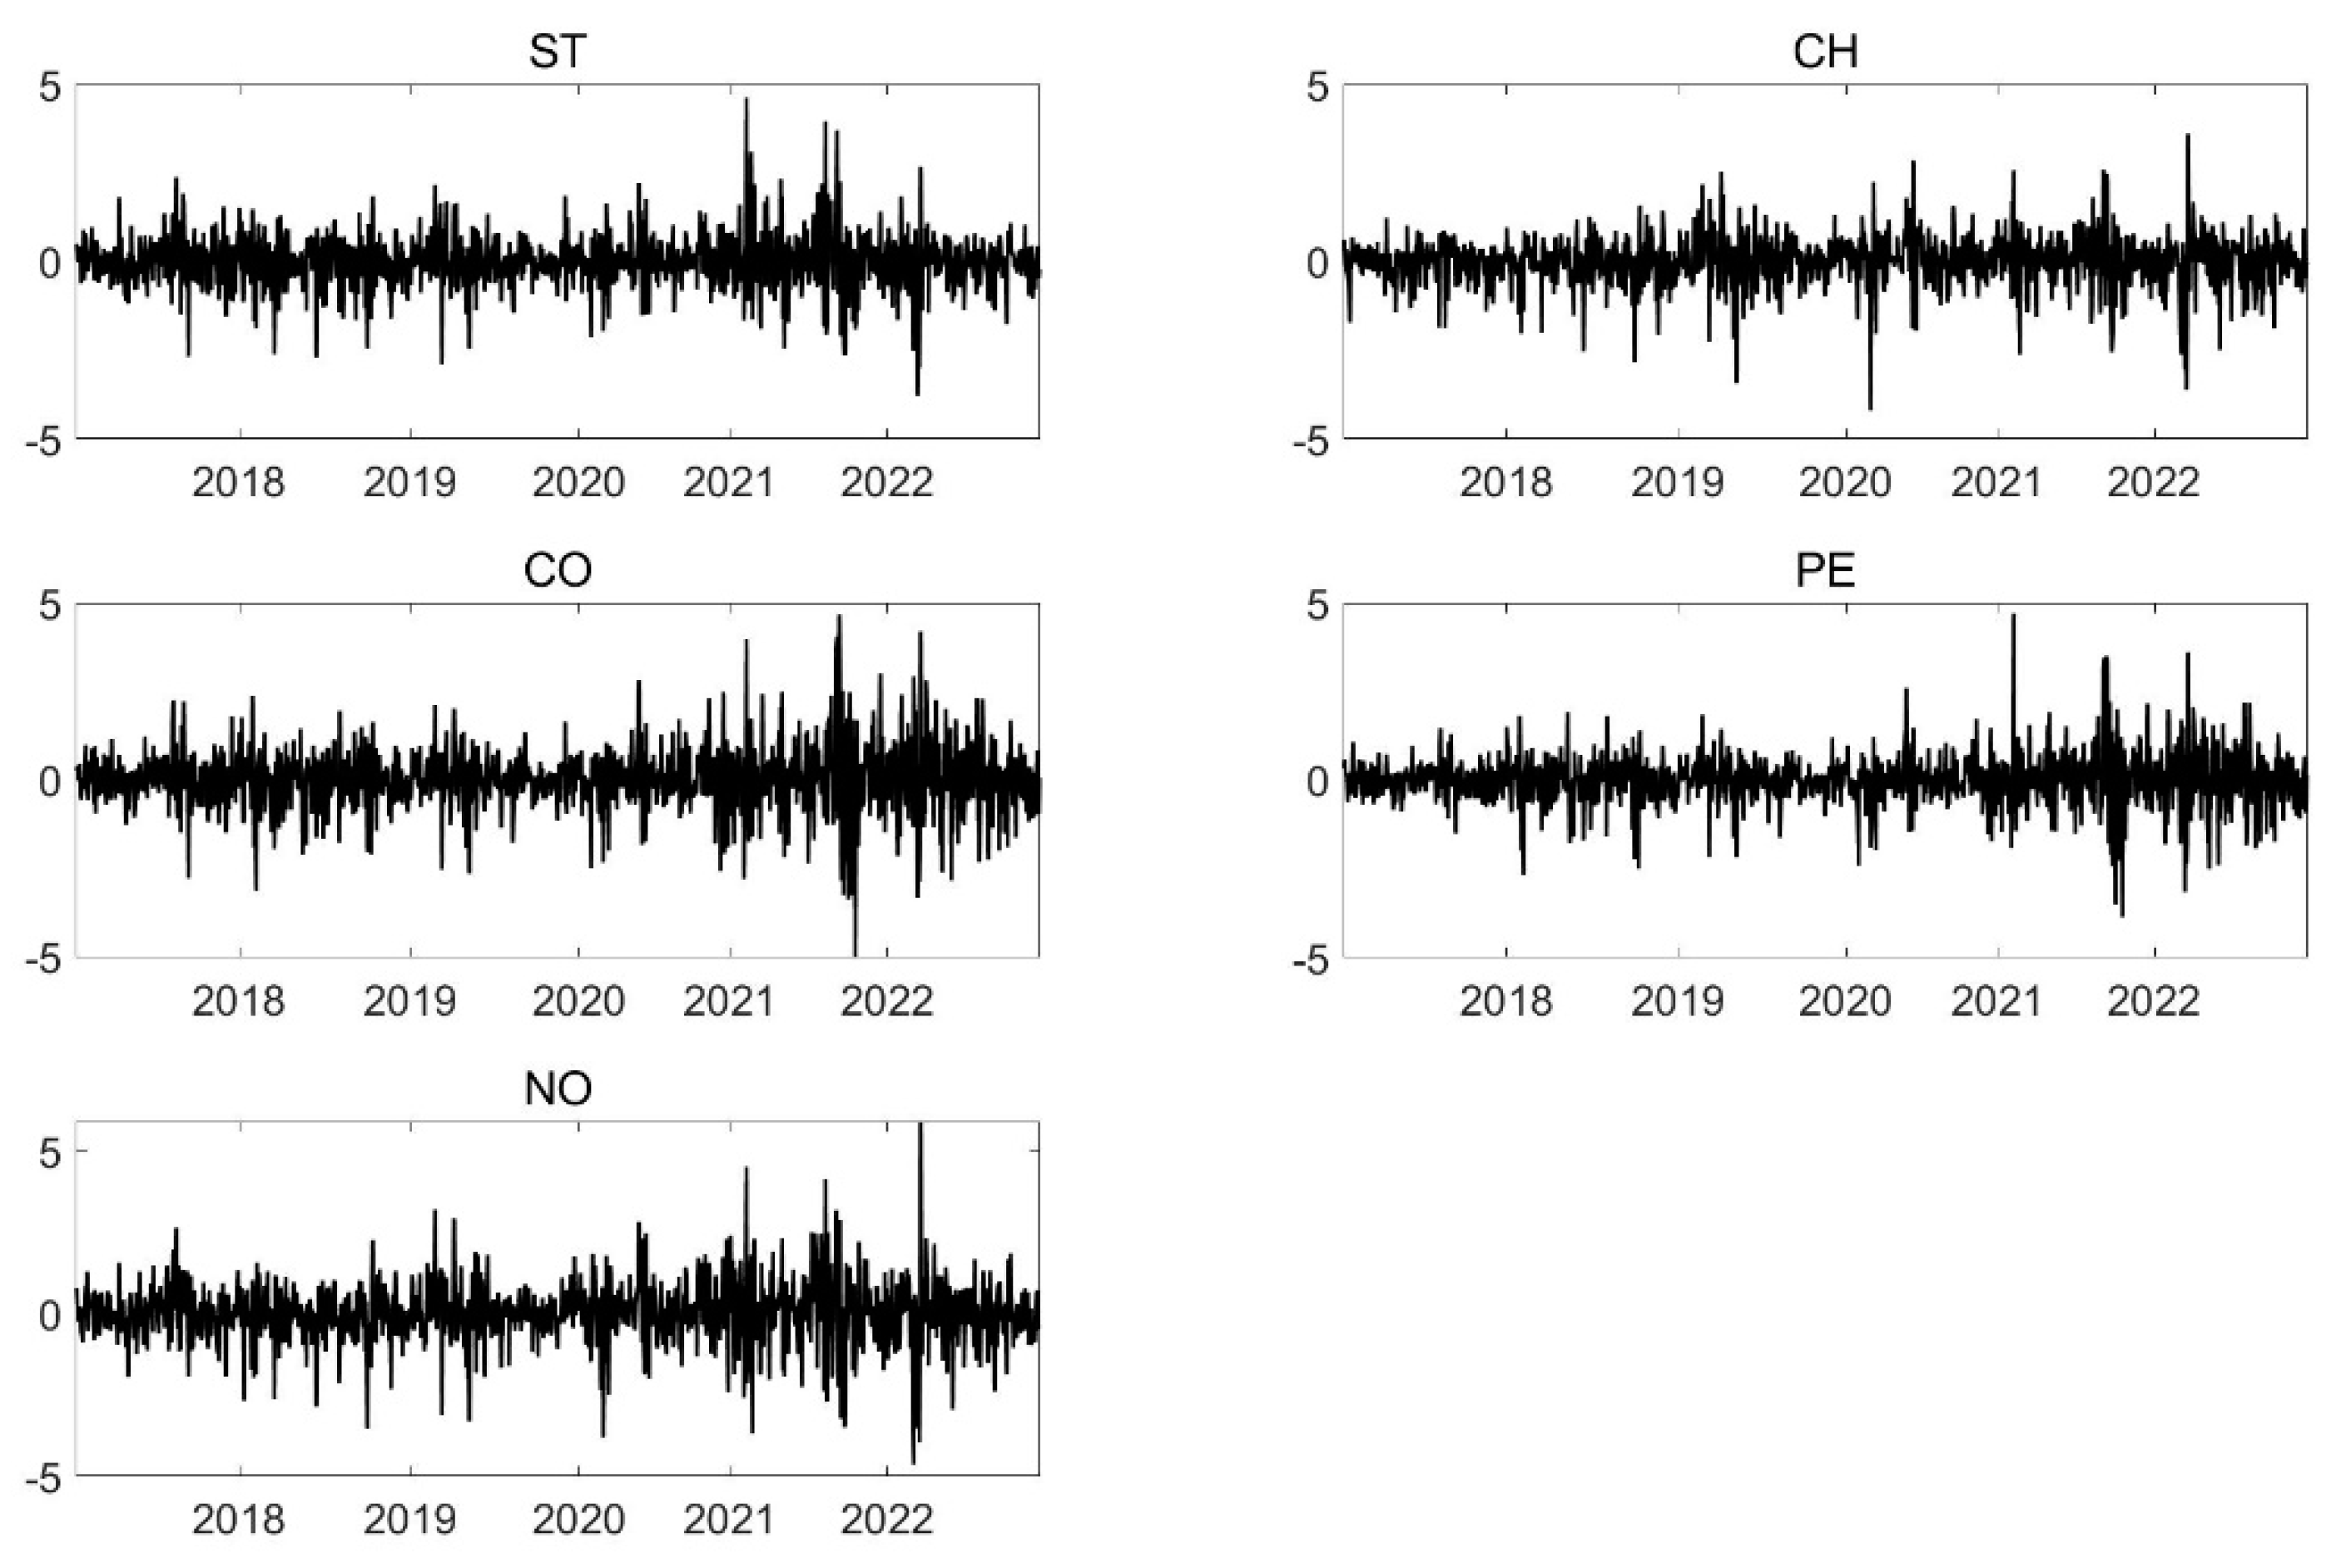
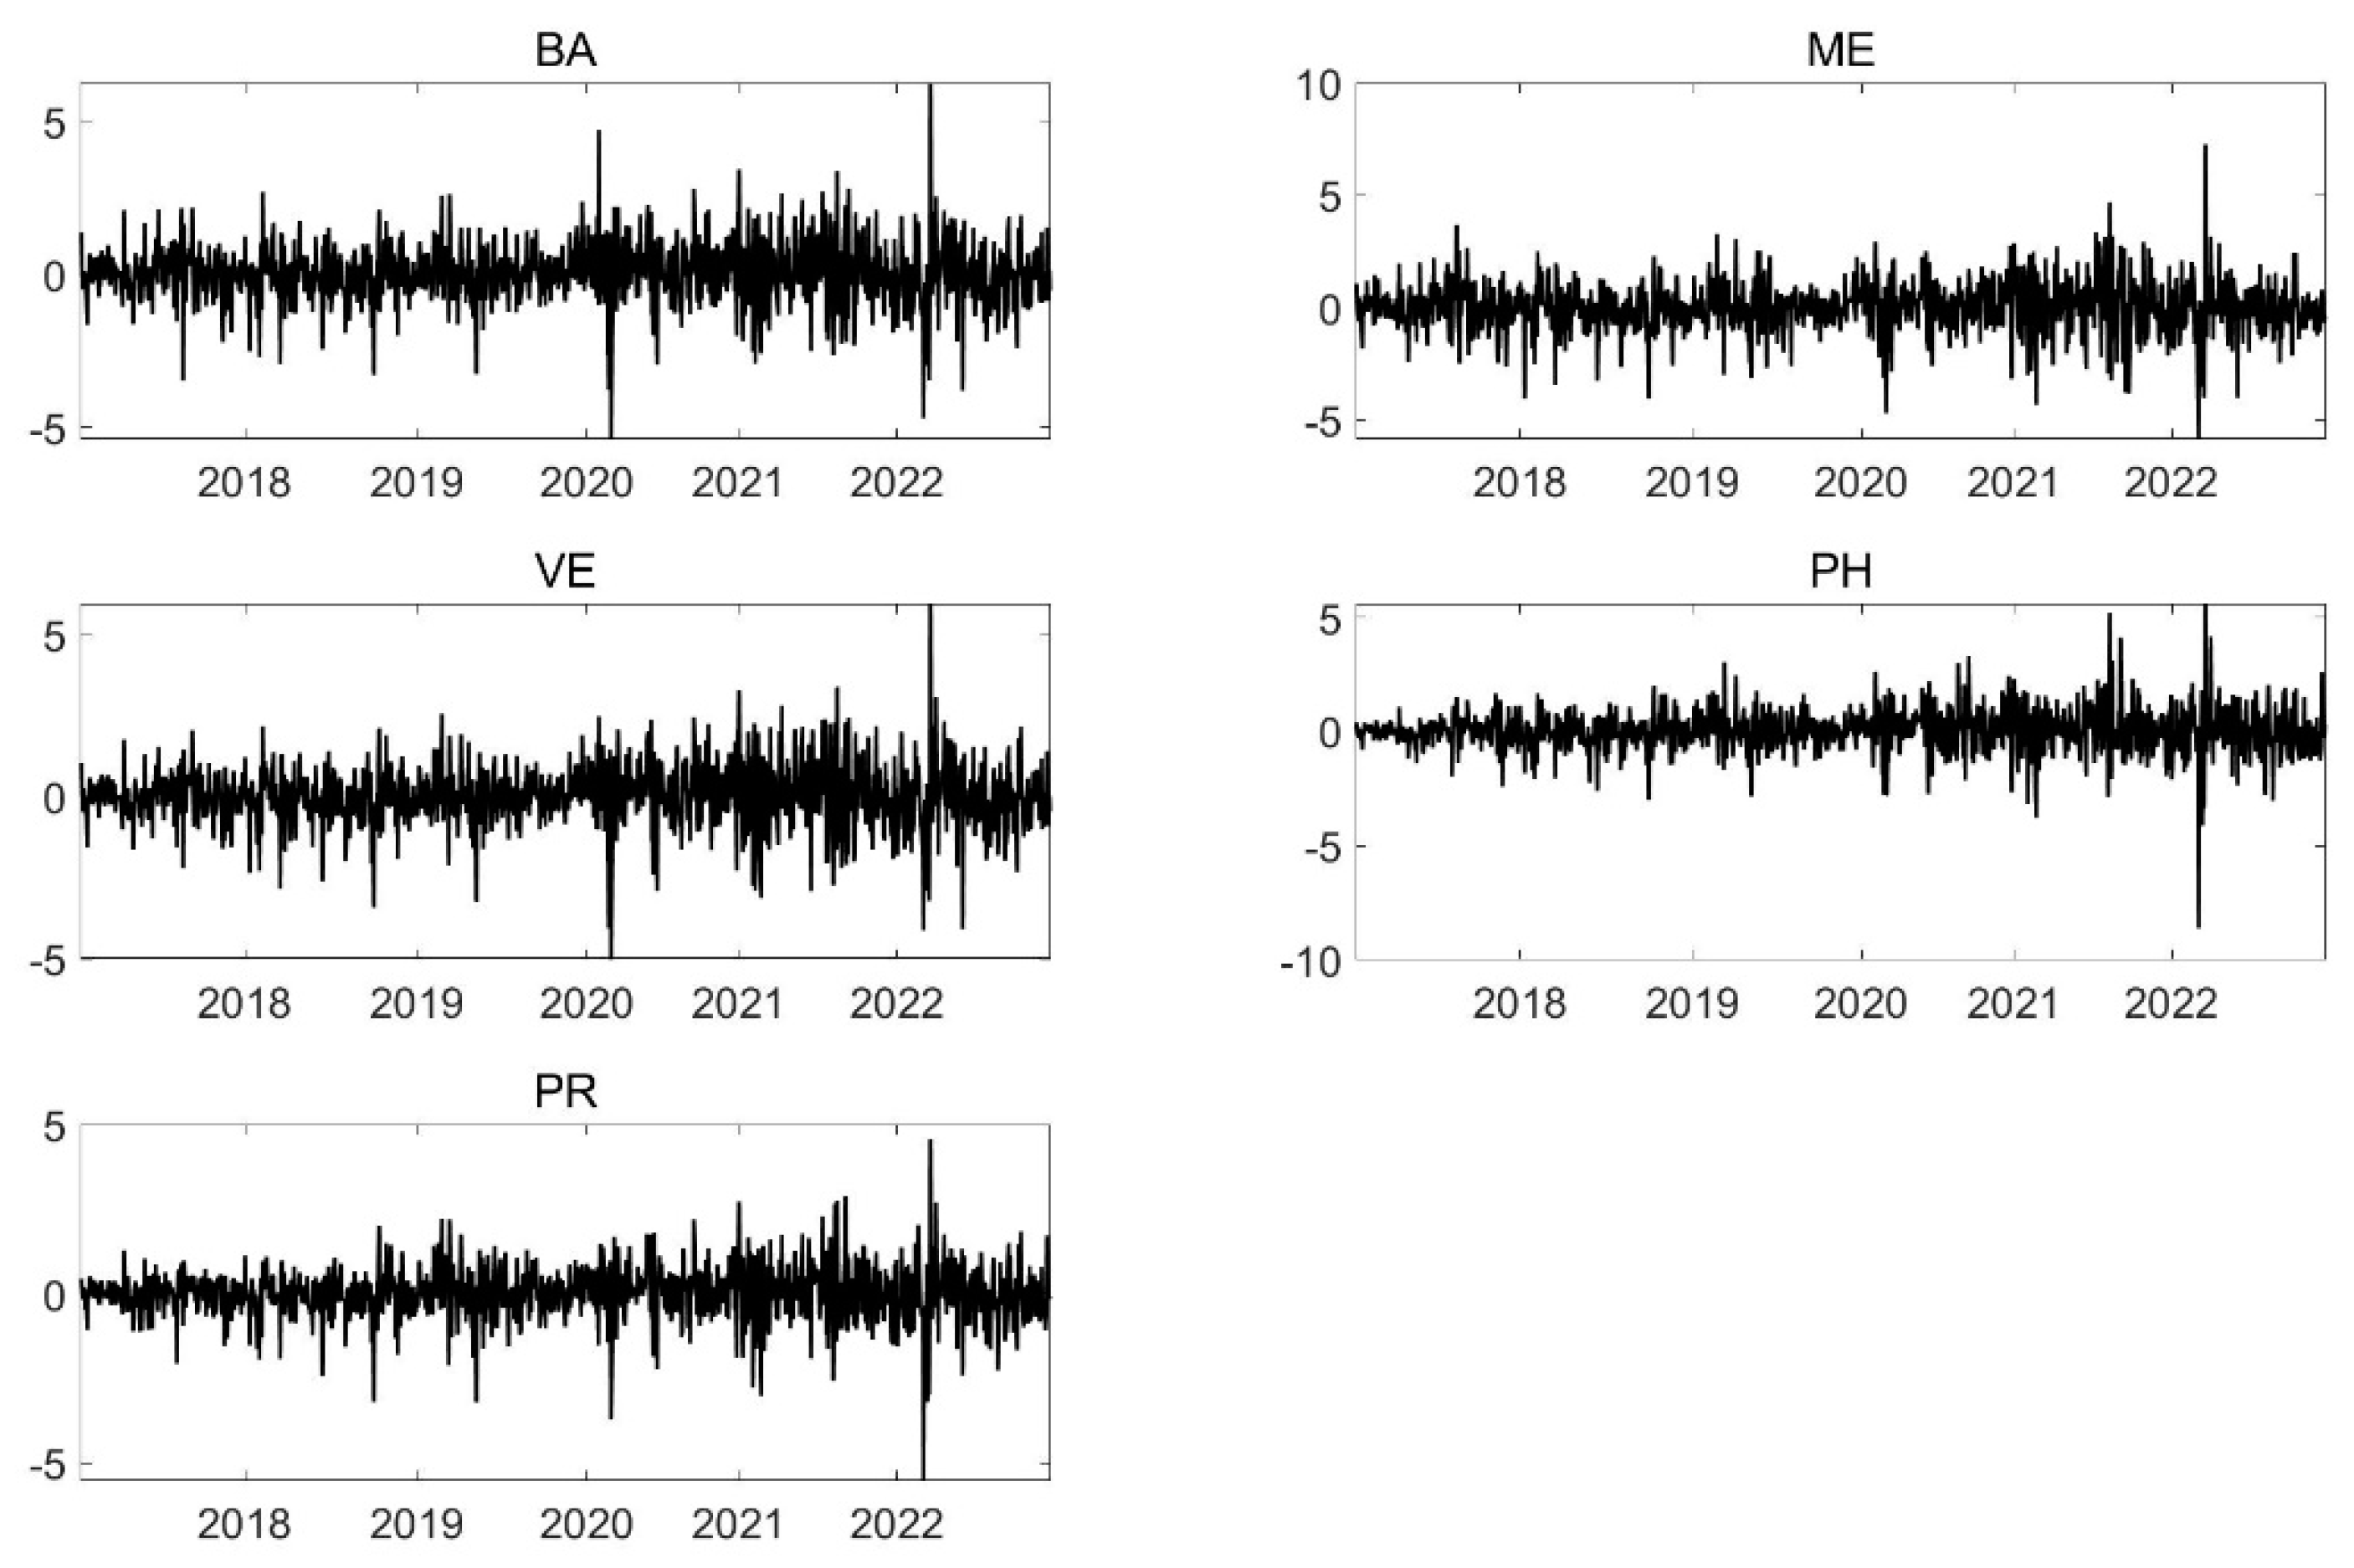
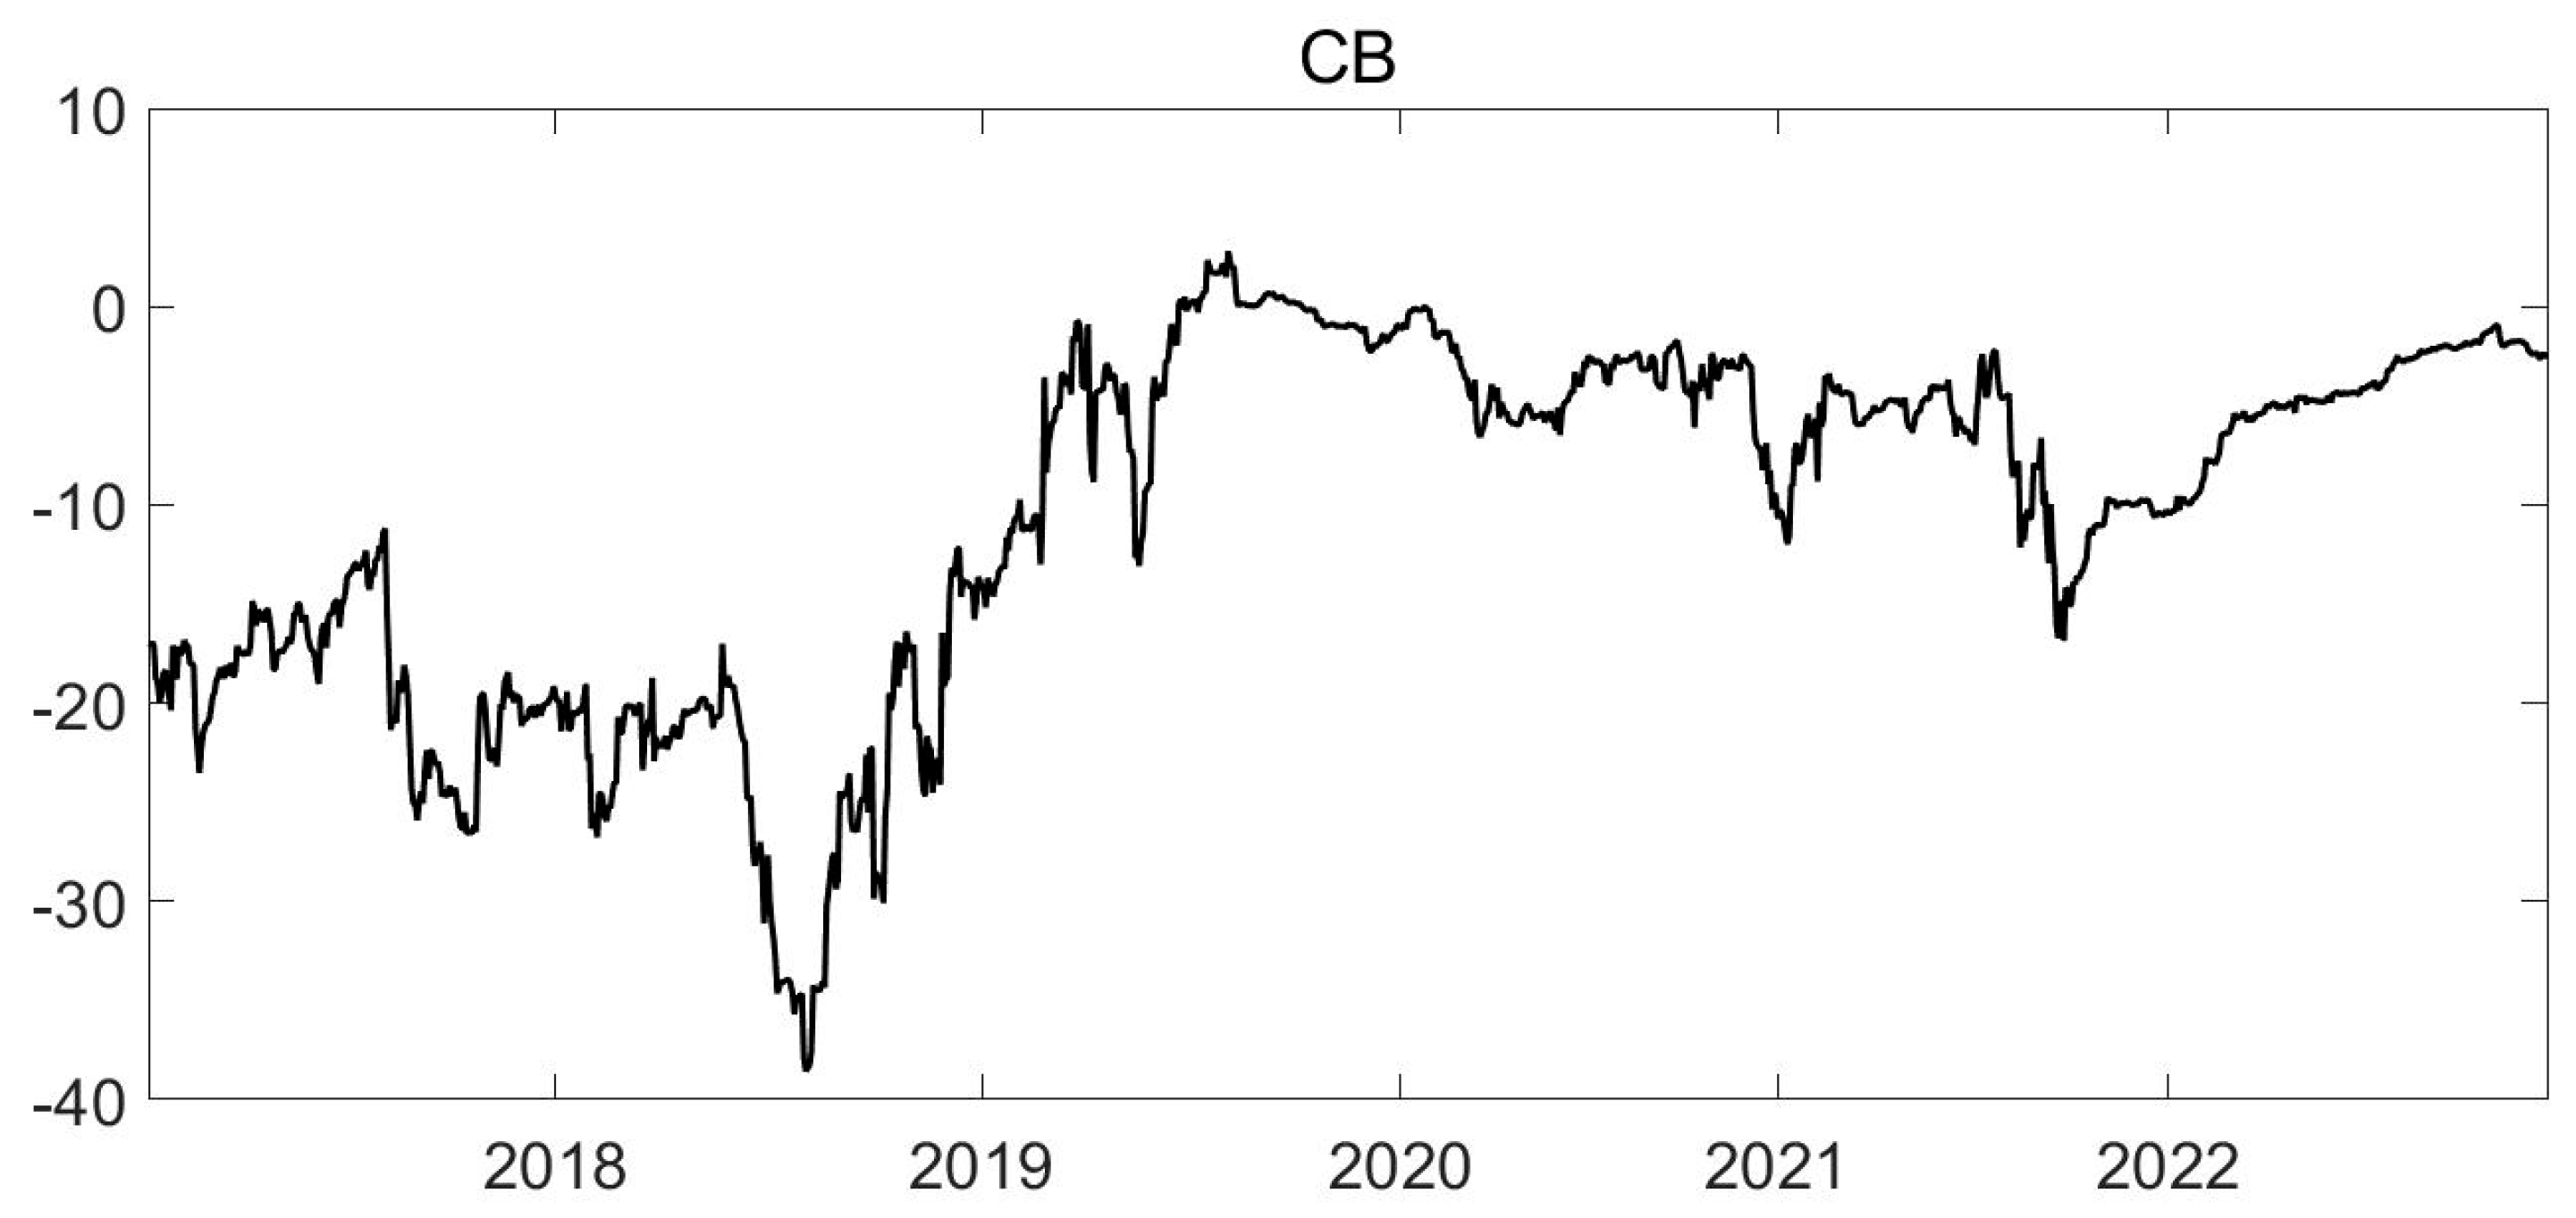
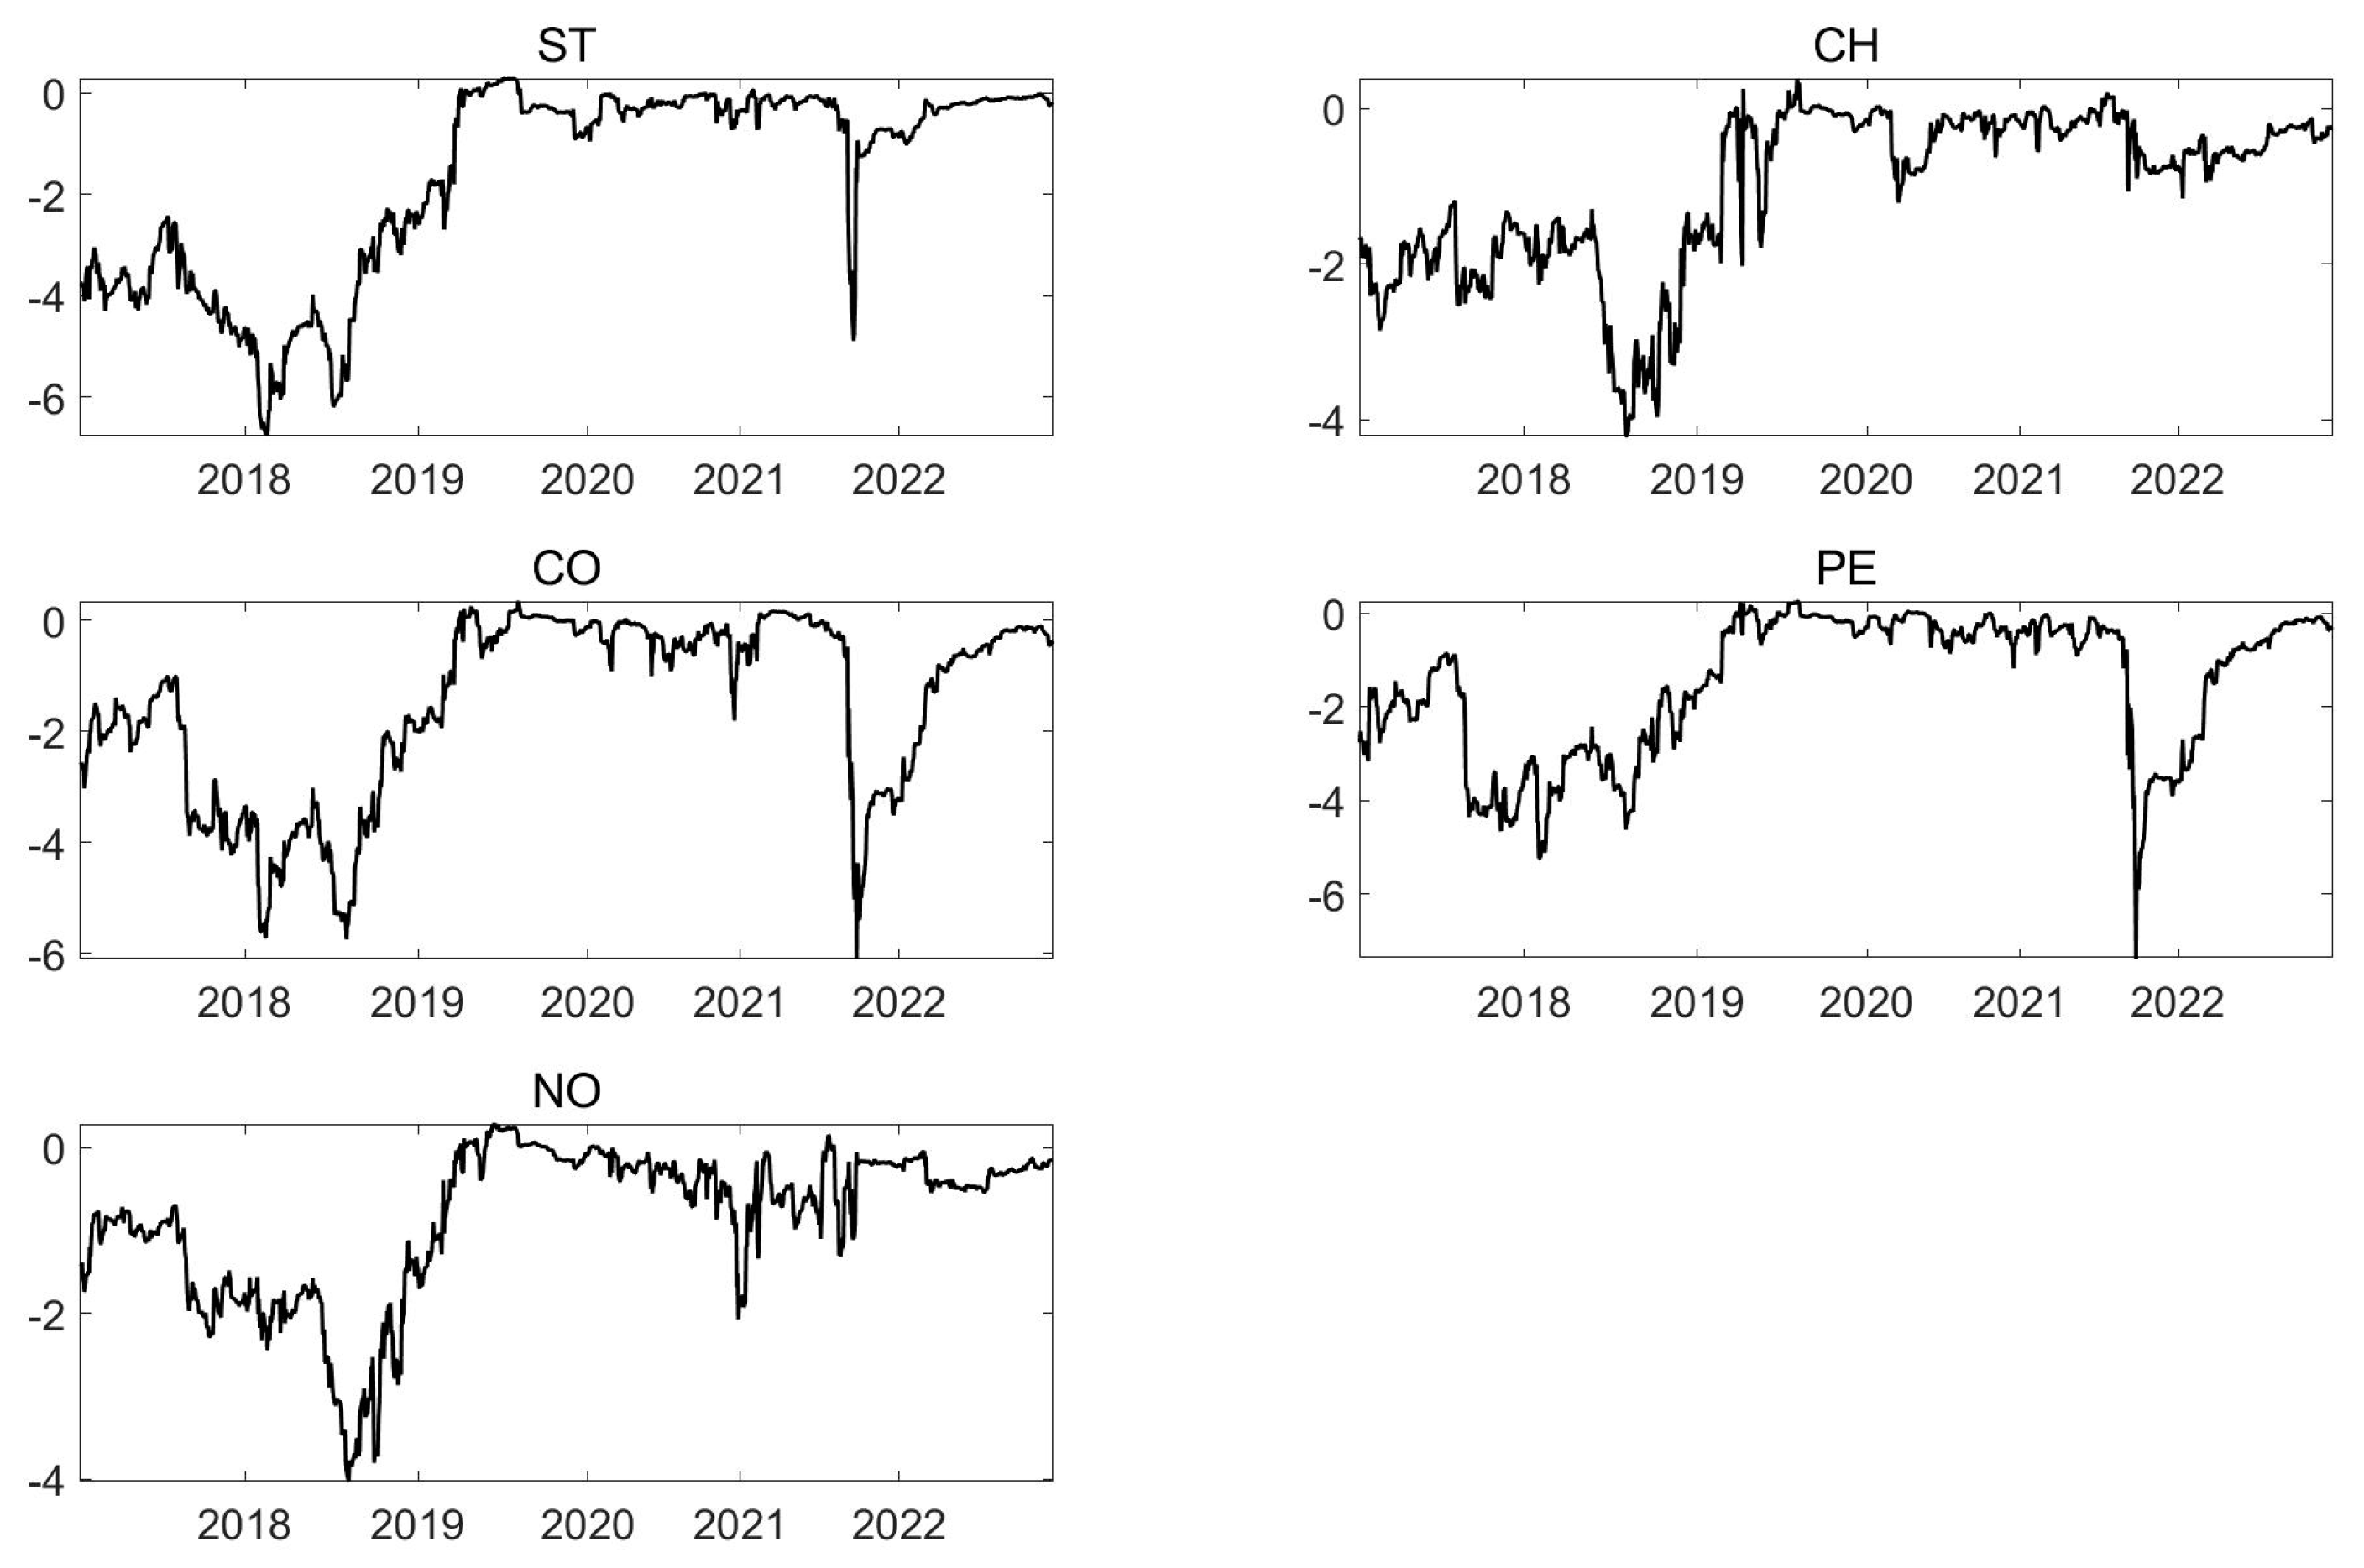
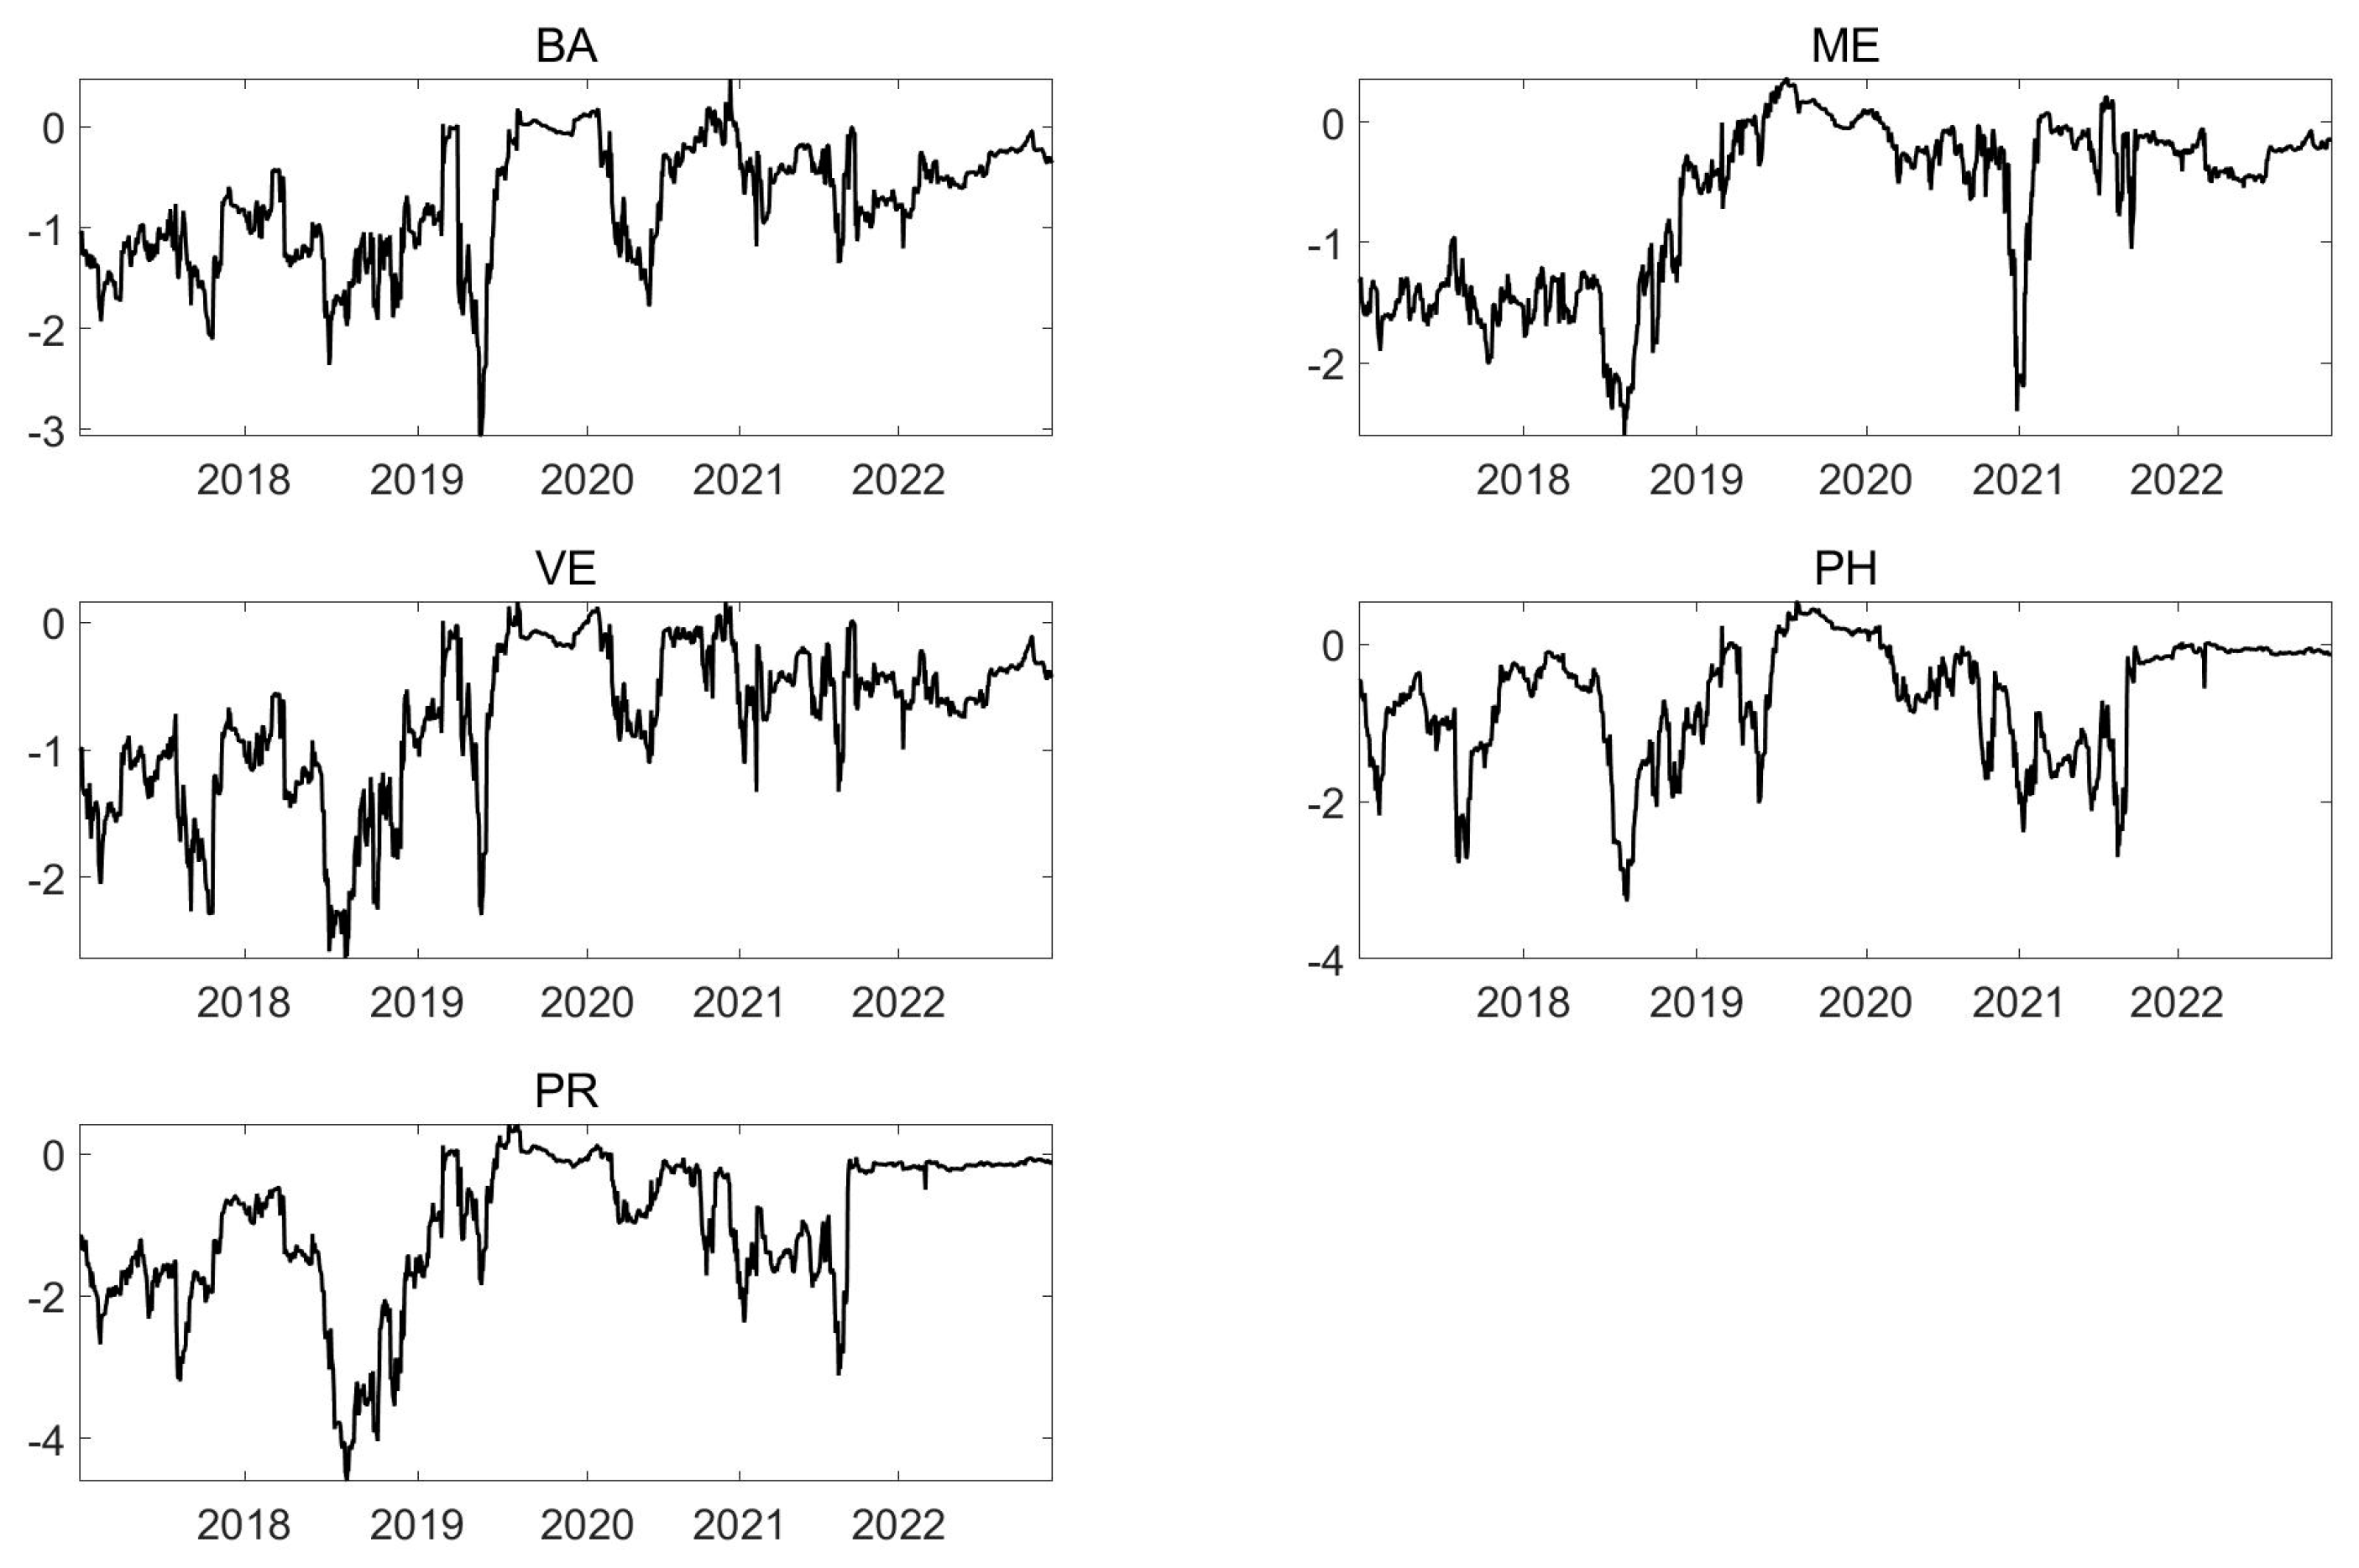
Figure 1, Figure 2, Figure 3, Figure 4 and Figure 5 show the time series of prices and returns of the carbon market, traditional energy markets, and new energy markets. From Figure 1, it can be observed that the volatility of the carbon market’s rate of return is relatively small, remaining around 0 to 30%. However, in the first half of 2019, the rate of return began to fluctuate dramatically, reaching a maximum of 85.7%. From the second half of 2019 to the first half of 2020, the volatility of the rate of return moderated. At the end of 2020, the volatility began to fluctuate frequently with large amplitudes, even exhibiting extreme values exceeding 100%. According to Figure 4, the price trends of the five stocks in the traditional energy industry from 2017 to 2022 were quite similar, exhibiting a “U” shape with a gradual decline followed by an increase before 2022. Around 2022, a small peak can be observed for all stocks. From Figure 5, it can be seen that the new energy industry, like the traditional energy industry, initially displayed a “U” shape. However, around 2022, a noticeable trough emerged for the new energy industry. While the rates of return for the new and traditional energy industries generally exhibited similar trends, this pattern became less apparent in 2021 and 2022, with larger fluctuations in the rates of return for each market, potentially due to severe external shocks to the overall environment.
According to the descriptive statistics in Table 1, it is evident that the mean and variance of the carbon market are significantly higher compared to other markets, indicating greater price uncertainty in the carbon market. This suggests that external influences would have a more pronounced impact. Moreover, the maximum and minimum returns of the carbon market exceeded 100%, occurring in September 2021. The occurrence of extreme values in September may be attributed to the report issued by the State Council on September 5, highlighting significant achievements in carbon reduction efforts, which boosted market participants’ optimistic forecasts for carbon market trading. This led to a short-term surge in market activity and rapid price escalation. However, such short-term stimuli do not constitute stable price trends, and two days later, carbon market trading volumes and prices reverted to previous levels. The skewness of each sequence in the descriptive statistics is non-zero, and the JB statistic results indicate a rejection of the null hypothesis at the 1% significance level for each market’s return sequence, suggesting that the selected sample data do not follow a normal distribution but exhibit characteristics of peakedness and heavy tails. The Augmented Dickey–Fuller (ADF) test results for each data series demonstrate stationarity at the 1% confidence level, indicating the feasibility of constructing a DY overflow index model.
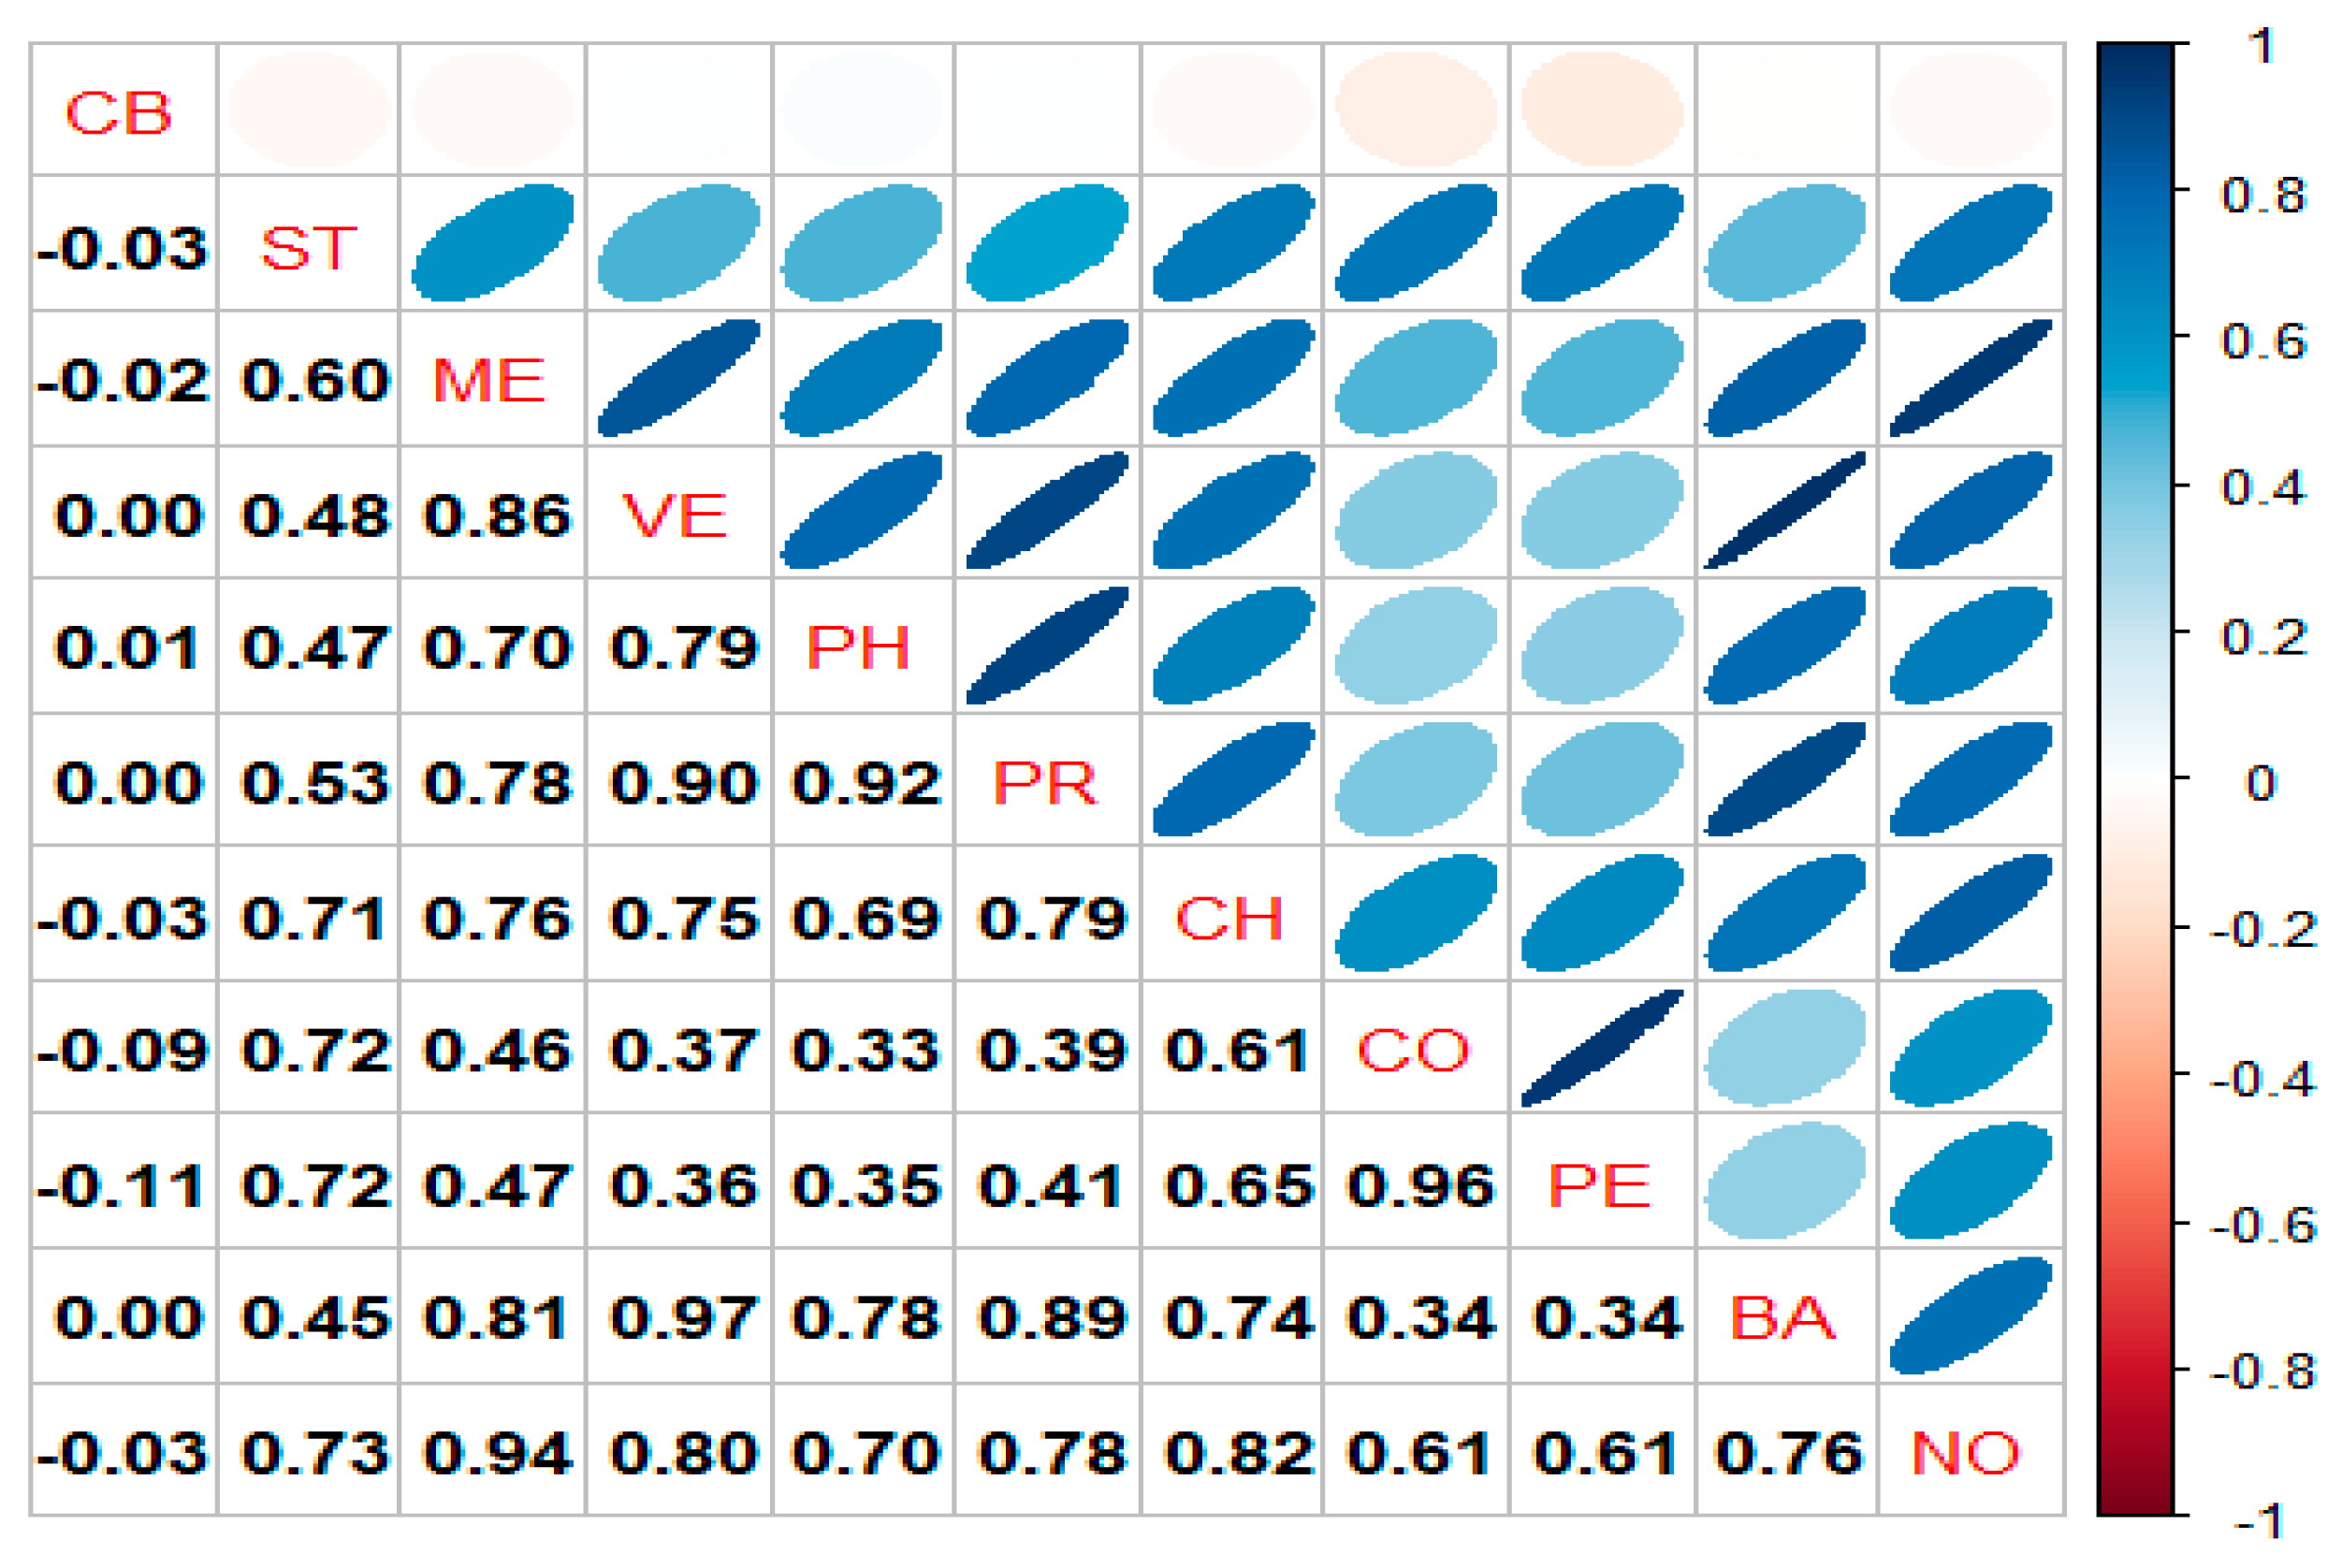
Figure 6 depicts the correlation coefficients among various markets, revealing no correlation between carbon market returns and those of other markets. This suggests that carbon market returns can be analyzed as an independent time series for subsequent analysis.

5. Empirical Analysis

In this section, we employ the DY model to examine the static spillover effects among the data. The specific numerical values obtained from the static spillover effects are used to investigate the magnitude and direction of spillover effects between markets. Subsequently, considering the temporal aspect, a dynamic rolling window technique is utilized to study the total spillover index and net spillover index among markets from 2017 to 2022 over five years. The net spillover index is further divided into two components: spillovers from the carbon market to other markets and spillovers from other markets to the carbon market.

5.1. Static Spillover Index

Firstly, we estimate directional spillover effects among a total of 11 markets, including the carbon market, over the entire time window from January 2017 to December 2022. Since the model’s operation and computation utilize the entire dataset, the results reflect the average level over the entire time window and do not indicate the nonlinear dynamic characteristics of spillover effects over time. Therefore, this section of the study focuses on the analysis of static spillover effects.
Table 2 presents the results of static spillover analysis for each dataset, where each row represents the extent to which the price fluctuations of a particular market (FROM) influence other markets, and each column represents the extent to which the price fluctuations of a particular market influence other markets (TO). The net spillover effect of one market on another is obtained by subtracting the influence received from the influence exerted. From Table 2, it can be observed that the carbon market is significantly influenced by its fluctuations, accounting for 84.58% of the total influence. Additionally, the carbon market exhibits relatively evenly distributed influences on other markets. The price spillover effects between the carbon market and other stock markets are found to be bidirectional and asymmetric. Furthermore, the net values for the carbon market, steel market, photovoltaic industry, coal market, and petroleum market are negative, indicating that these markets are net recipients of price fluctuations, while non-ferrous metals, new energy metals, new energy vehicles, the environmental protection industry, the chemical industry, and the new energy battery industry act as net sources of price fluctuations. Further analysis reveals that the carbon market is significantly influenced by traditional energy industries such as coal and petroleum, followed by photovoltaics and new energy power batteries. This is attributed to the rapid development of new clean energy-related industries such as photovoltaic power generation and power batteries, which, to some extent, weaken the demand for fossil fuels in the market, thereby reducing the demand for carbon emission quotas in the market and ultimately affecting the trading prices of carbon. However, the stability, convenience, and availability of new energy sources still have a long way to go in their development process. Currently, traditional energy sources remain predominant, exerting the greatest influence on the carbon market. Additionally, the development of the carbon market is still incomplete, and its financial attributes and economic value need to be enhanced. Hence, its overall spillover effect on stock markets is not particularly significant.

5.2. Dynamic Spillover Index

Due to the limitation of static spillover indices in capturing the evolving nature of spillover effects over time, this study employs a combination of the rolling window method and the DY model. A rolling window of 100 days is selected to investigate the time-varying spillover effects among different markets.

5.2.1. Total Spillover

As depicted in Figure 7, the overall spillover index has remained between 75% and 90%, indicating a relatively high level of correlation among markets. Moreover, the total spillover index exhibits significant volatility and uncertainty. It shows a notable trough in early 2018, followed by a gradual increase in spillover effects from 2018 to 2019, reaching a peak of nearly 90% in mid-2019. Subsequently, there was a continuous decline until 2022, with three subsequent troughs observed after 2020. In early 2018, amid the impact of the U.S.–China trade war, the United States continuously increased tariffs on Chinese imports and restricted Chinese businesses’ investments and operations in the U.S. This led to a continuous depreciation of the Chinese yuan against the U.S. dollar, causing domestic stock markets traded in yuan to decline continuously. This situation further affected trading prices in the market, as well as the stock values of carbon and energy markets, resulting in a trough in the overall spillover index. From 2018 to 2019, while other markets tightened, national carbon market construction proceeded in an orderly fashion. Various aspects of carbon trading, such as legal foundations, institutional rules, and data management, were comprehensively promoted, leading to a significant increase in carbon trading prices and further strengthening the overall spillover effects, showing an upward trend. However, by the end of 2019 and the beginning of 2020, with the sudden onset of the pandemic, policies such as staying at home led to a reduction in people’s production and living activities, slowing down the national economy and causing market prices to stagnate, with the GDP falling by 6.8% year-on-year. Energy demand also decreased further, leading to a slow reduction in carbon emissions, a decrease in carbon quota demand in the carbon trading market, and the correlation between the carbon market and other markets. Consequently, until the end of 2022, the total spillover index exhibited a period of fluctuating decline.

5.2.2. Directional Spillover and Net Spillover

From the following graphs, it can be observed that each market’s directional spillover index exhibits significant volatility and uncertainty, being heavily influenced by external policies and extreme events. Furthermore, the development of China’s carbon market is still incomplete, with the limited impact of enterprise carbon market emissions reduction on the enterprises themselves, resulting in relatively weaker spillover effects between the carbon market and the stock market, especially within low-carbon emitting industries. However, investor behavior, market efficiency, and other factors may facilitate price impact and information transmission among markets.
Figure 8 depicts the net spillover effect of the carbon market, which is derived by subtracting the spillover effects received by the carbon market from the spillover effects exerted by the carbon market on other markets. The line graph illustrates how the carbon market primarily acts as a net receiver of spillover effects most of the time, as indicated by its negative net spillover. In 2018, there was a V-shaped change in spillover effects, followed by a continuous increase in spillover effects, with a brief period in mid-2019 where the carbon market briefly acted as a net spillover emitter for several months. Subsequently, the change in spillover effects has been gradual, with two troughs observed, while maintaining an upward trend until 2022.
From Figure 9 and Figure 10, it can be observed that the net spillover effects of the carbon market on both traditional energy industries and new energy industries generally exhibit similar trends, albeit with more pronounced fluctuations in the case of the new energy sector. In 2019, the spillover effects of the carbon market on the traditional energy sector showed a steady upward trend. Collaborative efforts between the Shanghai Stock Exchange and the Shanghai Environment and Energy Exchange, innovative futures exchanges focusing on carbon emissions in Guangzhou, and the establishment of the first low-carbon development research center in the power industry in Jiangxi contributed to the development of various carbon financial products. These innovations increased the impact of carbon emissions on other industries, with fluctuations in carbon emission prices transmitting more significantly to other sectors through avenues such as carbon finance and stock markets, especially in high-carbon emitting sectors like traditional energy, thereby leading to a continuous rise in the net spillover effects of the carbon market. In 2020, the net spillover effects of the carbon market on the energy sector remained stable, with both the new energy and traditional energy industries hovering around the 0 level. Despite the sluggish national economic environment due to the onset of the COVID-19 pandemic, gradual progress in initiatives such as the Belt and Road Initiative and the internationalization of the Renminbi contributed to a stable economic environment in China. This steady progress in the domestic economy ultimately stabilized the mutual price impact between the carbon market and the stock market. The spillover effects of the carbon market on four markets, steel, coal, oil and natural gas, and new energy metals experienced a decline in October 2021. For industries such as steel and coal, as the weather turned colder, pollution dispersion slowed down, and environmental production restrictions expanded their impact on the production side; coupled with continued policy implementations such as production reduction and energy consumption control, market supply remained constrained while raw material prices trended upward overall, leading to a rise in enterprise costs. Stock prices, on the other hand, experienced consecutive declines influenced by various factors, leading to decreased trading activity in the carbon market due to overall industry profit declines, resulting in a discontinuous decline in the spillover effects received.
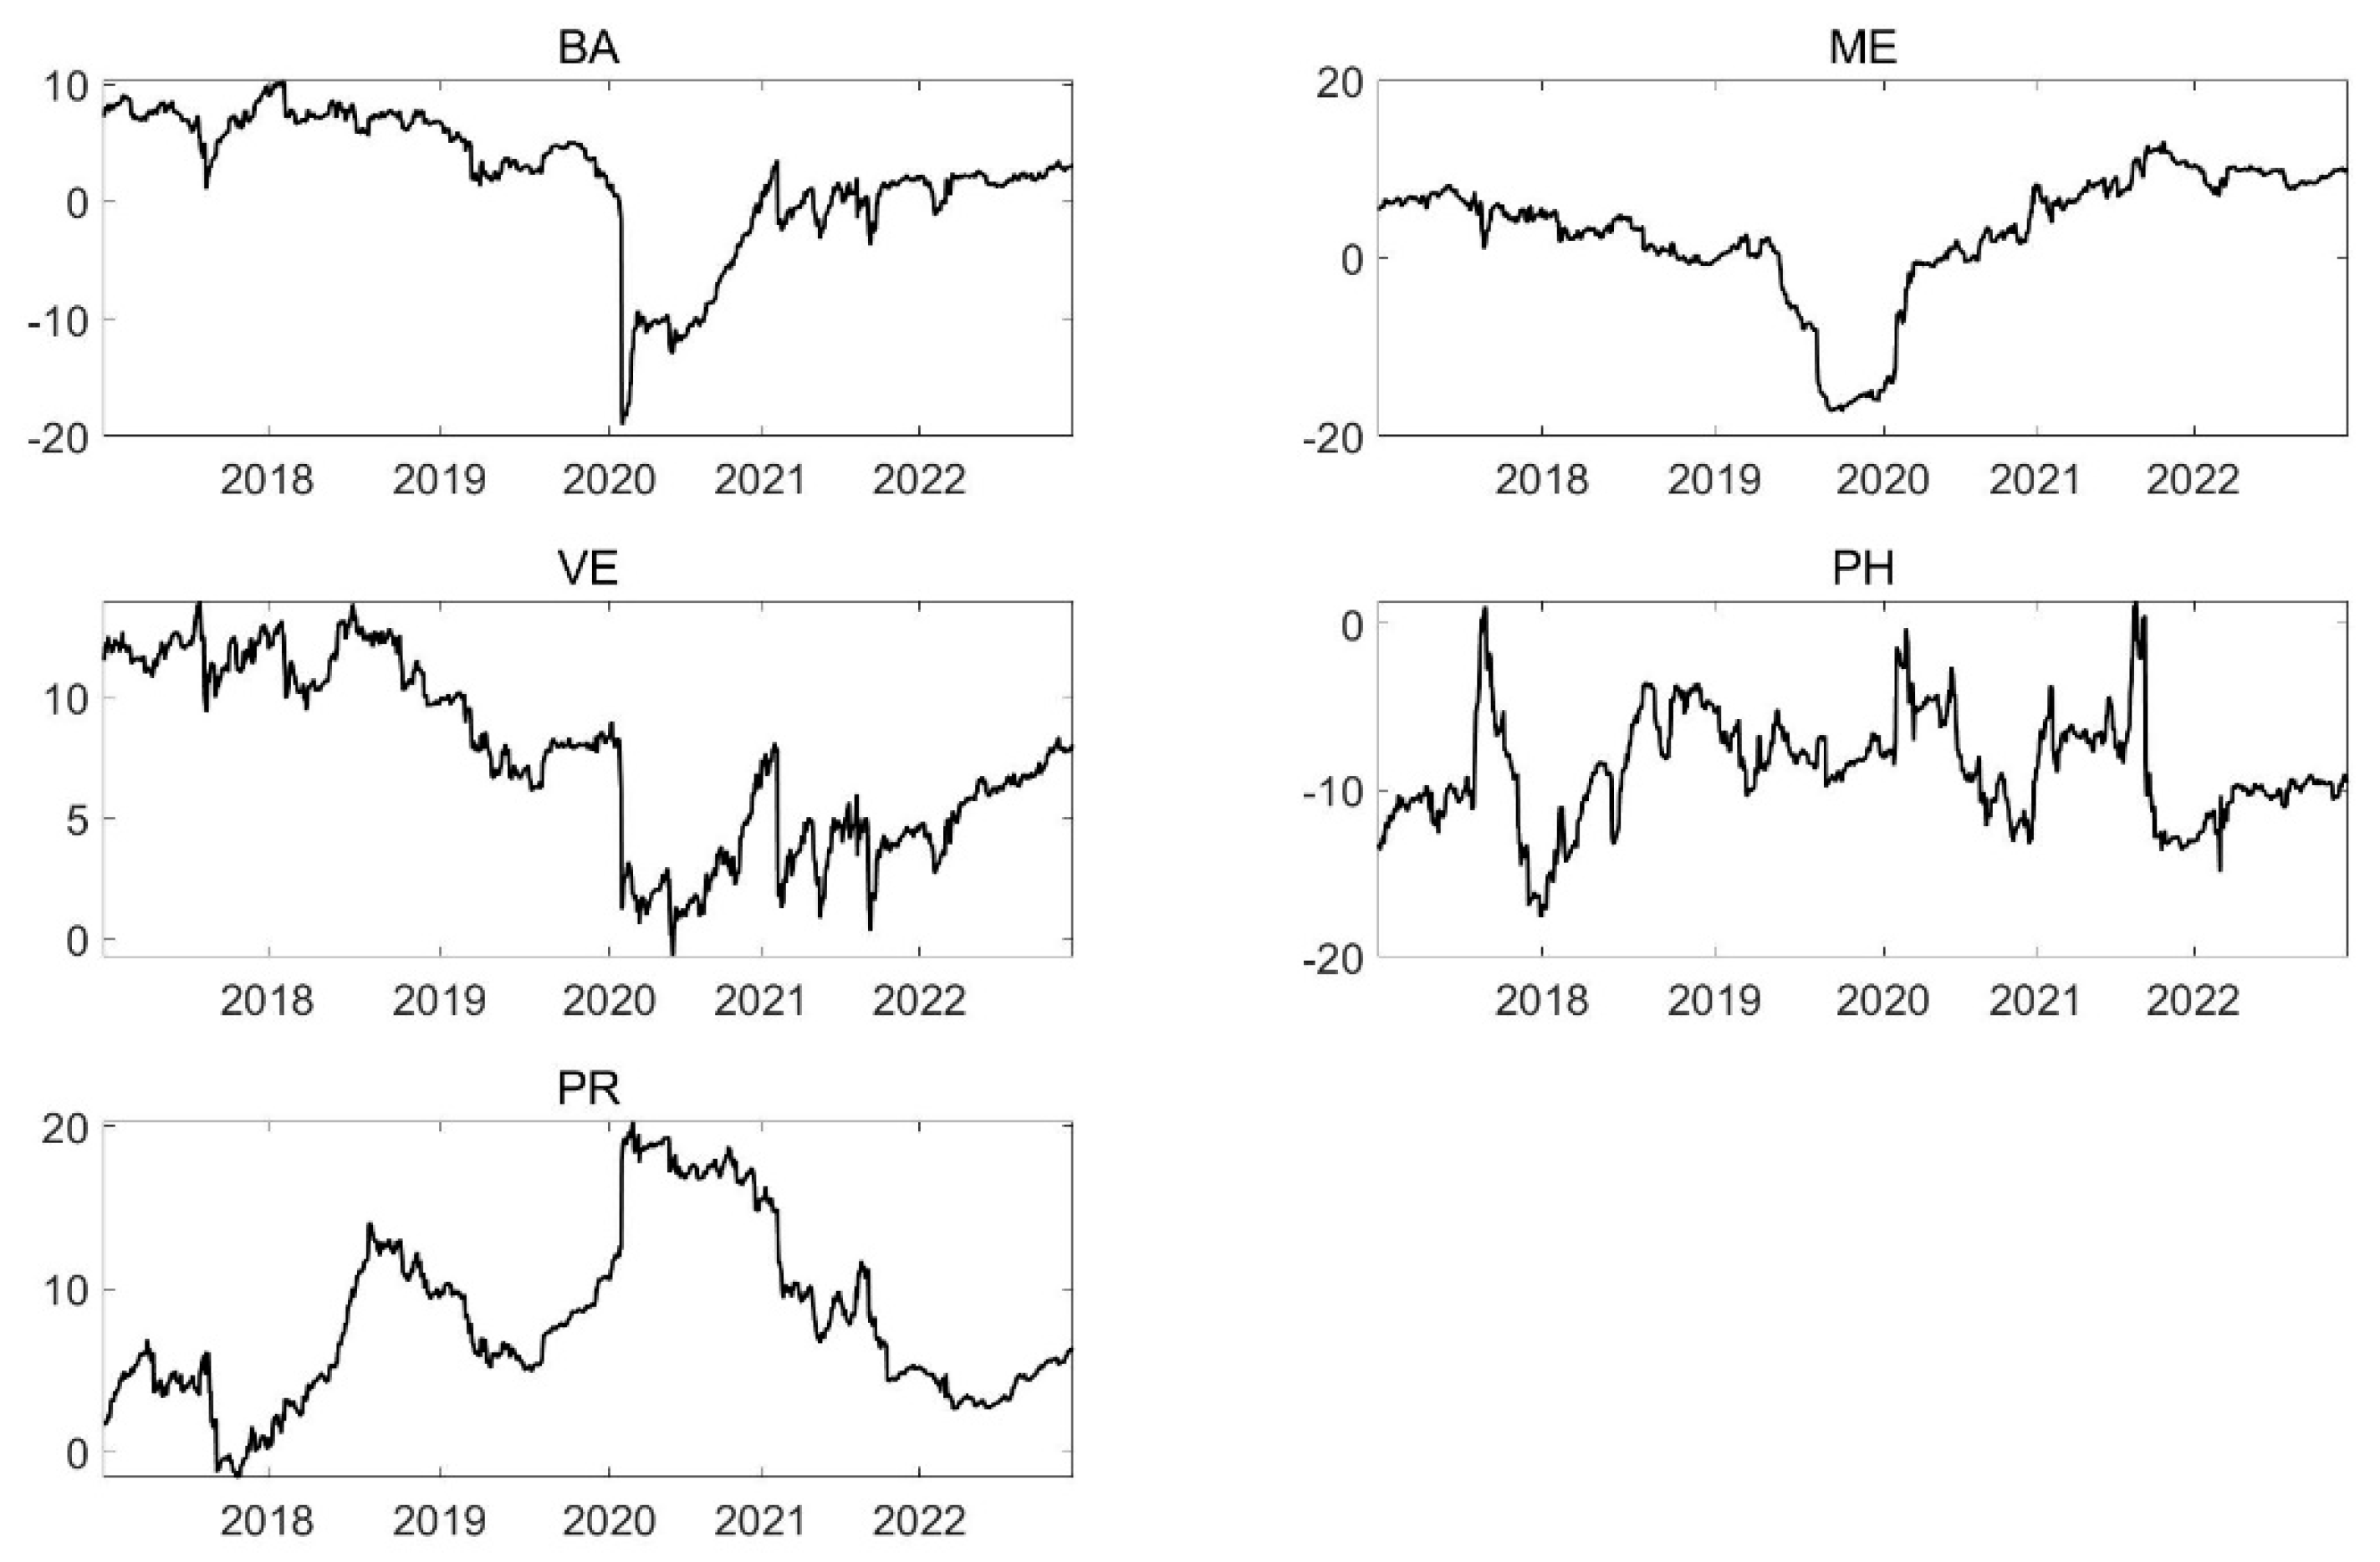
Figure 11 and Figure 12 depict the net spillover effect of the traditional energy market and the new energy market, separately. Figure 12 illustrates that the net spillover effects of non-ferrous metals, new energy metals, and new energy power batteries exhibited an evident “V-shaped” trend in 2020. The non-ferrous metals industry serves as a spillover emitter, holding a significant share in carbon emissions. In 2020, China’s non-ferrous metals industry emitted approximately 660 million tons of carbon dioxide, accounting for 4.7% of the national total carbon emissions. Notably, the aluminum industry contributed around 550 million tons of carbon dioxide emissions, representing 83.3% of the non-ferrous metal industry. However, with the outbreak of the pandemic at the end of 2019, international and domestic markets witnessed a rapid decline in non-ferrous metal prices, inducing panic among investors.
Subsequently, metals like copper and zinc experienced significant price fluctuations. However, in the following months, the market gradually digested the bearish sentiment. Prices of major non-ferrous metals stabilized and rebounded between 7 and 10 February, indicating the market’s digestion of various negative factors induced by the pandemic. As the pandemic was gradually brought under control and the situation improved, the prices of major metals began a slow recovery. The fluctuations in spillover effects synchronized with price fluctuations, exhibiting a trend of decline followed by an increase.
New energy metals, such as lithium, platinum, and rare earth, contribute to reducing enterprise carbon emissions and energy consumption. However, under the influence of the pandemic, limitations in existing mining technologies combined with the implementation of dual carbon policies increased the impact of carbon emission quotas on new energy metals. Consequently, the spillover effects of new energy metals experienced a decline around 2020, temporarily becoming net recipients of spillover effects. New energy vehicles (VE) have consistently been net spillover emitters as an emerging industry. Globally, the transportation sector accounts for 26% of total carbon emissions, making it the third-largest contributor to China’s carbon emissions, with an 8% share. Therefore, reducing carbon emissions in the transportation sector is crucial for energy conservation and emission reduction efforts. New energy vehicles, powered by new power batteries, effectively reduce carbon dioxide emissions. The performance of power batteries, a core component of new energy vehicles, significantly influences market acceptance, while the rapid increase in new energy vehicle sales injects momentum into the development of the power battery industry. However, in 2020, the pandemic affected the new energy vehicle industry’s production capacity due to the suspension of transportation activities. Although this did not impact new energy vehicle sales, factory shutdowns and decreased demand affected the utilization of battery materials. Consequently, the spillover effects of the battery industry experienced a precipitous decline in 2020, while the spillover effects of related automotive industries only saw minor changes.
In the new energy industry chain, China leads in both photovoltaics and new energy vehicles. In recent years, China’s photovoltaic industry has continued to advance. Facing the direct impacts of climate change, such as frequent extreme weather events, both the government and the public have a stronger desire to reduce carbon emissions. Therefore, solar energy is seen as an effective means to address global climate change. Photovoltaic power generation, in particular, is preferred over traditional oil and coal-fired power generation. As solar electricity prices decrease, it becomes more advantageous relative to traditional energy sources. Several large energy companies in China have entered the photovoltaic industry, attracting increasing capital investment. This has led to an increase in spillover effects from the photovoltaic industry after 2020. The chemical industry, new energy metals, environmental protection industry, and new energy power battery industry all experienced extreme growth in 2020.
Although facing the impact of the pandemic, some industries exhibited an increasing trend in spillover effects. Low-carbon-emitting industries like environmental protection benefit from reduced overall carbon emissions during the pandemic. Environmental industries, such as biogas and waste incineration for power generation, experience increased profits during periods of decreased carbon emissions. The chemical industry, as a cornerstone of traditional energy industries, has a significant impact on manufacturing and defense industries and maintains high stability in the face of pandemic impacts. Moreover, increased production is necessary to maintain the normal standard of living during crises, leading to an increase in its net spillover effects around 2020. In the face of the same crisis, the overall market fluctuations increase their intrinsic correlation, increasing spillover effects for these industries.
In 2021, both traditional energy and new energy industries experienced significant fluctuations in net spillover effects. This was due to the emergence of a global energy crisis caused by the stark contrast between energy supply and demand worldwide. In China, there were intermittent supply shortages in coal-fired power generation, leading to record-high prices for traditional energy sources such as coal and steel. The drastic changes in the energy market prompted domestic energy companies to adjust their demand and supply dynamics. The traditional energy sector, facing high prices due to limited supply, experienced reduced carbon emissions, thereby decreasing its spillover effects on the carbon market. Conversely, the new energy industry, which is an alternative to traditional energy sources, witnessed increasing influence on the carbon market due to favorable government policies supporting energy transition. However, these fluctuations were not long-lasting. Benefiting from policies ensuring stable energy supply by the Central Committee and the State Council, China’s energy economy remained robust throughout 2021. After a period of strong price increases, energy market prices gradually stabilized, with the traditional energy sector continuing to play a significant role in ensuring a stable energy supply.
The carbon market emerged as the largest net recipient, while the non-ferrous metals market emerged as the largest net emitter. The non-ferrous metals industry, being one of China’s four major high-energy-consuming industries, heavily relies on resources such as steel and coal for production due to limitations in smelting technology. Consequently, its spillover effects on the steel industry are pronounced. As a high-carbon emitting industry, the non-ferrous metals industry must optimize its industrial layout, invest in new energy, and utilize carbon derivative products as risk-hedging tools to realize a low-carbon, green, and environmentally friendly production approach.

5.2.3. The Robustness of the Spillover Index

In this part, we show a robustness test on the empirical results conducted by varying the forecasting horizon. The total spillover index plots for forecasting horizons (H) of 10 periods and 15 periods were computed, as depicted in Figure 13. It can be observed that the spillover effect plot for a forecasting horizon of 15 days exhibits the same results as the one for a forecasting horizon of 10 days, indicating that increasing the forecasting horizon does not impact the estimation results.

6. Implications and Conclusions

The study selected data on indicators from the carbon market and stock markets related to industries such as coal, steel, chemicals, oil and natural gas, non-ferrous metals, photovoltaics, new energy vehicles, new energy power batteries, environmental protection, and new energy metals from 4 January 2017 to 31 December 2022 as research objects. From the perspective of price spillovers, the direction and intensity of spillovers between the carbon market and the stock markets of traditional energy and new energy industries were calculated. The conclusions can be drawn as follows.
On the one hand, from the perspective of the static spillover index, the overall information linkage between the carbon market and stock markets is strong, with significant trendiness in value spillovers. In terms of spillover direction, the carbon market is a net recipient, while in terms of intensity, different industries exhibit varying spillover performances, with asymmetry present. The traditional energy industry shows the highest price spillover to the carbon market. On the other hand, from the perspective of the time-varying index, during the enactment of relevant policies and macroeconomic fluctuations, such as the COVID-19 crisis at the end of 2019, the implementation of the National Carbon Emission Trading Management Measures in 2021, and the energy crisis in 2021, the spillover index between the carbon market and stock markets also fluctuated, with the carbon market price spillover index exhibiting significant volatility. Overall, during periods of price volatility in related stock markets, Chinese carbon markets experience significantly higher inflow effects from energy markets than during other periods. In summary, significant and time-varying spillover effects exist between China’s carbon market and stock markets.

7. Recommendation

To effectively prevent financial risks, achieve carbon peak requirements, actively promote green and low-carbon lifestyles, and further promote the development of the carbon market, the following suggestions are proposed. Firstly, from the perspective of policymakers, it is necessary to clarify the transmission mechanism between the carbon market and stock markets, adhere to the improvement of energy–economic policies, establish reasonable pricing for carbon quotas in traditional energy industries, actively increase the supply of products from the new energy industry, gradually transition to green economic development, and continuously optimize energy consumption structures. Secondly, from the perspective of investors, it is important to grasp the knowledge system of price spillover mechanisms between the carbon market and related markets, attach importance to the financial attributes of carbon emission trading, use different financial instruments, adjust asset allocation strategies in the face of fluctuations in domestic and foreign energy industry stock prices, and obtain maximum investment returns. Thirdly, from the perspective of the carbon market, it is essential to expand the coverage of industries and trading participants and enhance the activity of market participants. It is necessary to enrich carbon financial products, provide diversified trading methods and effective risk-hedging tools for market participants, and build the carbon market into a composite market with investment value and regulatory support for the green development of enterprises.

Author Contributions

Conceptualization, H.Z. and J.M.; methodology, M.Y., J.M. and Y.J.; Software, M.Y.; formal analysis, J.M., H.Z. and Y.J.; investigation, J.M., H.Z. and M.Y.; data curation, M.Y.; writing—original draft preparation, H.Z.; writing—review and editing, M.Y. and J.M.; project administration, Y.J.; funding acquisition, Y.J. All authors have read and agreed to the published version of the manuscript.

Funding

This work is supported by the National Natural Science Foundation of PRC (71971098) and the National Natural Science foundation for Young Scholars of China (72101063).

Data Availability Statement

The data presented in this study are available on request from the corresponding author.

Conflicts of Interest

The authors declare no conflicts of interest.

References

  1. Diebold, F.X.; Yılmaz, K. On the network topology of variance decompositions: Measuring the connectedness of financial firms. J. Econom. 2014, 182, 119–134. [Google Scholar] [CrossRef]
  2. Wen, F.; Zhao, L.; He, S.; Yang, G. Asymmetric relationship between carbon emission trading market and stock market: Evidences from China. Energy Econ. 2020, 91, 104850. [Google Scholar] [CrossRef]
  3. Chen, Z.-H.; Ren, F.; Yang, M.-Y.; Lu, F.-Z.; Li, S.-P. Dynamic lead–lag relationship between Chinese carbon emission trading and stock markets under exogenous shocks. Int. Rev. Econ. Financ. 2023, 85, 295–305. [Google Scholar] [CrossRef]
  4. Zhao, Y.; Zhou, Z.; Zhang, K.; Huo, Y.; Sun, D.; Zhao, H.; Sun, J.; Guo, S. Research on spillover effect between carbon market and electricity market: Evidence from Northern Europe. Energy 2023, 263, 126107. [Google Scholar] [CrossRef]
  5. Qiu, L.; Chu, L.; Zhou, R.; Xu, H.; Yuan, S. How do carbon, stock, and renewable energy markets interact: Evidence from Europe. J. Clean. Prod. 2023, 407, 137106. [Google Scholar] [CrossRef]
  6. Li, Y.; Feng, T.-t.; Liu, L.-l.; Zhang, M.-x. How do the electricity market and carbon market interact and achieve integrated development?--A bibliometric-based review. Energy 2023, 265, 126308. [Google Scholar] [CrossRef]
  7. Wang, H.-R.; Feng, T.-T.; Zhong, C. Effectiveness of CO2 cost pass-through to electricity prices under “electricity-carbon” market coupling in China. Energy 2023, 266, 126387. [Google Scholar] [CrossRef]
  8. Su, C.-W.; Pang, L.-D.; Qin, M.; Lobonţ, O.-R.; Umar, M. The spillover effects among fossil fuel, renewables and carbon markets: Evidence under the dual dilemma of climate change and energy crises. Energy 2023, 274, 127304. [Google Scholar] [CrossRef]
  9. Tan, X.; Wang, B.; Wei, J.; Taghizadeh-Hesary, F. The role of carbon pricing in achieving energy transition in the Post-COP26 era: Evidence from China’s industrial energy conservation. Renew. Sustain. Energy Rev. 2023, 182, 113349. [Google Scholar] [CrossRef]
  10. Rudnik, K.; Hnydiuk-Stefan, A.; Li, Z.; Ma, Z. Short-term modeling of carbon price based on fuel and energy determinants in EU ETS. J. Clean. Prod. 2023, 417, 137970. [Google Scholar] [CrossRef]
  11. Du, Z.; Feng, M. The dependence between European Union carbon market and crude oil market: A copula analysis. IOP Conf. Ser. Earth Environ. Sci. 2019, 237, 042005. [Google Scholar] [CrossRef]
  12. Liu, Y.; Yang, X.; Wang, M. Global transmission of returns among financial, traditional energy, renewable energy and carbon markets: New evidence. Energies 2021, 14, 7286. [Google Scholar] [CrossRef]
  13. Duan, K.; Ren, X.; Shi, Y.; Mishra, T.; Yan, C. The marginal impacts of energy prices on carbon price variations: Evidence from a quantile-on-quantile approach. Energy Econ. 2021, 95, 105131. [Google Scholar] [CrossRef]
  14. He, A.; Xue, Q.; Zhao, R.; Wang, D. Renewable energy technological innovation, market forces, and carbon emission efficiency. Sci. Total Environ. 2021, 796, 148908. [Google Scholar] [CrossRef]
  15. Tiwari, A.K.; Abakah, E.J.A.; Gabauer, D.; Dwumfour, R.A. Dynamic spillover effects among green bond, renewable energy stocks and carbon markets during COVID-19 pandemic: Implications for hedging and investments strategies. Glob. Financ. J. 2022, 51, 100692. [Google Scholar] [CrossRef] [PubMed]
  16. Jiang, W.; Chen, Y. The time-frequency connectedness among metal, energy and carbon markets pre and during COVID-19 outbreak. Resour. Policy 2022, 77, 102763. [Google Scholar] [CrossRef]
  17. Jiang, Y.; Wang, J.; Lie, J.; Mo, B. Dynamic dependence nexus and causality of the renewable energy stock markets on the fossil energy markets. Energy 2021, 233, 121191. [Google Scholar] [CrossRef]
  18. Tao, M.; Poletti, S.; Wen, L.; Sheng, M.S. Dynamic spillovers between the carbon, stock, and energy markets: A New Zealand case. J. Clean. Prod. 2024, 434, 140278. [Google Scholar] [CrossRef]
  19. Li, G.; Shen, Z.; Song, M.; Wei, W. Exploring the interconnectedness of China’s new energy and stock markets: A study on volatility spillovers and dynamic correlations. Int. Rev. Econ. Financ. 2024, 89, 471–484. [Google Scholar] [CrossRef]
  20. Demirer, R.; Ferrer, R.; Shahzad, S.J.H. Oil price shocks, global financial markets and their connectedness. Energy Econ. 2020, 88, 104771. [Google Scholar] [CrossRef]
  21. Tan, X.; Sirichand, K.; Vivian, A.; Wang, X. How connected is the carbon market to energy and financial markets? A systematic analysis of spillovers and dynamics. Energy Econ. 2020, 90, 104870. [Google Scholar] [CrossRef]
  22. Atta-Mensah, J. Commodity-linked bonds as an innovative financing instrument for African countries to build back better. Quant. Financ. Econ. 2021, 5, 516–541. [Google Scholar] [CrossRef]
  23. Sikiru, A.A.; Salisu, A.A. Hedging with financial innovations in the Asia-Pacific markets during the COVID-19 pandemic: The role of precious metals. Quant. Financ. Econ. 2021, 5, 352–372. [Google Scholar] [CrossRef]
  24. Li, Z.; Ao, Z.; Mo, B. Revisiting the valuable roles of global financial assets for international stock markets: Quantile coherence and causality-in-quantiles approaches. Mathematics 2021, 9, 1750. [Google Scholar] [CrossRef]
  25. Mo, B.; Meng, J.; Wang, G. Risk Dependence and Risk Spillovers Effect from Crude Oil on the Chinese Stock Market and Gold Market: Implications on Portfolio Management. Energies 2023, 16, 2141. [Google Scholar] [CrossRef]
  26. Meng, J.; Mo, B.; Nie, H. The dynamics of crude oil future prices on China’s energy markets: Quantile-on-quantile and casualty-in-quantiles approaches. J. Futures Mark. 2023, 43, 1853–1871. [Google Scholar] [CrossRef]
  27. Zhou, Y.; Wu, S.; Zhang, Z. Multidimensional risk spillovers among carbon, energy and nonferrous metals markets: Evidence from the quantile VAR network. Energy Econ. 2022, 114, 106319. [Google Scholar] [CrossRef]
  28. Lin, B.; Zhu, J. Energy and carbon intensity in China during the urbanization and industrialization process: A panel VAR approach. J. Clean. Prod. 2017, 168, 780–790. [Google Scholar] [CrossRef]
  29. Gong, X.; Shi, R.; Xu, J.; Lin, B. Analyzing spillover effects between carbon and fossil energy markets from a time-varying perspective. Appl. Energy 2021, 285, 116384. [Google Scholar] [CrossRef]
  30. Antonakakis, N.; Gabauer, D. Refined measures of dynamic connectedness based on TVP-VAR. Munich Pers. RePEc Arch. 2017, 78282. Available online: https://mpra.ub.uni-muenchen.de/78282/ (accessed on 12 April 2017).
  31. Huang, Y.; Dai, X.; Wang, Q.; Zhou, D. A hybrid model for carbon price forecasting using GARCH and long short-term memory network. Appl. Energy 2021, 285, 116485. [Google Scholar] [CrossRef]
  32. Gargallo, P.; Lample, L.; Miguel, J.A.; Salvador, M. Co-movements between EU ETS and the energy markets: A VAR-DCC-GARCH approach. Mathematics 2021, 9, 1787. [Google Scholar] [CrossRef]
  33. Kanwal, M.; Khan, H. Does carbon asset add value to clean energy market? Evidence from EU. Green Financ. 2021, 3, 495–507. [Google Scholar] [CrossRef]
  34. Alola, A.A.; Bekun, F.V. Pandemic outbreaks (COVID-19) and sectoral carbon emissions in the United States: A spillover effect evidence from Diebold and Yilmaz index. Energy Environ. 2021, 32, 945–955. [Google Scholar] [CrossRef]
  35. Diebold, F.X.; Yilmaz, K. Better to give than to receive: Predictive directional measurement of volatility spillovers. Int. J. Forecast. 2012, 28, 57–66. [Google Scholar] [CrossRef]
  36. Diebold, F.X.; Yilmaz, K. Measuring financial asset return and volatility spillovers, with application to global equity markets. Econ. J. 2009, 119, 158–171. [Google Scholar] [CrossRef]
Figure 1. Time series chart of carbon market trading prices and returns.
Energies 17 02563 g001
Figure 2. Time series chart of returns for the traditional energy industry. Note: The industry names and abbreviations are steel (ST), coal (CO), non-ferrous metals (NO), basic chemicals (CH), petroleum, and natural gas (PE), separately.
Energies 17 02563 g002
Figure 3. Time series chart of returns for the new energy industry. Note: The industry names and abbreviations are new energy batteries (BA), new energy vehicles (VE), environmental protection industry (PR), new energy metals (ME), and photovoltaics (PH), separately.
Energies 17 02563 g003
Figure 4. Trend chart of prices in the traditional energy industry. Note: The industry names and abbreviations are steel (ST), coal (CO), non-ferrous metals (NO), basic chemicals (CH), petroleum, and natural gas (PE), separately.
Energies 17 02563 g004
Figure 5. Trend chart of prices in the new energy industry. Note: The industry names and abbreviations are new energy batteries (BA), new energy vehicles (VE), environmental protection industry (PR), new energy metals (ME), and photovoltaics (PH), separately.
Energies 17 02563 g005
Figure 6. The correlation coefficients among all markets. Red represents negative correlation and blue represents positive correlation. The darker the color and the flatter the circle, the higher the correlation.
Energies 17 02563 g006
Figure 7. The total spillover index.
Energies 17 02563 g007
Figure 8. The net spillover effect of the carbon market.
Energies 17 02563 g008
Figure 9. The trend chart of net spillover effects of the carbon market on the traditional energy industry.
Energies 17 02563 g009
Figure 10. The trend chart of net spillover effects of the carbon market on the new energy industry.
Energies 17 02563 g010
Figure 11. The net spillover effect of the traditional energy market.
Energies 17 02563 g011
Figure 12. The net spillover effect of the new energy market.
Energies 17 02563 g012
Figure 13. Robust test. Note: the former shows the total spillover index with a forecasting horizon of 15, and the latter shows that of 10.
Energies 17 02563 g013
Table 1. Summary statistics of all series.
MinMaxMeanS.D.SkewKurtJBADF
CB−120.412146.3440.018516.26300.32015.45812,519.191 ***−57.053 ***
ST−3.78484.62370.00040.76290.0523.647694.953 ***−36.19 ***
ME−5.83727.27200.02321.1247−0.1433.300572.476 ***−34.378 ***
VE−5.03935.95500.01930.9450−0.1973.288572.368 ***−33.983 ***
PH−8.62095.59330.02570.9481−0.3988.2103556.668 ***−36.305 ***
PR−5.51934.57050.00610.7776−0.4194.6231153.262 ***−35.188 ***
CH−4.20213.60640.00320.7152−0.5533.704780.364 ***−34.606 ***
CO−5.02414.66360.02140.91240.0143.286563.529 ***−34.52 ***
PE−3.86274.70010.00800.73880.1024.7431177.173 ***−36.423 ***
BA−5.38296.23980.02930.9801−0.0943.505643.055 ***−34.38 ***
NO−4.63675.90440.01250.9422−0.1353.790753.673 ***−36.196 ***
Note: CB represents the carbon market of China. Steel (ST), basic chemicals (CH), coal (CO), petroleum and natural gas (PE), and non-ferrous metals (NO) represent the traditional energy sector, while batteries (BA), new energy metals (ME), new energy vehicles (VE), photovoltaics (PH), and environmental protection (PR) represent the new energy industry. *** indicates rejection of the null hypothesis at a 1% level.
Table 2. Spillover index table for carbon and various energy stock markets.
CBSTMEVEPHPRCHCOPEBANOFROM
CB84.581.881.031.261.261.251.472.292.141.311.5315.42
ST0.3521.297.645.655.476.9110.8312.7912.715.0111.3678.71
ME0.346.4116.8512.538.0410.259.694.834.9511.1514.9783.15
VE0.274.8511.9916.049.9412.919.664.114.2615.2110.7583.96
PH0.35.459.1311.6218.6815.589.684.34.711.389.1881.32
PR0.235.749.7312.7213.1715.810.634.65.0412.59.8584.2
CH0.388.579.559.768.3110.8516.587.297.919.3811.4283.42
CO0.613.135.714.794.365.619.5122.320.244.099.6777.7
PE0.6512.725.714.884.636.0110.1319.721.634.269.6678.37
BA0.314.511.2116.0710.2613.379.713.733.9216.959.9883.05
NO0.328.5313.8210.337.539.6110.657.197.369.1615.4984.51
TO3.7571.7785.5289.6172.9692.3591.9570.8373.2483.4498.37833.79
NET−11.67−6.942.375.66−8.358.158.53−6.87−5.130.413.86
Note: CB represents the carbon market of China. Steel (ST), basic chemicals (CH), coal (CO), petroleum and natural gas (PE), and non-ferrous metals (NO) represent the traditional energy sector, while batteries (BA), new energy metals (ME), automobiles (VE), photovoltaics (PH), and environmental protection (PR) represent the new energy industry.
Disclaimer/Publisher’s Note: The statements, opinions and data contained in all publications are solely those of the individual author(s) and contributor(s) and not of MDPI and/or the editor(s). MDPI and/or the editor(s) disclaim responsibility for any injury to people or property resulting from any ideas, methods, instructions or products referred to in the content.