Article

Harvesting Electric Energy Using Thermoelectric Generators in a Residential Heating Application

by
Ugochukwu Chukwurah
* and
Gordon McTaggart-Cowan
School of Sustainable Energy Engineering, Simon Fraser University, Surrey, BC V3T 0N1, Canada
*
Author to whom correspondence should be addressed.
Energies 2024, 17(11), 2562; https://doi.org/10.3390/en17112562
Submission received: 26 April 2024 / Revised: 17 May 2024 / Accepted: 20 May 2024 / Published: 25 May 2024
(This article belongs to the Section G: Energy and Buildings)

Abstract

:
Biomass combustors provide space heating by converting chemical energy in woody biomass into low-temperature thermal energy. Thermoelectric generators (TEGs) can generate electricity from the heat flux without significantly reducing heating performance. However, most current TEGs are small (40 mm × 40 mm), requiring many TEG elements to generate useful power from a biomass combustion-based space heater. This work compares the electrical generation potential of an array of small TEGs with a larger (80 mm × 120 mm) TEG in a vertical configuration representative of a residential heating appliance. An experimental facility was developed for various representative cold-side ducts and controllable hot-side temperature and cooling airflows, and the Taguchi method was used to evaluate the impacts of temperature, airspeed, and ducting configurations. The results indicate that temperature and airspeed significantly influence TEG power, while ducting configurations have an insignificant influence. The large TEG achieved more consistent temperatures but produced lower power than an array of smaller TEGs with the same total area. The study emphasizes optimizing TEG design and operating conditions to enhance electricity generation efficiency in space heating combustors.

1. Introduction

In the pursuit of clean and zero carbon emission energy, technologies for converting heat to electricity offer a way to use available energy streams more efficiently. Thermoelectric generators (TEGs) use the Seebeck effect [1] to produce electricity from ‘low-grade’ heat sources, where temperature differences can exist in the range of 20–180 °C. The Seebeck effect (s) defines the occurrence of a voltage produced by a temperature difference between a junction of two dissimilar metallic conductors or semiconductors [2,3]. TEGs have been demonstrated to convert thermal energy into electricity in various applications, from industrial applications to automotive exhaust systems. TEGs have been evaluated in space heating in multiple applications, including cooking stoves that generate electricity for charging electronic devices [4] or gas heaters that produce up to 9.5 watts [5]. One of the most challenging aspects of integrating TEGs into biomass-fueled space heaters is that surface temperatures are low and tend to vary in regular use. Combined with the inherent low efficiency of TEGs, generating a valuable amount of electrical power is challenging. A new combustor concept uses a phase-change material (PCM) to absorb thermal energy from the combustion and then regulate heat transfer to the space over a longer duration. Maintaining a fixed hot-side temperature allows TEGs installed in this model to maximize electrical energy production.
Biomass-fueled space heating combustors are widely used, especially in off-grid locations in North America. Common challenges for these systems include temperature control, heat loss prevention, and the limited duration of heat supply [6,7]. Combustion efficiency is improved, and emissions are reduced if the biomass is burned rapidly. However, if the energy release rate is too fast, then the temperature in the occupied space varies unacceptably. One approach to address these challenges is incorporating a PCM that can absorb the rapid thermal energy released from biomass combustion but maintains a lower temperature to regulate heat transfer to space. In this application, TEGs can be integrated between the PCM and the room to convert some of the thermal energy stored in the PCM into a steady supply of helpful electricity.
Thermoelectric generators operate on the principle of extracting electrical energy from a flow of heat across a temperature difference. Based on the Seebeck effect, a fraction of this energy can be extracted and converted into electricity. TEGs are composed of P- and N-type semiconductors joined at two points to form a junction (see Figure 1). The P-type and N-type semiconductors are the positive- and negative-charge carriers, doped [8] to possess excess holes and electrons in the internal electron structure. When the junction of the two materials is exposed to a thermal gradient, the positive charges migrate toward the negative charges, leading to the generation of an electric potential.
TEGs are characterized by low efficiencies, in the range of 5 to 8%, and the efficiency of a TEG is influenced by many factors, including the material components of the TEG and the ability to reject heat on the low-temperature side of the TEG. Studies also show that the geometric shape and size of the component P-N semi-conductors [9] and the air temperature [10] of the TEG surrounding space influence the performance of TEGs. The most widely used TEG material is bismuth telluride, with a decreasing efficiency when the cold-side temperature is higher than typical room temperatures [10].
In a biomass-based space heater, the heat rejection from the combustor to the room air is performed through free convection and radiation. However, a TEG’s efficiency in generating electricity is often limited by poor cold-side heat transfer. To improve the heat rejection from the cold side of TEGs and to distribute the heat throughout the room, a combustor could be configured with an internal high-temperature shell containing the PCM and surrounded by air circulation ducts that can be controlled to regulate the heat flux to the rest of the room. Placing the TEGs between the PCM and the air ducts ensures relatively stable hot-side temperatures and effective cold-side heat rejection. Previous work has shown that a chimney effect can increase energy recovery from TEGs by increasing the airflow velocity over cooling surfaces [11]. However, increased air temperature within the chimney space could offset these benefits, which need to be assessed. A representative geometry is shown in Figure 2.
Typical biomass combustors for space heating are approximately square, with dimensions under about 1 m in width, depth, and height. A more efficient design could be to increase the height and reduce the footprint of the combustion (See Figure 2), and to generate enough power, multiple TEG modules can be connected in series. As TEGs are commonly available in a 40 mm × 40 mm footprint, this would lead to many TEGs on a combustor, resulting in a high manufacturing effort and corresponding increases in potential failure modes. A larger footprint TEG module could address these challenges, but there needs to be more information in the open literature on how a larger TEG would perform compared to an array of smaller TEGs.
In summary, TEGs have been assessed in several applications, such as rocket stoves [12], and mathematical models [13] have been developed to understand the optimal operating points. This study aims to assess the amount of electrical power that can be generated from an array of TEGs attached to the outer surface of a space-heating combustor and to identify the main factors impacting the electrical production potential. The primary objectives of the work are to experimentally:
  • Assess the relative importance of hot-side temperature, cold-side airflow, and cold-side geometry on the performance of an array of TEGs.
  • Compare the performance of an array of small TEGs and a single, large TEG of the same surface area.
The novel contribution of this work is to conduct a statistically robust analysis using the Taguchi method to compare the overall performance of small and large TEGs, and to evaluate the primary factors influencing the performance the TEGs. The work also assesses, for the first time, the suitability of air cooling for TEGs in a biomass combustor where the hot-side temperature is controlled at a near-constant value through a phase change material.

2. Materials and Methods

To meet the project aims, a dedicated sub-scale test rig was developed using a controllable induction heater, TEGs, duct, sensors, and data acquisition. Standard TEG performance parameters were used to assess overall system performance, including the design-of-experiment approach with parameter values developed in preliminary testing.

2.1. Assessing TEG Performance

The thermoelectric figure of merit [14] is an important factor when assessing TEG performance. It is a non-dimensional parameter that is a function of the material thermal conductivity, Seebeck coefficient, and thermal resistivity of the TEG. The formula for the thermoelectric figure of merit (ZT) of a TEG is:
Z T = S 2 σ T k
where σ is the electrical conductivity in Siemens per meter (S/m), k is the thermal conductivity of the material in watts per meter-kelvin (W/m·K), and T is the absolute temperature in Kelvin. The Seebeck coefficient, S, is a material property that relates the open-circuit voltage by a temperature difference in a P-N junction (S = V/T) [1]. As Equation (1) shows, the figure of merit is a function of material properties, but is independent of the geometric configuration of a specific TEG embodiment. When implemented in a TEG design, the geometry of the P-N junctions influences the flow of both thermal and electrical energies. The electrical resistance of a TEG is a function of the size of the individual elements and the total number of junctions:
R teg = N P . N ρ P L P A P + ρ N L N A N
where ρ is the electrical resistivity, A is the cross-sectional area of each P or N element, L is the length of the element, and N P . N is the number of P-N junctions in the TEG module. In the fabrication of a TEG module, the internal components (P and N semiconductors) are connected in series so that it sums up to provide the total voltage; likewise, identical TEG modules can be connected in series to generate a higher voltage, or parallel to generate higher current. The thermal resistance of a TEG also to be considered is given as:
R thermal = N P . N L P K P A P + L N K N A N
where K is the thermal conductivity of the material measured in watts per meter Kelvin (W/m·K), A is the cross-sectional area of each p or n element, L is the length of the element, and N P . N is the number of P-N junctions in the TEG module. To generate electricity, a TEG needs to be exposed to a temperature difference between the hot and cold sides. This temperature difference is due to heat transfer, and the rate of heat in watts absorbed by the hot side of a TEG [15,16] is given as:
Q hotside =   N P . N S × I × T hot + K Δ T 0.5 ×   I 2 × R teg
and the rate of heat in watts emitted from the cold side of a TEG is given as:
Q coldside =   N P . N S × I × T cold + K Δ T 0.5 ×   I 2 × R teg
where I is the current produced by the TEG, and from the first law of thermodynamics, the output power of a TEG is given as:
P O =   Q hotside   Q coldside
To compare different TEGs, the thermal efficiency of the module can be calculated from:
η thermal = P O Q hotside

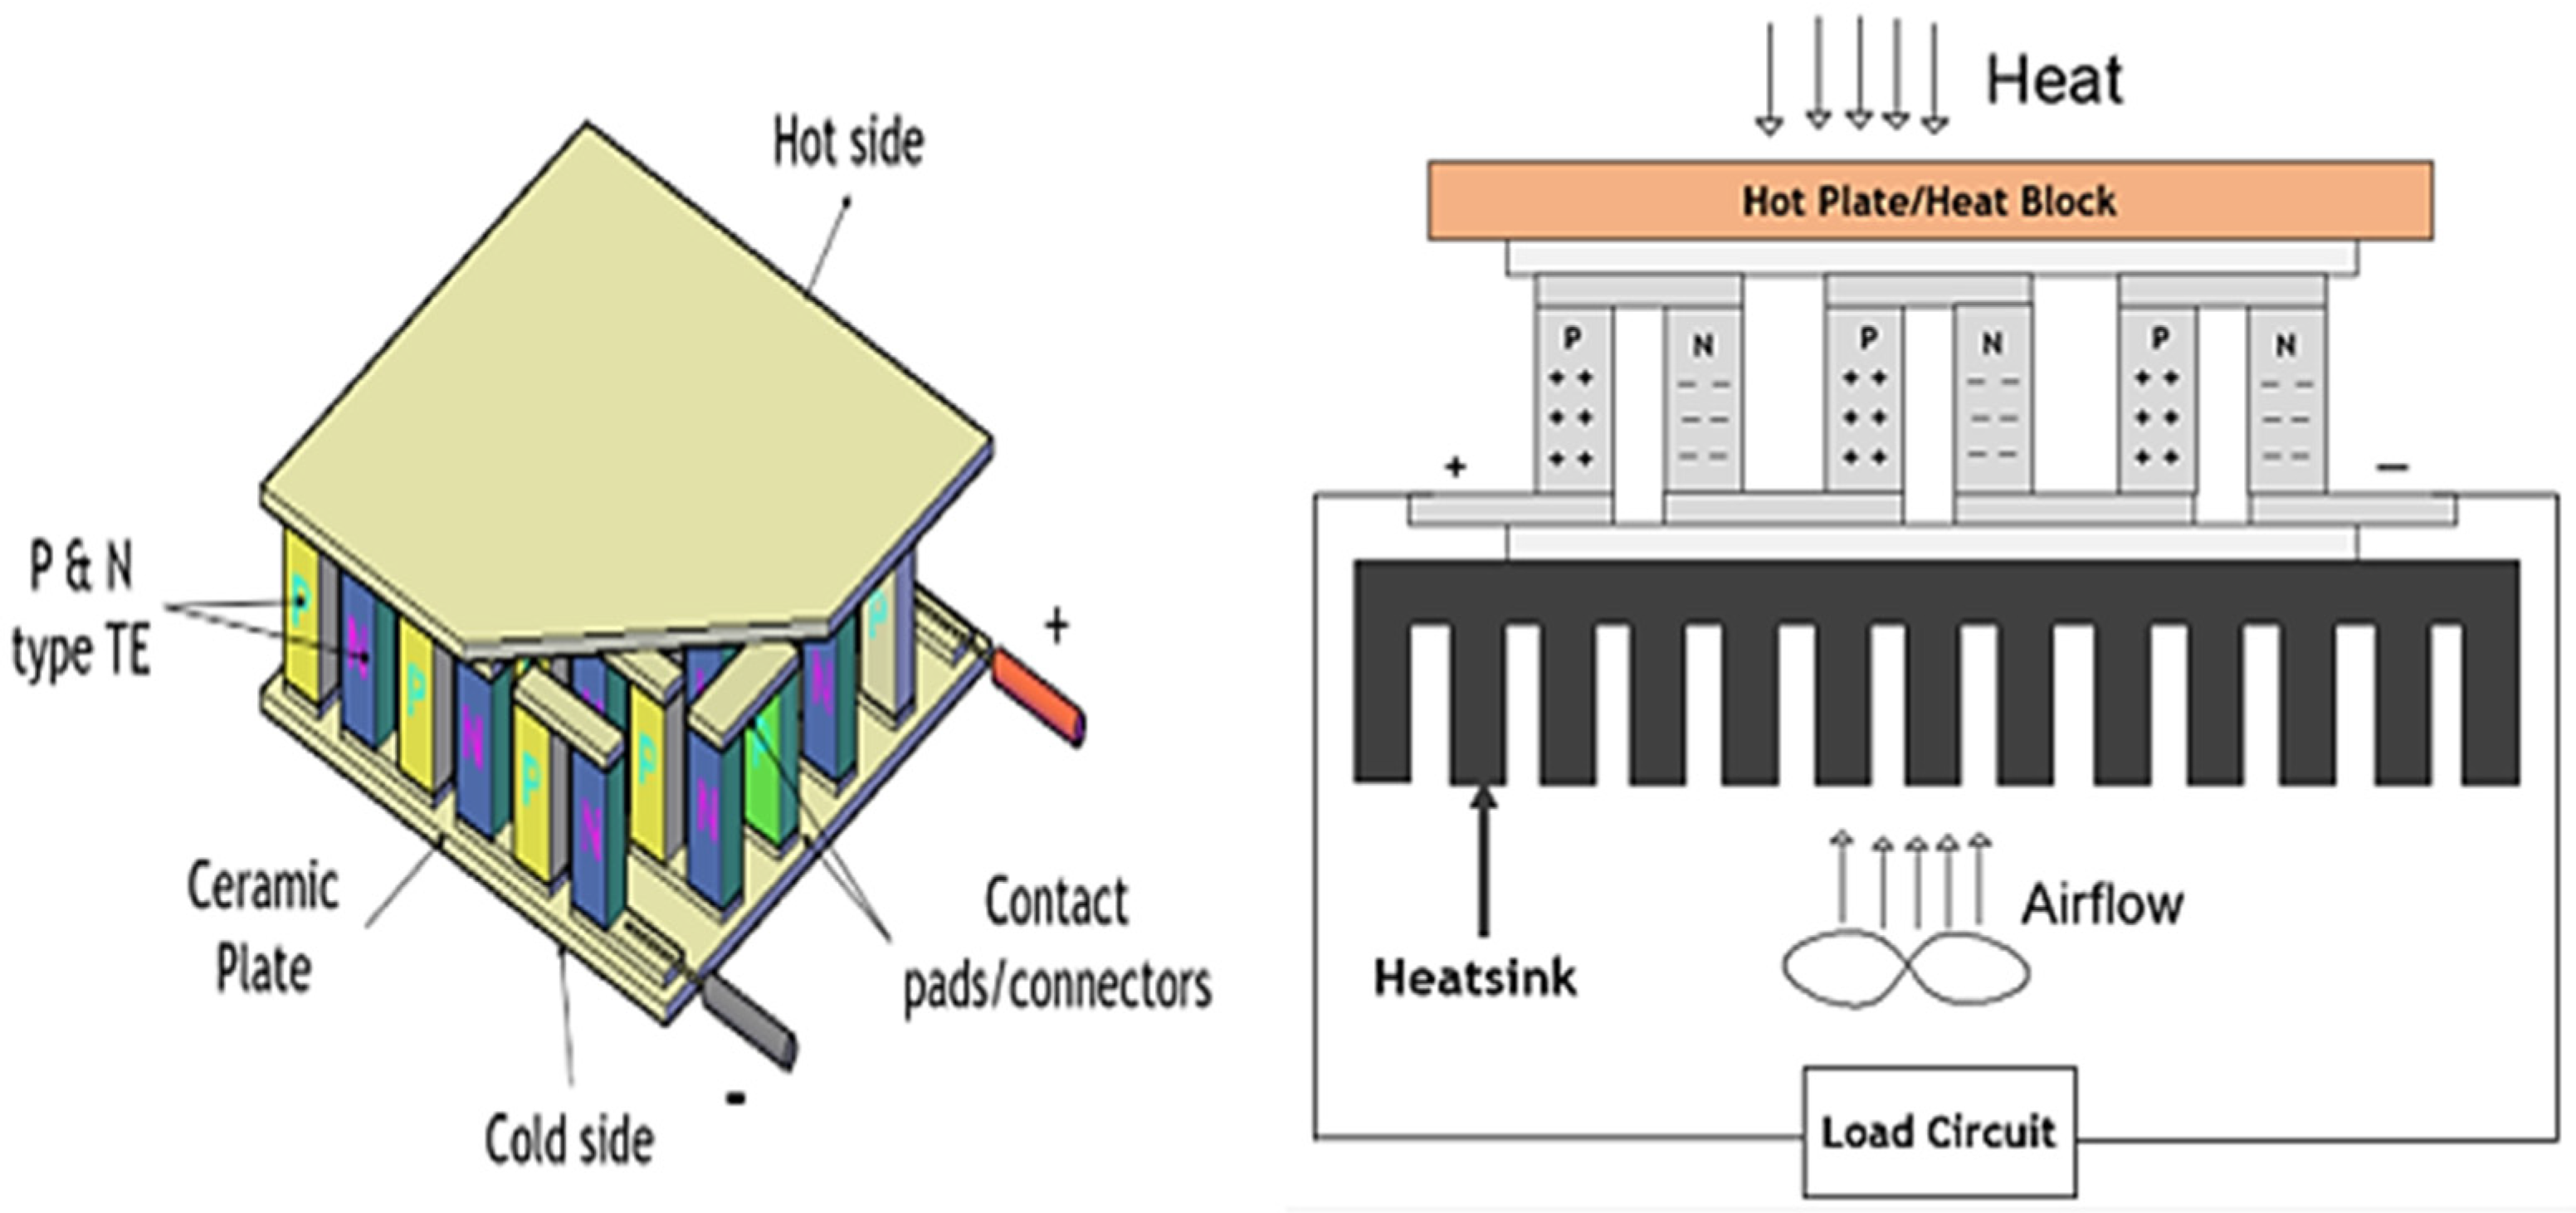
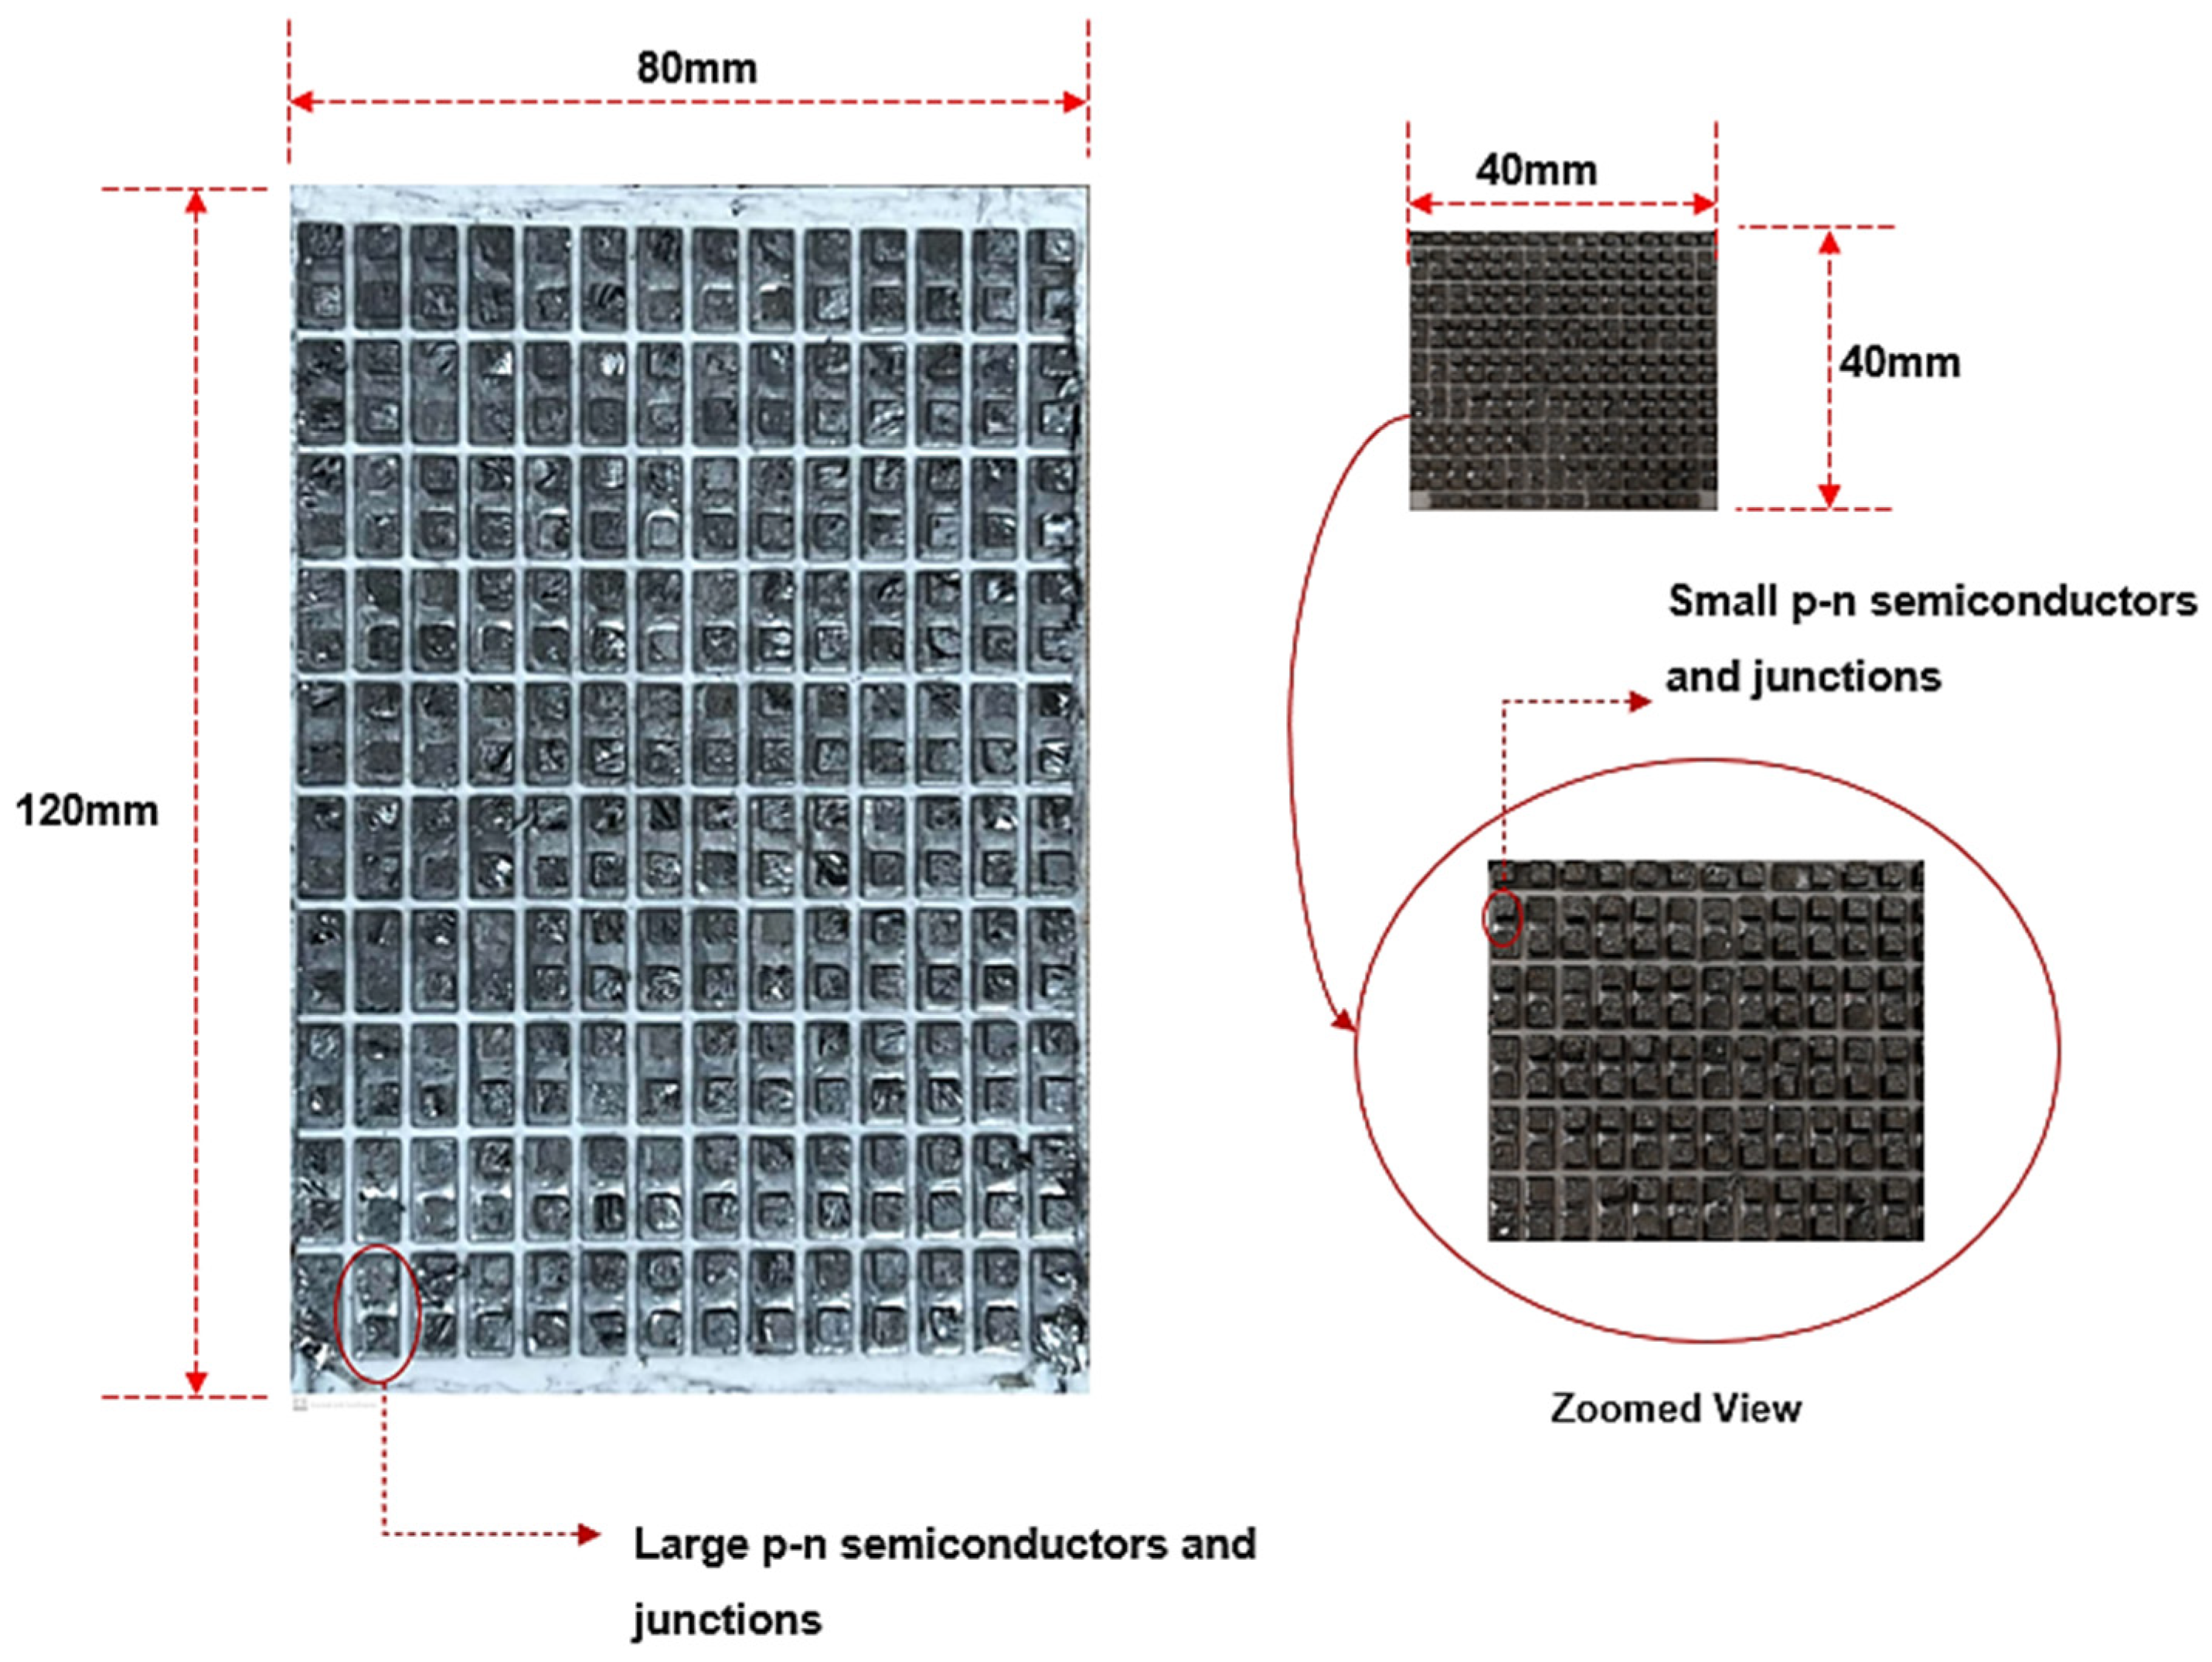
Sample Thermoelectric Generators

The primary objective of this work is to compare the performance of a single, large TEG module compared to an array of smaller TEG units subject to equivalent operating conditions. The operating conditions include hot-side temperature, airspeed, and ducting configurations. Commercially available TEGs come in small geometric sizes (square, per side: 40 mm, 25 mm, and 60 mm, etc.). To generate substantial electrical power, many such small TEGs would need to be installed (as shown in Figure 2) and connected electrically [17], but increasing the geometric size of the TEG will reduce the installation effort and average the heat transfer across a larger area, reducing the variability caused by variations in temperature on either the hot or cold sides of the TEG.
In this work, conventional 40 mm × 40 mm size TEGs (actual size of 40.13 mm × 40.13 mm × 3.91 mm from Marlow Industries, Inc. in Dallas, TX, USA were purchased and supplied through Digi key, with Digi-Key Part Number 1681-1071-ND and Manufacturer Product Number TG12-6-01) were used to compare against a large TEG (120 mm × 80 mm, 4.93 mm from Hebei Yuxiang Electronic Co., Ltd., Yuxian County, Zhangjiakou, China, and product part no of TEG1-139-3.0-1.3). Both the small and large TEGs were of bismuth telluride type, and the internal structures of the two TEG types are compared in Figure 3. A key observation is that the individual P-N semiconductor elements of the large TEG are more significant in cross-sectional area (4 mm × 4 mm) than the smaller TEG module (2.5 mm × 2.5 mm). This difference will lead to a lower electrical resistance (Equation (2)) for the large TEG and is a result of the limitations of the manufacturing process: a large TEG with small p-n junctions was not available.
In a commercially produced TEG, the P-N junctions are manufactured and installed as part of the assembly process. Following the Seebeck effect, in the presence of thermal gradients, electrons will flow in the direction of the thermal gradient. Since the thermal gradient is in the same direction across the entire TEG, then the electron flow should be in the same direction.

2.2. ANOVA and Taguchi Methodologies

The experimental analysis investigated the differences between critical parameters in the test set-up. Analysis of variance (ANOVA) was used in combination with Taguchi design of experiments (DOEs) [18]. This approach has been used in previous TEG analysis studies investigating the effects of temperatures, geometries, and heat rejection approaches [19,20]. ANOVA and Taguchi design of experiments (DOEs) were used in this work to compare the single, large TEG (120 mm × 80 mm) to the six small TEG units (40 mm × 40 mm each) to quantify the electrical energy recovered from the TEGs for the combination of factors and levels of temperature, ducting configuration, and airspeed. The size and configuration of the heatsink were kept constant throughout the experiments for both cases of the single, large TEG and the multiple TEG units to emphasize the relative comparison between the factors of interest.

2.3. Experimental Set-Up and Test Procedures

The test rig used in the work consisted of an electric induction heater mounted on a metal structure casing, which acted as a support and a base for the heater and other rig components. A solid heating block was placed adjacent to the induction heater to maintain a more constant temperature while the induction heater cycled on and off. The heating block was then placed in direct thermal contact with a metal plate to emulate the outside surface of the combustor. Thermoelectric generators and heatsinks were attached to this metal surface using a thermal adhesive. The rig was set-up and connected so that heat flowed from the induction heater through the heating block (also acting as a thermal reservoir) and mild steel plate into the thermoelectric generators and heatsink attachments. Airflow was generated parallel to the cooling fins on the heatsinks through an array of blower fans or by a diffuser connected to the laboratory compressed air system. A duct with variable spacing was installed to represent the internal flow geometry of the air past the cooling fins within a representative combustor geometry; likewise, further details on the test rig can be obtained from [21]. See CAD model of test rig in Figure 4.
The heat source for the testing was a vertically mounted induction heater with a heated circular area of approximately 314 cm2 (purchased from Cusimax, in Zhongshan City, China, and with product part number CMIC-180B1). It included a local control panel where the temperature or the power could be set. Temperature control from the induction heater was used to maintain stable thermal conditions at the TEG. As the heater thermal control cycled the heater element on and off, a steel thermal block (12 mm thick) was installed next to the heater to ensure a constant temperature at the TEG. Time-resolved measurements showed that the temperature fluctuated by ±2 °C at the hot side of the TEG.
Heat rejection from the TEGs was established using a finned aluminum heat sink that was 40 mm × 40 mm × 20 mm and was 1.3 to 1.7 mm thick. These heat sinks were chosen as they provided adequate clearance for airflow within the allocated space while maintaining a large surface area. The heat sinks were adhered directly to the cold side of the TEGs using thermal paste (JB weld-type thermal pastes purchased from Marietta, GA, 30068 USA and supplied through Amazon with model and part number 50240, and a tensile strength of 3900 PSI).
The TEGs were connected to a load created by an array of resistors connected in series. The number of resistors was established to provide the optimum efficiency of the TEGs, which was found to be 30 ohms for standard TEGs (six TEG arrays) and 0.4 ohms for the large TEG. The combined resistance was measured using a high-accuracy resistance meter (LCX100 LCR meter from Rohde & Schwarz in Munich, Germany). The voltage across the resistors was measured, and the accurate resistance obtained from the high-precision meter was used to calculate the power output from the TEGs. Wire and fitting losses were negligible for the small TEGs but significant for the large TEG with a low internal resistance. As a result, the load voltage and resistance were measured for the large TEG, including the wires and connections. The optimal load resistances were fixed for all tests.
Airflow through the duct on the cooling side of the TEGs is a critical parameter in establishing TEG performance. The airflow was generated in two ways: in preliminary testing, a series of blower fans with a controlled voltage were used to create airflow over a single TEG. The blowers were replaced with a compressed air supply connected to a diffuser for the entire testing program. The pressure upstream of the diffuser was set for each test condition. The upstream compressed air regulator was adjusted to achieve a repeatable air pressure, leading to a repeatable velocity in the duct. The air velocity in the duct was measured using a pitot tube mounted on a traversing frame that allowed measurements at multiple points in the duct and measuring the differential pressure (LEFOO LFM108 purchased from Hangzhou, Zhejiang, China and supplied through Amazon, with operation range of 0–500 pa, and accuracy: ±1.0%FS) allowed the calculation of the air velocity from the difference between static and stagnation pressures.
The experimental measurements were recorded on a DATAQ model-DI 2008 (purchased from DATAQ Instruments Inc., Akron, OH, USA) data acquisition (DAQ) system. This was used to record temperatures, load, and airflow voltages. The DAQ recorded a one-sample rate per second (S/s) over at least 10 min per test. Temperature was measured using K-type thermocouples, including surface-mount thermocouples installed in grooves between thermal elements in the rig and adhered to the outer surface of the finned array.

2.3.1. Experimental Procedure

The controlled variables for each configuration of TEGs were the heater temperature, the airflow rate/velocity, and the geometric configuration of the air duct. The induction heater controller was set to a target temperature between 70 °C and 120 °C. The overall procedure for using the test rig was to switch on the electric induction heater, which supplied thermal energy to the TEG/heatsink attachment through the heating block and hot plate. The heater was set to a predetermined temperature and allowed to reach a steady state, defined as when the temperatures from the thermocouples attached between the hot plate and the TEGs did not change for at least one minute. Data were recorded for at least 10 min for each test point. Then, the test condition was changed, and the process was repeated. Note that, in the experimental set-up, the output current was not specifically measured, while the hot-side temperature was lower than the cold side (reverse temperature gradient) because the heater was always configured to provide a higher temperature than the surrounding air.

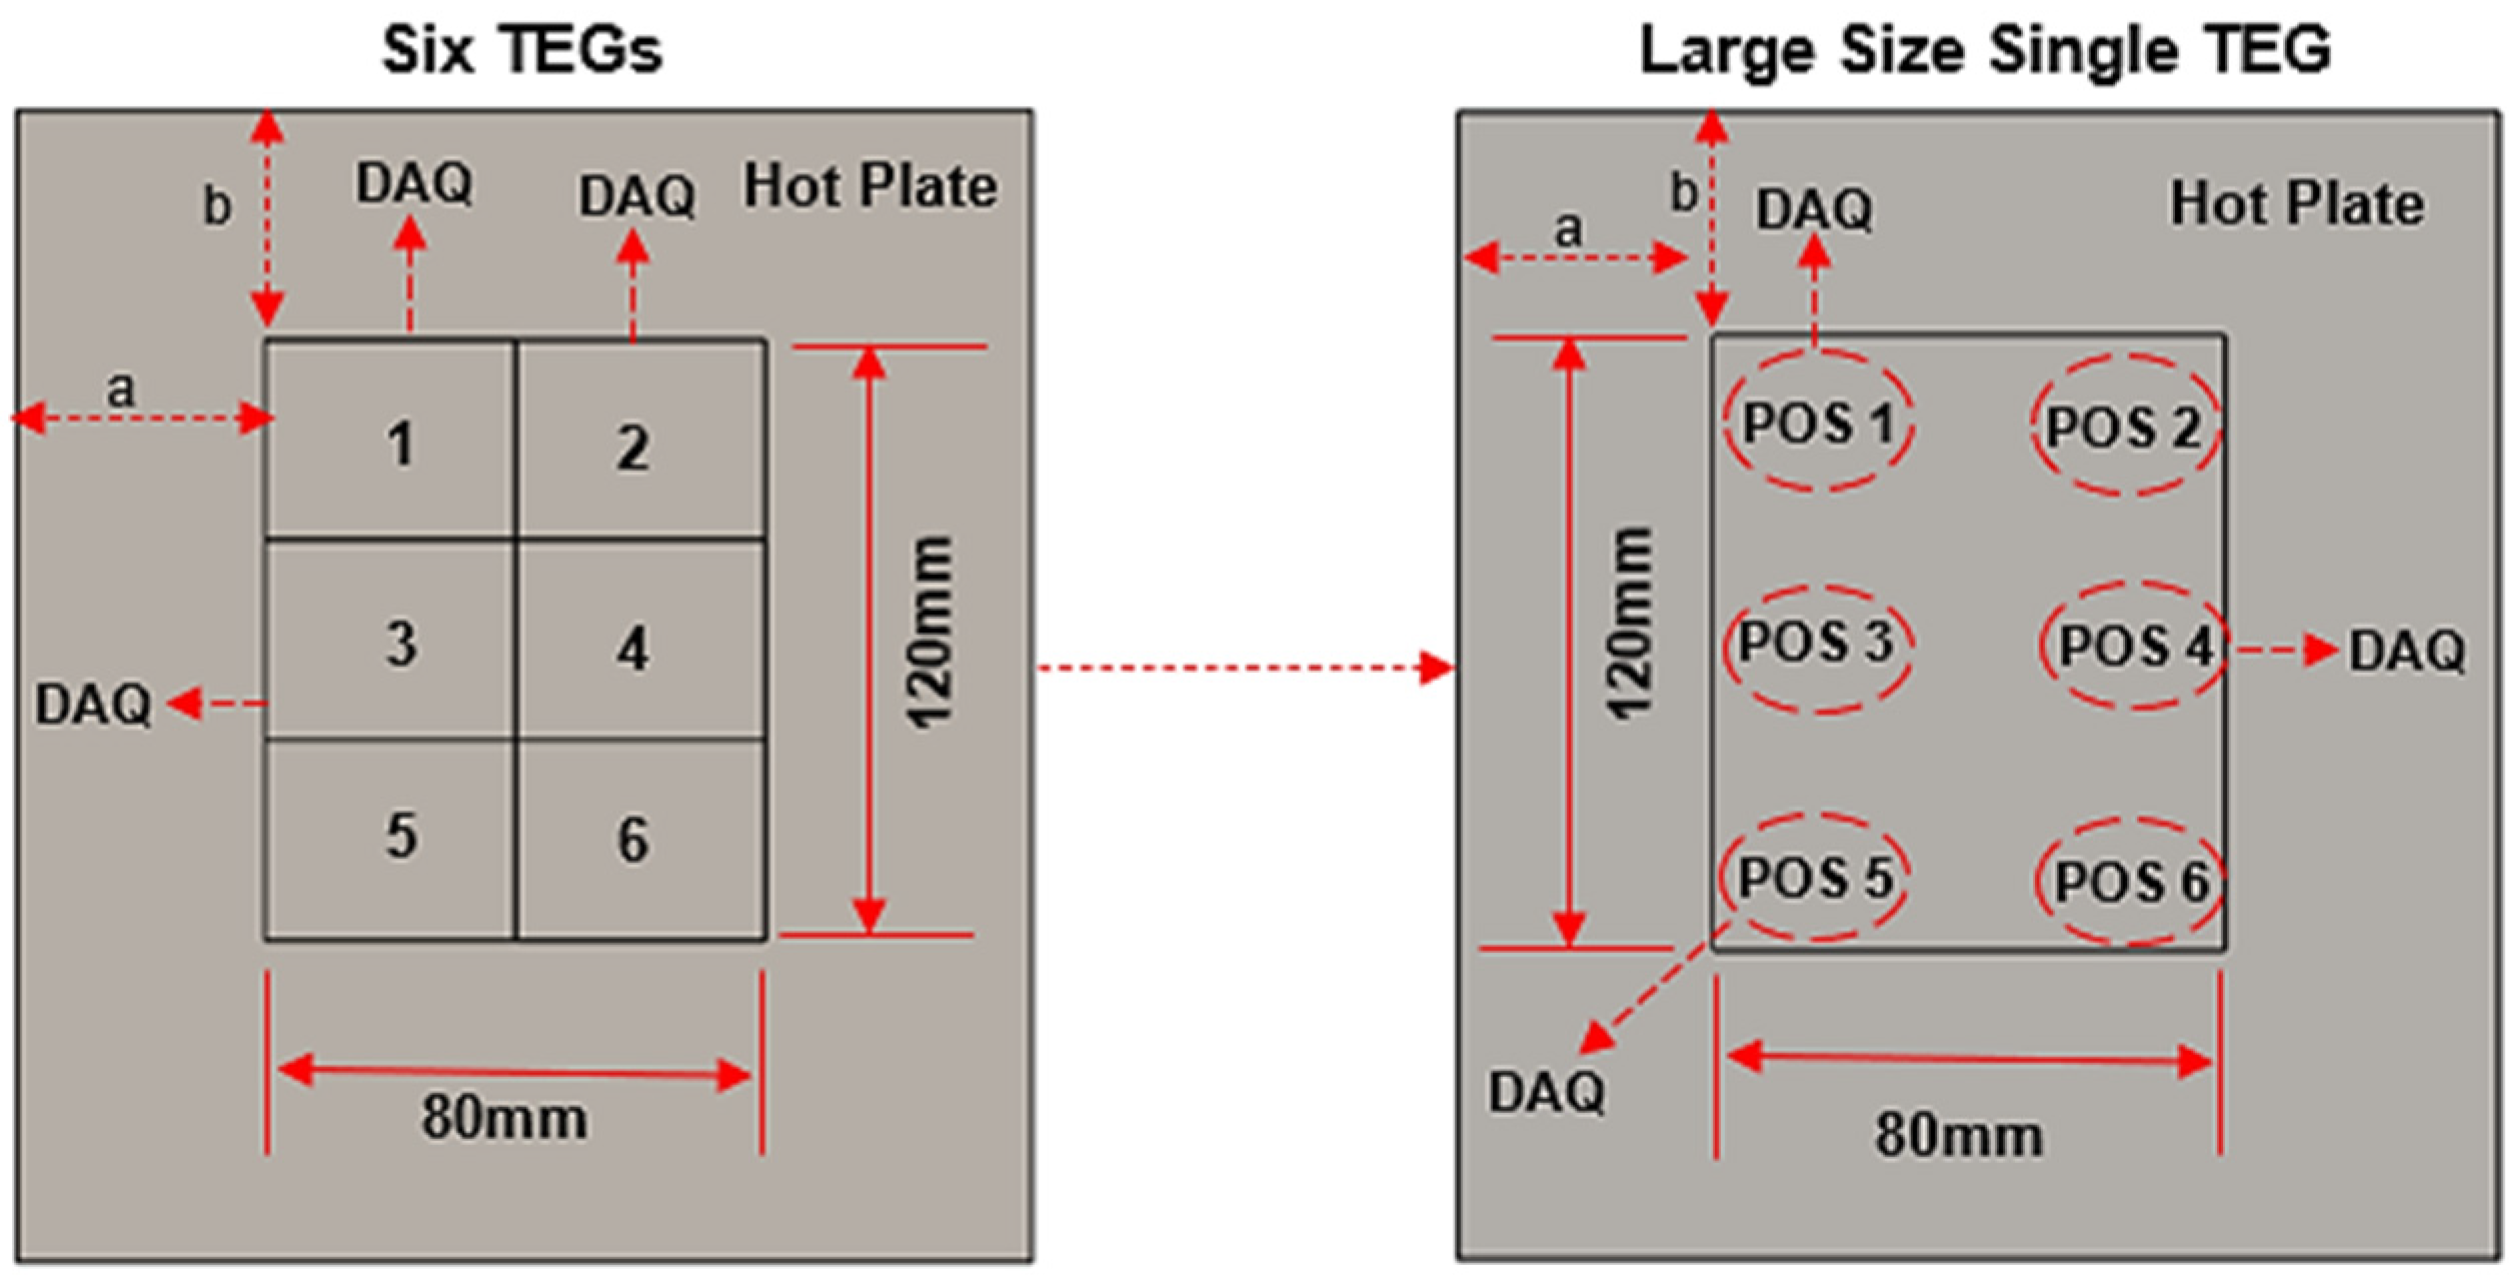
2.3.2. Set-Up for the Taguchi Architecture

The dependent variable is the output power from the TEGs, while the independent variables are the hot-side temperature, airflow speed, and ducting configuration. The heat sink geometry was not changed, and insulation was installed on the heated surface surrounding the TEGs. Thermal insulation prevented extra air heating, maximizing the heat flux (and power generation) from the TEG modules. Preliminary testing demonstrated how adding insulation could significantly increase the measured temperature difference across a single TEG (See Figure 5) independent of the ducting configuration. The results from the preliminary test also indicate that the air duct could significantly impact the temperature gradient across the TEG, depending on the overall configuration. This justified inclusion of the air duct configuration as an optimizable factor in the research. Please see Figure 5 for details.
The six TEGs (40 mm × 40 mm each) and the single, large TEG (120 mm × 80 mm) were mounted on separate mild steel flat plates of identical thicknesses (2.5 mm). Temperature characterization tests were performed to determine matching temperatures on the hot side of the TEGs. The thermocouples were installed in shallow grooves cut in the steel plate and then filled with high-temperature thermally conductive paste (JB weld type). The temperature setting was controlled to ensure that the hot-side temperature never exceeded 120 °C. The TEGs were placed at the same geometric position on the plates, and the temperature data across the array of TEGs for selected points on the array are illustrated in Figure 6.
The model-DI 2008 data acquisition (DAQ) system with eight pairs was used to capture the data. Two pairs were used to measure the airspeed and TEG(s) output voltage. The remaining six pairs were used to capture the temperature data. Therefore, only the temperature data for three TEGs and three positions could be obtained from the single and multiple TEG arrays. To account for a proper temperature comparison for the two TEG types (six TEG arrays and the single, large TEG), TEGs 1, 2, and 3 of the multiple TEG arrays were selected due to the close temperature range. Since the temperature on the large TEG surface was essentially even, positions 1, 4, and 5 were chosen to provide a picture of the temperature distribution over the surface of the TEG while accounting for the comparison objective.
At the same time, Table 1 shows the hot-side temperature value for the measured points, highlighting a critical difference between the multi-TEG array and the single, large TEG: the range of measured temperatures at each setting was up to 12 °C on the six TEG arrays, but only 5 °C for the large TEG. As the rest of the configurations were identical, this suggests that the lateral conduction in the large TEG helped to balance out temperature variations in the plate.
The testing program used three levels (low, medium, and high) for the air velocity distributed by the diffuser. These corresponded to maximum velocities measured with pitot tubes with measurements of 9 m/s, 14 m/s, and 18 m/s. The pressure upstream of the diffuser was measured using a manometer device to ensure a constant air velocity distribution.
Three-factor levels were selected to measure the impact of the ducting configuration on TEG power: without air duct, 30 mm containment, and 55 mm containment. The levels were selected based on the results of the preliminary tests and to fit within a reasonable space in a combustor application. Figure 7 illustrates the different ducting configurations used.

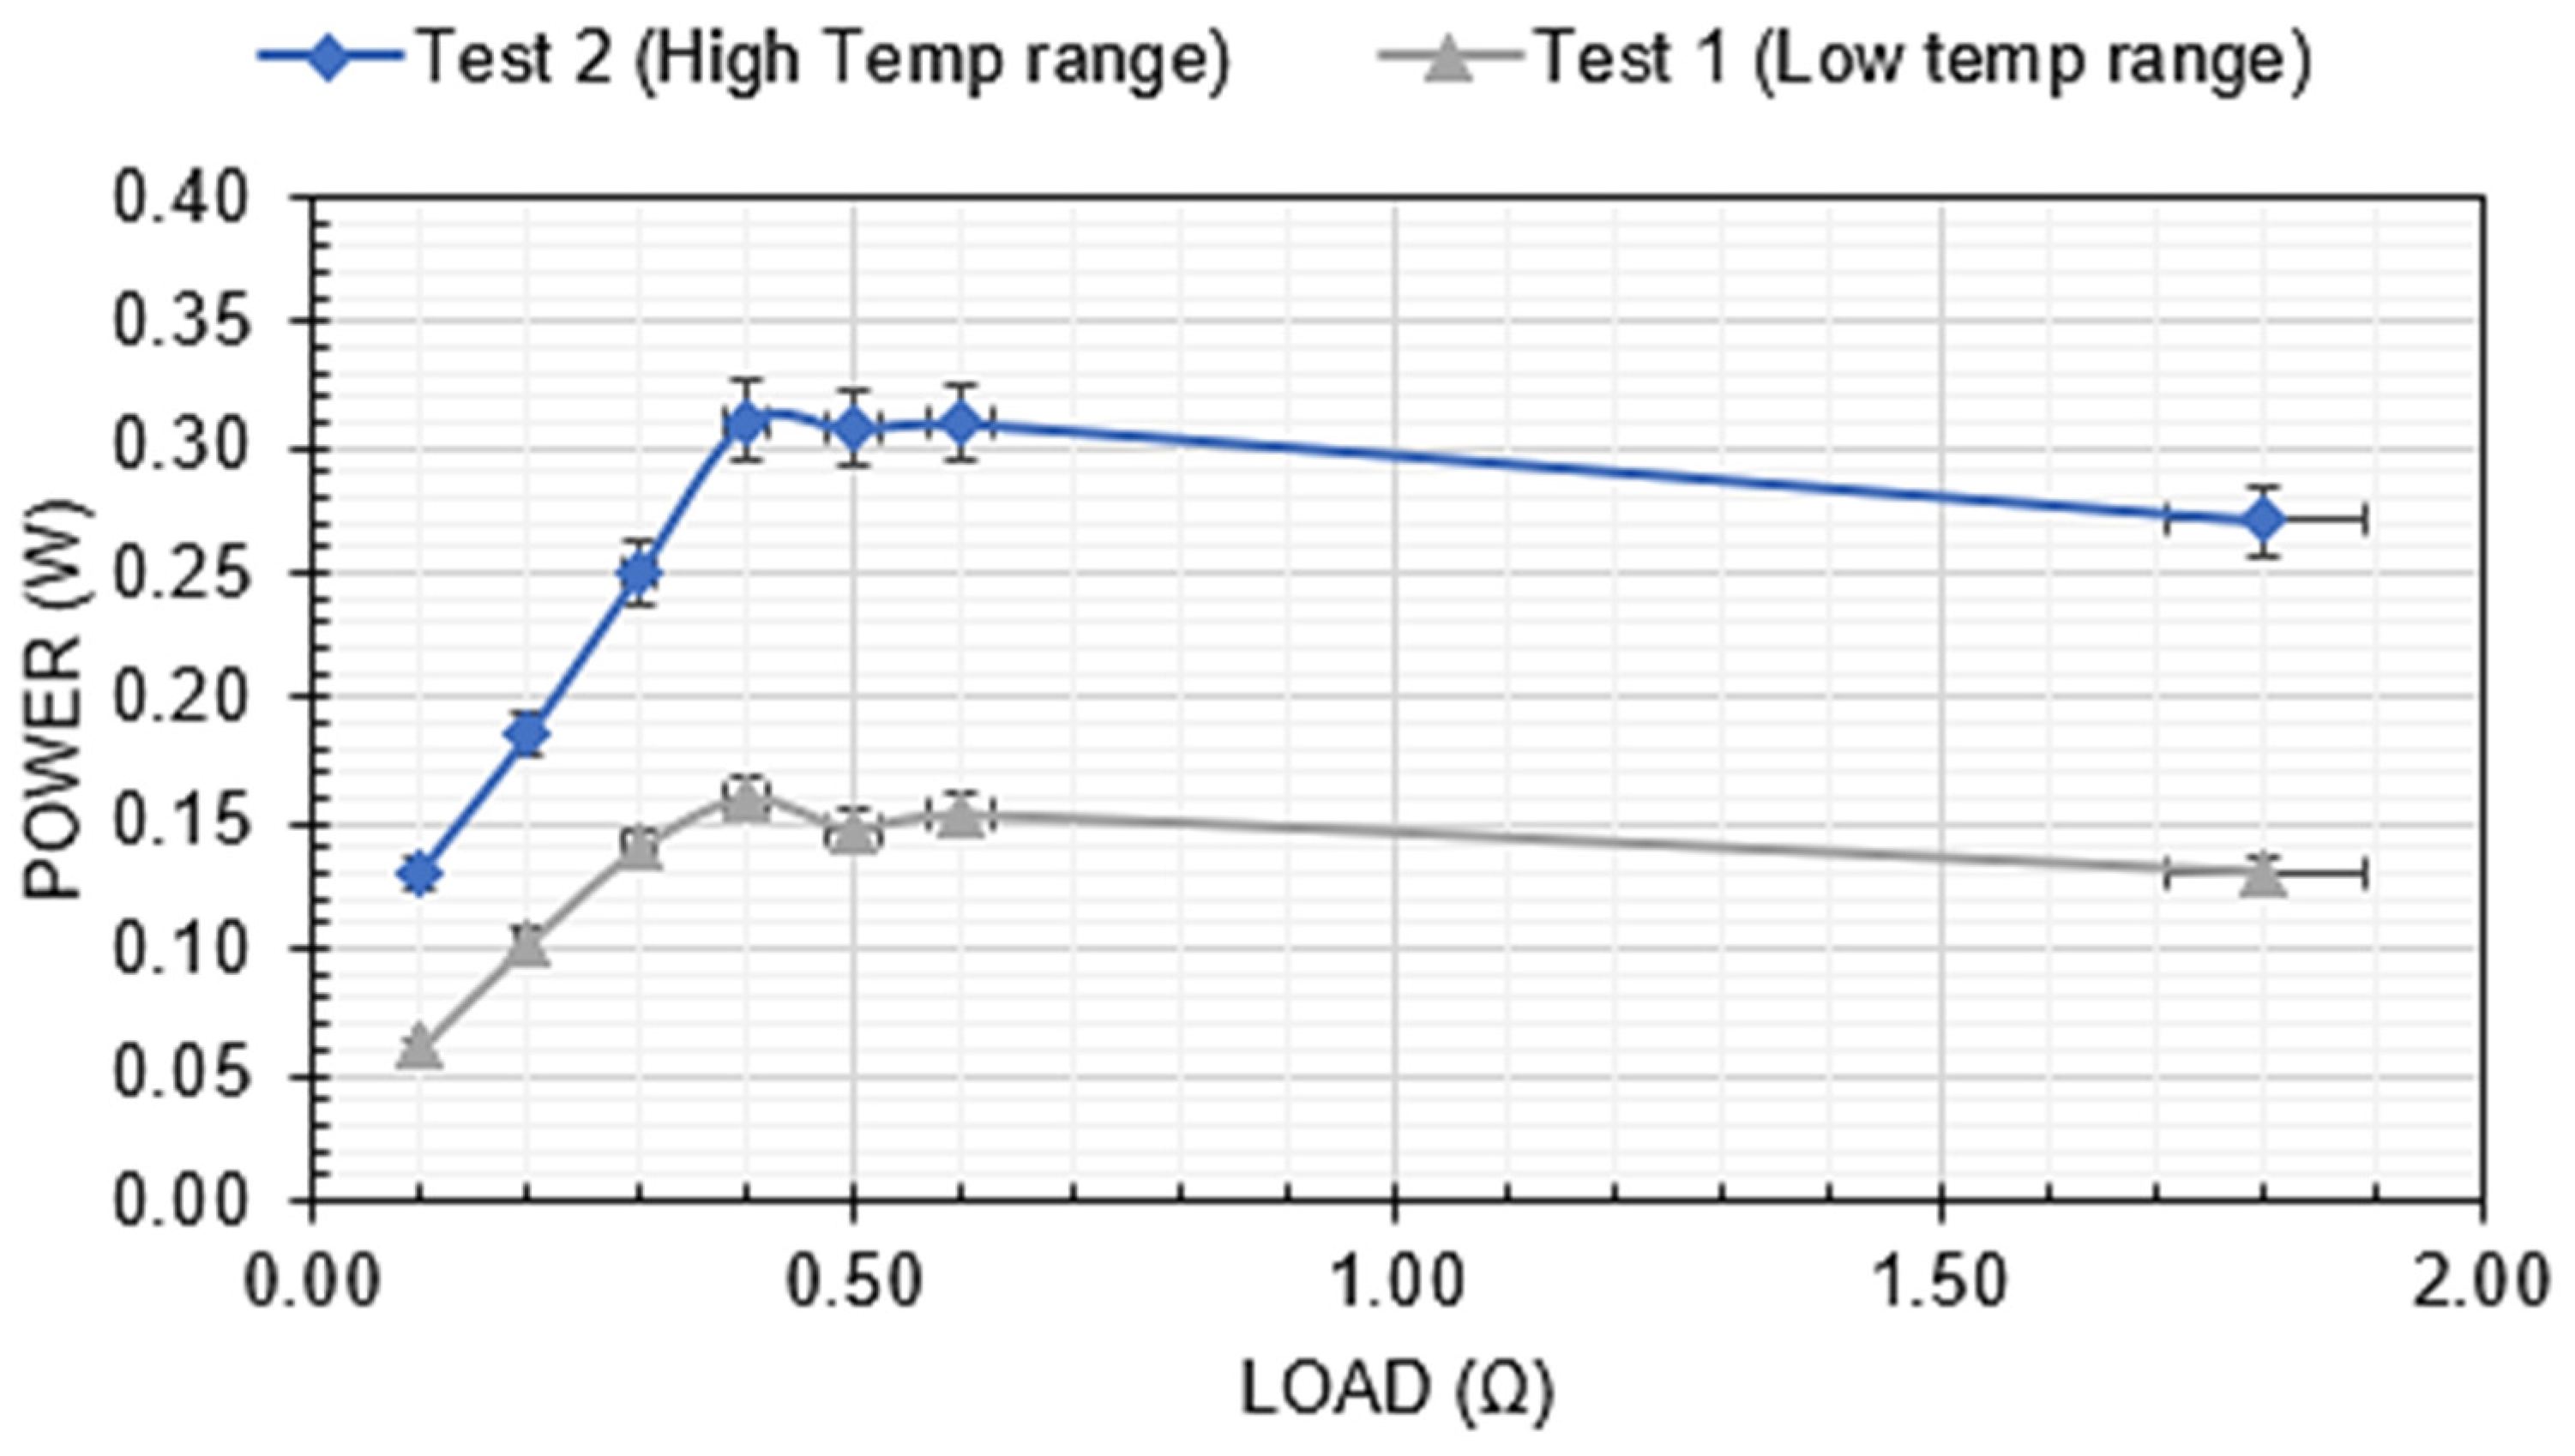
2.4. Establishing the Optimum Load

The internal resistances of the multi-TEG array and the single, large TEG were different. As a result, the optimum load to maximize the efficiency of the TEG was also different. The best efficiency points were assessed in a preliminary test for both TEG configurations. The individual TEGs were arranged in series for the multi-TEG array, leading to a relatively high optimal resistance, as shown in Figure 8. With its more prominent internal elements, the single, large TEG’s resistance was substantially smaller. This led to lower optimal resistance, as shown in Figure 9. For both TEG configurations, it is essential to note that the best-efficiency resistance curve is ‘flat’, such that a single resistance is likely to lead to a close-to-optimal power output independent of the details of the operating condition. The power output at two temperature levels as a function of load resistances were assessed for both the six TEG array (Figure 8) and the single, large TEG (Figure 9). In both cases, two temperature ranges were tested: a low temperature and a high temperature. These were in the range of 70–80 °C for the six TEG array and 90–100 °C for the large TEG. The results demonstrate that, as expected, the load resistance for peak efficiency is consistent at different temperature conditions.

3. Results and Discussions

A complete factorial design of experiments was used for the factors of airflow, hot surface temperature, and duct configuration. The design was repeated twice: once for the small TEG arrays and once for the single, large TEG.

3.1. L27 Orthogonal Table

The L27 orthogonal table type accounted for all possible combinations of factors and levels, with all interactions included in the experimental error. The testing sequence was randomized to eliminate experimental bias in the measurement order and ensure test independence. The L27 orthogonal table is presented in Table 2 for the six multiple TEGs and the single, large TEG showing the output power at an optimal load.
In Table 2, the three hot-side temperature and air speed levels, denoted as L, M, and H, correspond to low, medium, and high levels. Like the information in Table 1, L corresponds to the 70 °C range for the low-temperature level, M corresponds to the 90 °C range for the medium-temperature level, and H corresponds to the 120 °C max for the high-temperature level. Likewise, for the airspeed, the acronyms (L, M, and H) correspond to 9 m/s for low airspeed, 14 m/s for medium airspeed, and 18 m/s for the high airspeed.

3.2. Main Effects Results

The main effects influencing the dependent variable (power output) are the hot-side temperature, airspeed, and ducting configurations. To assess the impact of these factors on the output power, SPSS version 29 statistical software was used, and a multivariate test was performed to account for both the six TEGs and the single, large TEG. The hypothesis tests are stated below.
  • Null Hypothesis (HO) = The factors and levels of hot-side temperature, air speed, and the air duct configuration do not influence the power output.
  • Alternate Hypothesis (HA) = The factors and levels of hot-side temperature, air speed, and the air duct configuration influence the power output.
A significant value (p-value) of 0.05 was the basis of judgment. The null hypothesis was rejected for values less than 0.05; likewise, for p-values greater than 0.05, the null hypothesis was not rejected. The use of 0.05 as a suitable significant value is widely accepted and a standard choice for many statistical analyses [18,19,20], including three-factor ANOVA, providing justification to either reject or accept the null hypothesis.
The results from the ANOVA on the main factors are shown in Table 3. The model fits well with the measured data for multiple small and single, large TEG configurations. R2 values were >0.96 in all cases, and the experimental error was small. The experimental error in Table 3 incorporates both the random variation in the measurements and any interaction effects between the individual factors. The error term is small, indicating that the treatment variables (factors) can fully explain the observed variations in the dependent variable (the output power).
To check for any interaction in the experiments, the results were analyzed for three groups: interaction between the temperature and the ducting configuration, interaction between airspeed and ducting configuration, and the interaction between temperature and air speed. The result shows that only the interaction between temperature and air speed is significant, with p-values of less than 0.05. The p-values for the remaining interaction terms (temperature vs. ducting configuration and airspeed vs. ducting configuration) were above 0.05, suggesting no significant interest between the factors.

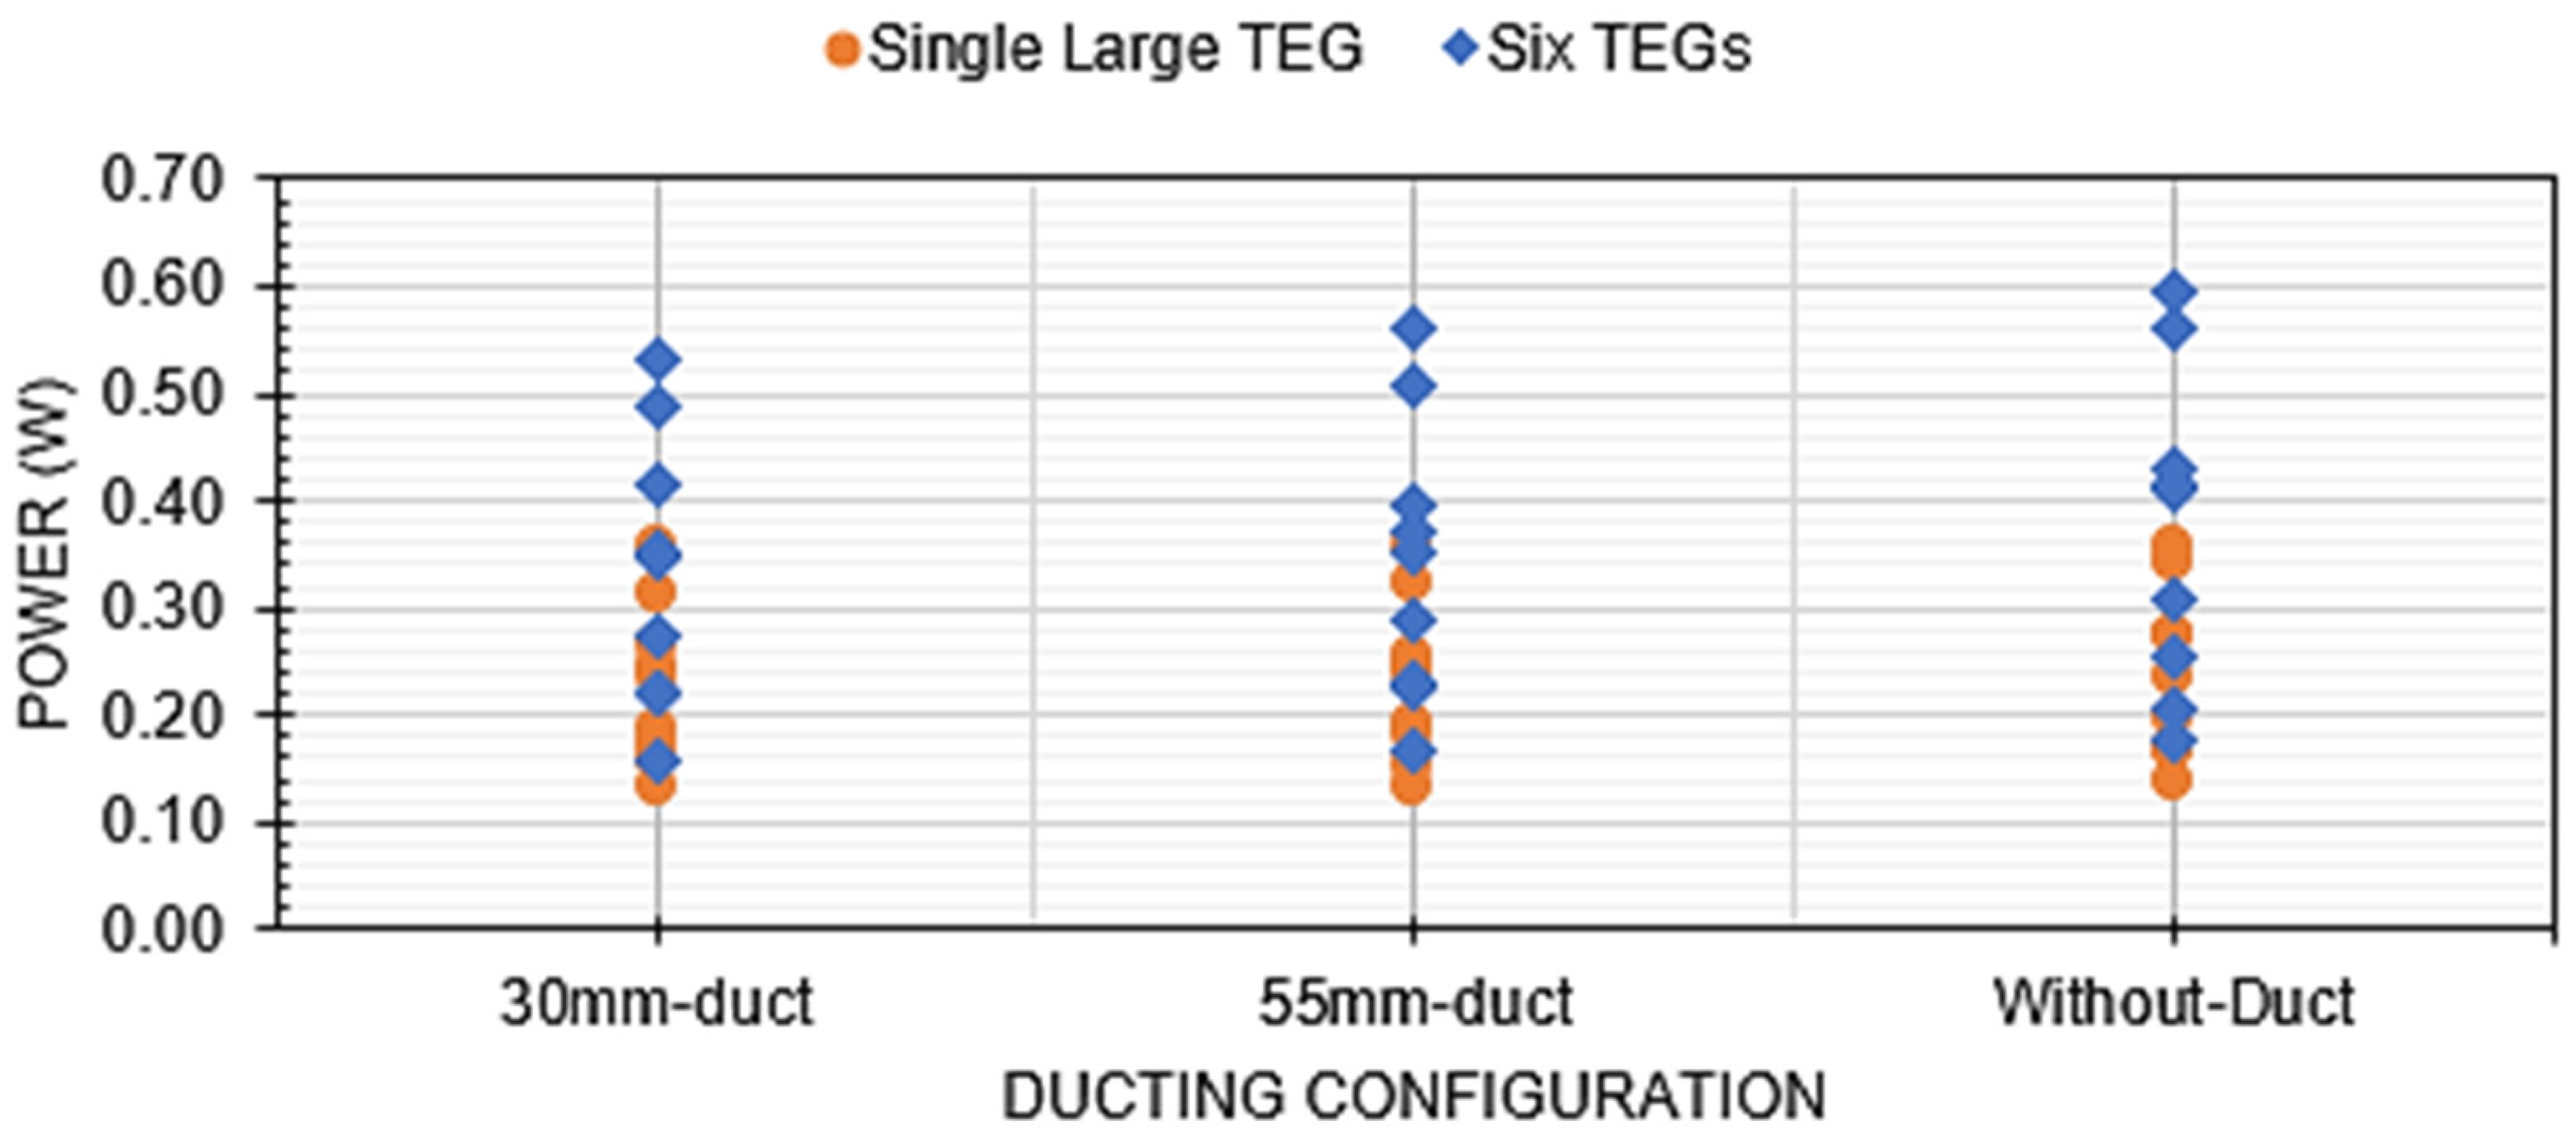
3.2.1. Results Comparison for Single versus Multiple TEG Arrays

The objective of this work was to compare the performance of multiple TEGs to that of a single TEG of the same geometric footprint to determine if the TEGs possessed the same sensitivity to similar operating conditions. The L27 table used in the design of experiments (DOEs) allowed for a combination of the different factor levels, with the power output used as the basis of comparison, and the result shows that both TEG types possess similar sensitivity to temperature changes. As expected, increasing the supply (hot-side) temperature increases the power output from the TEGs, as shown in Figure 10.
The second main factor to assess was sensitivity to airspeed. The results show that both TEG types possess similar sensitivity to airspeed changes. Increasing the airflow increases the power output, as shown in Figure 11. This is expected, as a higher airflow will be more effective at rejecting heat from the heat sinks, reducing the cold-side temperature of the TEGs, and increasing the power output. Interestingly, the increase in power from the medium to the high-velocity case is slight, suggesting that further increases in the airspeed would not significantly improve TEG performance for either the small TEG arrays or the single, large-format configuration.
The ducting configuration was the third factor that also showed a significant effect on the power output. The ANOVA results suggested that the two TEG configurations possessed different sensitivities to duct-type changes. In the case of the six TEGs, constraining the flow by including a duct reduced the power output. This is shown in Figure 12, where it is apparent that, while the ducting effect may be statistically significant, its magnitude is small compared to the impacts of temperature and airflow. A similar result is seen for the single, large TEG, where the variations are also more minor, but no differences are statistically significant in this case. This is an exciting result, as the hypothesis that restricting airflow past the fins would significantly impact heat rejection is thus not supported by the results.
In summary, the most significant power was obtained using the six small-sized TEGs (40 mm × 40 mm) in sharp contrast to the power from the large TEG with the same footprint. The total power from the six TEG array was about 0.6 watts, implying that, if the internal walls of the combustor are covered with 40 mm-sized TEGs, about 100 watts of power can be generated. However, to meet the cooling requirement, the testing suggested that the power to drive the fans will consume more power than is generated (estimated at 119 watts) to create sufficient airflow over the TEGs. This suggests that enhanced free convection based on the chimney effect or other methods of generating cooling airflow needs to be established to make this configuration viable.

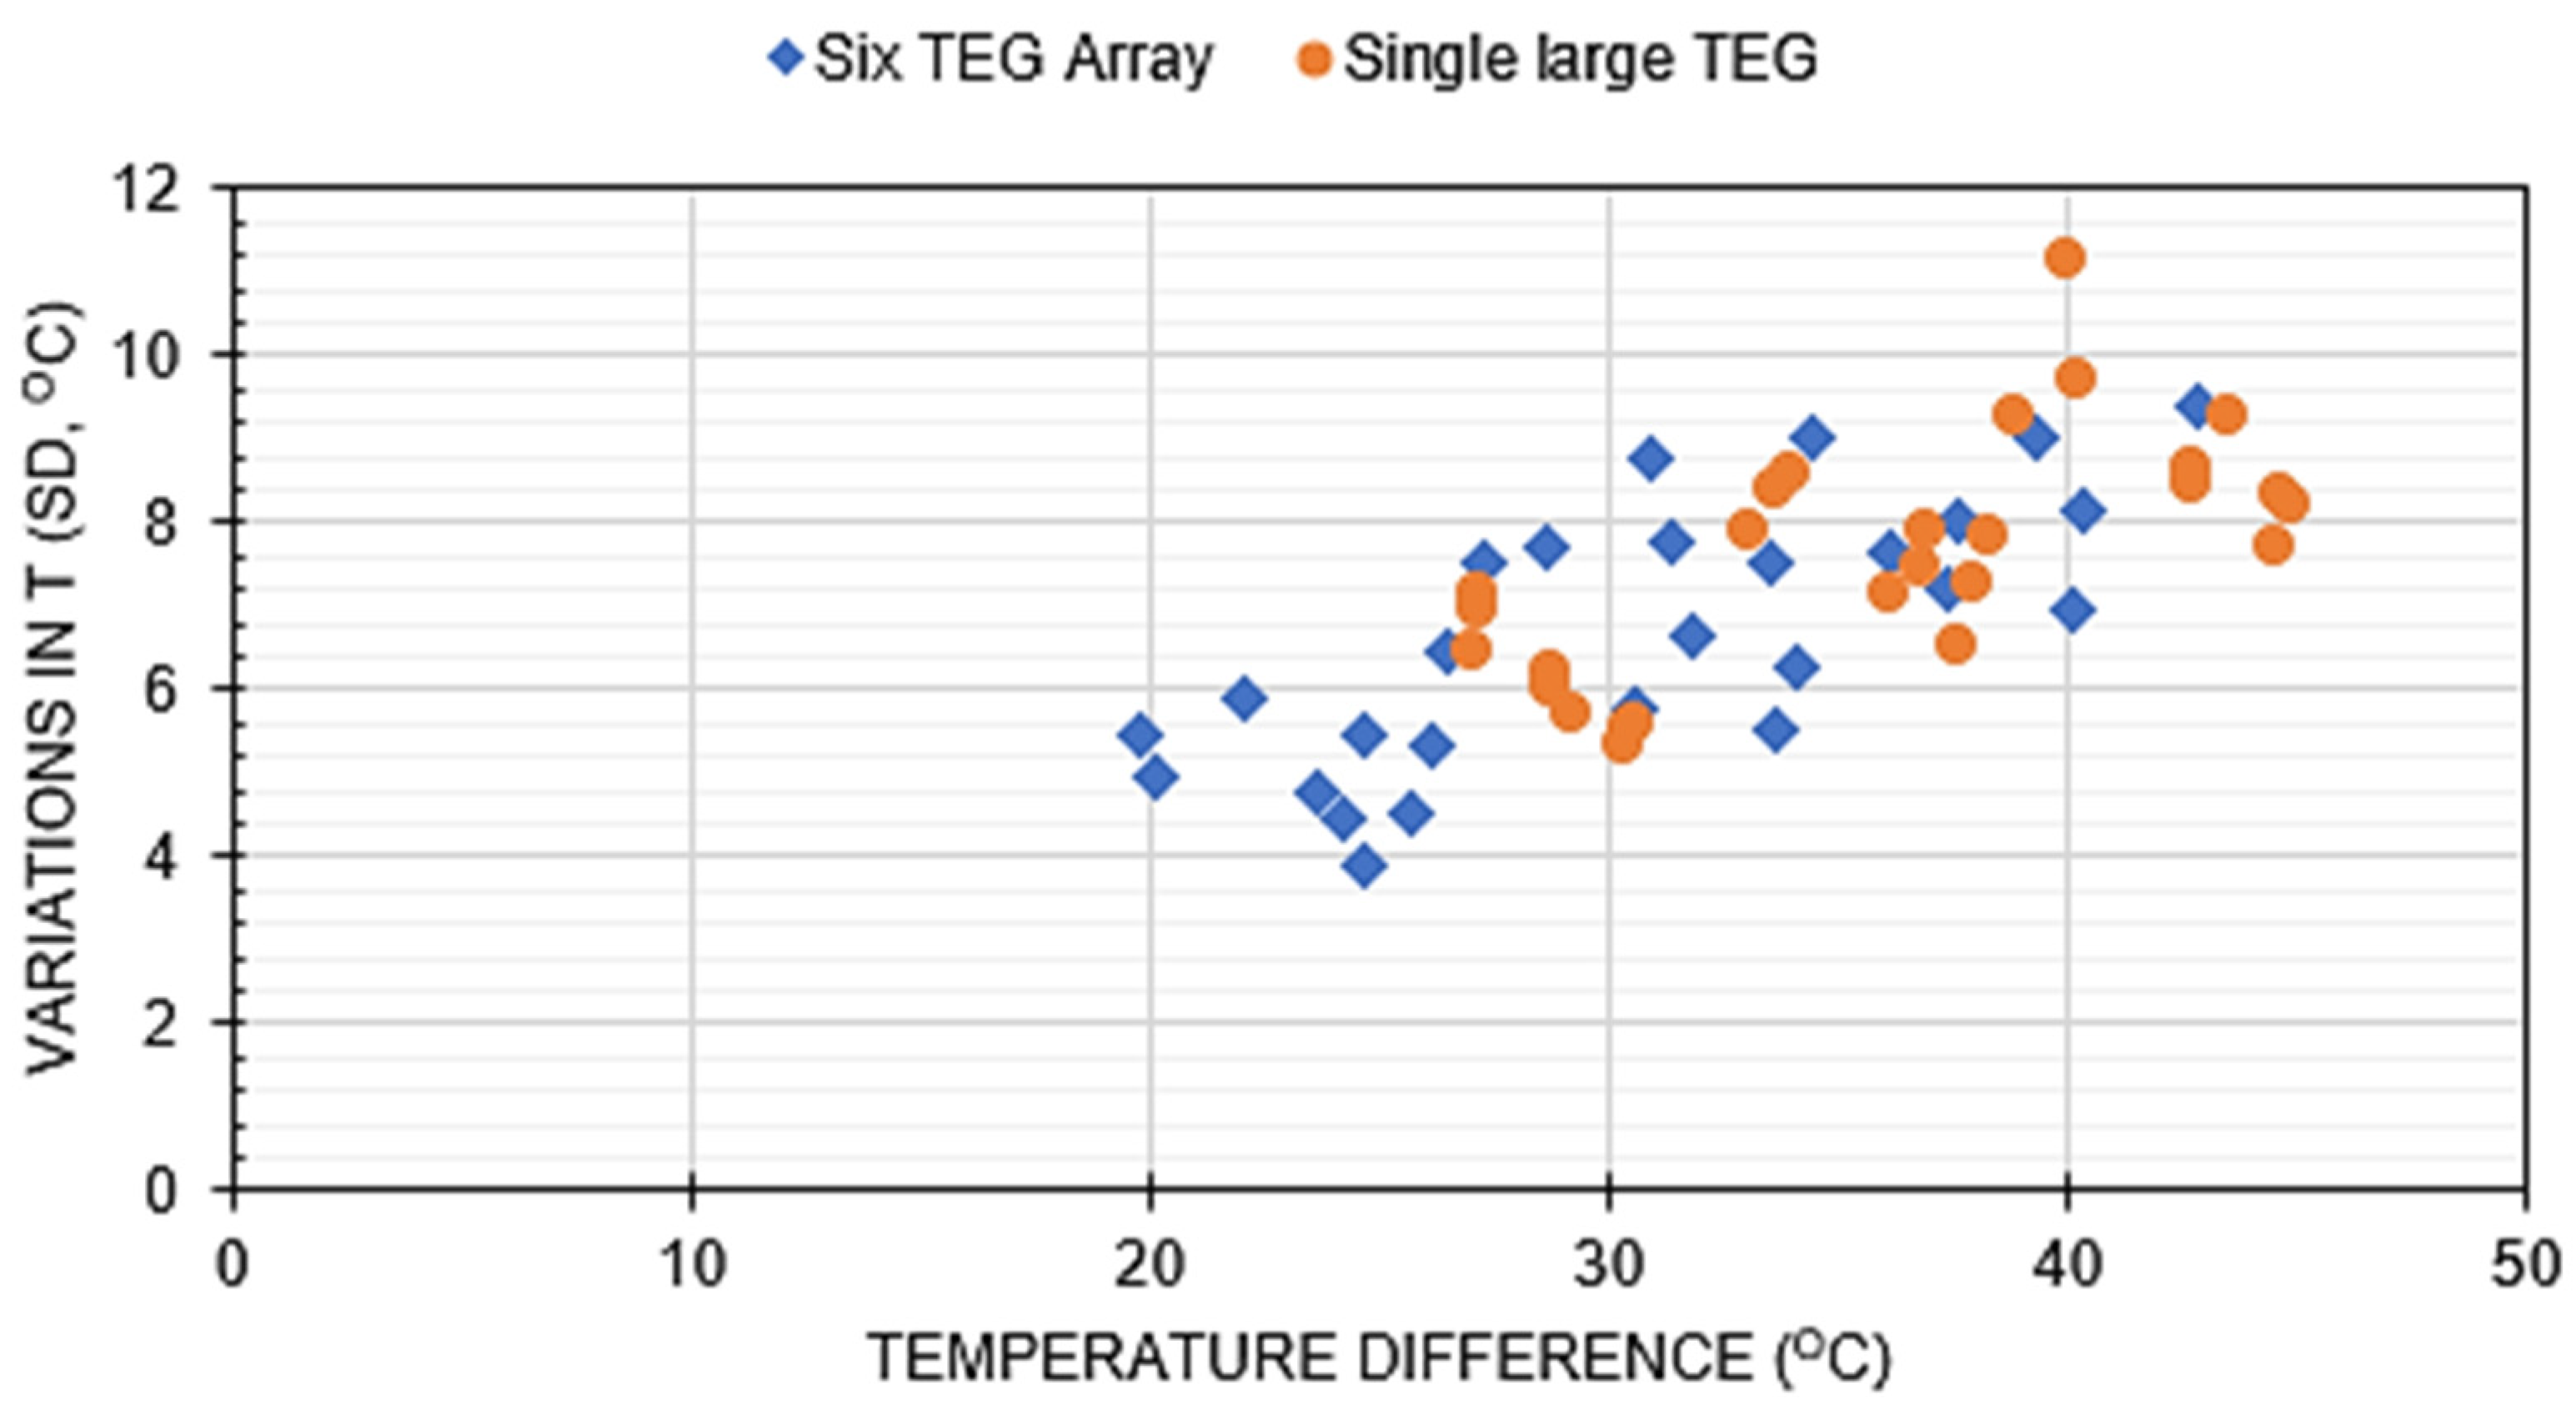
3.2.2. Further Comparison

The performance of a TEG is directly dependent on the temperature difference between its hot and cold sides. Table 4 details the temperature differences for the six TEGs and the single large TEG across the 27 tests of the Taguchi table. These results are summarized in Figure 13 and Figure 14, and clearly illustrate a key finding: the large TEG, while generating a higher temperature difference, also yields a lower power output than the six multiple-connected TEGs. Interestingly, the temperature difference variations were similar for both configurations, with higher variances observed at higher temperatures.
The observed variations in power between the large and small TEGs are primarily attributable to the larger cross-sectional area of the P-N junctions in the large TEG. From a heat transfer perspective, the large surface area of the large TEG amounts to a lower thermal resistance and higher thermal conductivity than the smaller TEGs. Likewise, the power from the multiple TEGs is because the total number of P-N junctions of the six TEGs was higher than that of the large TEG, and implies that more energy can be extracted in contrast to the large TEG with a smaller number of junctions. As Equation (3) shows, the cross-sectional area of a TEG P-N junction will determine the thermal resistance and eventually influence the temperature difference of the TEG. However, the quantity of power extractable from a TEG is a function of the number of P-N junctions. Hence, an optimal TEG design will maximize the number of P-N junctions with low thermal resistance.
To better understand the differences in TEG performance, the resistance of the TEGs was measured using a high-precision ohmmeter. The large TEG was measured to have an internal resistance of 0.363 Ω, while each of the single 40 mm × 40 mm TEGs was measured to have a resistance of 1.2 Ω, for a total of 7.2 Ω when six were arrayed in series. To improve the performance of the large TEG, the sizing of the individual P-N junctions should be reduced while their number is increased. This is possible but poses challenges for manufacturing and thermal design that need further assessment.

4. Conclusions

This study investigates the differences between a single, large TEG and an array of smaller TEGs in a biomass-based space heating application. The results demonstrate the primary influence of the hot-side temperature on the overall power output from a TEG in a vertical configuration with a parallel flow of air over a heat sink. The airspeed was also statistically significant and influenced the output power. The structure of any ducting to direct the cold-side air flow was found to have a marginal impact on power generation.
The large TEG produced less power for a given temperature difference than the array of six small TEGs with the same overall footprint. This is attributed to the larger cross-sectional area of the P-N junctions in the large TEG, which reduced electrical resistance and limited the potential power that could be generated. The total heat transfer rate was similar for the small and large TEG arrays for a similar hot surface temperature, and considerable benefits emerged from incorporating a large-scale TEG. Still, sub-optimal P-N junction sizing will limit its effectiveness. Therefore, a large TEG with an optimized number of P-N junction elements and sizes would be needed to be competitive.
Overall, the power obtained from the TEGs (both types) was low due to generally poor heat rejection from the cold sides of the TEGs. The forced airflow past a finned surface could not generate a sizeable thermal gradient, and despite a hot-side temperature of 120 °C, the temperature gradient across the TEGs never exceeded 50 °C.
Therefore, while the results of the study provide useful insights into the use of TEGs on a space heating combustor, the study was limited by the size of the test system, which did not allow for an evaluation of the “chimney effect” to increase air flow and supplement the forced convection cooling. The study also highlighted the limitations of air cooling, even with forced convection, to reject heat from the TEGs. In the future, the evaluation of water as a heat transfer medium on the cold side of the TEGs would allow for an assessment of alternative approaches. Finally, the TEGs used in the work were procured from existing suppliers. The development of custom TEGs that kept the same P-N junction cross-sectional areas, but with different overall footprints, would potentially overcome some of the restrictions on performance reported in this work.

Author Contributions

Conceptualization, G.M.-C. and U.C.; methodology, G.M.-C. and U.C.; software, U.C.; formal analysis, U.C.; investigation, U.C.; resources, G.M.-C.; data curation, U.C.; writing—original draft preparation, U.C.; writing—review and editing, G.M.-C.; visualization, U.C.; supervision, G.M.-C.; funding acquisition, G.M.-C. All authors have read and agreed to the published version of the manuscript.

Funding

This research was funded by Mitacs’ Accelerate program in collaboration with Demizine Inc. (IT26579) and by the Natural Science and Engineering Research Council of Canada’s Discovery grant program (RGPIN-02960).

Data Availability Statement

The data used to support the reported results are available from the corresponding author upon reasonable request.

Acknowledgments

The authors acknowledge the technical support and guidance of the team at Demizine and Ingenious Holdings Inc.

Conflicts of Interest

The authors declare no conflicts of interest.

Abbreviations

The symbols used in this work are listed below.
TEGThermoelectric Generator
ANOVAAnalysis of Variance
DOEsDesign of Experiments
PCMsPhase Change Materials
ZTThermoelectric Figure of Merit
DTTemperature Difference
SSeebeck Coefficient
S/SSamples per Second
DAQData Acquisition

References

  1. Kane, A.; Verma, V.; Singh, B. Temperature dependent analysis of thermoelectric module using Matlab/SIMULINK. In Proceedings of the 2012 IEEE International Conference on Power and Energy (PECon), Kota Kinabalu, Malaysia, 2–5 December 2012; pp. 632–637. [Google Scholar] [CrossRef]
  2. Beretta, D.; Neophytou, N.; Hodges, J.M.; Kanatzidis, M.G.; Narducci, D.; Gonzalez, M.M.; Beekman, M.; Balke, B.; Cerretti, G.; Tremel, W.; et al. Thermoelectrics: From history, a window to the future. Mater. Sci. Eng. R Rep. 2019, 138, 100501. [Google Scholar] [CrossRef]
  3. Jouhara, H.; Żabnieńska-Gńra, A.; Khordehgah, N.; Doraghi, Q.; Ahmad, L.; Norman, L.; Axcell, B.; Wrobel, L.; Dai, S. Thermoelectric generator (TEG) technologies and applications. Int. J. Thermofluids 2021, 9, 100063. [Google Scholar] [CrossRef]
  4. Mal, R.; Prasad, R.; Vijay, V.K. Multi-functionality clean biomass cookstove for off-grid areas. Process. Saf. Environ. Prot. 2016, 104, 85–94. [Google Scholar] [CrossRef]
  5. Champier, D.; Bédécarrats, J.P.; Kousksou, T.; Rivaletto, M.; Strub, F.; Pignolet, P. Study of a TE (thermoelectric) generator incorporated in a multifunction wood stove. Energy 2011, 36, 1518–1526. [Google Scholar] [CrossRef]
  6. Khan, Z.; Khan, Z.; Ghafoor, A. A review of performance enhancement of PCM based latent heat storage system within the context of materials, thermal stability and compatibility. Energy Convers. Manag. 2016, 115, 132–158. [Google Scholar] [CrossRef]
  7. Mižáková, J.; Piteľ, J.; Hošovský, A.; Pavlenko, I.; Ochowiak, M.; Khovanskyi, S. Biomass Combustion Control in Small and Medium-Scale Boilers Based on Low Cost Sensing the Trend of Carbon Monoxide Emissions. Processes 2021, 9, 2030. [Google Scholar] [CrossRef]
  8. Lyubomirsky, I.; Lyakhovitskaya, V.; Guillemoles, J.F.; Riess, I.; Triboulet, R.; Cahen, D. Evidence for thermodynamically stable p/n junc-tion, formed by Ag doping of (Hg,Cd)Te. J. Cryst. Growth 1996, 161, 90–93. [Google Scholar] [CrossRef]
  9. Kondaguli, R.S.; Malaji, P.V. Geometry design and performance evaluation of thermoelectric generator. Eur. Phys. J. Spec. Top. 2022, 231, 1587–1597. [Google Scholar] [CrossRef]
  10. Terasaki, I. 1.09—Thermal Conductivity and Thermoelectric Power of Semiconductors. In Comprehensive Semiconductor Science and Technology; Bhattacharya, P., Fornari, R., Kamimura, H., Eds.; Elsevier: Amsterdam, The Netherlands, 2011; pp. 326–358. [Google Scholar] [CrossRef]
  11. Schwurack, R.; Bärschneider, J.; Unz, S.; Beckmann, M. Performance enhancement of a thermoelectric system with improved natural convection cooling by utilizing the chimney effect. Energy Convers. Manag. 2021, 237, 114118. [Google Scholar] [CrossRef]
  12. Susanto, F.; Salim, A.T.A.; Romandoni, N.; Wahyudi, N.; Indarto, B.; Junaedi, Z.M.A.; Basyar, K.A.; Furqan, J.A.; Putra, G.A.B. Application of Thermoelectric Generator TEG Type Parallel Series Electric Circuit Produces Electricity from Heat Rocket Stove. J. Phys. Conf. Ser. 2021, 1845, 012036. [Google Scholar] [CrossRef]
  13. Karami, N.; Moubayed, N. New modeling approach and validation of a thermoelectric generator. In Proceedings of the 2014 IEEE 23rd International Symposium on Industrial Electronics (ISIE), Istanbul, Turkey, 1–4 June 2014; pp. 586–591. [Google Scholar] [CrossRef]
  14. Liang, G.; Zhou, J.; Huang, X. Analytical model of parallel thermoelectric generator. Appl. Energy 2011, 88, 5193–5199. [Google Scholar] [CrossRef]
  15. Bayendang, N.P.; Kahn, M.T.; Balyan, V. Thermoelectric Generators (TEGs) and Thermoelectric Coolers (TECs) Modeling and Optimal Operation Points Investigation. Adv. Sci. Technol. Eng. Syst. J. 2022, 7, 60–78. [Google Scholar] [CrossRef]
  16. Barry, M.M. Analytical and Experimental Studies of Thermoelectric Devices and Materials. Ph.D. Thesis, University of Pittsburgh, Pittsburgh, PA, USA, 2016. Available online: https://www.proquest.com/docview/1844067912/abstract/91d65fac3a12441apq/1 (accessed on 27 November 2023).
  17. Siddiqui, F. Study of TEG When Connected in Series and Parallel Combinations Along with a DC-DC Converter. 2017. Available online: https://www.semanticscholar.org/paper/Study-of-TEG-When-Connected-in-Series-and-Parallel-Siddiqui/1943778b09f0e88269a469e29fe5167e4f6ded18 (accessed on 16 May 2024).
  18. Terzioğlu, H. Analysis of effect factors on thermoelectric generator using Taguchi method. Measurement 2020, 149, 106992. [Google Scholar] [CrossRef]
  19. Chen, W.-H.; Uribe, M.C.; Luo, D.; Jin, L.; Saw, L.H.; Lamba, R. Taguchi optimization and analysis of variance for thermoelectric generators with forced convection air cooling. Appl. Therm. Eng. 2023, 231, 120878. [Google Scholar] [CrossRef]
  20. Shende, D.M.D.; Sarje, D.S.H.; Borse, D.S.L.; Joshi, D.S.P. Thermal Performance of Radial Heat Sinks under Forced Convection. Eur. Chem. Bull. 2023, 12, 3674–3686. [Google Scholar]
  21. Chukwurah, U. Experimental Evaluation of the Performance of a Thermoelectric Generator Energy Recovery System in an Adapted Vertical Configuration. Master’s Thesis, SFU Summit Research Repository, Simon Fraser University, Burnaby, BC, Canada, 2024. [Google Scholar]
Figure 1. Schematic of a TEG showing the internal components and a basic set-up.
Energies 17 02562 g001
Figure 2. Biomass combustion space heater isometric view (left) and top cross-section (right) showing air ducts, TEGs, and integrated heat sinks. Air flow over the fins is vertical from the bottom to top of the combustor.
Energies 17 02562 g002
Figure 3. Showing the internal components of the large and small TEGs. The Large and small TEG images are at the same magnification.
Energies 17 02562 g003
Figure 4. CAD model of the test rig.
Energies 17 02562 g004
Figure 5. Temperature difference for the single TEG tests with and without thermal insulation.
Energies 17 02562 g005
Figure 6. Illustration of the six TEGs and single, large TEG orientations and data capture points. Dimensions a and b are 88 mm each.
Energies 17 02562 g006
Figure 7. Illustration of ducting configurations. The frontal view (A) shows the system without a duct, the top view (B) shows the 55 mm height spacing, and the top view (C) shows the 30 mm spacing case. Note that the spacing between the outer end of the fins and the duct is between 10 mm (for the 30 mm case) and 35 mm (for the 55 mm case): the confined space in the 30 mm case was selected to force as much air through the fins as possible. In comparison, the 55 mm case provides lower resistance to airflow, but a less direct flow through the fins.
Energies 17 02562 g007
Figure 8. Six TEG-array electrical power output vs. load resistance (performed without ducts and at a constant airflow rate for two temperature ranges).
Energies 17 02562 g008
Figure 9. Single, large TEG electrical power output vs. load resistance (performed without ducts and at a constant airflow rate for two temperature ranges).
Energies 17 02562 g009
Figure 10. Power output as a function of hot-side temperature set point for single and multiple TEG arrays. Data points include all combinations of duct geometry and air flow rate.
Energies 17 02562 g010
Figure 11. Power output vs. peak air speed at the three air-speed levels (L, M, and H) for single, large TEG and array of small TEGs. Data points include all temperatures and duct configurations. The three air speeds correspond to the L/M/H factors in the experimental design.
Energies 17 02562 g011
Figure 12. Power output for the three ducting configurations. The data points include all the temperatures and air flow rates.
Energies 17 02562 g012
Figure 13. Comparison of all data for the small and large TEGs. DT is the average differential temperature for all cases.
Energies 17 02562 g013
Figure 14. Standard deviation in temperature difference vs. the temperature difference across the TEGs, for the results shown in Table 4, comparing the single large, and multi-TEG configurations for all 27 conditions evaluated.
Energies 17 02562 g014
Table 1. Measured temperature values at each level (without a load and a constant airflow of 6.64 m/s).
Six TEGs AVG Hot Plate TemperatureLarge-Size TEG AVG Hot Plate Temperature
High (TEG 1, 2, 3)102 °C, 114 °C, 110 °CHigh (POS 1, 4, 5)107 °C, 104 °C, 109 °C
Medium (TEG 1, 2, 3)89 °C, 100 °C, 96 °CMedium (POS 1, 4, 5)95 °C, 93 °C, 97 °C,
Low (TEG 1, 2, 3)73 °C, 81 °C, 79 °CLow (POS 1, 4, 5)80 °C, 78 °C, 82 °C
Note: TEGs 1, 2, and 3 for the six TEGs, and POS 1, 4, and 5 for the large TEG were only used for the temperature characterization. In the ANOVA tests, TEGs 1, 4, and 5, and POS 1, 2, and 5 were used.
Table 2. The L27 randomized data.
RunHot-Side TempAir SpeedDucting TypePower at 30 Ω
(Six TEGS)
Power at 0.4 Ω
(Large TEG)
1HL30 mm0.350.24
2LL30 mm0.160.13
3MH55 mm0.400.26
4HLW/O duct0.420.27
5HL55 mm0.370.24
6LHW/O duct0.260.17
7LM55 mm0.230.15
8MMW/O duct0.410.24
9MH30 mm0.410.26
10LL55 mm0.170.13
11MLW/O duct0.310.20
12HH30 mm0.530.36
13ML55 mm0.290.19
14HM55 mm0.510.32
15HHW/O duct0.600.36
16LMW/O duct0.210.16
17ML30 mm0.270.18
18LH55 mm0.230.18
19MM30 mm0.350.24
20LLW/O duct0.180.14
21MHW/O duct0.430.27
22LM30 mm0.220.16
23HH55 mm0.560.36
24HM30 mm0.490.31
25MM55 mm0.350.24
26LH30 mm0.220.17
27HMW/O duct0.560.34
Note: The actual resistance values used for calculating the power outputs for the six TEGs were 30.025 Ω and 0.413 Ω for the single, large TEG. This was confirmed using the high-precision meter and was performed to minimize experimental errors in the measurements.
Table 3. ANOVA table for six TEGs and single, large TEG multivariate tests using SPSS V.29.
SourceDependent VariableType-III Sum of SquaresDfMean SquareFSig.
Corrected ModelSix TEG Avg. Power0.43460.07295.647<0.001
Large TEG Avg. Power0.13760.023102.896<0.001
InterceptSix TEG Avg. Power3.32213.3224391.626<0.001
Large TEG Avg. Power1.46711.4676620.891<0.001
Hot-Side TempSix TEG Avg. Power0.35320.176233.038<0.001
Large TEG Avg. Power0.11220.056253.127<0.001
Air SpeedSix TEG Avg. Power0.07420.03748.905<0.001
Large TEG Avg. Power0.02420.01254.415<0.001
Air Duct ConfigurationSix TEG Avg. Power0.00820.0044.9990.017
Large TEG Avg. Power0.00120.0001.1470.338
ErrorSix TEG Avg. Power0.015200.001
Large TEG Avg. Power0.004200.000
TotalSix TEG Avg. Power3.77127
Large TEG Avg. Power1.60927
Corrected TotalSix TEG Avg. Power0.44926
Large TEG Avg. Power0.14126
R Squared = 0.969 (Adjusted R Squared = 0.959)
R Squared = 0.966 (Adjusted R Squared = 0.956)
Note: The results in the ANOVA table are only for the analysis of the main effects of temperature, airspeed, and duct configuration.
Table 4. Table of temperature differences for the six TEGs and large TEG.
Six TEGsSingle, Large TEG
RunHot-Side Temp.Air SpeedAir DuctTEG 1 (°C)TEG 4
(°C)
TEG 5
(°C)
Power at 30 Ω (W)POS 1
(°C)
POS 2
(°C)
POS 5
(°C)
Power at 0.4 Ω (W)
1HL30 mm2333380.353235500.25
2LL30 mm1521240.162225340.13
3MH55 mm2738370.403235470.26
4HLW/O duct2438410.423337510.27
5HL55 mm2232390.373335530.25
6LHW/O duct2031270.262629360.17
7LM55 mm1826270.232426360.15
8MMW/O duct2539370.413035460.24
9MH30 mm2737370.413335450.26
10LL55 mm1421250.172224350.13
11MLW/O duct2032340.312731440.20
12HH30 mm3245430.533842530.36
13ML55 mm1929340.292830430.19
14HM55 mm2842420.513640530.32
15HHW/O duct3351450.603743540.36
16LMW/O duct1829270.212427360.17
17ML30 mm1928320.272730420.19
18LH55 mm2129280.232629370.18
19MM30 mm2433350.353134440.24
20LLW/O duct1525260.182225350.14
21MHW/O duct2843380.433236460.27
22LM30 mm1926270.222527360.16
23HH55 mm3147430.563843540.36
24HM30 mm2942410.493640520.31
25MM55 mm2435360.353135450.24
26LH30 mm2027270.222629360.17
27HMW/O duct2946430.563641540.35
Disclaimer/Publisher’s Note: The statements, opinions and data contained in all publications are solely those of the individual author(s) and contributor(s) and not of MDPI and/or the editor(s). MDPI and/or the editor(s) disclaim responsibility for any injury to people or property resulting from any ideas, methods, instructions or products referred to in the content.

