
A Study on the Plugging Effect of Different Plugging Agent Combinations during CO2 Flooding in Heterogeneous Reservoirs
 ,
,
Abstract
1. Introduction
2. Materials and Methods
2.1. Experimental Materials
2.2. Experimental Methods
- (1)
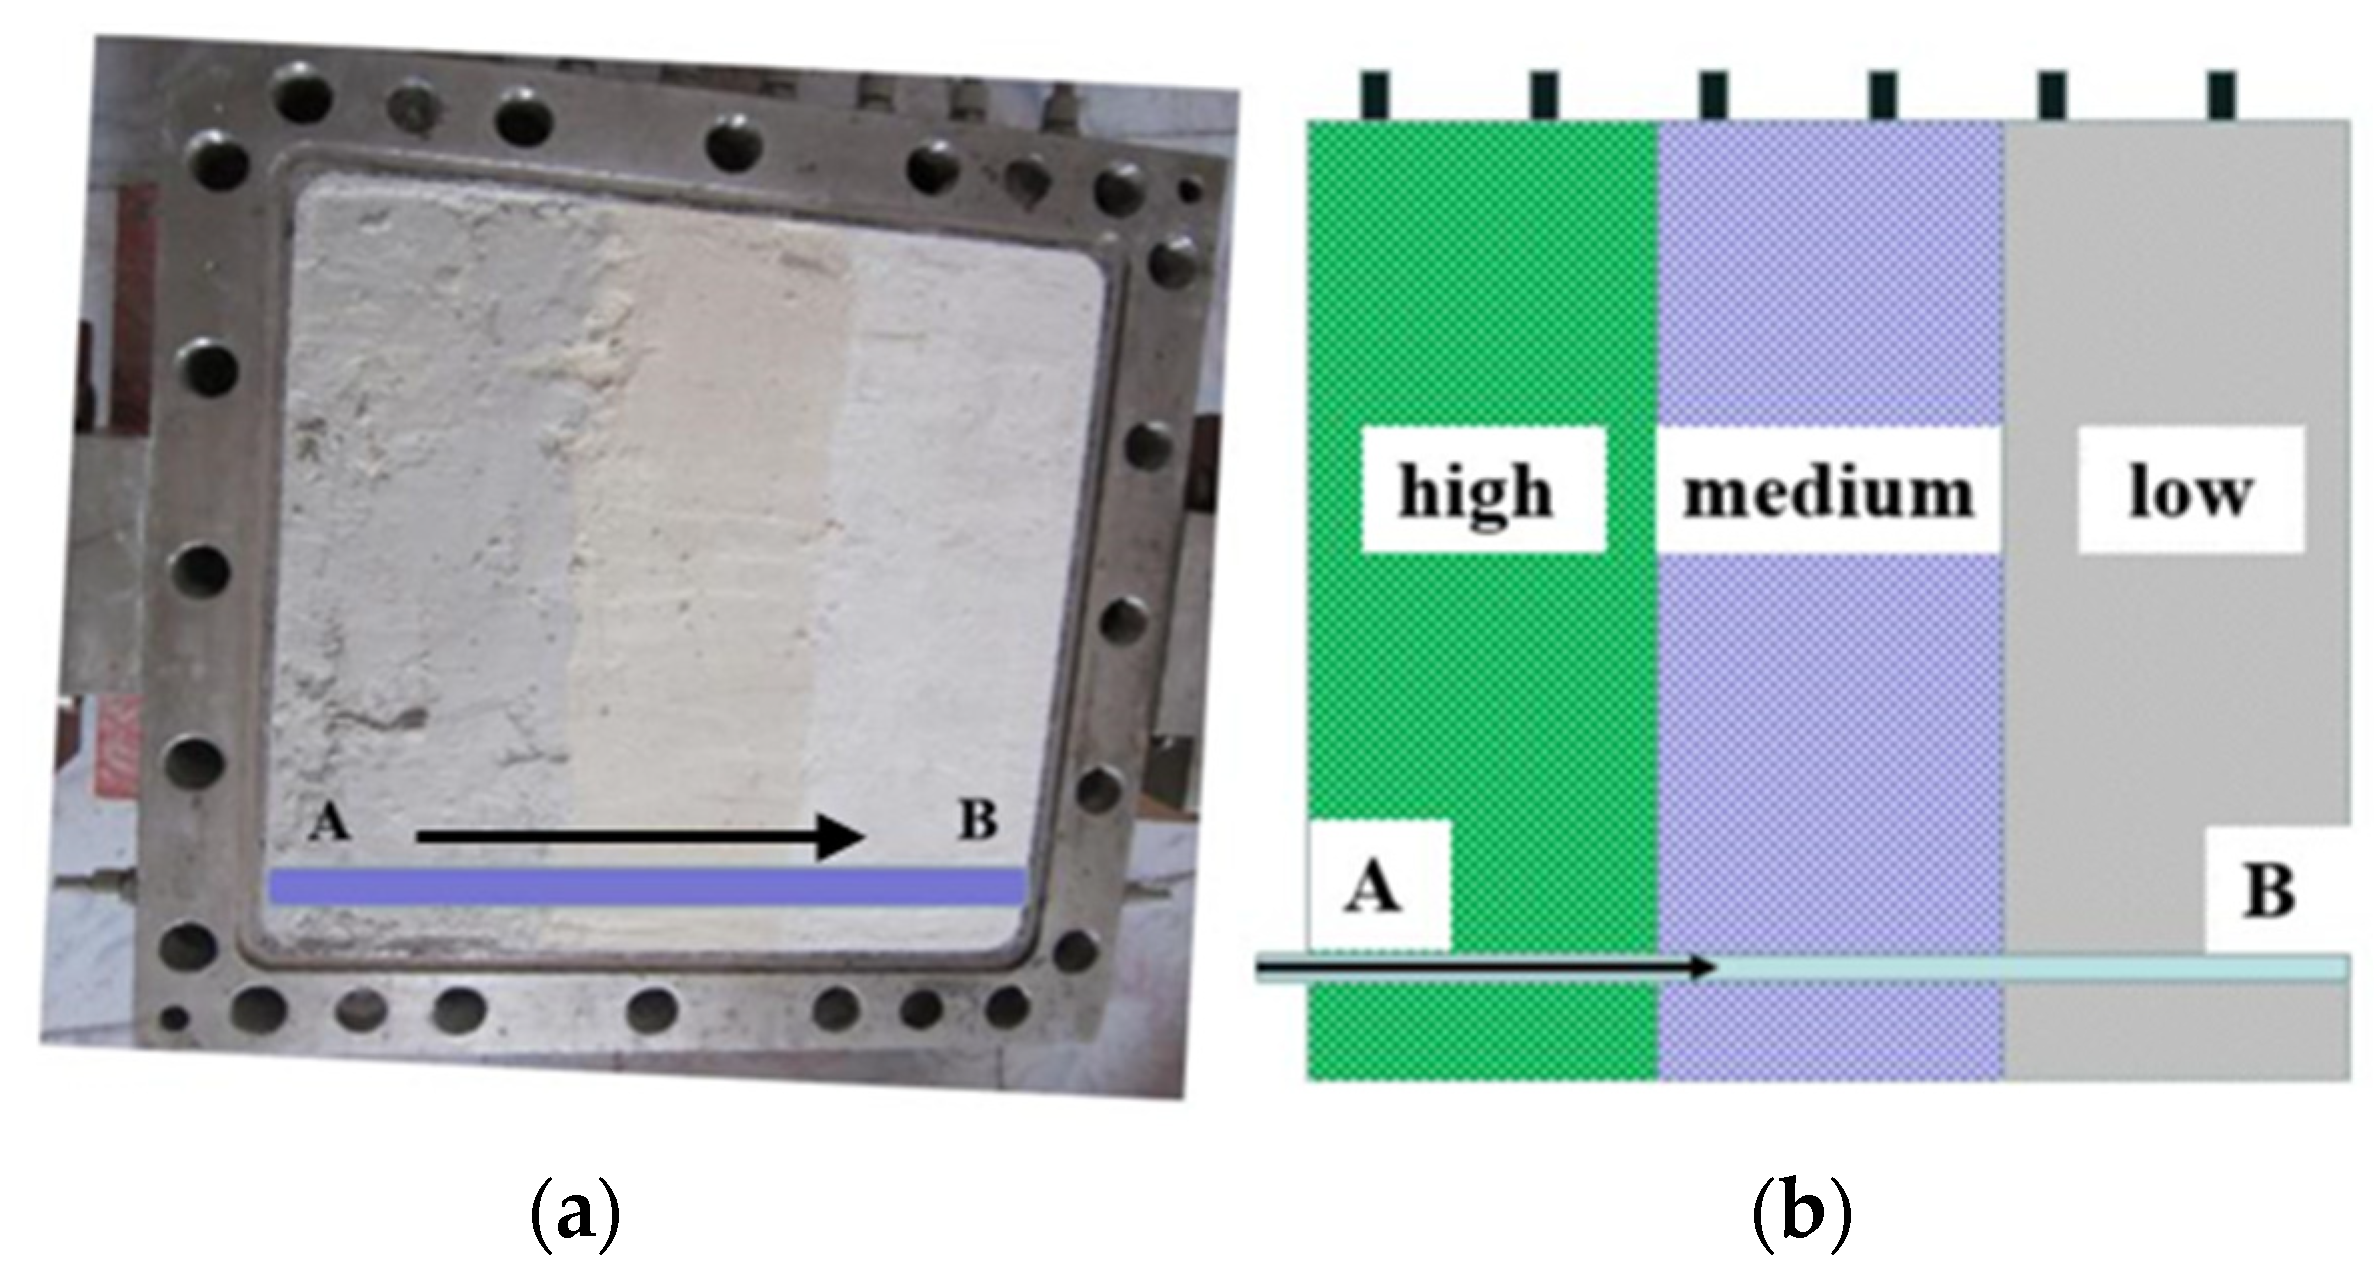
- Model establishment
- (2)
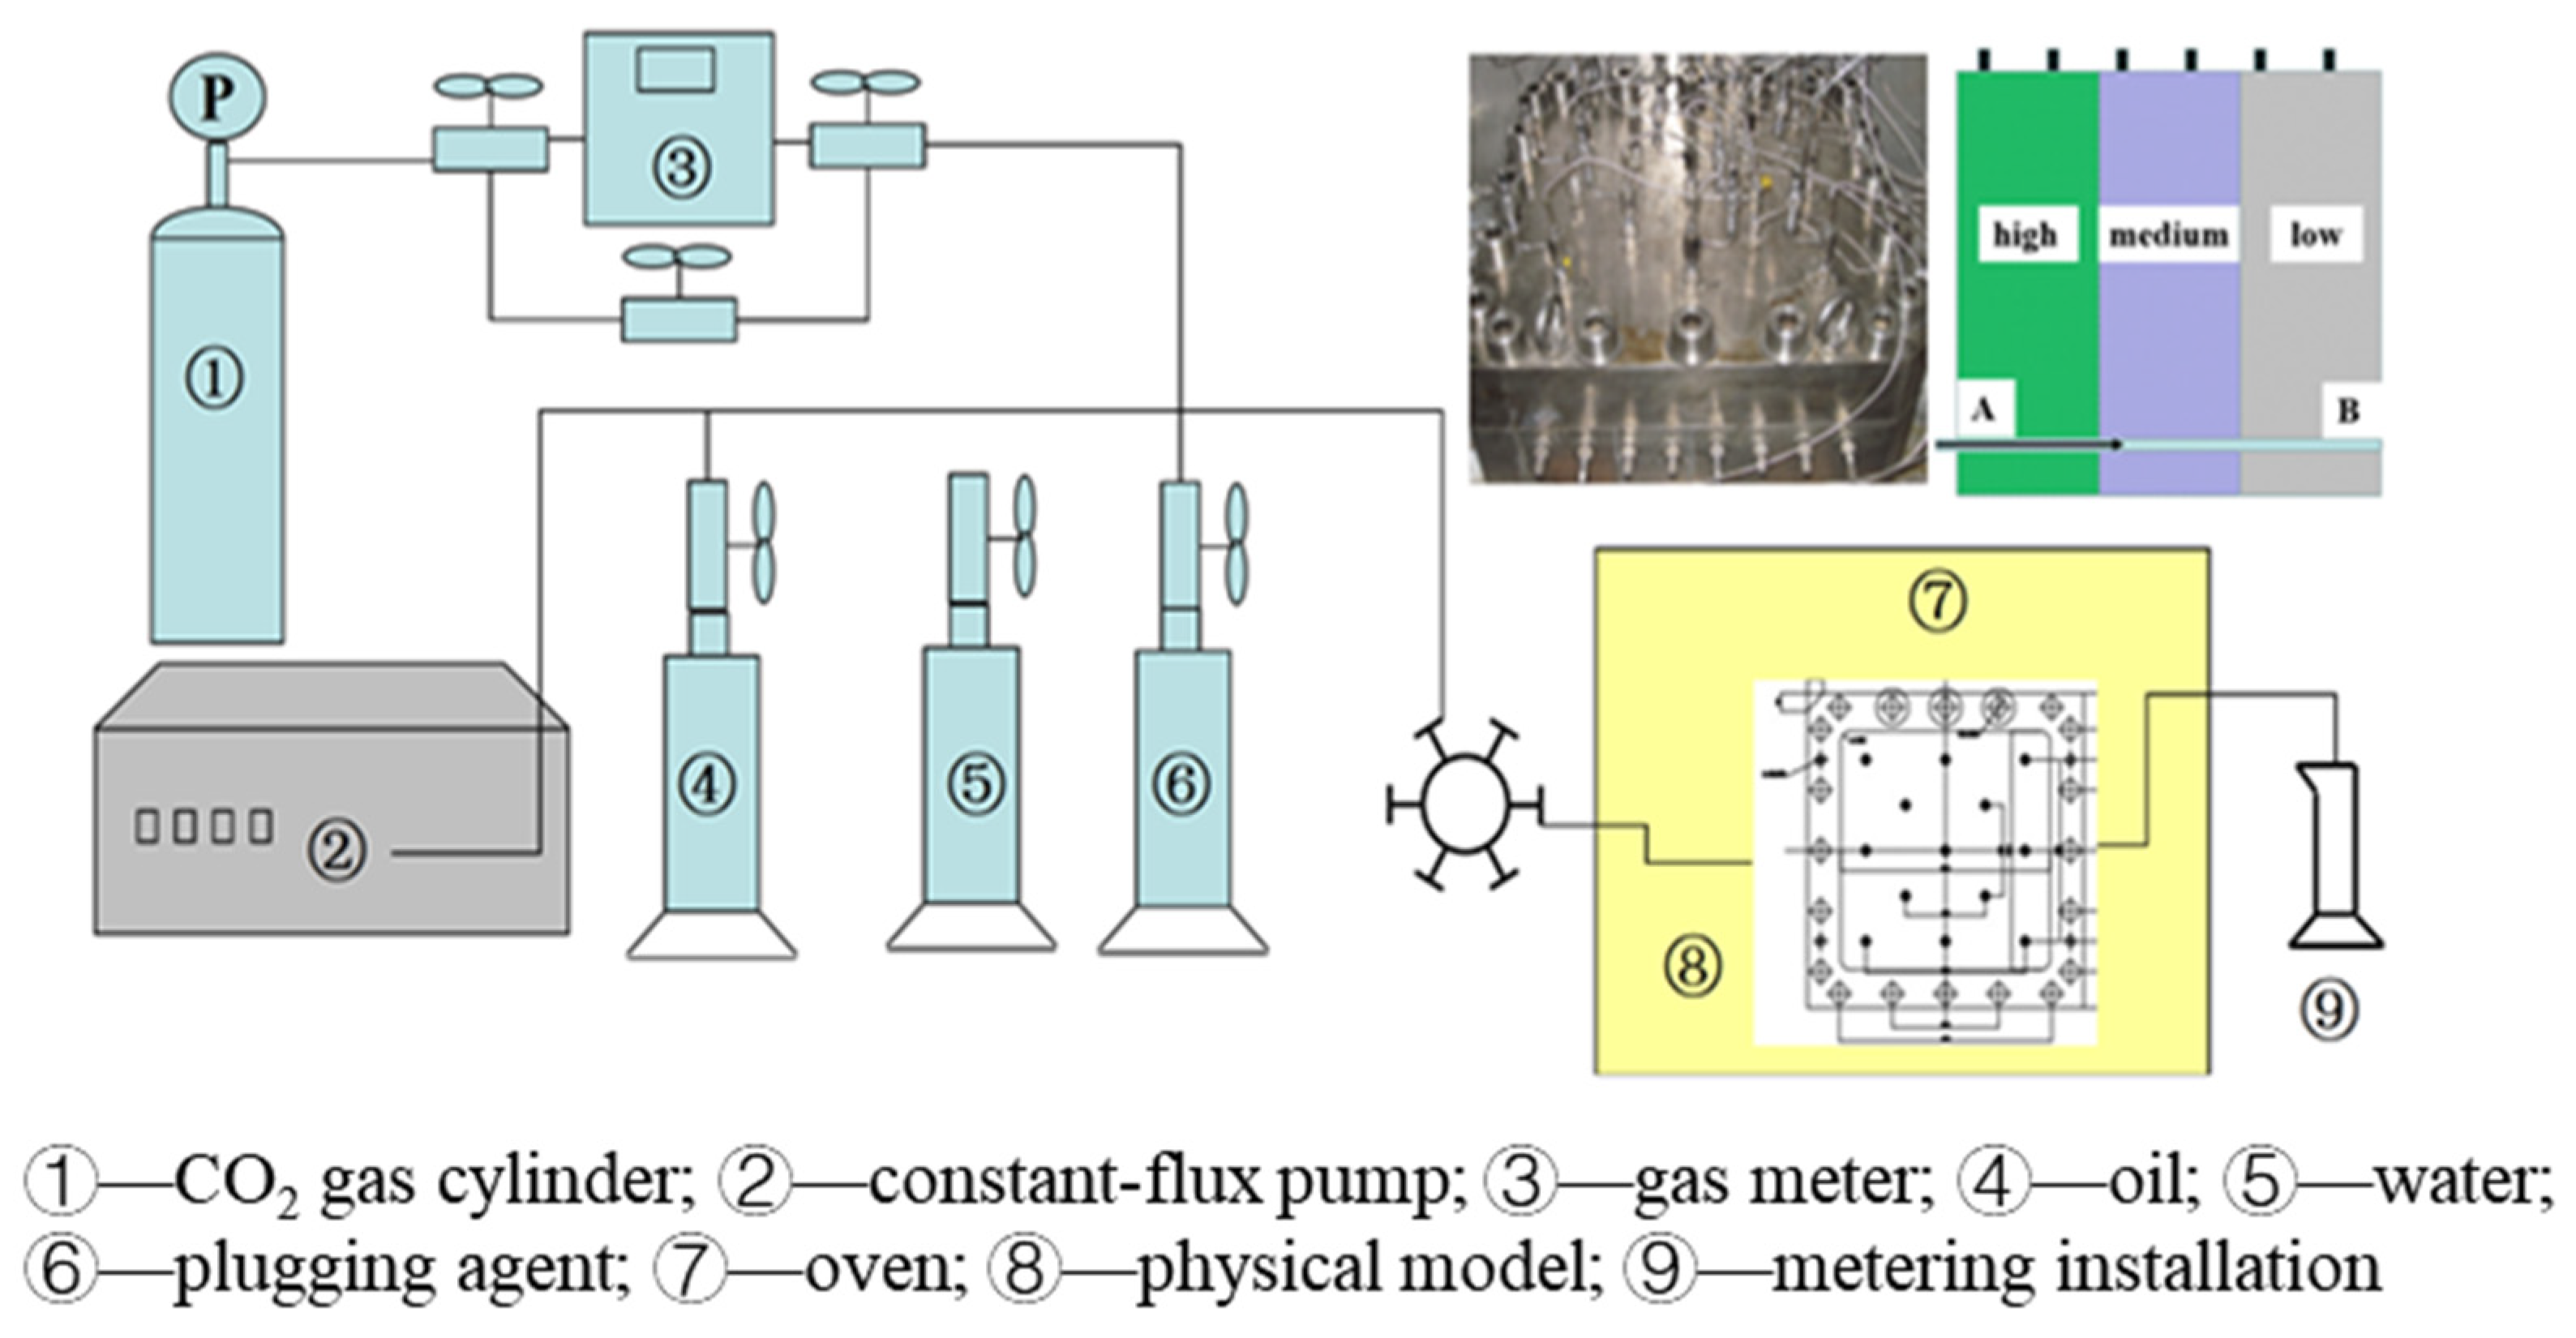
- Experimental procedure
3. Experimental Results
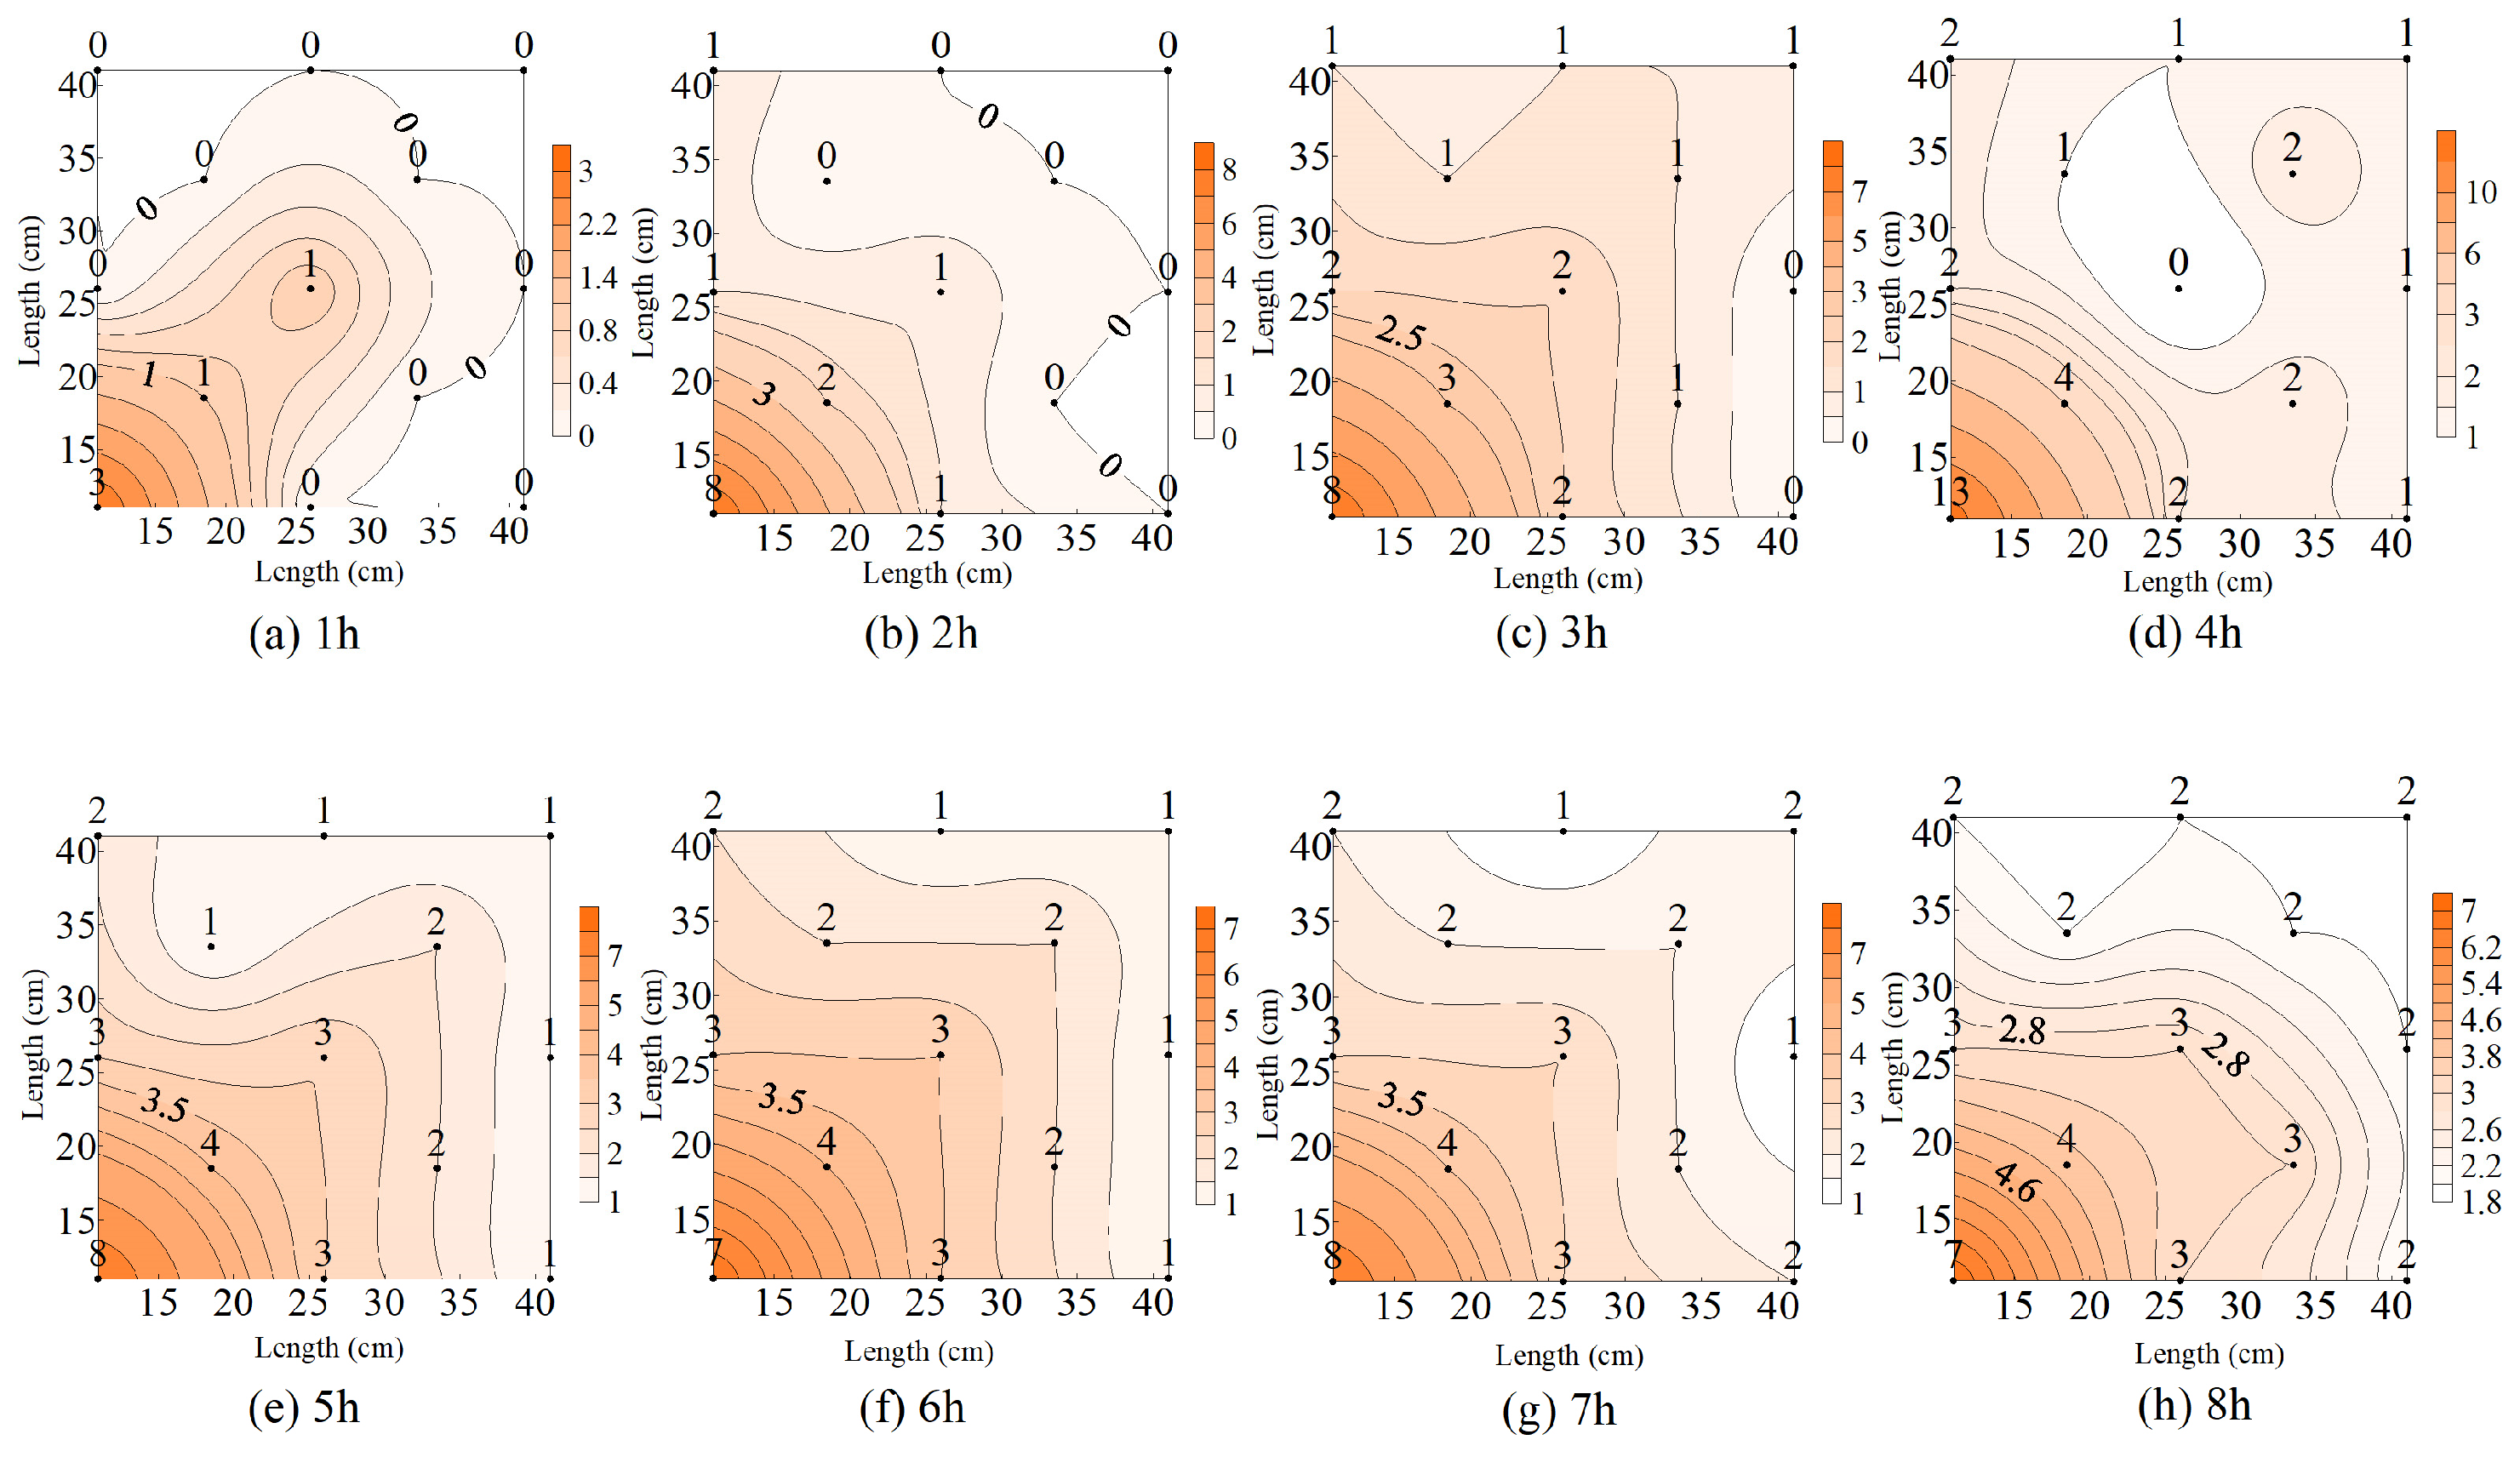
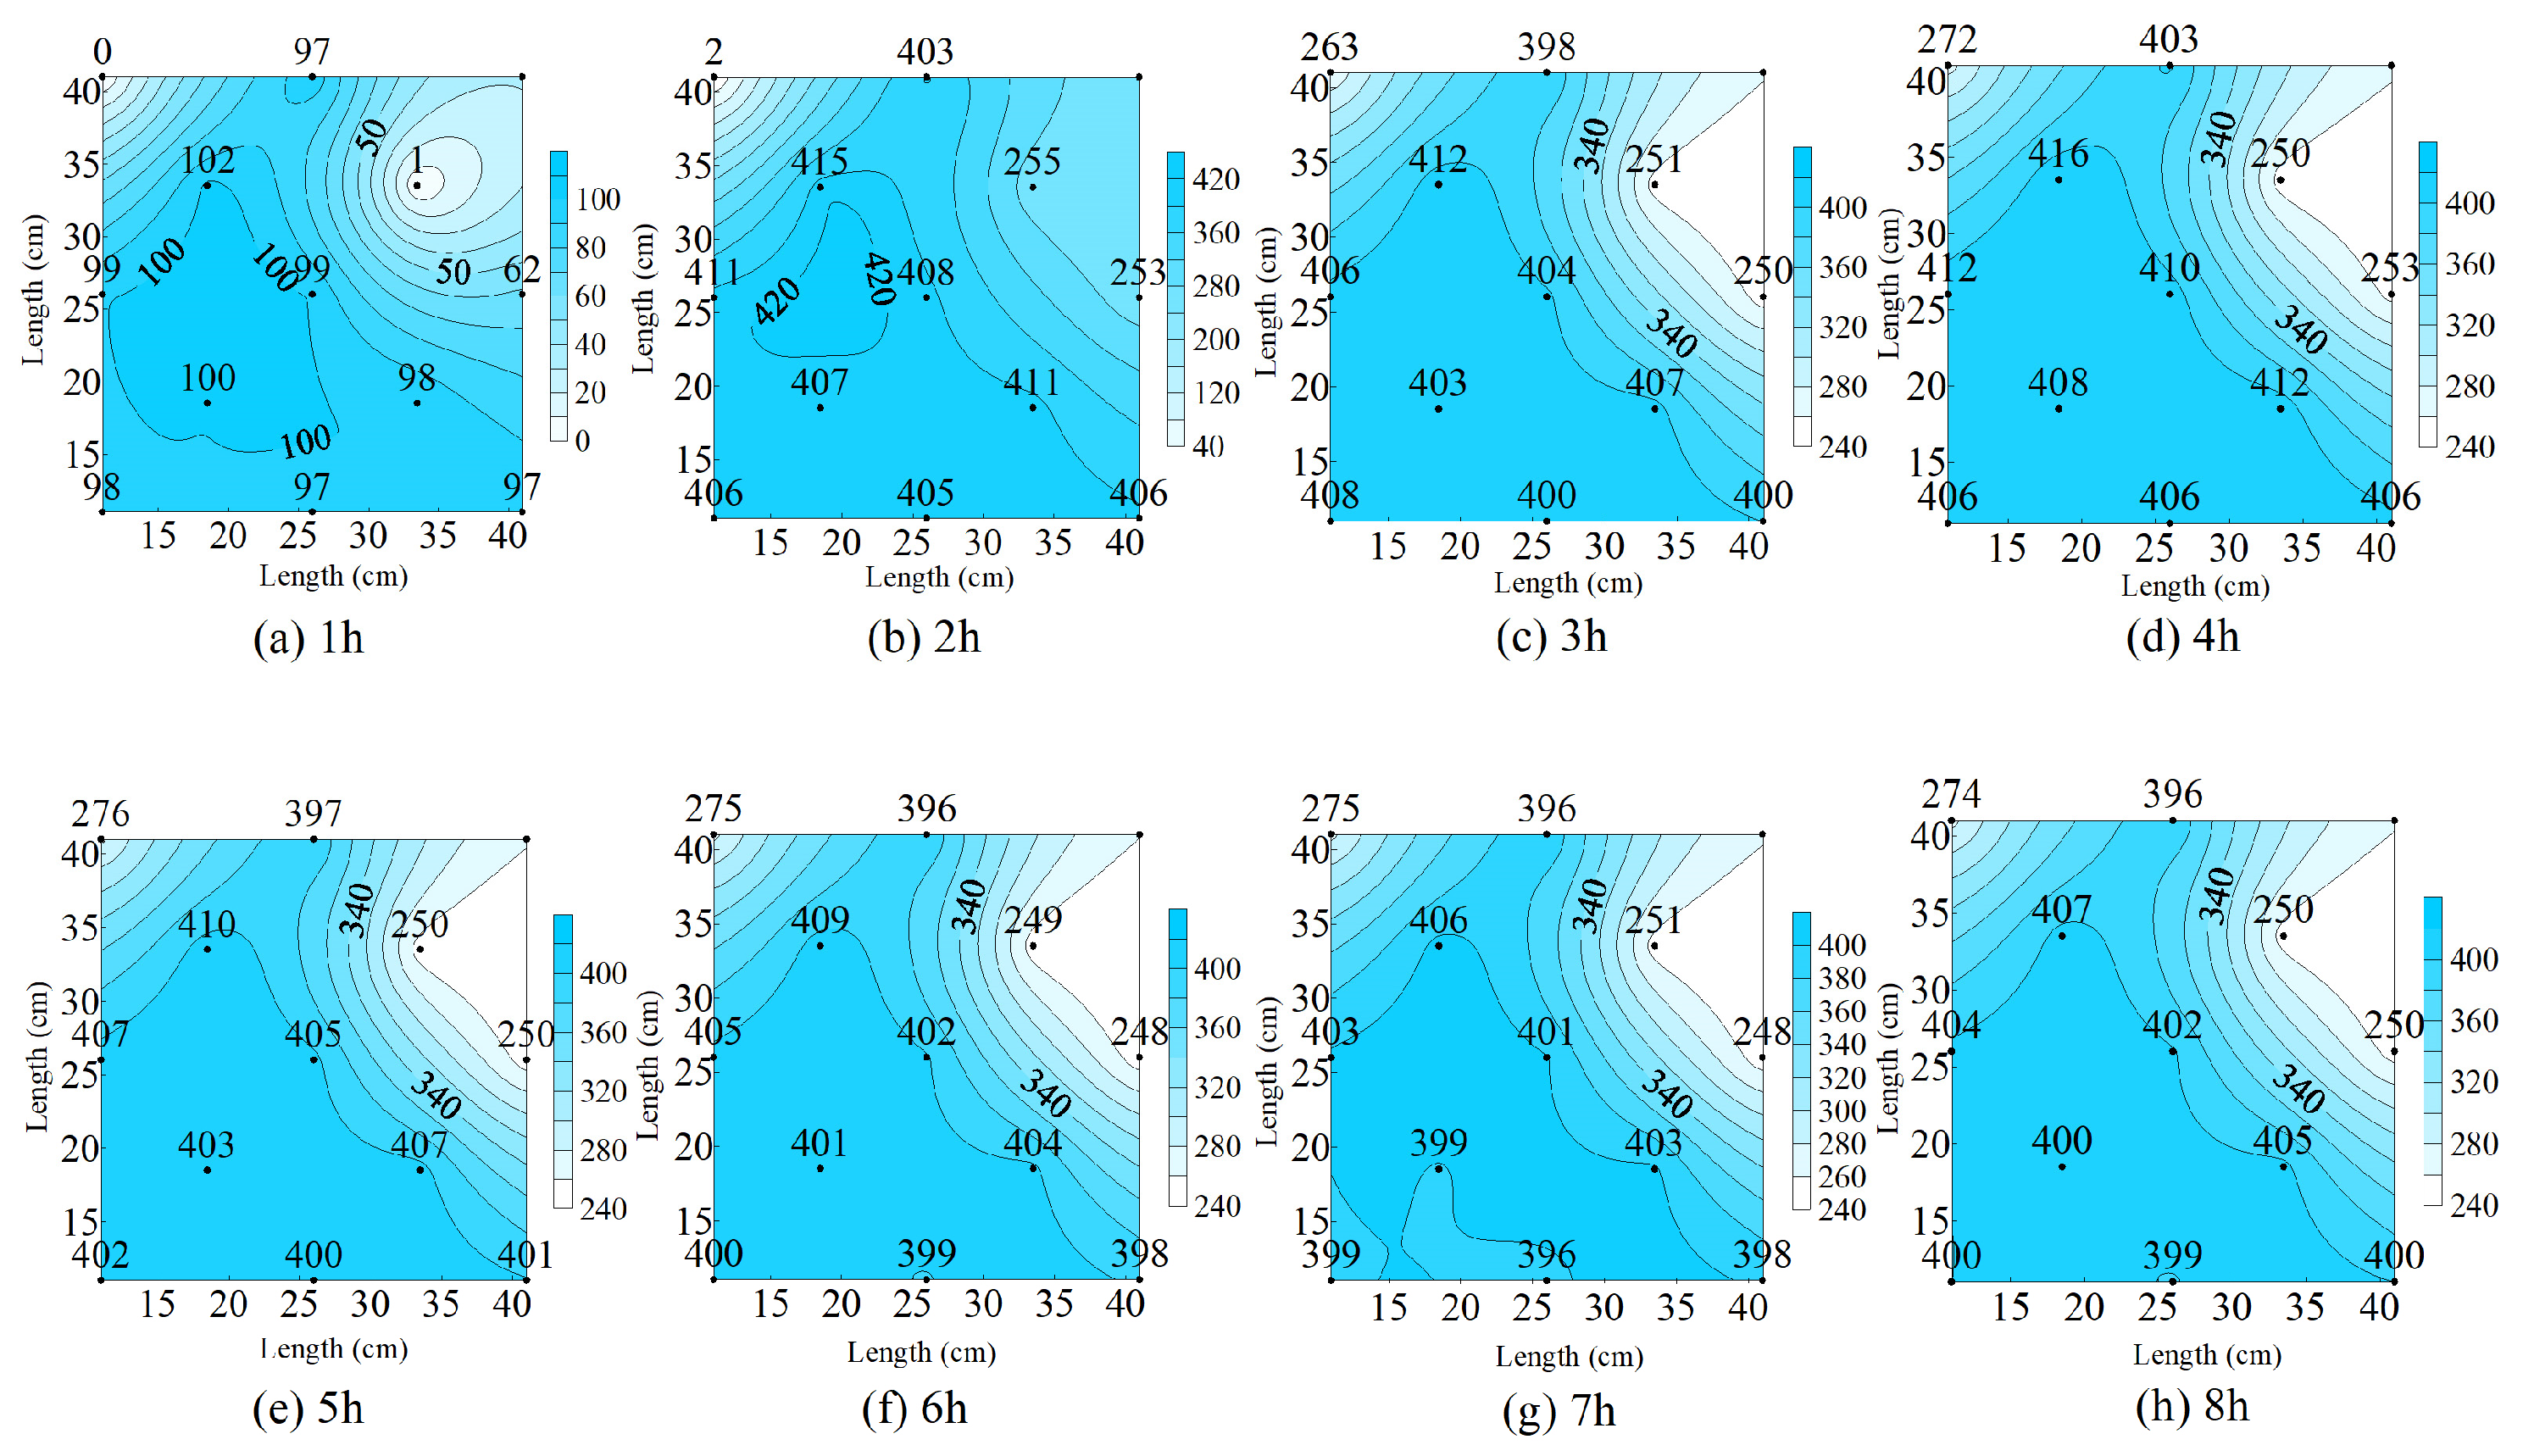
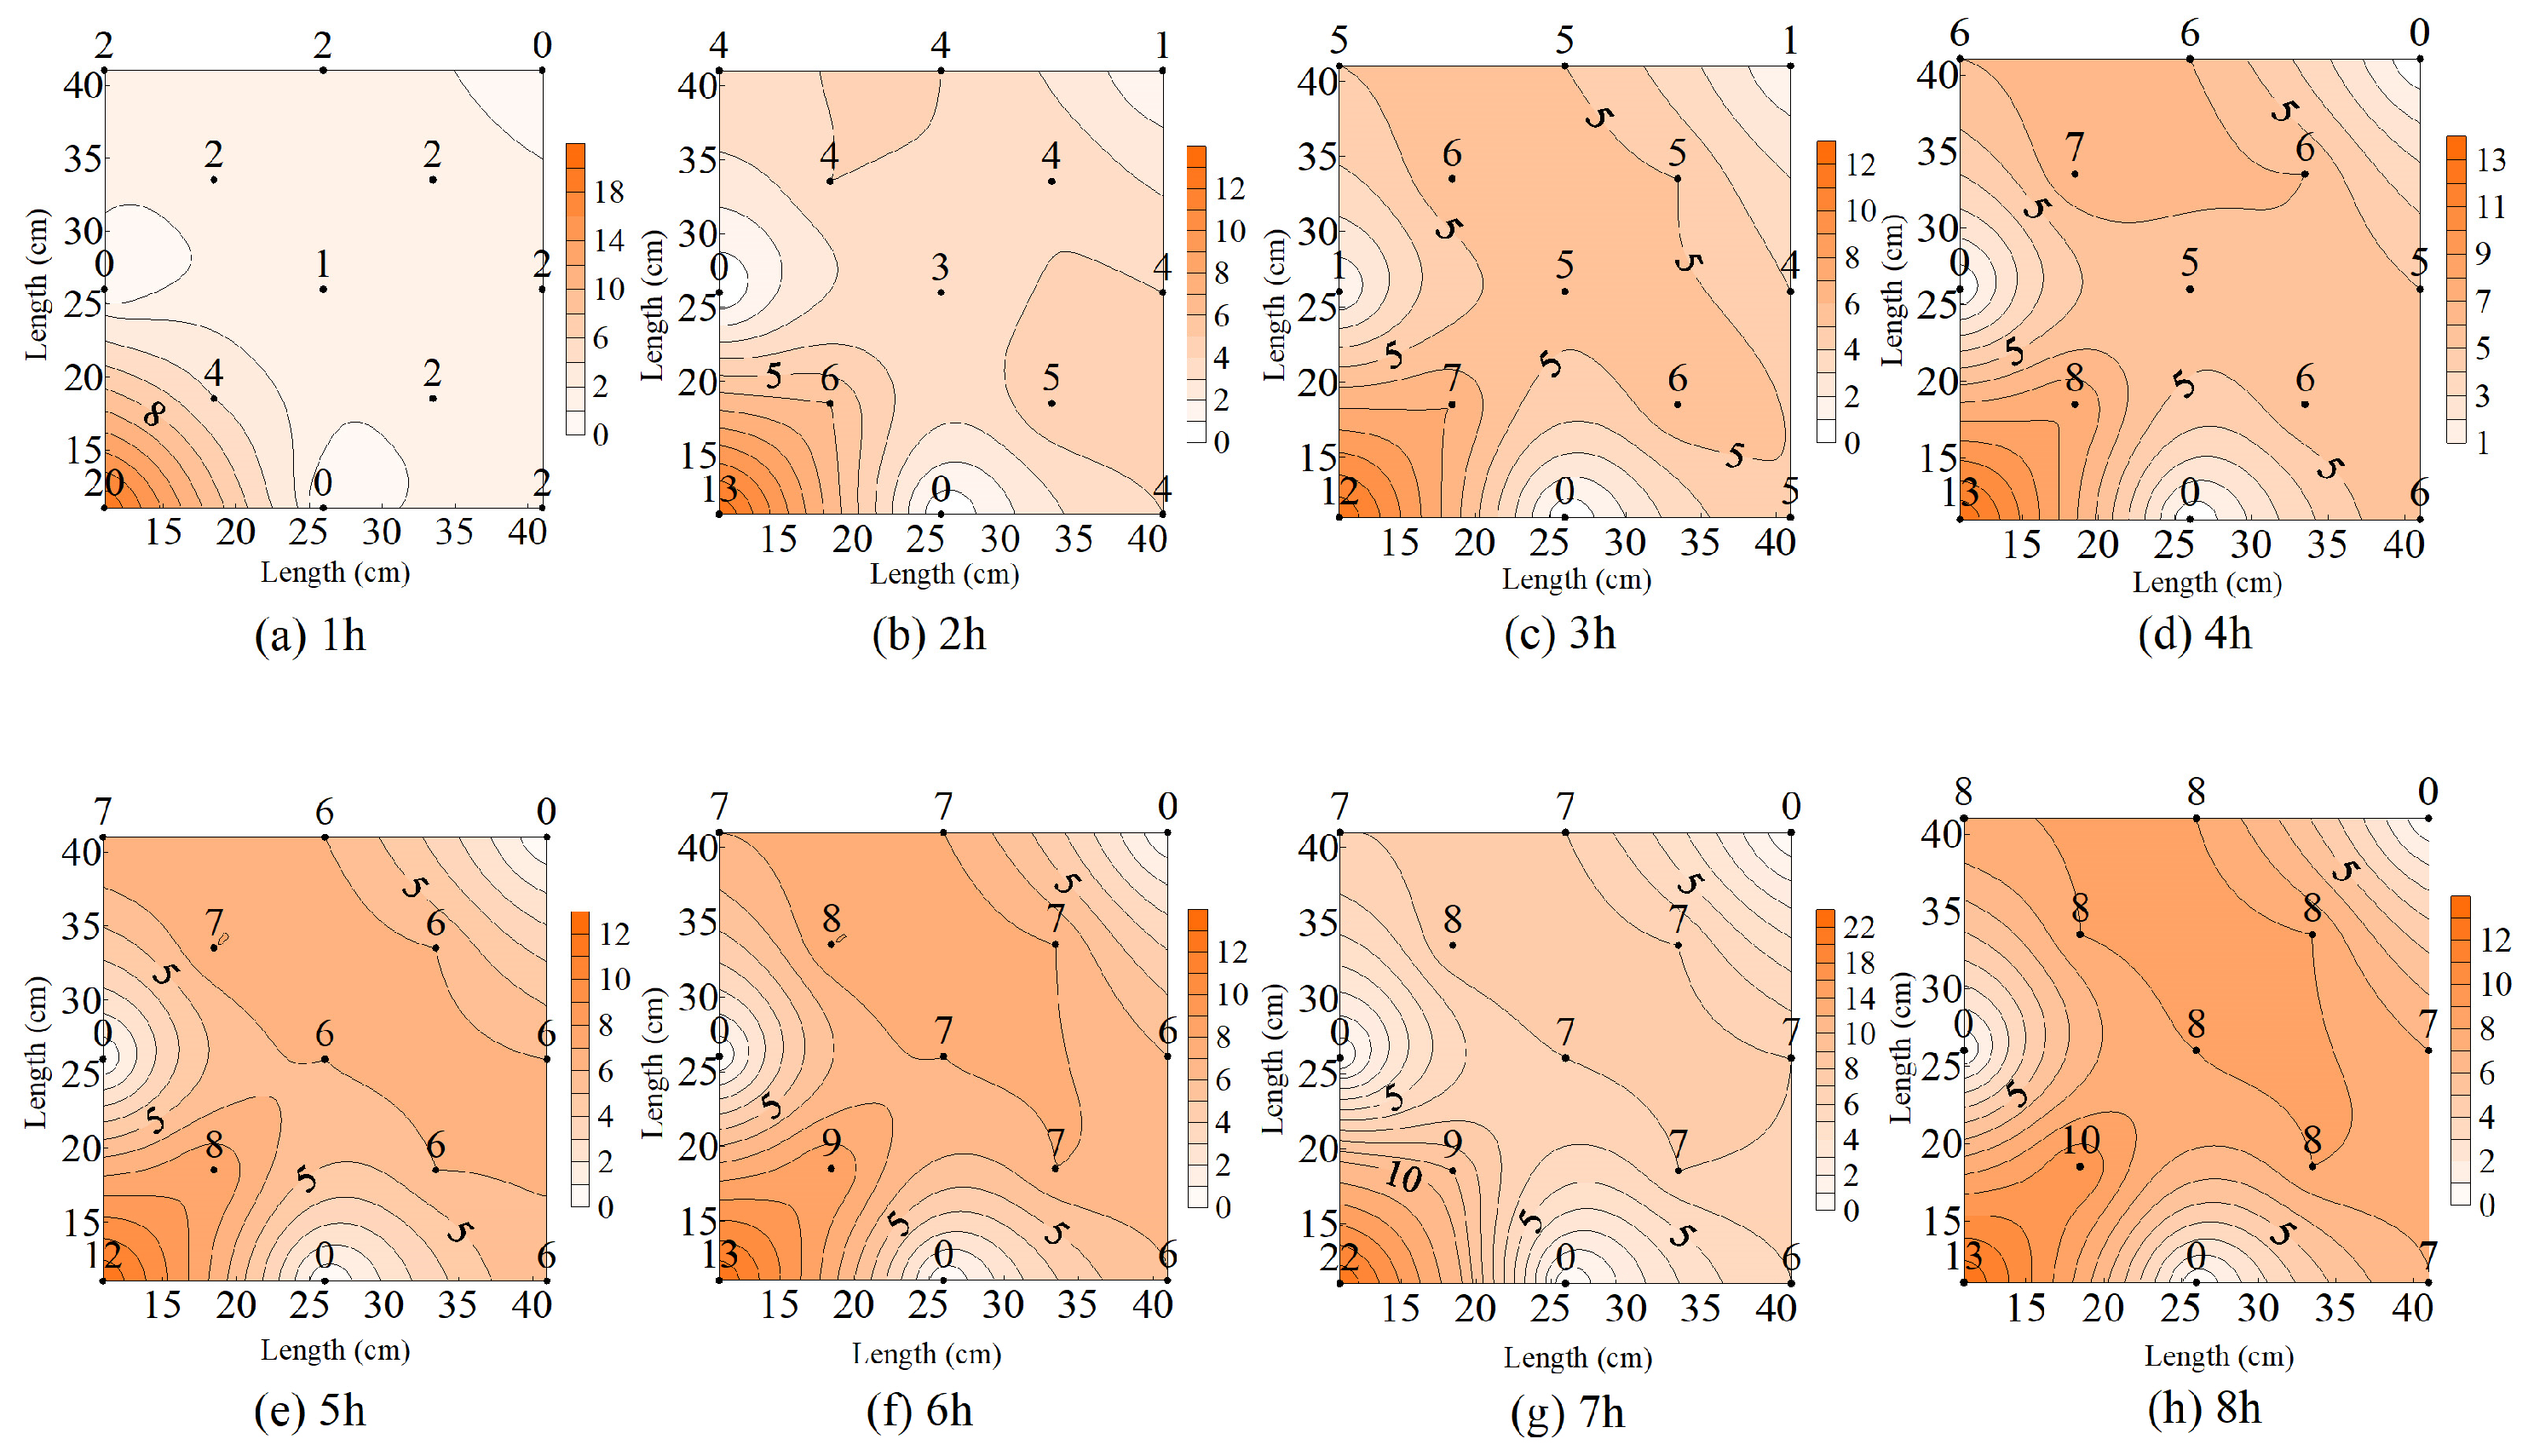
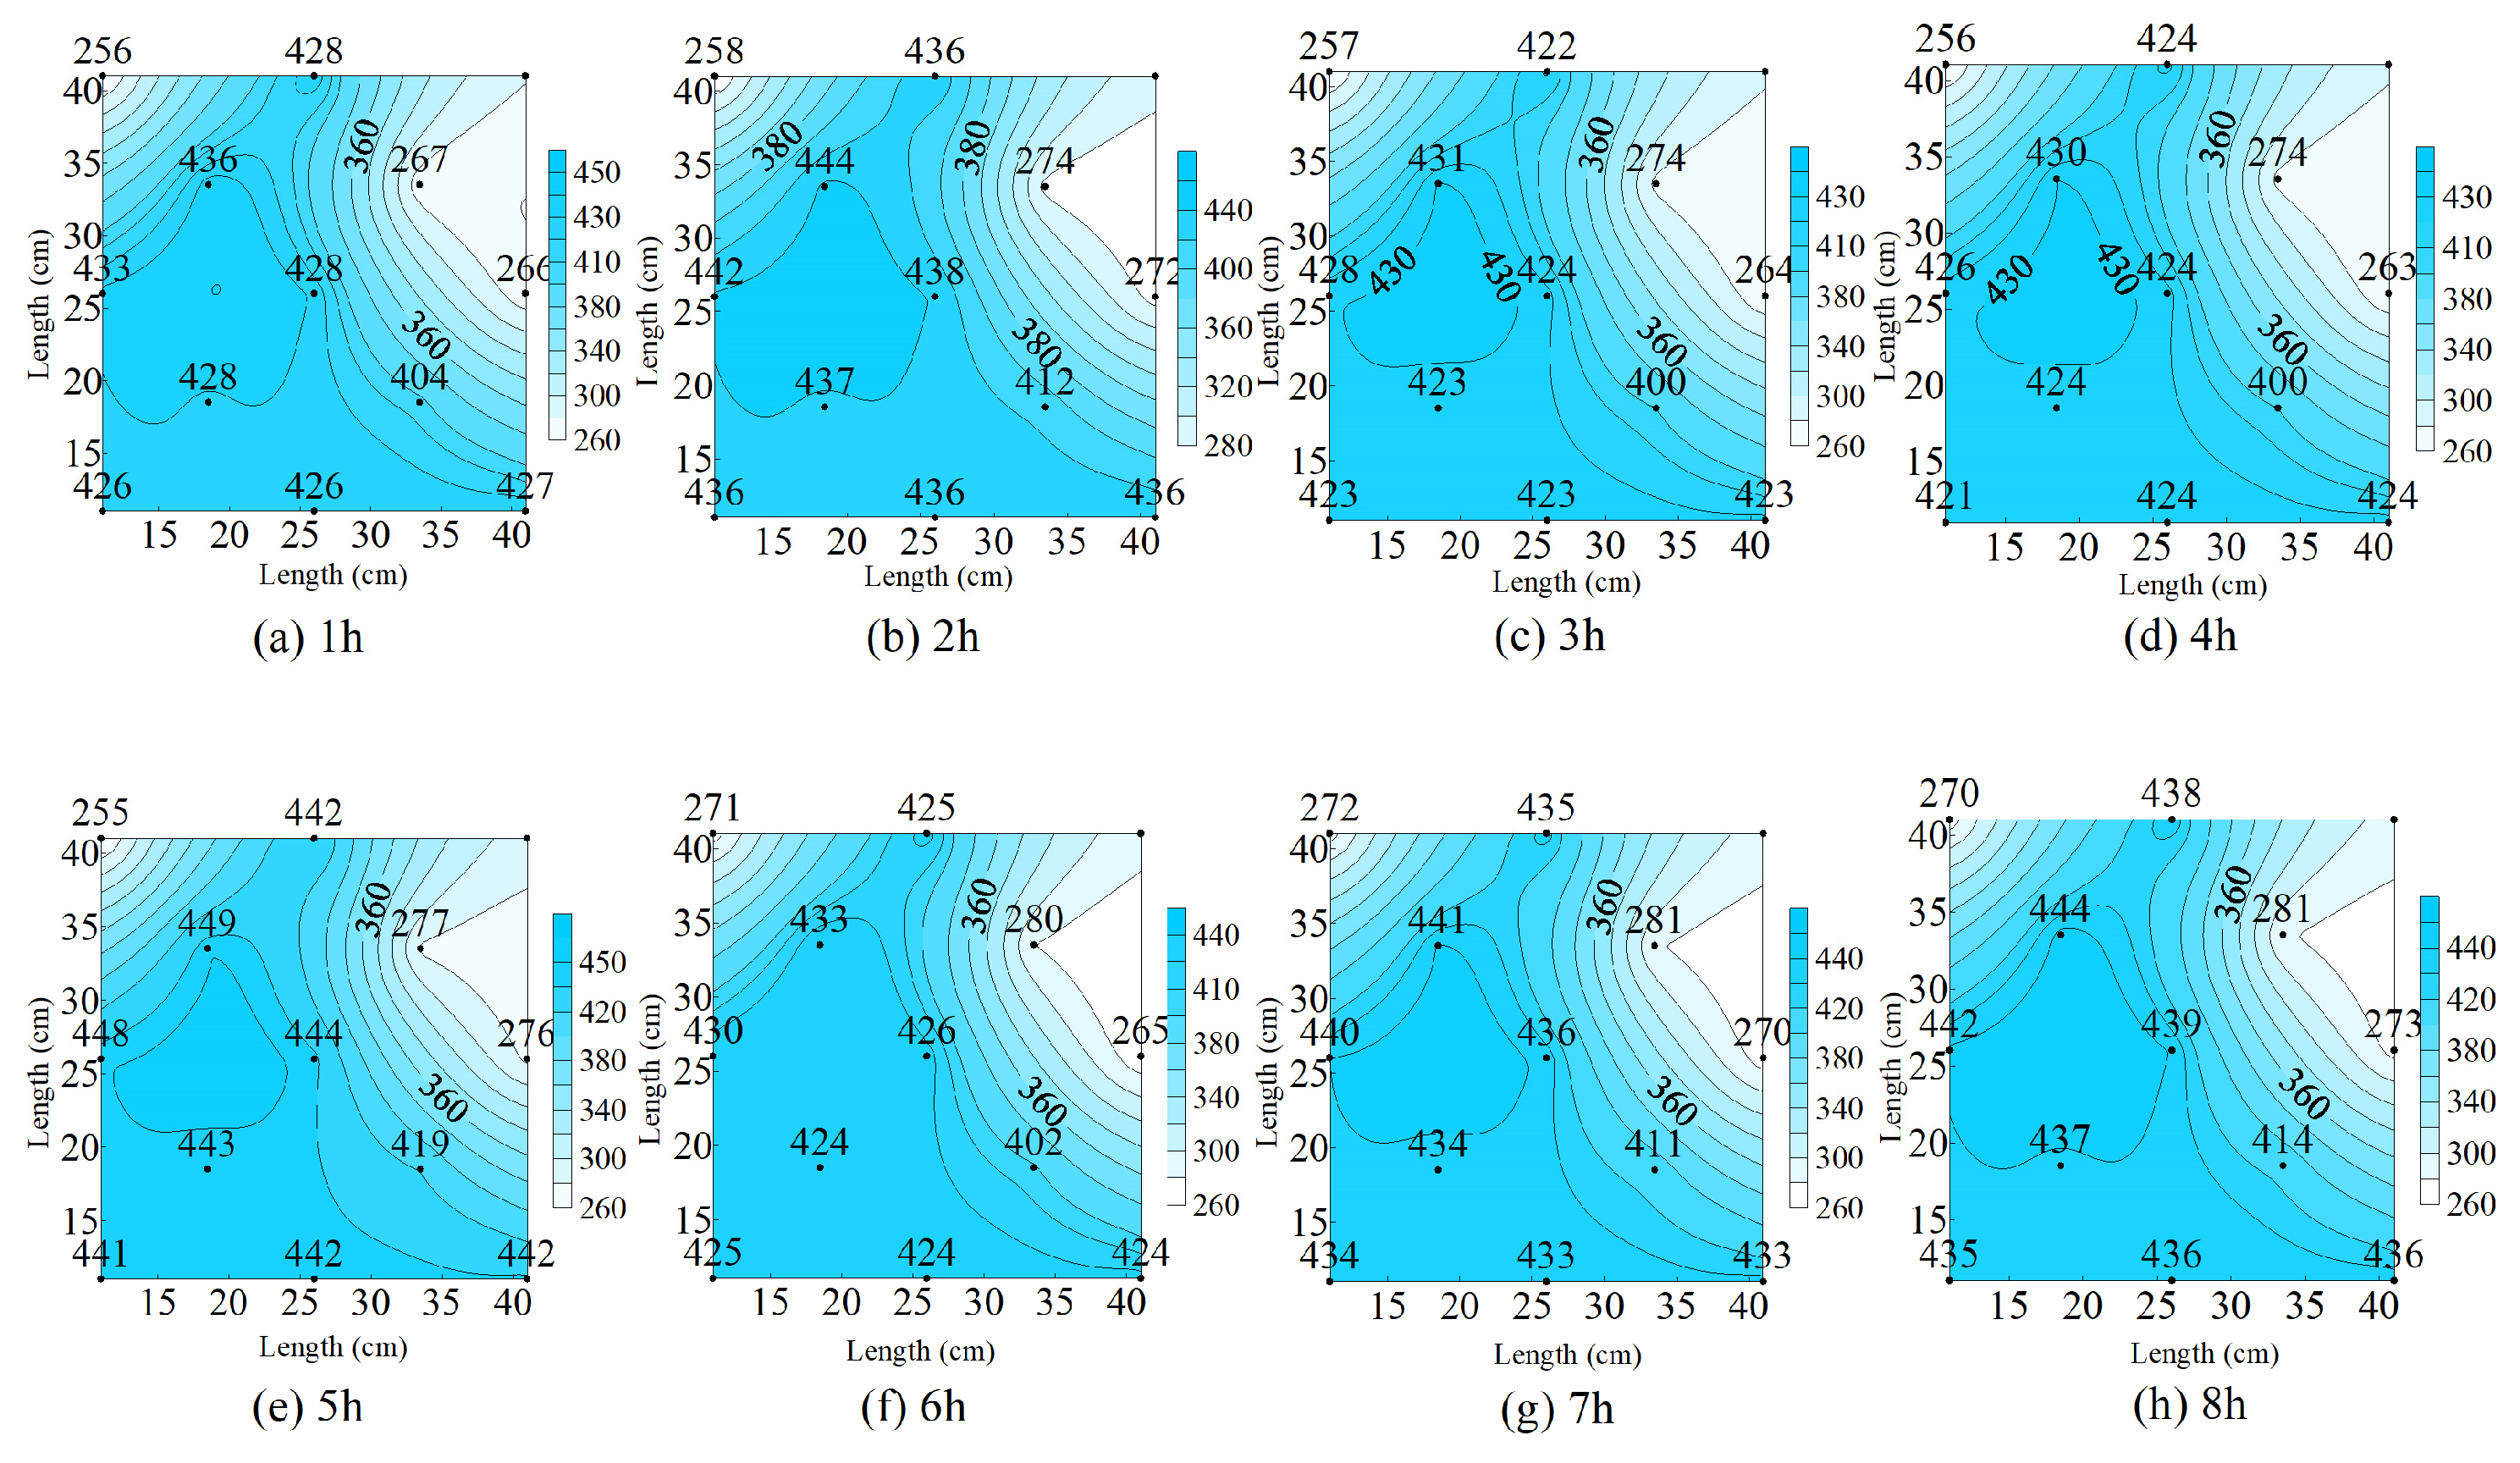
3.1. Changes in Pressure and Temperature during CO2 Flooding before Plugging
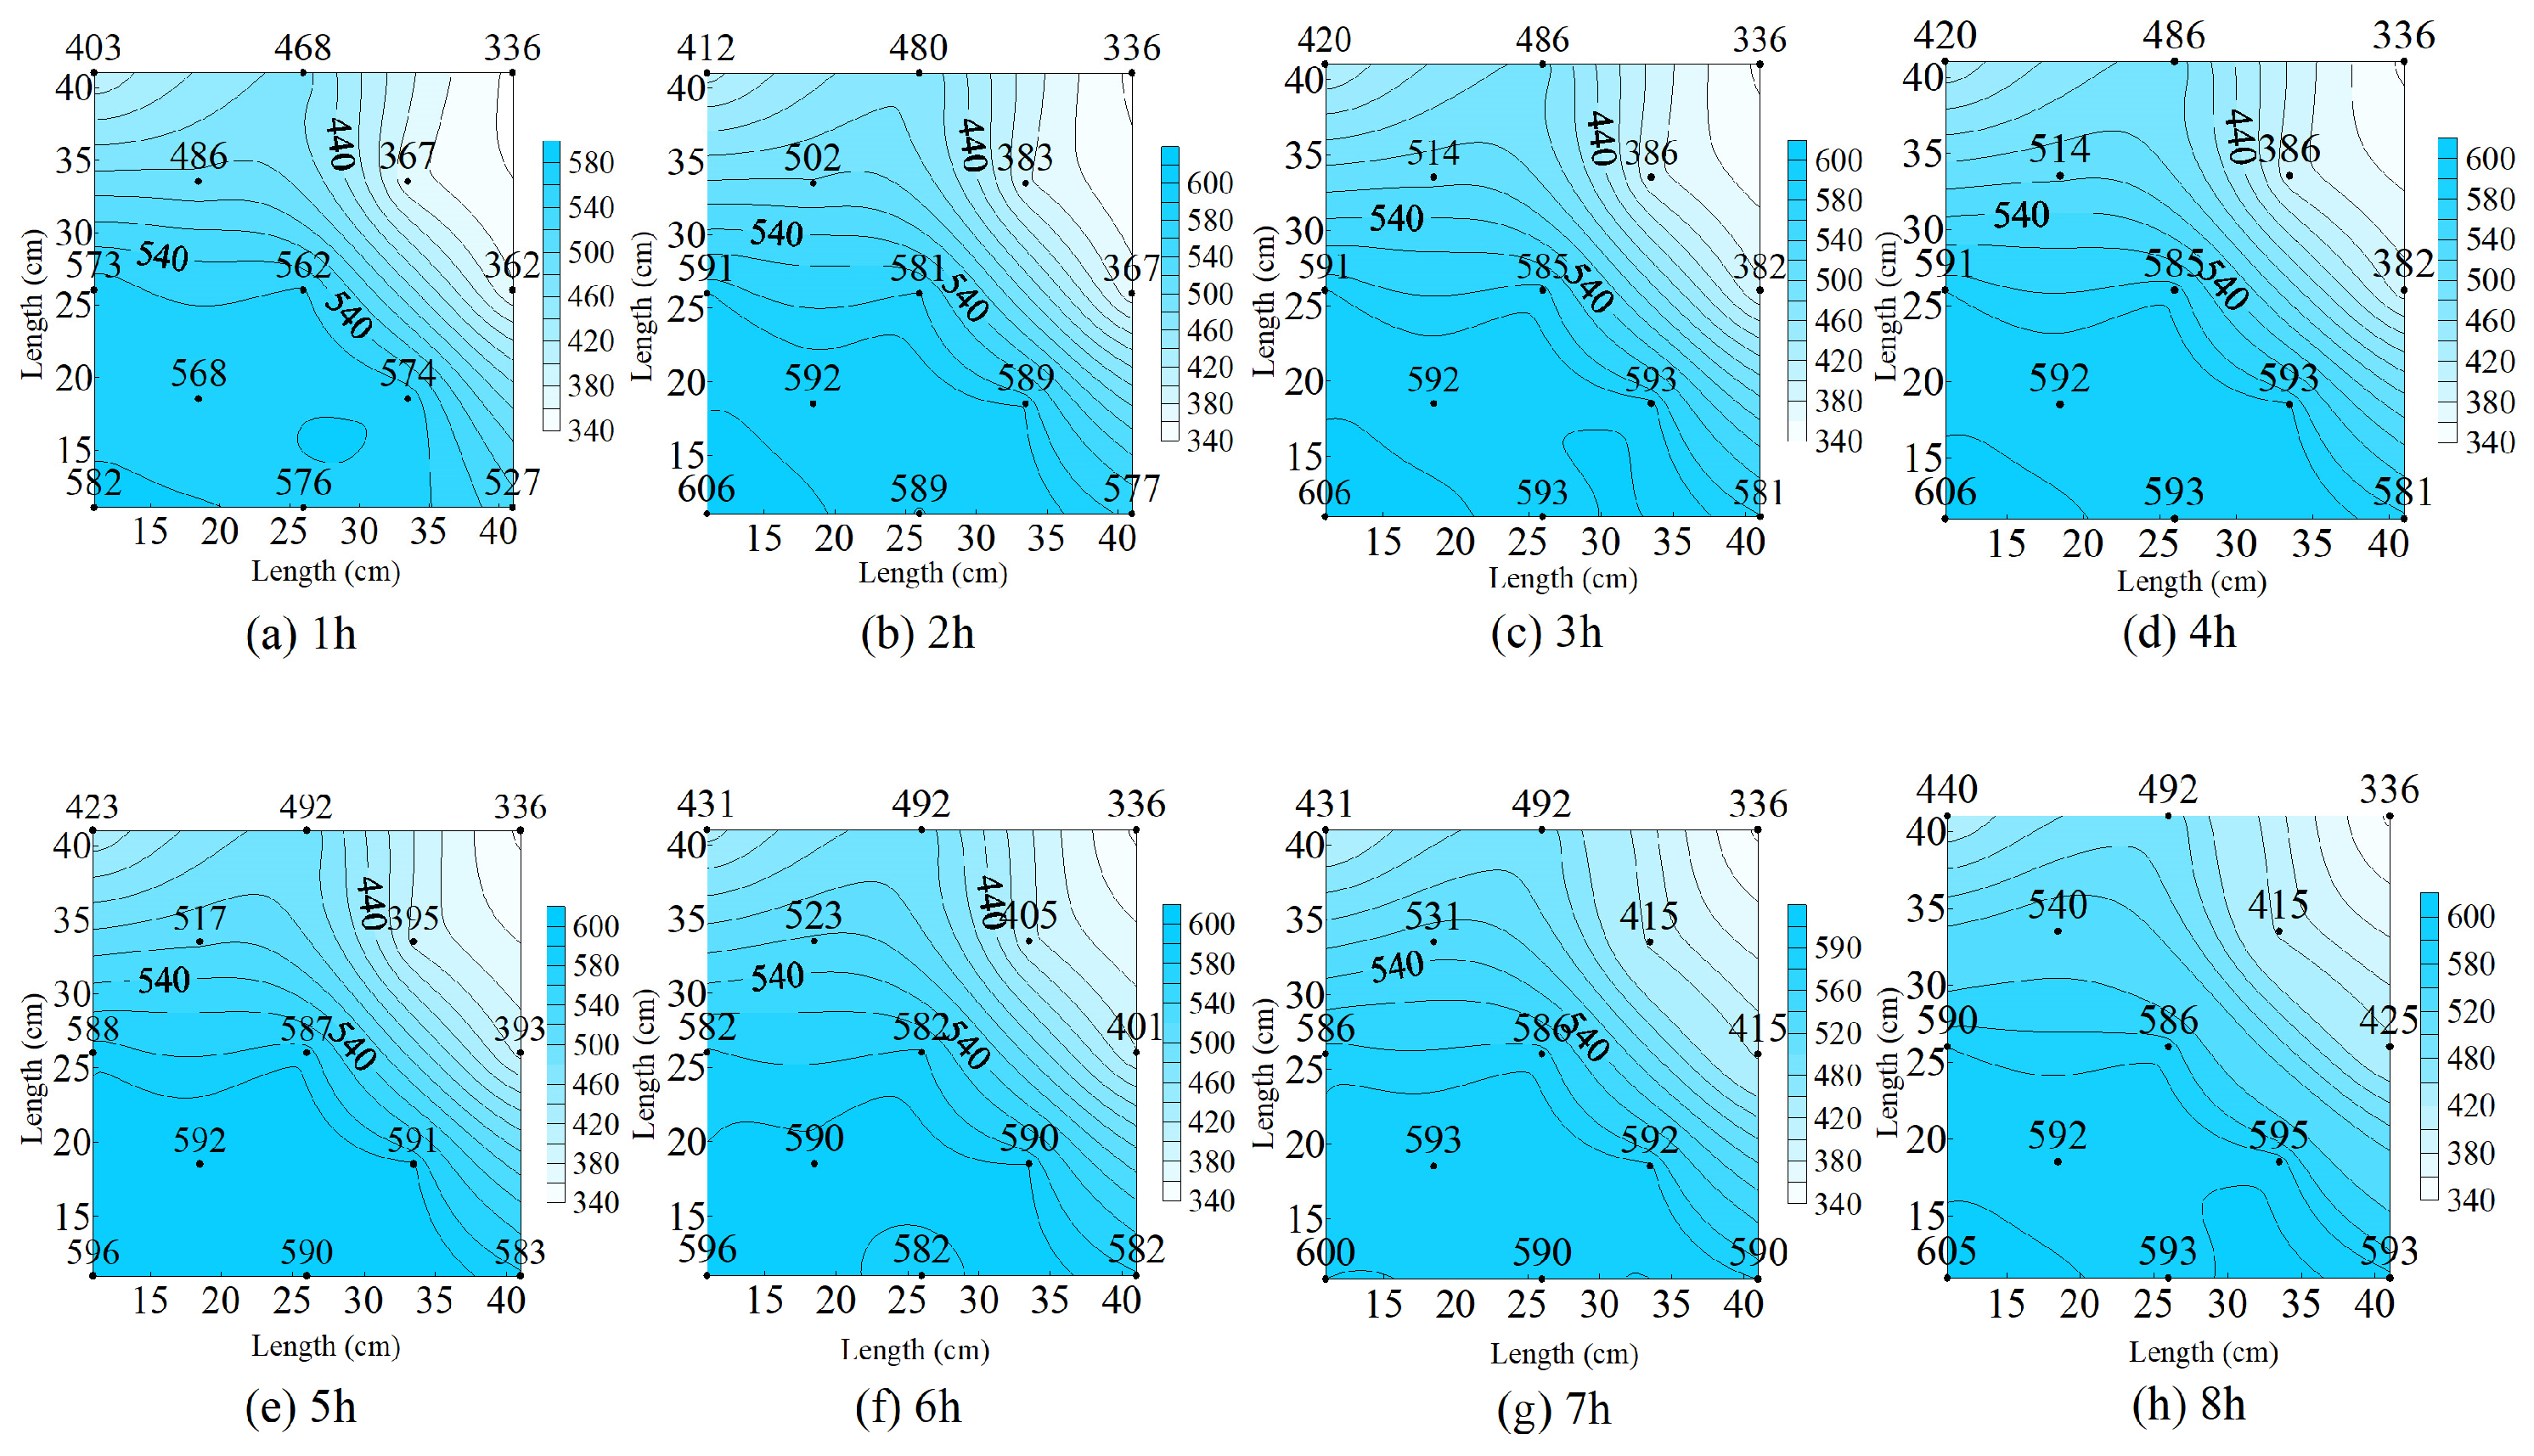
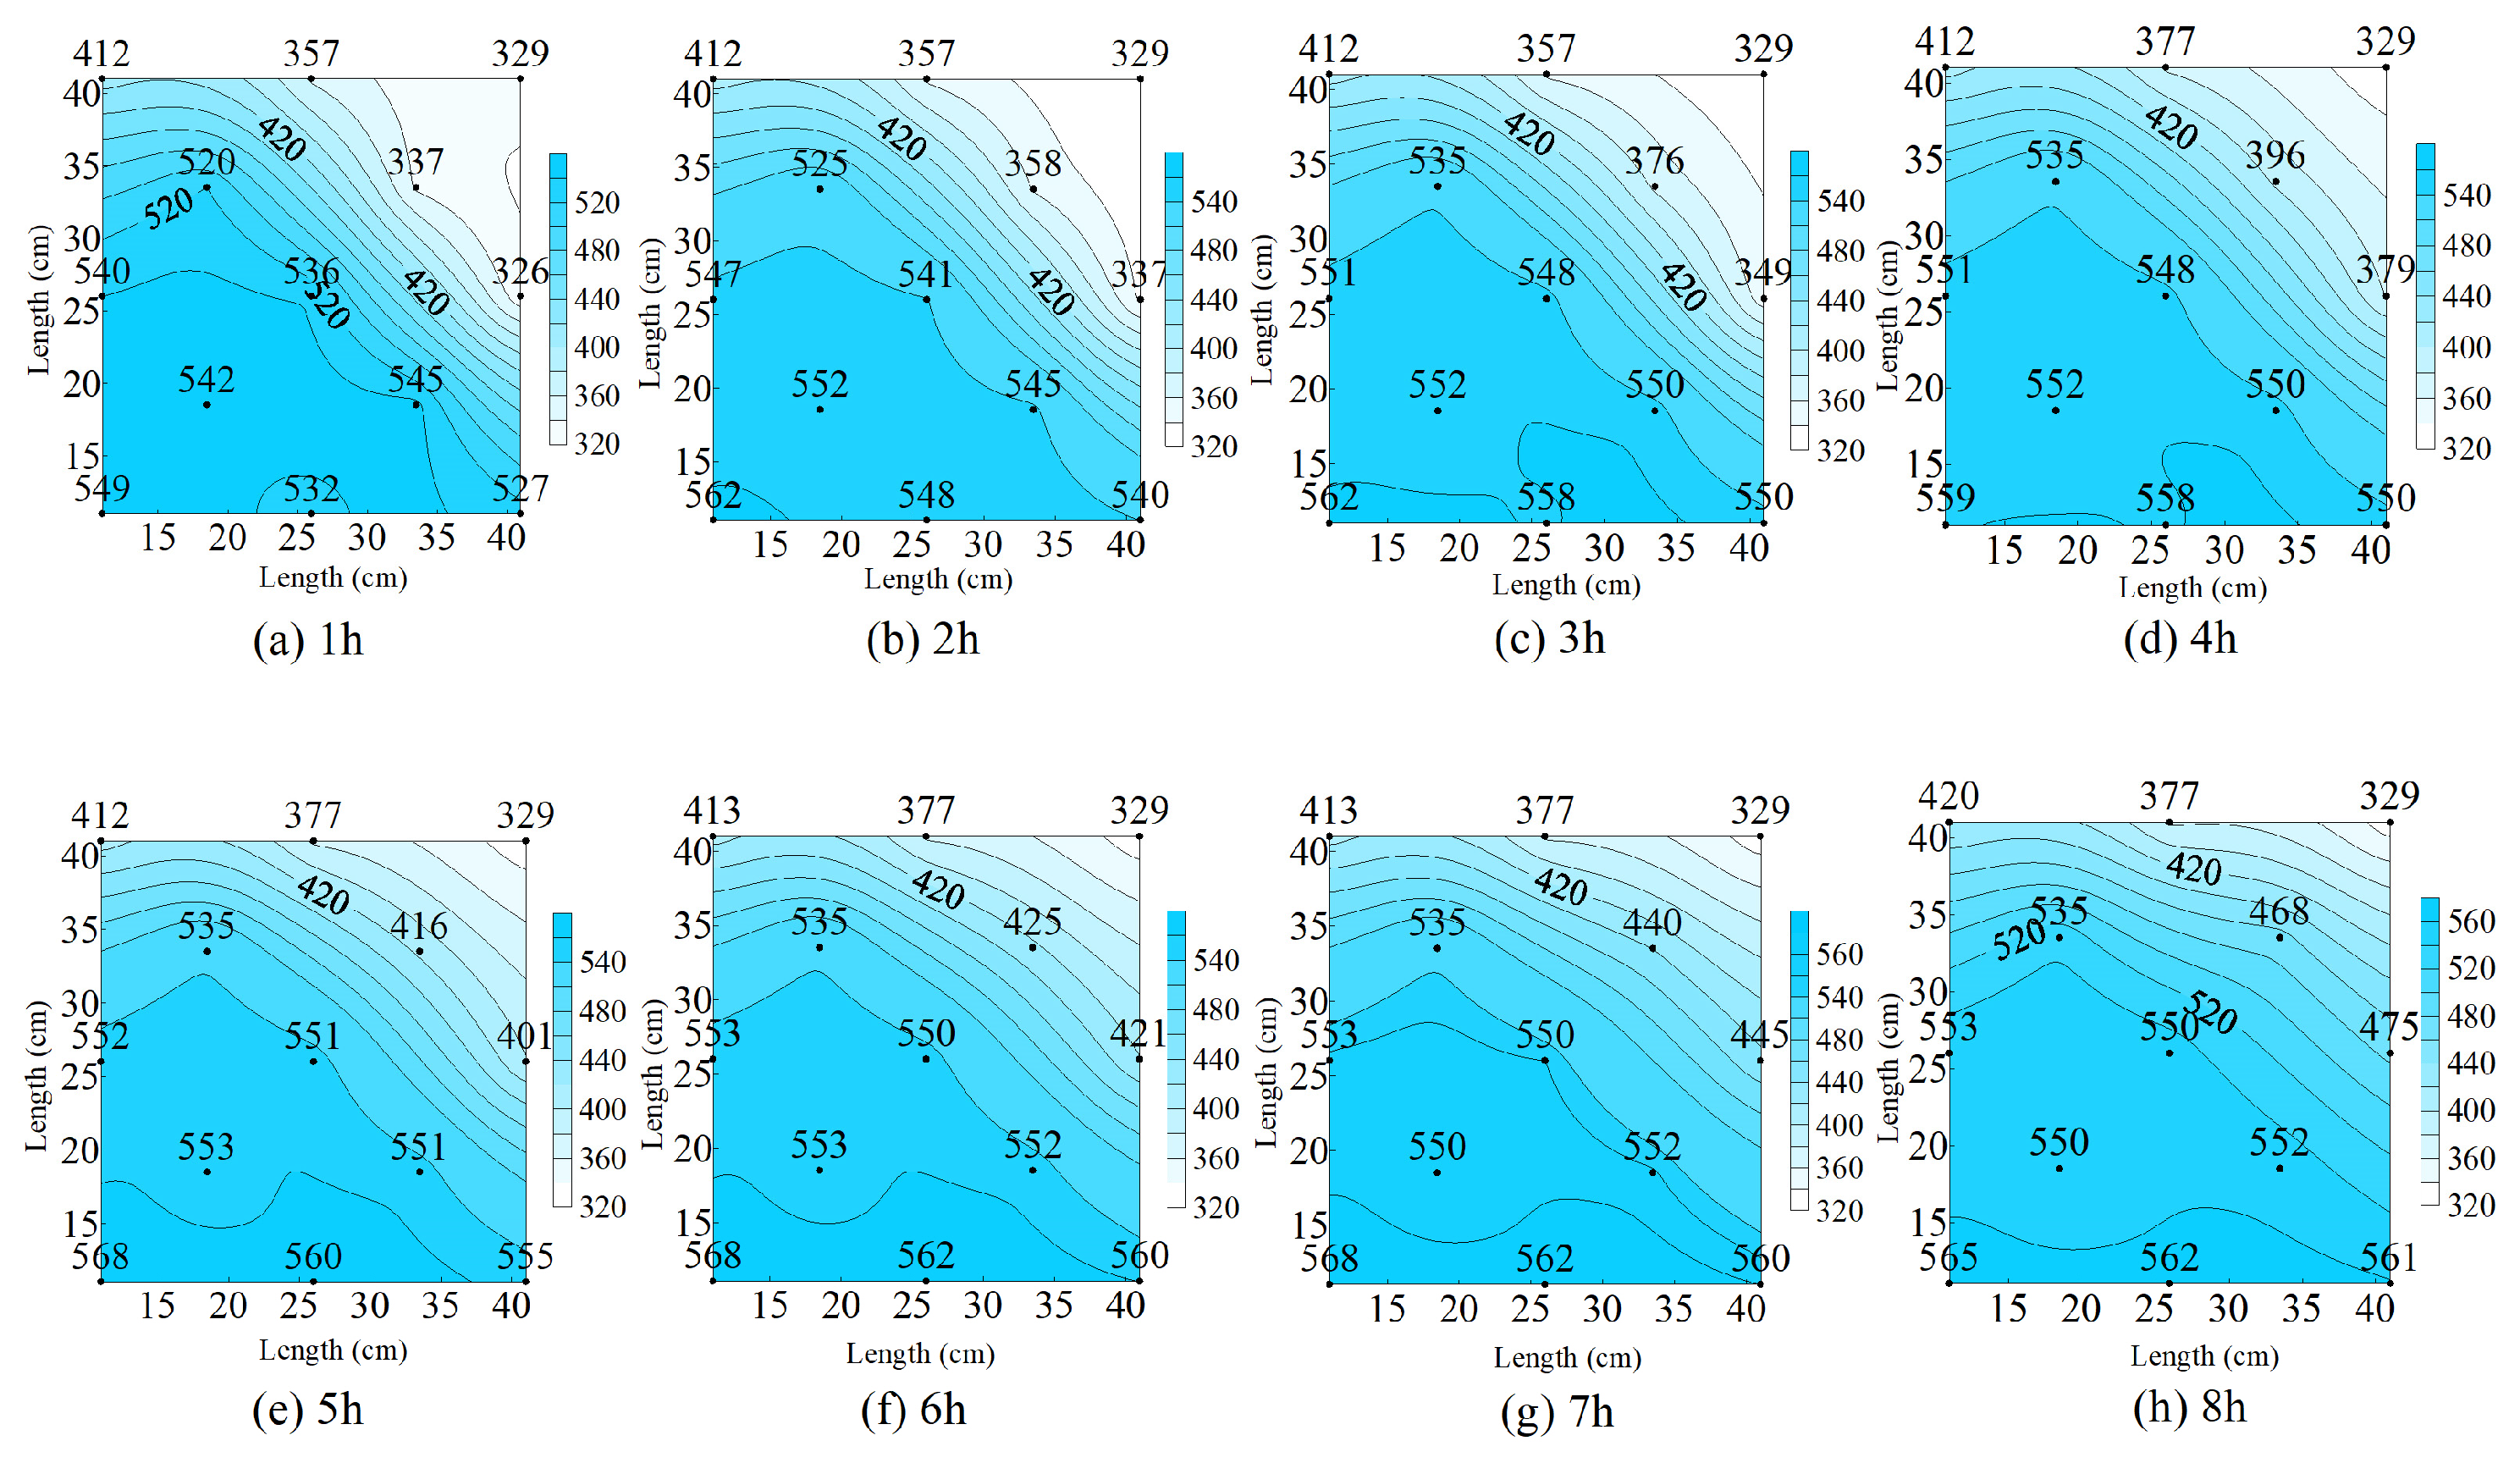
3.2. Changes in Pressure and Temperature during CO2 Flooding after Plugging with Different Combinations
- (1)
- Single Agent (S-A)
- (2)
- Strong–Medium–Weak Combination (S-M-W)
- (3)
- Strong–Weak–Strong–Weak Combination (S-W-S-W)
- (4)
- Weak–Strong–Weak–Strong (W-S-W-S) Combination
4. Evaluation of the Plugging Effect of the Four Combinations
5. Conclusions
Author Contributions
Funding
Data Availability Statement
Acknowledgments
Conflicts of Interest
References
- Clarkson, C.R.; Vahedian, A.; Ghanizadeh, A.; Song, C.Y. A new low-permeability reservoir core analysis method based on rate-transient analysis theory. Fuel 2019, 235, 1530–1543. [Google Scholar] [CrossRef]
- Hu, W.R.; Wei, Y.; Bao, J.W. Development of the theory and technology for low permeability reservoirs in China. Pet. Explor. Dev. 2018, 45, 685–697. [Google Scholar] [CrossRef]
- Liang, C.; Xiao, L.Z.; Zhou, C.C.; Wang, H.; Hu, F.L.; Liao, G.Z.; Jia, Z.J.; Liu, H.B. Wettability characterization of low-permeability reservoirs using nuclear magnetic resonance: An experimental study. J. Pet. Sci. Eng. 2019, 178, 121–132. [Google Scholar] [CrossRef]
- Xu, Z.X.; Li, S.Y.; Li, B.F.; Chen, D.Q.; Liu, Z.Y.; Li, Z.M. A review of development methods and EOR technologies for carbonate reservoirs. Pet. Sci. 2020, 17, 990–1013. [Google Scholar] [CrossRef]
- Chen, L.F.; Zhu, X.M.; Wang, L.; Yang, H.; Wang, D.G.; Fu, M.L. Experimental Study of Effective Amphiphilic Graphene Oxide Flooding for an Ultralow-Permeability Reservoir. Energy Fuel 2018, 32, 11269–11278. [Google Scholar] [CrossRef]
- Tetteh, J.T.; Brady, P.V.; Ghahfarokhi, R.B. Review of low salinity waterflooding in carbonate rocks: Mechanisms, investigation techniques, and future directions. Adv. Colloid Interface Sci. 2020, 284, 102253. [Google Scholar] [CrossRef]
- Wang, C.S.; Sun, Z.X.; Sun, Q.J.; Zhang, L.; Zhang, X.Q. Comprehensive evaluation of waterflooding front in low-permeability reservoir. Energy Sci. Eng. 2021, 9, 1394–1408. [Google Scholar] [CrossRef]
- Cuéllar-Franca, R.M.; Azapagic, A. Carbon capture, storage and utilisation technologies: A critical analysis and comparison of their life cycle environmental impacts. J. CO2 Util. 2015, 9, 82–102. [Google Scholar] [CrossRef]
- Wang, Z.J.; Li, S.Y.; Li, Z.M. A novel strategy to reduce carbon emissions of heavy oil thermal recovery: Condensation heat transfer performance of flue gas-assisted steam flooding. Appl. Therm. Eng. 2022, 205, 118076. [Google Scholar] [CrossRef]
- Zhang, L.Y.; Wu, K.L.; Chen, Z.X.; Li, J.; Yu, X.R.; Hui, G.; Yang, M. The increased viscosity effect for fracturing fluid imbibition in shale. Chem. Eng. Sci. 2021, 232, 116352. [Google Scholar] [CrossRef]
- Wang, Z.J.; Li, S.Y.; Peng, D.L.; Cheng, H.; Wei, Y.H. The effect of interfacial tension on CO2 oil-based foam stability under different temperatures and pressures. Fuel 2023, 341, 127755. [Google Scholar] [CrossRef]
- Li, S.Y.; Wang, Q.; Zhang, K.Q.; Li, Z.M. Monitoring of CO2 and CO2 oil-based foam flooding processes in fractured low-permeability cores using nuclear magnetic resonance (NMR). Fuel 2020, 263, 116648. [Google Scholar] [CrossRef]
- Zhuang, X.Y.; Wang, W.D.; Su, Y.L.; Li, Y.; Dai, Z.X.; Yuan, B. Spatio-temporal sequence prediction of CO2 flooding and sequestration potential under geological and engineering uncertainties. Appl. Energy 2024, 359, 122691. [Google Scholar] [CrossRef]
- Bai, H.; Zhang, Q.L.; Li, Z.M.; Li, B.F.; Zhu, D.; Zhang, L.Y.; Lv, G.Z. Effect of fracture on production characteristics and oil distribution during CO2 huff-n-puff under tight and low-permeability conditions. Fuel 2019, 246, 117–125. [Google Scholar] [CrossRef]
- Wang, W.D.; Wen, J.Y.; Wang, C.W.; Gomari, S.R.; Xu, X.Y.; Zheng, S.; Su, Y.L.; Li, L.; Hao, Y.M.; Li, D.X. Current status and development trends of CO2 storage with enhanced natural gas recovery (CS-EGR). Fuel 2023, 349, 128555. [Google Scholar] [CrossRef]
- Wang, W.D.; Xie, Q.H.; An, S.Y.; Bakhshian, S.; Kang, Q.J.; Wang, H.; Xu, X.Y.; Su, Y.L.; Cai, J.C.; Yuan, B. Pore-scale simulation of multiphase flow and reactive transport processes involved in geologic carbon sequestration. Earth-Sci. Rev. 2023, 247, 104602. [Google Scholar] [CrossRef]
- Xie, Q.H.; Wang, W.D.; Su, Y.L.; Wang, H.; Zhang, Z.Y.; Yan, W.B. Pore-scale study of calcite dissolution during CO2-saturated brine injection for sequestration in carbonate aquifers. Gas Sci. Eng. 2023, 114, 204978. [Google Scholar] [CrossRef]
- Tran, T.Q.M.D.; Neogi, P.; Bai, B. Stability of CO2 Displacement of an Immiscible Heavy Oil in a Reservoir. SPE J. 2017, 22, 539–547. [Google Scholar] [CrossRef]
- Wang, Z.; Bai, B.J.; Long, Y.F.; Wang, L.Z. An Investigation of CO2-Responsive Preformed Particle Gel for Conformance Control of CO2 Flooding in Reservoirs with Fractures or Fracture-Like Channels. SPE J. 2019, 24, 2398–2408. [Google Scholar] [CrossRef]
- Gao, Y.C.; Zhao, M.F.; Wang, J.B.; Zong, C. Performance and gas breakthrough during CO2 immiscible flooding in ultra-low permeability reservoirs. Pet. Explor. Dev. 2014, 41, 88–95. [Google Scholar] [CrossRef]
- Sanchez-Rivera, D.; Mohanty, K.; Balhoff, M. Reservoir simulation and optimization of Huff-and-Puff operations in the Bakken Shale. Fuel 2015, 147, 82–94. [Google Scholar] [CrossRef]
- Zhao, F.L.; Zhang, L.; Hou, J.R.; Cao, S.J. Profile improvement during CO2 flooding in ultra-low permeability reservoirs. Pet. Sci. 2014, 11, 279–286. [Google Scholar] [CrossRef]
- Sofia, S.J.D.; Pouladi, B.; Sharifi, M.; Shabankareian, B.; Moraveji, M.K. Experimental and simulation study of gas diffusion effect during gas injection into naturally fractured reservoirs. J. Nat. Gas Sci. Eng. 2016, 33, 438–447. [Google Scholar]
- Song, Z.J.; Hou, J.R.; Liu, X.C.; Wei, Q.; Hao, H.D.; Zhang, L.Y. Conformance control for CO2-EOR in naturally fractured low permeability oil reservoirs. J. Pet. Sci. Eng. 2018, 166, 225–234. [Google Scholar] [CrossRef]
- Wang, H.T.; Guo, J.J.; Zhang, L.H. A semi-analytical model for multilateral horizontal wells in low-permeability naturally fractured reservoirs. J. Pet. Sci. Eng. 2017, 149, 564–578. [Google Scholar] [CrossRef]
- Moradpour, N.; Pourafshary, P.; Zivar, D. Experimental analysis of hybrid low salinity water alternating gas injection and the underlying mechanisms in carbonates. J. Pet. Sci. Eng. 2021, 202, 108562. [Google Scholar] [CrossRef]
- Zhang, Y.; Wang, Y.T.; Xue, F.F.; Wang, Y.Q.; Ren, B.; Zhang, L.; Ren, S.R. CO2 foam flooding for improved oil recovery: Reservoir simulation models and influencing factors. J. Pet. Sci. Eng. 2015, 133, 838–850. [Google Scholar] [CrossRef]
- Wang, J.; Liu, H.Q.; Zhang, J.; Meng, Q.B.; Liu, H.P.; Ge, L.Z.; Zhu, Z.Q.; Liu, C. Experimental investigation on water flooding and continued EOR techniques in buried-hill metamorphic fractured reservoirs. J. Pet. Sci. Eng. 2018, 171, 529–541. [Google Scholar] [CrossRef]
- Conn, C.A.; Ma, K.; Hirasaki, G.J.; Biswal, S.L. Visualizing oil displacement with foam in a microfluidic device with permeability contrast. Lab Chip 2014, 14, 3968–3977. [Google Scholar] [CrossRef]
- Zhu, D.; Li, B.F.; Chen, L.K.; Zhang, C.B.; Zheng, L.; Chen, W.Q.; Li, Z.M. Experimental investigation of CO2 foam flooding-enhanced oil recovery in fractured low-permeability reservoirs: Core-scale to pore-scale. Fuel 2024, 362, 130792. [Google Scholar] [CrossRef]
- Zhao, F.L.; Hao, H.D.; Hou, J.R.; Hou, L.B.; Song, Z.J. CO2 mobility control and sweep efficiency improvement using starch gel or ethylenediamine in ultra-low permeability oil layers with different types of heterogeneity. J. Pet. Sci. Eng. 2015, 133, 52–65. [Google Scholar] [CrossRef]
- Hao, H.D.; Hou, J.R.; Zhao, F.L.; Song, Z.J.; Hou, L.B.; Wang, Z.X. Gas channeling control during CO2 immiscible flooding in 3D radial flow model with complex fractures and heterogeneity. J. Pet. Sci. Eng. 2016, 146, 890–901. [Google Scholar] [CrossRef]
- Zhao, F.L.; Wang, P.; Huang, S.J.; Hao, H.D.; Zhang, M.; Lu, G.Y. Performance and applicable limits of multi-stage gas channeling control system for CO2 flooding in ultra-low permeability reservoirs. J. Pet. Sci. Eng. 2020, 192, 107336. [Google Scholar] [CrossRef]
- Chen, H.; Zhang, X.S.; Chen, Y.; Tang, H.; Mei, Y.; Li, B.W.; Shen, X. Study on pressure interval of near-miscible flooding by production gas Re-injection in QHD offshore oilfield. J. Pet. Sci. Eng. 2017, 157, 340–348. [Google Scholar] [CrossRef]
- Zhang, N.; Wei, M.Z.; Bai, B.J. Statistical and analytical review of worldwide CO2 immiscible field applications. Fuel 2018, 220, 89–100. [Google Scholar] [CrossRef]
- Chen, H.; Li, B.W.; Zhang, X.S.; Wang, Q.; Wang, X.Q.; Yang, S.L. Effect of gas contamination and well depth on pressure interval of CO2 near-miscible flooding. J. Pet. Sci. Eng. 2019, 176, 43–50. [Google Scholar] [CrossRef]
- Yu, H.Y.; Lu, X.; Fu, W.R.; Wang, Y.Q.; Xu, H.; Xie, Q.C.; Qu, X.F.; Lu, J. Determination of minimum near miscible pressure region during CO2 and associated gas injection for tight oil reservoir in Ordos Basin, China. Fuel 2020, 263, 116737. [Google Scholar] [CrossRef]


| Combination Method | TFVC | SIPC | MPDR |
|---|---|---|---|
| S-A | 2.5 | 1.06 | 26.53 |
| S-M-W | 3.7 | 1.47 | 57.88 |
| S-W-S-W | 3.2 | 1.34 | 53.91 |
| W-S-W-S | 3.1 | 1.13 | 39.7 |
Disclaimer/Publisher’s Note: The statements, opinions and data contained in all publications are solely those of the individual author(s) and contributor(s) and not of MDPI and/or the editor(s). MDPI and/or the editor(s) disclaim responsibility for any injury to people or property resulting from any ideas, methods, instructions or products referred to in the content. |
© 2024 by the authors. Licensee MDPI, Basel, Switzerland. This article is an open access article distributed under the terms and conditions of the Creative Commons Attribution (CC BY) license (https://creativecommons.org/licenses/by/4.0/).
Share and Cite
Zhang, X.; Ji, W.; Yu, H.; Li, Y.; Yan, F.; Song, W.; Jiang, X.; Wang, H. A Study on the Plugging Effect of Different Plugging Agent Combinations during CO2 Flooding in Heterogeneous Reservoirs. Energies 2024, 17, 2527. https://doi.org/10.3390/en17112527
Zhang X, Ji W, Yu H, Li Y, Yan F, Song W, Jiang X, Wang H. A Study on the Plugging Effect of Different Plugging Agent Combinations during CO2 Flooding in Heterogeneous Reservoirs. Energies. 2024; 17(11):2527. https://doi.org/10.3390/en17112527
Chicago/Turabian StyleZhang, Xuetong, Wenjuan Ji, Haiyang Yu, Yilin Li, Fei Yan, Weiqiang Song, Xinrui Jiang, and Hongbao Wang. 2024. "A Study on the Plugging Effect of Different Plugging Agent Combinations during CO2 Flooding in Heterogeneous Reservoirs" Energies 17, no. 11: 2527. https://doi.org/10.3390/en17112527
APA StyleZhang, X., Ji, W., Yu, H., Li, Y., Yan, F., Song, W., Jiang, X., & Wang, H. (2024). A Study on the Plugging Effect of Different Plugging Agent Combinations during CO2 Flooding in Heterogeneous Reservoirs. Energies, 17(11), 2527. https://doi.org/10.3390/en17112527