Abstract
This paper presents a dynamic-phasor-based, average-value modeling method for power systems with extensive converter-tied subsystems. In the proposed approach, the overall system model is constructed using modular functions, interfacing both conventional and converter-tied resources. Model validation is performed against detailed Electro-Magnetic Transient (EMT) simulations. The analytical capabilities offered by the proposed modeling method are demonstrated on a modified IEEE 9-bus system. A Graphics Processing Unit (GPU)-based parallel computing approach for the solution of the resulting model is presented and exemplified on a modified IEEE 118-bus system, showing significant improvements in computing efficiency over EMT solvers. A co-simulation approach using a Central Processing Unit (CPU) and a GPU is also presented and exemplified using a modified version of the IEEE 118-bus system, demonstrating the model’s parallelization.
1. Introduction
Large-scale adoption of renewables has profoundly changed the nature of modern power systems. Converter-tied resources do not conform to the electro-mechanical dynamics of conventional synchronous machines; they act much faster and operate through far off-nominal frequency swings. Sophisticated control loops are employed in converter-tied resources, which introduce a wide array of operating time constants leading to interactions with the rest of the power network [1]. These new features also affect the applicability of conventional power system modeling methods by invalidating two main underlying assumptions: that (i) the dynamics of the network elements are sufficiently fast, such that their interactions with the sources and loads are insignificant, and (ii) the system frequency is tightly held close to nominal due to the highly inertial rotary generators. As a result of these two assumptions, network models using quasi-static phasors are widely used in the study of electro-mechanical oscillations in conventional power systems [2,3,4]. For the analysis of faster transients, computationally demanding Electro-Magnetic Transient (EMT) models [5] have been successfully applied. A number of studies [6,7,8] have highlighted the limitations of quasi-static phasor modeling over EMT models for modern converter-integrated systems. Modern networks, in which converters are scattered abundantly, render quasi-static phasor analysis invalid and pose computational challenges for EMT simulations of large systems.
With current Central Processing Unit (CPU) clock speeds reaching their limits, and faced with increasing computational burdens, new methods using parallelization on conventional CPUs and with Graphical Processing Units (GPUs) are critically important for addressing the simulation of converter-intensive networks. Such methods have already been demonstrated for CPU-based EMT simulations [9] relying on the presence of transmission lines whose latency allows network partitioning. GPU implementations have been explored for EMT simulations [10,11,12], although they have been shown to require significant re-configurations. Additionally, EMT simulations offer no direct way to formal system-level study methods such as eigenvalue analysis even though small-signal stability analysis has become an important concern in multi-converter systems. Interactions such as sub-synchronous torsional interactions (SSTI), sub-synchronous control interactions (SSCI), and sub-synchronous resonance (SSR) are best understood analytically through eigenvalue analyses.
A list of emerging modeling methods for converter-intensive systems is available in [13,14]. Positive-sequence dynamic phasor modeling methods represent the dynamics of network elements [15] and are known to provide an accuracy comparable to EMT simulations with lower computational complexity. Dynamic phasor modeling can be carried out similarly to EMT methods [16,17] or in the form of differential and algebraic equations (DAEs) [18]. Representing dynamic phasors using DAEs provides additional advantages such as eigenvalue analysis. A particular dynamic phasor modeling approach that is used for eigenvalue analysis is presented in [1]; however, its implementation for time-domain simulations and parallelization are not described. A GPU–CPU co-simulation approach using dynamic phasors is presented in [19]; however, this approach uses EMT modeling for dynamic phasors, which prevents eigenvalue analysis provisions. A dynamic phasor modeling approach has been presented for multi-converter systems [20]; however, the focus is primarily on the modeling of a large number of converters rather than the power network. Another dynamic phasor modeling approach has been presented and experimentally validated for variable-frequency sources in [21]; however, only synchronous machines are considered, and no analytical capabilities, such as eigenvalue analysis, are presented. An assessment of the quasi-static phasor and dynamic phasor methods with increasing renewable penetration is provided in [22], highlighting the capabilities of dynamic phasor modeling in converter-interfaced systems; however, performance enhancement of dynamic phasor simulations is not discussed. There is clearly a need for a dynamic-phasor-type solver with provisions for formal methods such as linearization and eigenvalue analysis that can be implemented on a parallel computing platform for computational efficiency.
This paper addresses this gap by developing an average-value, positive-sequence modeling method for power systems with converter-tied resources based on dynamic phasors. A GPU parallelization approach is also presented, along with both CPU- and GPU-based executions, providing analytical functionalities and increased computational gains.
2. Dynamic-Phasor-Based Model Development
A positive-sequence dynamic phasor model of a network represents three-phase voltages and currents using two orthogonal elements expressed in either real–imaginary or direct–quadrature (dq0) form (the latter form is adopted in this paper). As a result of this lower dimension, a reduction in the computational complexity of large networks is expected.
2.1. Models for Network Elements
Contrary to conventional phasors, dynamic phasors take into account the time-dependent dynamics of the inductive and capacitive elements of the network. The time-domain equation for the current through a single-phase series RL branch between nodes m and n is given in (1).
where , , and represent the node voltages and line current, and and are the resistance and inductance of the branch. Any current or voltage with time-varying amplitude, frequency, and phase may be shown in the following form:
where is the dynamic phasor corresponding to , and is the fundamental frequency of interest. Note that is a complex quantity and may be expressed in terms of its orthogonal components as follows:
The formulation in (4) is a result of the dynamic phasor differentiation property [15] given by (5a)
where is the dynamic phasor operator [15] that transforms the natural signal into a dynamic phasor, as shown in (5b).
Expanding (4) yields two differential equations, one for each of the orthogonal components of the dynamic phasor, as in (6).
Similarly, the differential equation for the dynamic phasor representation of a capacitor (see Figure 1) is given in (7).
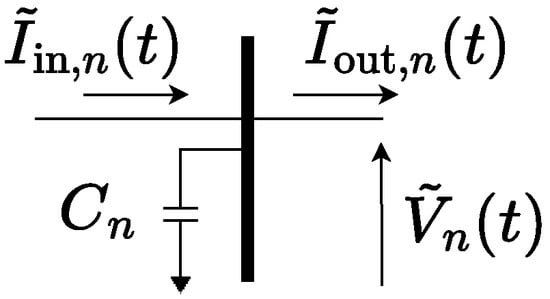
Figure 1.
Dynamic phasor currents and voltages for a capacitor.
The equations in (4) and (7) can be used readily to construct models for various elements of a power system. In dynamic-phasor-based models, transmission lines are often represented using -sections as opposed to the traveling-wave models commonly used in EMT studies. With a -section template, a terminal bus voltage can be represented using (7), with being the summation of the shunt capacitances of the line segments terminating at the bus, and and being replaced with the summation of the incoming and outgoing -section currents. The current through the series RL elements of a -section is represented using (4), which is also an equivalent of a short transmission line segment.
Each line model uses the bus voltage states (d and q components) as its inputs, whilst bus models use the line current states as inputs. The model of the entire network can be constructed by mapping the states and inputs of these individual bus and line modules. Line models can be readily extended to represent series and parallel static loads, reactive shunts, and transformers. Similarly the bus model can be extended to model capacitive shunts, and may be combined with line models to create series-compensated lines.
Certain subsystems may only contain capacitive or inductive elements. Obtaining an input voltage state for the line model is not possible for such subsystems. Typically, this voltage is generated by introducing a large fictitious resistance between the bus and the ground [23]. While this approach works for small-signal studies, it results in a stiff system of equations. The requirement for a voltage as an input can be circumvented through substitution and use of Kirchhoff’s Current Law (KCL) and Kirchhoff’s Voltage Law (KVL) to obtain a much less stiff set of state equations, as in [24].
2.2. Dynamic Devices and Controls
Dynamic devices, such as generators, converters, and their controllers, are modeled as current injection devices using ordinary differential equations, as shown in (8).
where is the vector of bus voltage dynamic phasors at the device’s terminal, denotes the device’s control inputs, and denotes the state variables of the device. The state variables in are used to formulate the current injections to the network. It is also used in the bus model (see (7)).
If a dynamic device’s model is to connect to a line model equivalent (e.g., a generator connecting through a transformer), where both models have voltages as inputs, the line model needs to be included in the dynamic device’s model so that the dynamic device remains a current injection source with a voltage input.
2.3. Reference Frame Transformation
The term in (6) denotes the momentary frequency of the natural quantities that are transformed to dynamic phasors. Since there are multiple frequency generation sources in the system, a constant nominal value cannot be used in the development of various component models. As such, the dynamic phasor quantities of the network (i.e., the line, bus, and static load models) are represented using the frequency of one of the sources (typically the generator at the slack bus in the power flow solution) with a rotational speed of , which is taken as the frequency of the common reference frame. Other sources are modeled in their own reference frames rotating at their respective speeds. Dynamic phasors of voltages and currents from other reference frames are transformed back and forth between the common reference frame and their own respective reference frames [1,23].
Figure 2 depicts the overall model of the system consisting of sources, network elements, and reference frame transformations. A prime superscript denotes variables in the reference frame of individual converters. The block labeled ’Dynamic Phasor Network Model’ accepts current injections and frequency () as inputs and produces the node voltages as the output. This system of DAEs can be solved using a suitable integration method, as described in Section 3.
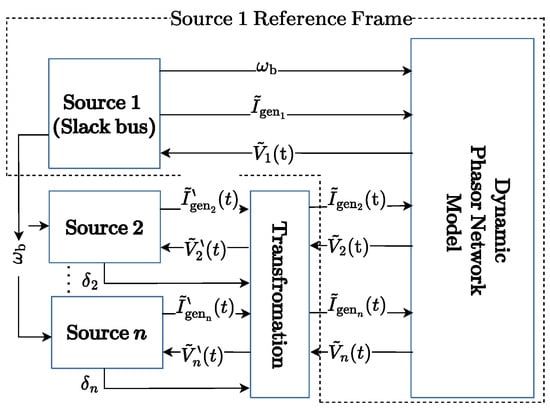
Figure 2.
A system’s overall model using dynamic-phasor-based subsystems.
3. Simulation Algorithms and CPU–GPU Execution Method
Conventional transient stability solvers model dynamic devices using DAEs with the network as a set of algebraic (using conventional phasors) equations. Partitioned explicit or simultaneous implicit methods [3] are used based on the required level of numerical stability or convenience of implementation. EMT simulators, on the other hand, utilize numerical integrator substitution and companion circuit models to calculate instantaneous values of time-domain quantities. The dynamic phasor modeling method proposed herein consists of non-linear DAEs which are combined to model the overall power system. Since, in the proposed approach, both the sources and the network consist of DAEs, solving the overall system of equations using a single integration method provides better stability in comparison to partitioned solution methods. Two distinct integration methods are used for the solution of the resulting system of equations.
3.1. Explicit Integration—Runge–Kutta Method
The Runge–Kutta (RK4) is an explicit integration method. For solving a non-linear system of equations, the eigenvalues of the linearized system of equations need to remain within the time-step-dependent stability boundary of the RK4 integration method. The system of dynamic phasor equations developed here includes inductive and capacitive elements that give rise to high-frequency resonant modes which determine the time-step of the RK4 integration method. Experiments with several IEEE benchmark systems with network dynamics represented using the proposed modeling method showed that simulation time-steps in the range of 10–200 s are necessary to accurately capture the network dynamics.
While simulating conventional power systems with time-steps in the micro-second range is commonly seen in EMT solvers, non-EMT simulation of systems with converter-tied resources shows that solutions using small time-steps are essential due to the wide range of time constants generated by controls and filter elements.
3.2. Implicit Integration—Backward Euler
The implicit backward Euler method provides a solution to a system of equations using the present value and an estimated value at the next time-step. For non-linear systems, this value is estimated using an iterative method such as the Newton–Rapson method, which involves a Jacobian calculation and a matrix inversion at every time-step. The computational cost associated with the Jacobian calculation and matrix inversion is significant and introduces complexity for GPU computations [10]. As a result, for this paper, the backward Euler method is implemented only for CPU-based computations of the dynamic phasor model.
3.3. GPU Implementation Using Runge–Kutta Method
Unlike CPUs, modern GPUs consist of thousands of computational cores that allow parallel execution on a massive scale. Popular hardware implementations include NVIDIA’s Compute Unified Device Architecture (CUDA) and AMD’s ROCm. The GPU implementation for the model in this paper utilizes CUDA. The functions executed in the GPU are known as CUDA kernels. The dynamic phasor model is implemented as a single CUDA kernel, where individual functions and function groups within the kernel are executed in parallel for each evaluation.
The software implementation of the GPU consists of execution units defined as threads, blocks, and grids, with the threads being the smallest execution unit. The number of threads per block and the number of blocks per grid can be defined so as to optimize the performance gain. This requires similar functions to be combined into thread groups that can fit into individual blocks. As a result, each group of functions (lines, buses, sources, etc.) is assigned to a group of threads identified by unique thread identifiers, and each function is assigned to a particular thread. Depending on the type of function, it may contain computation of a number of DAEs. The dynamic phasor model discussed in Section 1 consists of three main types of DAEs. These include:
- Dynamic network models (bus, line, and static loads);
- Dynamic source and load models;
- Reference frame angles for dynamic sources and loads.
Each function requires values of states from its neighboring functions as inputs and a list of parameters. Except for the bus function, all other functions have a predefined number of inputs from the system state vector. For example, a line function has inputs only from the two connected bus functions; the input state for a dynamic source or load model is the connected bus voltage and, for reference frame angles, the frequencies of the generating element and the frequency of the reference frame. Hence, each of these functions is provided with a vector containing the index of the required inputs from the overall system state vector. For bus functions, the number of inputs varies based on the number of connected lines, which is provided in the form of two matrices. The rows of the matrices represent the bus number, while the columns contain the index of the current in the overall state vector. The general format of an executed function is illustrated in Figure 3.
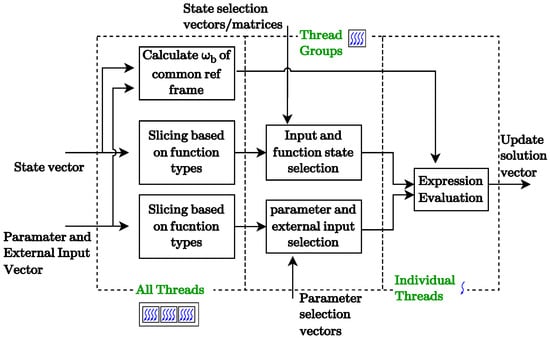
Figure 3.
Threaded execution of a dynamic phasor CUDA kernel.
The four stages of the RK4 solver require evaluation of the dynamic phasor equations sequentially. While the four stages are executed one after the other, the evaluation of each stage can be parallelized using threads. Each stage of the RK4 is thus sequentially executed as an individual CUDA kernel while providing its output to the dynamic phasor model. The execution of the RK4 solver in the GPU is shown in Figure 4.
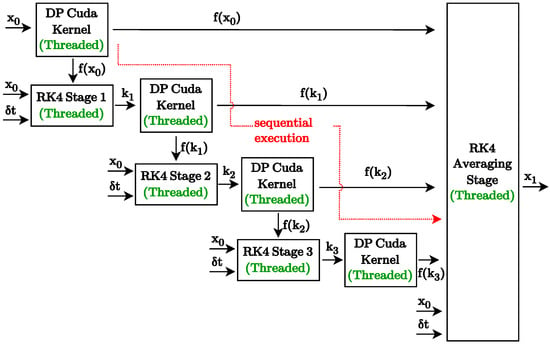
Figure 4.
Threaded execution of the RK4 solution method.
3.4. Overall Model Execution and Simulation
Initialization of the model is carried out by obtaining the bus voltages and phase angles of the sources through a power flow program. Once in steady state, the system of equations can be linearized for eigenvalue analysis through numerical perturbations, also known as the Jacobian calculation. This step can also be accelerated using GPUs. Run-time plotting of the simulated results requires GPU simulation data to be transferred to the CPU. Since CPU–GPU transfers are generally known to adversely affect the simulation performance, a plot step may be implemented that transfers the data for run-time viewing in larger time intervals. Full traces (i.e., containing all solved samples) can be obtained by storing the data in the GPU memory throughout the transient and transferring them at once.
4. Validation and Performance Comparison
For validation of the proposed modeling approach and to assess its computational performance, two systems are considered: the IEEE 9-bus system with synchronous generators and the IEEE 118-bus system fully equipped with grid-forming and grid-following inverters. The models are developed using Python and numpy/SciPy open-source libraries [25,26], just-in-time compilation tool Numba [27], and run-time plotting library pyQtgraph. The specifications of the CPU and GPU on which the simulations were carried out are given in Table 1. The GPU is a pre-configured unit available with conventional desktop computers. The use of a pre-configured GPU for simulations confirms that the proposed method does not require costly, high-end GPUs to achieve significant performance gains.

Table 1.
CPU and GPU specifications.
4.1. Model Validation
In order to create a current injection model for the synchronous generator, the eighth-order machine model [2] with stator fluxes as state variables was modified with the inclusion of the step-up transformer impedances. The sources in the IEEE 9-bus system [28] were then equipped with this generator model for validation against EMT simulation results from PSCAD/EMTDC. The generators were also equipped with an AC4A exciter model and a mechanical hydraulic governor model, which has proportional control with transient droop (GOV1), along with a turbine model that contains a non-elastic water column without a surge tank (TUR1). The power flows in the modified system were matched to those in the original IEEE 9-bus system with infinite buses.
The dynamic phasor model of this system has 77 state equations, of which 45 belong to the generators, 35 to the network, and 2 to reference frame angles. In steady state, a bolted three-phase fault at bus 5 was simulated. The same fault was also applied to a benchmark EMT model in the PSCAD/EMTDC. Both models were simulated with a time-step of 10 s. The fault was emulated in the dynamic phasor model by forcing the solution of the state equation for the bus function at bus 5 to zero during the fault. This removed the two states associated with the bus and provided a zero-voltage input to the faulted sides of the connected line functions. The active power response of the generator at bus 7 is shown in Figure 5 for a six-cycle fault applied at s. The traces from the dynamic phasor and the EMT models are in full conformity.
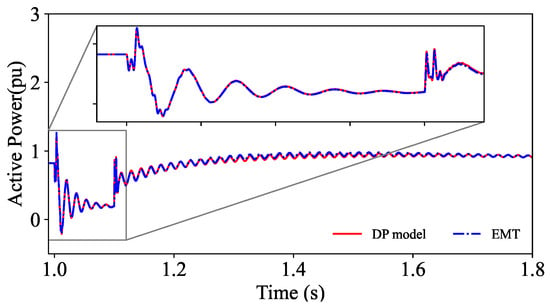
Figure 5.
Active power response of the generator at bus 7 to a fault.
Additionally, a tripping event was simulated for the line between buses 8 and 9 by forcing the solution of the line function to zero and removing the respective capacitances from the terminating bus functions. As a result, the current injections (from the removed line) to the connecting buses were driven to zero. The resulting transient response of the active power of the generator connected to bus 9 is shown in Figure 6 and is in close agreement with EMT results.
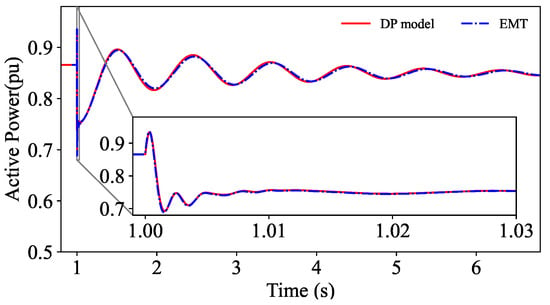
Figure 6.
Active power response of the generator at bus 9 to tripping a line.
4.2. GPU-Accelerated Simulations
The GPU implementation of the dynamic phasor kernel is shown in Figure 7, which also shows the states that are provided as inputs to individual functions. The execution for a single system is performed with 20 threads, with each thread being assigned to a single modular function. Source models require input states from the connected bus, whereas the line and load models also require voltage states from the connected buses. Bus models require state inputs from line, source, and load models. Since the source injections need to be transformed to the common reference frame, the transformation is performed in the bus function, taking in the states of the transformation angles as inputs. Calculations of these injections are carried out in individual threads associated with individual bus functions and are stored in the local thread memory available. The rest of the arrays, which include the states and parameters, are stored in global memory arrays and are accessed with state/parameter selection vectors, as shown in Figure 3.
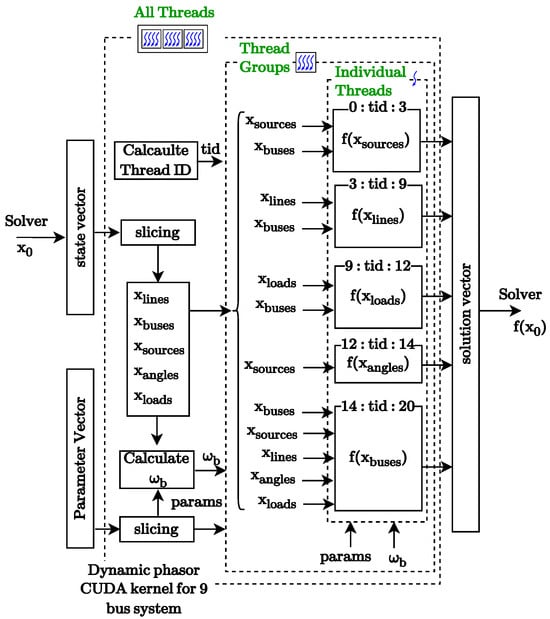
Figure 7.
Dynamic phasor CUDA kernel for the 9-bus system.
GPU-based execution of the dynamic phasor model can be used for studies that require repetitive simulations. To demonstrate the capability and the advantage of running multiple simulation cases in parallel, 500 cases of the IEEE 9-bus system equipped with the synchronous generator models used in Section 4.1 were developed. The entire study involved 38,500 state variables, with each simulation case containing 77 states. For the execution of multiple cases, the CUDA kernel of the dynamic phasor model was modified to split the states and function executions based on multiple case indexes and threads, which can combine each case into a group of threads. A case index shifts the conditional statements for thread numbers used to identify thread groups of different functions in individual cases.
The purpose of this example is to study the impact of the inertia of each generator on the frequency nadir of the system. The inertia constant of each synchronous generator was randomized to have a value between 4 s and 9 s. The active power load at each load bus was increased by 10 MW at s while the frequency nadir of each synchronous generator was recorded. The model with 500 cases was simulated with a time-step of 400 s. The simulation was executed until the frequency nadir was recorded around s. It took approximately 14.24 s of CPU–GPU time to execute all 500 cases in parallel.
The system was initialized with all three synchronous generators rated at 150 MW. The frequency nadir of each case was plotted versus the value of the inertia constant of each generator, as shown in Figure 8. While the general impact of increasing the inertia constant was improvement of the frequency nadir, the contribution of each generator’s inertia constant was similar for all the generators.
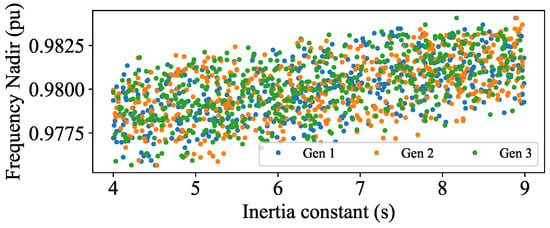
Figure 8.
Distribution of frequency nadir with inertia for each generator with a 150 MW capacity.
Next, the generator at bus 7 was replaced with a 250 MW unit and the other two generators reduced to 100 MW each. The resulting plot is shown in Figure 9. It shows that generator 2 dominates the frequency nadir as the dispersion of the values is less for generator 2 in comparison with the other generators. Furthermore, as the inertia constant increases, the dispersion among the values of generator 2 is further reduced, indicating that the frequency nadir of a power system is dominated by the generator with the highest inertia.
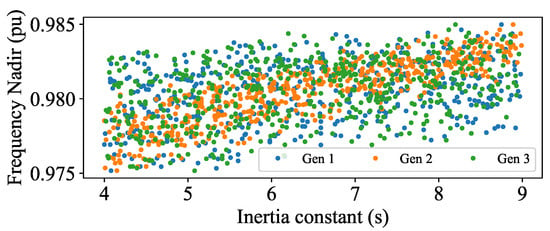
Figure 9.
Distribution of frequency nadir with generator 2 at 250 MW and generators 1 and 3 at 150 MW.
This exemplifies the capability of GPU simulations to analyze the frequency dynamics of power systems with different generator configurations. For power system planning studies of low-inertia grids, the ability to simulate multiple configurations in parallel can provide significant time savings.
4.3. Eigenvalue Assessment Capability
The IEEE 9-bus system model was equipped with grid-following and grid-forming converters to represent a system with extensive converter-based resources. The converter models described in [29] were used for implementation. Each synchronous generator was replaced with a grid-following converter with active and reactive power injections matching the power flows of the original system. For frequency support, each of the three generator buses was also equipped with grid-forming units with 10% capacity of the grid-following unit at each bus. Once the power flows were matched to be identical, the two networks were linearized, and eigenvalues and participation factors were generated for comparison.
In Figure 10a, the states 1–49 belong to the synchronous generators; the rest of the states belong to the network and inductive loads. The plot indicates a clear separation in the participation factors. Participation in lower frequencies is dominated by synchronous machines, while the network states participate in higher-order dynamics associated with -sections.
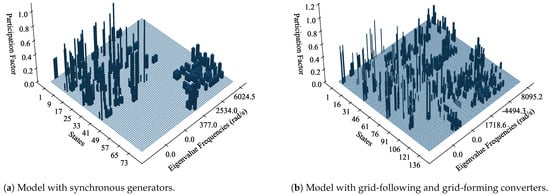
Figure 10.
Comparison of eigenvalues and participation factors for two variants of the IEEE 9-bus system.
In Figure 10b, the converter state variables range from 1 to 112, and the rest belong to the network. In comparison with Figure 10a, a clear separation is no longer observable. A number of high-frequency eigenvalues participate in the states of the converter filters, which fall in the range of the eigenvalues that participate in the network resonances. Some eigenvalues in the frequency range of 3000–8000 rad/s participate in the converter filter states and overlap with the frequencies of the eigenvalues participating in the network states. This is indicative of a possible resonance that can occur in converter-dominated grids. The two plots also highlight the dynamic phasor model’s capability in providing analytical insight into converter-penetrated systems, a feature that is not readily available in EMT models.
4.4. Comparison of Time-Domain Simulation Performance
4.4.1. Simulation Performance for a Single Case
To compare the time-domain simulation performance of the proposed method against EMT solutions, the IEEE 118-bus system model [30] was equipped with renewable generation sources containing both grid-following and grid-forming units. The IEEE 118-bus system consists of 54 generation sources, each of which is equipped with a grid-forming converter and a grid-following converter. Similar to the case in Section 4.3, the power output of the grid-following converters was adjusted to match the original power flow, with the grid-forming converters used for voltage and frequency control. Each grid-following converter was set to provide 0.2 pu reactive power to retain system voltages within the limits. All grid-forming units, except for the one at bus 10, were rated to 30% capacity of the grid-following converter of the same bus. The grid-forming unit at bus 10 was given the same capacity as its grid-following unit. The system was also modeled using both detailed (DET) and average-value (AVM) EMT models without parallelization. The total CPU times to execute the dynamic phasor and EMT models in the eight-core CPU are shown in Table 2. For fair simulation–time comparisons, run-time plotting in both models was disabled.

Table 2.
Simulation time performance comparison for a single case.
For a single simulation, the dynamic phasor solution using RK4 on the CPU showed a performance gain, performing approximately 5 times better than the AVM. In comparison with the detailed EMT switching model, it is noticeable that the simulation speed is significantly degraded when detailed switching models are employed in a single simulation case.
The dynamic phasor model solved using the backward Euler method is computationally expensive even at a time-step 10 times larger than the RK4 method. This computational cost is associated with the Jacobian calculation and matrix inversion carried out at each time-step. While the result shown here used the simplest implementation of the backward Euler integration method for a fair comparison with the RK4 method, implicit methods’ performance can be improved by reusing the Jacobians and by taking advantage of variable time-step solvers. Such optimized solvers based on implicit methods provide better performance [18]; however, they often require alterations that affect the parallelization capability and stability of simulation. In particular, the implementation of matrix inversion and Jacobian calculation on a GPU involves multiple additional sequential computations, which become expensive and inefficient as the size of the network increases.
4.4.2. Simulation Performance of Multiple Cases in Parallel
To compare parallel simulation performance, sets of 8 and 16 cases were simulated using the EMT solver. Since the performance markedly drops as the number of parallel cases increases beyond the number of cores available, the set with 16 cases was simulated on a 16-core CPU. This allowed even distribution of cases among the CPU cores, resulting in improved utilization. Both the 8-case and 16-case sets of GPU-accelerated dynamic phasor models were simulated on the same GPU, parallelized as shown in Section 3.3 and configured for multiple cases as in Section 4.2. Simulation execution times and speed-up gains are shown in Table 3.

Table 3.
Simulation performance comparison for multiple cases simulated in parallel.
The results indicate that GPU simulations provide a speed-up gain of 25–34 times based on the number of cases executed. While the number of cases can be increased in the GPU with minimal increase in execution time, EMT simulation times using the CPU drastically increase once the number of cases exceeds the number of cores available, as seen from the last row of Table 3.
However, such a limitation does not exist for the GPU-accelerated model due to the fine-grained parallelization of individual modular functions used to construct the power system model. Figure 11 shows the simulation time for the GPU execution of the 118-bus system’s dynamic phasor model with an increasing number of cases; while increasing the number of cases does in fact increase the simulation time, the total time taken is much less than in a counterpart CPU computation, indicating better scalability. Note that these performance gains may be different with different types of converters or dynamic load models that exist within a network. In such cases, thread assignments may require changes so that similar functions may be grouped together for optimal performance.
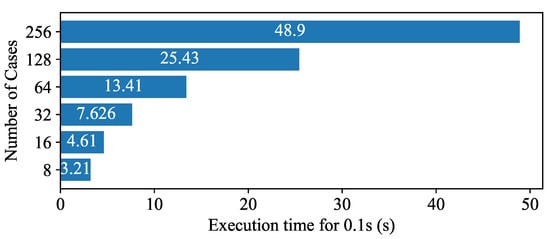
Figure 11.
Execution times for multiple cases of the model on GPU.
4.5. Co-Simulation with an Electro-Magnetic Transient Solver
The ability to co-simulate with an EMT solver allows the computational load of the simulation to be shared between the CPU and GPU. In addition, this allows manufacturer-compiled (i.e., black-boxed) EMT models to work with the proposed dynamic phasor model. Manufacturer models are often computationally intensive, and hence their simulation can be improved by sharing the computational load with the GPU. To demonstrate this, the grid-forming converter at bus 31, including the converter transformer and impedances up to the Point of Common Coupling (PCC), was modeled as an EMT detailed switching model and linked with the dynamic phasor model through PSCAD/EMTDC’s co-simulation API. The interfaced model is shown in Figure 12.
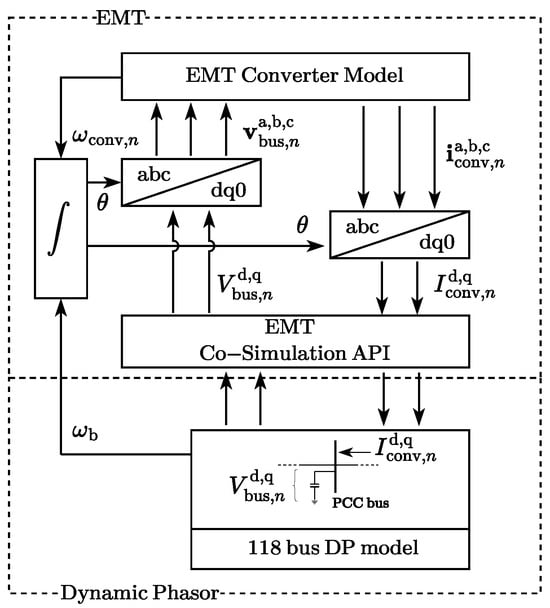
Figure 12.
Dynamicphasor and EMT co-simulation configuration.
The d and q components of the bus voltage’s dynamic phasor (), and the frequency of the common reference frame , in the dynamic phasor model are transferred to the EMT model through the EMT co-simulation API and transformed from the common reference frame to the converter reference frame. They are then converted to three-phase quantities and provided as PCC voltages to the converter model in the EMT simulator. The converter’s current injections to the PCC, which are in the abc domain, are then converted to dq0 components and transformed to the common reference frame before being provided as current injections to the same bus in the system’s dynamic phasor model. Both models were simulated with a time-step of 30 s. A fault was applied at bus 2, and the active and reactive power responses of the grid-forming converter with and without co-simulation are shown in Figure 13. The case without co-simulation was simulated using dynamic phasors and solved using the RK4 integration method. For the co-simulated case, the dynamic phasor components of the network were solved using the RK4 integration method, and converter models were solved using the EMT solver. The responses indicate a close agreement between the two models.
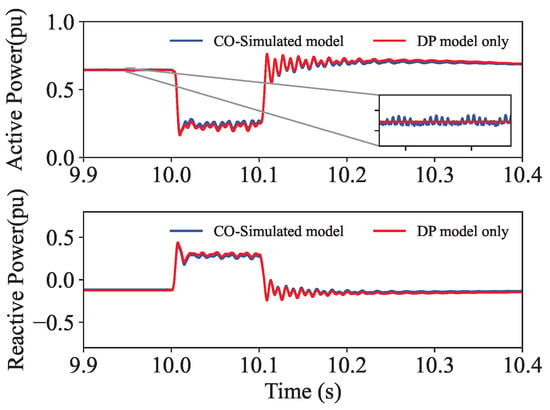
Figure 13.
Active and reactive power of the grid-forming converter at bus 31.
To assess the performance of GPU–CPU co-simulation, two scenarios were tested by co-simulating an EMT model with a GPU dynamic phasor model. In the first case, all 54 grid-forming devices of the IEEE 118-bus system were modeled as detailed switching EMT models and co-simulated with a single 118-bus DP model executed on a GPU. A total of 109 values containing bus voltages of the 54 converter buses and the frequency of the common reference frame were given to the EMT model. In return, 108 values of current injections of the converters were provided back to the dynamic phasor model. For the second scenario, eight such cases were simulated in parallel in the CPU as a simulation set, with the grid-forming converters of each case as EMT switching models and the rest of the network modeled in the GPU in dynamic phasor form. The numbers of signals exchanged for the bus voltages and current injections were multiples of 8, with an additional eight values for the reference frame angles provided from the dynamic phasor models to the EMT models. The simulation execution times are shown in Table 4.

Table 4.
CPU–GPU co-simulation of the IEEE 118-bus system.
In comparison with the results shown in Table 2 for the EMT switching model, the co-simulated model showed a significant improvement of approximately 80 times as all the grid-following converters and the network were simulated in the GPU as dynamic phasor models. However, the scenario with eight cases performed approximately 3 times slower than the single-case scenario due to the large number of signals communicated between the CPU and GPU, a known limitation that occurs when CPU to GPU transfers are increased.
5. Conclusions
This paper presented a modeling method for power systems with conventional generators and converter-tied renewable resources based on dynamic phasors and in the form of modular functions. The transient responses generated using this modeling method were thoroughly validated against detailed EMT simulations. The analytical capabilities of the developed model, e.g., eigenvalue analysis, were demonstrated on a modified IEEE 9-bus system with conventional and renewable generation resources. A GPU-based parallel computing approach for solution of the model was presented and exemplified on a 100% renewable integrated IEEE 118-bus system, showing significant improvements in computing speed over CPU-executed EMT models. The co-simulation capability of the dynamic phasor model with a commercial EMT simulator was presented, demonstrating the capability to share the simulation load with the GPU while allowing detailed converter models to be simulated in CPU. With the growing size of power networks and the increasing number of interactions observed therein, the proposed modeling approach with GPU acceleration and analytical capabilities provides significant computational advantages.
Author Contributions
Conceptualization: all authors; methodology: S.P. and S.F.; software: S.P.; validation: S.P. and S.F.; formal analysis: all authors; investigation: S.P.; resources: S.F. and D.M.; data curation: S.P.; writing—original draft preparation: all; writing—review and editing: all; visualization: S.P. and S.F.; supervision: S.F. and D.M.; project administration: S.F.; funding acquisition: S.F. and D.M. All authors have read and agreed to the published version of the manuscript.
Funding
This work was supported in part by the Natural Sciences and Engineering Research Council (NSERC) of Canada, MITACS, and Manitoba HVDC Research Center.
Data Availability Statement
The developed IEEE 118-bus system models for CPU and GPU benchmarking are provided at https://github.com/shiroshpeiris/DPmodels with relevant parameters.
Conflicts of Interest
Author Dharshana Muthumuni was employed by the company Manitoba Hydro International. The remaining authors declare that the research was conducted in the absence of any commercial or financial relationships that could be construed as a potential conflict of interest.
Abbreviations
The following abbreviations are used in this manuscript:
| EMT | Electro-Magnetic Transient |
| DP | Dynamic phasor |
| CPU | Central Processing Unit |
| GPU | Graphics Processing Unit |
| CUDA | Compute Unified Device Architecture |
| AVM | Average-value model |
| DET | Detailed switching model |
| PCC | Point of Common Coupling |
| KCL | Kirchhoff’s Current Law |
| KVL | Kirchhoff’s Voltage Law |
| DAEs | Differential and algebraic equations |
References
- Markovic, U.; Stanojev, O.; Aristidou, P.; Vrettos, E.; Callaway, D.; Hug, G. Understanding Small-Signal Stability of Low-Inertia Systems. IEEE Trans. Power Syst. 2021, 36, 3997–4017. [Google Scholar] [CrossRef]
- Kundur, P. Synchronous Machine Theory and Modelling. In Power System Stability and Control, 2nd ed.; McGraw-Hill: New York, NY, USA, 1994; pp. 45–136. [Google Scholar]
- Stott, B. Power System Dynamic Response Calculations. Proc. IEEE 1979, 67, 219–241. [Google Scholar] [CrossRef]
- Pai, M.; Sauer. Multimachine Simulation. In Power System Dynamics and Stability, 1st ed.; Prentice Hall: Hoboken, NJ, USA, 1998; pp. 161–218. [Google Scholar]
- Dommel, H.W. Electromagnetic Transients in Single- and Multiphase Networks. IEEE Trans. Power Appar. Syst. 1969, PAS-88, 388–399. [Google Scholar] [CrossRef]
- Kenyon, R.W.; Wang, B.; Hoke, A.; Tan, J.; Hodge, B.M. Comparison of Electromagnetic Transient and Phasor Dynamic Simulations: Implications for Inverter Dominated Systems. In Proceedings of the 2023 IEEE Power & Energy Society Innovative Smart Grid Technologies Conference (ISGT), Washington, DC, USA, 16–19 January 2023; pp. 1–5. [Google Scholar] [CrossRef]
- Du, W.; Singhal, A.; Tuffner, F.K.; Schneider, K.P. Comparison of Electromagnetic Transient and Phasor-based Simulation for the Stability of Grid-Forming-Inverter-based Microgrids. In Proceedings of the 2021 IEEE Power & Energy Society Innovative Smart Grid Technologies Conference (ISGT), Washington, DC, USA, 16–18 January 2021; pp. 1–5. [Google Scholar] [CrossRef]
- Favuzza, S.; Musca, R.; Zizzo, G.; Sa’ed, J.A. Comparative Modeling and Analysis of EMT and Phasor RMS Grid-Forming Converters Under Different Power System Dynamics. IEEE Trans. Ind. Appl. 2024, 60, 3613–3624. [Google Scholar] [CrossRef]
- Bonatto, B.D.; Armstrong, M.L.; Martí, J.R.; Dommel, H.W. Current and voltage dependent sources modelling in MATE-multi-area Thévenin equivalent concept. Electr. Power Syst. Res. 2016, 138, 138–145. [Google Scholar] [CrossRef]
- Zhou, Z.; Dinavahi, V. Fine-Grained Network Decomposition for Massively Parallel Electromagnetic Transient Simulation of Large Power Systems. In Proceedings of the 2018 IEEE Power & Energy Society General Meeting (PESGM), Portland, OR, USA, 5–10 August 2018; p. 1. [Google Scholar] [CrossRef]
- Debnath, J.K.; Gole, A.M.; Fung, W.K. Graphics-processing-unit-based acceleration of electromagnetic transients simulation. IEEE Trans. Power Deliv. 2016, 31, 2036–2044. [Google Scholar] [CrossRef]
- Song, Y.; Chen, Y.; Huang, S.; Xu, Y.; Yu, Z.; Xue, W. Efficient GPU-Based Electromagnetic Transient Simulation for Power Systems With Thread-Oriented Transformation and Automatic Code Generation. IEEE Access 2018, 6, 25724–25736. [Google Scholar] [CrossRef]
- Lara, J.D.; Henriquez-Auba, R.; Ramasubramanian, D.; Dhople, S.; Callaway, D.S.; Sanders, S. Revisiting Power Systems Time-domain Simulation Methods and Models. IEEE Trans. Power Syst. 2023, 39, 2421–2437. [Google Scholar] [CrossRef]
- Peng, Q.; Buticchi, G.; Tan, N.M.L.; Guenter, S.; Yang, J.; Wheeler, P. Modeling Techniques and Stability Analysis Tools for Grid-Connected Converters. IEEE Open J. Power Electron. 2022, 3, 450–467. [Google Scholar] [CrossRef]
- Venkatasubramanian, V.; Schättler, H.; Zaborszky, J. Fast Time-Varying Phasor Analysis in the Balanced Three-Phase Large Electric Power System. IEEE Trans. Autom. Control 1995, 40, 1975–1982. [Google Scholar] [CrossRef]
- Mudunkotuwa, K.; Filizadeh, S.; Annakkage, U. Development of a hybrid simulator by interfacing dynamic phasors with electromagnetic transient simulation. IET Gener. Transm. Distrib. 2017, 11, 2991–3001. [Google Scholar] [CrossRef]
- Rupasinghe, J.K. Advanced Methods, Models, and Algorithms for Multi-Rate Co-Simulation of Power System Transients. Ph.D. Thesis, University of Manitoba, Winnipeg, MB, Canada, 2021. [Google Scholar]
- Kulasza, M.A.; Annakkage, U.D.; Karawita, C. Extending the Frequency Bandwidth of Transient Stability Simulation Using Dynamic Phasors. IEEE Trans. Power Syst. 2022, 37, 249–259. [Google Scholar] [CrossRef]
- Shu, D.; Wei, Y.; Dinavahi, V.; Wang, K.; Yan, Z.; Li, X. Cosimulation of Shifted-Frequency/Dynamic Phasor and Electromagnetic Transient Models of Hybrid LCC-MMC DC Grids on Integrated CPU-GPUs. IEEE Trans. Ind. Electron. 2020, 67, 6517–6530. [Google Scholar] [CrossRef]
- Nazari, A.; Xue, Y.; Motwani, J.K.; Cvetkovic, I.; Dong, D.; Boroyevich, D. Dynamic Phasor Modeling of Multi-Converter Systems. In Proceedings of the 2021 IEEE Energy Conversion Congress and Exposition (ECCE), Vancouver, BC, Canada, 10–14 October 2021; pp. 2716–2721. [Google Scholar] [CrossRef]
- Yang, T.; Bozhko, S.; Le-Peuvedic, J.M.; Asher, G.; Hill, C.I. Dynamic Phasor Modeling of Multi-Generator Variable Frequency Electrical Power Systems. IEEE Trans. Power Syst. 2016, 31, 563–571. [Google Scholar] [CrossRef]
- Vega-Herrera, J.; Rahmann, C.; Valencia, F.; Strunz, K. Analysis and Application of Quasi-Static and Dynamic Phasor Calculus for Stability Assessment of Integrated Power Electric and Electronic Systems. IEEE Trans. Power Syst. 2021, 36, 1750–1760. [Google Scholar] [CrossRef]
- Pogaku, N.; Prodanovic, M.; Green, T.C. Modeling, Analysis and Testing of Autonomous Operation of an Inverter-Based Microgrid. IEEE Trans. Power Electron. 2007, 22, 613–625. [Google Scholar] [CrossRef]
- Peiris, P.; Filizadeh, S.; Muthumuni, D. An Improved state-space modelling approach for modelling converter based Microgrid networks. J. Mod. Power Syst. Clean Energy 2023, in press. [Google Scholar]
- Harris, C.R.; Millman, K.J.; van der Walt, S.J.; Gommers, R.; Virtanen, P.; Cournapeau, D.; Wieser, E.; Taylor, J.; Berg, S.; Smith, N.J.; et al. Array programming with NumPy. Nature 2020, 585, 357–362. [Google Scholar] [CrossRef] [PubMed]
- Virtanen, P.; Gommers, R.; Oliphant, T.E.; Haberland, M.; Reddy, T.; Cournapeau, D.; Burovski, E.; Peterson, P.; Weckesser, W.; Bright, J.; et al. SciPy 1.0: Fundamental Algorithms for Scientific Computing in Python. Nat. Methods 2020, 17, 261–272. [Google Scholar] [CrossRef] [PubMed]
- Lam, S.K.; Pitrou, A.; Seibert, S. Numba: A LLVM-based Python JIT compiler. In Proceedings of the Second Workshop on the LLVM Compiler Infrastructure in HPC—LLVM’15, Austin, TX, USA, 15 November 2015; Association for Computing Machinery: New York, NY, USA, 2015; pp. 1–6. [Google Scholar]
- Illinois Center for a Smarter Electric Grid (ICSEG), WSCC 9-Bus System. Available online: https://icseg.iti.illinois.edu/wscc-9 (accessed on 4 April 2024).
- Peiris, P.S.A.; Filizadeh, S. An open-source platform for modelling, simulation, and performance analysis of multi-converter, mixed-generation power systems. In Proceedings of the 18th International Conference on AC and DC Power Transmission (ACDC 2022), Online, 2–3 July 2022; pp. 206–213. [Google Scholar] [CrossRef]
- Illinois Center for a Smarter Electric Grid (ICSEG), IEEE 118-Bus System. Available online: https://icseg.iti.illinois.edu/ieee-118 (accessed on 4 April 2024).
Disclaimer/Publisher’s Note: The statements, opinions and data contained in all publications are solely those of the individual author(s) and contributor(s) and not of MDPI and/or the editor(s). MDPI and/or the editor(s) disclaim responsibility for any injury to people or property resulting from any ideas, methods, instructions or products referred to in the content. |
© 2024 by the authors. Licensee MDPI, Basel, Switzerland. This article is an open access article distributed under the terms and conditions of the Creative Commons Attribution (CC BY) license (https://creativecommons.org/licenses/by/4.0/).