Article

Combustion Mechanism of Gasoline Detonation Tube and Coupling of Engine Turbocharging Cycle

State Key Laboratory of Engines, Tianjin University, Tianjin 300072, China
*
Author to whom correspondence should be addressed.
Energies 2024, 17(11), 2466; https://doi.org/10.3390/en17112466
Submission received: 9 April 2024 / Revised: 9 May 2024 / Accepted: 18 May 2024 / Published: 22 May 2024
(This article belongs to the Topic Zero Carbon Vehicles and Power Generation)

Abstract

:
Traditional exhaust-gas turbocharging exhibits hysteresis under variable working conditions. To achieve rapid-intake supercharging, this study investigates the synergistic coupling process between the detonation and diesel cycles using gasoline as fuel. A numerical simulation model is constructed to analyze the detonation characteristics of a pulse-detonation combustor (PDC), followed by experimental verification. The comprehensive process of the flame’s deflagration-to-detonation transition (DDT) and the formation of the detonation wave are discussed in detail. The airflow velocity, DDT time, and peak pressure of detonation tubes with five different blockage ratios (BR) are analyzed, with the results imported into a one-dimensional GT-POWER engine model. The results indicate that the generation of detonation waves is influenced by flame and compression wave interactions. Increasing the airflow does not shorten the DDT time, whereas increasing the BR causes the DDT time to decrease and then increase. Large BRs affect the initiation speed of detonation in the tube, while small BRs impact the DDT distance and peak pressure. Upon connection to the PDC, the transient response rate of the engine is slightly improved. These results can provide useful guidance for improving the transient response characteristics of engines.

1. Introduction

When an engine steps from a low load to a high load, because of the hysteresis of the response to the exhaust gas turbocharger, the intake charge becomes far too low to produce the required acceleration, which seriously worsens the engine’s performance and may cause the engine to stall [1]. Therefore, improving the turbocharger’s transient response capability is the key to improving the acceleration performance of the engine. Pulse detonation combustion approximates constant volume combustion and is characterized by a fast combustion rate and a small entropy increase [2,3,4]. It can obtain high-temperature and high-pressure working fluid in an extremely short time, provide additional energy for the exhaust gas turbocharger, promote the rapid rotation of the turbine to supply sufficient fresh air for the engine, and enable the engine to switch to the steady operation mode quickly and smoothly through the valve, injection, and other synergistic control.
The pulse-detonation combustor (PDC) is the core component for generating pulse detonation waves. Optimizing the structure of the combustor can effectively enhance the intensity of detonation combustion, thus improving the transient response rate of the engine. The critical technologies of pulse detonation combustion mainly include air intake, detonation, and gas exchange, wherein the fuel atomization and mixing of fuel, the geometry of the detonation combustor, and the composition of the oxidant and the ignition energy each have an important influence on ignition.
Compared with conventional combustion, the conditions for the formation of detonation combustion are more stringent, especially for the control of the temporal and spatial distribution of the mixture and the initial ignition. Therefore, early research on detonation mainly focused on gaseous fuels such as hydrogen [5,6,7], methane [8,9], and ethylene [10,11]. However, liquid fuels are typically used in practical applications because gaseous materials are more difficult to store and transport. The structure of liquid-fueled detonation is more complex and much more difficult to control than that of gas-fueled detonation in terms of aspects including but not limited to the initial state of the mixtures (pressure and temperature), the particle parameters (e.g., particle shape, size, and distribution), the complicated multiphysical processes such as droplet breakup, atomization, and evaporation, as well as incomplete mixing of fuel and air [12,13].
Some studies have shown that the activity of liquid fuels is low; therefore, it is necessary to add a certain percentage of high-activity gaseous fuels to liquid fuels [14,15] or to adopt oxygen-enriched [16,17,18] and preheating [19,20,21] methods to accelerate the evaporation and atomization of the liquid fuels. Adopting atomizers [22,23,24] is another common method to improve fuel atomization and mixing. Frolov et al. [25] fabricated a one-meter-long pre-detonator and an air-assisted atomizer to initiate the detonation in the main detonation tube. Wolanski et al. [26] developed a special liquid fuel atomization system that uses preheated air to assist the early evaporation and mixing of liquid fuel to produce a homogeneous fuel–air mixture. Wu et al. [27] used an ultrasonic acoustic atomizer to finely atomize liquid fuel to increase the pre-evaporation degree of liquid fuel.
The installation of obstacles in the detonation tube also plays a key role in the generation of detonation waves. Common forms of obstacles include orifice plates, Shchelkin spirals, and grooves [28,29]. These obstacles can induce strong disturbances during flame propagation, which can enhance the evaporation and mixing rates of fuel, thereby accelerating combustion and heat release [30]. Research has shown that channel length and height, obstacle spacing, and blockage ratio (BR) all have varying degrees of influence on the deflagration-to-detonation transition (DDT) process. Heilbronn et al. [31] and Goodwin et al. [32] investigated the effects of the BR on the flame acceleration process using experimental and numerical methods, and the results showed that a BR between 0.3 and 0.6 will accelerate the DDT process efficiently, and a BR exceeding this interval will cause the DDT distance to increase drastically. Ciccarelli et al. [33] conducted experimental studies on the effects of obstacle spacing and BR on the DDT process, finding that obstacle spacing has a huge effect on the DDT distance at high BR and acquires the shortest DDT distance when obstacle spacing is roughly equal to the pipe diameter. Saeid et al. [34] studied the spatial height ratio (S/H) of the obstacle spacing to the pipe diameter; they found that in inhomogeneous mixtures, detonation could not be triggered in the tube when the S/H was equal to 10 and that the DDT time was considerably reduced when the S/H was reduced to 2.5. Wang et al. [35] investigated the effect of the number of jet obstacles on the DDT process, speculated that there existed an optimal number of jet obstacles, and concluded that the optimal number of jet obstacles may vary with changes in channel size and obstacle spacing. Coates et al. [36] compared the influences of obstacles of different shapes on flame acceleration and found that rectangular obstacles induced the largest flame acceleration. The aforementioned studies suggest that suitable obstacles would accelerate the combustion reaction rate, which in turn would increase the flame speed and pressure, causing the DDT to occur more easily in the PDC.
Recent studies on pulse detonation combustion mainly focused on aero engines and rocket engines [37,38,39]; therefore, they have adopted the detonation cycle to replace the Brayton cycle to achieve high thermal efficiency and power performance. The main approach used to optimize the DDT process has been optimizing the ignition and the PDC structure. Most of the research objects have been gaseous fuels, and when liquid fuel has been the research object, it has typically been aviation kerosene [40,41,42]. A series of complex methods have been devised to accelerate the evaporation and atomization process of fuels [43,44]. In this study, we rely on the engine fuel supply system to inject high-pressure fuel directly into the detonation tube so that the fuel is rapidly broken and atomized into tiny particles (particle size < 8.5 μm), which substantially simplifies the multiphysical process of liquid fuel in the volatilization process. For numerical simulation, most studies have utilized two-dimensional (2D) simulation to reduce the computation time [45,46,47]; however, in the study of two-phase detonation, the mixing, atomization, and evaporation process of liquid fuel is the key to the formation of combustible mixtures. Computational fluid dynamics (CFD) can simulate the whole process of fuel from injection to mixing with the oxidant, which can provide a comprehensive understanding of how the three-dimensional (3D) detonation structure evolves so as to better optimize the detonation and combustion process. The idea of this study is to provide additional energy to the diesel engine turbine through the high-temperature and high-pressure working fluid discharged by the PDC so that the turbine can obtain enough power to increase the speed of the compressor and exhibit a fast intake response to improve the transient response performance of the heavy-duty diesel engine. At present, research on the synergistic coupling of the pulse detonation cycle and the diesel cycle to improve the transient response of the turbocharger is still scarce.
In this study, based on relevant literature, a numerical simulation is used to optimize the design of the straight tube detonation combustion process, and an implementation scheme for the detonation combustor is proposed. The numerical simulation results are experimentally verified and then imported into the one-dimensional coupling model of the engine equipped with the detonation afterburning module. The model is intended to serve as a design reference to facilitate the improvement in the transient response performance of heavy-duty diesel engines.

2. Materials and Methods

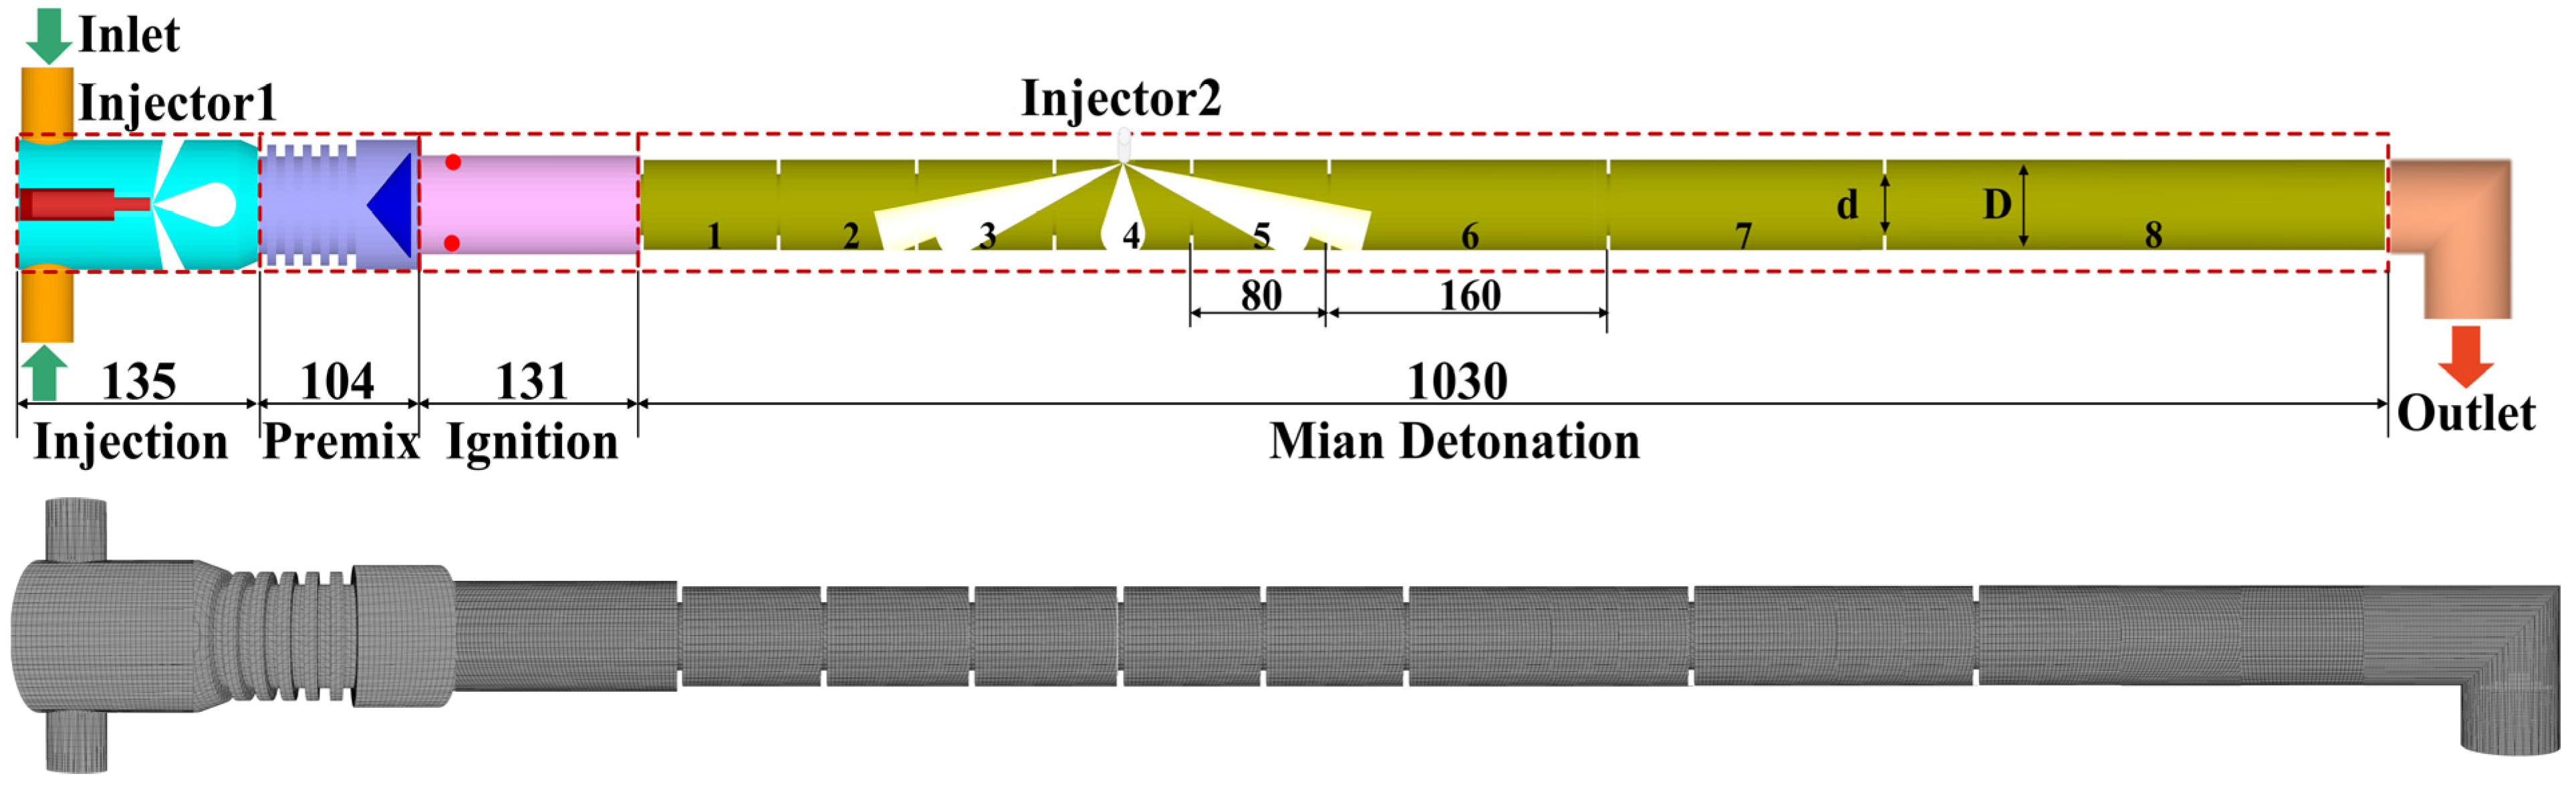
2.1. Computational Models

Figure 1 presents the configuration and meshing of the computational model, in which the lengths of the injection section, premixing section, ignition section, and main detonation section are 135, 104, 131, and 1030 mm, respectively, and the total length of the tube is 1400 mm. The main detonation section of the tube has a diameter of D = 50 mm, eight groups of symmetrically distributed solid obstacles are arranged inside the tube, the gap between the upper and lower obstacles is d = 34 mm, the spaces between obstacles 1–5 are 80 mm each, and the space between obstacles 6 and 7 is 160 mm; moreover, BR is defined as BR = 1 − d2/D2. For the suppression of flame and pressure wave back-propagation, a conical thrust wall is arranged behind the premixing section. Because the main detonation section is long, the injectors are placed in two different positions to better organize the distribution of the mixture in the tube. Injector 1 is installed horizontally in the front of the injection section, while injector 2 is installed vertically at around the one-third point along the length of the main detonation section. The two injectors are of the same model, and both use an eight-hole fuel injector with a nozzle orifice diameter of 0.169 mm.

2.2. Computational Numerical Simulation Methods and Boundary Models

The various physical and chemical models used in the computational model are shown in Table 1; the governing equations for all models are solved using CONVERGE. The characterization fuel of gasoline is isooctane (C8H18), and the chemical reaction mechanism is a 42-component, 142-step simplified model. In the simulation, the basic grid size is set to 4 mm and is supplemented by an adaptive mesh refinement technique; the minimum grid size is 0.5 mm, and the maximum number of grids is about 1 million.
To ensure that the detonation tube can be filled with fresh air smoothly, the inlet pressure is set to 0.15 MPa, the temperature is 325 K, the outlet pressure is set to 0.1 MPa, and the total temperature is 300 K. Two symmetrically distributed spherical ignition sources, each with a radius of 1 mm, are set up at 26 mm from the left side of the main detonation tube; the ignition energy is 1 J, and the ignition pulse width is 5 ms. The spray cone angle of the injector is 149°, and the injection pressure is 100 MPa.
To make the mixture distribution in the detonation tube more uniform, the fuel quantity of injector 1 is set to 150 mg, that of injector 2 is set to 110 mg, and the injection interval between the two injectors is 6 ms. According to the pulse detonation cycle process, the detonation combustion can be divided into five stages:
  • Intake stage: the intake valve is opened, allowing fresh air to flow into the detonation tube to provide oxidants for subsequent detonation combustion, which is usually carried out at the same time as the purge process.
  • Injection stage: the injector is opened, and fuel mixes with the fresh air in the tube, driven by the airflow and compression wave successively dispatched into the ignition section and the main detonation section.
  • Ignition stage: high-energy igniter discharge instantly ignites the mixture near the spark plug, and a compression wave causes the initial flame to travel into the main detonation section.
  • DDT stage: flames form and propagate, and deflagration gradually transitions to detonation in the tube.
  • Purge stage: the intake valve is reopened, and the exhaust gas in the pipe is discharged by fresh air to prepare for the next detonation.

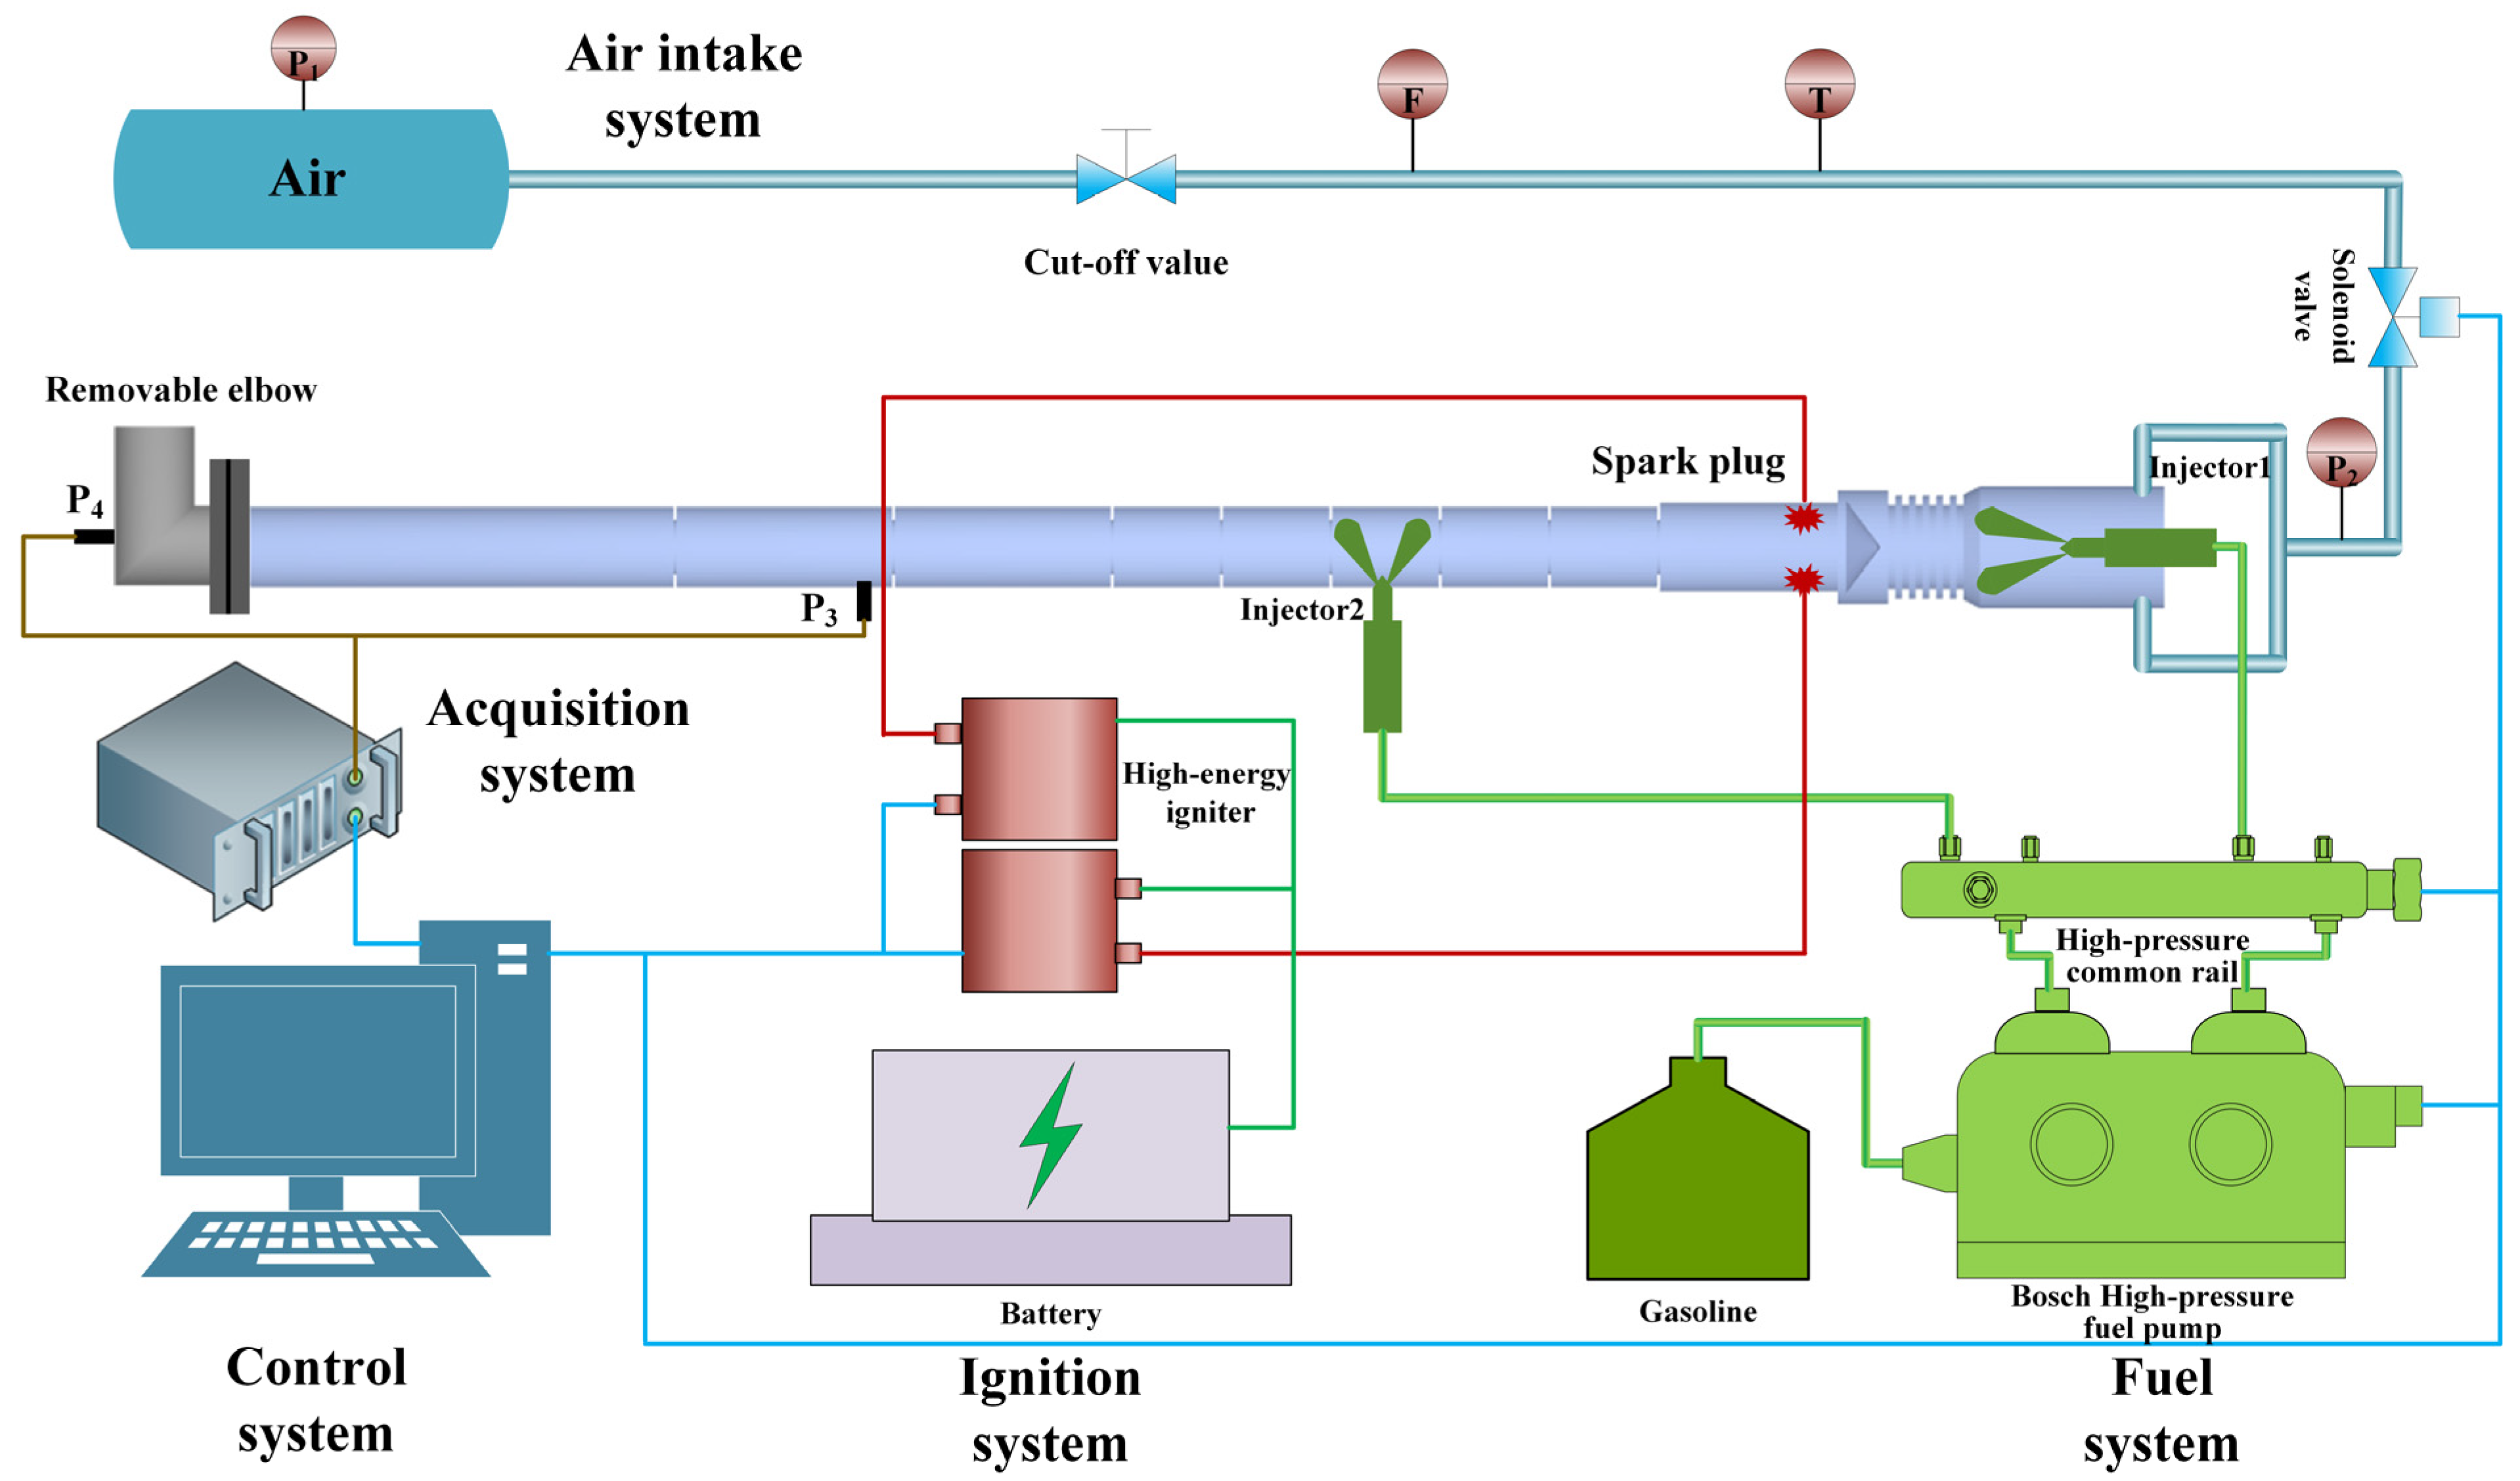
2.3. Experimental Validation

The experimental setup for the pulse detonation system, detailed in Figure 2, is mainly composed of a control system, an acquisition system, an air intake system, a fuel system, and an ignition system. Among them, the detonation tube used in the experiment is designed in reference to the model parameters in Figure 1, with air flowing vertically into the tube from the side of the injection section and an overall equivalence ratio of about 1.06. The liquid fuel used in the test is gasoline with an octane number of 92, the approximate fuel is C8H16, and the oxidant is air. The Chapman–Jouguet (CJ) detonation pressure and detonation wave speed are 1.88 MPa and 1796.4 m/s [48], respectively, and the gasoline/air equivalence ratio is 1. According to two-phase detonation research [49], there is a certain loss of detonation wave when using liquid-fueled detonation. Hence, when the peak pressure is up to 80% of the CJ detonation pressure (1.5 MPa), and the detonation wave speed is up to 65% of the CJ detonation wave velocity (1168 m/s), the detonation is considered successful.
The control system, developed independently by our research group, can control the whole process of intake, fuel injection, and ignition constantly and accurately. The acquisition system is a self-editing module based on the LabVIEW platform, which allows the number and frequency of acquisition to be freely adjusted according to demand; consequently, the pressure fluctuation in the detonation tube can be accurately collected. To detect whether a detonation wave is generated in the detonation tube, three pressure sensors are set up in the intake section and the main detonation section. A dynamic piezoresistive pressure sensor P2 with a range of 0–2 MPa is installed at the intake inlet to monitor the intake pressure in the detonation tube. Two Kistler6125C (Kistler, Switzerland) piezoelectric sensors (P3–P4), each with a range of 0–30 MPa, are installed on the outer wall of the main detonation section to detect the triggering and development process of the detonation wave in the tube. As shown in Figure 2, P3 is installed at the head of the seventh section, and the distance to the end of the tube is 450 mm. To measure the total pressure of the detonation tube at the gas outlet, an L-shaped elbow is added to the end of the detonation tube, and the piezoelectric sensor P4 is placed on the wall facing the burning gases. For the fuel system, the Bosch high-pressure common rail system is utilized to provide high-pressure fuel to both injectors, and the ignition system uses two high-energy igniters driven by 24 V batteries to provide 1 J of ignition energy to each of the spark plugs. All dynamic data of the test are acquired by a NIUSB6259 (National Instruments, Austin, TX, USA) high-speed data acquisition card with thirty-two channels (single channel sampling rate of 1.25 MS/s) and a sampling frequency of 2 × 10⁴ MS/s.
Figure 3 presents a comparison of the trend of detonation pressure curves obtained via a numerical simulation and an experiment under a single detonation with an inlet air pressure of 0.15 MPa. It can be seen from the figure that the peak pressure and change trend of the two curves are basically consistent. The peak pressure of the test is 2.1 MPa, which satisfies the characteristics of detonation. However, there is a certain error in the simulation and test data during the pressure drop stage because the piezoelectric sensor has the inherent characteristics of return hysteresis. In summary, it can be considered that the numerical simulation in this paper can reflect the ignition and detonation process of PDC and can be used to study different parameters.

3. Results

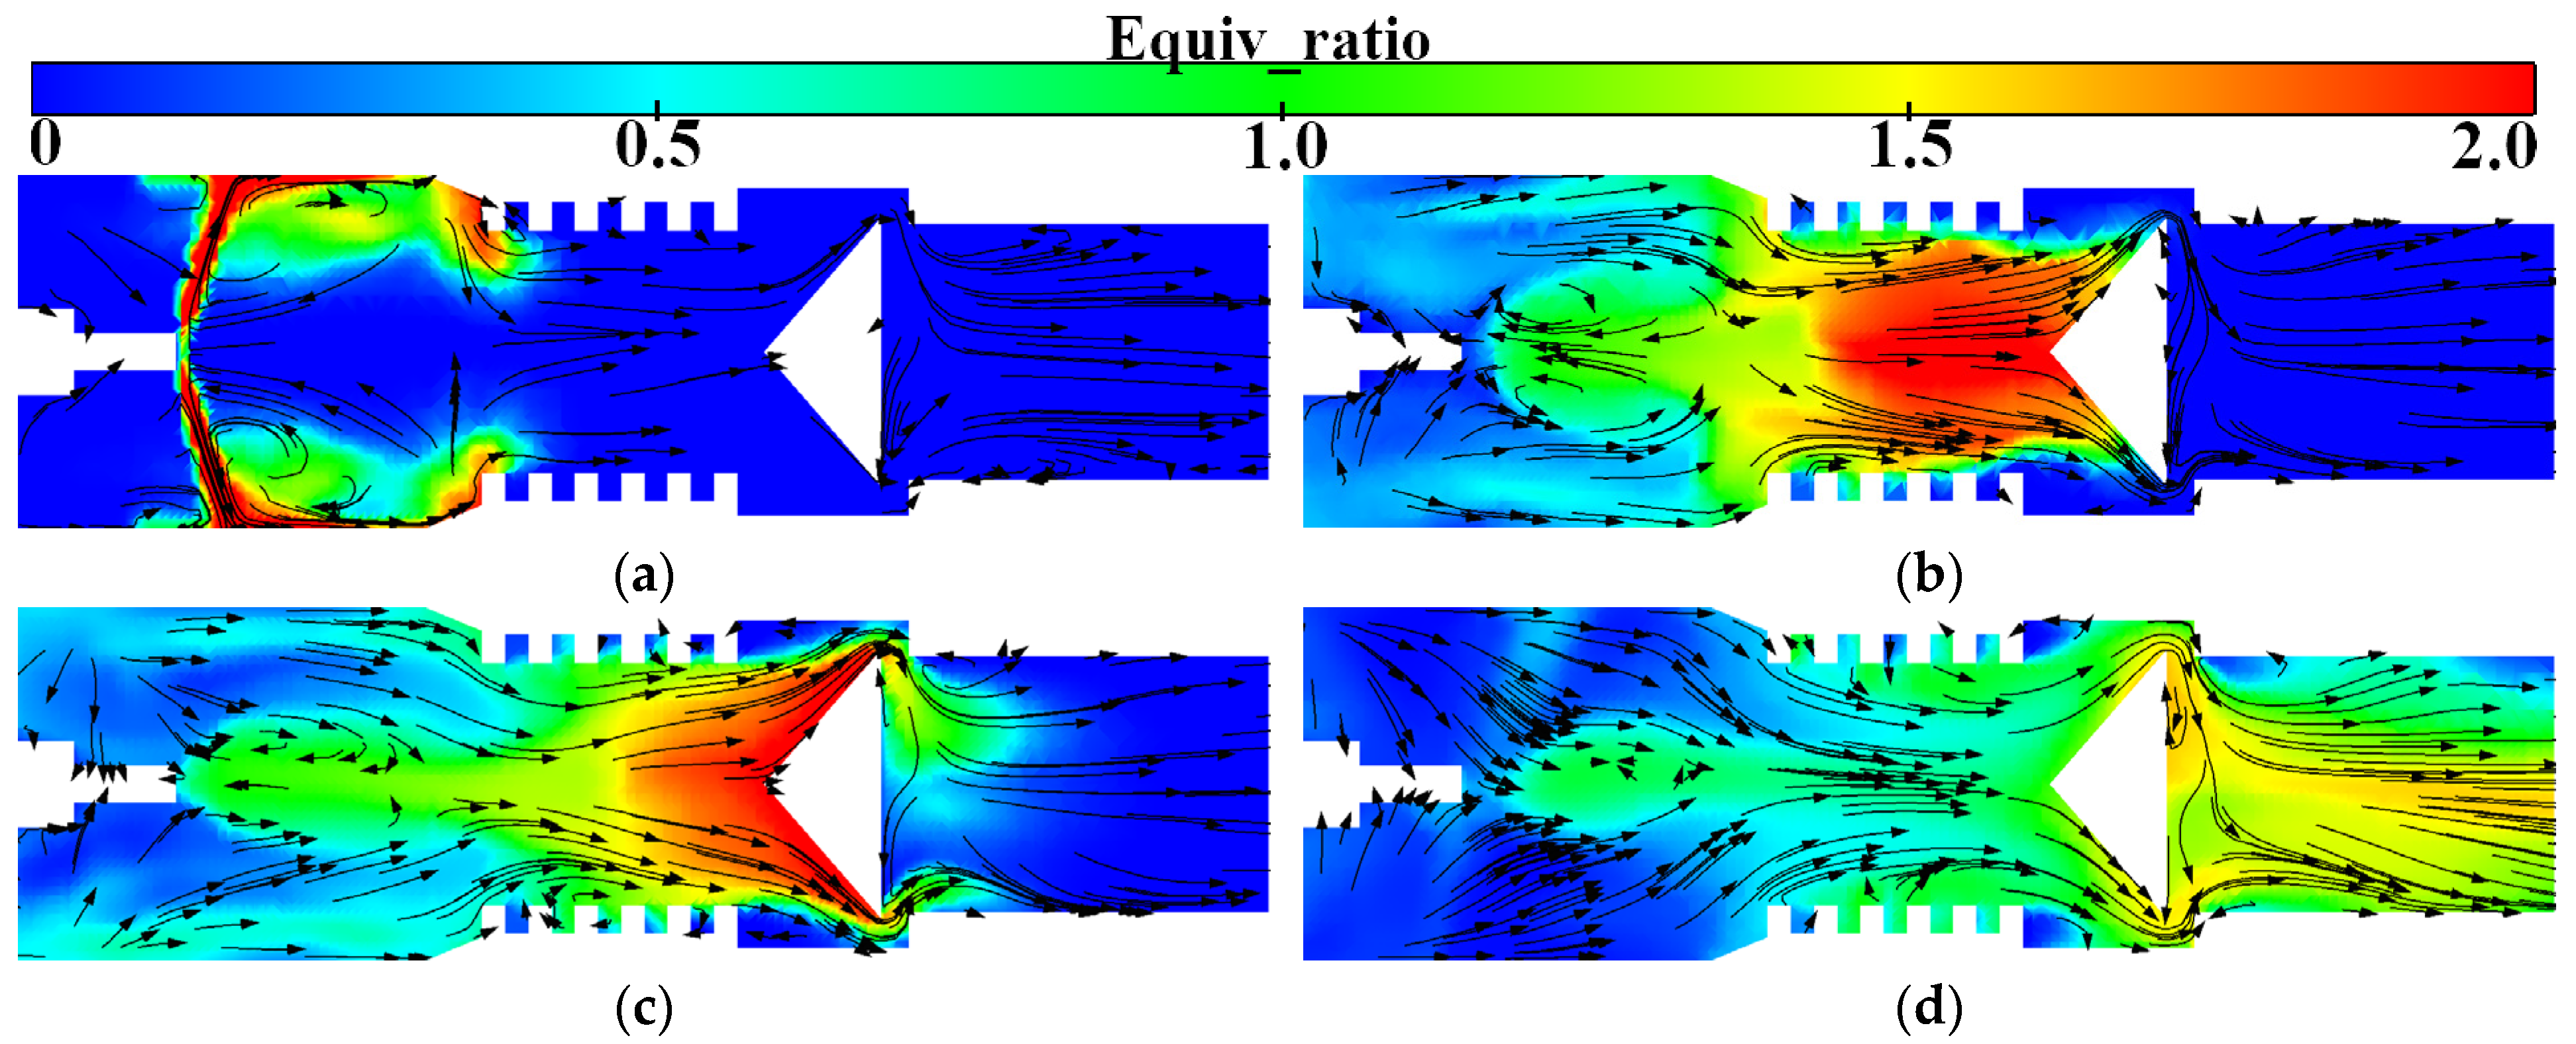
3.1. Process Analysis of the Injection to Ignition Stage

The development process of the mixture is shown in Figure 4. Injector 1 sprays most of the fuel near the wall of the tube. As a result of the impact, a plurality of vortex clusters is formed close to the wall; moreover, the fuel is continuously rolled backward by the airflow and then enters the premixing section. There is weak airflow movement in the small grid near the wall of the premixing section, which can largely prevent the fuel from adhering to the wall. The fuel pauses briefly after contacting the conical body, and the flow of the mixture through the conical body becomes more uniform under the push of the airflow, which can effectively reduce the fuel concentration zone. Subsequently, the mixture quickly passes through the conical body and reaches the ignition point of the spark plug, at which time the mixture exhibits an approximately equivalent distribution.
Figure 5 shows the development of the mixture and flame in the ignition section during the ignition stage (t = 18–23 ms). As shown in Figure 5a, at the initial stage of ignition (t = 18 ms), the mixture in the ignition section exhibits a distribution wherein the middle is concentrated, and the surroundings are dilute because of the faster flow velocity near the gap between the conical body and the wall. In contrast, it can be seen from Figure 5b,c that the airflow movement is relatively slow at the wall near the spark plug, which can favor the stable formation of the initial flame kernel. The development of the flame front is basically consistent with the contour of the chemical equivalent ratio, and it gradually moves from the periphery to the middle. Afterward, because of the airflow movement of the compression wave, the flame kernel is driven forward continually, passing through the first obstacle at t = 20.4 ms and gradually entering the main detonation tube.

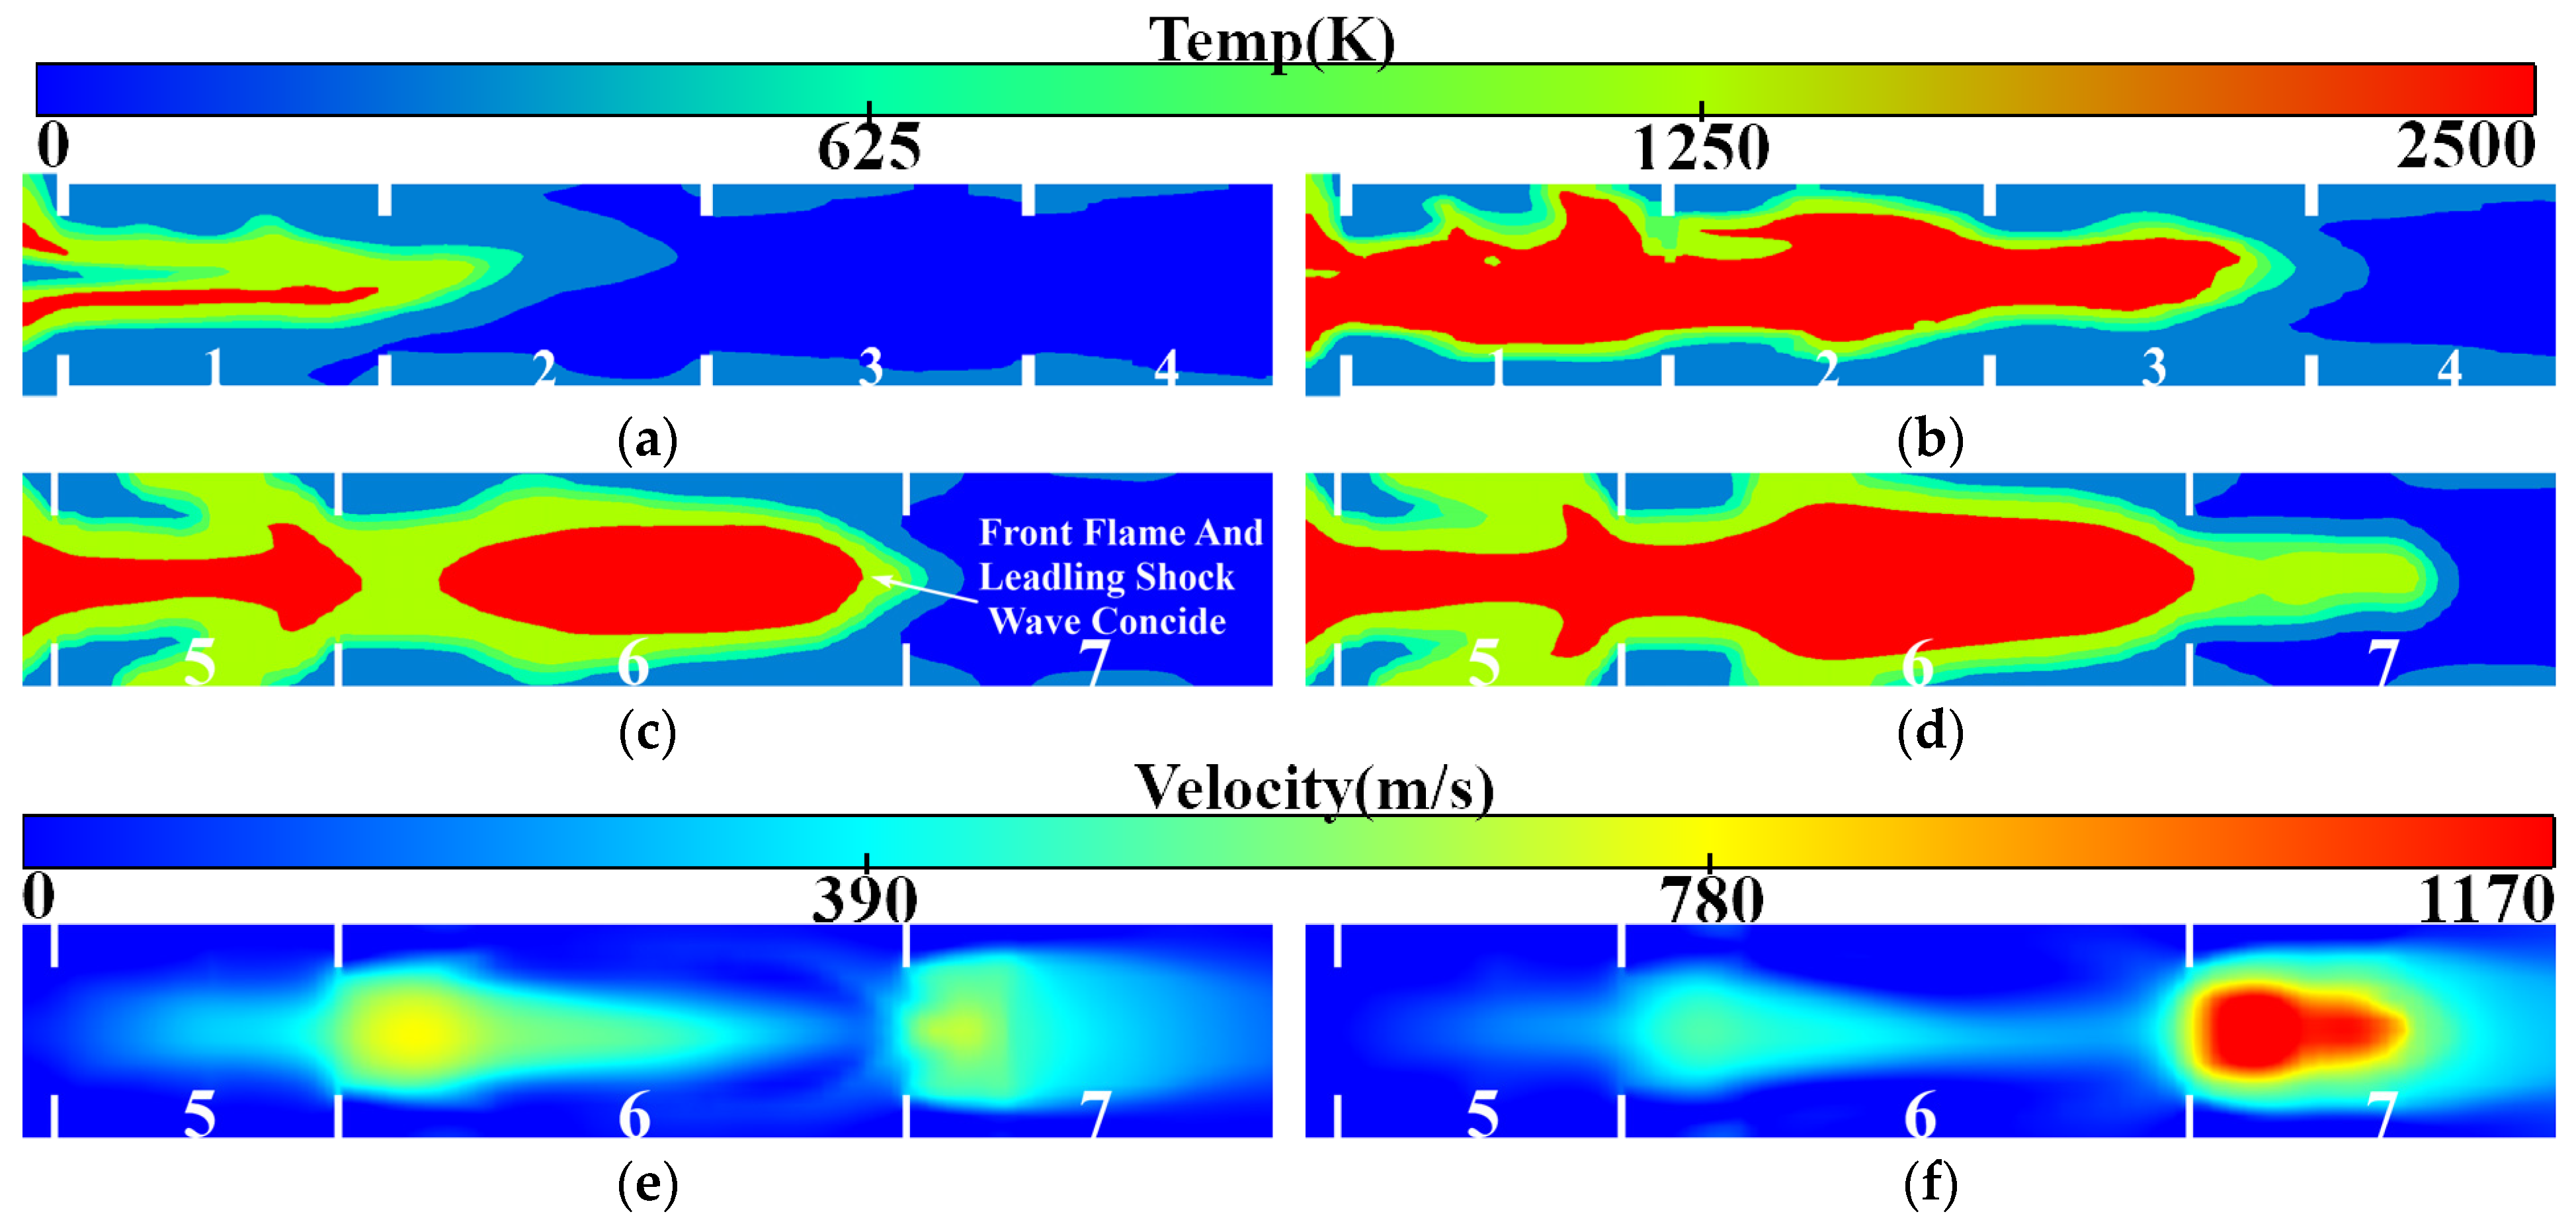
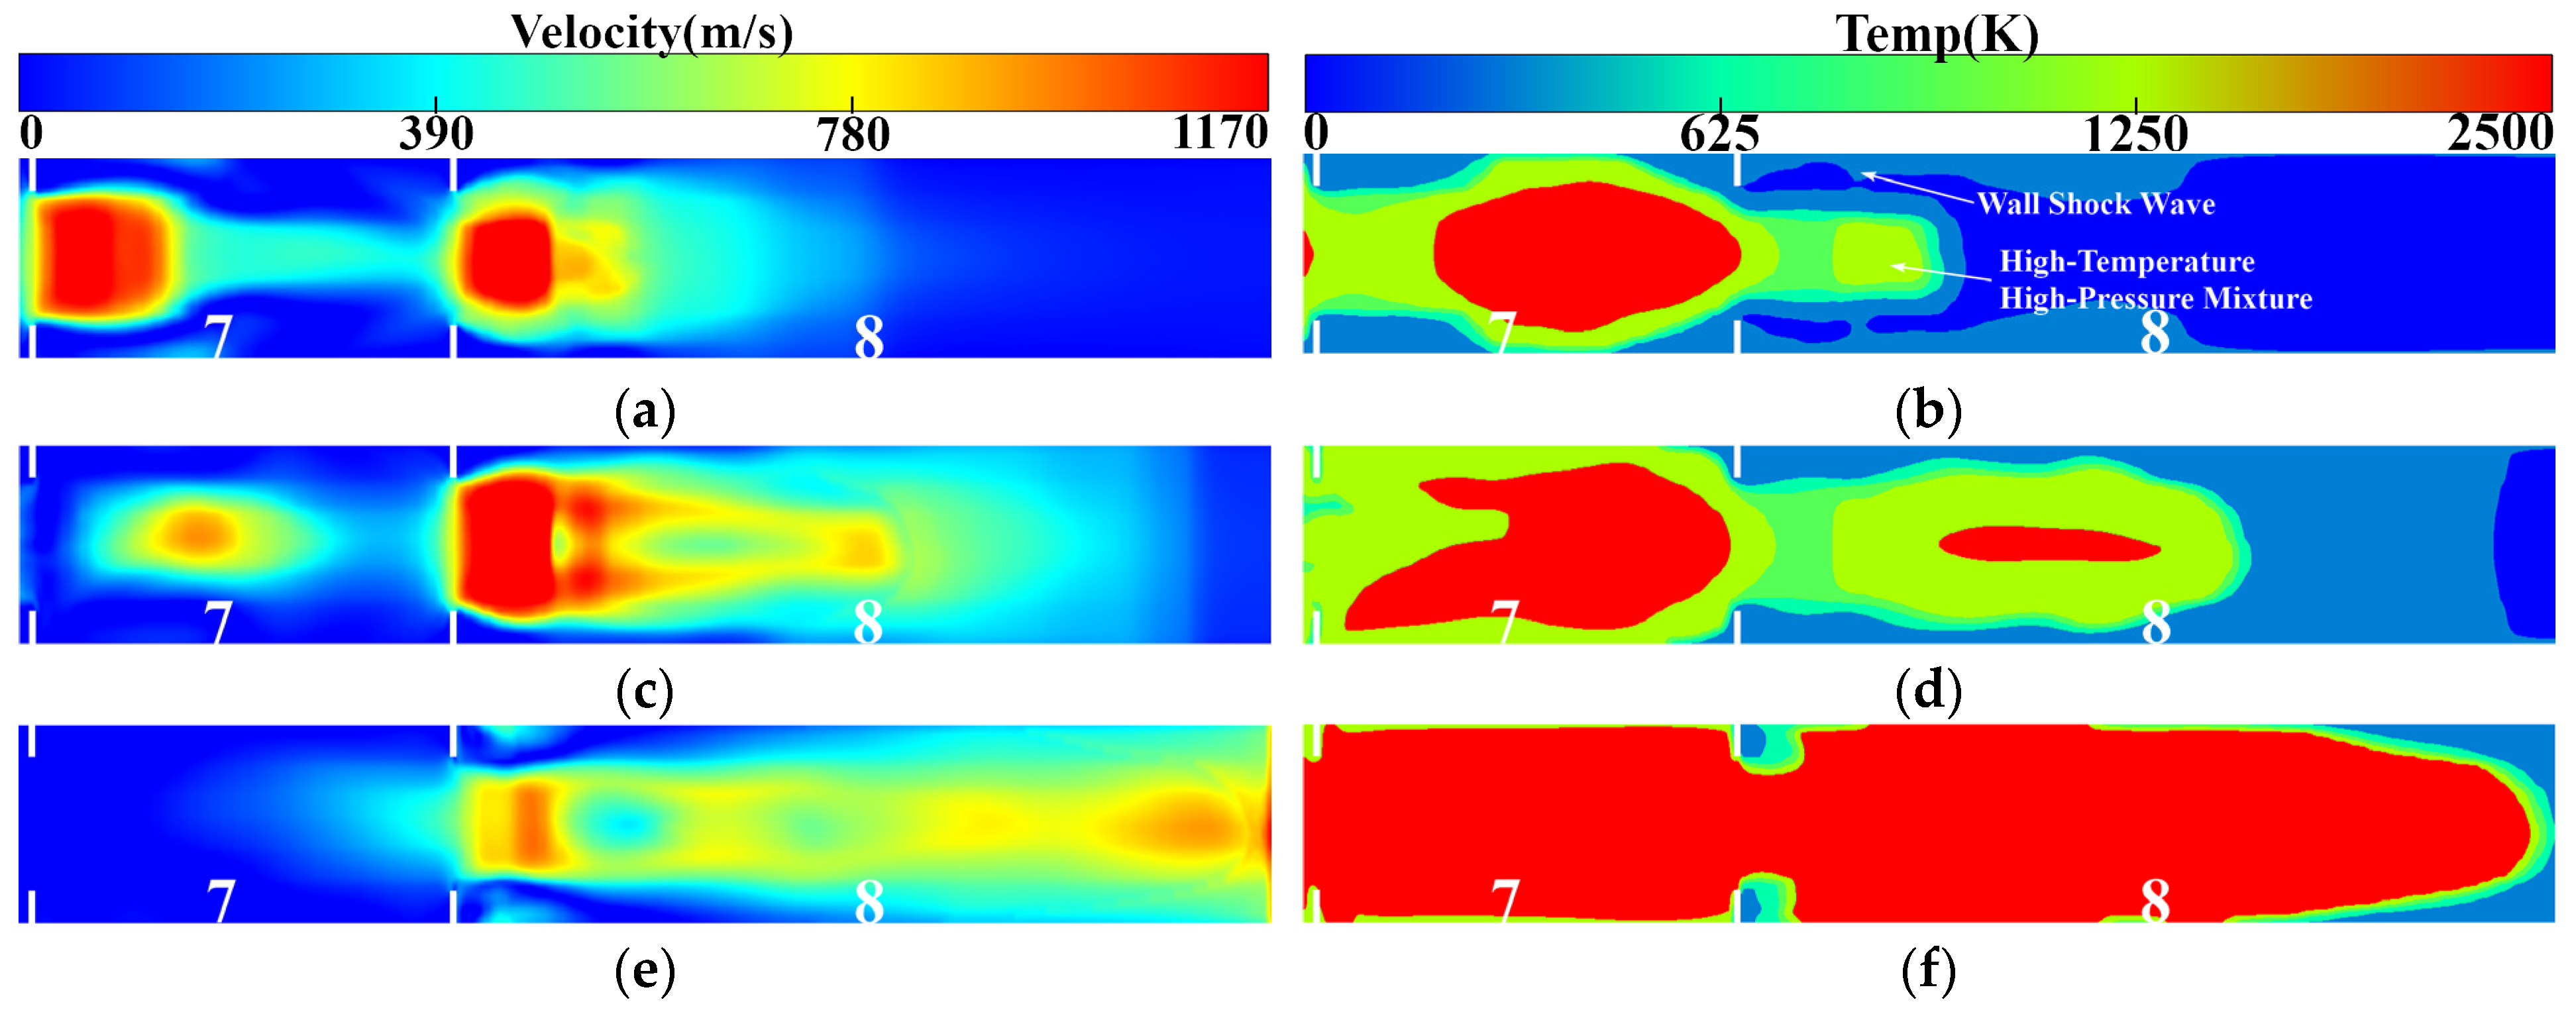
3.2. Process Analysis of Flame Acceleration-to-Detonation Transition and Detonation Wave Development

When the flame enters the main explosion section, owing to the presence of obstacles, the high-temperature airflow is often blocked and compressed when it flows around the obstacles, resulting in a sudden rise in the compression wave. As shown in Figure 6a, the initial compression wave is mainly distributed in the tube wall and near the flame front, where the compression wave sweeping through will cause a sudden change in the thermodynamic state of the unburned gas (i.e., the pressure, temperature, and density will all increase), which will intensify the combustion of the flame, increase the heat release, and ultimately enable the flame to propagate at a faster speed. In the meantime, the increase in flame speed will enhance the strength of the compression wave, thus creating a feedback mechanism for flame acceleration. This feedback mechanism makes the distance between the flame front and the compression wave gradually decrease, as shown in Figure 6c, and finally, at t = 24.7 ms, at the end of the sixth section of the main detonation tube, the flame front and the leading shock wave coincide. The state of the compression wave in the tube at this time with the influence of the obstacles is shown in Figure 6e; the trend of airflow in the tube is fast in the middle and slow in the periphery, so its velocity profile is a “bullet” type. The shock wave velocity can reach 718 m/s, which is a form of flame propagation before the detonation wave is triggered. Subsequently, the high-temperature flame surface (T > 2500 K) expands rapidly in the tube, accelerated by the obstacles and coupled with high-temperature, high-pressure reactants. The “detonation wave kernel” is formed at the front end of the obstacle in the seventh section, corresponding to the initial state of detonation wave formation, as depicted in Figure 6d,f. At this point, the velocity of the detonation wave reaches 1283 m/s, with a peak pressure of 0.56 MPa.
Once formed, the detonation shock wave will propagate to both ends. However, owing to the presence of a larger amount of unburned high-temperature and high-pressure mixture downstream, the initial detonation shock wave exhibits a conical shape and expands further downstream. As depicted in Figure 7a, detonation waves are observed in sections 7 and 8 of the tube at t = 25.1 ms. Notably, the trigger mechanisms for these two detonation waves are entirely different. The first detonation wave originates from the progressive acceleration of the flame, leading to the combustion flame’s DDT; in contrast, the second detonation wave arises from the direct detonation of high-temperature and high-pressure reactants due to shock wave-wall interactions. Figure 7b shows that the high-temperature and high-pressure reactants at the front end of the eighth section are reignited after touching the leading shock wave near the wall and react rapidly to form a new detonation wave. In comparison to the first shock wave, both the initiation time and distance of the second shock wave are significantly reduced, causing the generation speed of the second detonation wave to be greater than the attenuation speed of the first detonation wave. Consequently, multiple detonations occur within the tube. This phenomenon effectively retards decoupling between shock waves and reaction surfaces during the transmission process while inhibiting downstream back transmission of detonation waves, thereby ensuring stable propagation.
As can be seen from Figure 7c, the decay of the seventh section of the detonation wave results in further augmentation of the velocity and sweep range of the detonation wave in the eighth section, which continues to propagate downstream. Figure 7d demonstrates that at t = 25.3 ms, a high-temperature flame overspreads the detonation tube within the seventh section. At this juncture, the velocity of the detonation wave inside the tube can reach up to 1950 m/s while achieving a maximum burst pressure of 1.98 MPa. Moreover, it is observed that there is a transition in the shape of the detonation wave front from conical to horizontal forward propulsion. The detonation wave reaches the exhaust outlet at t = 25.5 ms, as depicted in Figure 7e. Because of a sharp pressure drop when it reaches the outlet, a smaller range of detonation waves is generated near the outlet of the PDC. This substantial pressure difference leads to a surge of the wave velocity at the outlet, with maximum speeds reaching up to 2033 m/s. Simultaneously, the pressure of the detonation wave in the tube begins to decrease, with a peak pressure of 0.8 MPa. Because there is no combustible mixture at the leading edge of the PDC, the generation of new detonation waves becomes unattainable. Subsequently, after 0.5 ms, the velocity of the detonation wave drops below 1000 m/s and gradually attenuates until it reaches a stable state.
The aforementioned section provides a comprehensive description of the process involving the formation, ignition, and detonation of the gasoline–air mixture within a tube containing obstacles. To further enhance the optimization of the PDC structure, an analysis is conducted on the BR parameters of the detonation tube based on this foundation.

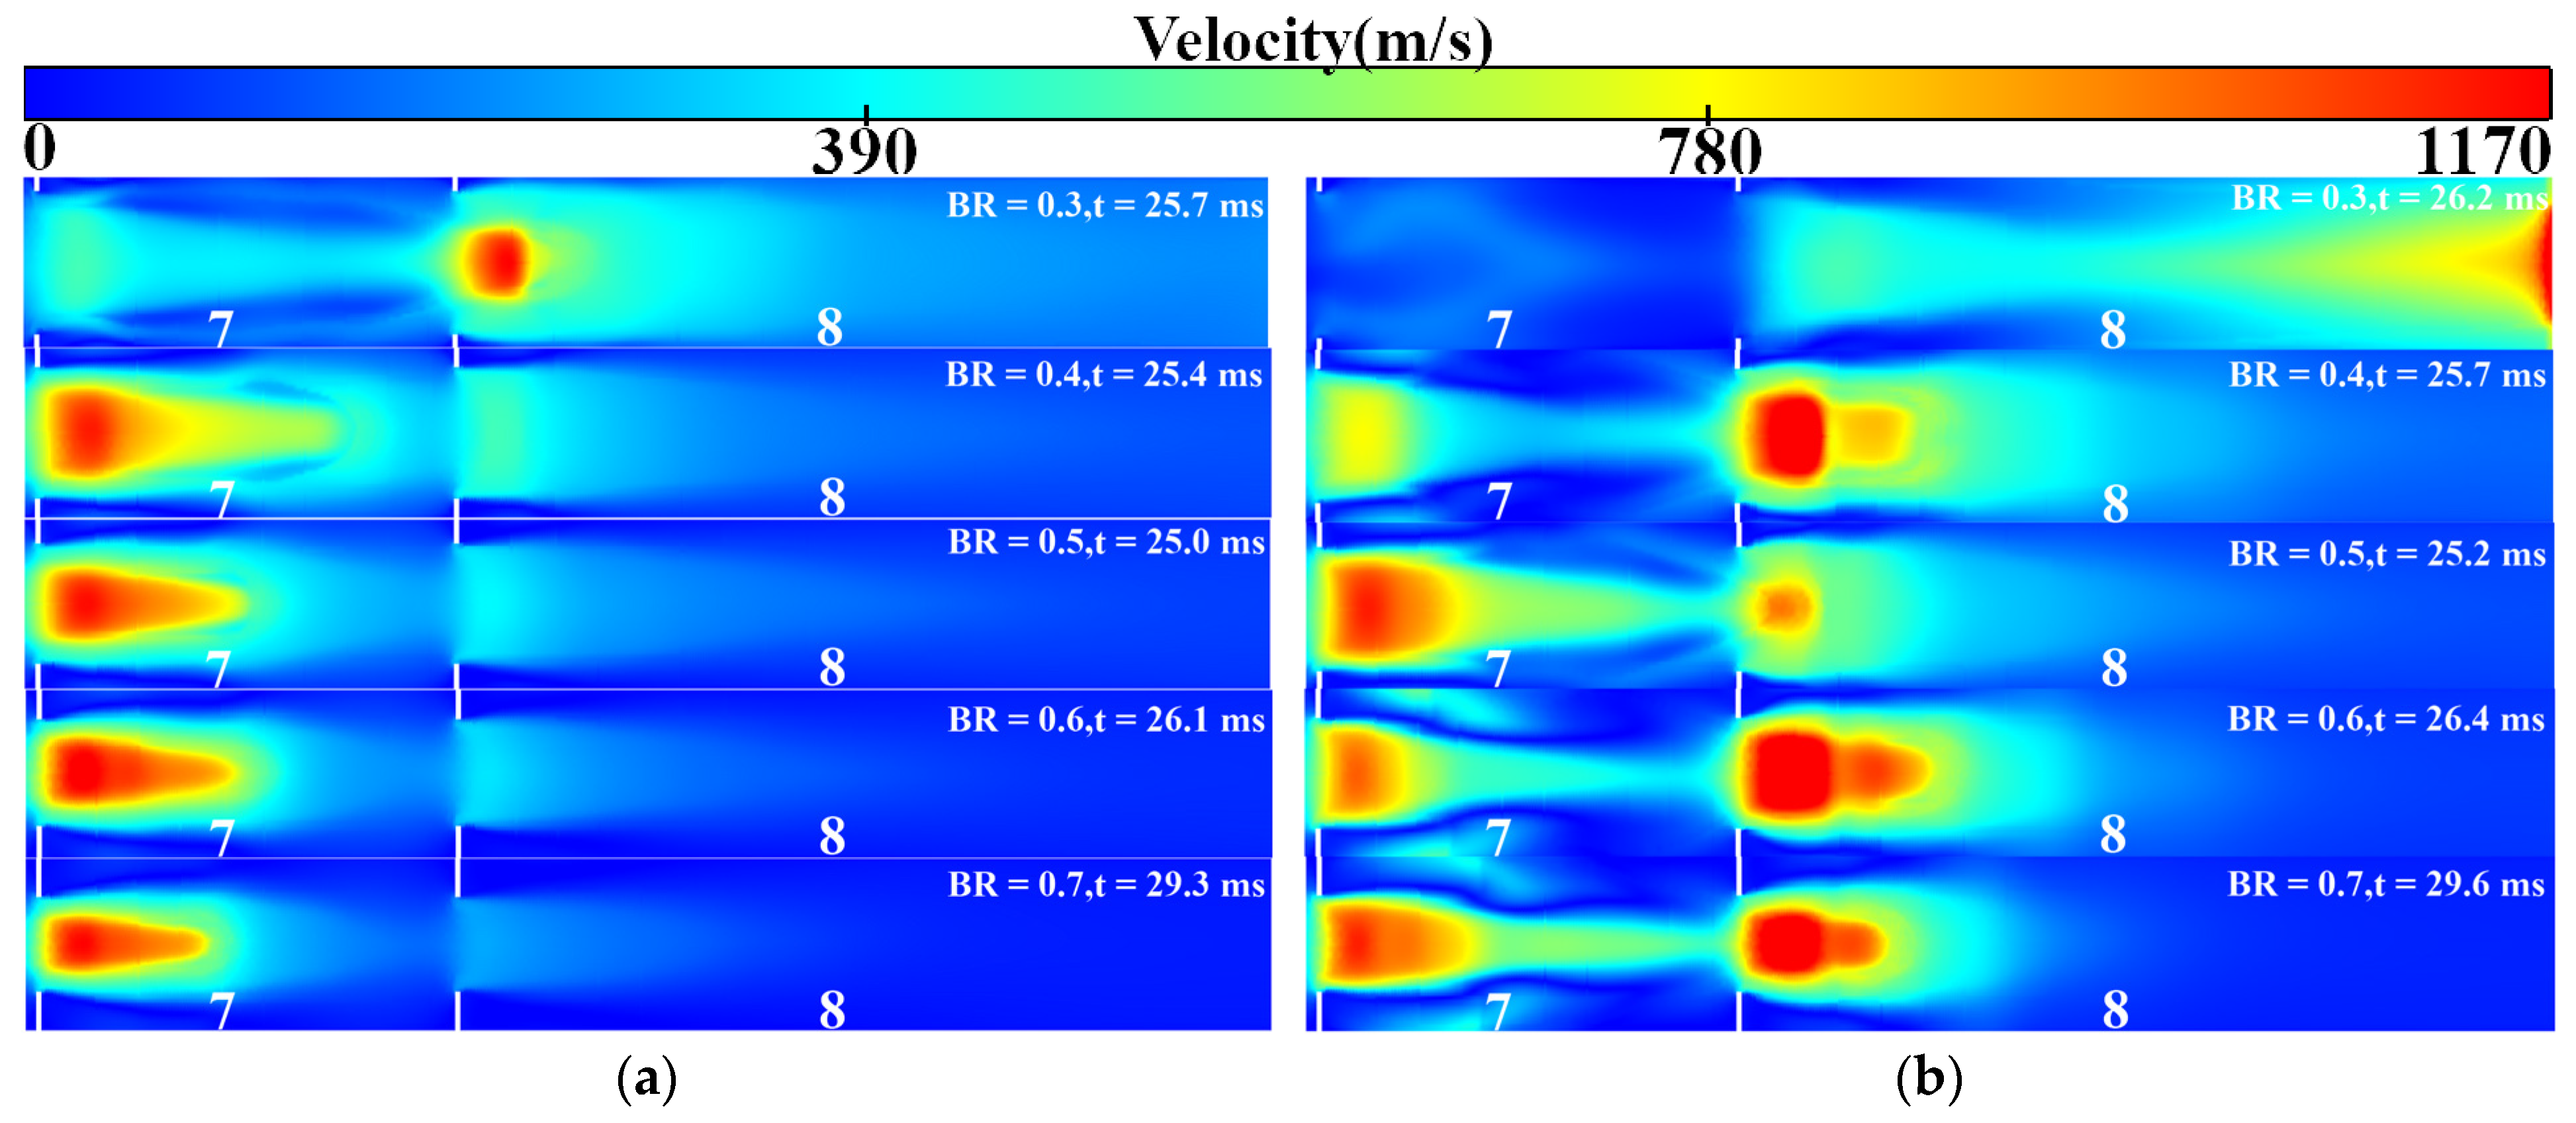
3.3. Effect of Different BRs on Detonation and Combustion Characteristics of the Detonation Tube

The BR is an important parameter that affects the detonation in the detonation tube. Figure 8 illustrates the gas flow velocities and the DDT times of five different detonation tubes with BRs of 0.3 to 0.7 at the moment of ignition (t = 18 ms). Moreover, this figure clearly demonstrates the considerable impact of BR on gas flow velocity within the detonation tube. A higher value of BR corresponds to a slower gas flow rate in the tube. The gas flow velocity greatly affects the diffusion rate of the fuel particles, thereby influencing the distribution of the mixture throughout the tube.
High BR results in considerable resistance in the tube, which affects the development and step of the compression wave, leading to a substantial increase in the required DDT time. However, the DDT time does not exhibit a monotonic increase as BR decreases; on the contrary, it exhibits a trend of initial decrease and subsequent increase. The minimum DDT time occurs when the BR is approximately 0.5, and the DDT time at BR = 0.7 is 61% higher than that at BR = 0.5. High BR considerably impacts the detonation speed of the detonation tube.
Notably, BR also exerts an influence on the DDT distance of the detonation tube. As depicted in Figure 9a, when the BR ranges from 0.4 to 0.7, the DDT distance remains relatively consistent, with detonation occurring at the onset of the seventh obstacle. Conversely, when BR is 0.3, detonation occurs at the onset of the eighth obstacle and results in the furthest DDT distance, indicating that a low BR has a greater impact on the detonation distance of the DDT.
The analysis presented in Figure 9b investigates multiple detonation phenomena in the tube with different BRs. Multiple detonation phenomena are not observed in the tube when the BR ranges from 0.3 to 0.5, and the detonation wave is directly propagated from the beginning of the eighth section to near the outlet when the BR is 0.3. However, for BRs of 0.4 or 0.5, only one detonation wave is generated in the tube; a shock wave is also generated, but its velocity is lower than 0.67VCJ (780 m/s), which does not reach the velocity of a detonation wave. When the BR increases to 0.6–0.7, two detonation waves are generated within the tube.
Results demonstrate that the propagation mechanism of detonation waves in the tube with continuous obstacles remains consistent. The detonation wave in the process of traversing obstacles will exhibit attenuation, failure, and re-initiation of the phenomenon. This can be attributed to the fact that the detonation wave is a shock wave coupled with a chemical reaction and that the law of its development through the obstacles is similar to the law of shock wave diffraction in the obstacles. In other words, as airflow passes through the tiny concave corner, compression waves are generated due to the blockage. The magnitude of these compression waves is influenced by both airflow velocity and obstacle shape. Therefore, during the initiation stage of the detonation wave, which involves the interaction between the flame and the shock wave, the turbulence effect does not play a leading role. This also explains why the DDT time does not decrease with the increase in airflow movement. Specifically, the generation and propagation of detonation waves are jointly determined by interactions among flames, the leading shock wave, obstacles, and local geometric conditions.
The peak pressure and instantaneous heat release rate curves of five different detonation tubes with BRs ranging from 0.3 to 0.7 are depicted in Figure 10a and Figure 10b, respectively. It can be observed from Figure 10a that as BR increases, the peak pressure of the detonation tube exhibits an initial increase followed by a decrease. Notably, the detonation tubes with BRs of 0.5 and 0.6 demonstrate relatively high peak pressures. When the BR is 0.3, the fuel particles disperse rapidly due to the high flow velocity in the tube, which is unfavorable to the formation of a stable initial fire core. Moreover, owing to little obstacle blockage, there is weak disturbance and a small area affected by compression waves, resulting in a negligible impact on the unburned gas state and minimal overall heat release. When the BR is 0.7, although the DDT time is prolonged, the peak pressure of the detonation wave remains high. This can be attributed to low airflow velocity within the tube impeding flame propagation speed and causing slow development of the detonation wave during its formative stage.
The heat release time in the tube becomes longer as the BR decreases, as depicted in Figure 10b. Conversely, as the BR increases, the heat release becomes more concentrated. Although the peak heat release values are higher when BR = 0.6 and 0.7, the maximum pressure is lower than when BR = 0.5. This is because increasing the BR increases the resistance and results in a certain pressure loss within the tube, which emphasizes that detonation wave triggering is a consequence of flame and compression wave interaction. The DDT time is observed to be the shortest and the pressure to be the largest when the BR is 0.5, as depicted in Figure 10a,b. Deviating from this optimal value of BR (in the positive or negative direction) will adversely affect both the fuel particle diffusion speed (making it either excessively slow or fast) and the compression wave magnitude. Even with adjustments made to ignition and injection timing, satisfactory results will not be achieved, and some problems will arise, such as diminished heat release and prolonged detonation cycle time. Through optimization, it has been determined that the optimal DDT time is 6.7 ms, and the peak pressure is 2.2 MPa when the BR of the detonation tube is 0.54.

3.4. Effect of the Detonation Tube Coupled Exhaust Gas Turbine on Diesel Engine Performance

To investigate the impact on the engine performance after accessing the pulse detonation tube, a one-dimensional engine model is constructed based on the GT-POWER platform, which mainly includes cylinders, a supercharging system, an intercooling system, and a detonation afterburning module. The engine’s operating parameters are presented in Table 2.
The engine employs a variable-geometry turbocharger. The total outlet pressure and pulse flow from a previous acquisition of the detonation tube are imported at the environmental boundary of the afterburning module e300-2 to drive the turbine and compressor together with the exhaust gas discharged from the engine. The combined cycle arrangement according to GT-POWER is illustrated in Figure 11.
The engine’s constant speed is set at 700 r/min. From 0 to 5 s, the engine operates in an idle state with a constant fuel quantity of 35 mg. At 5 s, the fuel quantity begins gradually increasing and reaches its maximum value of 212 mg after 0.5 s. At this time, the outlet pressure and pulse flow of the detonation tube at a frequency of 7 Hz are inputted into the e300-2 module of the GT engine model.
Figure 12 presents the transient response abilities of the original engine and the engine connected to the detonation tube, with a variable-geometry turbocharger (VGT) blade opening of 0.55. As depicted in the figure, it takes 13.3 s for the original diesel engine to achieve an intake pressure of 1.4 bar; however, when the PDC is connected to supply exhaust gas to the turbine, this response time is shortened to 8.2 s, a reduction of 38.3%. This clearly indicates that connecting the PDC significantly improves the compressor supercharging response and yields outstanding supercharging effects.
The PDC also demonstrates a certain effect in enhancing the engine’s transient response performance. Figure 13 illustrates the impact curve of the PDC outlet’s exhaust gas flow on the engine’s intake flow and torque at a turbine VGT blade opening of 0.55. It is evident that, under the current VGT setting, connecting the PDC results in a reduction of 1.1 s (approximately 11%) in response time when the intake flow reaches 65 g/s compared to the original engine. Meanwhile, when the engine torque increases to 1600 Nm, it only takes 5.9 s, which is about 11% shorter than the original engine’s response time.
From the aforementioned results, it can be concluded that the engine will experience a substantial improvement in the transient response of intake supercharging when the detonation combustion tube is installed. With an appropriate VGT opening, the engine intake supercharging response time can be effectively shortened, which can meet the transient demand of the engine under special working conditions. These results provide insights and numerical references that will be valuable for improving the transient operating efficiencies of engines.

4. Conclusions

In this study, the detonation characteristics of high-pressure direct-injection gasoline–air mixtures in a long straight detonation tube are investigated using numerical simulations, the effects of different BRs on flame acceleration and the DDT process are determined, and an efficient PDC structure is established. The exhaust gas generated by the PDC is further used to promote turbine operation, effectively compensating for the problem of turbocharging delay and quickly realizing the purpose of pressure boost and intake volume adjustment. This study is intended to serve as a design reference to facilitate the improvement in the transient response performance of heavy-duty diesel engines. The key conclusions are as follows:
  • In the ignition stage, the formation of the initial flame kernel is significantly influenced by the local airflow velocity and the mixture equivalent ratio, while flame development predominantly follows the chemical equivalent ratio contour. In the flame acceleration stage, turbulent flow and compression waves synergistically promote flame propagation, establishing a feedback mechanism for flame acceleration. During the detonation wave development stage, detonation is triggered by one of the following two mechanisms: one involves detonation resulting from the coupling between flames and shock waves, and the other entails direct detonation initiated by collision and reflection of compression waves with the wall.
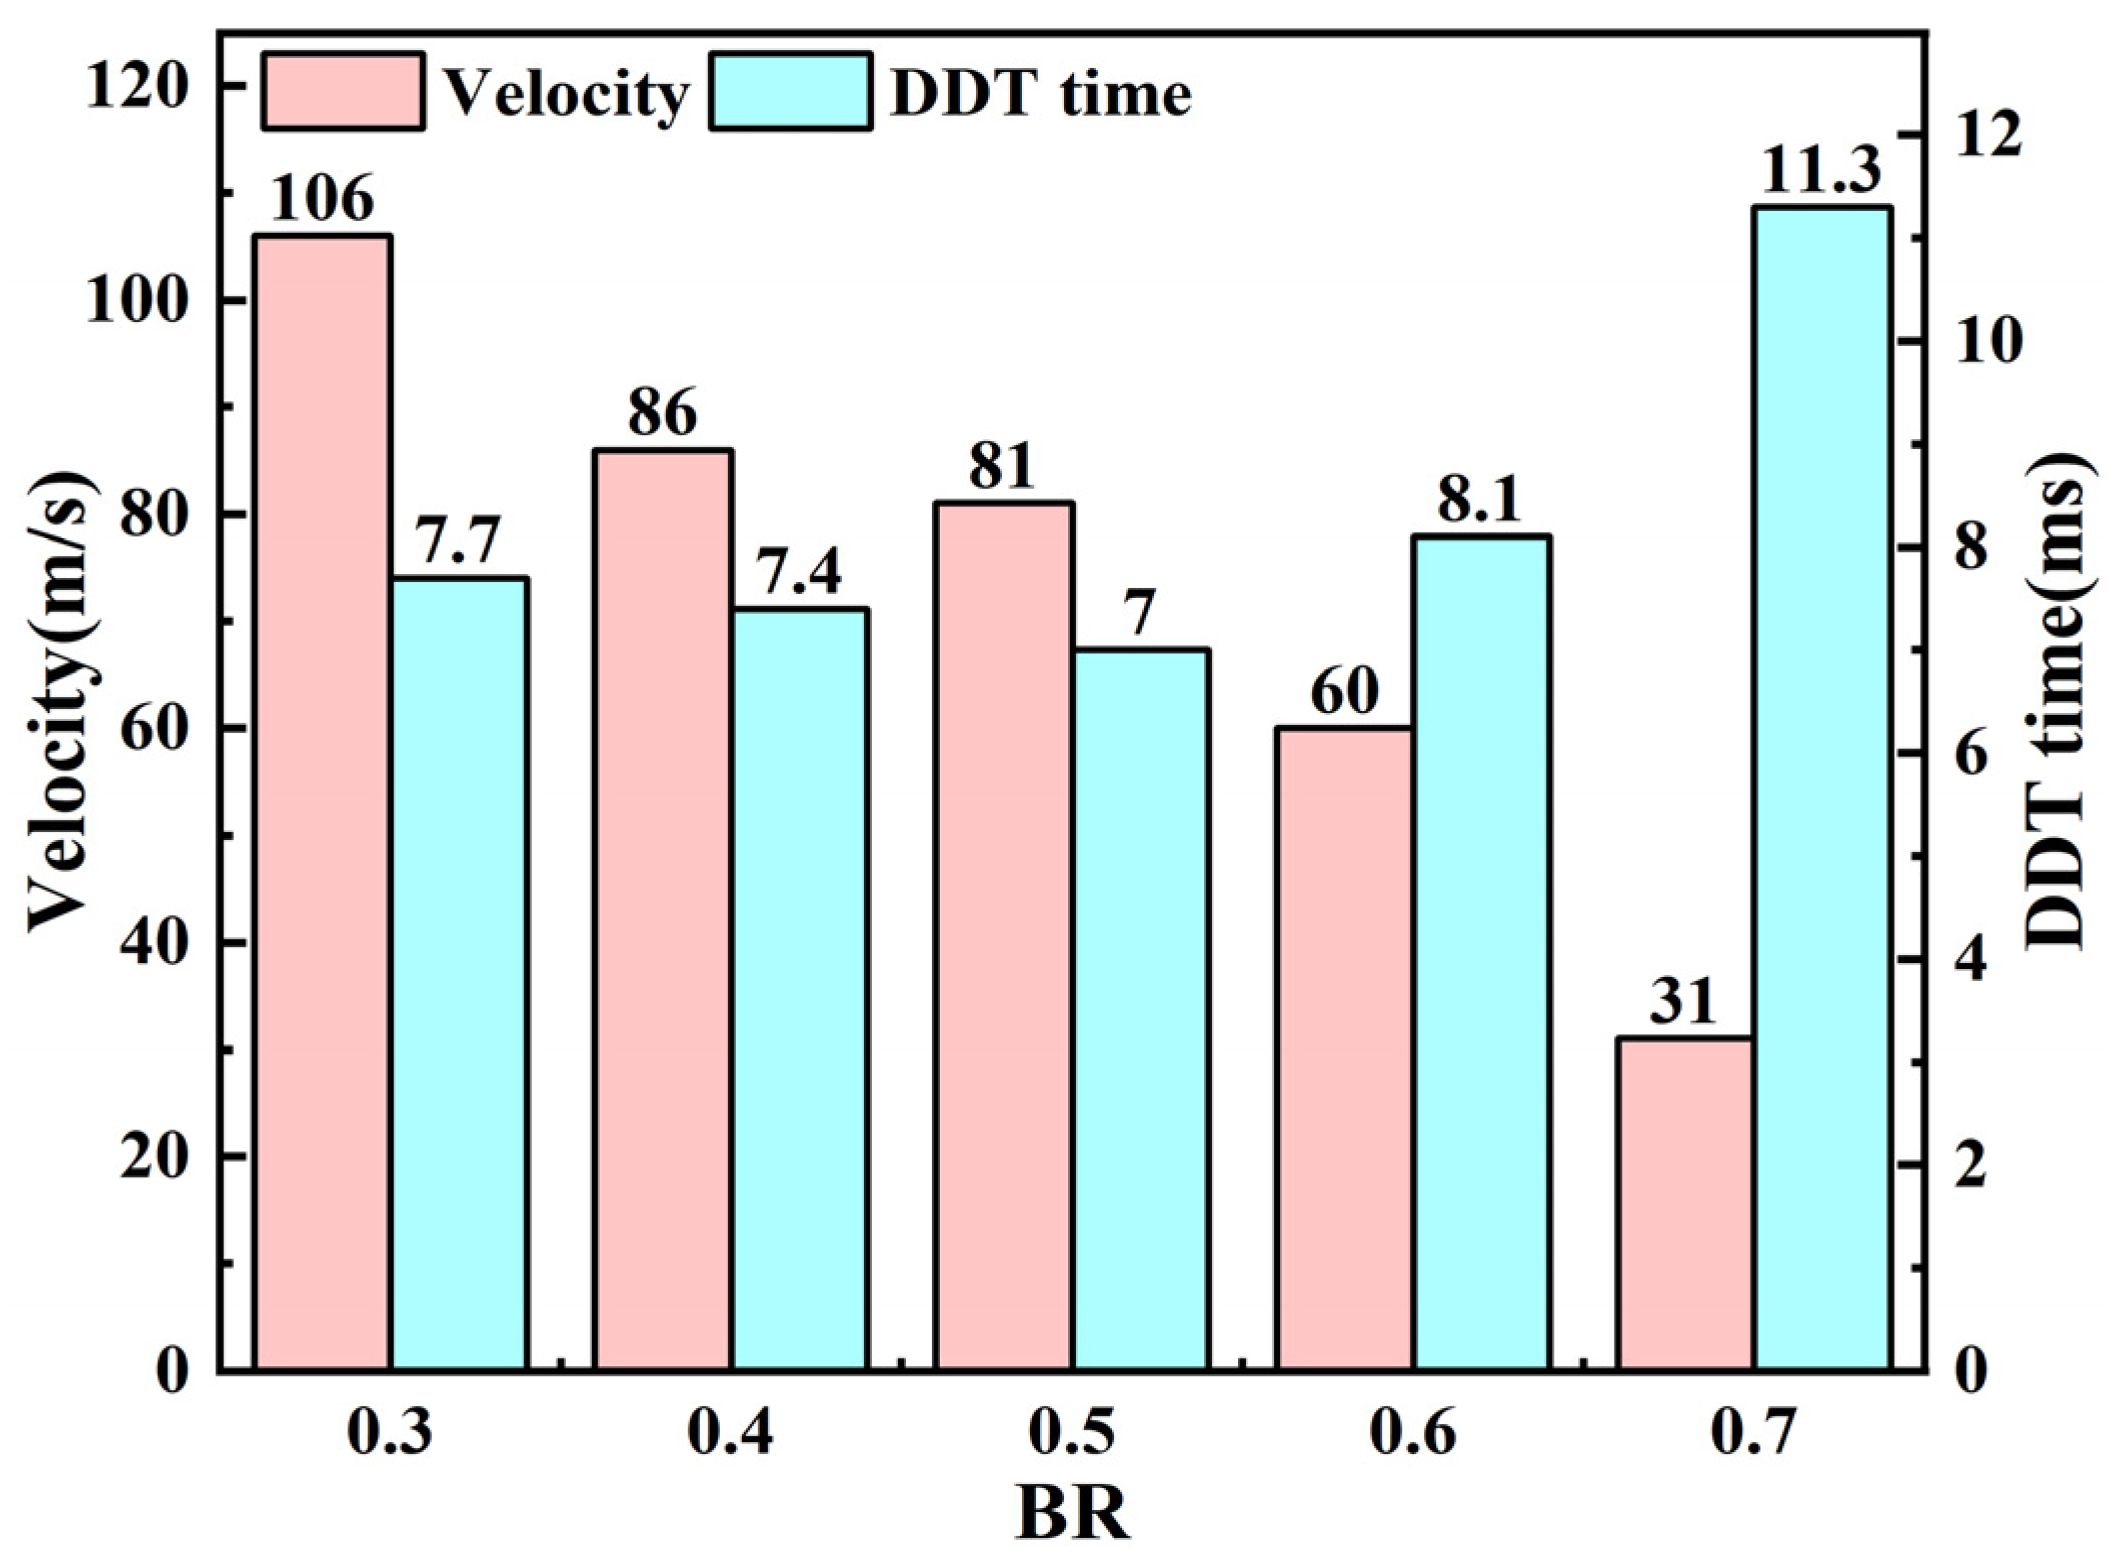
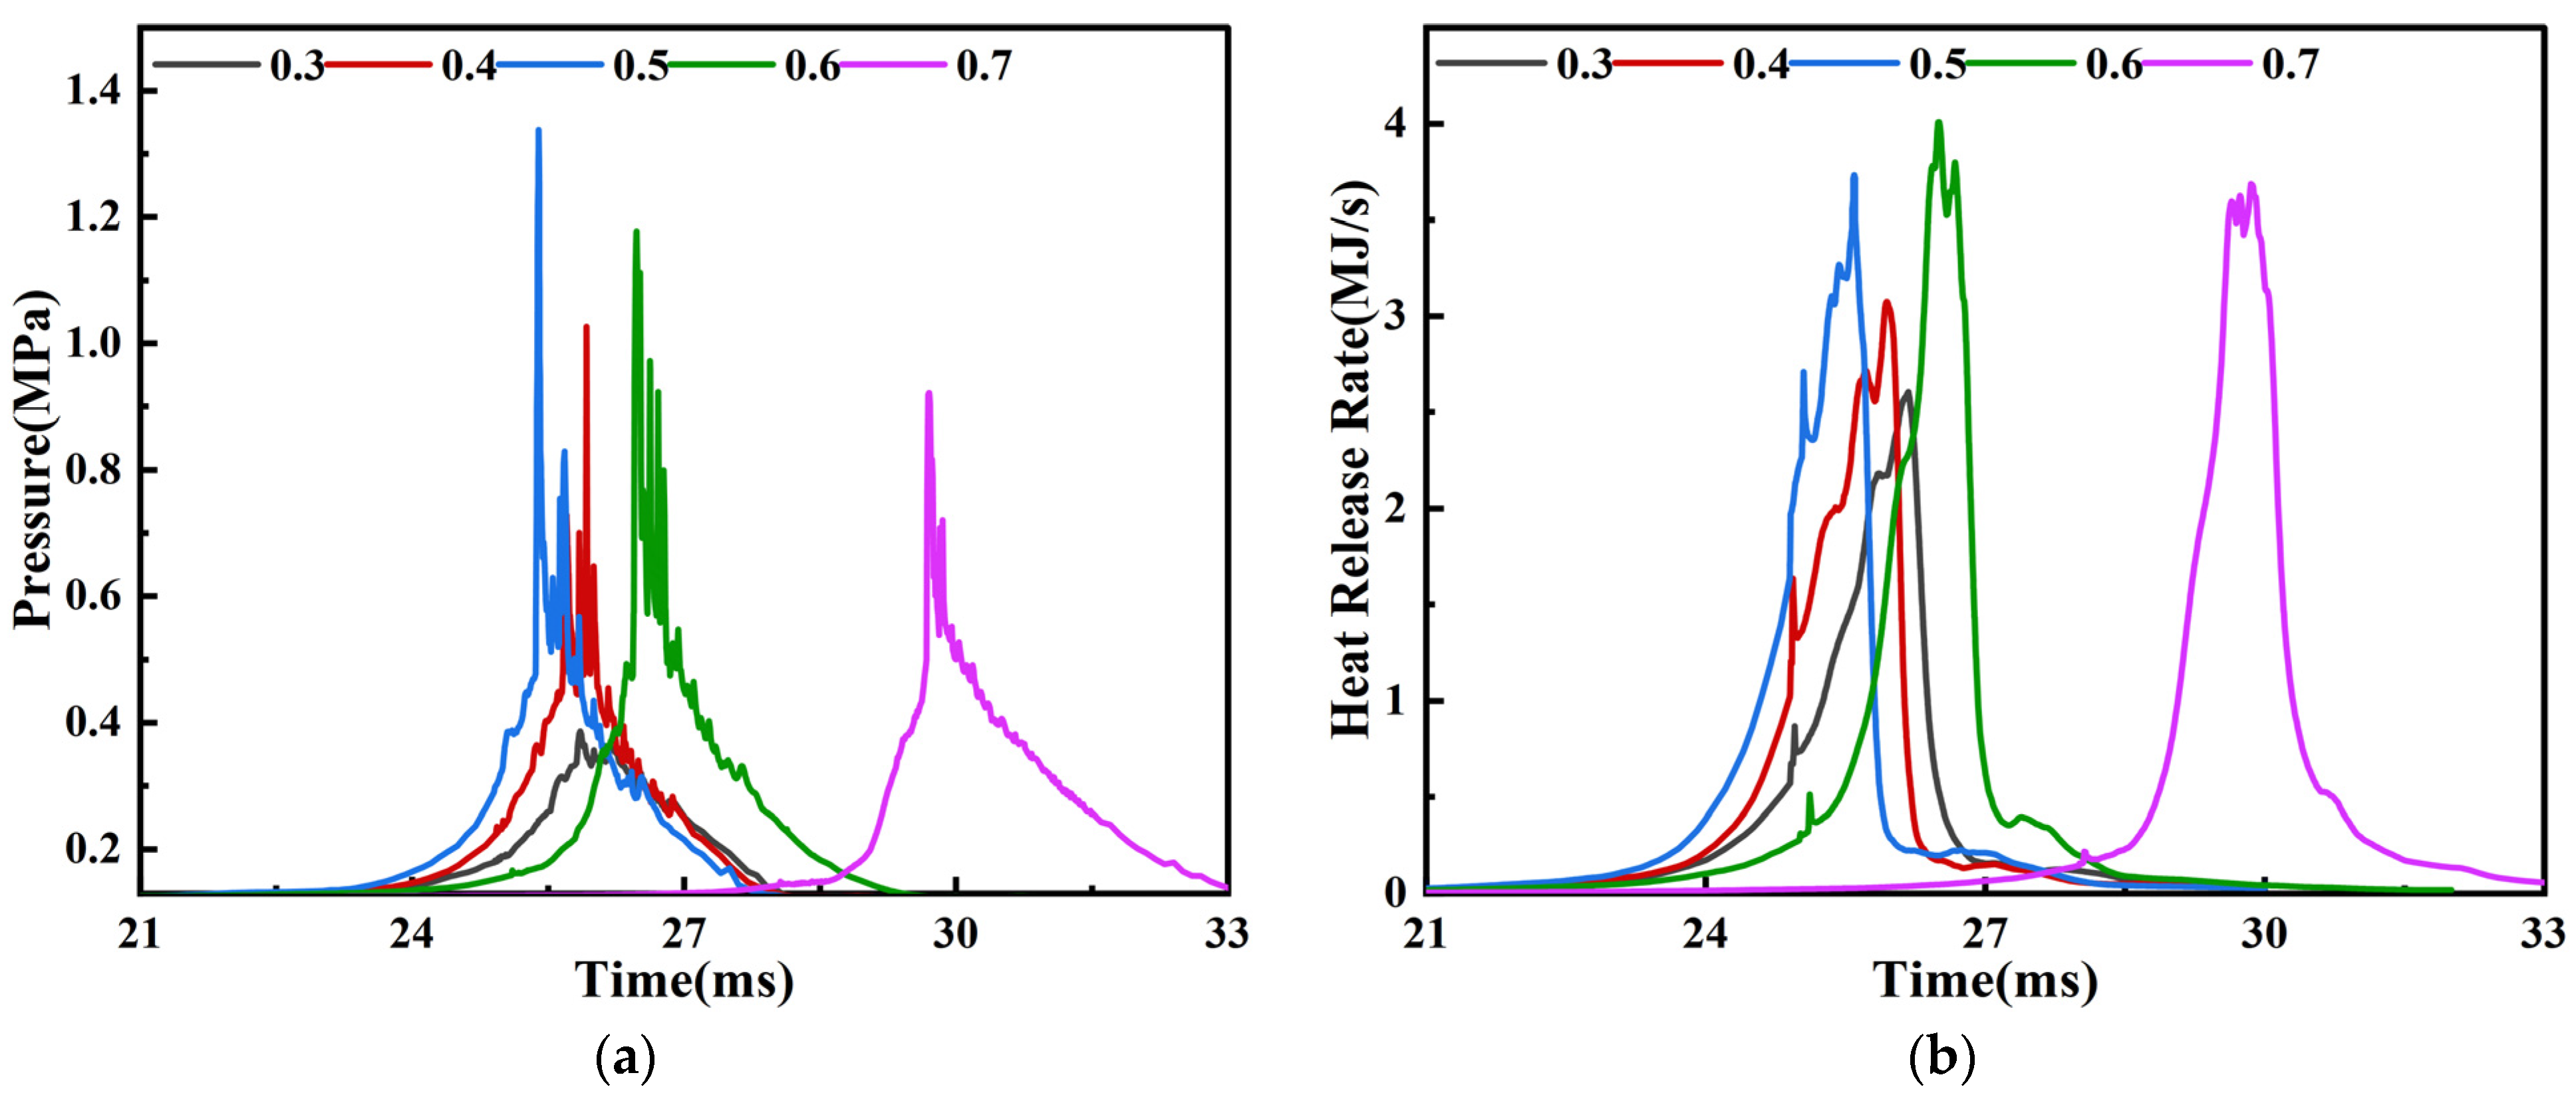
  • The detonation mechanism of a detonation wave remains fundamentally consistent across varying BRs, but as the BR increases, the airflow in the tube slows, and the DDT time decreases and then increases. DDT time is 61% higher when the BR is 0.7 than when the BR is 0.5, indicating that a high BR seriously impacts detonation velocity and results in substantial pressure loss. When the BR is 0.54, the DDT time is the shortest at 6.7 ms. The BR has less effect on the DDT distance, but a low BR will prolong the DDT distance.
  • When BR ≤ 0.5, there are not two types of detonation waves in the detonation tube, indicating that an excessively small BR will affect the strength and range of the compression waves. At this time, the blockage in the tube is small, high-strength leading shock waves cannot be formed, and the interaction between shock waves and the wall surface is insufficient to directly initiate detonation. The flames, compression waves, and local geometric conditions collectively determine the generation and propagation of detonation waves, and re-initiation will occur under appropriate conditions.
  • When the PDC exhaust gas flow is connected to the turbine, the VGT blade opening is 0.55, the intake air is supercharged to 1.4 bar, the response time of the compressor is 5.1 s shorter than that of the original engine, and the response rate is increased by 38.3%. Moreover, the time required for the engine to reach its rated torque of 1600 Nm decreases from 7 s to 5.9 s, indicating that the PDC can effectively improve the transient acceleration response process of the diesel engine and provide sufficient intake air charge for the diesel engine in a short time.

Author Contributions

Writing—original draft preparation, D.H.; writing—review and editing, B.W.; validation, J.W.; investigation, M.S. and P.Y. All authors have read and agreed to the published version of the manuscript.

Funding

This research was funded by the National Defense Science and Technology Key Laboratory Foundation Program, grant number 6142212210205.

Data Availability Statement

The data presented in this study are available on request from the corresponding author. The data are not publicly available due to privacy.

Conflicts of Interest

The authors declare no conflicts of interest.

References

  1. Shi, Y.; Zheng, G.; Chen, H.; Wang, L. Transient Behavior Study of HD Diesel Engine and the Effects of Turbochargers. In Proceedings of the FISITA World Automotive Congress; Lecture Notes in Electrical Engineering; Springer: Berlin/Heidelberg, Germany, 2013; Volume 190. [Google Scholar] [CrossRef]
  2. Roy, G.D.; Frolov, S.M.; Borisov, A.A.; Netzer, D.W. Pulse detonation propulsion: Challenges, current status, and future perspective. Prog. Energy Combust. Sci. 2004, 30, 545–672. [Google Scholar] [CrossRef]
  3. Liu, J.Y.; Wang, Z.W.; Zhang, Z.X.; Li, J.L.; Qin, W.F.; Huang, J.J. Reheat effect on the improvement in efficiency of the turbine driven by pulse detonation. Def. Technol. 2024, 31, 200–210. [Google Scholar] [CrossRef]
  4. Anand, V.; Gutmark, E. Rotating detonation combustors and their similarities to rocket instabilities. Prog. Energy Combust. Sci. 2019, 73, 182–234. [Google Scholar] [CrossRef]
  5. Jin, S.; Qi, L.; Zhao, N.B.; Zheng, H.T.; Meng, Q.Y.; Yang, J.L. Experimental and numerical research on rotating detonation combustor under non-premixed conditions. Int. J. Hydrogen Energy 2020, 45, 10176–10188. [Google Scholar] [CrossRef]
  6. Wang, Z.W.; Qin, W.F.; Huang, J.J.; Wei, L.S.; Yang, Y.X.; Wang, Y.Q.; Zhang, Y. Numerical investigation of the effect of jet intensity from internal jet tube on detonation initiation characteristics. Int. J. Hydrogen Energy 2022, 47, 13732–13745. [Google Scholar] [CrossRef]
  7. Zhao, M.J.; Zhang, H.W. Origin and chaotic propagation of multiple rotating detonation waves in hydrogen/air mixtures. Fuel 2020, 275, 117986. [Google Scholar] [CrossRef]
  8. Luan, Z.Y.; Huang, Y.; Gao, S.J.; You, Y.C. Formation of multiple detonation waves in rotating detonation engines with inhomogeneous methane/oxygen mixtures under different equivalence ratios. Combust. Flame 2022, 241, 112091. [Google Scholar] [CrossRef]
  9. Peng, H.Y.; Liu, W.D.; Liu, S.J.; Zhang, H.L.; Jiang, L.X. Hydrogen-air, ethylene-air, and methane-air continuous rotating detonation in the hollow chamber. Energy 2020, 211, 118598. [Google Scholar] [CrossRef]
  10. Wang, G.Y.; Liu, W.D.; Liu, S.J.; Zhang, H.L.; Peng, H.Y.; Zhou, Y.F. Experimental verification of cylindrical air-breathing continuous rotating detonation engine fueled by non-premixed ethylene (vol 189, pg 722, 2021). Acta Astronaut. 2022, 193, 795–796. [Google Scholar] [CrossRef]
  11. Wang, Y.; Le, J.; Wang, C.; Zheng, Y. A non-premixed rotating detonation engine using ethylene and air. Appl. Therm. Eng. 2018, 137, 749–757. [Google Scholar] [CrossRef]
  12. Musick, B.J.; Paudel, M.; Ramaprabhu, P.K.; McFarland, J.A. Numerical simulations of droplet evaporation and breakup effects on heterogeneous detonations. Combust. Flame 2023, 257, 113035. [Google Scholar] [CrossRef]
  13. Wen, H.C.; Fan, W.Q.; Xu, S.; Wang, B. Numerical study on droplet evaporation and propagation stability in normal-temperature two-phase rotating detonation system. Aerosp. Sci. Technol. 2023, 138, 108324. [Google Scholar] [CrossRef]
  14. Huang, X.X.; Lin, Z.Y. Analysis of coupled-waves structure and propagation characteristics in hydrogen-assisted kerosene-air two-phase rotating detonation wave. Int. J. Hydrogen Energy 2022, 47, 4868–4884. [Google Scholar] [CrossRef]
  15. Yao, S.B.; Guo, C.H.; Zhang, W.W. Effects of droplet evaporation on the flow field of hydrogen-enhanced rotating detonation engines with liquid kerosene. Int. J. Hydrogen Energy 2023, 48, 33335–33345. [Google Scholar] [CrossRef]
  16. Ding, C.W.; Wu, Y.W.; Xu, G.; Xia, Y.Q.; Li, Q.; Weng, C.S. Effects of the oxygen mass fraction on the wave propagation modes in a kerosene-fueled rotating detonation combustor. Acta Astronaut. 2022, 195, 204–214. [Google Scholar] [CrossRef]
  17. Han, X.P.; Huang, Y.K.; Zheng, Q.; Xiao, Q.; Xu, H.; Wang, F.; Wu, Y.W.; Feng, W.K.; Weng, C.S. Study of the characteristics and combustion efficiency of liquid kerosene/oxygen-enriched air rotating detonation wave with different modes. Fuel 2024, 355, 18. [Google Scholar] [CrossRef]
  18. Zhang, Q.B.; Qiao, X.Q.; Fan, W.; Wang, K.; Tan, F.G.; Wang, J.G. Study on operation and propulsion features of a pulse detonation rocket engine with secondary oxidizer injection. Appl. Therm. Eng. 2020, 180, 115661. [Google Scholar] [CrossRef]
  19. Ma, Y.; Zhou, S.B.; Ma, H.; Ge, G.Y.; Yu, D.H.; Zou, G.; Liang, Z.T.; Zhang, T.F. Experimental investigation on propagation characteristics of liquid-fuel/preheated-air rotating detonation wave. Int. J. Hydrogen Energy 2022, 47, 24080–24092. [Google Scholar] [CrossRef]
  20. Qiu, H.; Bai, Q.D.; Han, J.X.; Huang, B.Y.; Liu, Z.Y.; Weng, C.S. Experimental research on self-initiation process of rotating detonation wave by high-temperature ethylene-rich gas. Fuel 2024, 357, 129795. [Google Scholar] [CrossRef]
  21. Wang, J.S.; Lin, W.; Huang, W.D.; Shi, Q.; Zhao, J.F. Numerical study on atomization and evaporation characteristics of preheated kerosene jet in a rotating detonation scramjet combustor. Appl. Therm. Eng. 2022, 203, 117920. [Google Scholar] [CrossRef]
  22. Zhao, J.F.; Ren, Y.J.; Tong, Y.H.; Lin, W.; Nie, W.S. Atomization of a liquid jet in supersonic crossflow in a combustion chamber with an expanded section. Acta Astronaut. 2021, 180, 35–45. [Google Scholar] [CrossRef]
  23. Malik, V.; Salauddin, S.; Hytovick, R.; Bielawski, R.; Raman, V.; Bennewitz, J.; Burr, J.; Paulson, E.; Hargus, W.; Ahmed, K. Detonation wave driven by aerosolized liquid RP-2 spray. Proc. Combust. Inst. 2023, 39, 2807–2815. [Google Scholar] [CrossRef]
  24. Xu, G.; Wu, Y.W.; Kang, C.H.; Lei, T.; Qiu, Y.M.; Ding, C.W.; Weng, C.S. Propagation behaviors of kerosene-fueled rotating detonation wave with varied atomizer locations. Aerosp. Sci. Technol. 2023, 142, 108676. [Google Scholar] [CrossRef]
  25. Frolov, S.M. Liquid-fueled, air-breathing pulse detonation engine demonstrator: Operation principles and performance. J. Propuls. Power 2006, 22, 1162–1169. [Google Scholar] [CrossRef]
  26. Wolanski, P.; Balicki, W.; Perkowski, W.; Bilar, A. Experimental research of liquid-fueled continuously rotating detonation chamber. Shock Waves 2021, 31, 807–812. [Google Scholar] [CrossRef]
  27. Wu, Y.W.; Han, Q.X.; Yang, G.Y. Effects of an acoustic atomizer upon liquid-fueled detonation initiations in a detonation tube. Exp. Therm. Fluid Sci. 2019, 109, 109863. [Google Scholar] [CrossRef]
  28. Zhang, Q.B.; Wang, K.; Dong, R.X.; Fan, W.; Lu, W.; Wang, Y.J. Experimental research on propulsive performance of the pulse detonation rocket engine with a fluidic nozzle. Energy 2019, 166, 1267–1275. [Google Scholar] [CrossRef]
  29. Zhang, B.; Liu, H.; Wang, C. On the detonation propagation behavior in hydrogen-oxygen mixture under the effect of spiral obstacles. Int. J. Hydrogen Energy 2017, 42, 21392–21402. [Google Scholar] [CrossRef]
  30. Zheng, K.; Jia, Q.H.; Ma, Z.M.; Xing, Z.X.; Hao, Y.M.; Yu, M.G. Experimental and numerical investigation on the premixed methane/air flame propagation in duct with obstacle gradients. Process Saf. Environ. Protect. 2023, 178, 893–904. [Google Scholar] [CrossRef]
  31. Heilbronn, D.; Barfuss, C.; Sattelmayer, T. Influence of geometry on flame acceleration and DDT in H<sub>2</sub>-CO-air mixtures in a partially obstructed channel. J. Loss Prev. Process Ind. 2021, 71, 104493. [Google Scholar] [CrossRef]
  32. Goodwin, G.B.; Houim, R.W.; Oran, E.S. Effect of decreasing blockage ratio on DDT in small channels with obstacles. Combust. Flame 2016, 173, 16–26. [Google Scholar] [CrossRef]
  33. Ciccarelli, G.; Fowler, C.J.; Bardon, M. Effect of obstacle size and spacing on the initial stage of flame acceleration in a rough tube. Shock Waves 2005, 14, 161–166. [Google Scholar] [CrossRef]
  34. Saeid, M.H.S.; Khadem, J.; Emami, S. Numerical investigation of the mechanism behind the deflagration to detonation transition in homogeneous and inhomogeneous mixtures of H2-air in an obstructed channel. Int. J. Hydrogen Energy 2021, 46, 21657–21671. [Google Scholar] [CrossRef]
  35. Wang, J.B.; Zhao, X.Y.; Fan, L.Y.; Pan, J.F.; Zhu, Y.J. Effects of the quantity and arrangement of reactive jet obstacles on flame acceleration and transition to detonation: A numerical study. Aerosp. Sci. Technol. 2023, 137, 108269. [Google Scholar] [CrossRef]
  36. Coates, A.M.; Mathias, D.L.; Cantwell, B.J. Numerical investigation of the effect of obstacle shape on deflagration to detonation transition in a hydrogen-air mixture. Combust. Flame 2019, 209, 278–290. [Google Scholar] [CrossRef]
  37. Zhou, S.B.; Liu, F.; Ning, H.M.; Hu, N. Experimental investigation on a rotating detonation combustor with the pulse operating frequency of 10 Hz. Acta Astronaut. 2024, 215, 642–652. [Google Scholar] [CrossRef]
  38. Gray, S.; McLoughlin, M.; Ciccarelli, G. Fuel-oxygen mixing and detonation propagation in a linear rotating detonation rocket engine geometry. Combust. Flame 2024, 260, 113250. [Google Scholar] [CrossRef]
  39. Luo, S.B.; Sun, Y.H.; Song, J.W.; Liu, J. Performance analysis of a hybrid pulse detonation engine using liquid hydrogen as fuel. Int. J. Hydrogen Energy 2022, 47, 21537–21551. [Google Scholar] [CrossRef]
  40. Feng, W.K.; Zheng, Q.; Xiao, Q.; Meng, H.L.; Han, X.P.; Cao, Q.; Huang, H.L.; Wu, B.W.; Xu, H.; Weng, C.S. Effects of cavity length on operating characteristics of a ramjet rotating detonation engine fueled by liquid kerosene. Fuel 2023, 332, 126129. [Google Scholar] [CrossRef]
  41. Xu, S.D.; Song, F.L.; Wu, Y.; Zhou, J.P.; Cheng, P.; Yang, X.K.; Chen, X. Experimental investigation on combustion efficiency of a partially premixed kerosene-air rotating detonation combustor. Fuel 2022, 329, 125418. [Google Scholar] [CrossRef]
  42. Li, X.F.; Li, J.Z.; Qin, Q.Y.; Jin, W.; Yuan, L. Experimental study on detonation characteristics of liquid kerosene/air rotating detonation engine. Acta Astronaut. 2024, 215, 124–134. [Google Scholar] [CrossRef]
  43. Tunik, Y.V.; Gerasimov, G.Y.; Levashov, V.Y.; Mayorov, V.O. Busemann diffuser for supersonic ramjet on detonation combustion of kerosene vapor. Acta Astronaut. 2022, 198, 495–501. [Google Scholar] [CrossRef]
  44. Sato, T.; Chacon, F.; Gamba, M.; Raman, V. Mass flow rate effect on a rotating detonation combustor with an axial air injection. Shock Waves 2021, 31, 741–751. [Google Scholar] [CrossRef]
  45. Zhao, W.D.; Deiterding, R.; Liang, J.H.; Wang, X.X.; Cai, X.D.; Duell, J. Adaptive simulations of flame acceleration and detonation transition in subsonic and supersonic mixtures. Aerosp. Sci. Technol. 2023, 136, 108205. [Google Scholar] [CrossRef]
  46. Warimani, M.; Azami, M.H.; Khan, S.A.; Ismail, A.F.; Saharin, S.; Ariffin, A.K. Internal flow dynamics and performance of pulse detonation engine with alternative fuels. Energy 2021, 237, 121719. [Google Scholar] [CrossRef]
  47. Jiang, C.; Pan, J.; Li, J.; Shi, X.; Quaye, E.K. Numerical simulation of detonation re-initiation in a 90° bifurcated channel filled with n-heptane/air mixture. Acta Astronaut. 2023, 202, 497–510. [Google Scholar] [CrossRef]
  48. Wang, Z.W.; Wang, Y.Q.; Peng, C.X.; Zheng, L.X. Experimental study of pressure back-propagation in a valveless air-breathing pulse detonation engine. Appl. Therm. Eng. 2017, 110, 62–69. [Google Scholar] [CrossRef]
  49. Qiu, H.; Su, Z.; Xiong, C. Experimental investigation on multi-cycle two-phase spiral pulse detonation tube of two configurations. Proc. Inst. Mech. Eng. Part G-J. Aerosp. Eng. 2019, 233, 4166–4175. [Google Scholar] [CrossRef]
Figure 1. The configuration and meshing of the computational model (unit: mm).
Energies 17 02466 g001
Figure 2. Schematic of the experimental setup for the pulse detonation system.
Energies 17 02466 g002
Figure 3. Comparison of detonation pressure between the experiment and numerical simulation.
Energies 17 02466 g003
Figure 4. Process of fuel injection and mixing: (a) distribution of mixture equivalence ratio and flow field (t = 13 ms); (b) distribution of mixture equivalence ratio and flow field (t = 15 ms); (c) distribution of mixture equivalence ratio and flow field (t = 18 ms); (d) distribution of mixture equivalence ratio and flow field (t = 20 ms).
Energies 17 02466 g004
Figure 5. Process of ignition and the initial formation of flame: (a) distribution of mixture equivalence ratio and flow field (t = 18 ms); (b) distribution of mixture temperature and equivalence ratio contour lines (t = 19 ms); (c) distribution of mixture equivalence ratio and flow field (t = 20 ms); (d) distribution of mixture temperature (t = 20.4 ms).
Energies 17 02466 g005
Figure 6. Process of flame acceleration and detonation initiation: (a) distribution of mixture temperature (t = 23 ms); (b) distribution of mixture temperature (t = 24 ms); (c) distribution of mixture temperature (t = 24.7 ms); (d) distribution of mixture velocity (t = 24.7 ms); (e) distribution of mixture velocity (t = 24.7 ms); (f) distribution of mixture velocity (t = 24.8 ms).
Energies 17 02466 g006
Figure 7. Process of flame and detonation wave propagation: (a) distribution of mixture velocity (t = 25.1 ms); (b) distribution of mixture temperature (t = 25.1 ms); (c) distribution of mixture velocity (t = 25.3 ms); (d) distribution of mixture temperature (t = 25.3 ms); (e) distribution of mixture velocity (t = 25.5 ms); (f) distribution of mixture temperature (t = 25.5 ms).
Energies 17 02466 g007
Figure 8. The airflow velocity and DDT time vary with BR.
Energies 17 02466 g008
Figure 9. DDT distance and detonation wave distribution vary with BR: (a) DDT distance at different BRs; (b) distribution of detonation wave at different BRs.
Energies 17 02466 g009
Figure 10. Pressure and heat release rate vary with BR: (a) pressure at different BRs; (b) heat release rate at different BRs.
Energies 17 02466 g010
Figure 11. GT-POWER model layout.
Energies 17 02466 g011
Figure 12. Comparison of compressor outlet pressure between the original engine and connected PDC at a VGT opening of 0.55.
Energies 17 02466 g012
Figure 13. Comparison of transient response performance between the original engine and connected PDC: (a) engine intake flow response; (b) engine torque response.
Energies 17 02466 g013
Table 1. Physical and chemical models of simulation.
ProcessModel
Turbulence RNG   k ε
Spray breakKH-RT
Spray-wall interactionRebound/slide
Fuel collisionNTC
Drop evaporationFrossling
Wall heat transferHan and Reitz
CombustionSAGE chemical reaction solver and simplify chemical reaction mechanism
Table 2. GT-POWER simulation engine parameters.
ItemValueUnit
Cylinder number6-
Bore126mm
Stroke155mm
Speed700r/min
Compression rate17-
Displacement11.6L
Air intake methodTurbocharged, intercooled-
Nozzle number × diameter8 × 0.217mm
Disclaimer/Publisher’s Note: The statements, opinions and data contained in all publications are solely those of the individual author(s) and contributor(s) and not of MDPI and/or the editor(s). MDPI and/or the editor(s) disclaim responsibility for any injury to people or property resulting from any ideas, methods, instructions or products referred to in the content.

