Article

Techno-Economic Assessment of a Full-Chain Hydrogen Production by Offshore Wind Power

1
Guangzhou Power Supply Bureau, Guangdong Power Grid Co., Ltd., Guangzhou 510620, China
2
State Key Laboratory of Engines, Tianjin University, Tianjin 300350, China
3
National Industry-Education Platform for Energy Storage, Tianjin University, Tianjin 300350, China
*
Authors to whom correspondence should be addressed.
Energies 2024, 17(11), 2447; https://doi.org/10.3390/en17112447
Submission received: 25 April 2024 / Revised: 11 May 2024 / Accepted: 12 May 2024 / Published: 21 May 2024
(This article belongs to the Special Issue Applications of Microfluidic Power Systems)

Abstract

:
Offshore wind power stands out as a promising renewable energy source, offering substantial potential for achieving low carbon emissions and enhancing energy security. Despite its potential, the expansion of offshore wind power faces considerable constraints in offshore power transmission. Hydrogen production derived from offshore wind power emerges as an efficient solution to overcome these limitations and effectively transport energy. This study systematically devises diverse hydrogen energy supply chains tailored to the demands of the transportation and chemical industries, meticulously assessing the levelized cost of hydrogen (LCOH). Our findings reveal that the most cost-efficient means of transporting hydrogen to the mainland is through pipelines, particularly when the baseline distance is 50 km and the baseline electricity price is 0.05 USD/kWh. Notably, delivering hydrogen directly to the port via pipelines for chemical industries proves considerably more economical than distributing it to hydrogen refueling stations, with a minimal cost of 3.6 USD/kg. Additionally, we assessed the levelized cost of hydrogen (LCOH) for supply chains that transmit electricity to ports via submarine cables before hydrogen production and subsequent distribution to chemical plants. In comparison to offshore hydrogen production routes, these routes exhibit higher costs and reduced competitiveness. Finally, a sensitivity analysis was undertaken to scrutinize the impact of delivery distance and electricity prices on LCOH. The outcomes underscore the acute sensitivity of LCOH to power prices, highlighting the potential for substantial reductions in hydrogen prices through concerted efforts to lower electricity costs.

1. Introduction

Energy consumption has increased dramatically in recent decades as a result of population growth and industrial development. The increasing need for energy involves the combustion of more fossil fuels, which emit greenhouse gases and contribute to air pollution [1,2]. To reduce greenhouse gas emissions, international communities are looking for environmentally acceptable and low-carbon energy sources, such as solar and wind power [3,4]. Offshore wind power is recognized as one of the most promising renewable energy sources due to the greater wind resources and customizable layout on the sea in the near future [4]. Offshore turbines run at higher wind speeds and in more constant directions than onshore turbines, making them more efficient [4]. However, the intermittent output of offshore wind electricity makes it difficult to connect to the grid network [5]. On the other hand, the expensive cost of submarine cables limits the use of offshore wind power in practical projects. Hydrogen from offshore wind farms is recognized as one of the most effective techniques for removing the constraints of fluctuations and lowering power delivery costs [6]. Because hydrogen is a good alternative energy to fossil fuels, it has the highest specific energy of 142 MJ/kg and produces only water when combined with oxygen. In recent decades, hydrogen has been mostly produced from coal and natural gas and used as a raw material in fertilizer making and petroleum refining [7,8]. Today, as fuel cells improve rapidly, new markets for transportation and utilities arise.
Hydrogen can be produced in a variety of ways, including natural gas reforming, coal gasification, and water electrolysis. The cost of hydrogen production is significantly dependent on sources of energy and production processes. For example, hydrogen produced from natural gas reforming has the lowest cost due to its massive scale as well as cheap raw material [9]. However, this process produces a significant amount of carbon dioxide, which contributes to global warming, whereas water electrolysis does not. Hydrogen production from offshore wind offers a possible way to meet increasingly rigorous environmental standards. There are numerous benefits to combining hydrogen production with offshore wind. First, we can employ hydrogen production to increase the penetration of renewable electricity by reducing its curtailment [10]. Then, the hydrogen produced offshore can be delivered by undersea pipelines and ships, preventing the construction of high-voltage, long-distance, large-capacity transmission submarine cable lines, especially when the wind farm is far from land [11,12]. Finally, reducing the use of fossil fuels lowers carbon emissions and the greenhouse gas effect. In contrast, heavy-duty vehicles equipped with fuel cells only release water, which may significantly decrease air pollution [13].
The structure of an offshore hydrogen supply chain typically consists of hydrogen production, delivery, and distribution. The components of hydrogen production include electrolyzers, offshore platforms, and seawater desalination systems. After the hydrogen production stage, the delivery stages involve submarine pipelines, storage tanks, gas ships, and liquid ships in this study. At the distribution stage, high-pressure trailers, liquid trailers, distribution pipelines, refueling stations, and other auxiliary equipment are involved. These components make up the overall structure of different hydrogen supply chains as Figure 1 shows. At the first stage of hydrogen production, an alkaline electrolyzer (AE) is the most commonly utilized electrolysis technology for large-scale industrial applications because it is well established, affordable, simple to procure, and long-lasting [14,15,16]. Another promising technology is proton exchange membrane electrolysis (PEME), which is based on proton exchange membrane fuel cell technology and shows rapid response times, high efficiency, high product purity, compact design, and high output pressures [17]. Other electrolysis technologies, like solid oxide electrolysis [18] and anion exchange membrane electrolysis [19], are still in the laboratory stage and are not yet developed. Therefore, only AE and PEME are analyzed in this study. The electrolysis equipment has very strict requirements on water purity, which can be supplied by desalination technologies. Generally, there are three types of desalination technologies, evaporation and condensation, filtration, and crystallization [20,21]. The cost of seawater desalination varies from 0.52 to 2.5 USD/m3 [20,22], which is a tiny contribution to the cost of hydrogen. In this study, we choose a filtration system that is suitable for hydrogen production platforms to desalinate seawater to make it up to the purity standard. When seawater flows into the filtration system, it will be pumped into a reverse osmosis membrane (RO) and finally pass through the ion exchange (IX) process [9]. Since PEME needs water of greater quality than AE, we designed a two-stage filtering system for PEME to ensure the dependable operation of electrolyzers [9].
Most offshore wind power facilities are located far from the coast, so the hydrogen they produce must be stored in high-pressure gas tanks or liquid containers before transport to the gas distribution system. This has driven researchers to find ways to reduce the costs of hydrogen delivery systems. Yan et al. [23] designed various hydrogen delivery strategies to evaluate the technical and economic performance of hybrid offshore systems that co-generate hydrogen and power. Sepanta et al. explored the economic feasibility of producing hydrogen from seawater, focusing on seawater desalination, and found that the cost of desalination for producing 1 kg of hydrogen is relatively low [9]. In international hydrogen trade, transportation distance can be significant. Lee et al. compared the costs of five hydrogen storage technologies—liquid hydrogen, ammonia, toluene-methylcyclohexane (TOL-MCH), dibenzyltoluene-perhydro-dibenzyltoluene (H0DBT-H18DBT), and methanol—and found that TOL-MCH had the best economic and environmental performance [24]. Another study examined different transportation methods, concluding that high-pressure shipping without storage facilities at port terminals incurs the lowest cost [25]. Gu et al. looked into hydrogen distribution to fuel cell cars and estimated the distribution and refueling cost at around 2.0 USD/kg H2 [26]. Olateju et al. developed an integrated wind–hydrogen plant model to optimize battery and electrolyzer sizes, estimating the cost of hydrogen production through wind-powered electrolysis to range from 3.37 to 9.0 EUR/kg [27].
The precise technical and economic assessment is paramount in the formulation and implementation of novel hydrogen energy systems. The economic viability of offshore hydrogen systems is intricately linked to the judicious selection of technologies, investment in components, and the management of operational and maintenance costs [28]. In this study, we have established an economic model aimed at assessing the levelized cost of hydrogen supply chains, encompassing all stages from production to utilization, as illustrated in Figure 1. Concerning the delivery stage, three distinct approaches are proposed: liquid shipping, high-pressure shipping, and submarine pipelines. Subsequently, hydrogen is conveyed to an onshore storage facility for further distribution. In the distribution phase, we evaluate the costs associated with liquid trailers, high-pressure gas trailers, and pipelines. Additionally, we consider two hydrogen consumption scenarios: refueling stations and industrial factories. To allow for accurate comparisons between onshore and offshore hydrogen electrolysis, this study also evaluates the cost of routes that carry power via submarine cables to the port before electrolyzing it into hydrogen, and the details are shown in Figure 1 and Table 1. In Table 1, the prefixes R and F denote hydrogen supply chains that end at a refueling station and a factory, respectively, and C represents routes involving a submarine cable.
This research stands out from previous studies by focusing on the levelized cost of hydrogen (LCOH) in offshore hydrogen supply chains—a topic rarely examined in depth. What sets this study apart is its comprehensive approach: it considers every stage of the hydrogen supply chain, from offshore platform construction to seawater desalination and the costs associated with loading and receiving. By incorporating such a detailed analysis, this study provides valuable insights that can guide policymakers in making more informed decisions.

2. Methods

The hydrogen supply chain comprises four integral components: production, storage and delivery, distribution, and utilization, as depicted in Figure 1. This study strategically designs 15 routes for the delivery of offshore wind power, detailed in Table 1. The envisioned hydrogen destinations are the refueling station and industrial factory, symbolizing transportation and industrial sectors with substantial potential for hydrogen consumption. Routes designated by identifiers starting with R, F, and C denote pathways associated with hydrogen refueling stations as terminals for utilization, routes involving factories as endpoints for utilization, and routes utilizing submarine cables for the transmission of wind power, respectively.
It is worth noting that the economic model presented in Section 2.1 is utilized to evaluate the costs associated with all stages of the process, including hydrogen production, delivery, distribution, and more. However, certain stages require additional clarification due to their complexity. To address this, our study provides specific details and formulas for calculating costs related to raw materials, components, and labor. This information is a supplement to the broader economic model and ensures that the evaluation is comprehensive and precise.

2.1. Economic Model

The levelized cost of hydrogen (LCOH) can be defined as the total lifetime cost of the investment in a hydrogen supply chain divided by its cumulative delivered hydrogen. It reflects the internal average price of hydrogen that can be sold at a time when the net present value of the investment is zero. It may be used to calculate the lowest cost of a product from birth to death, which is extremely important for policymakers when determining if a project is worthwhile. However, more precise assessments demand a large amount of data, which is difficult to collect, and researchers must make certain compromises to lower the size of data while still meeting the requirements of their research. In this study, the LCOH model is formulated to appraise the economic viability of the supply chains under diverse scenarios, with route details provided in Table 1. The project’s lifespan is presumed to be 30 years [29], employing an 8% discount rate, while specific parameters are delineated in Table 2. The levelized cost encompasses two primary components: capital investment and operational and maintenance costs. Capital costs encompass infrastructure construction, equipment procurement and installation, land expenses, and other ancillary costs. The annual capital cost is computed using the recovery factor (RF), denoting the present cost value of a series of equal annual costs over a predetermined period, expressed by Equation (1).
R F = i ( 1 + i ) y ( i + 1 ) y 1
where y and i are the discount rate and lifetime of the project, respectively. Therefore, the capital cost of energy (USD/kg, USD/kWh) can be calculated by Equation (2).
c cap = C cap × R F E flow
where c cap is the capital cost of per unit energy (kg H2, kWh), C cap is the total capital investment, and E flow is the annual energy flow of the energy supply chains, which represents the hydrogen supply chains and electricity supply chain (submarine cable) in this study.
The operation and maintenance (O&M) cost encompasses equipment maintenance, system energy consumption, labor salaries, replacement costs, and similar factors. Annual fluctuations in O&M costs are attributed to rising labor expenses, electricity prices, inflation, and other uncertainties. Consequently, an annual change rate is incorporated into this study to account for these dynamic factors. The O&M cost can be calculated in Equation (3).
c O & M = C O & M annual × m = 1 m = y ( 1 + R annual ) m ( 1 + i ) m × R F
where c O & M is the cost of hydrogen (USD/kg) or electricity (USD/kWh), C O & M annual is the annual O&M cost, R annual is the annual change rate, and y is the project life year. Therefore, the levelized cost of hydrogen (or electricity) is calculated by Equation (4).
L C O H = c cap + c O & M

2.2. Hydrogen Production

An offshore hydrogen production system comprises a power conversion system, a platform, and a seawater desalination system. Currently, two primary electrolysis technologies, namely alkaline electrolysis (AE) and proton exchange membrane electrolysis (PEME), show promise for large-scale applications [31,32]. AE has achieved widespread commercialization and is presently the primary method for green hydrogen production through electrolysis. PEME, gaining recent attention due to its superior adaptability to renewable energy volatility and higher hydrogen purity compared to AE, has experienced a steady decline in cost [32,33]. AE and PEME, compared to other technologies, offer flexibility in installation and relatively low costs, rendering them suitable for offshore hydrogen production platforms [33,34]. To accurately assess hydrogen production costs, considerations encompass the construction of offshore platforms, electrolyzer capital costs, and desalination expenses. Table 3 presents the cost parameters of electrolyzers. With a 1000 MW offshore wind farm capacity, the study adopts the 95th percentile load factor for electrolyzer power capacity calculation [30], addressing wind power uncertainty while significantly reducing capital investment. Hydrogen production, calculated using the average load factor [30], is employed in determining the levelized cost of hydrogen (LCOH).
Typically, the produced hydrogen undergoes short-term storage before delivery to onshore distribution centers. Storage size and technologies vary among delivery methods, prompting the inclusion of storage costs in the delivery stage.

2.3. Hydrogen Delivery

This study introduces three transportation methods for delivering hydrogen from offshore platforms to onshore distribution centers: submarine pipelines, high-pressure gas ships, and liquid hydrogen ships. Despite hydrogen’s exceptional energy density at 33.33 kWh/kg under normal temperature and pressure, its volumetric density is only 2.9 kWh/Nm3, approximately 3000 times less than that of diesel [23]. Typically, hydrogen undergoes compression or liquefaction for shipping, both processes incurring additional energy consumption that elevates delivery costs. The liquefaction process, in particular, is estimated to require approximately 7–11 kWh of electricity to liquefy 1 kg of hydrogen [42]. The energy consumption and capital cost of liquefication can be calculated by Equation (5) and Equation (6), respectively [43].
E liqf = 13.382 × F N 0.1
C liquefier = 5.6 × 10 6 × F 0.8
where E liqf denotes the actual average energy requirement of liquefaction (kWh/kg), F is the flow rate of liquefication (ton/day), N is the number of liquefiers, and C liquefier represents the capital cost of liquefication.
A steel pressure vessel with a glass fiber composite overwrap is usually used as a hydrogen storage tank due to its high pressure resistance and relatively low cost [23]. The 35 MPa and 70 MPa tanks are commonly used to store hydrogen in fuel cell cars [44]. However, a gas ship can just deliver 100~2000 tons of high-pressure hydrogen, which is one-tenth of a liquid hydrogen ship [23,25]. More details of ships can be found in Table 4. The power and capital cost of compressors can be calculated by Equations (7) and (8) [43].
P compressor = z × m × R × T × n 1 η k k 1 P outlet P inlet k 1 n k 1
C compressor = 40035 × ( P compressor ) 0.6038
where z is the mean compressibility factor, m is the mass flow rate (kg/s), R is the universal gas constant, T is the inlet gas temperature (K), n is the number of compression stages, η is the isentropic efficiency, k is the ratio of specific heats, P outlet is the absolute compressor discharge pressure, and P inlet is the absolute compressor inlet pressure. The C compressor represents the capital cost of compressors (USD). The specific values of these parameters are shown in Table 4.
The pipeline stands out as an ideal method for delivering hydrogen over large mass flows [45], but its cost is challenging to estimate due to substantial uncertainties. Hydrogen pipelines typically operate at an average pressure ranging from 6 to 10 MPa [29,45], eliminating the need for a significant amount of extra energy for prior compression or liquefaction of hydrogen. In an accurate estimation of submarine pipeline costs, this study meticulously considers material costs, construction costs, and other miscellaneous expenses. The diameter of the pipeline can be calculated by Equation (9).
D p i p = 2 m ρ H 2 V H 2 π
where ρ H 2 and V H 2 is hydrogen density and velocity in the pipeline. And the material cost C pip , labor (USD/km), construction cost C pip , labor (USD), and miscellaneous cost C pip , misce (USD) of the pipeline can be calculated by Equation (10) [43,46].
C pip , mat = 100843 × e ( 0.0697 × D pip ) C pip , labor = 1980 × D pip + 1648800 C pip , misce = 485 × ( D pip ) 2 + 20652.8 × D pip + 197192
All the costs are normalized into 2023 based on the chemical engineering plant cost index [46].

2.4. Hydrogen Distribution

Upon delivery to the onshore distribution center, hydrogen undergoes short-term storage before being distributed to consumption terminals. In this study, the main utilization scenarios considered are refueling stations for fuel cell cars and industrial factories utilizing hydrogen as a chemical raw material. Three distribution methods are devised: the high-pressure tank trailer (20 MPa), the liquid trailer, and the pipeline, as illustrated in Figure 1. The economic parameters of the trailers are listed in Table 5. For low-pressure hydrogen stored in the distribution center and delivered by a pipeline, three delivery strategies are designed. Compression and liquefaction are necessary for high-pressure and liquid trailers, respectively. To enhance the precision of pipeline distribution cost evaluation, a two-stage pipeline system is designed, involving multiple branch pipelines connected to a main pipeline. For liquid hydrogen distribution in the distribution center, both high-pressure and liquid trailers are deemed suitable. However, liquefying high-pressure hydrogen proves uneconomical. Therefore, only high-pressure trailers are utilized for distributing high-pressure hydrogen stored in the distribution center. Refer to Table 1 for detailed information on hydrogen supply chains.
When the utilization terminal is designated as a hydrogen refueling station, the refueling cost must be factored into the hydrogen supply chains. The economic parameters of the refueling stations are listed in Table 6 and Table 7. A standard hydrogen refueling station comprises a compressor (or liquid hydrogen pump), a buffer tank, dispensers with a cooling system, and other infrastructure. The typical filling pressures are 35 MPa and 70 MPa. Trucks powered by fuel cells usually prefer using a 35 MPa tank for hydrogen storage due to their lower sensitivity to volume. Conversely, fuel cell cars favor a 70 MPa tank owing to their space constraints. Given that the majority of hydrogen consumers are urban car drivers, only the 70 MPa filling pressure is considered.

2.5. Submarine Cable

Presently, strategies for offshore wind power transmission primarily involve three types: high-voltage alternating current (HVAC) transmission, low-frequency alternating current (LFAC) power transmission, and high-voltage direct current (HVDC) transmission [41]. While most offshore wind farms connect to the grid using HVAC, which suffers from poor power quality over long distances, limited power capacity and transmission distance, and susceptibility to grid failures, other alternatives are being explored. LFAC, although capable of reducing the impedance of the power transmission system and extending the transmission distance, comes with drawbacks such as diminished power quality, and the technology is not yet fully mature [47]. In contrast, HVDC stands out as a robust option [41]. It features high capacity and long-distance transmission, is unaffected by terrestrial power grid issues, is considered safer, and entails lower costs and power loss. However, the drawback lies in the need for constructing an offshore converter platform, with maintenance costs being relatively high. Therefore, the HVDC transmission system is the preferred choice in this study. The construction of the offshore converter platform, submarine cable, and onshore converter are all factored into the analysis. Refer to Table 3 for a comprehensive breakdown of the costs associated with the electricity transmission chain.

3. Results

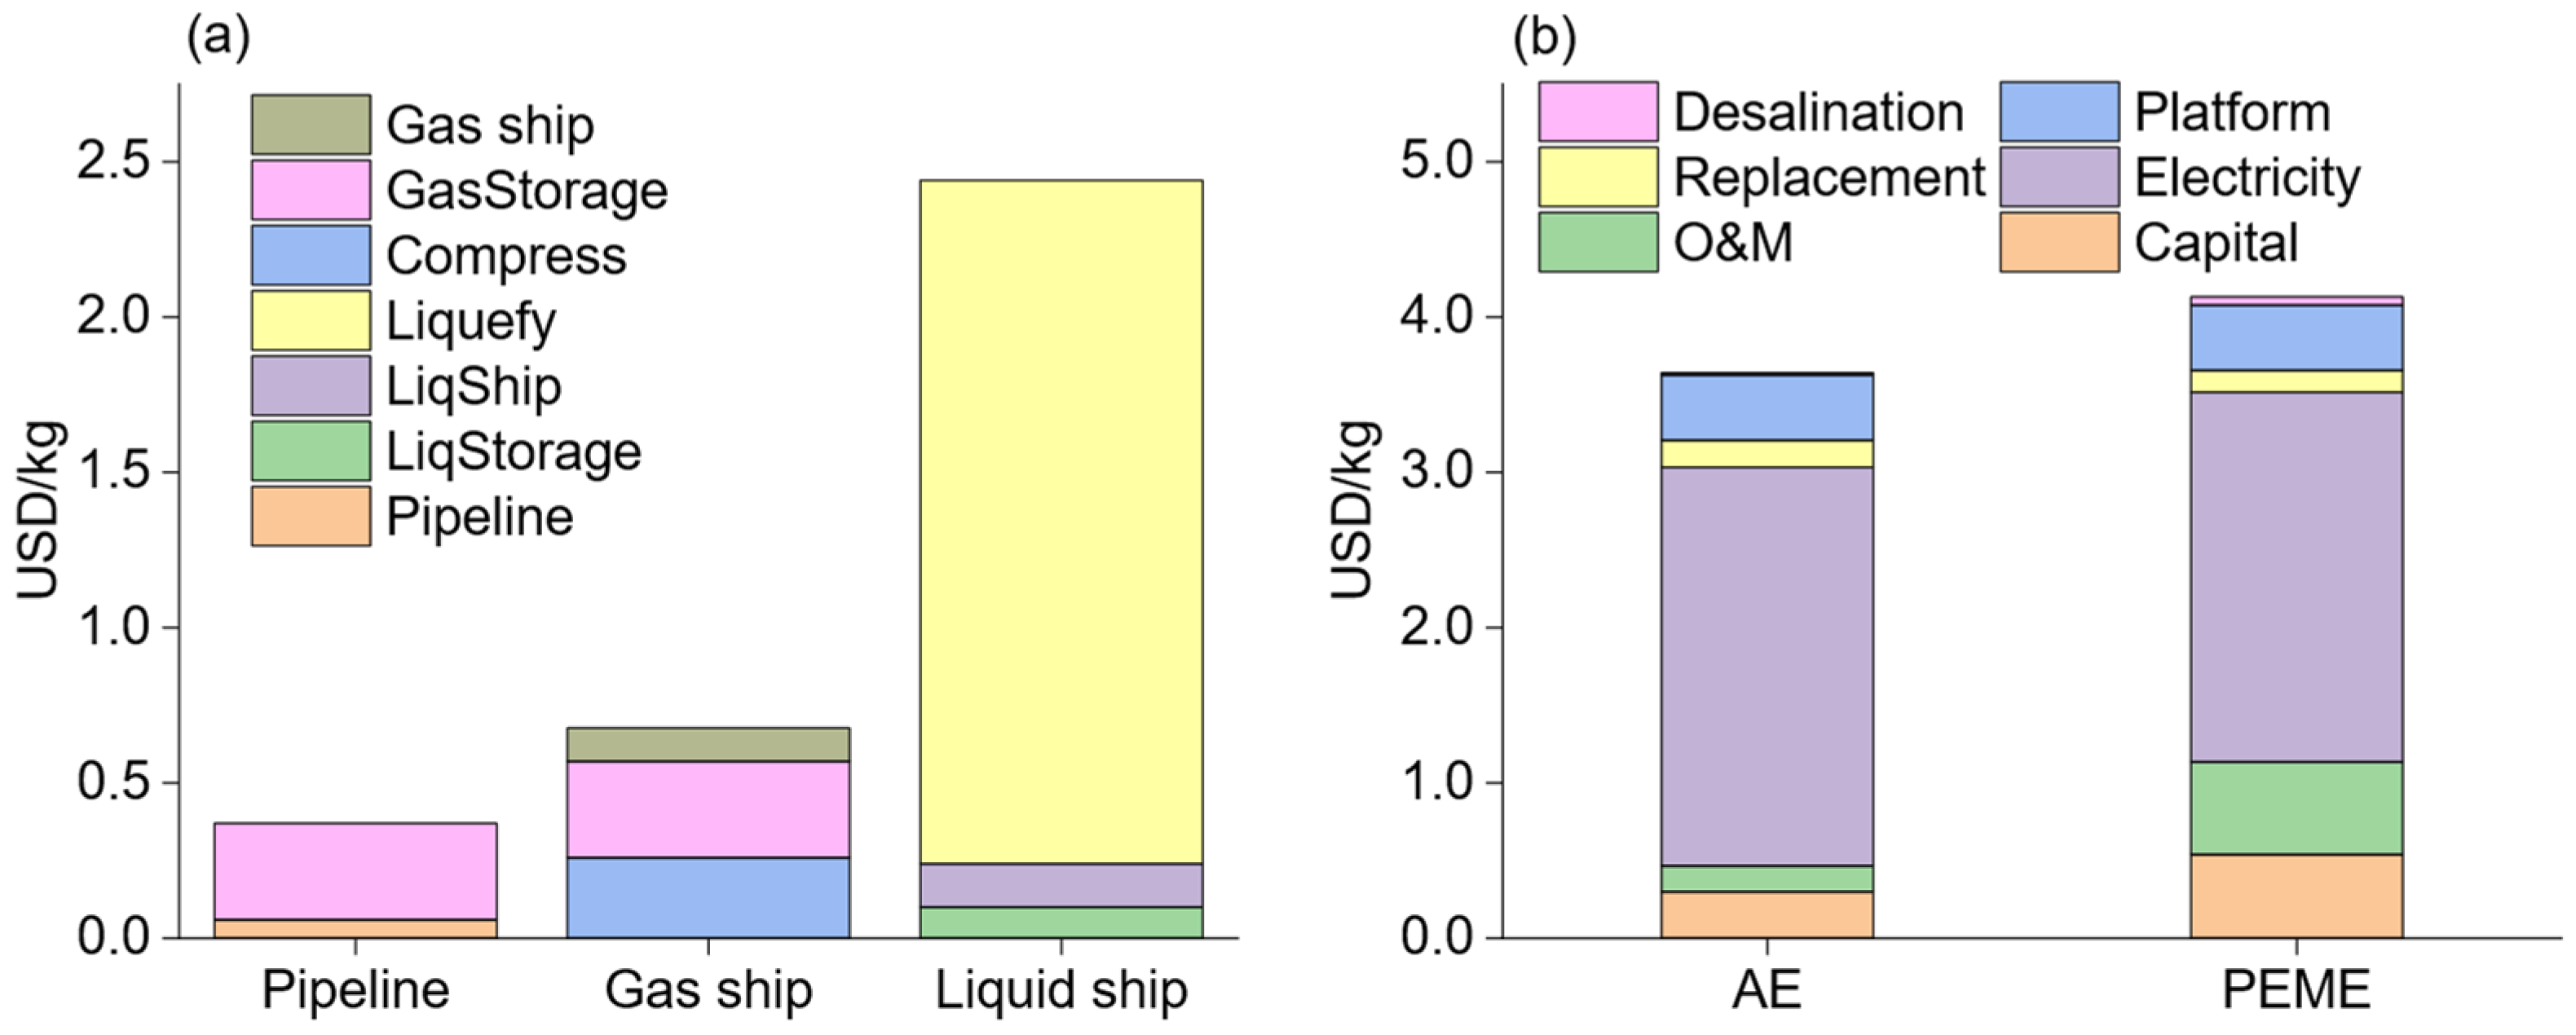
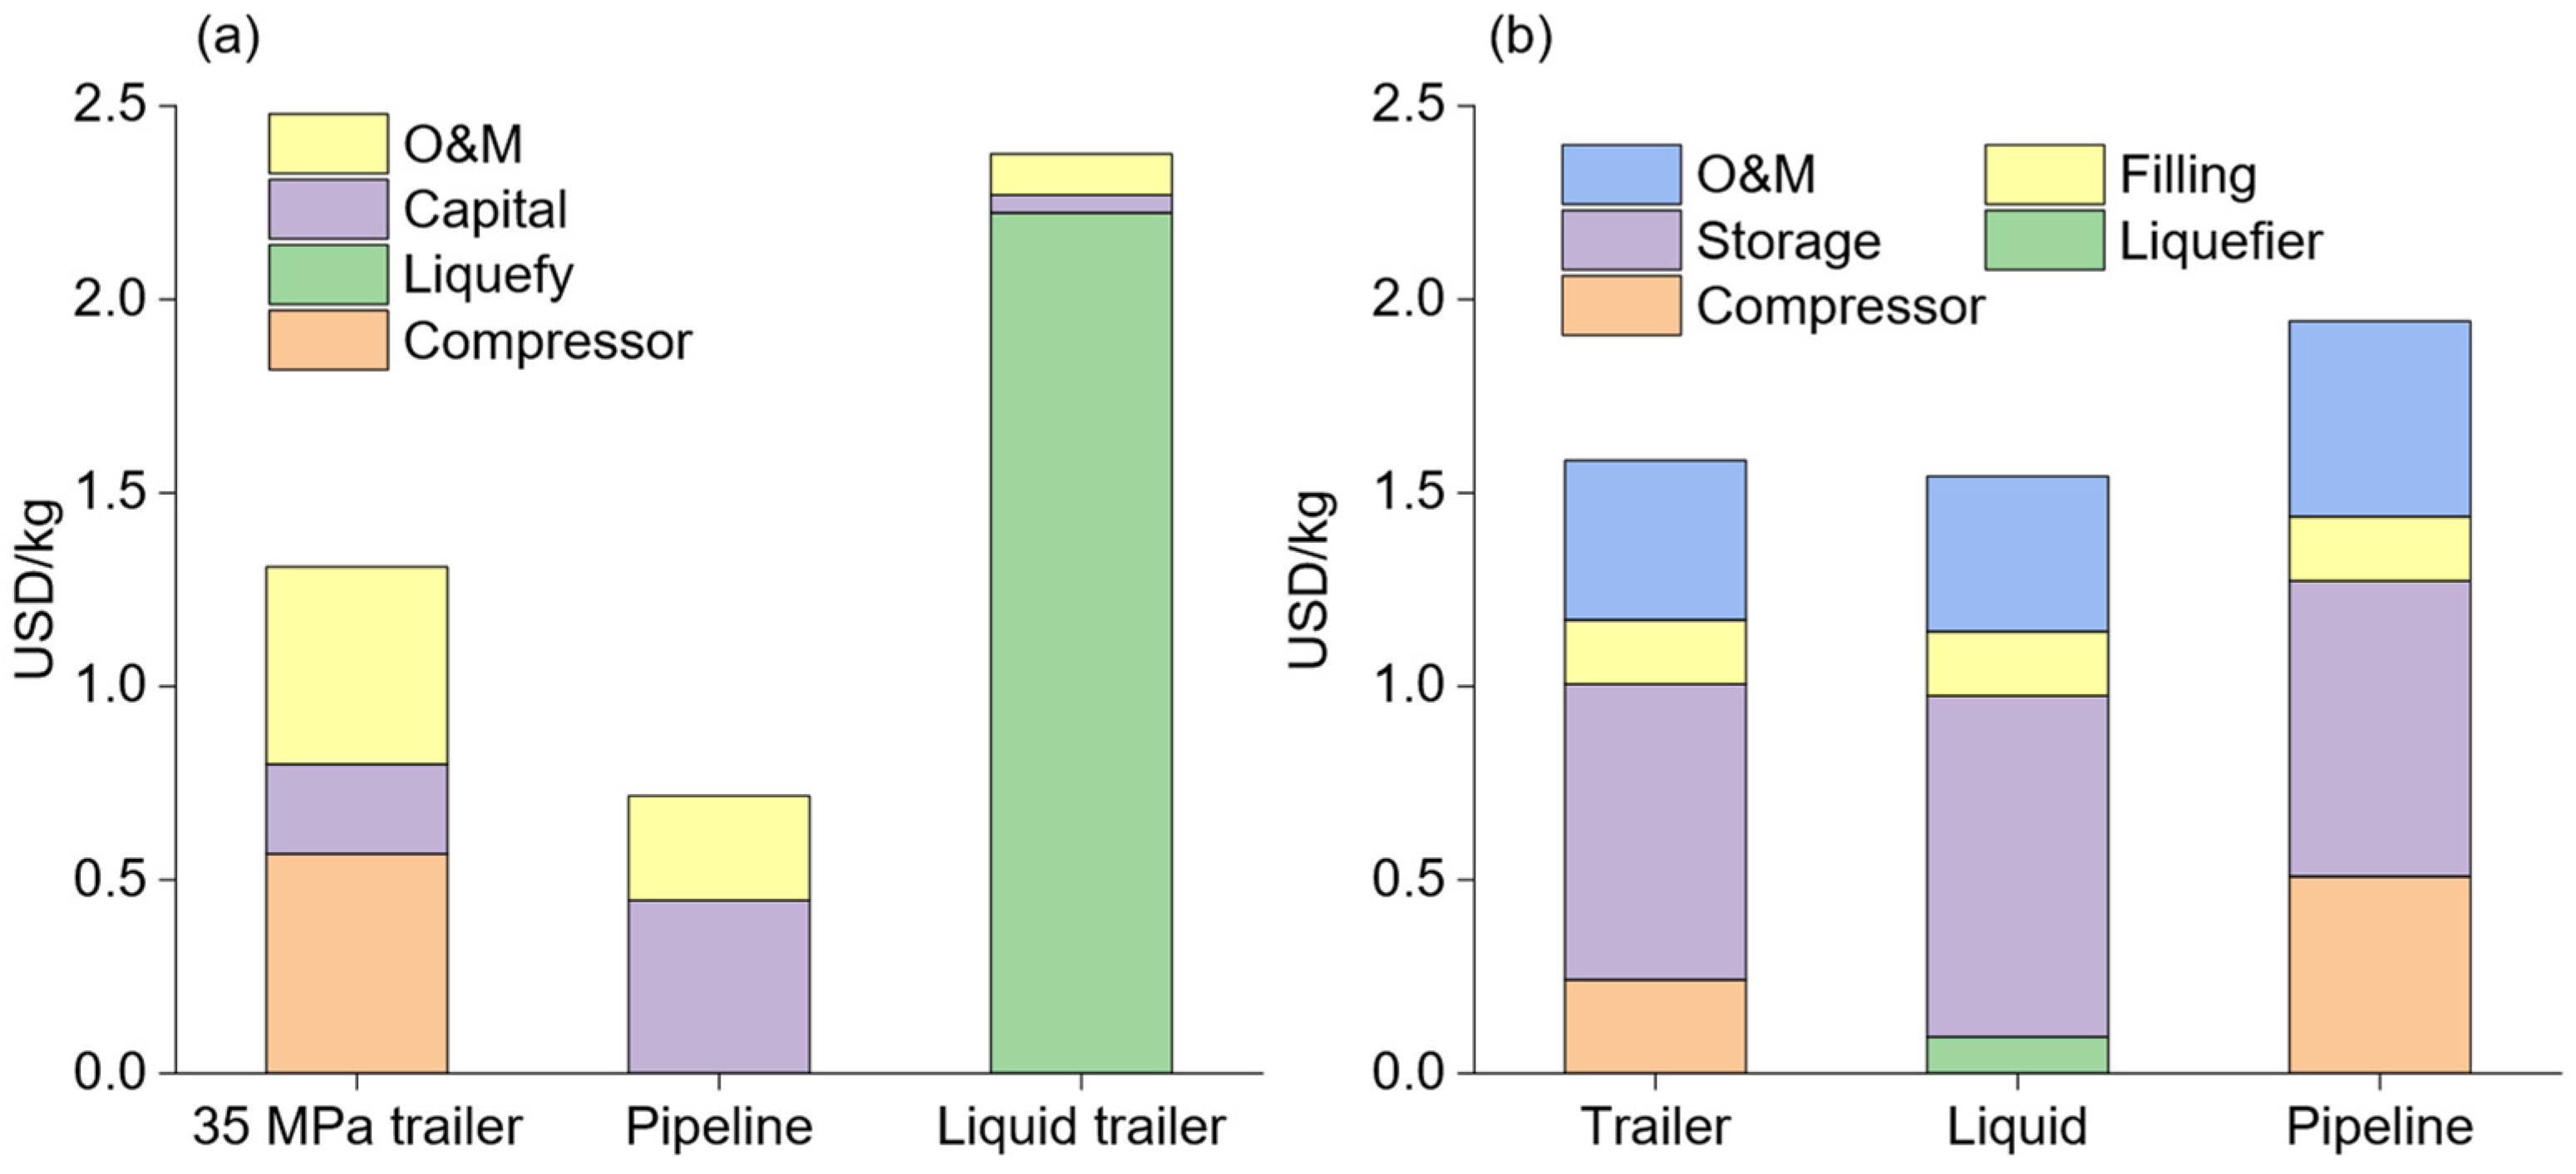
3.1. Economic Performance of Hydrogen Supply Chain Stages

The baseline distance between the offshore wind farm and the onshore distribution center is established at 50 km, and the base electricity price is set at 0.05 USD/kWh. The economic performance of hydrogen production is depicted in Figure 2. The production cost encompasses various components, including capital investment, O&M, electricity, replacement, offshore platform construction, and seawater desalination. Notably, the electricity cost constitutes the predominant portion of the hydrogen production cost, accounting for 70.5% and 57.6% for alkaline electrolysis (AE) and proton exchange membrane electrolysis (PEME), respectively. The reduced electricity consumption of PEME is primarily attributed to its higher efficiency. The capital costs for both technologies represent relatively modest proportions, amounting to 8.2% for AE and 13.1% for PEME. AE exhibits a lower operation and maintenance cost than PEME due to its greater technological maturity. Another significant cost factor is the construction of offshore platforms, which incurs a cost of 0.42 USD/kg H2, constituting approximately 10% of the overall hydrogen production cost. Ultimately, the hydrogen production costs stand at 3.64 USD/kg and 4.13 USD/kg for AE and PEME, respectively.
The delivery costs are illustrated in Figure 2b. Evidently, the pipeline boasts the lowest cost at 0.37 USD/kg, encompassing both the submarine pipeline and the storage system. In contrast, the liquid ship exhibits the highest cost at 2.44 USD/kg, with the liquefaction cost constituting 91.6% of the total delivery cost. Surprisingly, the liquid storage cost is lower than that of high-pressure gas storage (35 MPa) due to its higher density, facilitating more efficient storage. The liquid storage cost comprises the onshore liquid storage system and the offshore liquid storage system. The cost of the liquid ship accounts for only 5.7% of the total cost. In the gas ship delivery scenario, hydrogen is compressed into 35 MPa tanks before being transported via ships. These hydrogen tanks are independent and can be replaced in batches for ship use, so only the cost of onshore hydrogen storage is calculated. The compression cost and hydrogen storage cost together constitute 85% of the gas ship delivery route, with a total cost of 0.677 USD/kg.
The distribution costs for refueling stations are depicted in Figure 3a. Assuming an average distribution distance of 200 km for trailers and a pipeline length of 800 km (300 km main line and 500 km branch line), these costs are calculated based on hydrogen delivered by submarine pipeline. Therefore, the distribution costs of high-pressure trailers (35 MPa) and liquid trailers include the compression and liquefaction costs, which can be neglected when distributing hydrogen from gas ships and liquid ships, respectively. It is evident that pipeline distribution has the lowest costs, while the liquid trailer incurs a very high cost that is unsuitable for short-distance delivery. The cost of high-pressure trailers (35 MPa) is 1.3 USD/kg, which is relatively high. However, if hydrogen in the distribution center comes from a gas ship, extra compression cost is not needed, and its cost can be reduced by 43.6%, making it more economically competitive.
The refueling pressure is set at 70 MPa in this study. Consequently, hydrogen coming from high-pressure trailers (35 MPa) and pipelines needs to be compressed again to satisfy the higher pressure demand. Liquid hydrogen from the liquid trailer should be pumped into a high-pressure storage system before being filled into fuel cell cars. The different preprocessing for various hydrogen distribution routes leads to different refueling costs. For hydrogen refueling stations, the cost of storing hydrogen is very high, accounting for a range from 39% to 58% in the three refueling scenarios. Therefore, reducing the storage cost is a useful way to decrease the refueling cost. The refueling cost for pipeline distribution is the highest, reaching 1.94 USD/kg. This is because the pipeline operates at a low pressure and requires more energy to compress it to the filling pressure (70 MPa), which accounts for 26.2% of its total cost.

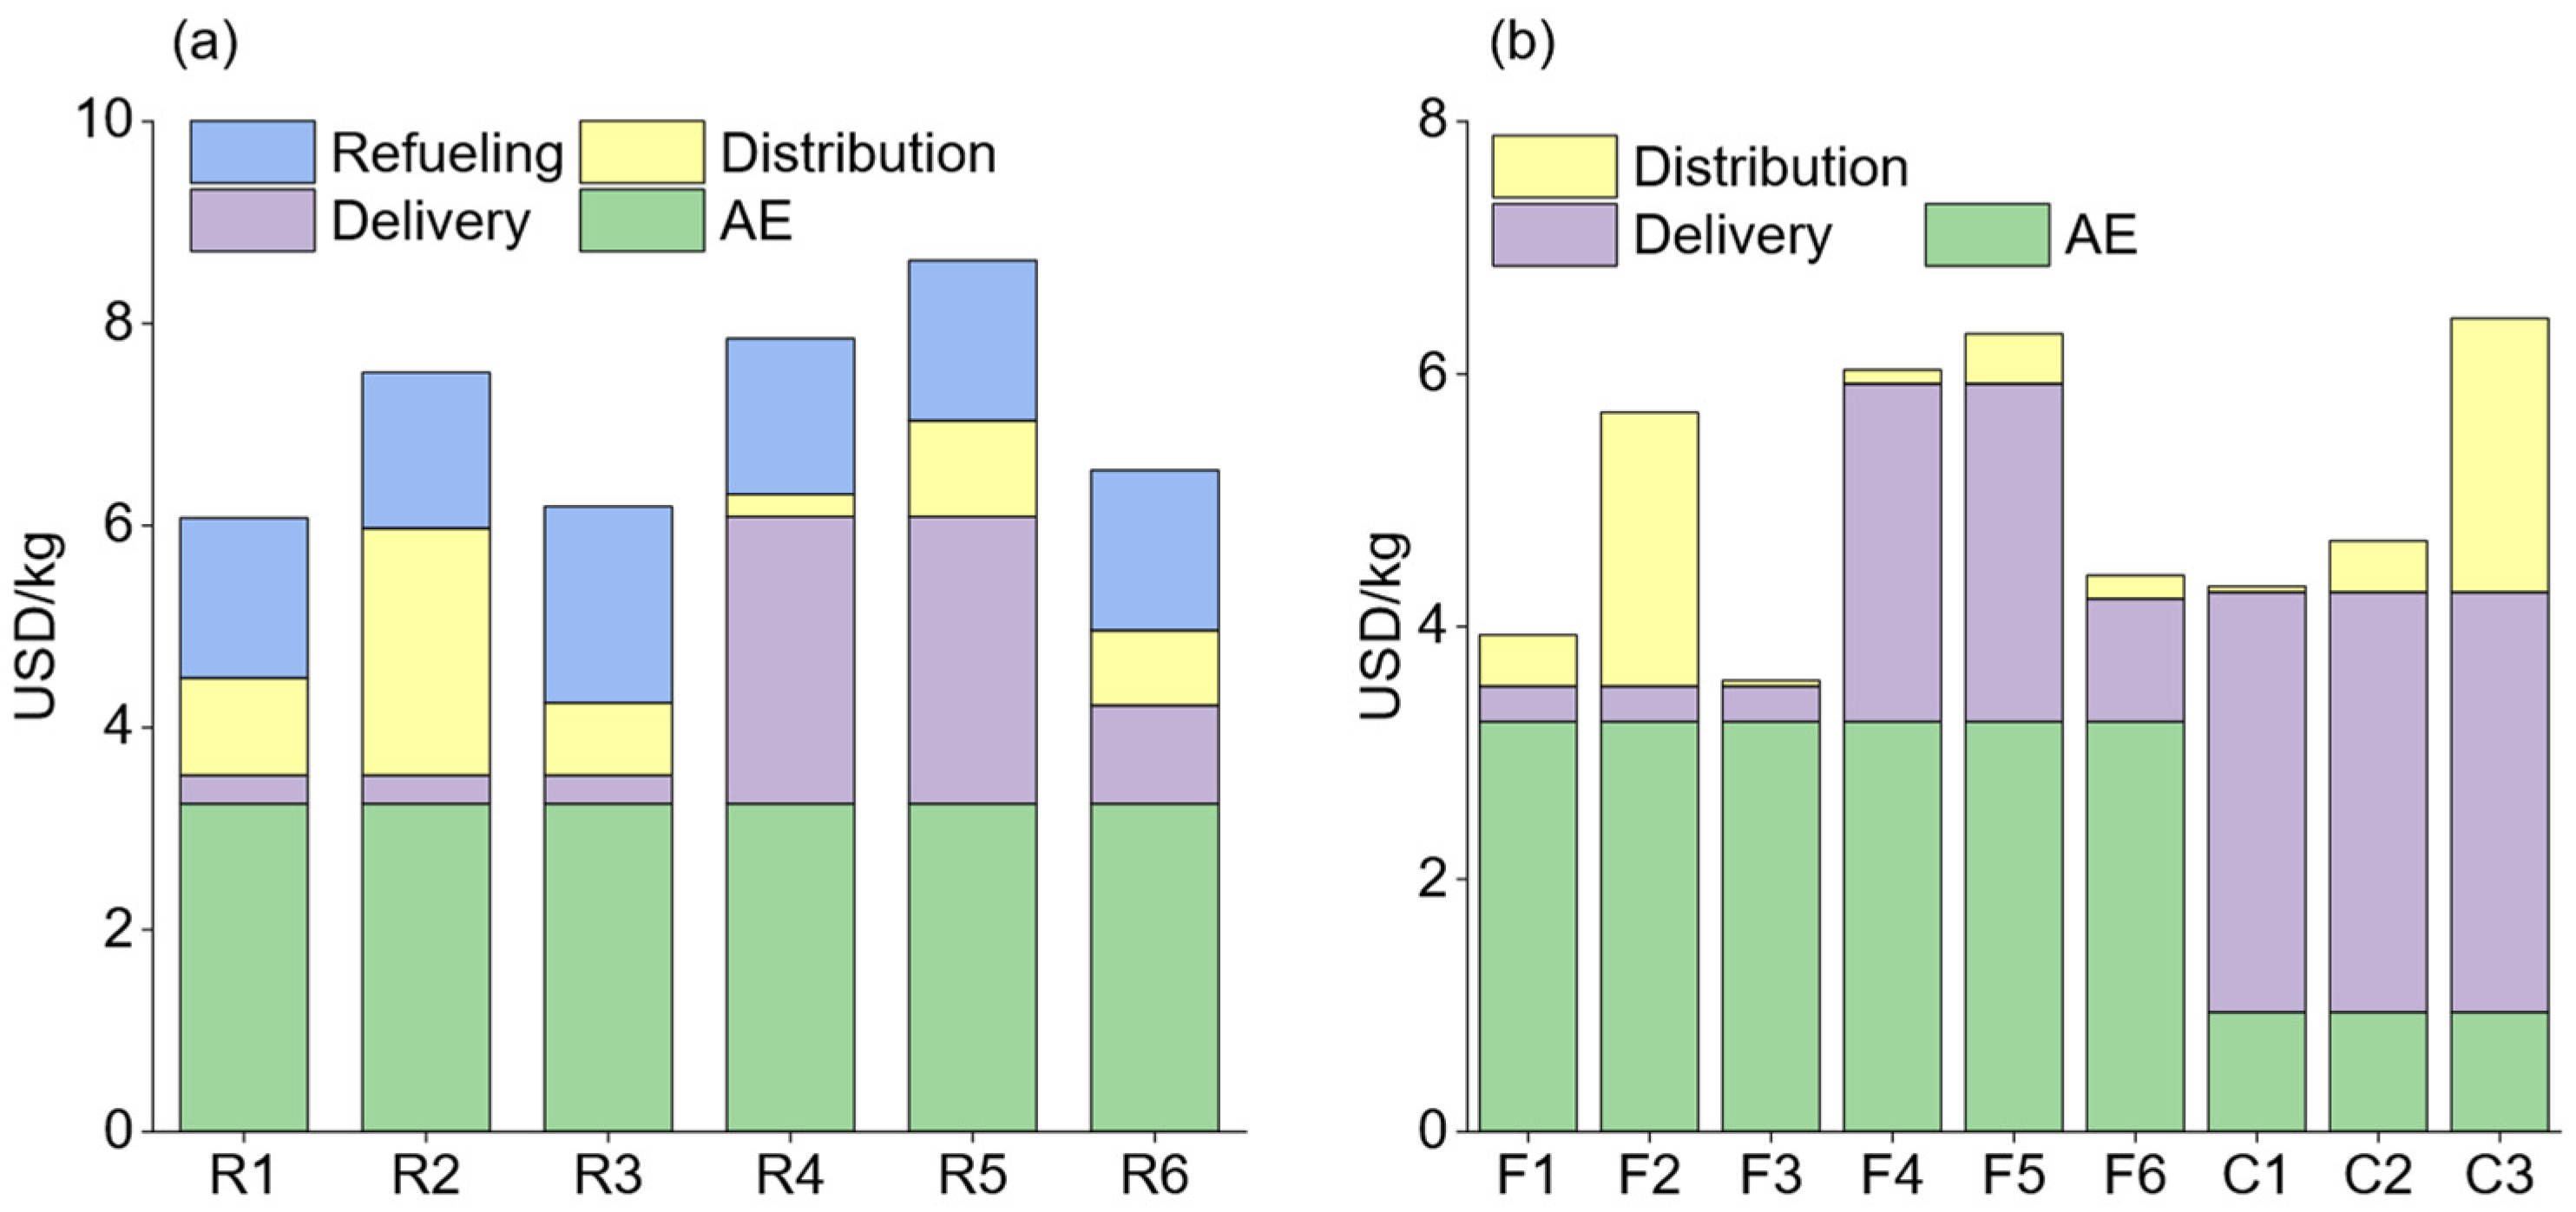
3.2. The Cost of Different Energy Supply Chains

The costs of various hydrogen supply chains are evaluated, as illustrated in Figure 4. Figure 4a represents the LCOH of hydrogen supply chains terminating with a refueling station. Among the hydrogen supply chains, R1 and R3 exhibit the lowest LCOH at 6.1 and 6.2 USD/kg, respectively, which is slightly lower than the on-land hydrogen supply chain’s cost conducted by Li et al. [36]. Both chains involve offshore hydrogen production transferred via submarine pipelines; the difference lies in their distribution techniques—R1 uses a high-pressure trailer, while R3 uses pipelines. Route R5 has the highest LCOH at 8.6 USD/kg, with delivery by a liquid ship, and this delivery cost reaches 2.8 USD/kg, accounting for 33.1% of the LCOH. A similar situation also arises in the distribution stage of route R2, where the distribution cost of a liquid trailer accounts for 32.5% of the LCOH. Therefore, liquid hydrogen is not suitable for delivery and distribution due to its extremely expensive liquefaction cost. The high-pressure trailer and pipeline distribution methods demonstrate competitive economic potential, with the high-pressure trailer being more flexible and easier to expand.
Figure 4b illustrates the LCOH of hydrogen supply chains terminated with industrial factories. The distance between distribution centers and factories is much shorter than the distance between refueling stations, as the latter are widely dispersed throughout the city, resulting in long distribution distances. Conversely, the former are located in a fixed location with far fewer and shorter distribution paths. The absence of refueling costs and shortened distribution distance effectively reduces the costs of routes terminated with factories. The lowest LCOH is 3.6 USD/kg, achieved via route F3. The cost of AE in routes C1–C3 is lower than that of other routes because it does not include the electricity cost, which is contained in the delivery cost (submarine cable). The LCOH of C1 reaches 4.3 USD/kg, which is higher than that of F3. Therefore, route F3 is the most economical strategy to supply hydrogen. Generally speaking, it is cheaper to transport hydrogen to the factory than to the hydrogen refueling station, which can save a significant amount in distribution and refueling costs. Compared to the previous research conducted by Yan et al. [23], the price in this study is lower; however, our findings agree that the underwater pipeline is the most cost-effective delivery system for transporting offshore hydrogen.

3.3. Sensitivity Analysis

The impact of different delivery distances on LCOH is considerable, and the optimal transit technique varies with distance. In Figure 5a, the relationship between various marine hydrogen delivery costs and distance is depicted. It is evident that the cost of submarine pipeline delivery is overwhelmingly advantageous. The cost of submarine cable transmission is directly proportional to distance. When the distance is less than 300 km, the cost is lower than that of the high-pressure gas ship. However, when the distance surpasses 300 km, the cost of a submarine cable exceeds that of the high-pressure gas ship. Liquid hydrogen ships exhibit the highest delivery costs, exceeding ten times that of submarine pipeline delivery. In general, the three hydrogen delivery methods are less influenced by distance.
In Figure 5b, the variation in distribution costs with distance is illustrated. Pipeline distribution, the most common and cost-effective of the three choices, shows costs ranging from 0.12 to 1.2 USD/kg at delivery distances of 50 to 500 km. The second category, high-pressure trailer delivery, is mainly influenced by distance, with costs varying from 0.4 to 2.1 USD/kg at delivery distances of 50 to 500 km. This is almost constant due to the high-pressure trailer’s limited load capacity. Liquid hydrogen distribution has the highest cost but is less sensitive to distance, with costs increasing by only 0.5 USD/kg over distances from 50 to 500 km, attributed to liquefaction expenses as discussed before (Figure 3a). Therefore, when selecting hydrogen distribution methods, pipeline distribution and high-pressure gas trailers should be prioritized.
In Figure 5c, the variation in LCOH with delivery distance for hydrogen supply routes ending at industries is depicted. In these routes, the distribution distance is constant. Routes C1, C2, and C3 exhibit significant price fluctuations, consistent with the cost change of submarine cable in Figure 5a. Overall, transportation costs contribute a small amount to LCOH, making it not very sensitive to delivery distance.
Because the cost of hydrogen generation accounts for a substantial amount of LCOH, such as 53% in the F3 route, we conducted a sensitivity analysis of LCOH to offshore wind power prices, as shown in Figure 5d. All routes are quite sensitive to the cost of electricity. Using F3 as an example, when the electricity price (r) changes from 0.01 to 0.1 USD/kWh, the LCOH of F3 changes from 1.3 to 5.9 USD/kg. We can also see that all of the routes have the same upward tendency in terms of price change, which is due to the fact that price increases directly lead to a climb of the AE, which is the starting point for all of the routes.

4. Conclusions

This paper introduces a delivery strategy for electrolytic hydrogen production, addressing challenges in offshore wind power transportation. The process involves three stages: hydrogen generation for offshore platforms, transportation via submarine pipelines or ships to a distribution and storage center at the port, and subsequent distribution. Two primary destinations are considered: hydrogen refueling stations across the city and industrial factories. Additionally, alternative routes involve transmitting offshore wind power through submarine cables to a port, where electrolysis is conducted, and then hydrogen is distributed to factories. The study encompasses 15 hydrogen transportation routes, subjected to comprehensive economic analysis. In the hydrogen production process, alkaline electrolysis (AE) exhibits lower expenses, with the price of hydrogen production at 3.6 USD/kg. However, this is not particularly attractive when compared to proton exchange membrane electrolysis (PEME) at 4.1 USD/kg. Given PEME’s advantages in terms of energy efficiency, current density, H2 purity (about 99.99%), and the potential for compact system design and rapid loading time, it holds significant potential in the future of hydrogen production. Pipelines emerge as the most efficient means to transport and distribute hydrogen, making route F3 the one with the lowest LCOH. The transportation of liquid hydrogen involves a significant energy cost in the liquefaction stage, making the associated routes the most expensive. When delivering hydrogen to filling stations, pipelines and 35 MPa trailers, as demonstrated by routes R1 and R3, emerge as equally competitive. On the other hand, offshore hydrogen production presents greater advantages compared to land-based hydrogen production technologies (C1–C3). The costs of all routes are less sensitive to delivery distance, but the cost of electricity transmission is extremely high. Finally, electricity prices exert a significant impact on LCOH, making reducing electricity rates an efficient strategy to minimize LCOH.

Author Contributions

Conceptualization, J.L. and B.W.; methodology, J.L., H.Z., J.P., L.L. and B.W.; investigation, A.C., W.C., Z.Y., K.F. and L.J.; resources, Y.Z., Y.Z., Z.Y. and K.F.; data curation, J.P., Y.Z., A.C., K.F. and L.J.; writing—original draft preparation, J.L. and L.L.; writing—review and editing, B.W.; supervision, K.J. All authors have read and agreed to the published version of the manuscript.

Funding

This research is supported by the Study on the Strategic Planning Layout of Hydrogen Energy in Power Grid Companies (Project Number: 030100QQ00230008).

Data Availability Statement

The data presented in this study are available on request from the corresponding author. The data are not publicly available.

Conflicts of Interest

Authors Jinyong Lei, Hang Zhang, Jun Pan, Yu Zhuo, Aijun Chen, Weize Chen, Zeyu Yang, Keying Feng were employed by the company Guangzhou Power Supply Bureau, Guangdong Power Grid Co., Ltd. The remaining authors declare that the research was conducted in the absence of any commercial or financial relationships that could be construed as a potential conflict of interest.

Abbreviations

PhraseAbbreviations
Alkaline electrolyzerAE
Proton exchange membrane electrolysis PEME
Reverse osmosis membrane RO
Ion exchange IX
Toluene-methylcyclohexaneTOL-MCH
Dibenzyltoluene-perhydro-dibenzyltoluene H0DBT-H18DBT
Levelized cost of hydrogen LCOH
Operation and maintenance O&M
High voltage alternating current HVAC
Low-frequency alternating current LFAC
High voltage direct current HVDC

References

  1. Jiao, K.; Xuan, J.; Du, Q.; Bao, Z.; Xie, B.; Wang, B.; Zhao, Y.; Fan, L.; Wang, H.; Hou, Z.; et al. Designing the next Generation of Proton-Exchange Membrane Fuel Cells. Nature 2021, 595, 361–369. [Google Scholar] [CrossRef] [PubMed]
  2. Tashie-Lewis, B.C.; Nnabuife, S.G. Hydrogen Production, Distribution, Storage and Power Conversion in a Hydrogen Economy—A Technology Review. Chem. Eng. J. Adv. 2021, 8, 100172. [Google Scholar] [CrossRef]
  3. Ji, J.; Chi, Y.; Yin, X. The blue treasure of hydrogen energy: A research of offshore wind power industry policy in China. Int. J. Hydrogen Energy 2024, 62, 99–108. [Google Scholar] [CrossRef]
  4. Liu, G.; Kong, Z.; Sun, W.; Li, J.; Qi, Z.; Wu, C.; Li, C. Impacts of Offshore Wind Power Development on China’s Marine Economy and Environment: A Study from 2006 to 2019. J. Clean. Prod. 2023, 423, 138618. [Google Scholar] [CrossRef]
  5. Groenemans, H.; Saur, G.; Mittelsteadt, C.; Lattimer, J.; Xu, H. Technoeconomic Analysis of Offshore Wind PEM Water Electrolysis for H2 Production. Curr. Opin. Chem. Eng. 2022, 37, 100828. [Google Scholar] [CrossRef]
  6. Hu, X.; Yuan, X.; Li, B.; Ge, Y.; Lin, R. TechnoEconomic Comparison between Power Transmission and Hydrogen Production and Transportation for OffshoreWind. In Proceedings of the 2022 2nd International Conference on Electrical Engineering and Control Science (IC2ECS), Nanjing, China, 16–18 December 2022; pp. 275–281. [Google Scholar]
  7. Gomez, J.R.; Baca, J.; Garzon, F. Technoeconomic Analysis and Life Cycle Assessment for Electrochemical Ammonia Production Using Proton Conducting Membrane. Int. J. Hydrogen Energy 2020, 45, 721–737. [Google Scholar] [CrossRef]
  8. Makhloufi, C.; Kezibri, N. Largescale Decomposition of Green Ammonia for Pure Hydrogen Production. Int. J. Hydrogen Energy 2021, 46, 34777–34787. [Google Scholar] [CrossRef]
  9. Dokhani, S.; Assadi, M.; Pollet, B.G. Technoeconomic Assessment of Hydrogen Production from Seawater. Int. J. Hydrogen Energy 2023, 48, 9592–9608. [Google Scholar] [CrossRef]
  10. Weimann, L.; Gabrielli, P.; Boldrini, A.; Kramer, G.J.; Gazzani, M. Optimal Hydrogen Production in a Wind-Dominated Zero-Emission Energy System. Adv. Appl. Energy 2021, 3, 100032. [Google Scholar] [CrossRef]
  11. Ferrario, M.; Bartolini, A.; Manzano, S.; Vivas, F.J.; Comodi, G.; McPhail, S.J.; Andujar, J.M. A Modelbased Parametric and Optimal Sizing of a Battery/Hydrogen Storage of a Real Hybrid Microgrid Supplying a Residential Load: Towards Island Operation. Adv. Appl. Energy 2021, 3, 100048. [Google Scholar] [CrossRef]
  12. Wang, Y.; Yuan, H.; Martinez, A.; Hong, P.; Xu, H.; Bockmiller, F.R. Polymer Electrolyte Membrane Fuel Cell and Hydrogen Station Networks for Automobiles: Status, Technology, and Perspectives. Adv. Appl. Energy 2021, 2, 100011. [Google Scholar] [CrossRef]
  13. Zhang, H.; Liang, Y.; Ma, J.; Qian, C.; Yan, X. An MILP Method for Optimal Offshore Oilfield Gathering System. Ocean. Eng. 2017, 141, 25–34. [Google Scholar] [CrossRef]
  14. Catenacci, M.; Verdolini, E.; Bosetti, V.; Fiorese, G. Going Electric: Expert Survey on the Future of Battery Technologies for Electric Vehicles. Energy Policy 2013, 61, 403–413. [Google Scholar] [CrossRef]
  15. Pingkuo, L.; Xue, H. Comparative Analysis on Similarities and Differences of Hydrogen Energy Development in the World’s Top 4 Largest Economies: A Novel Framework. Int. J. Hydrogen Energy 2022, 47, 9485–9503. [Google Scholar] [CrossRef]
  16. Rashid, M.; Al Mesfer, M.; Naseem, H.; Danish, M. Hydrogen Production by Water Electrolysis: A Review of Alkaline Water Electrolysis, PEM Water Electrolysis and High Temperature Water Electrolysis. Int. J. Eng. Adv. Technol. (IJEAT) 2015, 4, 80–93. [Google Scholar]
  17. Tschiggerl, K.; Sledz, C.; Topic, M. Considering Environmental Impacts of Energy Storage Technologies: A Life Cycle Assessment of Powertogas Business Models. Energy 2018, 160, 1091–1100. [Google Scholar] [CrossRef]
  18. Holm, T.; BorsboomHanson, T.; Herrera, O.E.; Mérida, W. Hydrogen Costs from Water Electrolysis at High Temperature and Pressure. Energy Convers. Manag. 2021, 237, 114106. [Google Scholar] [CrossRef]
  19. Vincent, I.; Bessarabov, D. Low Cost Hydrogen Production by Anion Exchange Membrane Electrolysis: A Review. Renew. Sustain. Energy Rev. 2018, 81, 1690–1704. [Google Scholar] [CrossRef]
  20. Niklas Hausmann, J.; Schlögl, R.; Menezes, P.W.; Driess, M. Is Direct Seawater Splitting Economically Meaningful? Energy Environ. Sci. 2021, 14, 3679–3685. [Google Scholar] [CrossRef]
  21. Curto, D.; Franzitta, V.; Guercio, A. A Review of the Water Desalination Technologies. Appl. Sci. 2021, 11, 670. [Google Scholar] [CrossRef]
  22. Currenti, F. Techno-Economic Evaluation of Alkaline Electrolyzers for Green H2 Production from Seawater. Webthesisbibliopolitoit. 2023. Available online: https://webthesis.biblio.polito.it/26113/ (accessed on 28 February 2024).
  23. Yan, Y.; Zhang, H.; Liao, Q.; Liang, Y.; Yan, J. Roadmap to Hybrid Offshore System with Hydrogen and Power Cogeneration. Energy Convers. Manag. 2021, 247, 114690. [Google Scholar] [CrossRef]
  24. Lee, J.; Cherif, A.; Yoon, H.; Seo, S.; Bae, J.; Shin, H.; Lee, C.; Kwon, H.; Lee, C. Largescale Overseas Transportation of Hydrogen: Comparative Technoeconomic and Environmental Investigation. Renew. Sustain. Energy Rev. 2022, 165, 112556. [Google Scholar] [CrossRef]
  25. d’AmoreDomenech, R.; Meca, V.L.; Pollet, B.G.; Leo, T.J. On the Bulk Transport of Green Hydrogen at Sea: Comparison between Submarine Pipeline and Compressed and Liquefied Transport by Ship. Energy 2023, 267, 126621. [Google Scholar] [CrossRef]
  26. Gu, Y.; Chen, Q.; Xue, J.; Tang, Z.; Sun, Y.; Wu, Q. Comparative Technoeconomic Study of Solar Energy Integrated Hydrogen Supply Pathways for Hydrogen Refueling Stations in China. Energy Convers. Manag. 2020, 223, 113240. [Google Scholar] [CrossRef]
  27. Olateju, B.; Kumar, A.; Secanell, M. A Technoeconomic Assessment of Large Scale Windhydrogen Production with Energy Storage in Western Canada. Int. J. Hydrogen Energy 2016, 41, 8755–8776. [Google Scholar] [CrossRef]
  28. Wei, X.; Qiu, R.; Liang, Y.; Liao, Q.; Klemeš, J.J.; Xue, J.; Zhang, H. Roadmap to Carbon Emissions Neutral Industrial Parks: Energy, Economic and Environmental Analysis. Energy 2022, 238, 121732. [Google Scholar] [CrossRef]
  29. Miao, B.; Giordano, L.; Chan, S.H. Longdistance Renewable Hydrogen Transmission via Cables and Pipelines. Int. J. Hydrogen Energy 2021, 46, 18699–18718. [Google Scholar] [CrossRef]
  30. IRENA Renewable Power Generation Costs in 2019. Available online: https://www.irena.org/publications/2020/Jun/Renewable-Power-Costs-in-2019 (accessed on 25 February 2024).
  31. Robles, O.; Almaraz, D.; AzzaroPantel, C.; AzzaroPantel, C. Chapter 2 Hydrogen Supply Chain Design: Key Technological Components and Sustainable Assessment. In Hydrogen Supply Chains; Academic Press: Cambridge, MA, USA, 2018; pp. 37–79. ISBN 9780128111970. [Google Scholar]
  32. Kumar, S.; Himabindu, V. Hydrogen Production by PEM Water Electrolysis—A Review. Mater. Sci. Energy Technol. 2019, 2, 442–454. [Google Scholar] [CrossRef]
  33. Lee, B.; Lim, D.; Lee, H.; Lim, H. Which Water Electrolysis Technology Is Appropriate?: Critical Insights of Potential Water Electrolysis for Green Ammonia Production. Renew. Sustain. Energy Rev. 2021, 143, 110963. [Google Scholar] [CrossRef]
  34. Kong, L.; Li, L.; Cai, G.; Liu, C.; Ma, P.; Bian, Y.; Ma, T. Technoeconomic Analysis of Hydrogen Energy for Renewable Energy Power Smoothing. Int. J. Hydrogen Energy 2021, 46, 2847–2861. [Google Scholar] [CrossRef]
  35. Battersby, A. World’s First Offshore Green Hydrogen Project on Working Platform. Available online: https://www.upstreamonline.com/hydrogen/world-s-first-offshore-green-hydrogen-project-on-working-platform/2-1-1043280 (accessed on 25 February 2024).
  36. Li, L.; Wang, B.; Jiao, K.; Ni, M.; Du, Q.; Liu, Y.; Li, B.; Ling, G.; Wang, C. Comparative Technoeconomic Analysis of Largescale Renewable Energy Storage Technologies. Energy AI 2023, 14, 100282. [Google Scholar] [CrossRef]
  37. Guerra, O.J.; Eichman, J.; Kurtz, J.; Hodge, B. Cost Competitiveness of Electrolytic Hydrogen. Joule 2019, 3, 2425–2443. [Google Scholar] [CrossRef]
  38. Lin, H.; Wu, Q.; Chen, X.; Yang, X.; Guo, X.; Lv, J.; Lu, T.; Song, S.; McElroy, M. Economic and Technological Feasibility of Using Powertohydrogen Technology under Higher Wind Penetration in China. Renew. Energy 2021, 173, 569–580. [Google Scholar] [CrossRef]
  39. Deng, T.; He, G.; Miao, P. Cost analysis of hydrogen production from water electrolysis in different application scenarios. Energy Chem. Ind. 2020, 41, 1–5. (In Chinese) [Google Scholar]
  40. Minutillo, M.; Perna, A.; Forcina, A.; Micco, D.; Jannelli, E. Analyzing the Levelized Cost of Hydrogen in Refueling Stations with Onsite Hydrogen Production via Water Electrolysis in the Italian Scenario. Eur. Fuel Cell Conf. Exhib. 2021, 46, 13667–13677. [Google Scholar] [CrossRef]
  41. Liu, Z.; Wang, S.; Hao, W.; Li, N. Research on Construction Mode of Large-Scale Offshore Wind Power Centralized Transmission. South. Energy Constr. 2023, 10, 13–20. (In Chinese) [Google Scholar] [CrossRef]
  42. Lümmen, N.; Karouach, A.; Tveitan, S. Thermoeconomic Study of Waste Heat Recovery from Condensing Steam for Hydrogen Production by PEM Electrolysis. Energy Convers. Manag. 2019, 185, 21–34. [Google Scholar] [CrossRef]
  43. DOE H2A Delivery Analysis: DOE Hydrogen Program. Available online: https://www.hydrogen.energy.gov/h2a_delivery.html (accessed on 25 February 2024).
  44. Nistor, S.; Dave, S.; Fan, Z.; Sooriyabandara, M. Technical and Economic Analysis of Hydrogen Refuelling. Appl. Energy 2016, 167, 211–220. [Google Scholar] [CrossRef]
  45. Verma, A.; Kumar, A. Life Cycle Assessment of Hydrogen Production from Underground Coal Gasification. Appl. Energy 2015, 147, 556–568. [Google Scholar] [CrossRef]
  46. Kaiser, M.J. Offshore Pipeline Construction Cost in the U.S. Gulf of Mexico. Mar. Policy 2017, 82, 147–166. [Google Scholar] [CrossRef]
  47. Watson, N.R.; Watson, J.D. An Overview of HVDC Technology. Energies 2020, 13, 4342. [Google Scholar] [CrossRef]
Figure 1. Road map of hydrogen and electricity supply chains.
Energies 17 02447 g001
Figure 2. The components of hydrogen production and delivery cost. (a) The offshore hydrogen production cost of alkaline electrolysis (AE) and proton exchange membrane electrolysis (PEME) cost. (b) The delivery cost of the submarine pipeline, gas ship and liquid ship.
Energies 17 02447 g002
Figure 3. (a) The distribution costs of different methods for refueling stations based on hydrogen delivered by submarine pipeline. The distribution distance is set as 200 km for trailers and 800 km for pipelines (300 km main pipeline and 500 km branch pipelines). (b) The refueling cost for different delivery methods.
Energies 17 02447 g003
Figure 4. The levelized cost of different hydrogen (LCOH) supply chains. (a) The LCOH of hydrogen supply chains ended with a refueling station and the electricity transmission cost ended with a grid net. (b) The LOCH of hydrogen supply chains ended with the factory and the electricity transmission cost ended with the grid net.
Energies 17 02447 g004
Figure 5. Sensitivity analysis of LCOH. (a) The cost of delivering hydrogen by sea varies with distance. (b) The cost of hydrogen distribution varies with distance (c) The LCOH of hydrogen supply chains varies with distance. (d) The LCOH of hydrogen supply chains varies with electricity prices.
Energies 17 02447 g005
Table 1. The strategies of hydrogen supply chains.
RoutesPowerDelivery and StoragePowerDistributionDestination
HydrogenElectricityPipelineLiquid ShipGas ShipCableHydrogenGas TrailerLiquid TrailerPipelineRefueling StationIndustrial Factory
R1
R2
R3
R4
R5
R6
F1
F2
F3
F4
F5
F6
C1
C2
C3
Table 2. The general parameters and values.
ParametersValues Ref.
Project life30 years
Capacity of offshore wind farm1000 MW
Discount rate 0.08
Electricity price 0.05 USD/kWh
Hydrogen heating value 33.33 kWh/kg H2
Average load factor of wind farm0.34 [30]
The 95th percentile loader factor0.53 [30]
The ratio between USD and RMBUSD 1 = RMB 7.19
Table 3. The cost parameters of electrolyzers [9,35].
Subsystem ComponentsCostRef.
Alkaline electrolyzer (AE)Capital cost 866 USD/kW[34,36]
Operation and maintenance cost19 USD/kW per year[36]
Replacement cost 52 USD/kW [36]
System efficiency 0.65[37]
Operation time24 h per day and 365 days per year[38]
Life 7 years[39]
Proton exchange membrane electrolyzer (PEME)Capital cost 1543 USD/kW[36]
Operation and maintenance cost68 USD/kW per year[36]
Replacement cost 52 USD/kW[36]
System efficiency 0.7[40]
Operation time24 h per day and 365 days per year[36]
Life 7 years[39]
Storage systemStorage pressure 350 MPa[36]
Life year15 years[36]
Capacity of one tank300 kg[36]
Capital costUSD 227,638 per tank[36]
Operation and maintenance costUSD 2000 per year per tank[36]
Replacement time 7.5 years[36]
Replacement cost USD 227,638 per tank
Desalination system Water mass flow per unit2000 m3/day
Life 15 years[9]
Capital costUSD 9,125,000 [9]
Operation and maintenance cost%3 of capital cost[9]
Offshore platform Hydrogen flow400 kg/day[35]
Capital cost USD 100,000,000 [35]
Life year 30 years[35]
Operation and maintenance cost%1 of capital cost [41]
Table 4. The parameters of delivery methods [24,25,26,43].
Facilities Parameter ValuesRef.
Compressorz1.28216[43]
R8.3144[43]
T300[43]
n2~3[43]
k1.4[43]
η 0.75[43]
O&M%3 of capital cost[26]
High-pressure gas shipLife year15[25]
Load capacity2000 ton[25]
Average speed 32 km/m[25]
Mass loss0.1%/day[25]
Capital cost USD 33 million [25]
O&M5550 USD/day[25]
Dessel consumption 13.6 ton/day[25]
Disel cost 358.3 USD/ton[25]
Labor cost 30 million/year[25]
Indirect cost 45% capital cost[25]
Loading cost 0.21 USD/kg[24]
Receiving 0.28[24]
Storage tankMass capacity300 kg[25]
Capital cost USD 227,638 [43]
O&M2000 USD/year[24]
Liquid hydrogen ship Mass load11,000 ton/day[24]
Average speed32 km/h[24]
Disel consumption21 ton/day[24]
Mass loss0.1%/day[24]
Capital cost412 million[24]
O&MUSD 5550 [24]
Life year 15 years[24]
Loading cost 0.25 USD/kg H2[24]
Receiving cost 0.31 USD/kg H2[24]
Submarine pipelineInlet pressure10 MPa[24]
Life year30 years[25]
Outlet pressure 7.8 MPa[25]
Capital payback year10 years[25]
Transportation Efficiency99.8%[25]
O&M cost3% capital cost per year[25]
Submarine cablesCable 3.195 million USD/km[25]
Offshore converter236 million USD/GW[25]
Onshore converter139 million USD/GW[25]
Table 5. Parameters about trailer [26,36,43].
ParameterValueRef.
Service life10 years[26]
Speed 60 km/h[26]
Fuel typeDiesel[26]
Capacity (20 MPa)350 kg per tube trailer[43]
Capacity (Liquid hydrogen)4000 kg per liquid trailer[43]
Capacity (Methanol trailer)25 ton [26]
Distribution distance 200 km
Fuel economy (20 MPa, liquid)25 L per 100 km [26]
Fuel economy (Methanol trailer)29 L per 100 km[26]
Trailer’s work hour 16 h per day[36]
Tractor cost58,823 USD each unit[26]
Tube tank trailer (350 kg, 200 bar)176,470 USD each unit[26]
Liquid trailer (For methanol)115,000 USD each unit[26]
Liquid tank trailer (4000 kg H2)950,000 USD each unit[26]
Diesel price 1 USD/L[36]
Variable rate of diesel0.03 per year[36]
Drivers for every trailer2
Drivers’ salary 15,000 USD per year[36]
Maintenance cost%5 of capital cost per year[26]
Table 6. Configuration of different refueling stations [36,43].
ApplicationsComponents
Refueling station
(High pressure)
Compressor (2 stages)
High-pressure tank (SF = 2)
Dispenser
Refueling station
(Pipeline)
Compressor (3 stages)
High-pressure tank (SF = 2)
Dispenser
Refueling station
(Liquid)
Liquid pump
High-pressure tank (SF = 2)
Dispenser
Table 7. Economic parameters of refueling station [36,43].
Refueling StationScaleValueRef.
Service life--15 years[43]
M mean   (Flow rate)700 kg per day(Supply 2000 cars)[36]
Compressor78 kWUSD 40,035 × ( P compressor )0.6038 [43]
Low-pressure buffer700 kg1001 USD/kg[36]
High-pressure tankMmean × SF kg1495 USD/kg[36]
Dispenser (with pre-cooling unit)2USD 170,000 each one[36]
Liquid pump120 kW991.89 × cryogenic tank capacity (kg H2)0.6929[43]
Fixed O&M cost Counts 15% of capital cost[36]
Other O&M cost--Counts 11% of capital cost [36]
Disclaimer/Publisher’s Note: The statements, opinions and data contained in all publications are solely those of the individual author(s) and contributor(s) and not of MDPI and/or the editor(s). MDPI and/or the editor(s) disclaim responsibility for any injury to people or property resulting from any ideas, methods, instructions or products referred to in the content.

