Article

Study on Emulsification Effect of Crude Oil in Brine Emulsions by Automated Demulsibility Tester

1
Department of MOL Hydrocarbon and Coal Processing, University of Pannonia, H-8200 Veszprém, Hungary
2
Oilfield Chemicals and Technologies, MOL Plc., H-6701 Szeged, Hungary
*
Author to whom correspondence should be addressed.
Energies 2024, 17(10), 2438; https://doi.org/10.3390/en17102438
Submission received: 15 April 2024 / Revised: 30 April 2024 / Accepted: 13 May 2024 / Published: 20 May 2024
(This article belongs to the Section H2: Geothermal)

Abstract

:
The purpose of the surfactants used is to greatly reduce the interfacial tension between the crude oil and brine, thereby decreasing the capillary number. The resulting oil-in-water emulsions are often grouped according to the Winsor theory. Oil recovery aims to produce Winsor type-III emulsions because they have the lowest interfacial tension values and the most favorable flow properties. The sensitivity of oil–water–surfactant systems to environmental influences (e.g., mixing speed and equilibration time) increases close to the favorable environmental range (temperature, brine total salt concentration, pressure, etc.) of the Winsor III type, the middle microemulsion phase, which is favorable for crude oil recovery. The tests aimed to investigate the quality and quantity of emulsions prepared with surfactants used in enhanced oil recovery (EOR) using an automatic device to characterize and select surfactants for industrial petroleum applications. An essential method for surfactant selection is to study the emulsifying effect and phase behavior. Phase behavior tests and emulsifying effect tests were performed on surfactants and surfactant packages as a function of mixing parameters. The mixing speed and mixing time can influence the results of the phase behavior and emulsifying effect tests, although during the investigations, other parameters were unchanged.

1. Introduction

Currently, as the demand for energy and various plastics increases, so does the demand for crude oil, while the world’s oil reserves are limited. With conventional (primary and secondary) oil recovery methods, a significant portion of the oil in reservoirs cannot be recovered. The so-called enhanced oil recovery methods, one of the variants of which is the use of chemical auxiliaries, are becoming increasingly widespread to increase oil production and efficiency. These methods include surfactant–polymer flooding by using different surfactants, also known as surfactant/surfactant mixtures; therefore, the effective selection of the surfactants used is essential for their development [1,2].
Surfactants are special materials whose molecular structure can be divided into two functional groups according to their solubility. They contain a polar (hydrophilic) group, which may be ionic or nonionic, and an apolar (hydrophobic or lipophilic) group. These molecules adsorb at the water–oil interface and form micelles above the critical micelle formation concentration [3,4,5]. The purpose of the surfactants used is to greatly reduce the interfacial tension and form emulsions between the crude brine and thereby increase the capillary number [6].
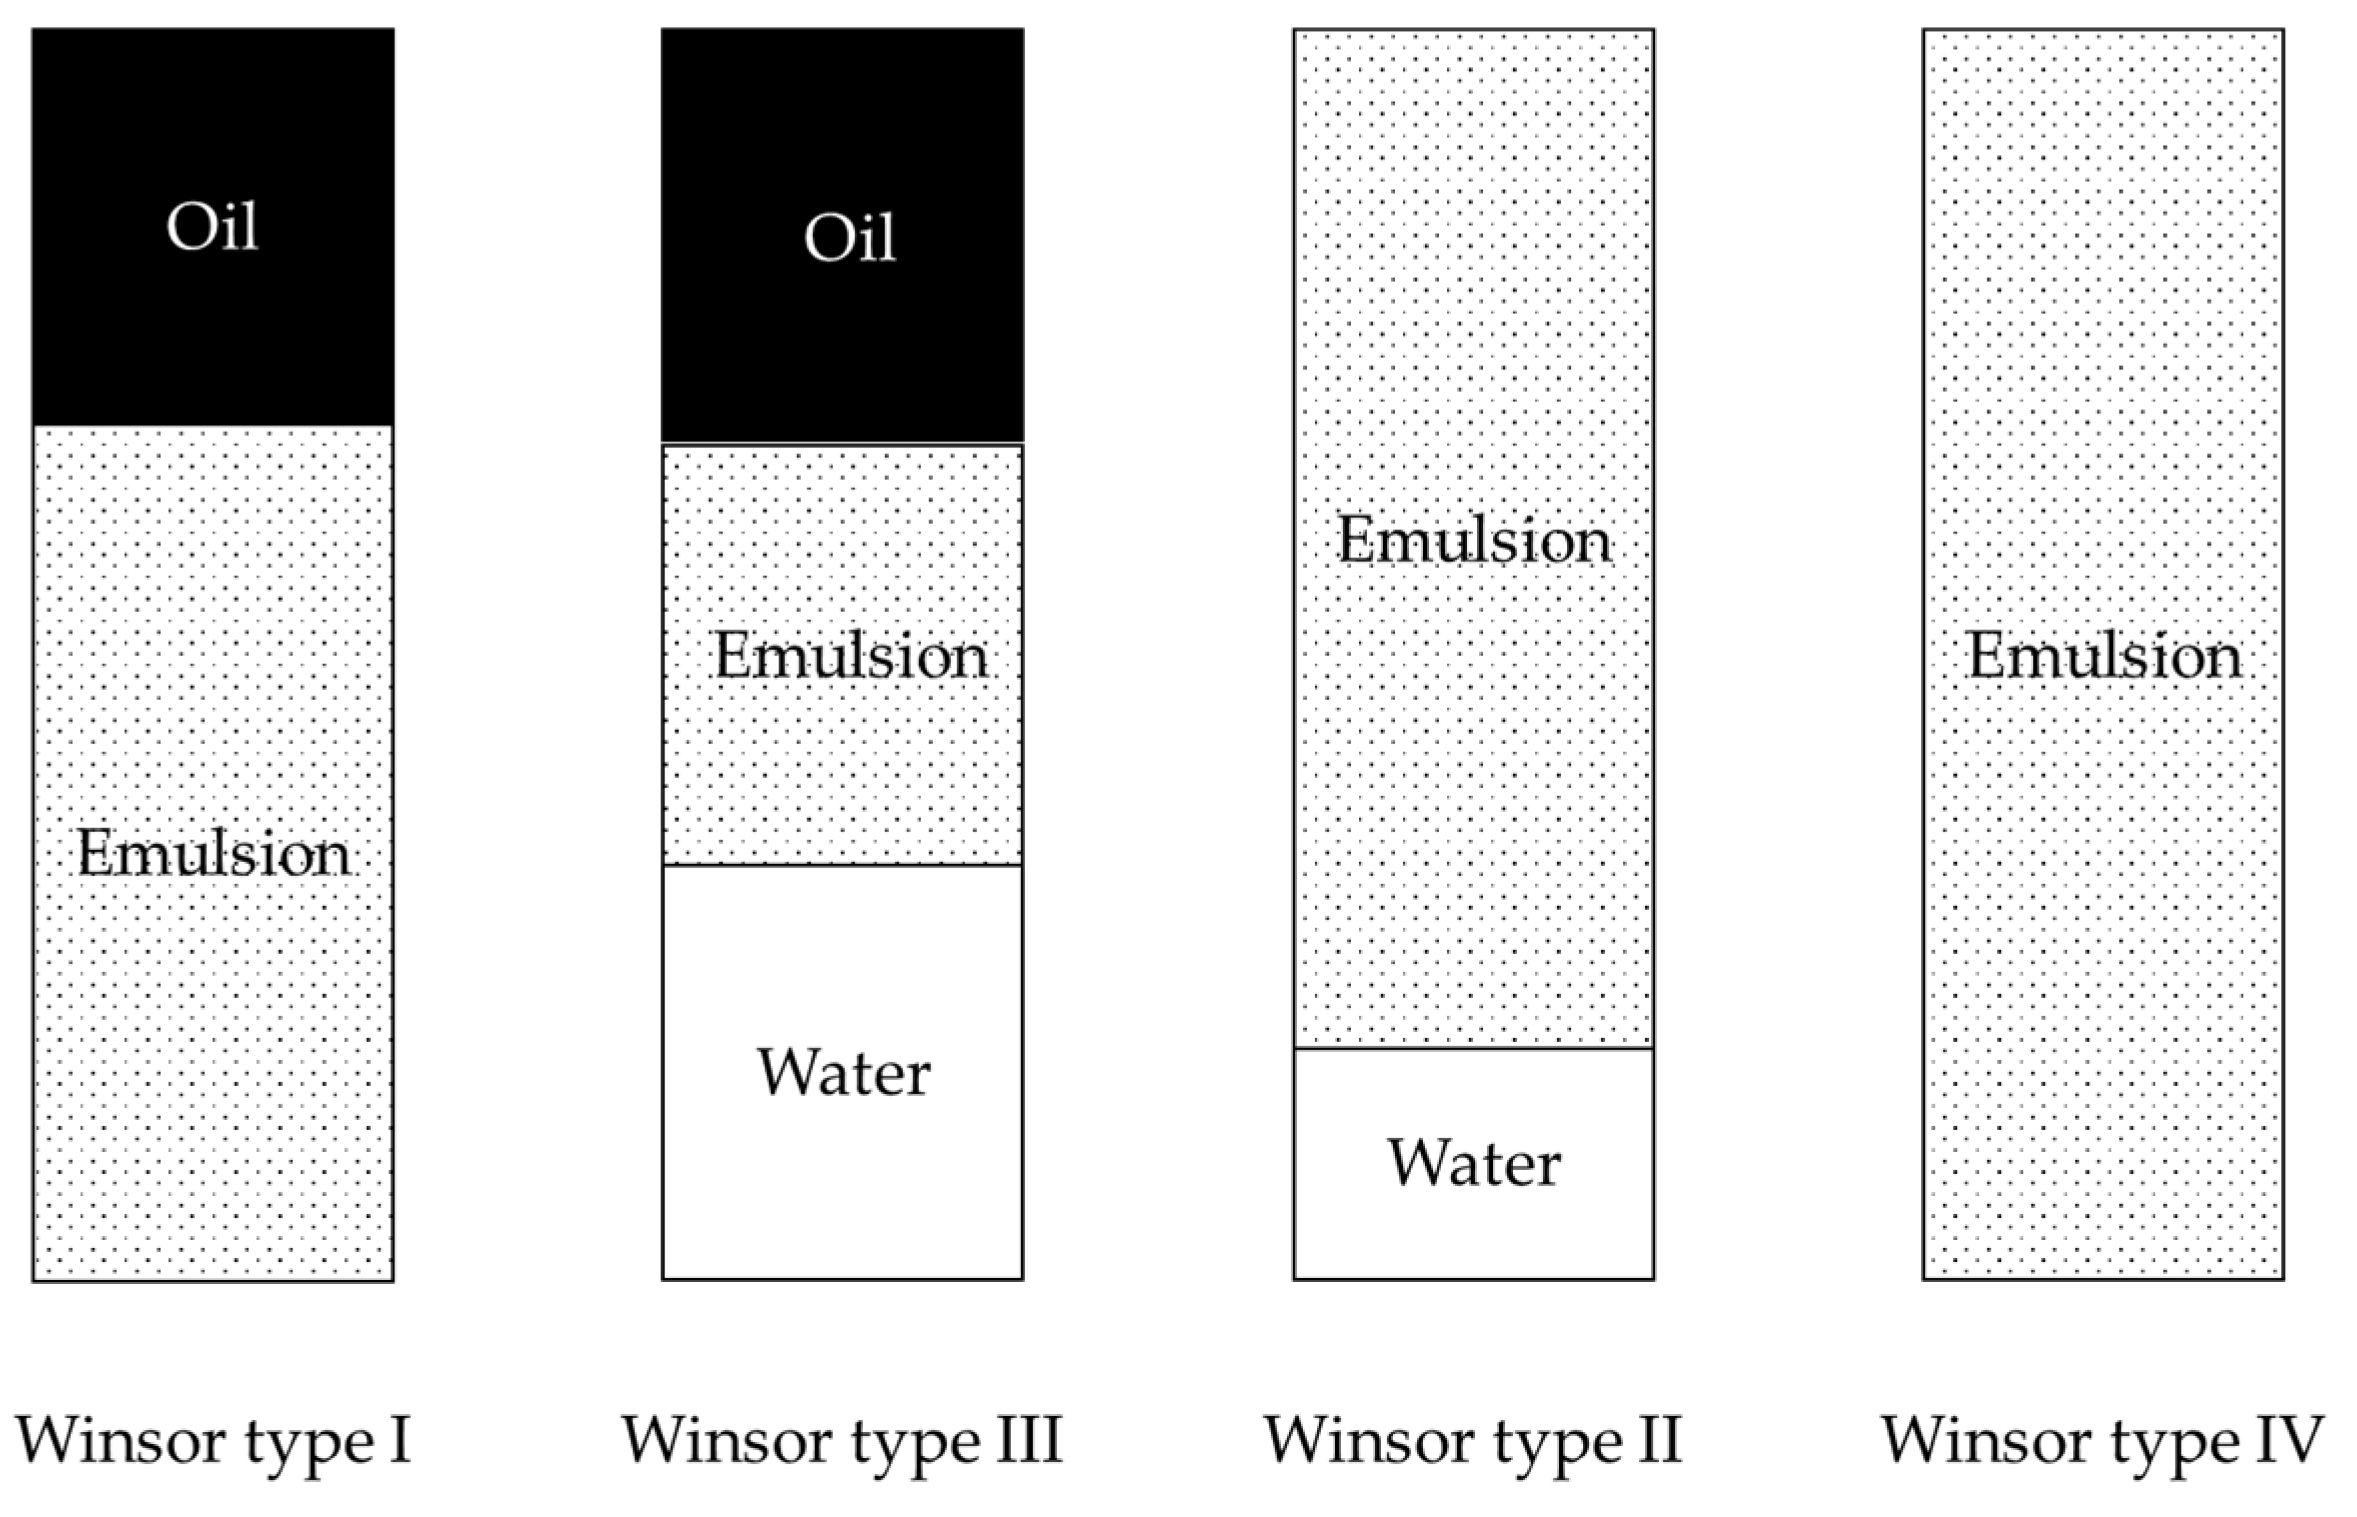
The resulting oil–water emulsions are often grouped according to Winsor theory [7]:
  • Winsor type I: The surfactant-rich water phase accompanies the oil phase, where the surfactant primarily exists as monomers at low concentrations.
  • Winsor type II: The surfactant-loaded oil phase combines with a surfactant-poor aqueous phase.
  • Winsor type III: If the surfactant system has the capability to form a micro-emulsion, a third phase appears at the oil–water interface. In this microemulsion, both water and oil are surfactant-deficient phases, typifying ultra-low interfacial tension attainment.
  • Winsor type IV: Continued addition of the same surfactant system leads to the conversion of the entire liquid into a micro-emulsion, classified as type IV. In a Winsor type-IV microemulsion, the middle phase extends and becomes a single phase at higher surfactant concentrations. Further addition of the surfactant system results in phase separation, described as the cloud point.
Oil recovery aims to produce Winsor type-III emulsions because they have the lowest interfacial tension values and the most favorable flow properties. The type of emulsion formed is determined by the systemic HLB value of the surfactants used, which can affect several conditions. Furthermore, as the mixing intensity changes during the emulsion formation on the water–oil ratio map (WOR map), the proportions of the ranges for each emulsion type may change, thereby changing the type of emulsion formed. The sensitivity of oil–water–surfactant systems to environmental impacts (temperature, brine salinity, pressure, crude oil composition, mixing speed, equilibration time, etc.) increases in the Winsor III type, middle microemulsion phase, which is favorable for crude oil recovery [8].
The essential method of surfactant selection is to study the emulsifying effect and phase behavior test [9]. When using a test method to investigate the emulsifying effect of surfactants, the oily and aqueous phases are often mixed by hand, and, consequently, the intensity of mixing may vary from measurement to measurement [10]. The selection with this method (manual homogenization and visual detection) is imprecise, and the result of the selection is uncertain [11].
Compared with IFT reduction, in situ emulsification of surfactants plays a key role in oil recovery, especially as the core permeability decreases [12]. The emulsifying effect of surfactants on crude oil was determined by a novel colorimetric method [13]. An artificial oil film model was designed to simulate the micro residual oil absorbed on the rock surface. It was found that surfactants with different interfacial tensions (IFTs) and emulsification behavior can promote the dislodging of the oil film [14].
During the study of the technical publications, it was found that until now, the emulsifying effect was tested by manual homogenization and visual evaluation (the so-called tube test).
The tests aimed to explore the possibility of improving the measurement method and investigating the quality and quantity of emulsions prepared with surfactants used in enhanced oil recovery (EOR) with an automatic device for the characterization and selection of surfactants for industrial petroleum applications. The emulsifying effect and phase behavior were investigated as a function of mixing time and mixing speed for crude oil–brine–surfactant systems.

2. Materials and Methods

2.1. Crude Oil

Crude oil from the Algyő (Hungary) oil field was used as the oily phase. The key properties of this crude oil are summarized in Table 1.
Based on the values presented in the table, the crude oil used for the tests was considered to be a light, paraffinic crude oil.

2.2. Brine

The synthesized brine was used as the aqueous phase for the experiments, which were based on the brine of the Algyő (Hungary) oil field. The ion concentrations of the synthetic brine are summarized in Table 2.
Each of the salts used to produce the brine were technical grade, water-free salts. The salts were dissolved individually, and each solution was mixed. First, the sodium salt solutions and the calcium salt solution were added. The solution was transparent.

2.3. Surfactants

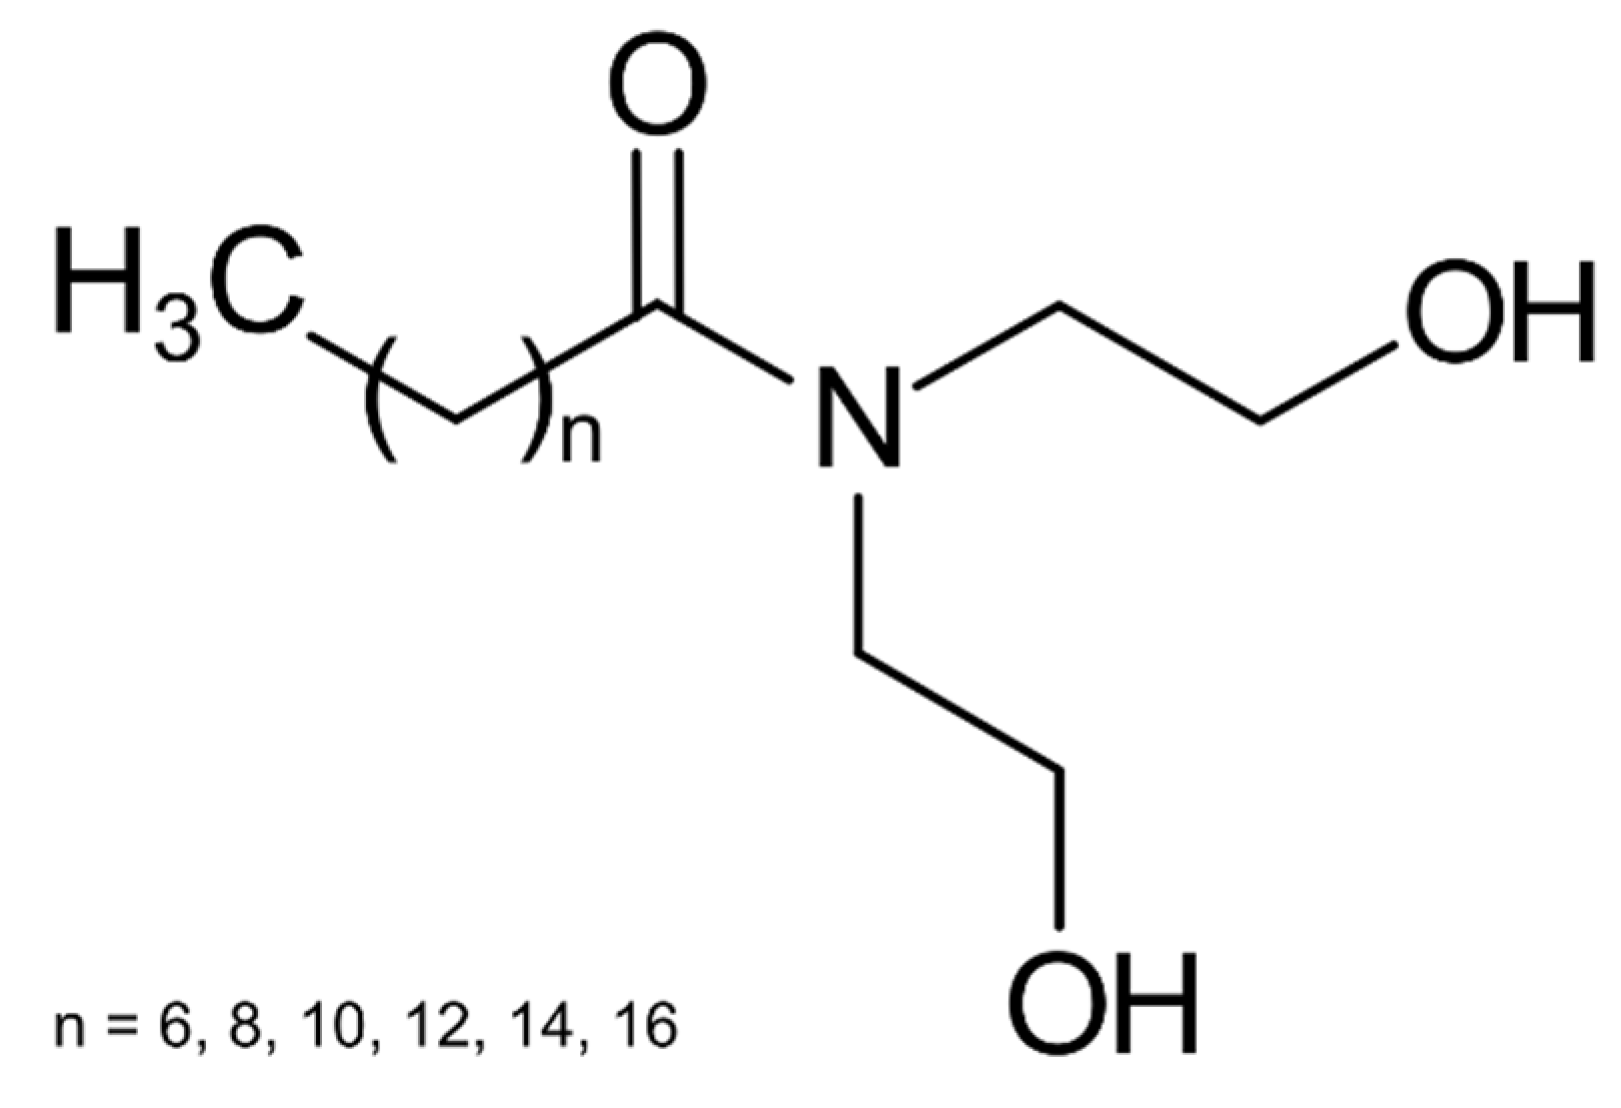
Coco-DEA was used as the nonionic surfactant, SLES was used as the anionic surfactant, and a mixture of these in different proportions was used as the surfactant mixture. The main properties of Coco-DEA and SLES are summarized in Table 3.
The chemical structure of surfactants used is shown in Figure 1.
The compositions of each package are summarized in Table 4.
The surfactants used were dissolved in synthetic brine and thus prepared at a concentration of 15 g/L.

2.4. Phase Behavior Test

The samples were observed visually and classified according to the Winsor emulsion type. When the oil or water phase was observed with the emulsion, the Winsor I and Winsor II type emulsions, respectively, were determined. If three phases were determined, then the emulsion was called the Winsor III type. When only emulsion was present in the system, the emulsion was called the Winsor IV type [15]. The Winsor emulsions are schematically illustrated in Figure 2.
The classification of emulsions according to the Winsor theory allows quality characterization. In the selection of surfactants for crude oil recovery, the general aim is to produce a Winsor type-III emulsion.
This method can be used to estimate the type of emulsion; however, other methods are also required for accurate determination, such as the determination of the dynamic viscosity of the emulsion [15].

2.5. Emulsification Effect Method

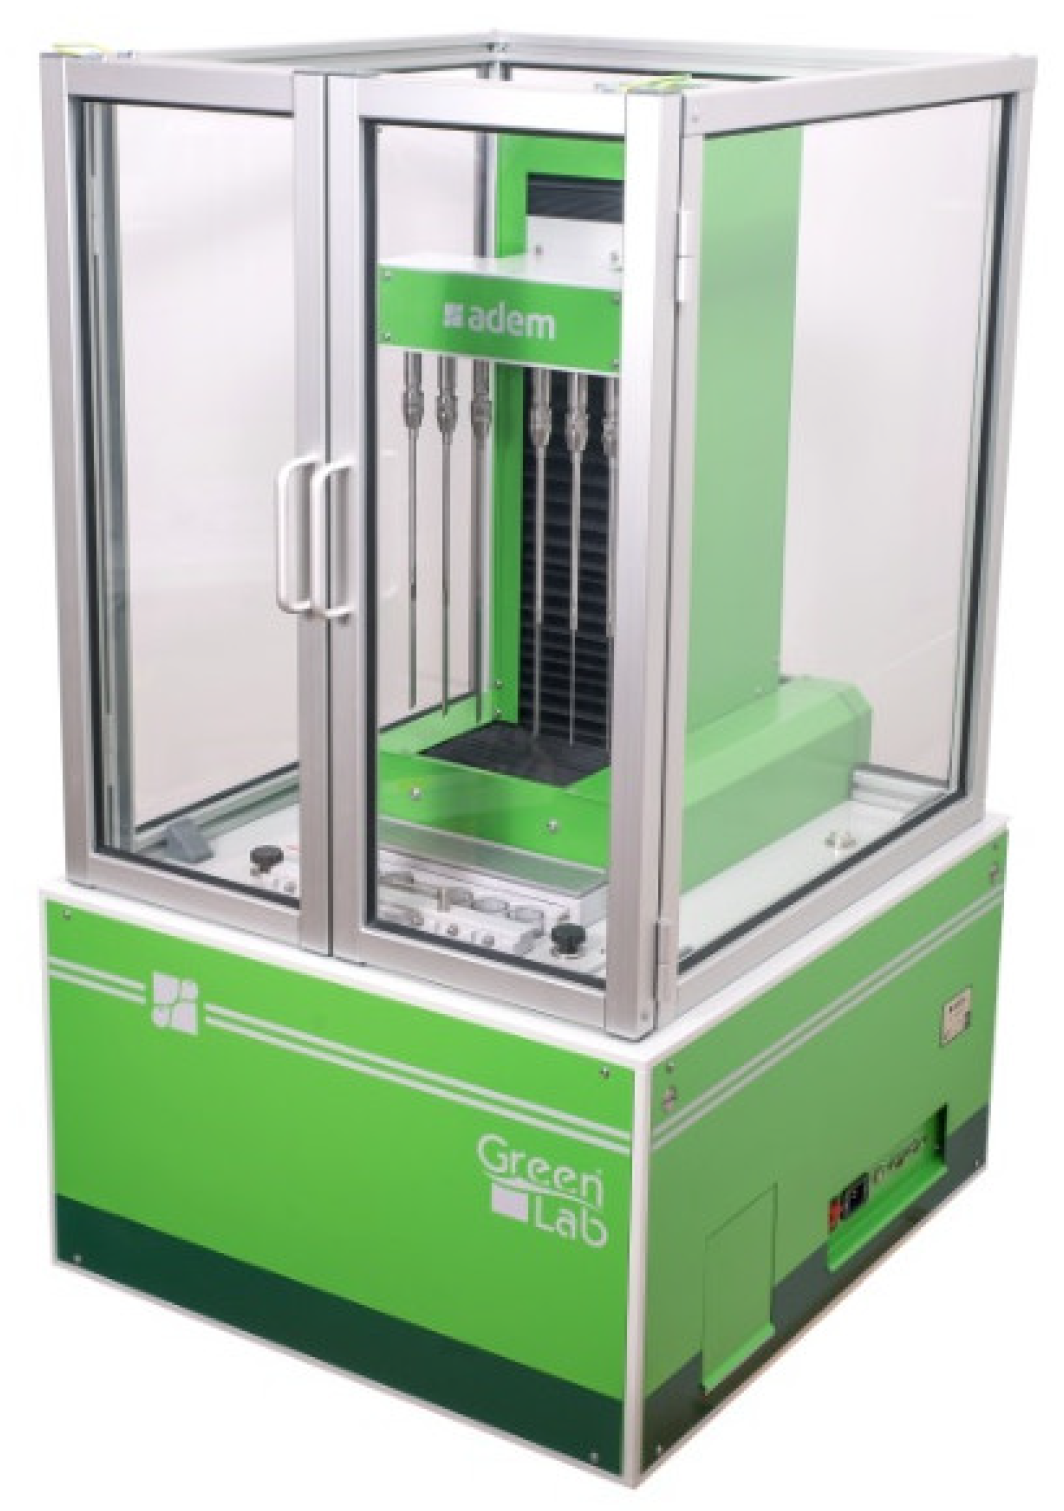
Measurements were performed with a Green Lab ADEM (Budapest, Hungary). The method is based on the manual method. The most important parameters of the equipment are summarized in Table 5.
The machine used is shown in Figure 3.
In the experimental work, the test temperature, the ratio of the aqueous and oily phases, and the test duration were fixed. These values were 80 °C for the temperature and 50–50 V/V% for the phase ratio. After mixing, the duration of the test (separation) was 1 h. During this time, the samples were not mixed, and the phases were separated at 80 °C. The stirring speed varied between 500 and 1500 rpm, and the stirring time was between 5 and 600 s. The emulsifying effect was evaluated by the ratio of the emulsion phase measured after 1 h following the end of the mixing in V/V% [4]. This emulsification effect allows the quantitative characterization of the efficiency of the surfactants used for the preparation of emulsions.

3. Results and Discussion

For the tests, the surfactant mixtures were dissolved in synthetic brine, and the oil was added to the cylinder of the instrument. After tempering, the apparatus was used to homogenize the phases. The results were determined 60 min after stirring.

3.1. Phase Behavior Test Results

For the phase behavior tests, homogenization of the oily and aqueous phases was performed with an automatic device at 80 °C. The quality of the emulsion was characterized according to the Winsor theory after 1 h following the end of stirring. In the case of surfactant selection, mainly the Winsor type-III emulsion is acceptable. The results for surfactant S1 are summarized in Table 6.
Using surfactant S1, in the case of a short stirring time and a low stirring speed, complete separation of the phases occurred after 1 h following the cessation of stirring (5 cases). Winsor type-III emulsions were observed at four mixing times, and Winsor type-II emulsions were stored for 1 h after the cessation of mixing. At a stirring speed of 1500 rpm and a stirring time of 10 min, a Winsor type-IV complete emulsion was observed after 1 h of storage.
The phase behavior test results are shown in Table 7 for S2.
For surfactant S2, there was no emulsion phase after 1 h at stirring speeds of 500 and 750 rpm. At 1000 rpm, a stirring time of 3 min was required for the emulsion phase to remain after one hour. With a longer mixing time and/or faster mixing, a Winsor II emulsion was observed after 1 h of sedimentation.
The results in the case of surfactant SM1 are summarized in Table 8.
For the surfactant composition SM1, the minimum stirring speed for the emulsion phase remaining after one hour was 750 rpm. The minimum stirring time was 30 s at 750 rpm and 15 s at 1000 rpm. After one hour, the emulsion phase was Winsor type II in all cases.
The phase behavior test results are shown in Table 9 for SM2.
In the case of the surfactant composition SM2, even the slowest stirring speed (500 rpm) was sufficient to form the emulsion phase remaining after one hour. In this case, the minimum mixing time was 5 min. At 750 rpm, 15 s was sufficient to allow the emulsion phase to form after 1 h. Winsor type-II emulsions were observed in all cases.
The results in the case of surfactant SM3 are summarized in Table 10.
In the case of the surfactant composition SM3, the emulsion phase remaining after 1 h of storage was Winsor type II in each case. This required a stirring time of 3 min at 500 rpm and 30 s at 750 rpm.
For each surfactant and surfactant mixture, stirring speeds of 1250 and 1500 rpm were sufficient to form an emulsion phase that remained after one hour of settling. Stirring at 500 and 750 rpm and a stirring time of less than 15 s were not sufficient for any of the samples tested to form an emulsion phase remaining after one hour of storage.

3.2. Emulsification Effect

In the experimental study, certain parameters were held constant, including the test temperature, the ratio of the aqueous and oily phases, and the test duration. The temperature was maintained at 80 °C, while the phase ratio was maintained at 50–50 V/V%. Following the mixing process, a 1 h duration was designated for the test (separation) phase. Throughout this period, the samples underwent no agitation, allowing the phases to naturally separate at 80 °C. Stirring was performed at varying speeds between 500 and 1500 RPM, with stirring times ranging from 5 to 600 s.
The assessment of the emulsifying effect was based on the proportion of the emulsified phase measured after 1 h following the cessation of mixing, expressed in V/V% [4]. This quantified emulsification effect enabled the objective measurement of surfactant efficiency in emulsion preparation. The results of the emulsifying effect experiments using surfactant S2 are shown in Table 11.
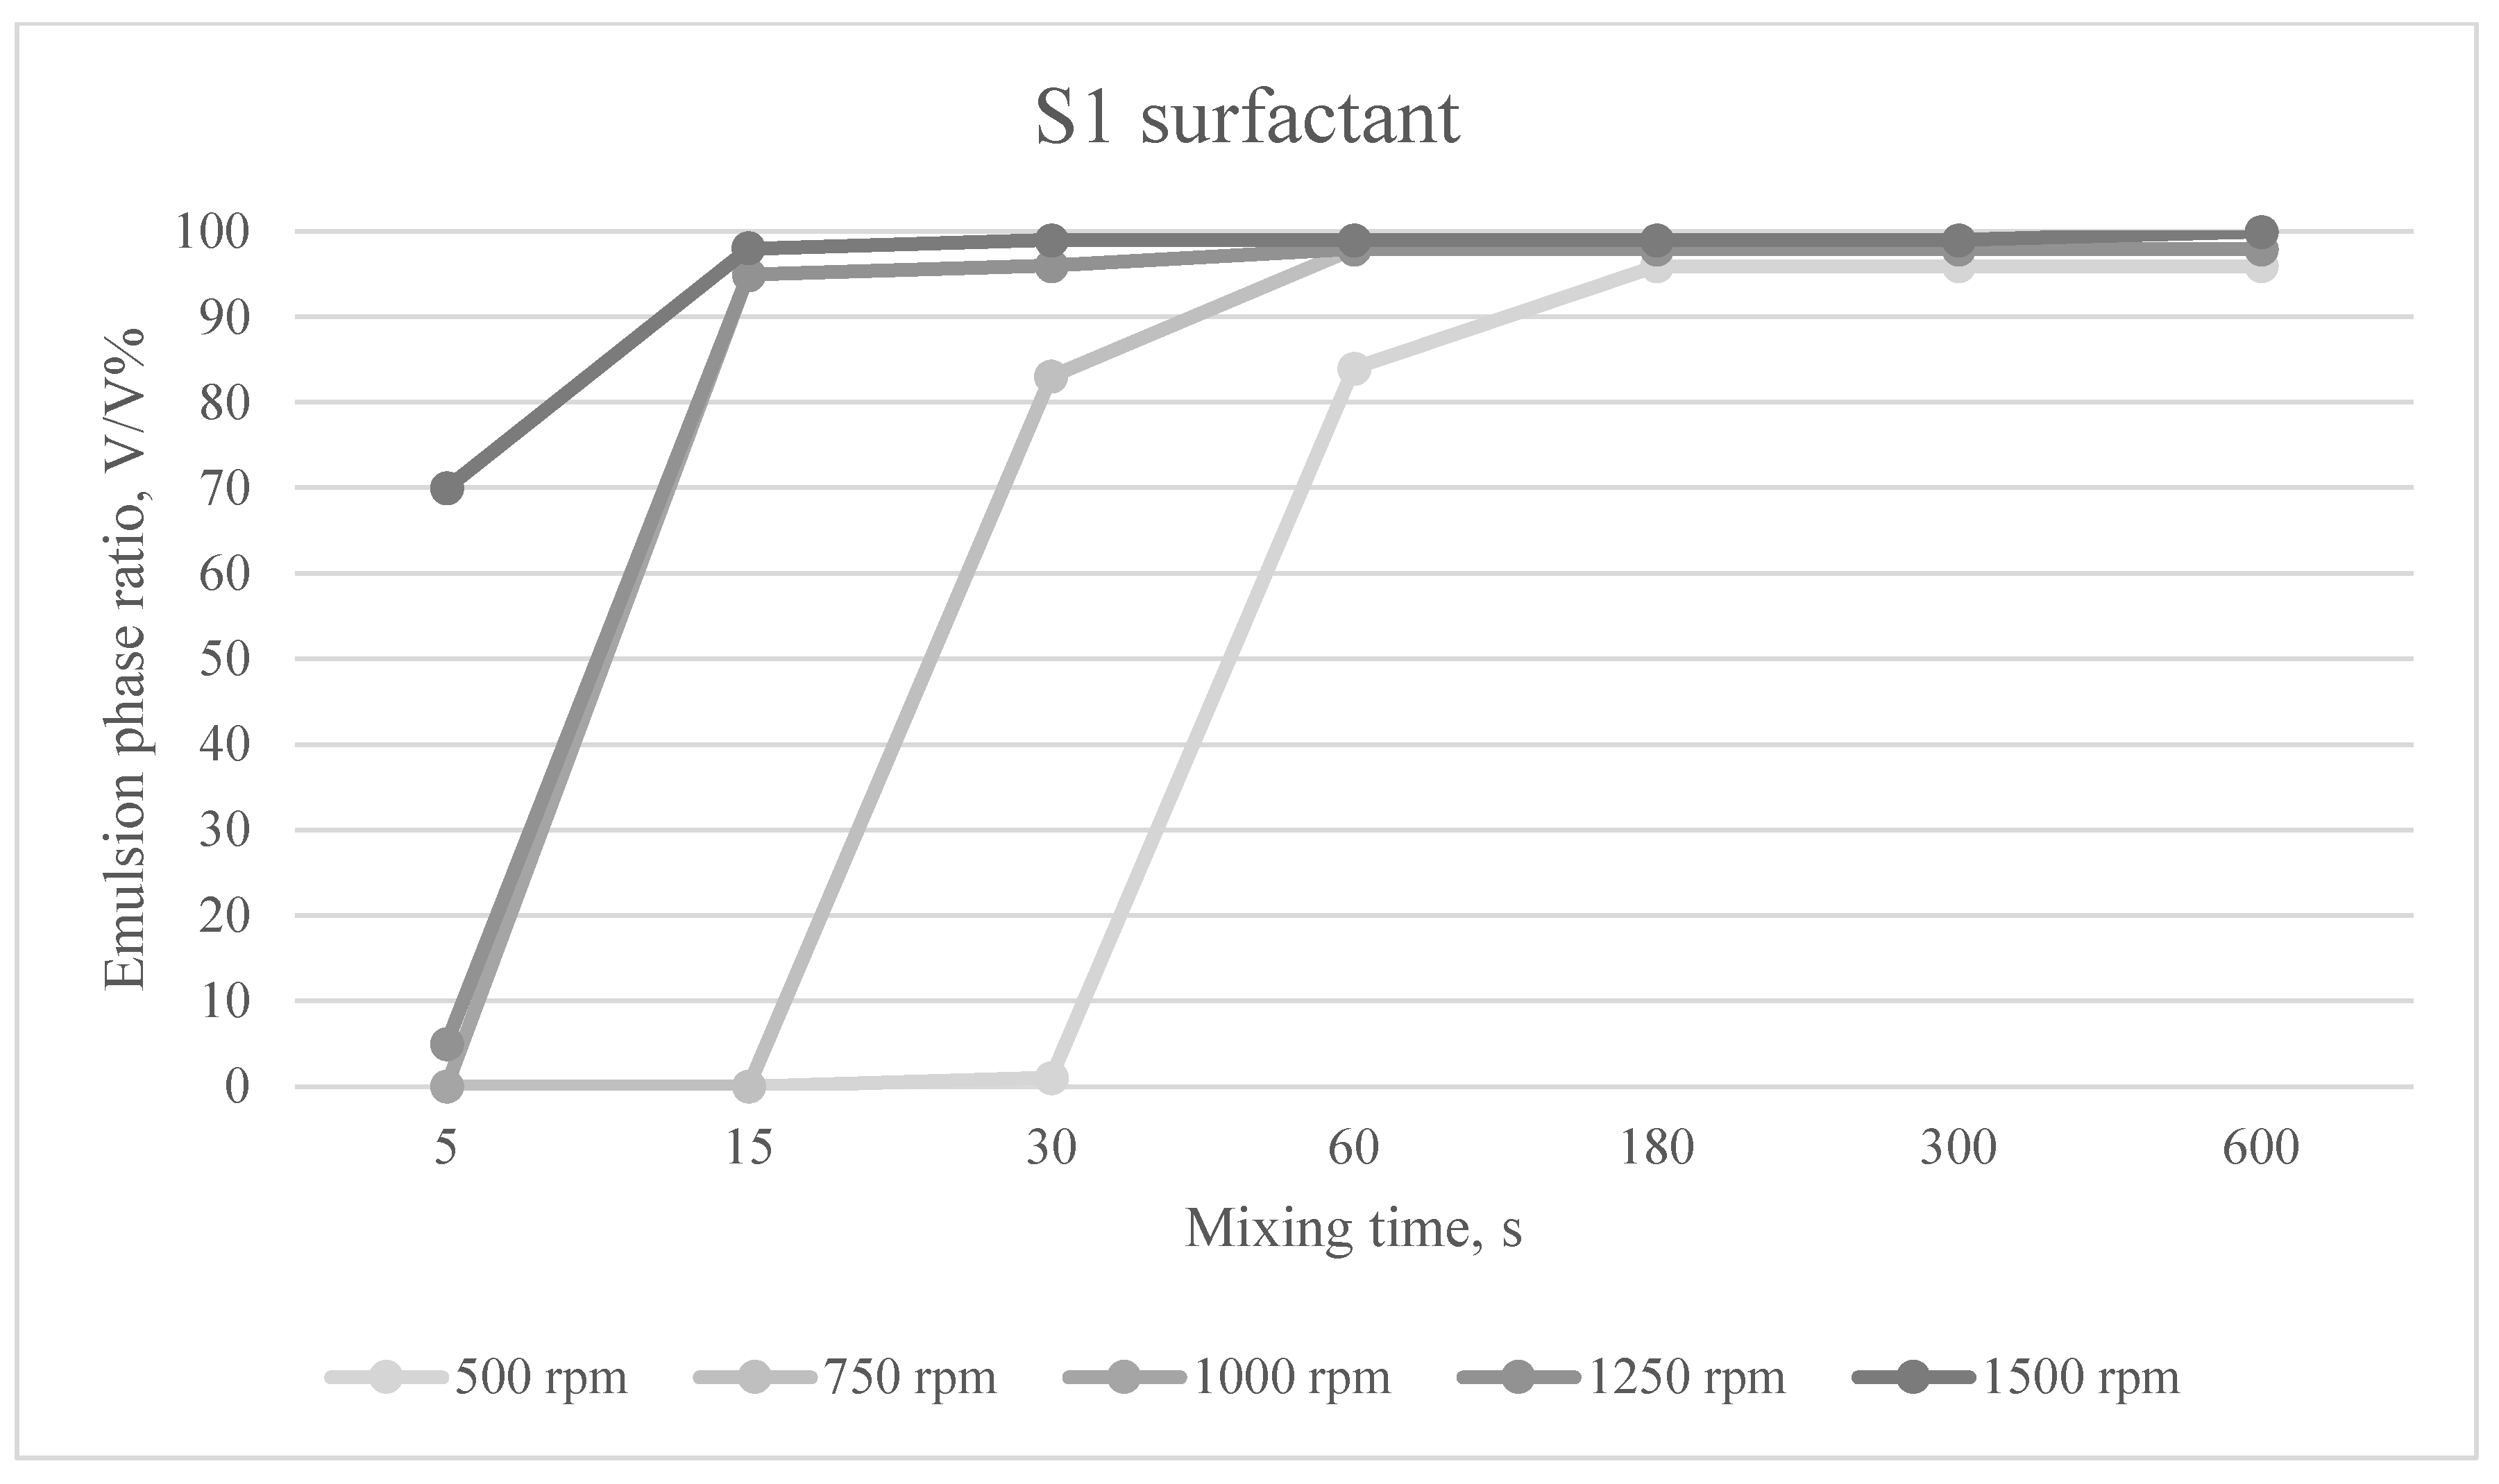
The emulsion phases formed at different mixing times and mixing speeds for the S1 surfactant are shown in Figure 4.
When using surfactant S1, the emulsifying effect varied between 96 and 100% if a Winsor I or Winsor II emulsion was observed after one hour. If there was a Winsor II or Winsor III emulsion after one hour, the emulsifying effect ranged from 1 to 84%.
The results of the emulsifying effect tests with surfactant S2 are summarized in Table 12.
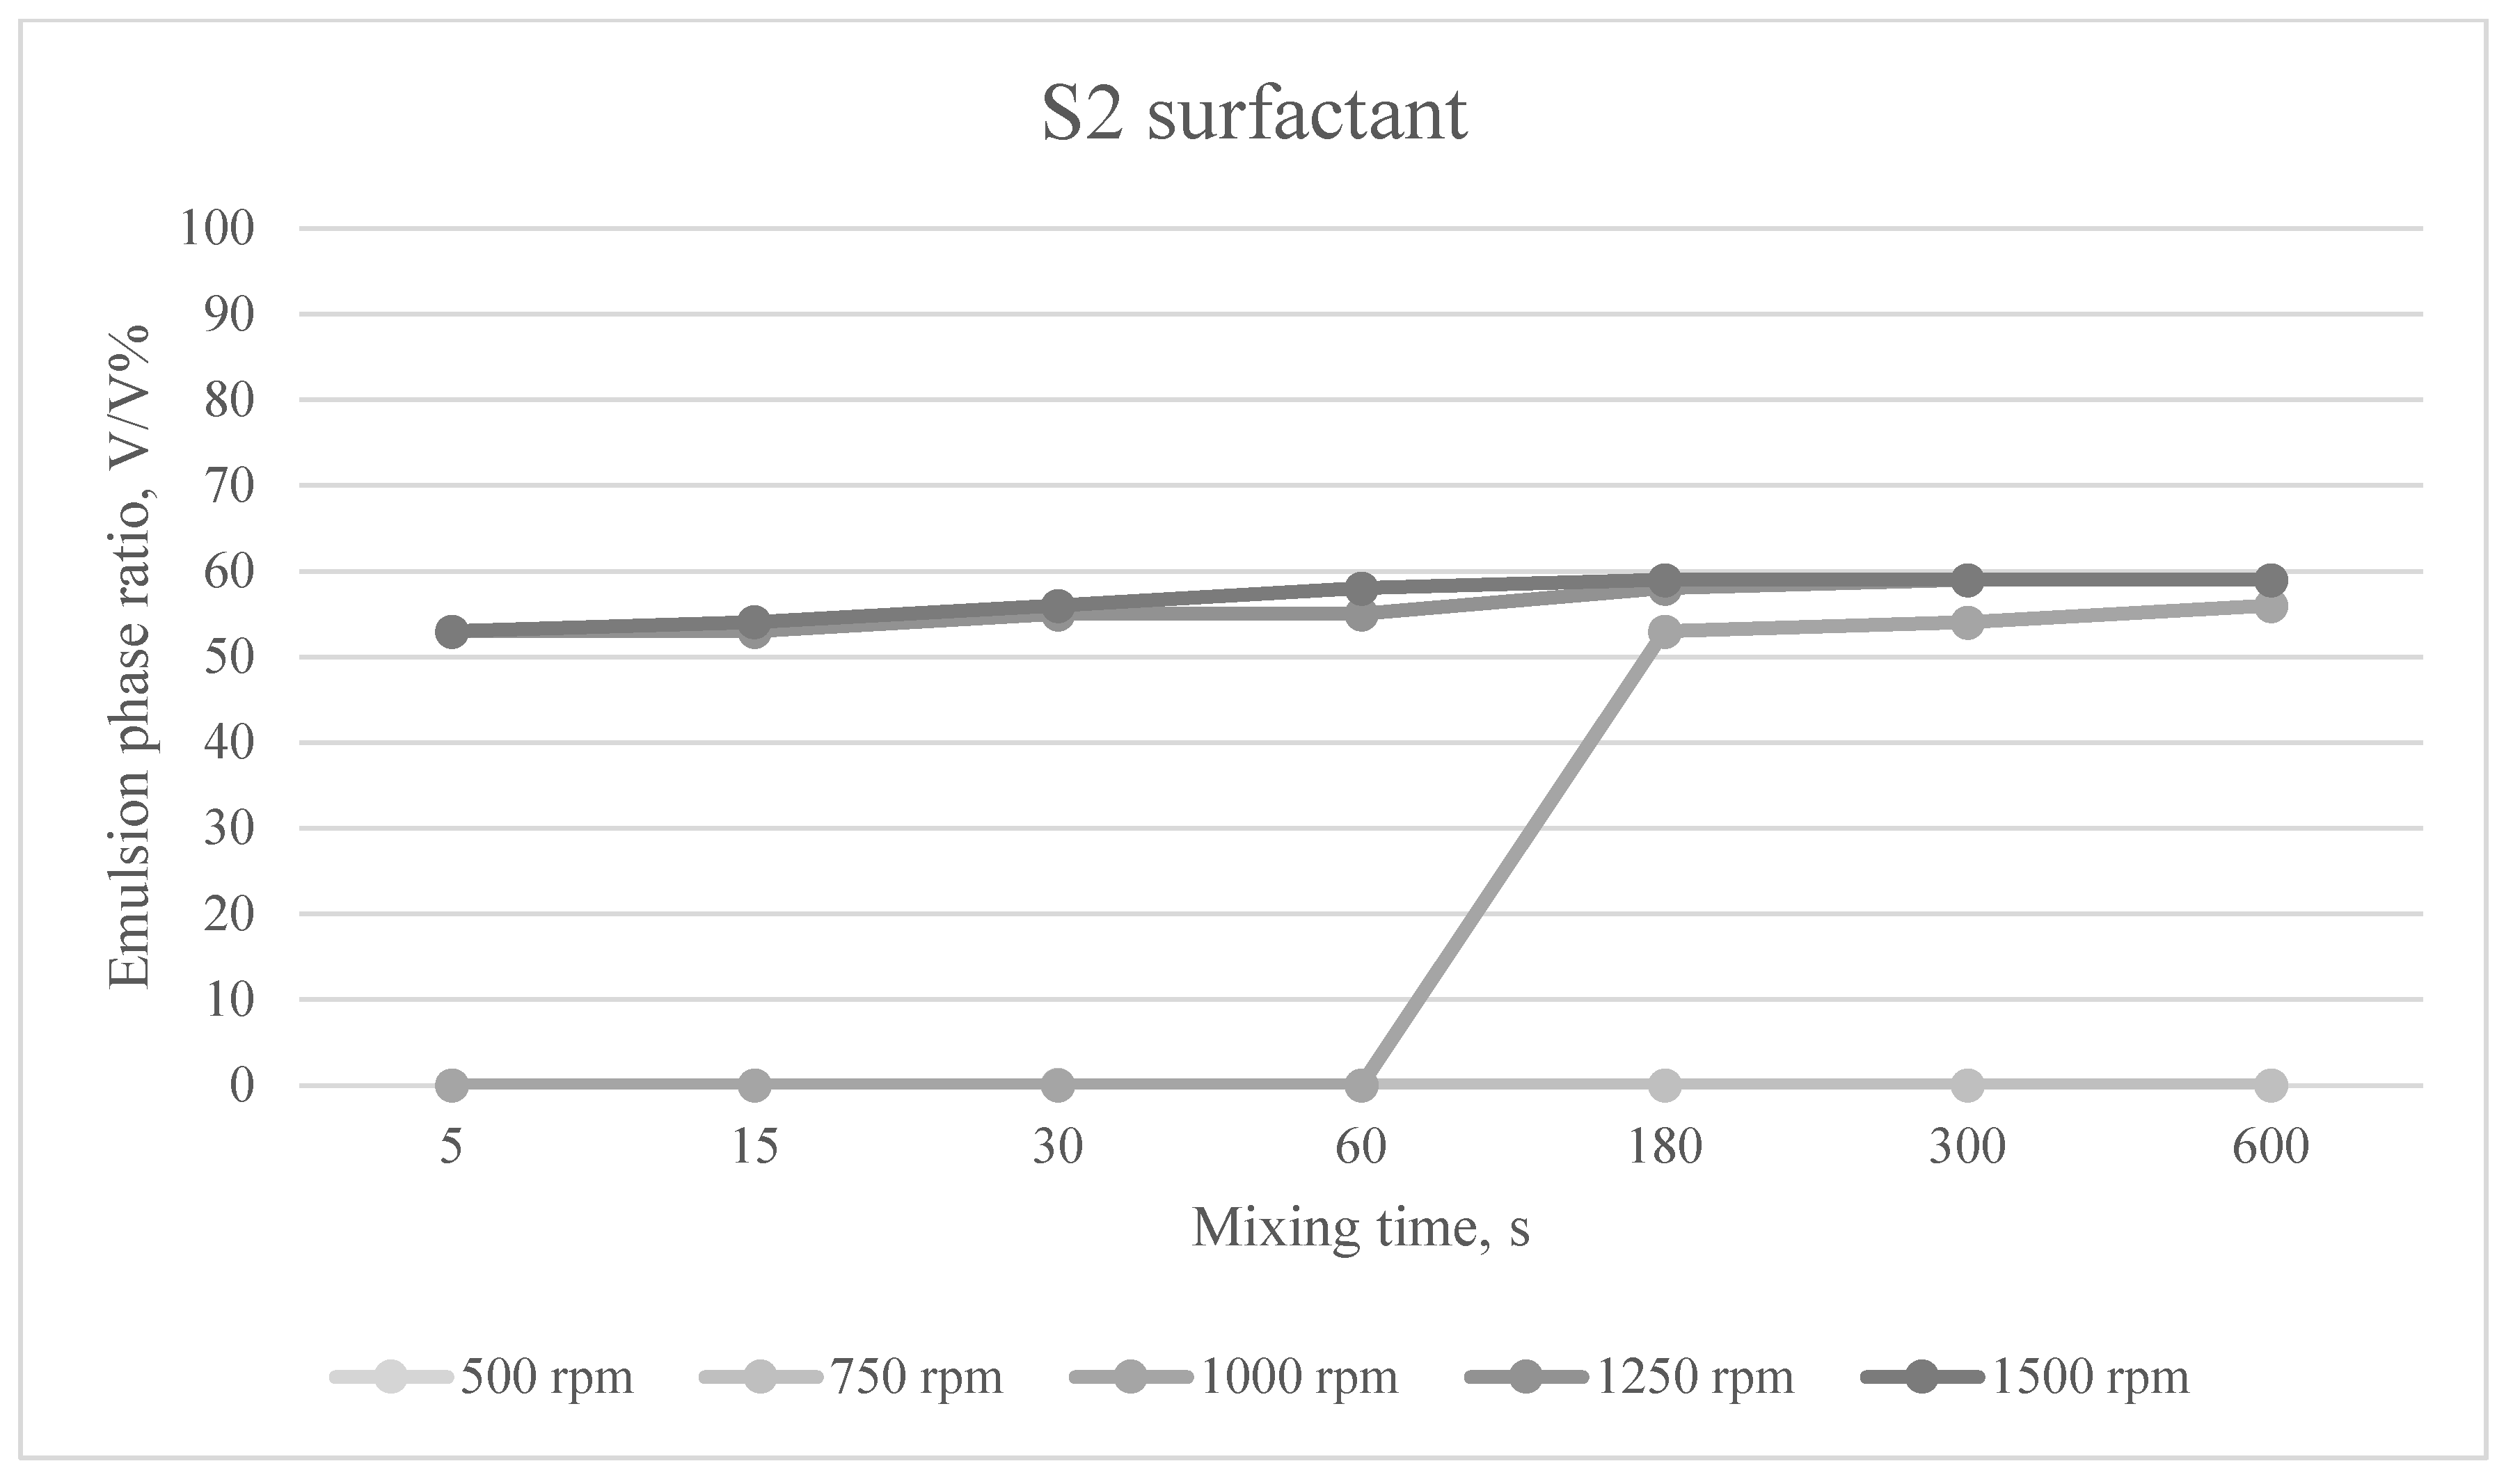
The emulsion phases formed at different mixing times and mixing speeds for the S2 surfactant are shown in Figure 5.
For surfactant S2, the emulsifying effect varied between 53 and 59% depending on the mixing parameters. As the mixing speed and/or time increased, the emulsifying effect increased.
The results of the emulsifying effect tests with the SM1 surfactant are summarized in Table 13.
The emulsion phases formed at different mixing times and mixing speeds for the SM1 surfactant package are shown in Figure 6.
In the case of the surfactant SM1, the emulsifying effect varied between 53 and 59%, similar to that of the surfactant S2, but a shorter mixing time and/or a slower mixing speed were sufficient for the emulsifier to remain after one hour.
The results of the emulsifying effect tests with the surfactant SM2 are summarized in Table 14.
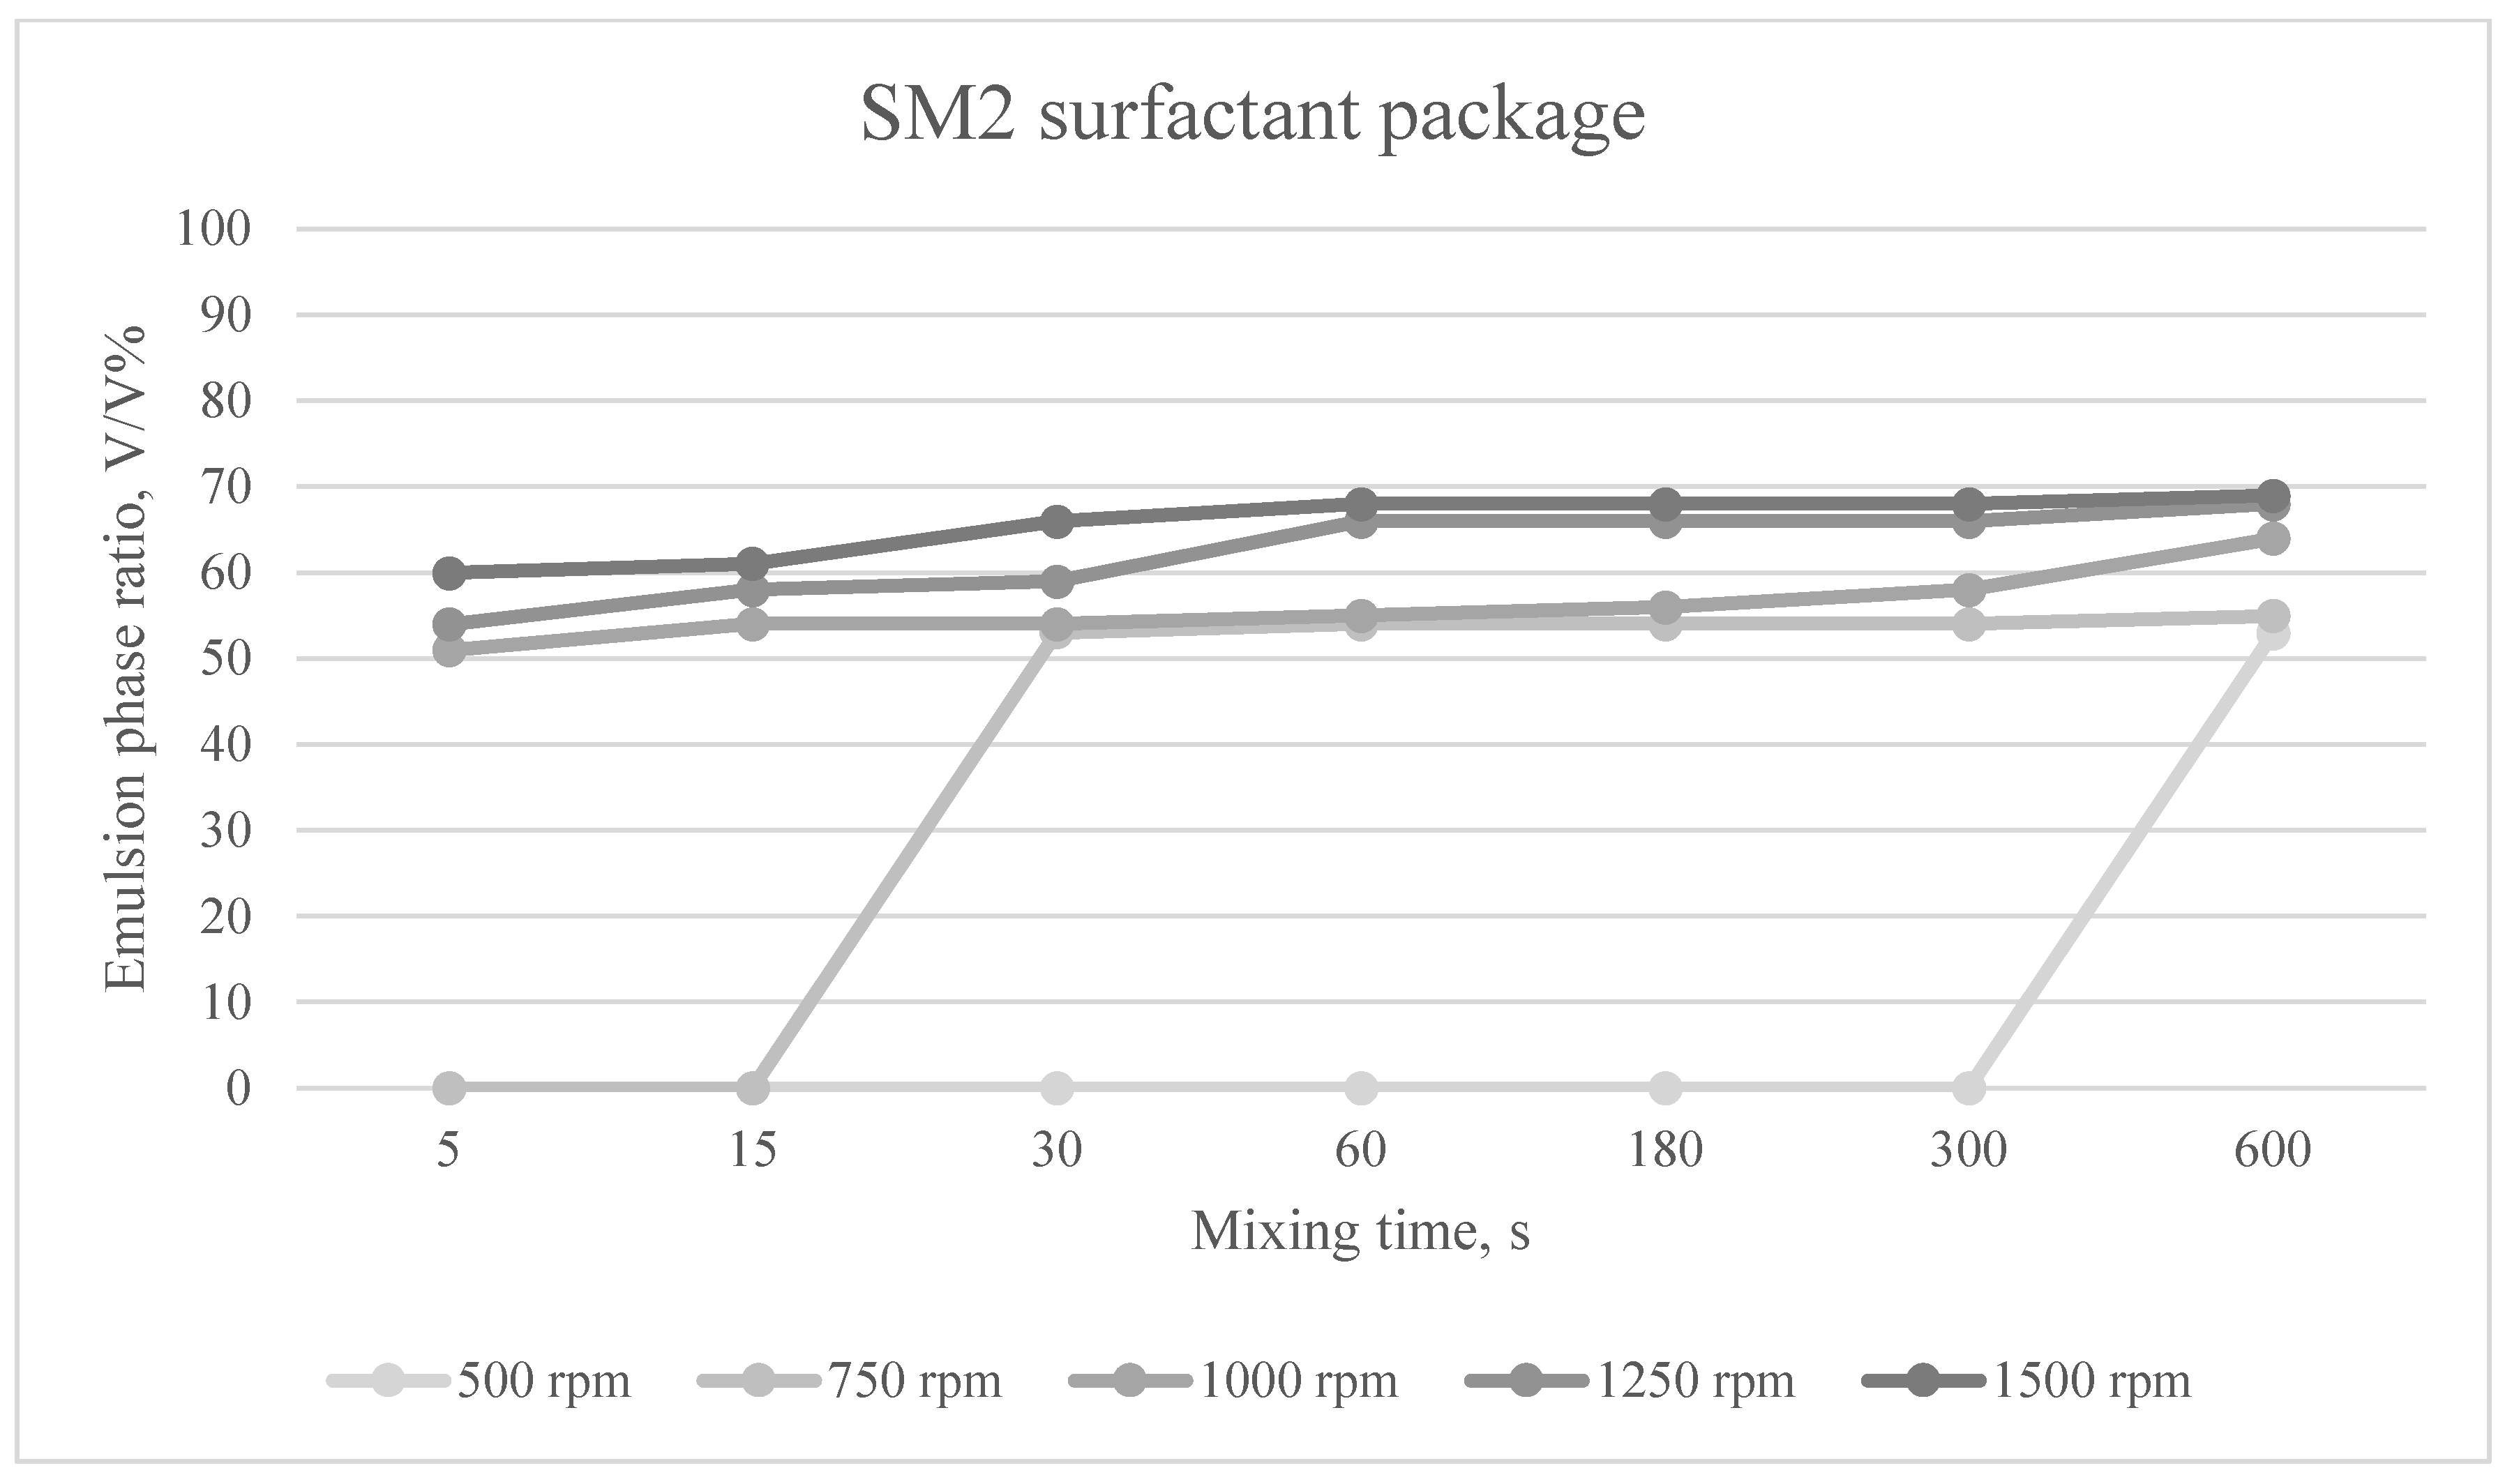
The emulsion phases formed at different mixing times and mixing speeds for the SM2 surfactant package are shown in Figure 7.
In the case of the surfactant composition SM2, the emulsifying effect increased compared to that of the surfactant composition SM1. The emulsifying effect ranged from 51 to 69%.
The results of the emulsifying effect tests with the SM3 surfactant are summarized in Table 15.
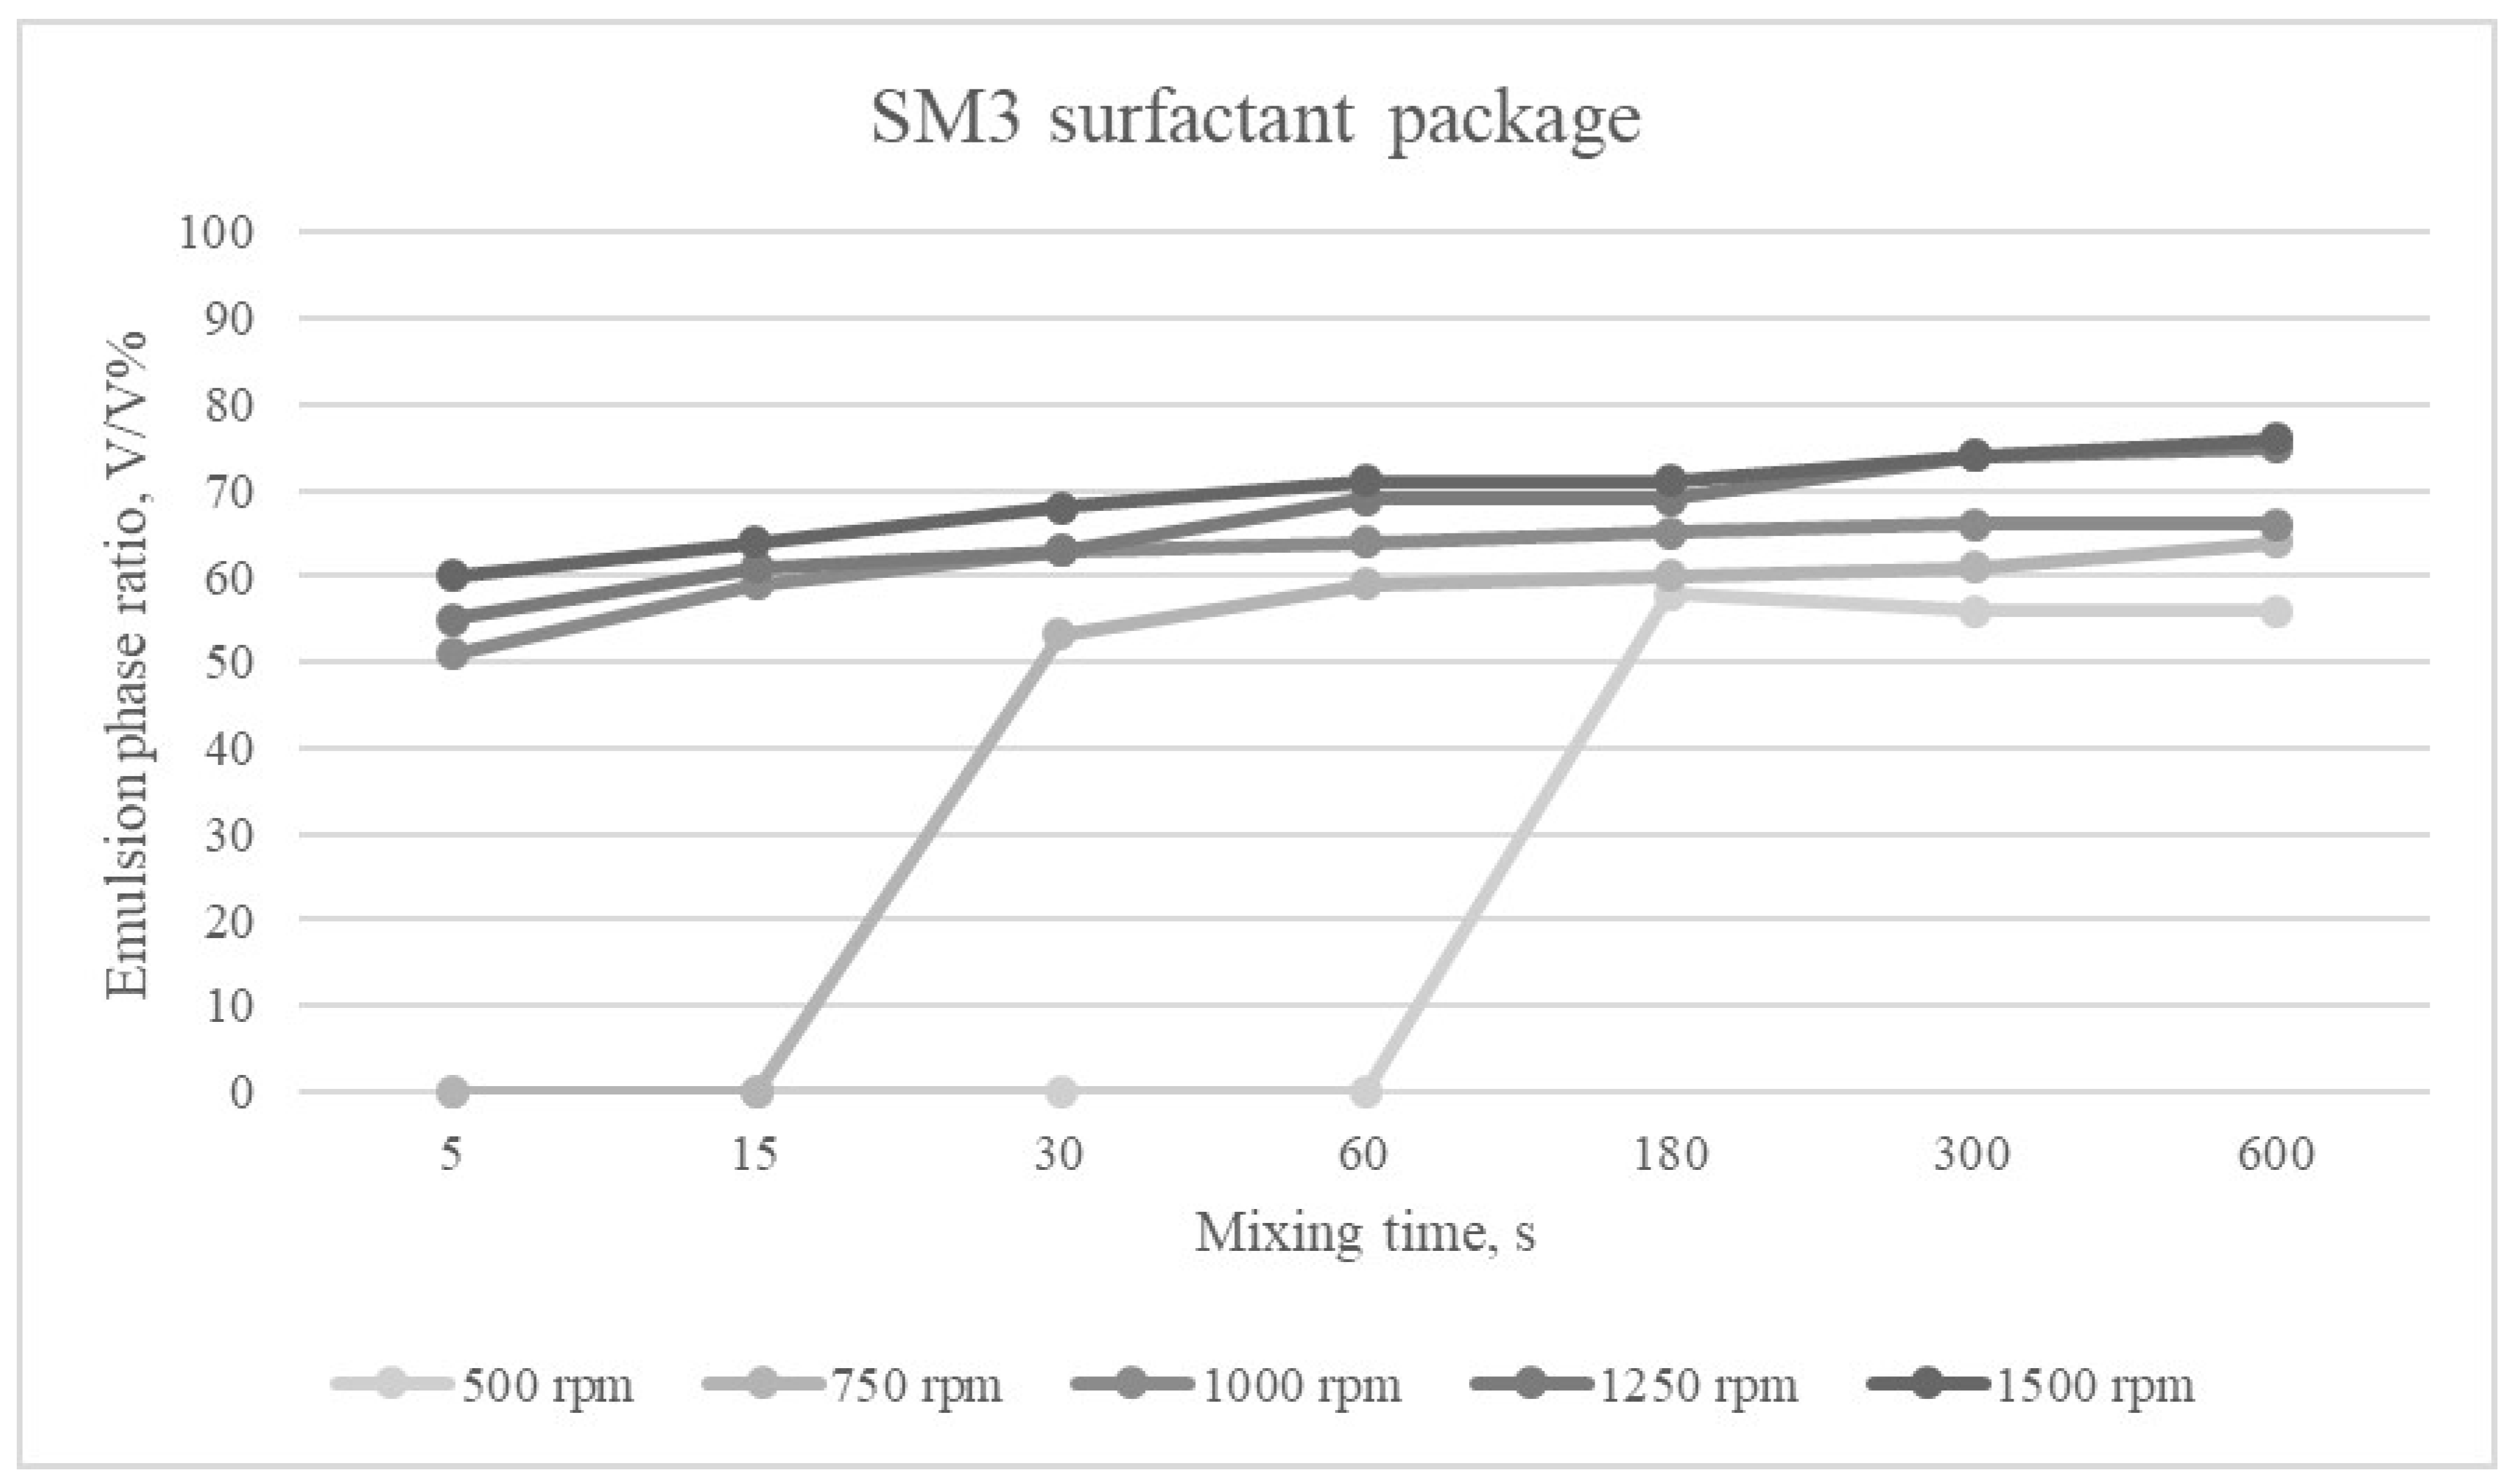
The emulsion phases formed at different mixing times and mixing speeds for the SM3 surfactant package are shown in Figure 8.
Among the surfactant compositions, SM3 had the greatest emulsifying effect. Its value varied between 51 and 76% depending on the mixing parameters.
When the emulsifying effect was 0%, the mechanical energy generated by mixing was not enough to homogenize the phases sufficiently, and due to the large size of the dispersed droplets, the phase separation process took less than one hour. In one case, a Winsor IV type emulsion was formed using the S1 surfactant at a stirring speed of 1500 rpm and a stirring time of 10 min. In this case, the mechanical energy invested by mixing the phases was large enough to allow the dispersed droplets to fragment and remain stable after one hour of storage.
The highest emulsifying effect was achieved with the surfactant S1. In the case of surfactant compositions, increasing the proportion of surfactant S1 increased the emulsifying effect and decreased the minimum mixing time/mixing required to form an emulsion remaining after one hour of storage.
When two surfactant compositions were used, the test sample had an emulsifying effect of 5 s mixing time with a mixing speed of 1000 rpm, although the surfactants alone did not emulsify under similar test parameters.
4. Summary

Phase behavior tests and emulsifying effect tests were performed on two surfactants and three surfactant packages as a function of mixing parameters. For four of the five solutions, for each mixing time and mixing speed, there was either no emulsion phase after one hour or a Winsor type-II emulsion. In the case of the S1 surfactant, all Winsor type emulsions were observed, and in some cases, no emulsion phase was observed after the settling time. The highest emulsifying effect was achieved with the surfactant S1. In the case of the surfactant package, increasing the proportion of surfactant S1 increased the emulsifying effect and decreased the minimum mixing time and mixing speed required to form an emulsion remaining after one hour.
During the study of the technical publications, it was found that until now, the emulsifying effect was tested by manual homogenization and visual evaluation (the so-called tube test). The aim of the experimental work was derived from this.
In summary, the results of the phase behavior test used to qualitatively characterize the emulsion formation of surfactants are influenced by the mixing time and mixing speed used in the test. With respect to different mixing parameters, the classification of the resulting emulsion according to the Winsor theory may differ for the same samples. Furthermore, the result of the emulsifying effect test used for the amount of emulsion formation also depends on the mixing parameters and results in extreme values for systems. Minimum mixing time and mixing speed are required for testing surfactants, and consistency of mixing parameters is essential for the comparability of tests. This is especially true near the conditions that are favorable for the formation of Winsor type-III emulsions.

Author Contributions

Conceptualization and writing—original draft preparation M.H.; supervision, R.N., L.B. and S.P. All authors have read and agreed to the published version of the manuscript.

Funding

Doctoral Student Scholarship Program of the Cooperative Doctoral Program of the Ministry of Innovation and Technology financed by the National Research, Development and Innovation Fund. Founding number: KDP-11-3/PALY-2021.

Data Availability Statement

The original contributions presented in the study are included in the article, further inquiries can be directed to the corresponding author.

Conflicts of Interest

Not applicable.

Nomenclature

EOREnhanced Oil Recovery
HLBHydrophilic–Lipophilic Balance
WORWater–Oil Ratio
Coco-DEACoconut Diethanolamide
SLESSodium Lauryl Ether Sulfate
RPMRevolutions Per Minute
S1Surfactant 1
S2Surfactant 2
SM1Surfactant Mixture 1
SM2Surfactant Mixture 2
SM3Surfactant Mixture 1
ppmParts Per Million

References

  1. Rellegadla, S.; Prajapat, G.; Agrawal, A. Polymers for enhanced oil recovery: Fundamentals and selection criteria. Appl. Microbiol. Biotechnol. 2017, 101, 4387–4402. [Google Scholar] [CrossRef] [PubMed]
  2. Green, D.W.; Willhite, G.P. Enhanced Oil Recovery; SPE Textbook Series; Society of Petroleum Engineers: Richardson, TX, USA, 1998; Volume 6. [Google Scholar]
  3. Olajire, A.A. Review of ASP EOR (alkaline surfactant polymer enhanced oil recovery) technology in the petroleum industry: Prospects and challenges. Energy 2014, 77, 963–982. [Google Scholar] [CrossRef]
  4. Malahov, A.O.; Saifullin, E.R.; Varfolomeev, M.A.; Nazarychev, S.A.; Mustafin, A.Z.; Yuan, C.; Novikov, I.P.; Zharkov, D.A.; Sagirov, R.N.; Kadyrov, R.I. Screening of Surfactants for Flooding at High-Mineralization Conditions: Two Production Zones of Carbonate Reservoir. Energies 2022, 15, 411. [Google Scholar] [CrossRef]
  5. Schramm, L.L. Surfactants: Fundamentals and Applications in the Petroleum Industry; Cambridge University Press: Cambridge, UK, 2009. [Google Scholar]
  6. Luan, H.; Zhou, Z.; Xu, C.; Bai, L.; Wang, X.; Han, L.; Zhang, Q.; Li, G. Study on the Synergistic Effects between Petroleum Sulfonate and a Nonionic–Anionic Surfactant for Enhanced Oil Recovery. Energies 2022, 15, 1177. [Google Scholar] [CrossRef]
  7. Binks, B.P. Emulsions-Recent Advances in Understanding. In Modern Aspect of Emulsion Science, 1st ed.; Bernard, B.P., Ed.; The Royal Society of Chemistry: Cambridge, UK, 1998; pp. 1–55. [Google Scholar]
  8. Winsor, P.A. Solvent Properties of Amphiphilic Compounds; Butterworths Scientific Publications: Oxford, UK, 1954. [Google Scholar]
  9. Kothencz, R.; Nagy, R.; Bartha, L.; Vágó, Á. Improvement of the Selection Method of Surfactants and Their Mixtures for Chemical Enhanced Oil Recovery. Chem. Eng. Commun. 2017, 204, 440–444. [Google Scholar] [CrossRef]
  10. Nagy, R.; Sallai, R.; Bartha, L.; Vágó, Á. Selection method of surfactants for chemical enhanced oil recovery. Adv. Chem. Eng Sci. 2015, 5, 121. [Google Scholar] [CrossRef]
  11. Hartyányi, M.; Nagy, R.; Bartha, L.; Puskás, S. Investigation of the emulsifying effect of coconut fatty acid diethanolamide depending on mixing intensity in case of crude-brine system. Tech. Rev. 2021, 78, 16–22. [Google Scholar] [CrossRef] [PubMed]
  12. Li, X.; Zou, J.; Yan, R. Effect of in situ emulsification of surfactant on the enhanced oil recovery in low-permeability reservoirs. Colloids Surf. A Physicochem. Eng. Asp. 2022, 634, 127991. [Google Scholar] [CrossRef]
  13. Chen, L.; Zhao, X.; Wang, Z.; Tang, J.; Feng, B.; Tang, M. Research on the emulsifying ability of surfactants in crude oil. Tenside Surfactants Deterg. 2013, 50, 434–440. [Google Scholar] [CrossRef]
  14. Li, X.; Yue, X.A.; Wang, Z.; Yan, R.; Guo, Y. Role of emulsification and interfacial tension of a surfactant for oil film displacement. Energy Fuels 2021, 35, 3032–3041. [Google Scholar] [CrossRef]
  15. Sheng, J.J. Status of surfactant EOR technology. Petroleum 2015, 1, 97–105. [Google Scholar] [CrossRef]
Figure 1. Chemical structure of surfactants used (above: COCO-DEA, below: SLES).
Energies 17 02438 g001aEnergies 17 02438 g001b
Figure 2. Schematic illustration of Winsor-type emulsions.
Energies 17 02438 g002
Figure 3. The automated demulsibility tester (ADEM).
Energies 17 02438 g003
Figure 4. Emulsion phase ratio at different mixing times and mixing speeds for S1.
Energies 17 02438 g004
Figure 5. Emulsion phase ratio at different mixing times and mixing speeds for S2.
Energies 17 02438 g005
Figure 6. Emulsion phase ratio at different mixing times and mixing speeds for SM1.
Energies 17 02438 g006
Figure 7. Emulsion phase ratio at different mixing times and mixing speeds for SM2.
Energies 17 02438 g007
Figure 8. Emulsion phase ratio at different mixing times and mixing speeds for SM3.
Energies 17 02438 g008
Table 1. The most important properties of the crude oil used for the tests.
PropertyValue
Density, g/cm3 (d254)0.8242
API density38.7
Dynamic viscosity, mPas (25 °C)45.0
Kinematic viscosity, mm2/s (25 °C)51.5
Kw (Watson)12.8
CharacteristicParaffinic
Approx. mean average boiling point (°C)410
Table 2. Composition analysis of the synthetic brine.
ParameterValue (ppm)
Na+5700
Ca+2200
Cl900
HCO32600
CH3COO2600
TDS5900
Table 3. Properties of surfactants.
Surfactant NameTypeSupplierMain ComponentActive Matter Content, w%Appearance
Coco-DEAnonionicCrodaCocamide DEA85yellowish, viscous liquid
SLESanionicEMALSodium lauryl ether sulfate70white paste
Table 4. Composition of the surfactants used for the tests and their solubility.
Surfactant Package MarkCoco-DEA Content, w%SLES Content, w%Surfactant TypeSolubility in Used Brine
S11000nonionicgood
S20100anionicgood
SM12575surfactant mixture
anionic and nonionic
good
SM25050surfactant mixture
anionic and nonionic
good
SM37525surfactant mixture
anionic and nonionic
good
Table 5. Properties of the emulsification device (ADEM).
PropertyValue
Number of parallelly investigated samples6 pcs
Type of mixerShovel mixer
Mixing speed500–1600 rpm
Heat transfer mediumWater
Temperature20–85 °C
Temperature stability±1 °C
Amount of sample80 mL
PropertyValue
Table 6. Results of the phase behavior test in the case of surfactant S1.
Mixing Time, sMixing Speed, rpm
500750100012501500
5---Winsor IIIWinsor II
15--Winsor IWinsor IWinsor I
30Winsor IIIWinsor IIIWinsor IWinsor IWinsor I
60Winsor IIIWinsor IWinsor IWinsor IWinsor I
180Winsor IWinsor IWinsor IWinsor IWinsor I
300Winsor IWinsor IWinsor IWinsor IWinsor I
600Winsor IWinsor IWinsor IWinsor IWinsor IV
Table 7. Results of the phase behavior test in the case of surfactant S2.
Mixing Time, sMixing Speed, rpm
500750100012501500
5---Winsor IIWinsor II
15---Winsor IIWinsor II
30---Winsor IIWinsor II
60---Winsor IIWinsor II
180--Winsor IIWinsor IIWinsor II
300--Winsor IIWinsor IIWinsor II
600--Winsor IIWinsor IIWinsor II
Table 8. Results of the phase behavior test for the SM1 surfactant package.
Mixing Time, sMixing Speed, rpm
500750100012501500
5---Winsor IIWinsor II
15--Winsor IIWinsor IIWinsor II
30-Winsor IIWinsor IIWinsor IIWinsor II
60-Winsor IIWinsor IIWinsor IIWinsor II
180-Winsor IIWinsor IIWinsor IIWinsor II
300-Winsor IIWinsor IIWinsor IIWinsor II
600-Winsor IIWinsor IIWinsor IIWinsor II
Table 9. Results of the phase behavior test for the SM2 surfactant package.
Mixing Time, sMixing Speed, rpm
500750100012501500
5--Winsor IIWinsor IIWinsor II
15--Winsor IIWinsor IIWinsor II
30-Winsor IIWinsor IIWinsor IIWinsor II
60-Winsor IIWinsor IIWinsor IIWinsor II
180-Winsor IIWinsor IIWinsor IIWinsor II
300Winsor IIWinsor IIWinsor IIWinsor IIWinsor II
600Winsor IIWinsor IIWinsor IIWinsor IIWinsor II
Table 10. Results of the phase behavior test for the SM3 surfactant package.
Mixing Time, sMixing Speed, rpm
500750100012501500
5--Winsor IIWinsor IIWinsor II
15--Winsor IIWinsor IIWinsor II
30-Winsor IIWinsor IIWinsor IIWinsor II
60-Winsor IIWinsor IIWinsor IIWinsor II
180Winsor IIWinsor IIWinsor IIWinsor IIWinsor II
300Winsor IIWinsor IIWinsor IIWinsor IIWinsor II
600Winsor IIWinsor IIWinsor IIWinsor IIWinsor II
Table 11. Results of the emulsification effect in the case of the S1 surfactant.
Mixing Time, sMixing Speed, rpm
500750100012501500
Emulsion Phase Ratio, V/V%
5000570
1500959598
30183969699
608498989899
1809698989899
3009698989899
60096989898100
Table 12. Results of the emulsification effect in the case of the S2 surfactant.
Mixing Time, sMixing Speed, rpm
500750100012501500
Emulsion Phase Ratio, V/V%
50005353
150005354
300005556
600005558
18000535859
30000545959
60000565959
Table 13. Results of the emulsification effect in the case of the SM1 surfactant package.
Mixing Time, sMixing Speed, rpm
500750100012501500
Emulsion Phase Ratio, V/V%
50005355
1500535455
30053545456
60054555658
180053555858
300055555859
600055565859
Table 14. Results of emulsification effect in the case of the SM2 surfactant package.
Mixing Time, sMixing Speed, rpm
500750100012501500
Emulsion Phase Ratio, V/V%
500515460
1500545861
30053545966
60054556668
180054566668
300054586668
6005355646869
Table 15. Results of emulsification effect in the case of the SM3 surfactant package.
Mixing Time, sMixing Speed, rpm
500750100012501500
Emulsion Phase Ratio, V/V%
500515560
1500596164
30053636368
60059646971
1805860656971
3005661667474
6005664667576
Disclaimer/Publisher’s Note: The statements, opinions and data contained in all publications are solely those of the individual author(s) and contributor(s) and not of MDPI and/or the editor(s). MDPI and/or the editor(s) disclaim responsibility for any injury to people or property resulting from any ideas, methods, instructions or products referred to in the content.