1. Introduction
Conventional distribution networks (CDNs) are facing challenges in integrating distributed energy resources (DERs), especially renewable energy sources (RESs), which are associated with intermittency and fluctuations. For example, the unidirectional power flow from the power grid to customers in CDNs may conflict with the requirement of distributed generators (DGs) to deliver power back to the grid; the increasing penetration of RESs with fluctuations and intermittency may cause higher uncertainty in operation.
To solve these issues, researchers place great emphasis on developing active distribution networks (ADN). The consensus on the definition of an ADN was proposed by CIGRE (International Council on Large Electric System) as a system in place to control a combination of DERs, including generators, loads, and storages, while distribution system operators (DSO) manage power flow
in a flexible network, and
DERs take some degree of responsibility for system support [
1]. It has been pointed out that ADNs can support more DG connections than networks with a fit-and-forget strategy instead of ADN management [
2].
Compared with CDNs, an ADN should display its “active” features in three aspects, which are active planning, active management, and active defense. Some features of ADN include, but are not limited to, the following:
Optimally planned configuration of DG, distributed energy storage system (DESS), and controllable load (CL), which enables bidirectional power flow and the capabilities of the prosumer selling power to the grid or to each other;
Corrective power flow management and control in real-time, instead of leaving significant redundancy in the planning stage preventively, as in the “fit-and-forget” strategy;
Defense capability considered in planning and management stage, for example, system reliability under possible grid disintegration to prevent cascading failure’s propagation.
With existing large-scale CDN infrastructure, there are challenges regarding the transition from CDNs to ADNs. Firstly, the structure and configuration of CDNs have been formed over a long period, and they cannot be extensively upgraded due to investment constraints. Secondly, if individual prosumers are allowed to directly generate power into the main grid, additional measurement and control units will be used, which leads to communication and computation difficulties. Thirdly, emerging technologies (e.g., microgrid) cannot be directly utilized for large-scale existing loads in CDNs if they cannot be subversively reconstructed.
To deal with these issues, the virtual microgrid (VM) is viewed as a possible and realistic solution. In our research, a VM is defined as a subnetwork that is partitioned from a CDN, performing as a microgrid. In contrast to conventional microgrids’ (CMs’) physical boundaries, VMs’ boundaries are from partitioning, which is virtual, so that it may not only keep existing structure and configuration of CDNs but also utilize the advantages of microgrid technologies. In past research [
3,
4], a VM was created in a clustering CDN for system performance optimization. Based on a complex network method, the boundaries of VMs can be identified by structural characteristics [
5] so that each VM may perform with better efficiency.
Self-sufficiency denotes the ability of VMs to supply load when working in independent or even islanding mode and fulfill power demand/supply discrepancy within a VM in a certain time slot. Similar ideas have been used in past research [
4,
6,
7,
8], which mainly consider sufficiency in a static power supply capacity and not as a dynamic balance between flexibility and uncertainty. However, one key challenge in integrating renewable power generation with CDNs is their uncertainty. Then, the local sufficiency of flexibility resources is a key point that VMs must consider to construct a capable ADN. However, this has never been considered in previous research about VMs.
Power grid flexibility is defined in some research [
9] as the
system’s ability to cope with variability and uncertainty in both generation and demand, while maintaining a satisfactory level of reliability at a reasonable cost. In this definition, flexibility must cope with not only short-term uncertainty, derived from RESs and load fluctuations, but also long-term variability, meaning the estimable but inevitable variation in RESs, such as the seasonal changes in wind speed and solar hour. In this paper, the definition of flexibility will be focused to dealing with short-term disturbances that are fast enough to keep the system secure [
10], as per the definition of many researchers (M. Bucher et al. [
10,
11], J. Bertsch et al. [
12], and E. Lannoye et al. [
13]). Long-term flexibility is inapplicable here, because RESs’ long-term variation is supposed to be foreknown, and long-term unit commitment portfolio schedules can be altered according to estimations.
In a previous study [
14], an index for flexibility supply was introduced to quantify flexibility and uncertainty based on a triad of available power, ramp rate, and energy capacity. In this paper, these three elements are normalized and averaged to obtain a flexibility index (FI) for DGs, controllable loads (CLs), and DESSs. Following a similar method, the uncertainty index (UI) is formulated. The flexibility supply index (FSI), being the ratio between FI and UI, denotes the supply and demand balance of flexibility sources.
Compared with the existing literature, the contributions of this paper include the following:
The active planning of ADN is defined as the maximization of system active management and active defense capability. Then, based on these definitions, new meanings of self-sufficient VM are proposed;
Based on the meaning of self-sufficiency, an assessment method of grid flexibility and uncertainty balance is proposed and calculated via Monte Carlo simulation;
Based on the meaning of self-sufficiency, the definition and assessment of VM structural cohesion are put forward;
A bi-level optimization model for self-sufficient VMs’ active planning is designed and implemented.
This paper is structured as follows:
Section 2 further explains the ideas of active distribution networks and virtual microgrids and revises the notion of net-ability in the VMs setting.
Section 3 will discuss the quantification method of flexibility and uncertainty. In
Section 4, a bi-level optimization based on Monte Carlo simulation (MCS) and genetic algorithm (GA) is proposed for active planning.
Section 5 proposes a case study based on the PG&E 69 bus system, and comparisons are made to show improvements from existing methods. In
Section 6, a discussion on the case study is provided for more concrete analysis, and the limitations of the proposed research are described.
Section 7 concludes this paper.
2. Concepts for Self-Sufficient and Cohesive VM
2.1. Active Planning for VMs with IoT Supports
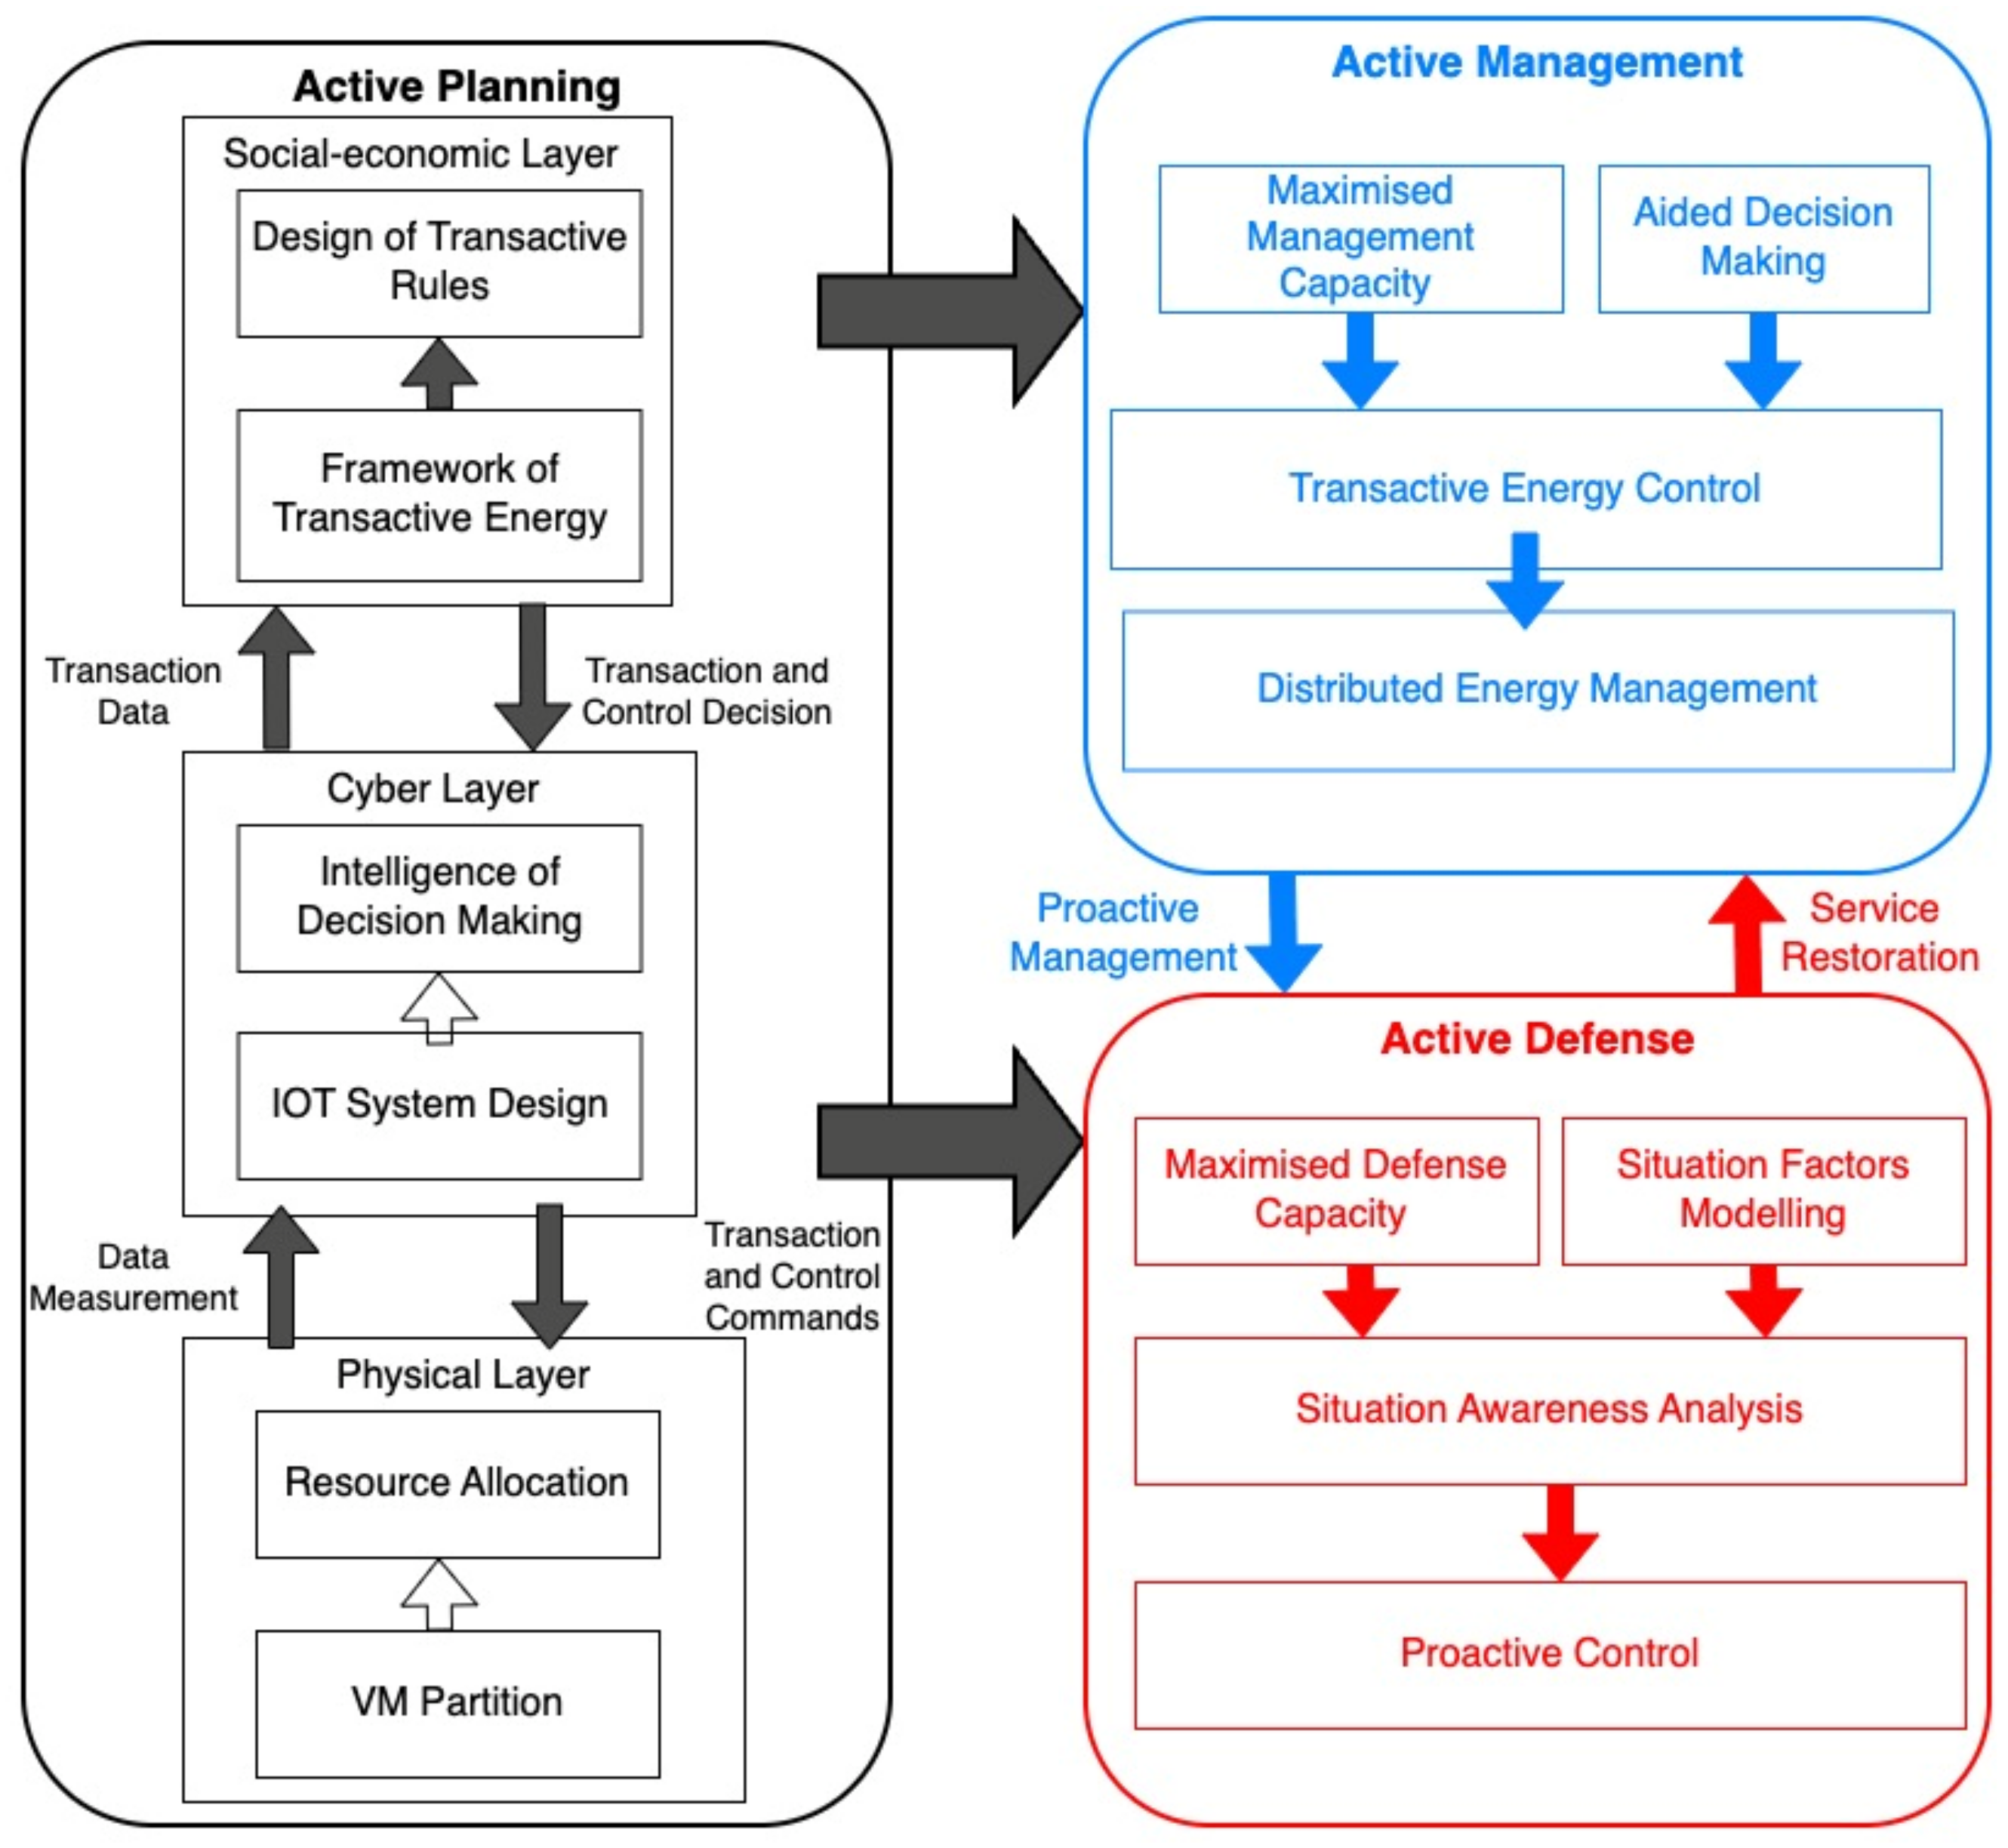
In our research, enabling the technology of ADNs consists of three categories: active planning, active management, and active defense. A research framework is shown in
Figure 1. Active planning is defined as a smart configuration of system components that may support adequate capabilities in active management and active defense. An ADN with multiple VMs could be considered as an extended CPS system (cyber, physical, and socioeconomic) [
5]. So, active planning could be performed in a physical layer, cyber layer, and socioeconomic layer. This paper mainly focuses on resource allocation in the physical layer. Further, by definition, active management refers to schedule and control technologies which enable the higher penetration of RESs with lower curtailment and the inclusion of prosumers to meet power consumption requirements with lower cost. With a transactive energy framework from planning, transactive energy control, which may utilize transactions as means to achieve specific control targets, could be implemented to perform distributed energy management [
15,
16]. Active defense considers the capability of an ADN in proactive strategies to safeguard operation under forecast errors, random faults, or malicious attacks.
Conventional microgrids have been widely studied as typical IoT (Internet of Things) systems [
17,
18]. With similar characteristics, ADNs composed of multiple VMs could also be considered as typical IoT systems. As shown in
Figure 1, IoT system design would be an important part in the cyber layer, which may support data and information for the upper intelligence of decision making. IoT-enabling technologies could enhance the system’s capabilities in active management and active defense significantly.
In most previous research, ADN is normally viewed wholly in the planning stage, without considering system partition. For example, in [
19], multi-level active planning is provided for RESs and energy storage systems (ESSs) using particle swamp optimization (PSO), considering cost, RES promotion, and reliability in the whole distribution network.
In [
20], the honey badger algorithm (HBA), a heuristic algorithm, was used to size the DGs optimally in IEEE’s 33-bus and 69-bus power distribution test bench systems to minimize power losses. However, only a single DG is sized and allocated (i.e., at bus 61 for the IEEE 69 system). This methodology is not suitable for accommodating DERs in a modern ADN.
In [
21], DGs and capacitor banks (CBs) are sized and allocated based on single-level GA optimization to reduce losses and to improve the voltage profile. In this paper, the evaluation of a GA chromosome only utilized voltage levels and transformer core impedance to calculate the losses, without considering the network’s topology and distribution line losses.
In [
22], similar to a GA, a multi-objective evolutionary algorithm is proposed for optimizing the sites and sizes of DGs. The algorithm itself provides good results for conflicting objective functions with global optimal values, with a small DG size. However, the optimization objectives are given by assuming constant loads and in a case study of fixed operating cases for DGs, which is likely not to be the real management scenario.
Since VMs provide an applicable and self-sufficient solution in building cohesive ADNs, this paper focuses on planning augmented ADNs using multiple interconnected VMs with self-sufficiency and cohesion in each of them. The notions of self-sufficiency and cohesion will be explained in the next two sections.
2.2. VM Self-Sufficiency
Previously, quantified self-sufficiency was normally limited to static power balance. Self-sufficiency, together with similar concepts including self-adequacy, autonomous ability, and supply adequacy, was generally defined as a system’s ability to continue working under a power balance discrepancy. These concepts are fundamentals for building VMs focusing on power supply adequacy with ideal operation conditions, such as perfect forecast without impacts from uncertainties. In [
6,
23], autonomy and supply-sufficiency are constraints in optimization, without explicit quantification. In [
8], self-sufficiency is measured by its total power exchange with other microgrid. In [
7], power exchange and microgrid internal power balance are both considered and quantified.
However, our proposed meaning of self-sufficiency shall be two-fold. This definition covers both active management and active defense in building ADN. First, the system needs to support enough critical loads with enough power generation capacity, which follows the above-mentioned meaning. Second, the system should also have enough flexibility resources installed to locally balance potential uncertainties. Only considering the traditional first aspect, i.e., power supply and demand balance, is not adequate, because with a large RES and relatively small reserve setting, the forecast error of wind or solar power and loads may lead to potential and indeterministic power imbalance, insufficient ramp rate, and energy gap. This is critical not only for active management, which intends to maintain flexible operations without support from the main grid, but also for active defense to guarantee secure independent islanding operation in response to faults or attacks.
2.3. VM Cohesion
VMs could be viewed as subsystems which may support ADNs with flexible operation in management and independent survivability in defense. However, very few works have considered the sources where these characteristics are from. In this paper, we propose a new concept of ‘cohesion’ as a critical feature which may be positively corelated to VM independence.
For a network
, the cohesion as a feature is intuitional in analyzing partition. A subnetwork
is defined as cohesive, respective to cohesive feature mapping
, if and only if the following is true:
where
is a subnetwork of the whole network
.
is the partitioned subnetworks set.
is a function to evaluate the performance of a network. That means that a subnetwork is cohesive if its performance evaluated by a specific metric is higher than the average performance of the entire network.
Thus, the cohesion intensity (CI) of network
with subsystem
could be defined as
where
is the number of subsystems under
, and
is the averaged cohesion intensity of each subsystem’s cohesion function
.
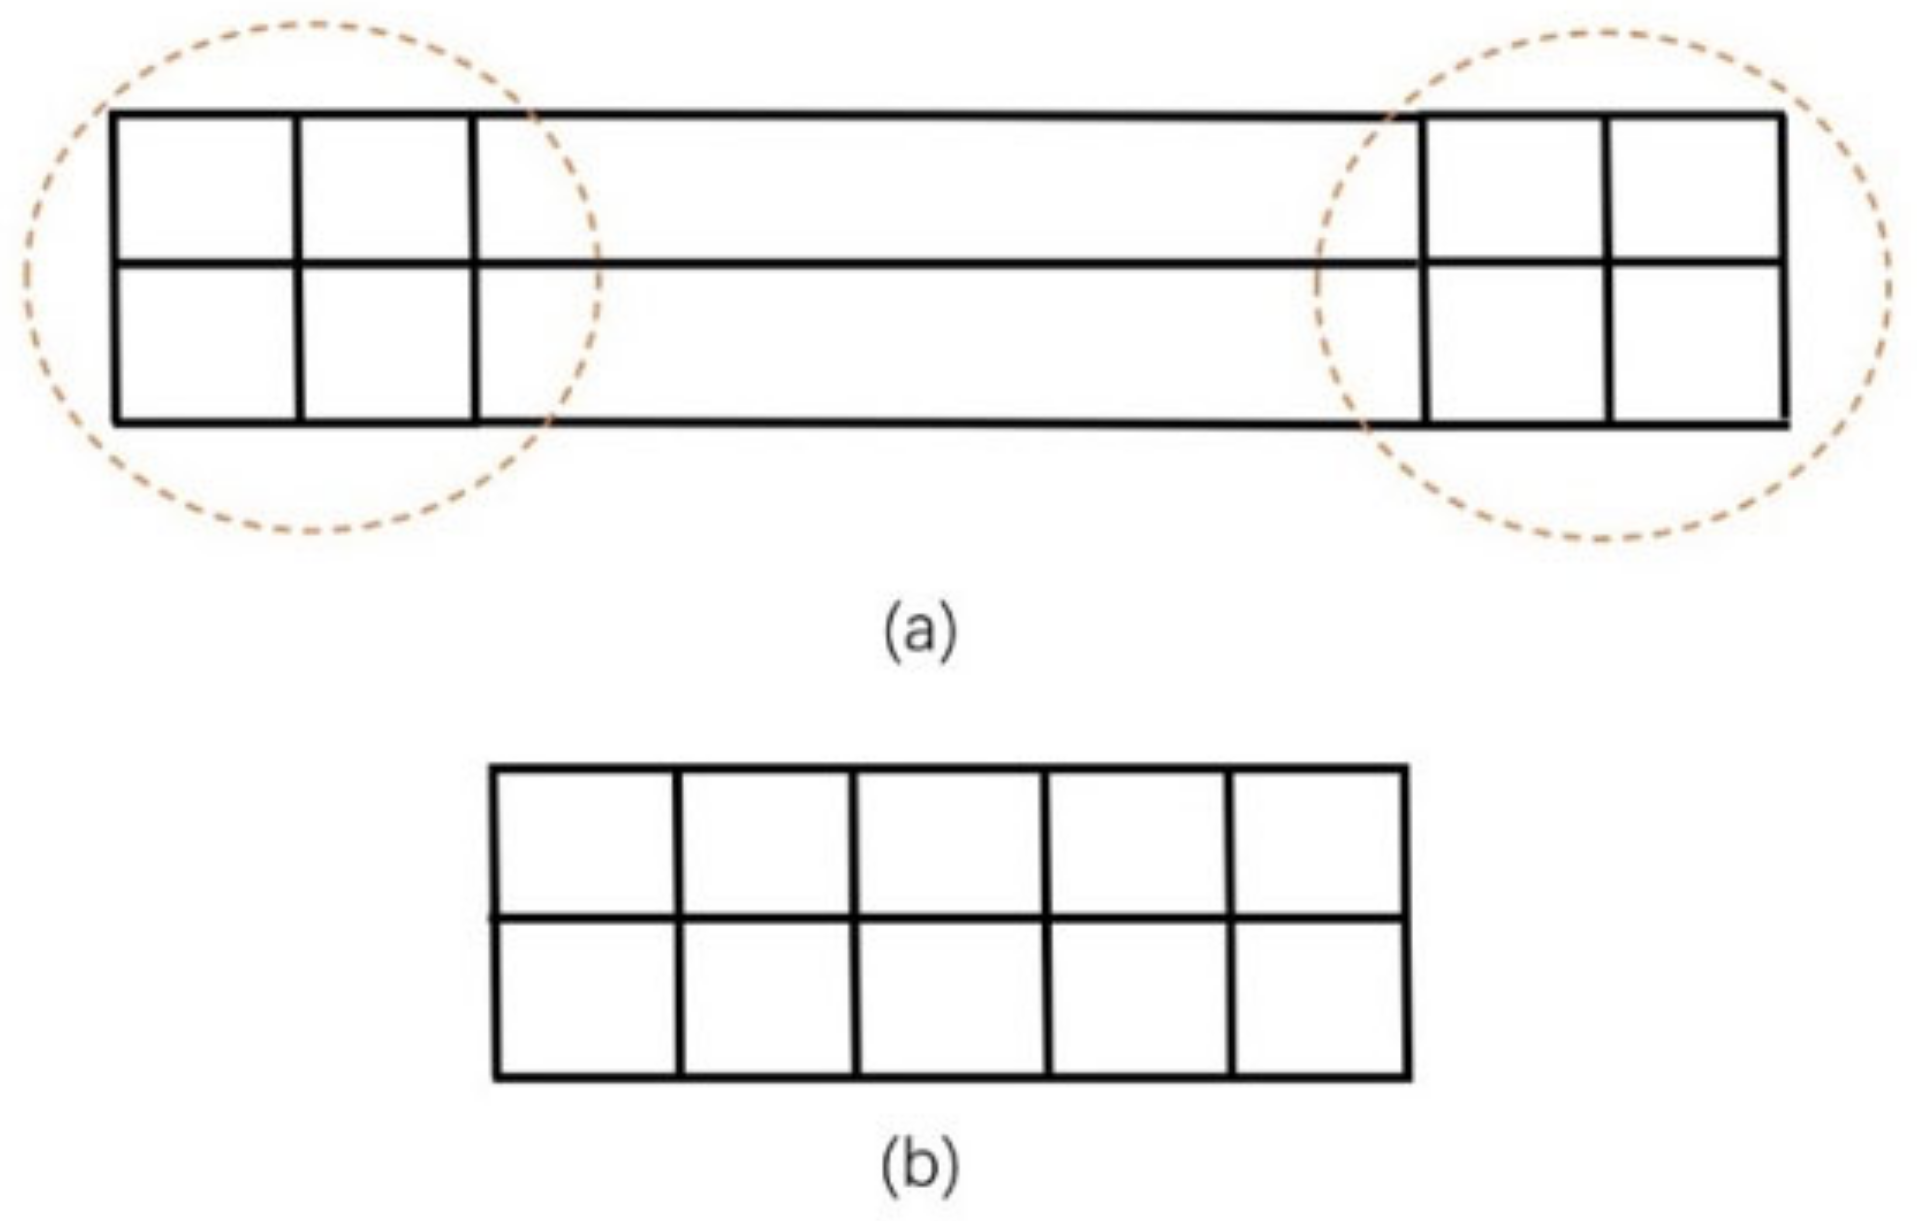
The cohesive nature of the subsystem is illustrated in
Figure 2. In case (a), if the network performance is evaluated by efficiency (reciprocal of distance) [
24] between vertices, two partitioned subnetworks are obviously more cohesive than the average performance of the whole network, as the mean distance of the circled part is visually smaller than the whole system.
In case (b), with even distance distribution, the network has much fewer cohesive characteristics. No matter the partition method, the average distance is the same with the whole system; thus, the cohesion intensity of any partition is smaller than case (a). With more factors in the definition of performance metrics, this concept is extended to include more engineering considerations and not only distance in our research.
2.4. Net-Ability
As shown in the definition of VM cohesion, an index f to evaluate the performance of a network is needed. Net-ability could be a possible solution for power grids. Net-ability derives from graph efficiency. In complex network theory, the global efficiency of a network graph is defined by the averaged reciprocal of geodesic distances, i.e., the shortest path, between nodes [
24], as follows:
where
is total number of nodes, and
denotes the geodesic distance between node
and node
in graph
. If the averaged value of the reciprocal of the shortest path length is higher, then intuitively, the communication between nodes will be more efficient.
After applying this definition in power networks, S. Arianos et al. [
25] proposed the idea of net-ability (NA) as
where
is the
row and
column element of the impedance matrix [
26], and
is defined as the equivalent impedance. Given a line flow limit,
is the equivalent transfer capacity from bus
to
, which is the maximum power transmitted from
to j, following power flow constraints.
and
are the numbers of generations and load buses, respectively.
In this definition, the geodesic distance is replaced by transfer capacity over impedance, indicating the “difficulty” of power transmission between node and . If of a certain path is higher, the corresponding branches of the path are viewed as possessing more aptitude in power transmission.
Contrary to , which is the number of all possible connection pairs between nodes, is the number of all electrical pairs between generators and loads.
2.5. VM, VPP, and Conventional Microgrids
In this paper, a virtual microgrid is defined as a virtually partitioned grid in which the nodes’ clustering represents better cohesion than a whole ADN, and in each cluster, optimal planning, management, and defense capabilities are improved in comparison to viewing an ADN as a whole. Previous research on VMs has not clarified the relationship between similar concepts, including virtual power plant (VPP) and conventional microgrids (CM). These three technologies are all to deal with challenges from integration of DERs based on aggregation, but the methods and operational scenarios are different.
Compared with VPP, VM and CM can work in both islanding mode and grid-connected mode. VPP has no emphasis on the spatial boundary of aggregated resources. Another difference would be that VPP has more consideration in the active management and control strategy but fewer considerations in active defense capability than VM.
Conventional microgrid (CM), on the other hand, requires a total physical reconstruction of the CDN, while VM is only partitioned based on existing grid structure. Compared with CM, VM may have better topological scalability due to flexible partitions with dynamic borders. The construction and configuration of VMs could be dynamically adjusted in accordance with the development process from CDNs to ADNs, and even further.
4. Active Planning of Virtual Microgrid
The goal of the active planning of ADN is to enhance active management and active defense capability via optimized locations, capacities, and types of DG and DESS. The active management level is represented by the following:
Optimized operational cost.
Self-sufficiency in local power supply of VMs represented by minimized boundary power flow.
Sufficient flexibility sources to cope with uncertainty in grid-connected mode.
The active defense capability is related to,
Maintaining VMs’ critical load in augmented islanding mode, represented by VMs’ capacity fitness.
Sufficient local flexibility sources in islanding mode to maintain stable operation.
Cohesive structure of VMs for optimal operating efficiency in islanding mode and robustness in restoration.
4.1. Bi-Level Optimization Model
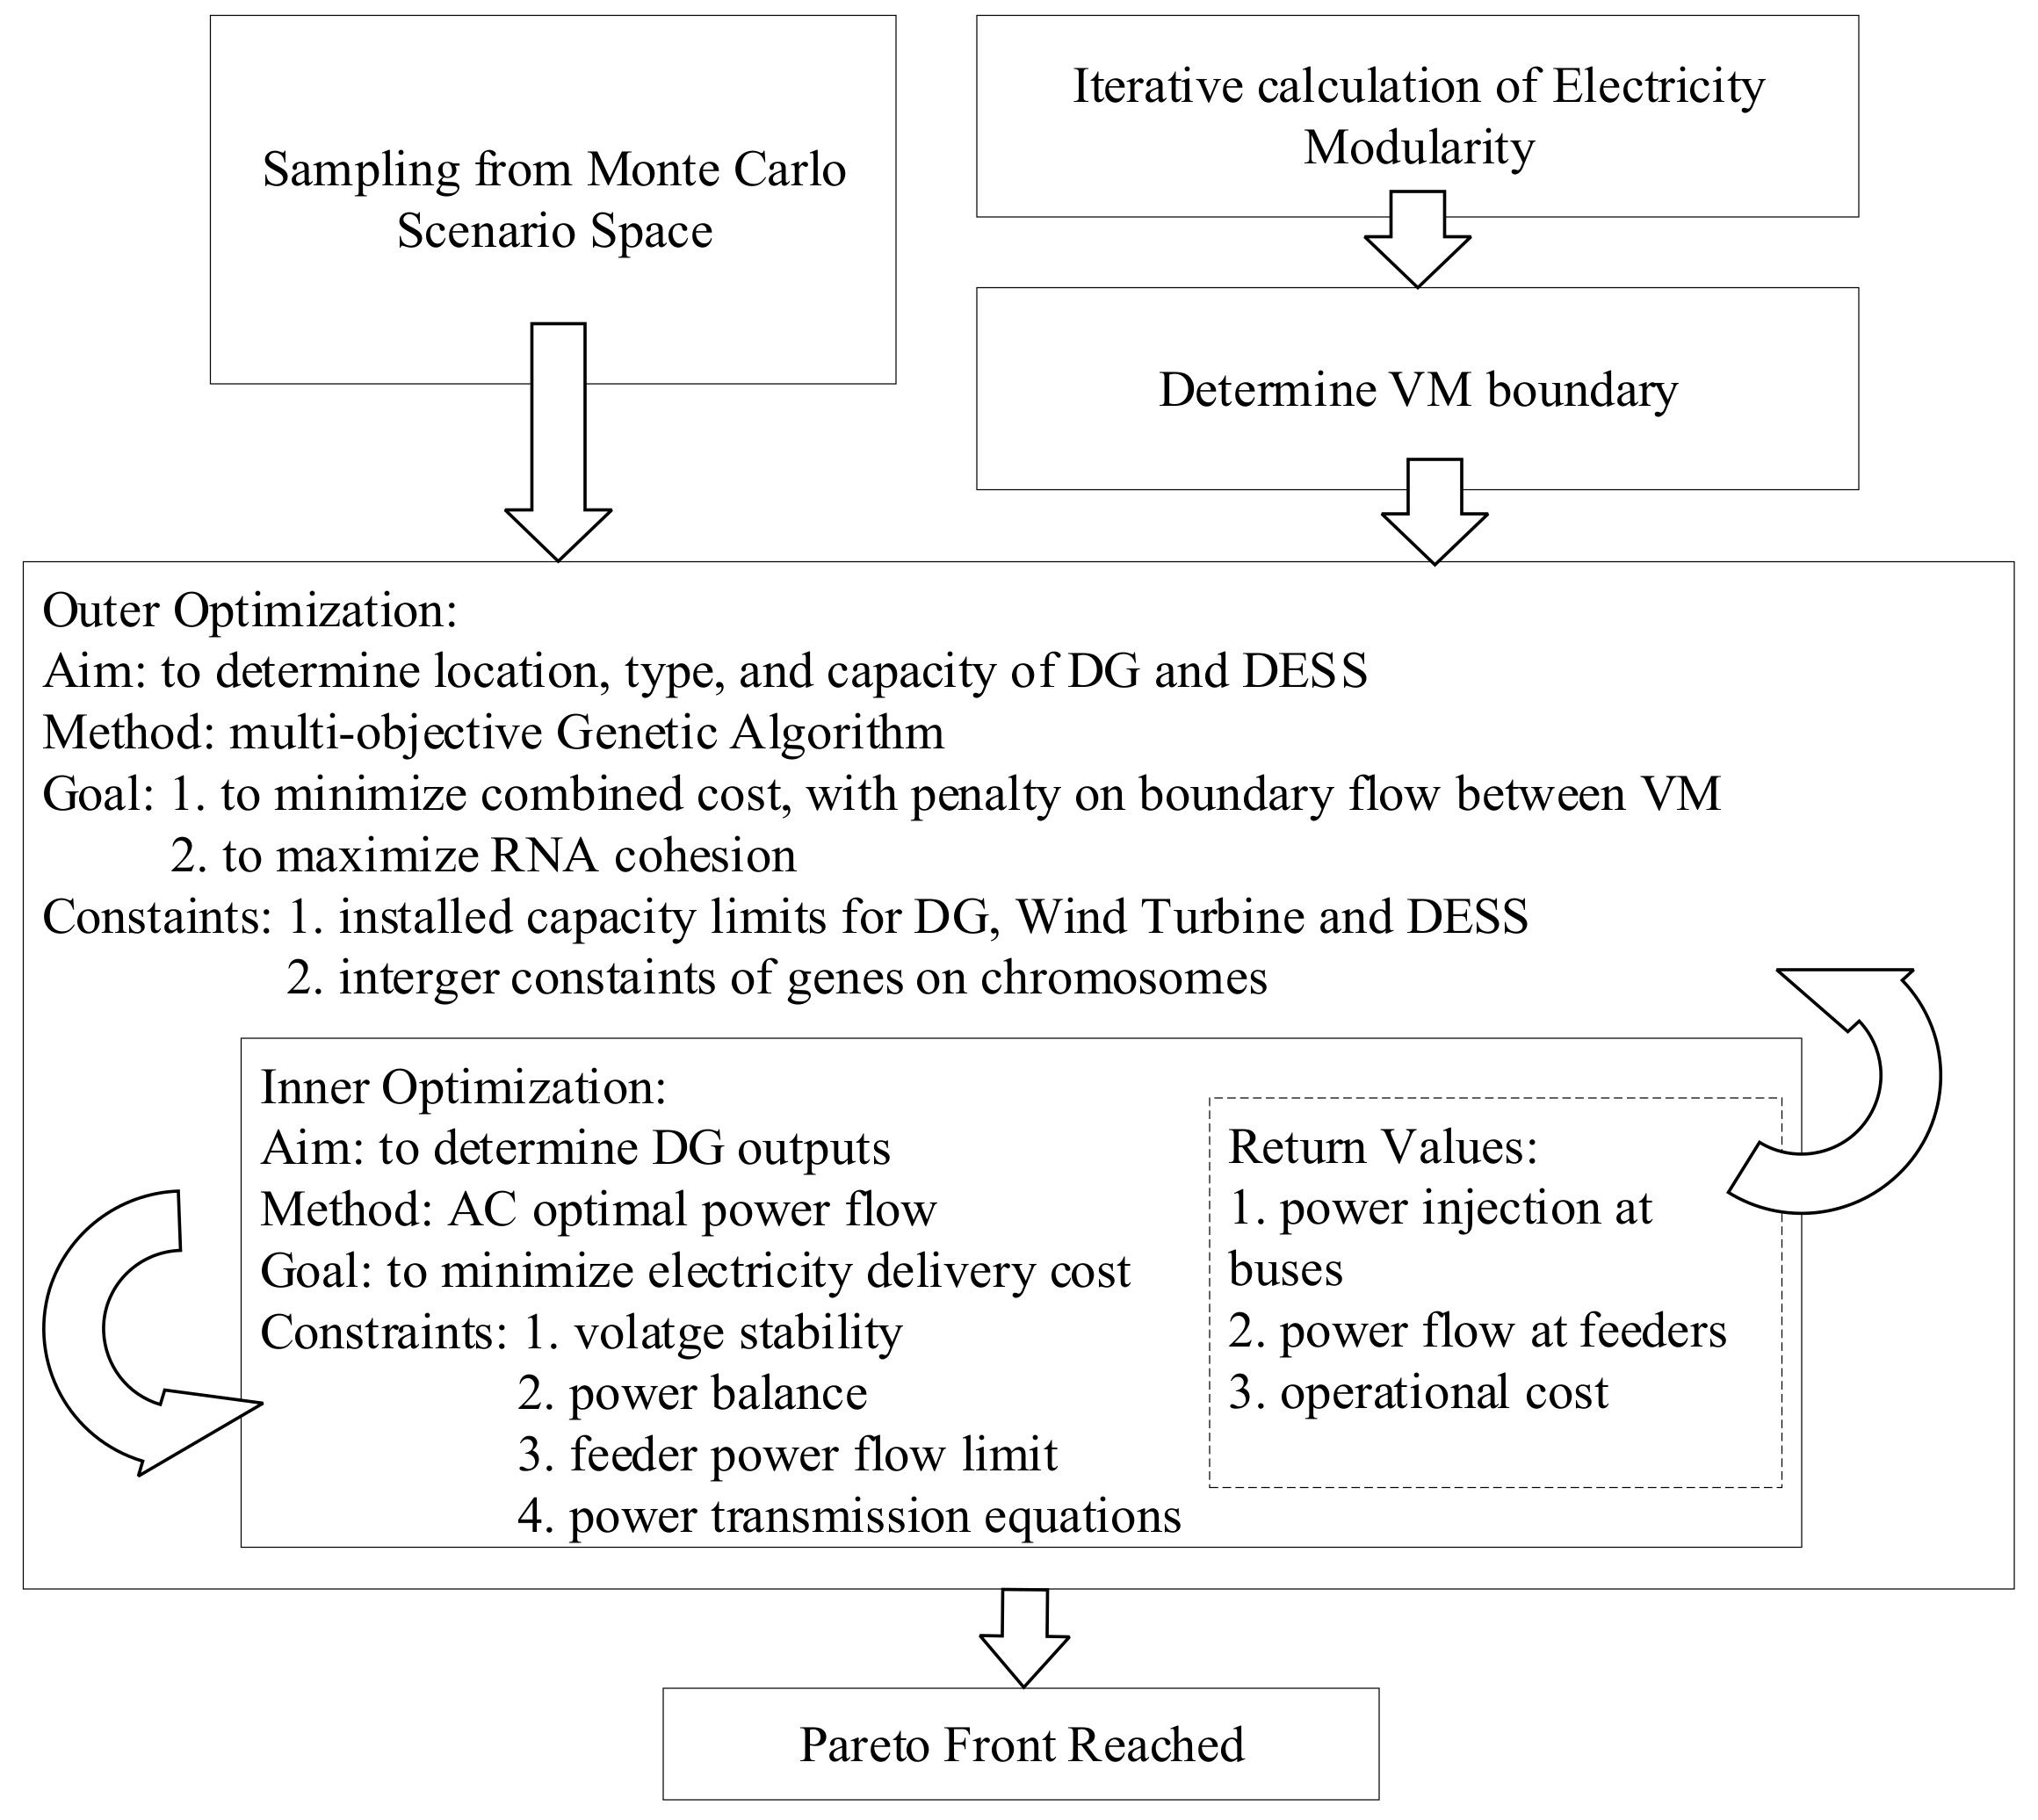
Our proposed bi-level, mixed-integer, multi-objective optimization is illustrated in
Figure 4 below. The VM partition method is based on an improved Newman algorithm [
5,
35], in which electrical modularity (EM) weighted by electrical coupling strength (ECS) is calculated iteratively for all merging cases, and the number of VMs is decreased from the initial maximum number of
to 1. By giving the desired range of VMs, the partition method with the maximum EM can be selected.
Two objective functions are construed for outer optimization. The first objective is operational cost and boundary flow penalty cost. The boundary line flow between adjacent VMs is penalized by the corresponding line shadow cost, which is the marginal cost per unit of all DGs, explained in [
36]. The second goal is RNA cohesion, denoting a beneficial system augmentation.
Decision variables in this objective function denote DGs’ and DESSs’ locations, types, and capacities. The locations of DGs refers to their connected buses. The types of DGs include dispatchable DGs and non-dispatchable DGs. Dispatchable DGs are power sources of which generation can be controlled, including gas turbines, biomass generators, etc. Non-dispatchable DGs refer to rigid power generation, with little variability. In this ADN planning, wind power and solar photovoltaic panels are regarded as non-dispatchable for critical load balancing. The capacity of DGs is defined as the maximum power generation.
As mentioned above, the first objective of outer optimization is the total cost, given by (22)
where
denotes the generation cost function, with respect to active power generation by the
DG.
is the GA chromosome consisting of DG and DESS configuration, which is the decision variable in the GA.
represents the power flow between node
and node
that are boundary nodes of VMs in node set
.
is the shadow cost which is used as the penalty cost for boundary flow. The sum of operational cost and penalty cost are averaged via Monte Carlo scenario space
. In MCS, the iteration number is
, and the combined sampling space is the tensor product of load situation distribution and wind speed distribution.
The second goal of outer optimization is the cohesion of RNA, shown in (23). The difference between the RNA of VMs and that of the whole ADN denotes the potential autonomous ability gain. FSI denotes the flexibility resources’ relative amount with respect to system uncertainty in wind power and loads. To summarize, the cohesive feature is the
difference between individual VMs and the total distribution network, which is the optimization goal.
In (23), denotes the revised net-ability of VM and is the RNA of the whole ADN. is the number of VM partitions, i.e., number of elements in VM set .
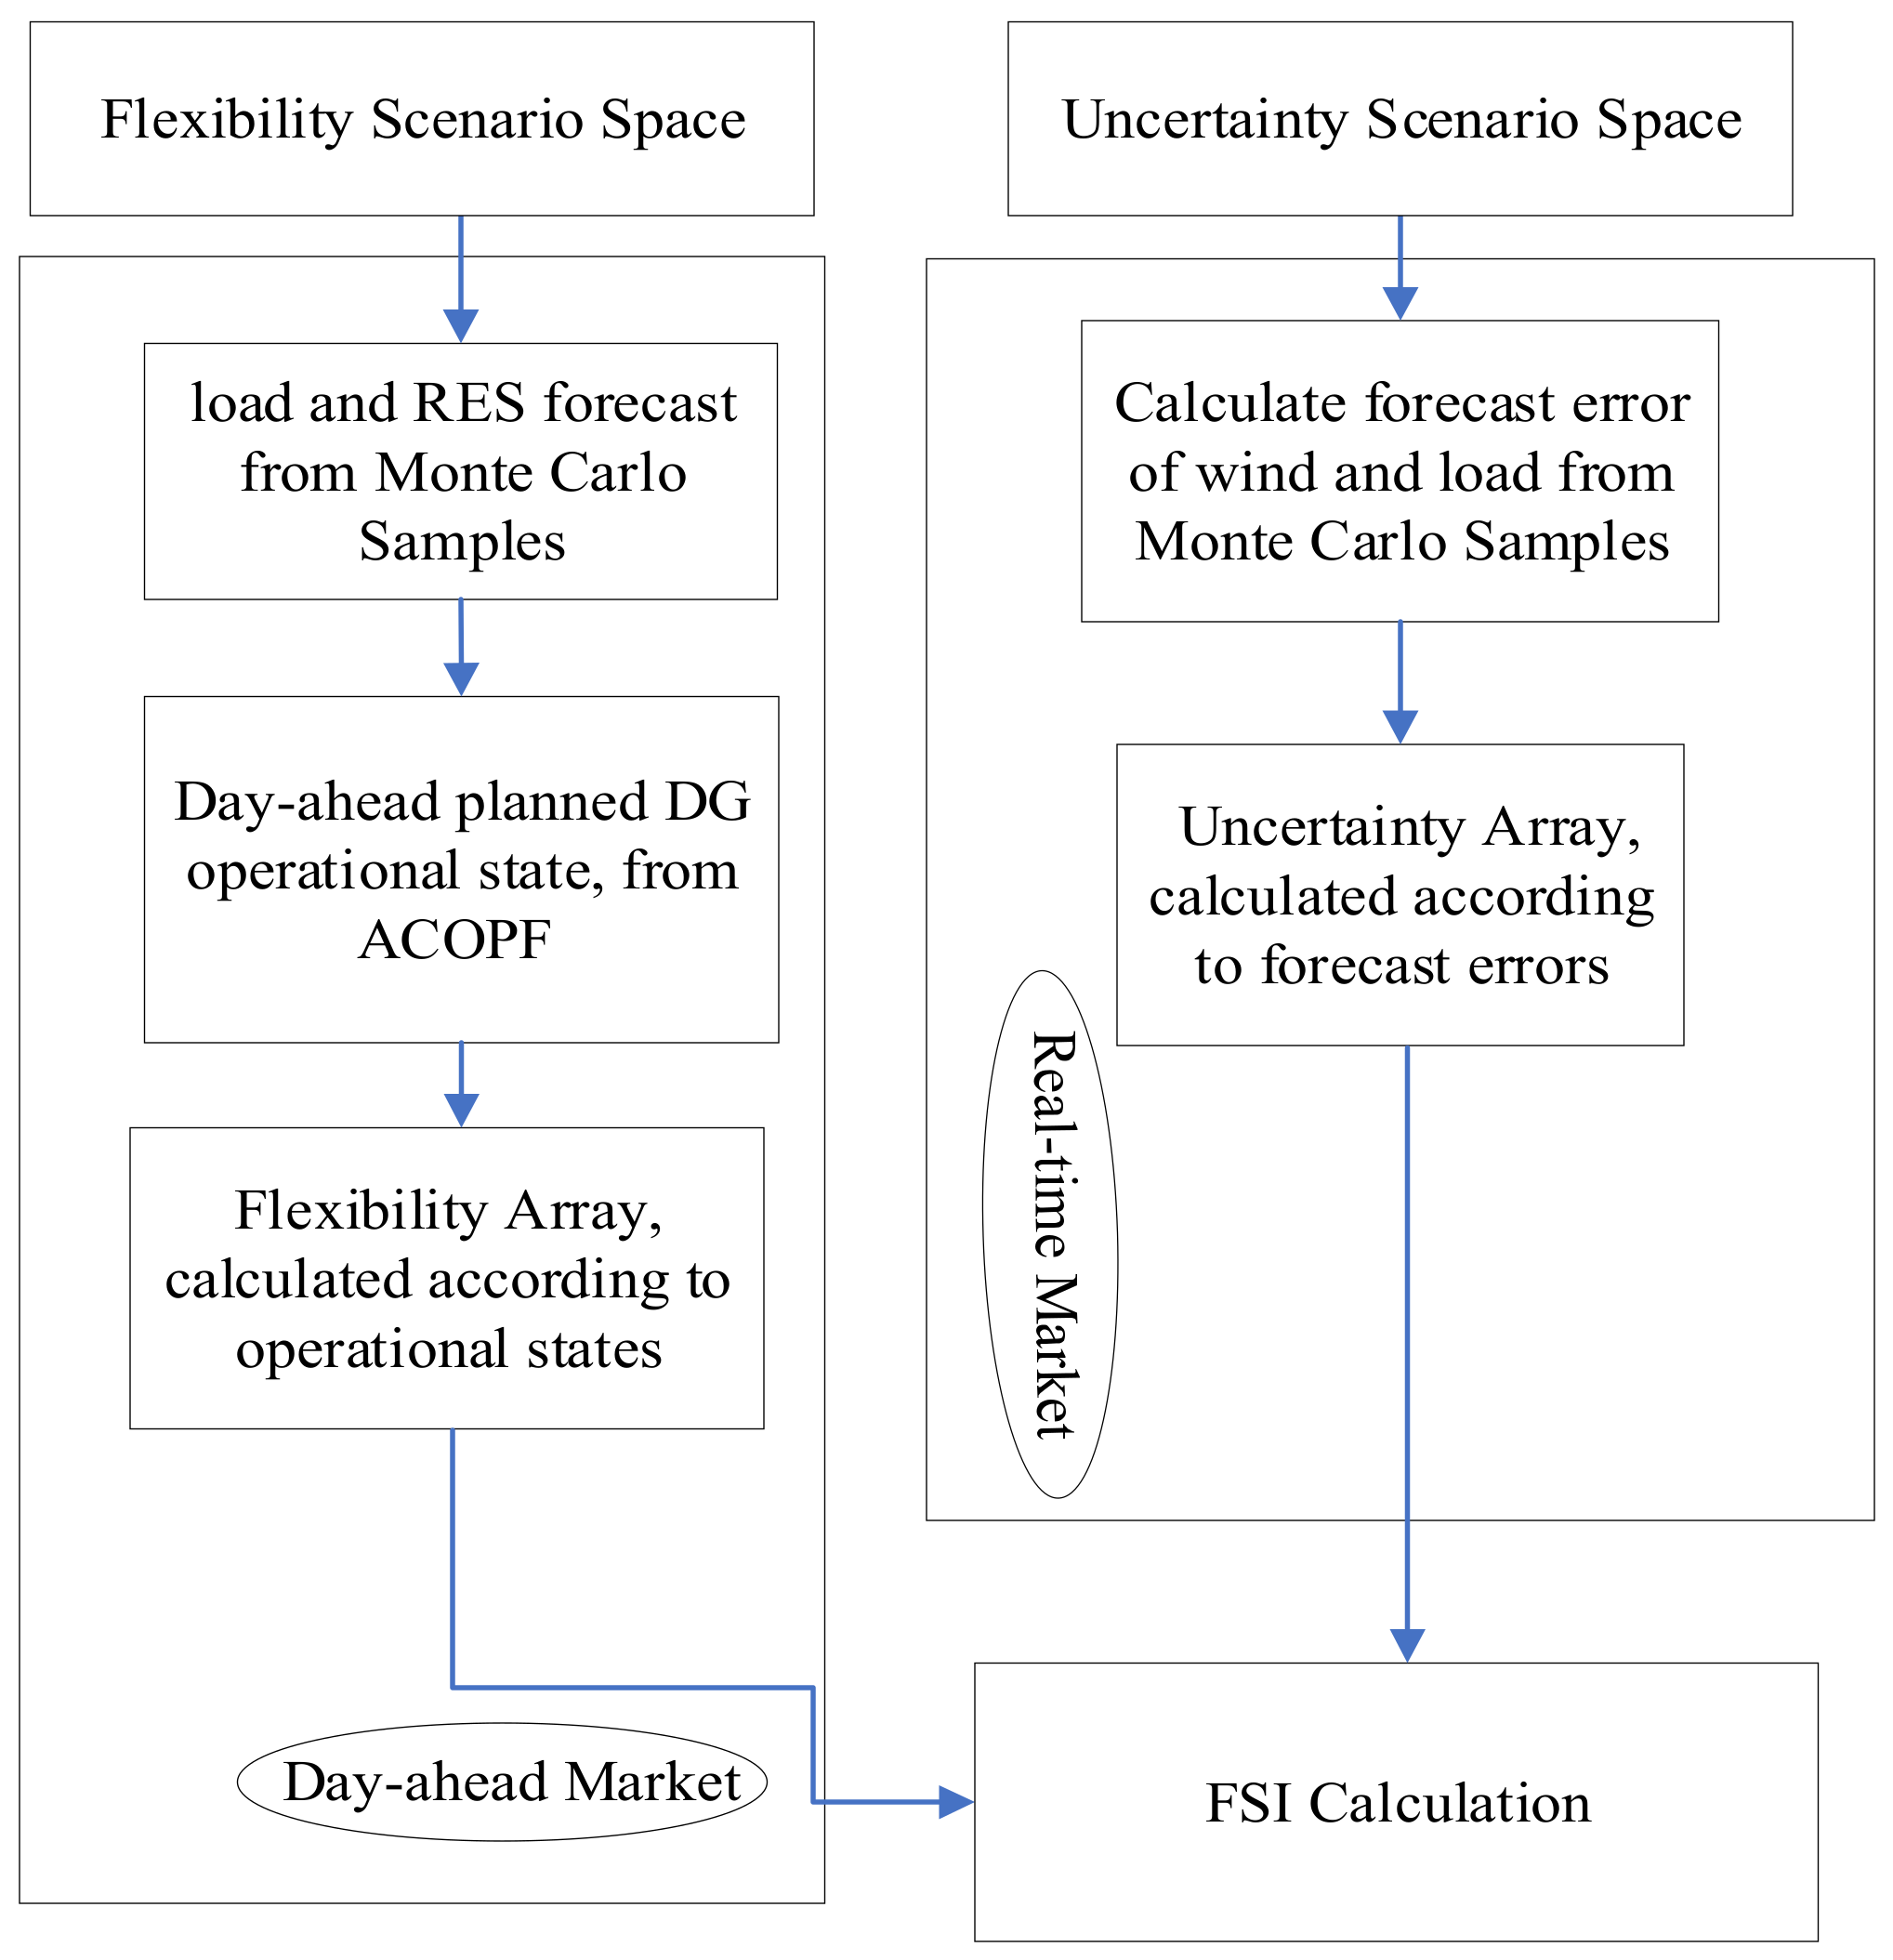
The inner optimization is AC-OPF, yielding the optimized operational cost and the corresponding DG active power output. Note that the Monte Carlo scenario space in
Figure 4 refers to the sampling of wind speed, load, and forecast errors in
Figure 3.
4.2. Constraints
In multi-objective GA optimization, inequality constraints include total installed capacity limits in both DG and DESS due to the limitation of investment in engineering practice.
In each VM, critical load should always be supplied.
where
is the critical load percentage,
is the total installed capacity in the
VM, and
is the total load in the
VM.
Another constraint regards FSI. To ensure that each VM has adequate flexibility resources, a lower boundary is added in each VM’s FSI, as follows:
in which
is the FSI limit constant for the
VM.
To ensure enough renewable energy penetration in each VM, the minimal wind turbine capacity is defined.
is the wind turbine installed capacity in VM , and is the lower bound.
In the outer layer GA, each element on the chromosome is an integer depicting DG and DESS configuration, which will be explained in
Section 3. Integer constraints are the non-convex optimization constraints.
The constraints of inner optimization include the power flow balance equation, power transfer equation constraints, voltage stability constraints, and line flow thermal constraints.
In these constraints, is the generator’s output on the bus, is the load installed on the bus, and is the thermal loss on the feeder in branch set . Equations (30) and (31) are the power transfer equations, in which and are the active and reactive power injected into the bus. and are the real and imaginary parts of the admittance matrix. is the phasor angle difference between bus and bus . is the bus voltage, and is the active power flow from bus to bus .
4.3. Implementation
The outer optimization is implemented by GA through the function gamultiobj in the Global Optimization Toolbox in MATLAB, which starts from an initial population and then individual chromosomes crossover and mutate, until GA’s fitness evaluation converges or the iteration number reaches its limit.
The chromosome has two parts with the same length conjugated, and each part has a length equivalent to the number of buses in the ADN, representing the locations of the DG and DESS. Each element has values representing the tensor product of configurations of the DG and DESS.
The generation function, mutation function, and crossover function in GA are customized for mixed-integer programming. Two fitness functions consist of two optimization goals to be optimized.
The inner optimization is AC-OPF nested in fitness functions of GA, which is solved using the MATPOWER 7.0 package in MATLAB. Wind and load sampling space are simulated by the Weibull distribution and load data from [
37].The averaged objective is then given by MCS.
5. Case Study
A case study is based on the PG&E 69-bus system with branch configuration from [
38]. The coding environment is MATLAB R2022a (x86) installed on a workstation with an Intel Core i9-10920X CPU and 32 GB memory. The total running time is 54 h 12 min.
5.1. System Modelling
Wind speed is simulated by the Weibull distribution, given by
over four seasons. Weibull parameters are given in
Table 3.
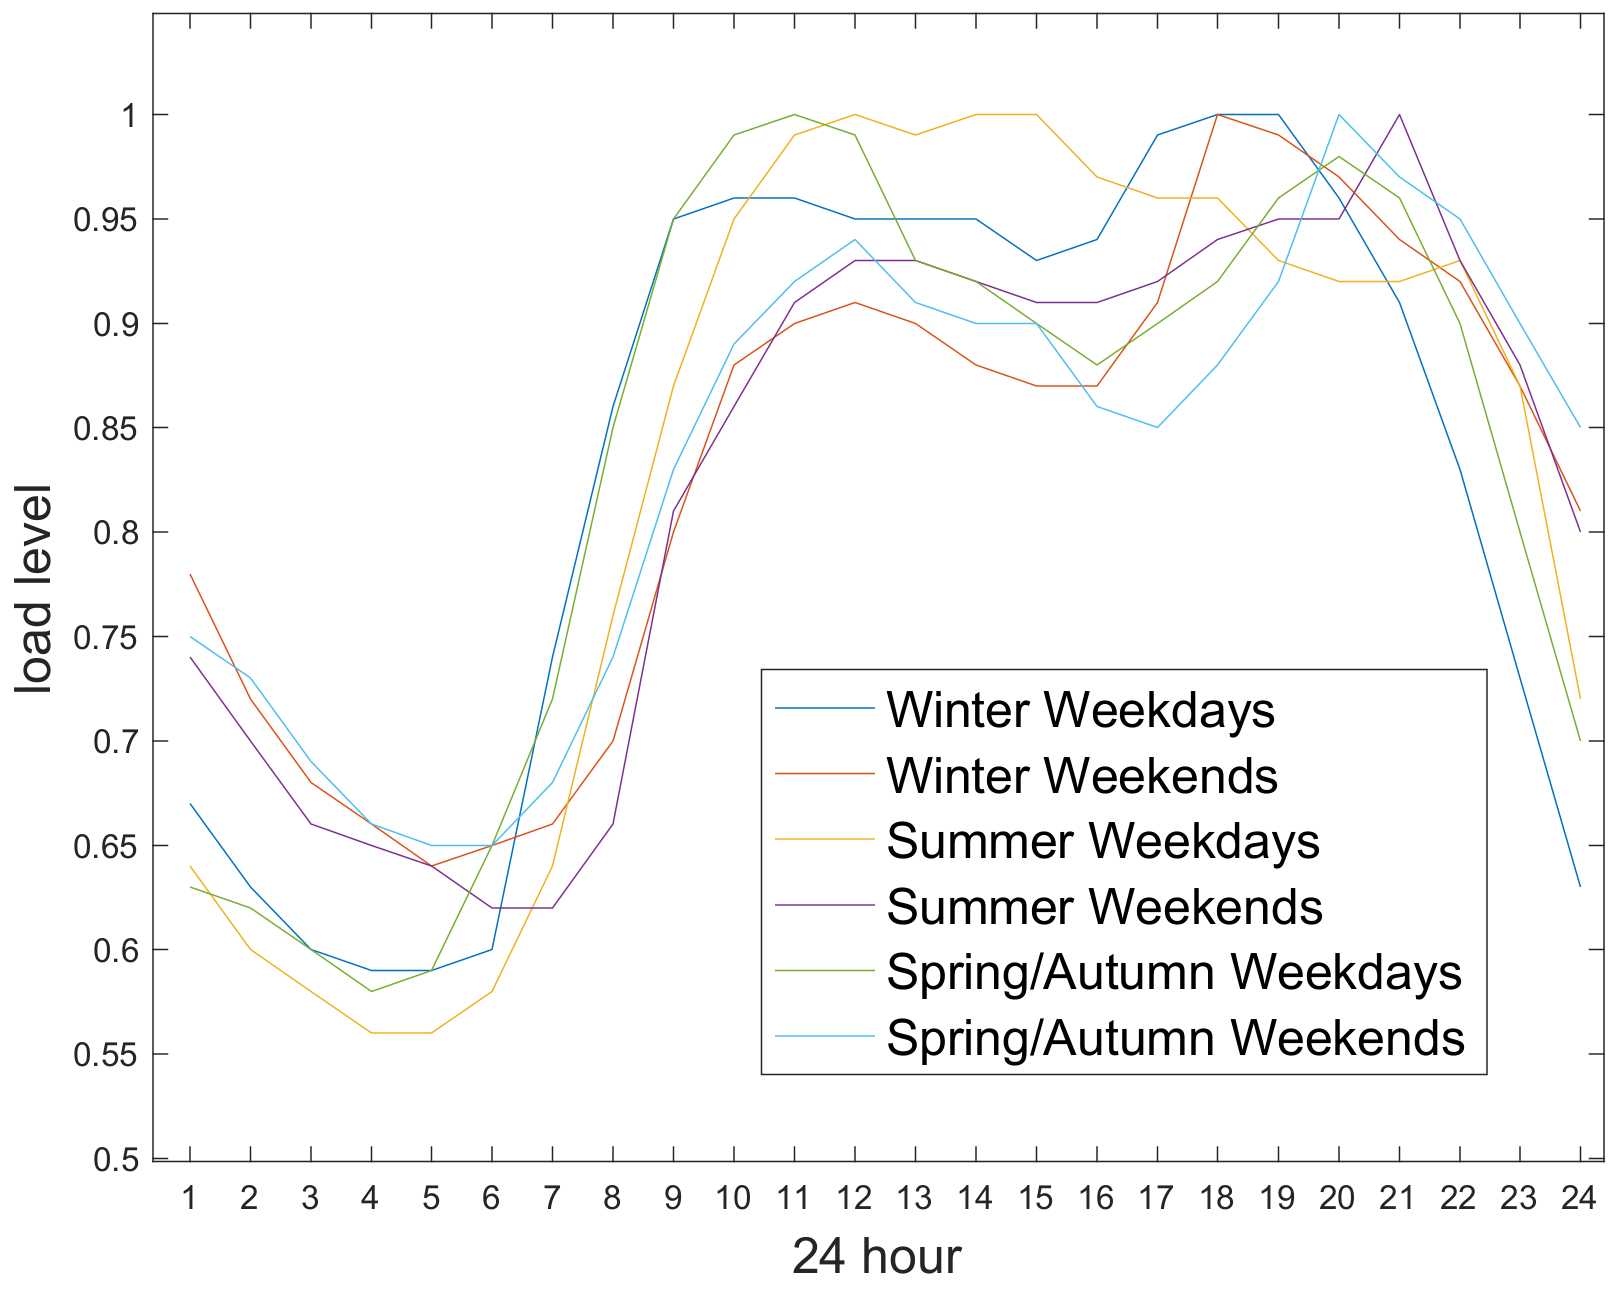
Load distribution is further categorized into 8 groups, which include weekdays and weekends in spring, summer, autumn, and winter, with the load profile provided in the IEEE Reliability Test System [
37]. The detailed load data and figure are shown in
Appendix A.
Four levels (50 kW, 100 kW, 150 kW, 200 kW) of the DG’s installed capacity and two types (both dispatchable and non-dispatchable) are considered in our case. The energy storage system is considered to have rated charging and discharging power of 50 kW, and the maximum storage is 120 kWh. The maximum SoC in operation is 95%, and the minimum SoC is 5%. The maximum adjustable demand in controllable loads is set as 10% of loads on corresponding buses. Both upwards and downwards ramp rates of DGs are regarded as 10% of rated power per min. The power output of the DESS is fast enough to reach rated power within 1 min; thus, the averaged ramp rate is 50 kW/min in this case. The initial values of the DESS SoC are set as 50%.
5.2. DG and DESS Configuration
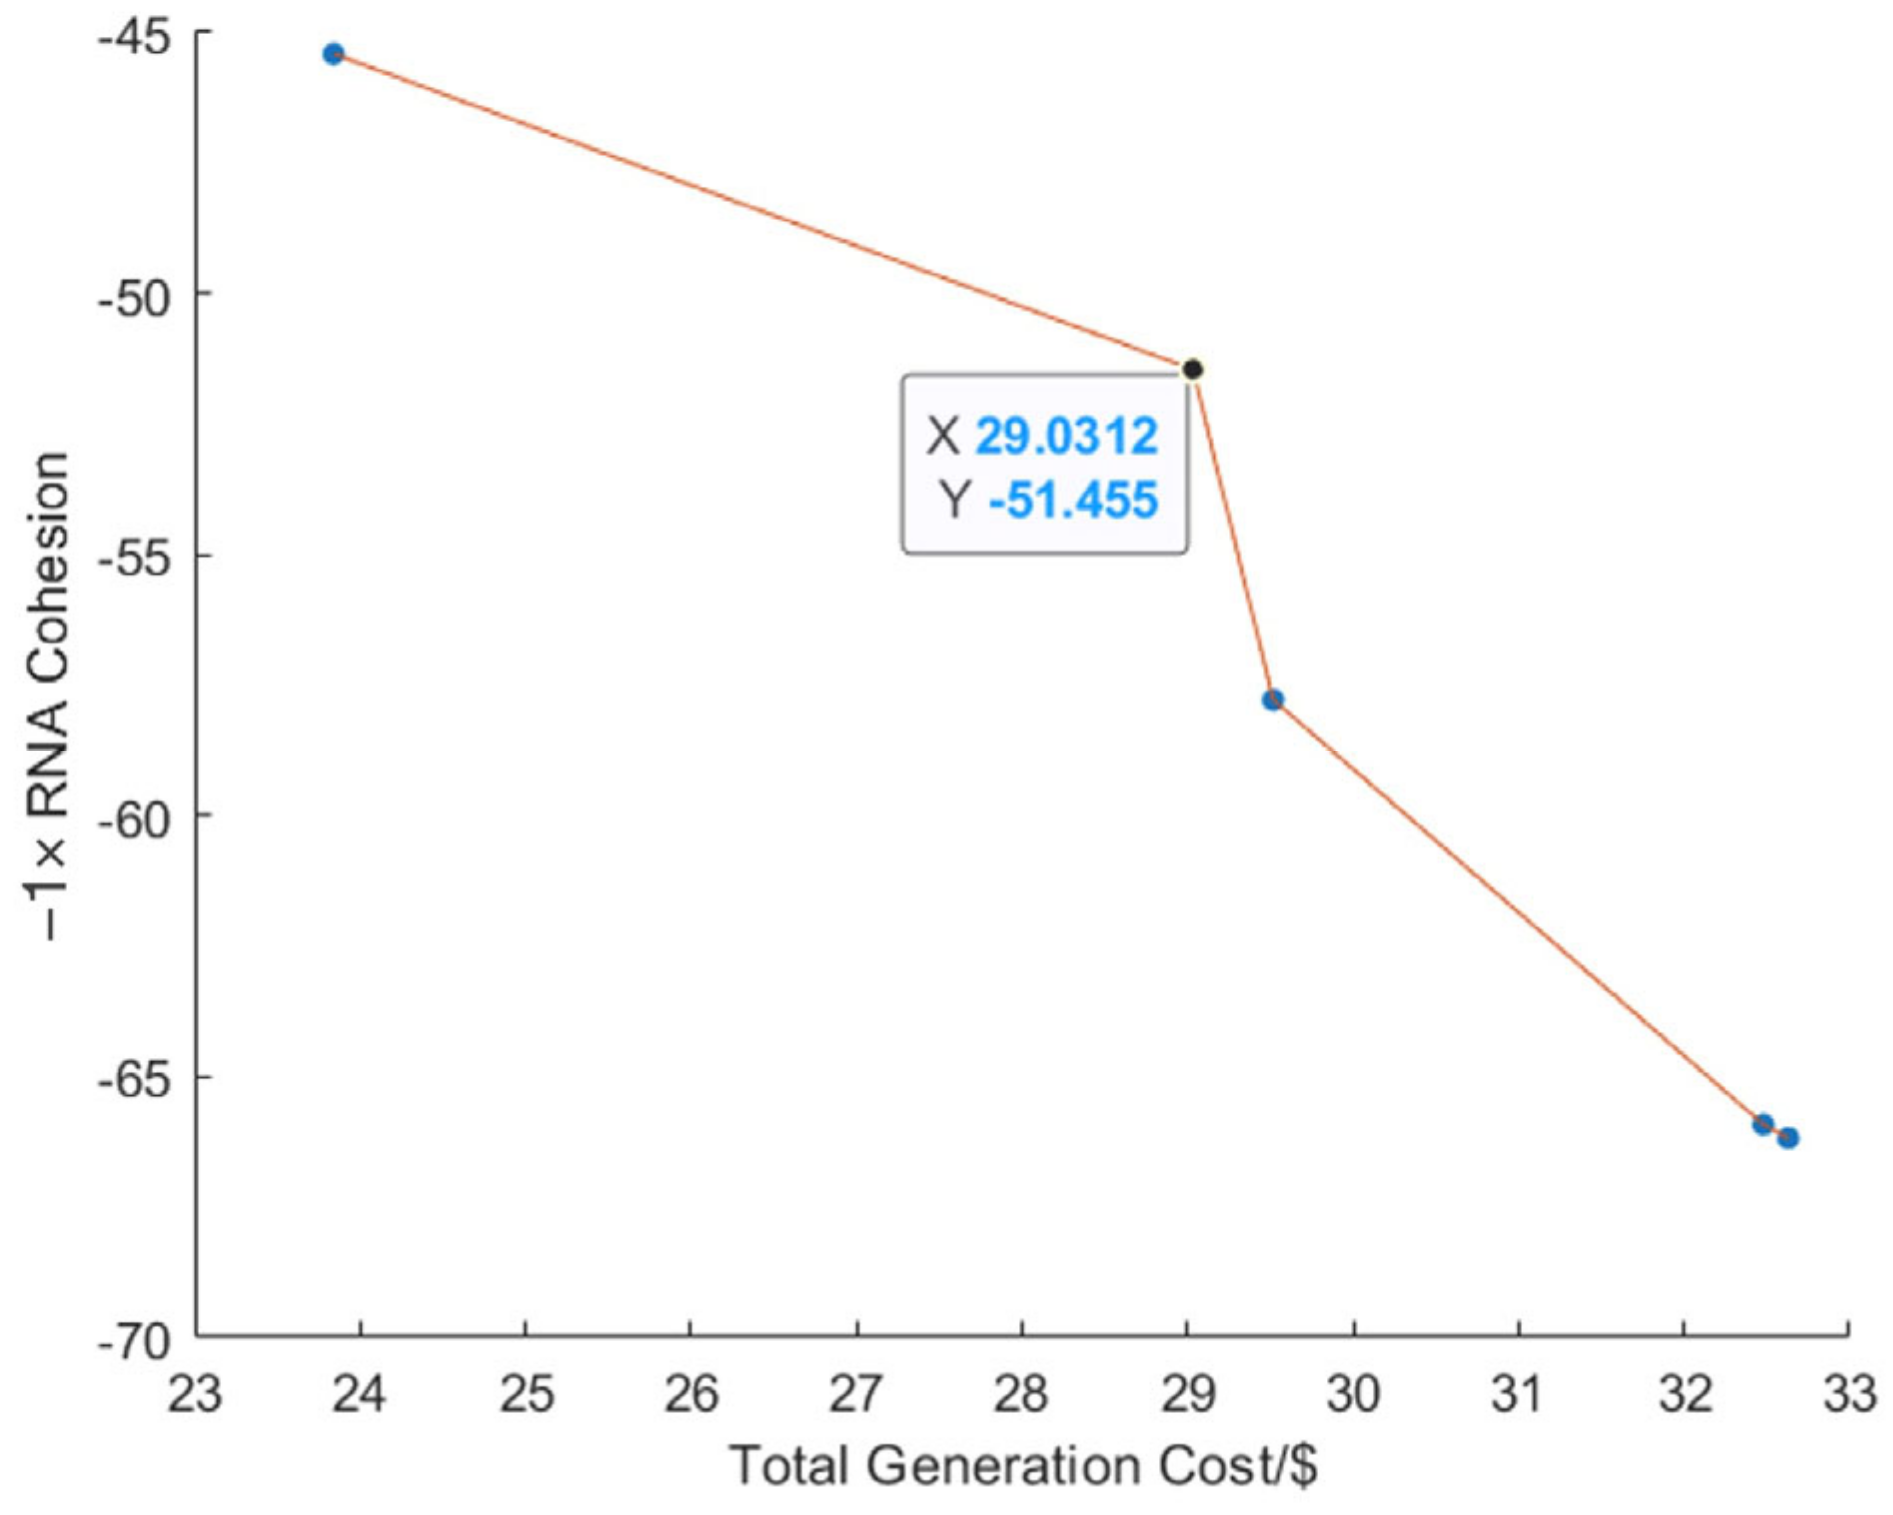
The optimization result when the total installed capacity is capped at 4 MW is presented by the Pareto Front shown in
Figure 5. The knee point, i.e., the point with maximum marginal utilities, is specified. Note that the negative values on the y-axis result from the minimalization of −1 × RNA cohesion. The configurations of the DG and DESS are given by
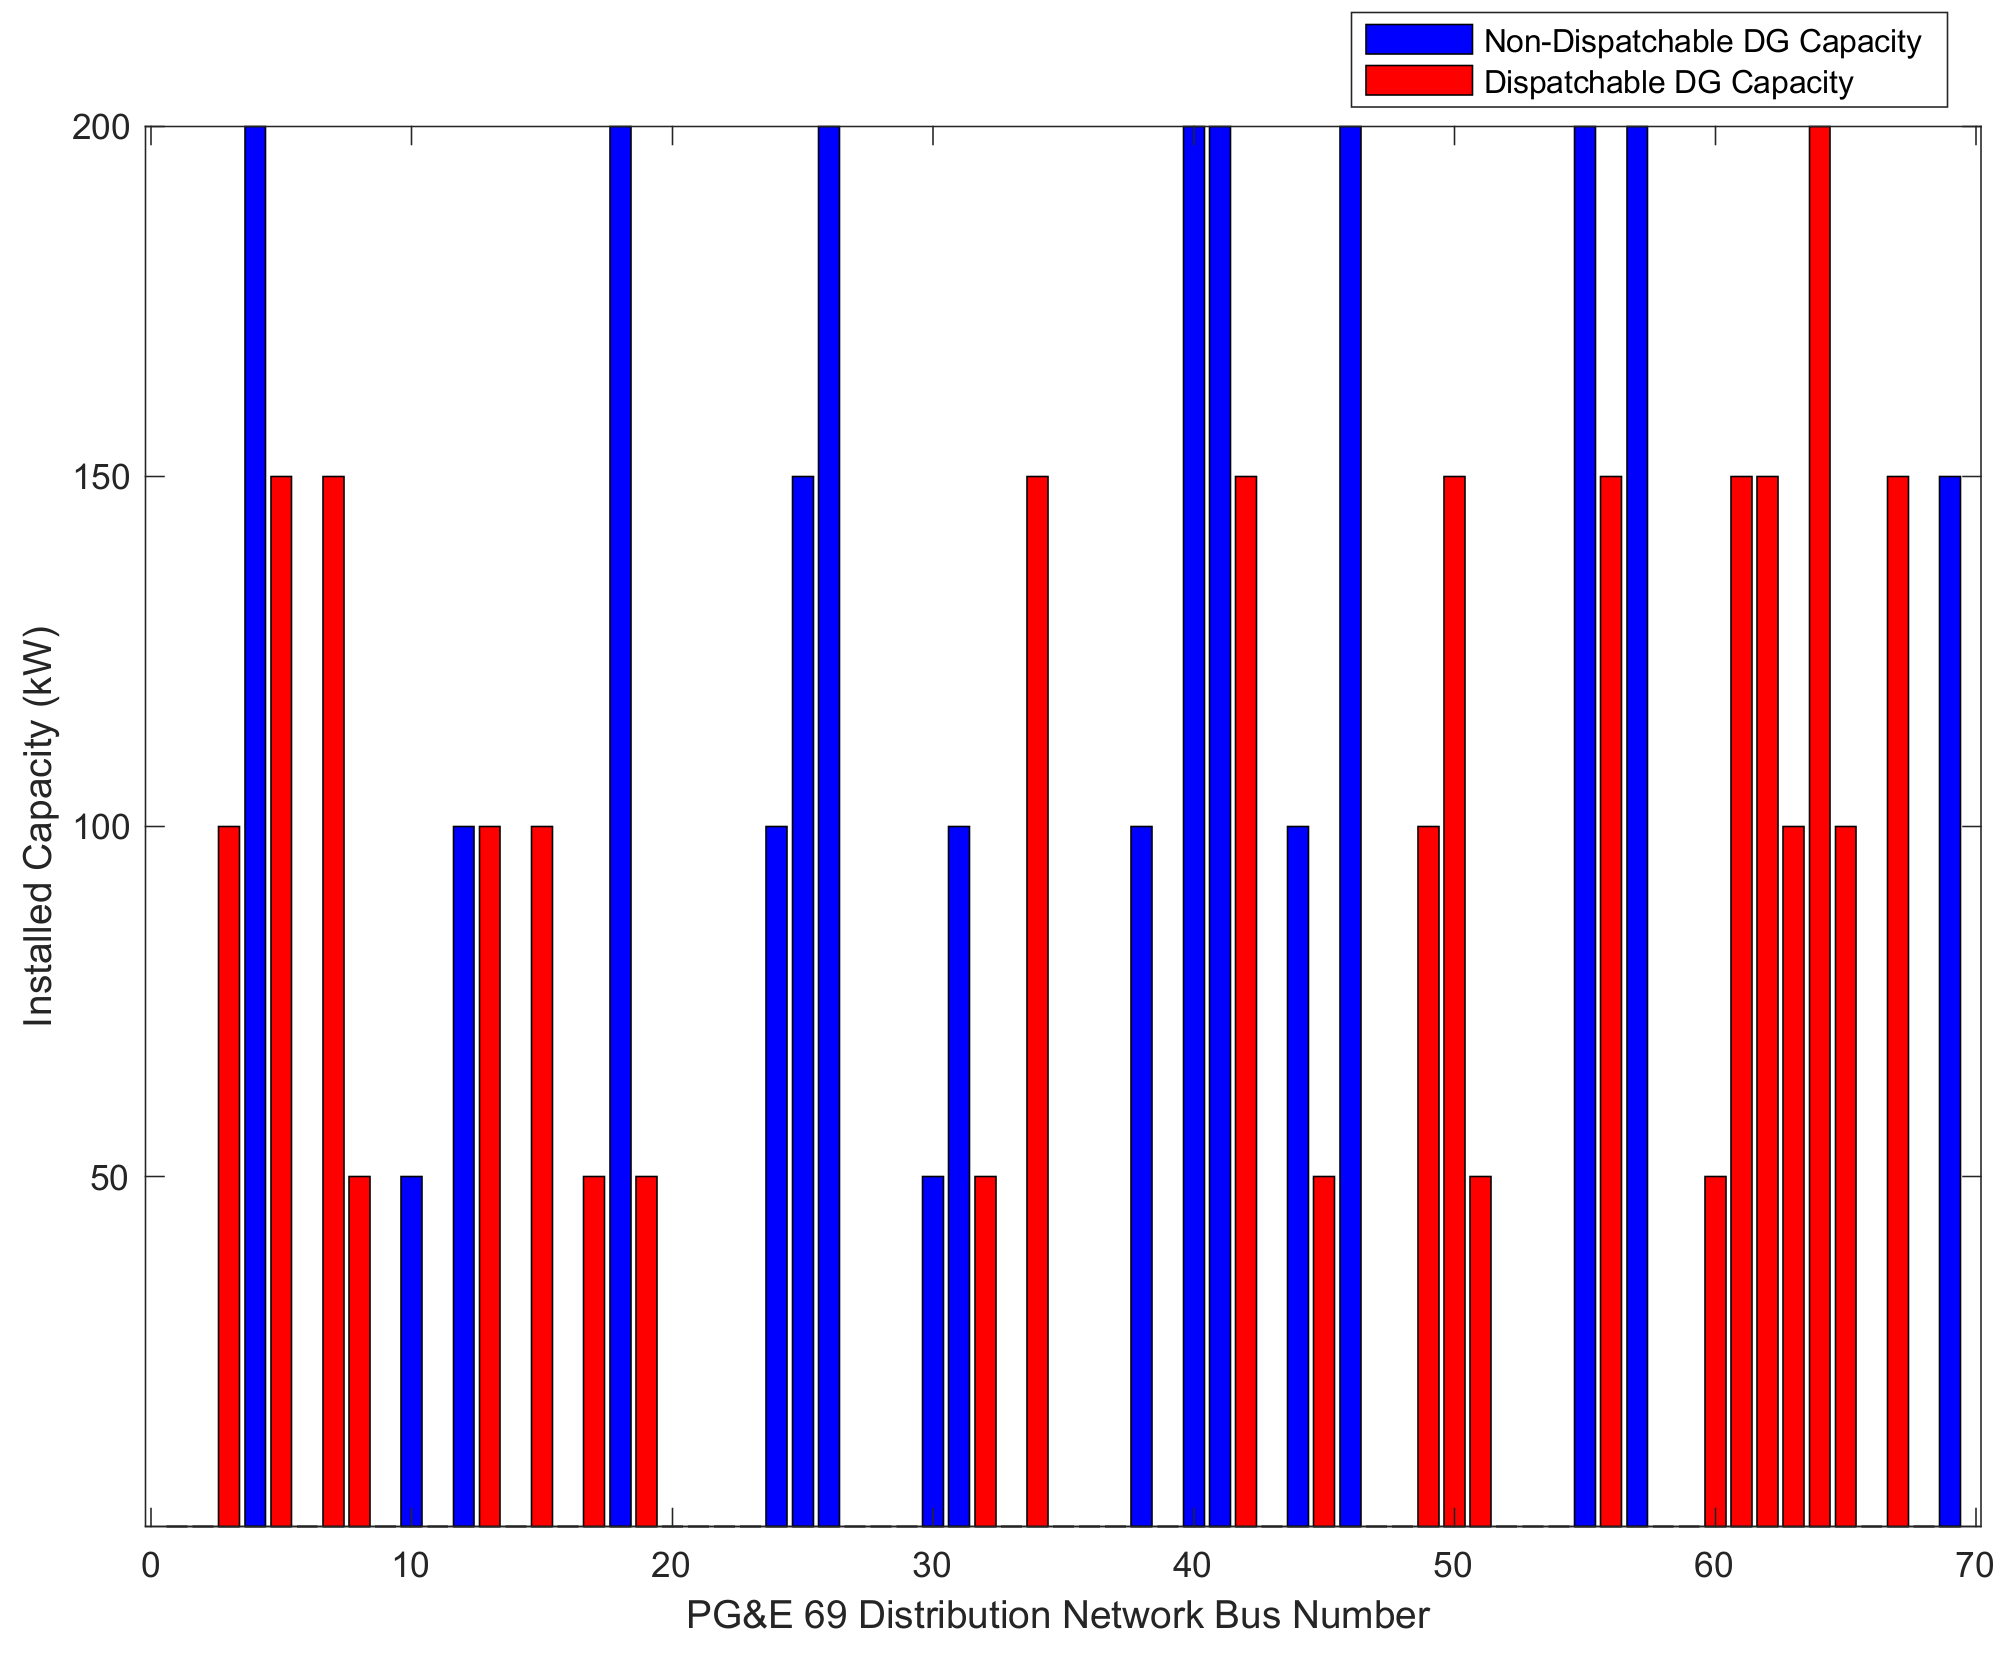
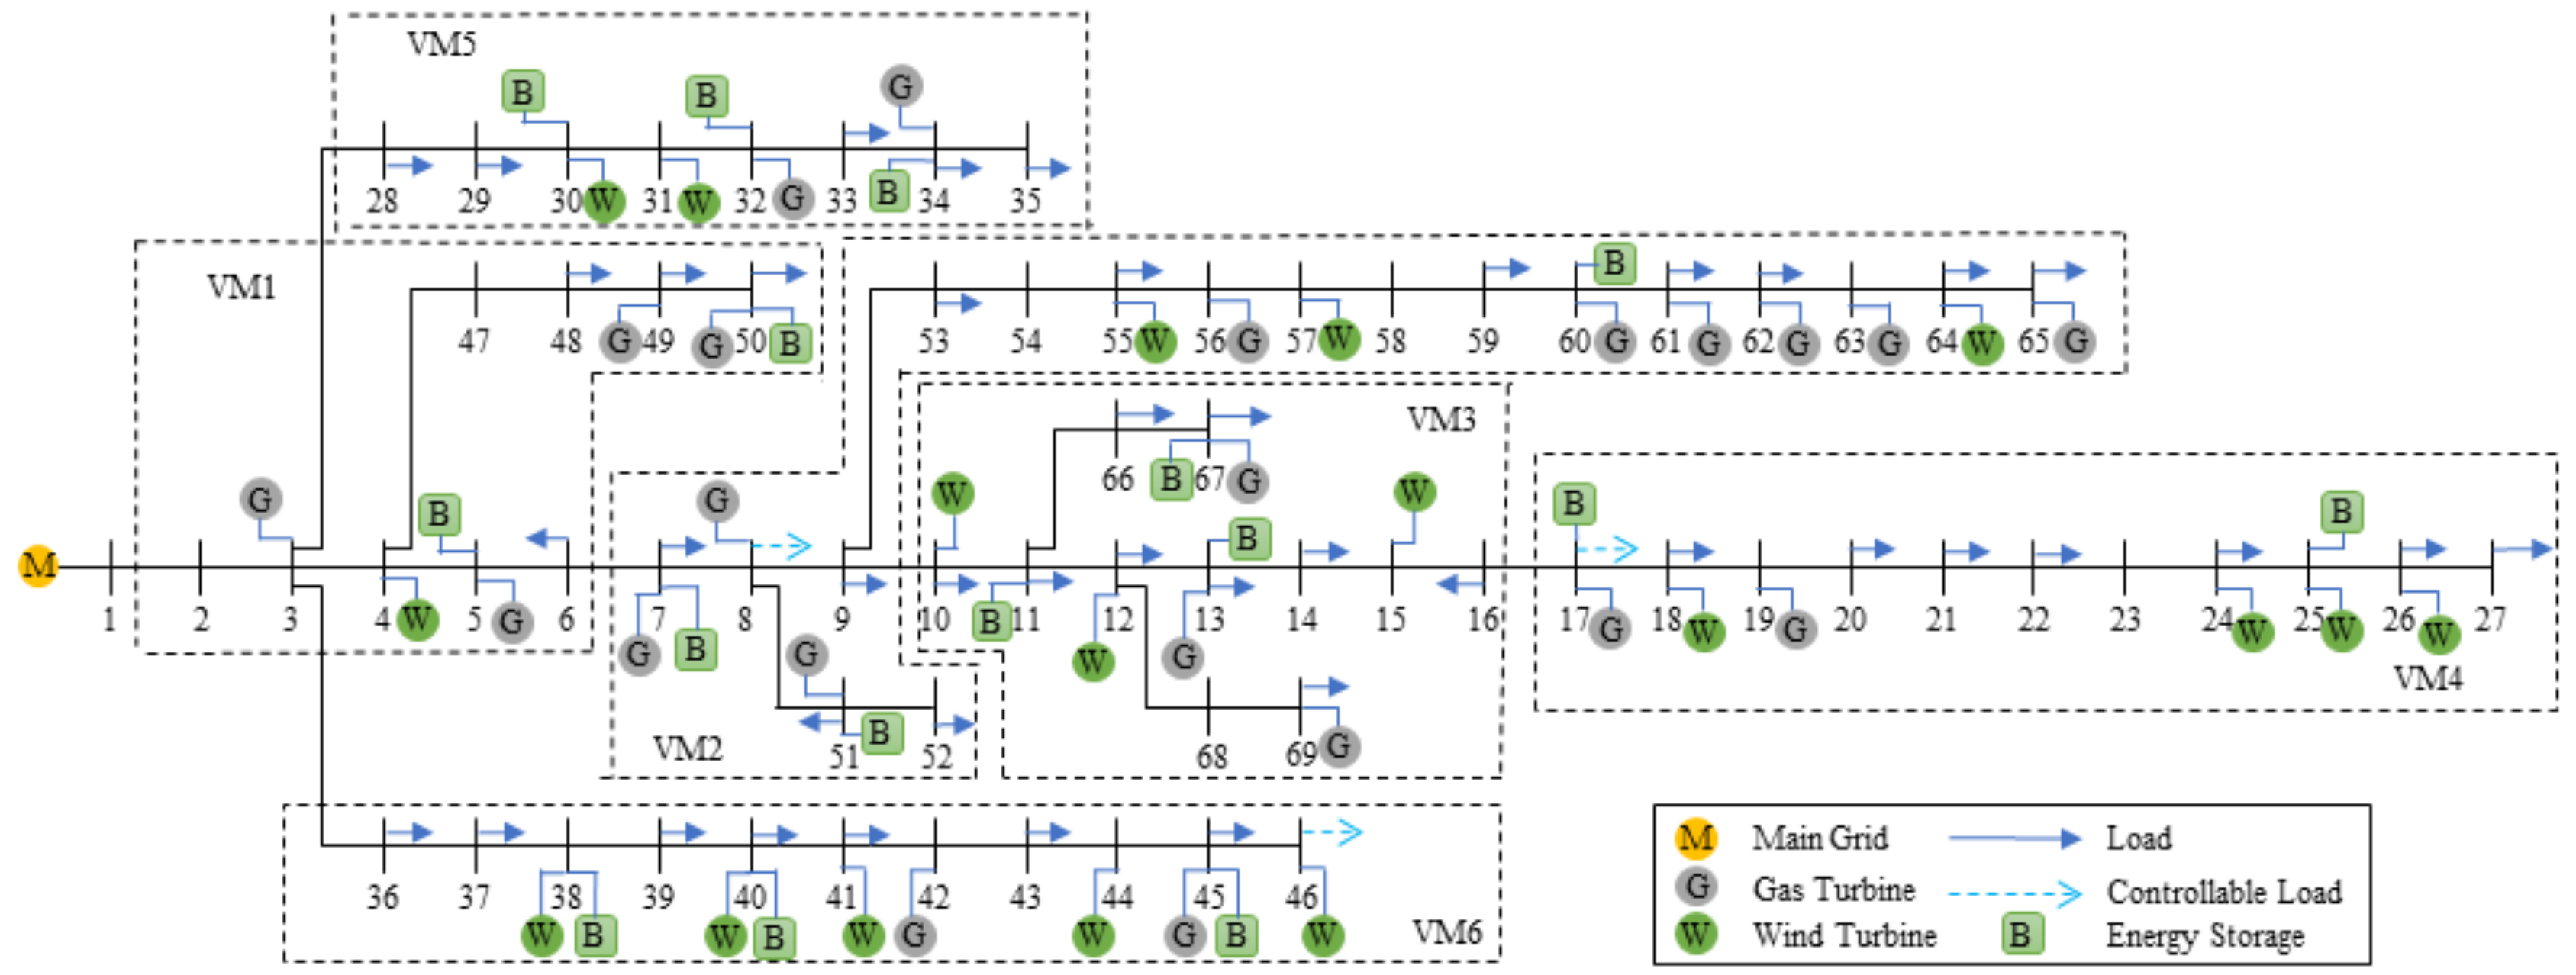
Figure 6 and
Figure 7. To represent the installed capacity in each bus, a bar plot is given in
Figure 6 to show the 4 types of capacity, i.e., 50 KW, 100 KW, 150 KW, and 200 KW.
The constraints are respected without violation, as shown in
Table 4. For the table, we can tell that the critical load is fully supplied and the FSI level is far from its violation. The installed DG’s capacity is at its maximum limit, due to the attempt to increase the cohesion of FSI and RNA. The voltage level is in the safe range for power system stability.
5.3. VM Management and Defense Capability
As mentioned, active planning takes active management and defense into consideration. To enhance management capability under wind and load uncertainty, one VM should use its local flexibility resources to prevent additional boundary flow with other VMs caused by wind and load uncertainty and to deal with local supply load imbalance.
To explore flexibility resources management, a flexibility management strategy for each VM is declared as per the order shown in
Table 5.
Because DESSs provide a much higher fast ramp rate than DGs and DRs, the forecast error, i.e., stochastic uncertainty, is first managed by DESS. If DESS storage is not enough, then DG power generation needs to be altered. Then, if the available capacities of DGs are not enough, a CL is further utilized.
The ratios between corresponding elements in the FA and UA of each VM are shown in
Table 6, showing that VM 1 and VM 5 have the most adequate flexibility resources compared to other VMs. For VM 1, flexibility supply derives from its high penetration of dispatchable DGs, leading to an outstanding FSI. For VM 5, it has the lowest installed wind and among one of the highest numbers of DESS.
Each VM’s cohesive features are given in
Table 7. In terms of FSI cohesion, a VM with positive cohesion intensity is viewed as more flexible than a combined case. It can be deduced that the relative flexibility supply in VM 1 and VM 5 is more adequate than the whole ADN, with a larger positive cohesive feature value, and these two VMs may support other VMs in dealing with uncertainty in the grid-connected mode. VM 4 has the least cohesive character of all VMs, due to its uncertainty caused by high wind turbine installation and relatively lower flexibility supply.
As observed from the results in
Table 7, it is difficult to make all cohesions positive in the planning process. A reasonable balance of cohesion could be an interesting topic in further research.
5.4. Comparison with Referential Case
The cohesion of VM reduces boundary flow, which is an indicator that each VM is more self-sufficient. Compared with a previous case study in [
5] that did not consider VM cohesion and flexibility sufficiency, as is shown in
Table 8, which had a 1.2944 MW total boundary flow with the same system conditions, our proposed method provides lower total boundary flow at 0.9598 MW.
In this referential case, the RNA gain, i.e., RNA cohesion intensity, is 1.6962, due to RNA not being considered in the optimal planning objective. With our proposed method, the value is improved to 51.455, showing better cohesion in terms of RNA and self-sufficiency.
In comparison with the referential case, the operational cost also decreases by 15.41 USD/h due to the increased utilization of cheaper wind power. The power exchange between the main grid and the ADN also decreased from 0.7284 MW to 0.3608 MW, which means that self-sufficiency and cohesion in each partition of the VMs results in a more independent ADN overall.
5.5. VM Flexibility Resources
To further probe the efficiency of the proposed flexibility supply method, flexibility resources’ management in VM 6 are scrutinized based on the strategy in
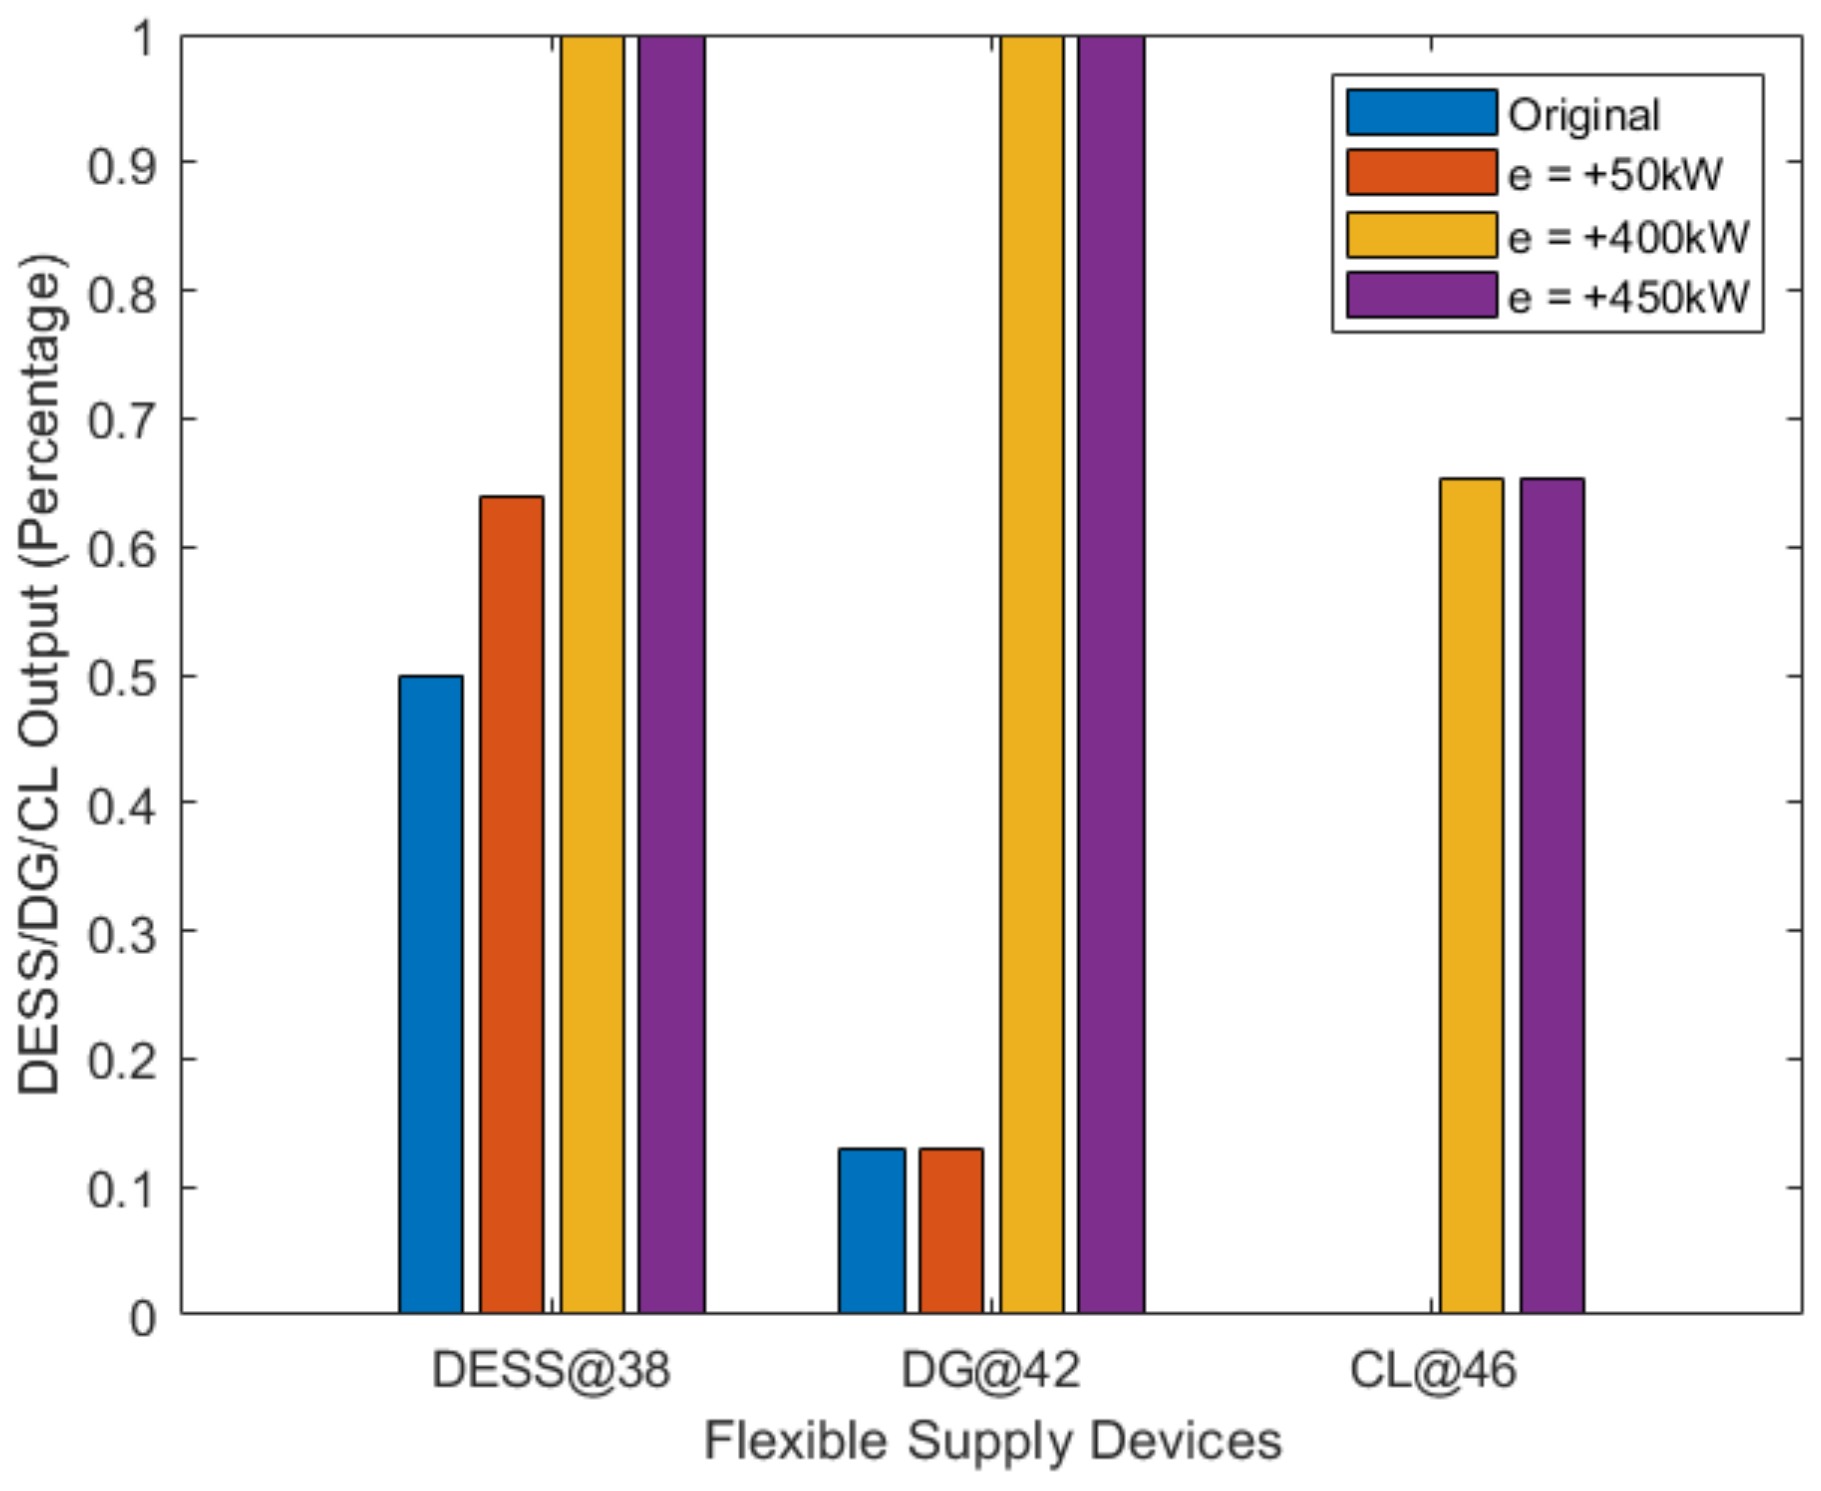
Table 5. In VM 6, two dispatchable DGs and three DESSs are optimally located, with one controllable load priorly built at bus 46. When VM 6 is working in an independent mode, it utilizes its own flexibility resources to deal with a priori forecast errors, following the order in
Table 4. With different levels of total real-time error, the results are displayed in
Figure 8.
When the total error is 50 kW, i.e., the real-time load exceeds planned generation by 50 kW, DG, DESS, and CL output are shown in the red bar, in which the DESS at bus 38 increases its output, while the DG output remains the same. If estimation error increases to over 400 kW, shown in the yellow and purple bar, then the DESS and DG are drained out at their maximum output. The CL then starts operating to deal with system imbalance to ensure self-sufficiency.
5.6. Flexibility Supply Indices and Installed Capacity Limit
For active planning, the installed capacity limit in Equation (24) is given by load forecast and averaging. The accuracy of this value has an effect on the optimization result. If this value is too low, then self-sufficiency will not be secured for all VMs. On the other hand, if this limit is too relaxed, then power generation may not be efficient due to excessive redundancy. Moreover, the feasibility needs to be taken into consideration when total installed capacity is too high.
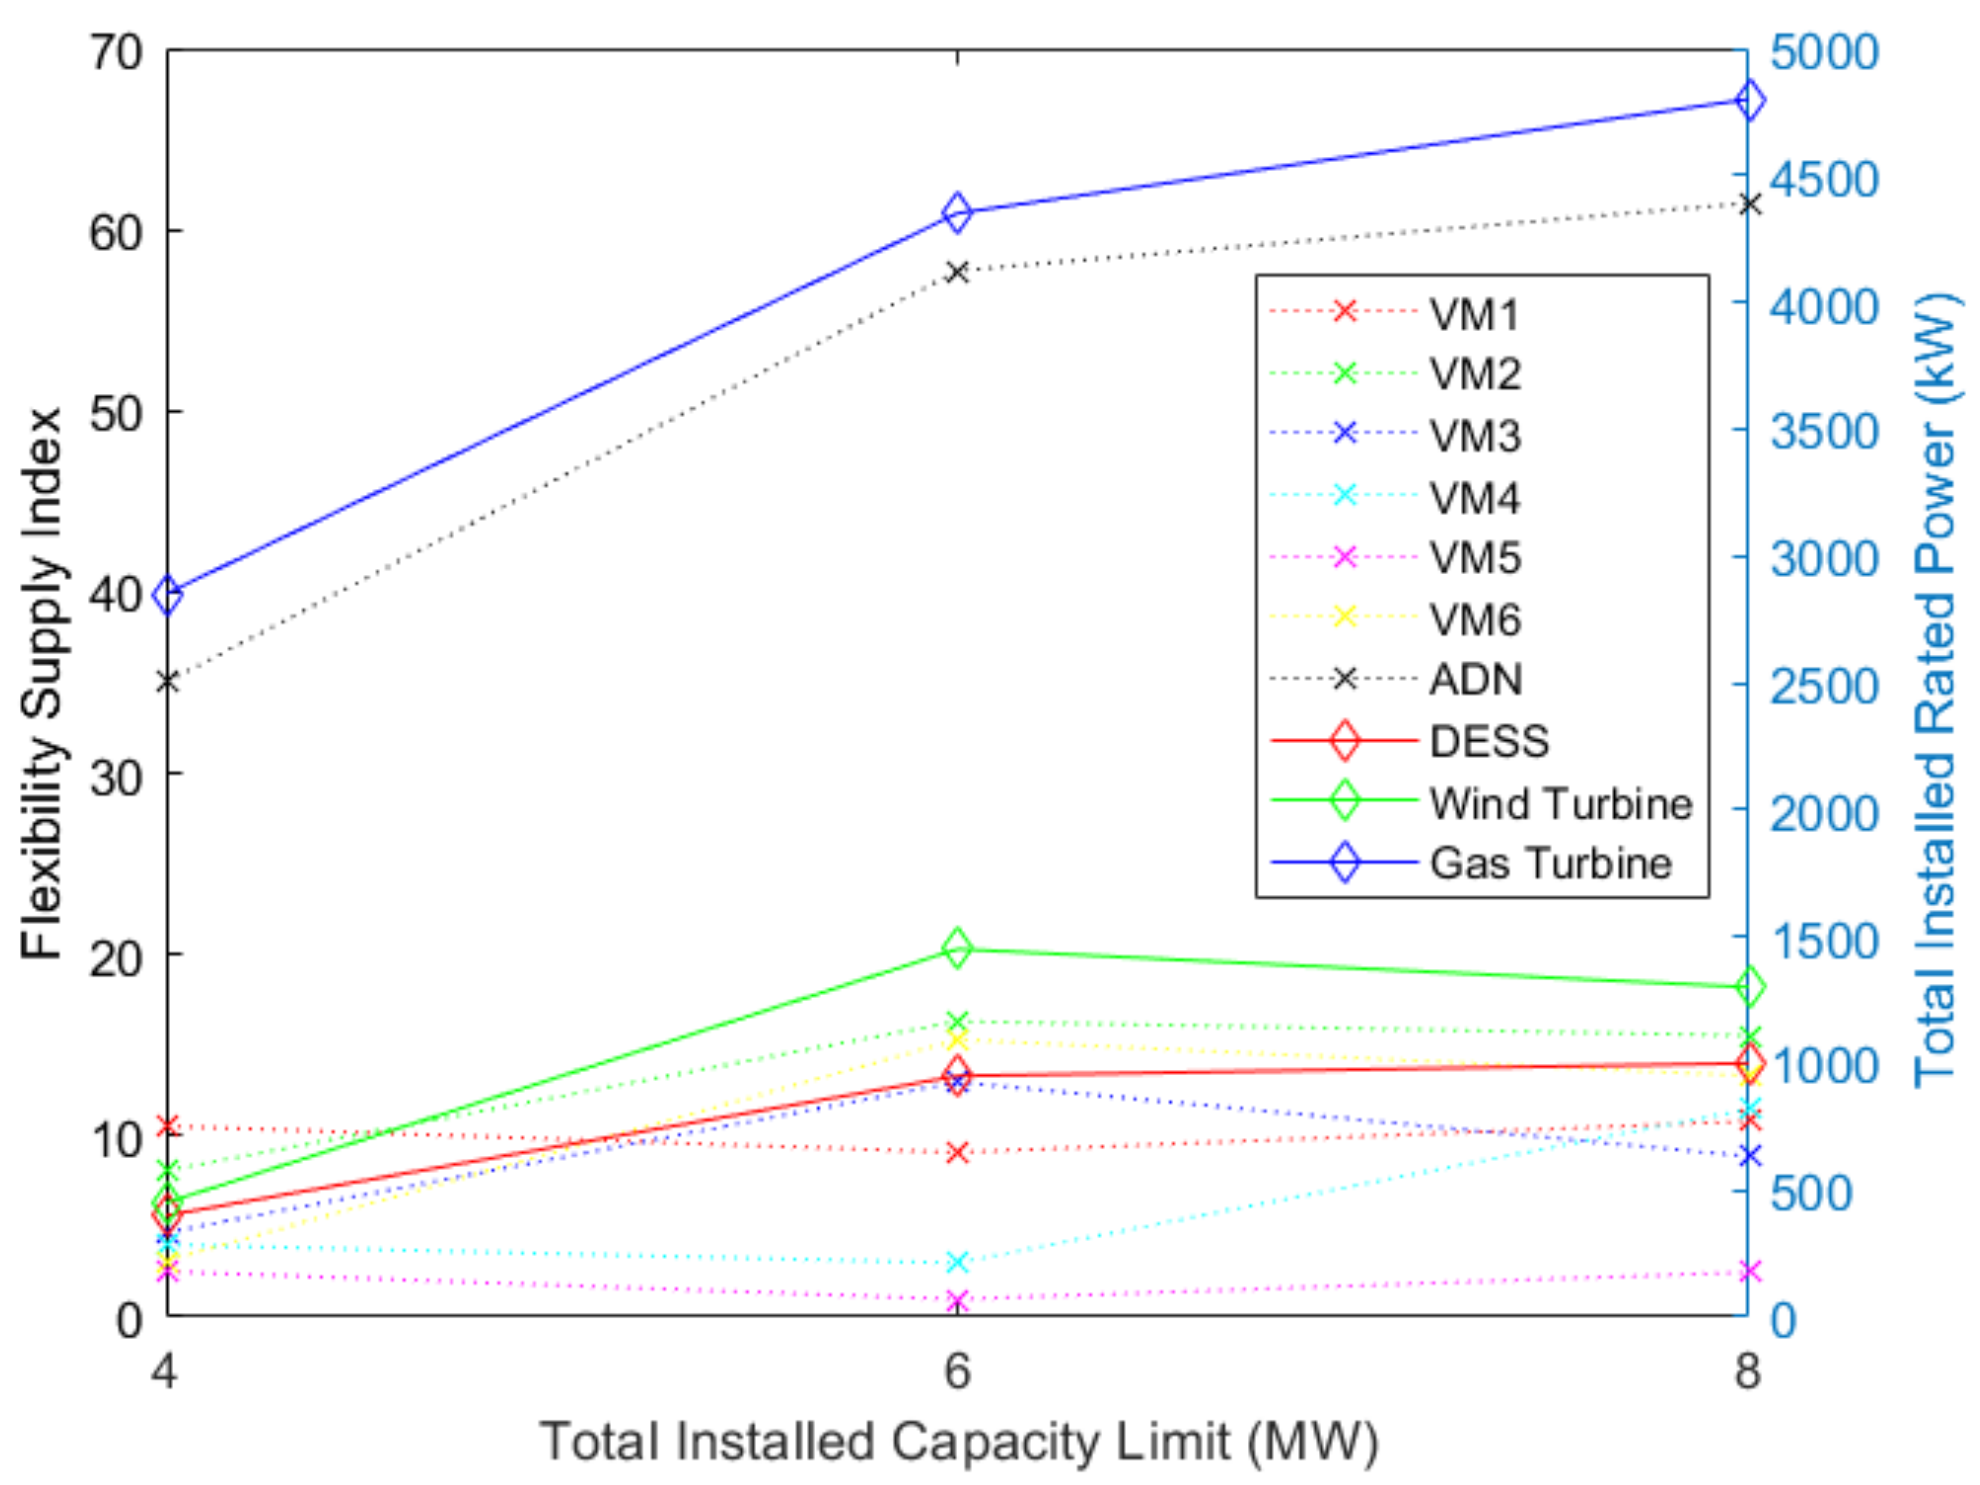
A test on the relationship between the FSIs of VMs and total installed capacity limit was conducted, as shown in
Figure 9. When the limit is relaxed to 6 MW, for VMs 2, 3, and 6, the FSI increases, and for VMs 1, 4, and 5, the FSI decreases. However, we can find that the FSI of the whole ADN increased significantly from 40 to 60. This situation is caused by the number of wind turbines and increased in VMs 1, 4, and 5.
If this constraint on total installed capacity is further relaxed to 8 MW, a similar increase happens in the ADN’s FSI, but the improvement is only marginal, with an increase of only 5. Individually, the FSIs of VMs 1, 4, and 5 increased from the 6 MW constraint scenario, whereas the FSIs of VMs 2, 3, and 6 slightly decreased.
The variation in the FSI shown in
Figure 9 suggests that the increase in the total installed capacity limit has no significant and explicit effect on each VM’s FSI but is positively related with whole ADN’s FSI.
The variation in FSI with reference to the capacity limit is consistent with theory analysis. In this test case, the capacity limit represents the investment scale, and it is only beneficial if cost and flexibility supply are balanced under a reasonable investment. However, this issue has never been addressed in previous studies. As shown in the analysis above, our method and index for flexibility evaluation could be efficient and promising in dealing with this issue.
6. Discussion
In this section, the efficiency, running time, and qualitative comparisons are presented.
6.1. Comment on Execution of Proposed Method
The execution of the proposed active planning method takes 54 h and 12 min, which is acceptable in the planning stage of a power system. Compared with [
38,
39,
40], where heuristic algorithms are utilized in the IEEE 69-bus system within minutes, the running time is still significantly longer. Still, when compared to Grey Wolf optimization (GWA) given in [
41], the proposed bi-leveled GA is still faster than the GWA, which takes over 216 h for only 10 DGs.
The first and main reason for enhanced operational time is the determination of the FSI. In our proposed method, the FSI is calculated by MCS sampling, which takes many iterations for a flexibility assessment. The second reason is the bi-level optimization structure which, while accurately determining the power flow, delayed the algorithm. Finally, compared with the existing literature, the installed DG amount is larger, which is reported to have larger convergence than an algorithm allocating few DGs [
40].
6.2. Comment on Various RES Inclusion
In this research, RESs are limited to wind turbines, but the proposed idea can be easily extended to other RESs, including photovoltaic power plants or micro-hydro sources.
For solar energy harvesting, rooftop PV panels can be adopted in a city setting, where the construction of DGs can be difficult. In the optimization process, the exact time in solar year, local latitude, and average shading factor should be considered for correctly quantifying the generation.
For micro-hydro power, the allocation is normally fixed with strict geographical restrictions. Two types of hydro power utilization methods can be adopted. The first type is water-powered turbines, extracting mechanical energy from water flow. The second type is a pumped storage hydropower system (PSH). The location is restricted as well, but PSH systems can serve as flexibility providers in ADNs.
Naturally, for wind power, the geographical difference is not negligible. Wind power is viewed as observable, but the urban environment causes interruptions compared with rural areas. In the city scenario, wind speed can be smaller than on a plain field of a rural setting, due to the turbulence of existing civil infrastructure. Based on adequate historical data on wind measurements and real civil structure modelling, the forecast of turbulence-influenced wind measurement can be more accurate. AI-based wind mapping systems, which are statistical methods based on big data technology, are promising for the assessment of wind turbulence [
42]. For example, in [
43], Higgins et al. proposed using an artificial neural network (ANN) to categorically predict urban wind speed based on different shapes of buildings. In [
44], a dataset from SCADA is utilized for training the classification model of a wind turbulence model.
6.3. Limitations and Future Extension
One of the limits of this research is the lack of considering geographical differences in the optimization process. Though the impedance between buses can mean the geodesic length between nodes, the specific consideration of nodes’ existing infrastructure is not given. For future extensions, each node’s available building footprint can be considered as a constraint in optimization. For example, some nodes cannot accommodate large DGs and wind turbines, since they are located in a developed city area or have other limitations in building new distributed energy resources.
Another limit is in the determination of a VM boundary. The boundary is determined before the optimization process, during which it remains static. This neglects the effect of potentially allocated DERs in branch weight. In the next step, our research will probe this effect and extend this work to a more accurate scale of spatial differences in ADNs.
Another limit is the program’s running time. Even though in a realistic planning setting, there is no issue of urgency, it is believed that simplification and better algorithmic structure design will decrease the execution time, especially in flexibility supply assessment in MCS.
7. Conclusions
To conclude, this paper proposed an innovative framework including active planning, active management, and active defense for research on ADNs. Active planning has been implemented for virtual microgrids with optimal self-sufficiency and cohesion. Cohesion is a novel concept first defined in this paper. Furthermore, the meaning of self-sufficiency has been revised by considering the balance between flexibility and uncertainty, which could be quantified by a novel method based on Monte Carlo. The case study has proven that this active planning can significantly improve the capabilities of ADNs in management and defense. Compared with a referential case under the same partition of the IEEE 69-bus bar system with no consideration of ADN flexibility, this case has shown a 34.68% decrease in operational cost, a 25.85% decrease in boundary flow, and a 50.47% decrease in main grid power, indicating a self-sufficiency increase in VMs. Moreover, the CI of the FSI and RNA in the proposed case is significantly higher than the referential case.
The understanding of ADNs following the new framework could help to consider ADNs from a more comprehensive perspective and clearly identify the influence from planning to management and defense. To upgrade large-scale CDNs to ADNs, the construction of VMs could be a promising solution. However, the idea of active planning could even be extended to other methodologies in ADN construction without VMs. The quantification method to evaluate flexibility supply balance could also contribute to other planning issues in power systems. In future research, existing geographical and civil structure could be included by adding proper constraints. Also, the spatial difference will be taken into more consideration in determining the partitioning and configuration of ADNs.
