Article

Environmental Impact Evaluation of CO2 Absorption and Desorption Enhancement by Membrane Gas Absorption: A Life Cycle Assessment Study

1
School of Mechanical Engineering, Qilu University of Technology (Shandong Academy of Sciences), Jinan 250353, China
2
Shandong Institute of Mechanical Design and Research, Jinan 250031, China
3
School of Energy and Power Engineering, Shandong University, Jinan 250061, China
4
Shenzhen Research Institute, Shandong University, Shenzhen 518057, China
*
Authors to whom correspondence should be addressed.
Energies 2024, 17(10), 2371; https://doi.org/10.3390/en17102371
Submission received: 22 April 2024 / Revised: 11 May 2024 / Accepted: 12 May 2024 / Published: 14 May 2024
(This article belongs to the Special Issue Sustainable Technologies for Decarbonising the Energy Sector)

Abstract

:
Membrane gas absorption technology has been considered a promising approach to mitigate CO2 emissions from power plants. The aim of this study is to evaluate the environmental impacts of CO2 absorption and desorption processes by hollow fiber membrane contactors using a life cycle assessment methodology. On the basis of the ReCipe 2016 Midpoint and the ReCipe 2016 Endpoint methods, the research results show that membrane gas absorption systems exhibit the lowest environmental impacts across the majority of assessed categories in comparison with chemical absorption and membrane gas separation systems. The CO2 capture process via membrane gas absorption has the most significant impact on the METP category, with heat consumption as the primary contributing factor accounting for 55%, followed by electricity consumption accounting for 43.1%. According to the sensitivity analysis, heating by natural gas shows better performance than other heat supply sources in improving overall environmental impacts. In addition, the increasing utilization of renewable energy in electricity supply reduces the global warming potential, fossil resource consumption and ozone formation.

1. Introduction

Carbon dioxide is one of the primary greenhouse gases contributing to global warming, which leads to a variety of environmental problems such as rising sea levels, melting glaciers and ice sheets and species extinction. According to the special report issued by the Intergovernmental Panel on Climate Change, it is imperative to restrict the increase in global average temperature to 1.5 °C above preindustrial levels in order to achieve the targets outlined in the Paris Agreement [1]. Carbon dioxide emissions shall be universally reduced in order to combat climate change and resulting disasters. The European Union and Japan have set ambitious targets of achieving net-zero greenhouse gas emissions by 2050 [2,3]. The US White House is aiming at challenging goals of reducing total economy-wide greenhouse gas emissions by 50–52% and achieving net-zero emissions by 2030 and 2050, respectively [4]. China has also announced its aim to reach a peak in its carbon dioxide emissions before 2030 and achieve carbon neutrality by 2060 [5].
CO2 capture and storage (CCS) from large-scale emission sources has been considered an effective approach to stabilize or reduce the CO2 concentration in the atmosphere in the short term. CCS can be further classified into three categories: pre-combustion capture, oxygen combustion capture and post-combustion capture. For CO2 post-combustion capture from coal-fired power plants, chemical and physical absorption [6], solid adsorption [7], cryogenic distillation [8] and membrane separation [9] technologies have been currently proposed without significant retrofitting of existing infrastructure. Chemical absorption has been extensively used as the most well-established technology on a commercial scale in the gas separation industry for decades, attributed to its high removal efficiency. Nonetheless, conventional gas absorption towers and scrubbers are generally encountered with high regeneration costs and operation problems such as flooding, absorbent losses, entrainment, liquid channeling and foaming [10]. Membrane gas separation has been considered as another attractive technology that shows the benefits of continuous operation, flexible design, low energy consumption and simple equipment [11]. However, its applications for CO2 capture are mainly limited by its permeability-selectivity tradeoff relationship. Therefore, in recent years, many researchers have been exploiting the possibilities by integrating two or more gas separation technologies to overcome the performance gaps and enhance the removal efficiency.
Membrane gas absorption technology is a hybrid process that combines the advantages of the absorption process and membrane separation. In comparison with traditional columns, although the membrane wall introduces additional resistance, the CO2 absorption and stripping processes by hollow fiber membrane contactors can still enhance the CO2 absorption flux and reduce equipment size and the total energy costs. The gas-liquid interface area of a hollow fiber membrane contactor is 30 times higher than that of a conventional packed column, which effectively reduces the size of the CO2 absorber by 65% [12]. Compared to a conventional absorption process, 4.63% and 6.11% energy savings can be achieved with membrane-integrated absorption in series and in parallel configurations due to a reduction in the absorber size, respectively [13]. Attributed to its flexible operation, compact specification, high surface-area-to-volume ratio, linear scale-up feasibility, modular design and other benefits [14,15,16], membrane gas absorption technology has already been identified as one of the most promising alternatives to conventional technologies for CO2 mitigation. In the past two decades, most of the research conducted has mainly focused on the technical and economic feasibility of membrane gas absorption for CO2 capture from the perspectives of membrane materials, absorbent types and operating parameters through experimental and numerical simulations [17,18,19,20]. However, the environmental impact of the membrane gas absorption for CO2 capture, which can be used to evaluate the real sustainability of the CO2 capture processes regarding all environmental aspects, has seldom been studied in the previous literature.
Life cycle assessment (LCA) is a systematic and comprehensive method used to evaluate the environmental impact categories of a product, process, or service throughout its entire life cycle. In the past two decades, numerous LCA studies have been carried out to evaluate the environmental implications of typical CO2 post-capture systems or technologies. Koornneef et al. [21], Petrscu et al. [22] and Surprenant [23] applied LCA to investigate the environmental trade-offs and co-benefits of implementing CO2 capture and storage using different absorbents by chemical absorption technology in the supercritical pulverized coal fired power plant. Giordano et al. [24] performed a comparative LCA between MEA-based chemical absorption processes and membrane separation processes for CO2 post-combustion capture, concluding that membrane separation could reduce lifecycle emissions compared to chemical absorption. Wang et al. [25] also applied the LCA method to study the environmental impacts of MEA-based chemical absorption and two-stage membrane separation for CO2 capture in a supercritical pulverized coal power plant. Two-stage membrane separation showed less damage to human health, resources and ecosystems compared to MEA absorption technology.
Specific to the membrane gas absorption process, Akan et al. [26] conducted a comprehensive assessment of the environmental impacts associated with CO2 capture in hollow fiber membrane contactors, utilizing MDEA activated by piperazine under different operation conditions at the laboratory scale. Their findings indicated that the highest impacts on ecosystems, human health and resource utilization were observed under conditions of maximal liquid flow, minimal solvent concentration and an optimal sweep gas flow rate. To date, there exists a scarcity of studies that explore the environmental impacts of CO2 absorption and desorption processes employing hollow fiber membrane contactors at a commercial-scale power plant, specifically through the life cycle assessment methodology. Therefore, this study is primarily focused on assessing the environmental impacts of CO2 capture through membrane gas absorption utilizing the LCA methodology. Furthermore, chemical absorption and membrane gas separation processes are also evaluated for comparative purposes. The structure of this paper is outlined as follows: Section 2 introduces the process flow of the membrane gas absorption system, chemical absorption system and membrane separation system. Section 3 introduces the methodology for life cycle assessment. Section 4 discusses the life cycle environmental assessment results. Section 5 conducts a sensitivity analysis on the factors with the greatest impact on the system’s environmental performance. Finally, Section 6 summarizes the main conclusions of the study.

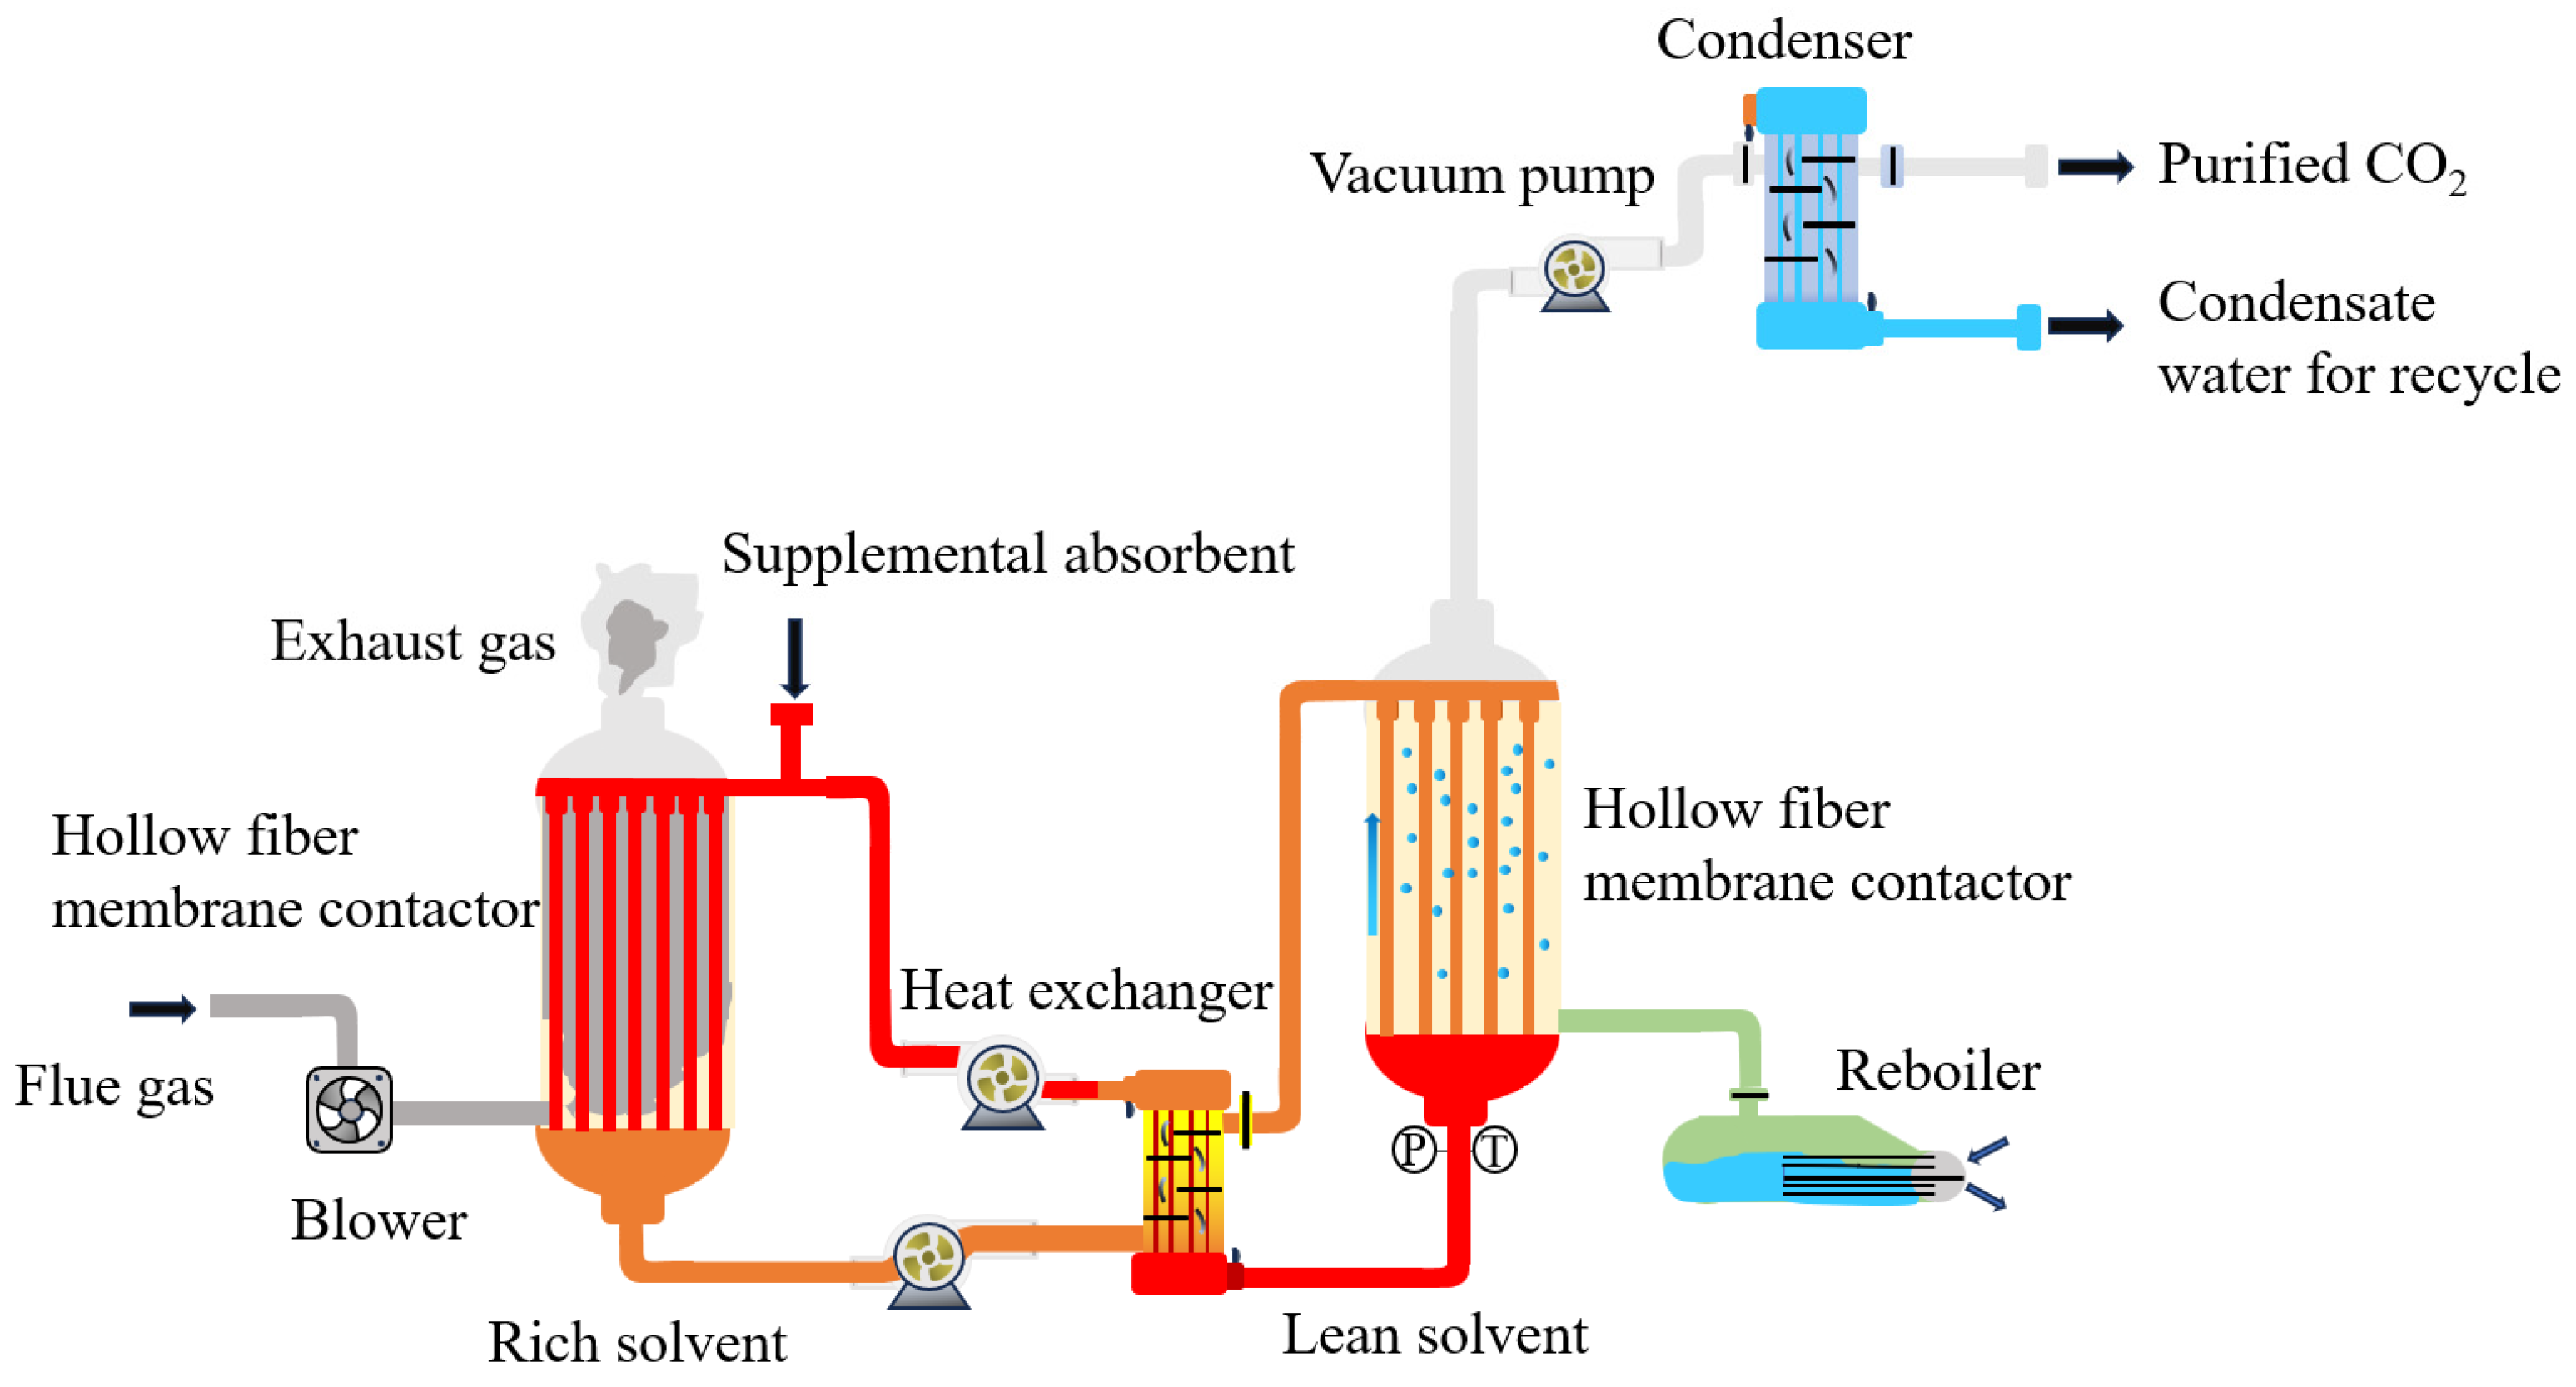
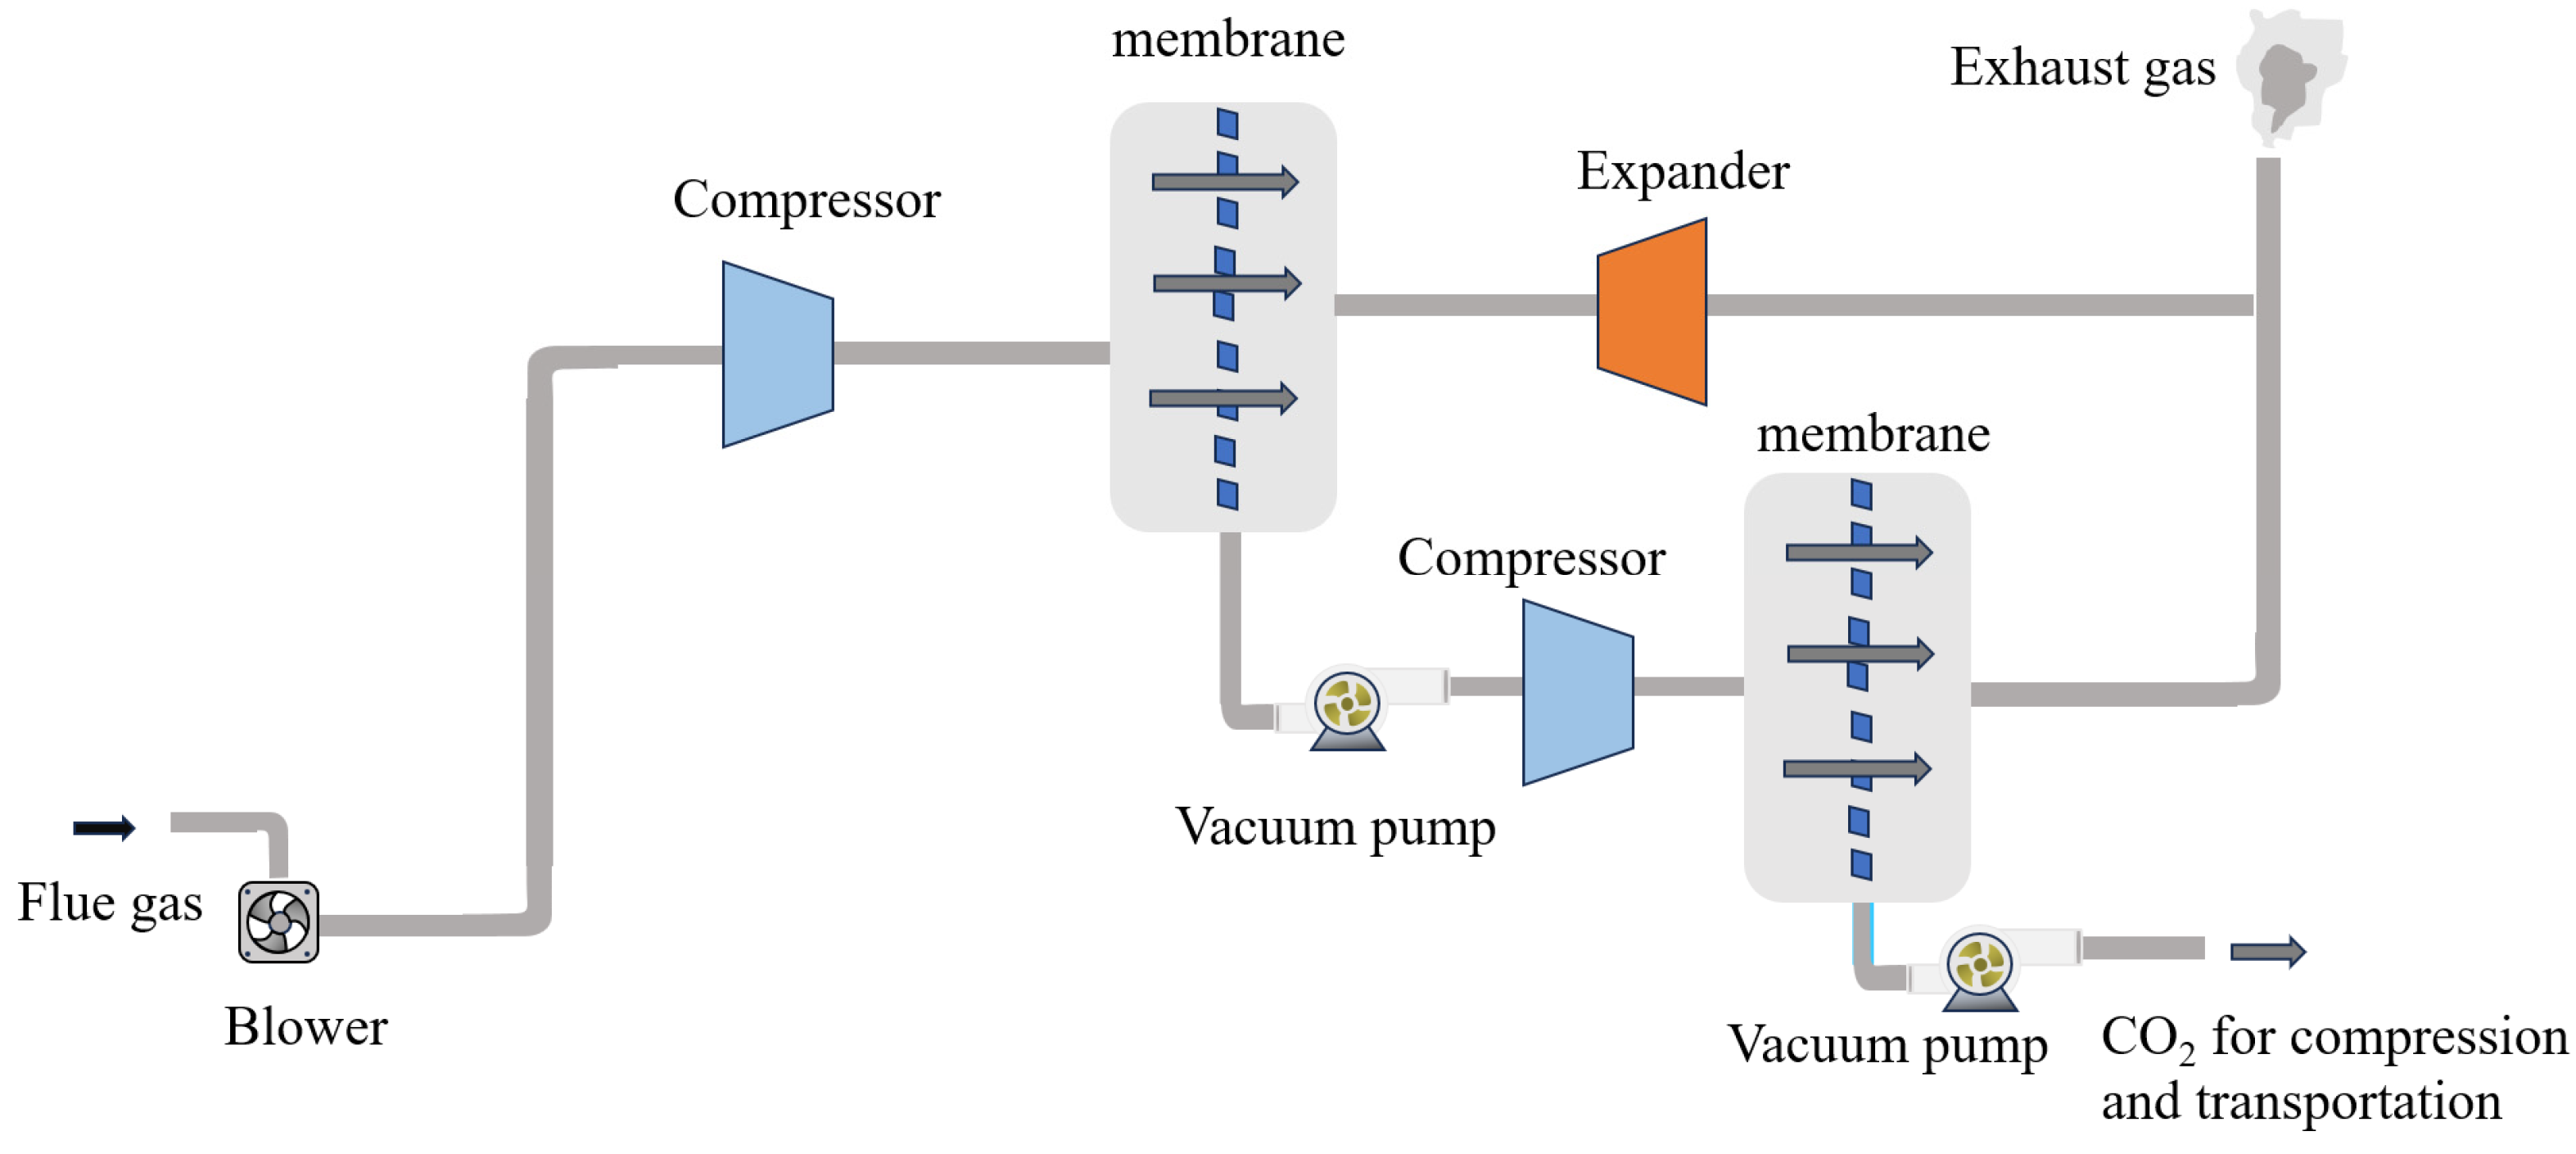
2. Materials and Methods

The CO2 capture process is retrofitted to a 685 MWe supercritical pulverized coal power plant, which is designed based on case B12A specified by the National Energy Technology Laboratory with the detailed parameters specified in reference [27]. The designed service life of the power plant is 30 years. The flue gas from the power plant is cooled to a temperature of 27 °C and further purified to remove NOx, SO2 and dust before entering the capture equipment. It is assumed that the flue gas entering the separation system is 12.46 mol% CO2 and 87.54 mol% N2 at a mass flow rate of 736 kg/s. In this study, the CO2 capture rate is set at 90%, and 100% CO2 is regenerated for compression. To compare with the membrane gas absorption technology for reducing CO2 emissions in coal-fired power plants, chemical absorption and membrane gas separation technologies are also investigated as study scenarios.
Figure 1 is the schematic diagram of membrane gas absorption technology to capture CO2 from the flue gas of a power plant. The purified flue gas, primarily N2 and CO2, is introduced into the bottom of the polysulfone hollow fiber membrane contactor and flows through the shell sides of the membrane contactor. The absorbent, 30 wt.% MEA, flows through the lumen sides of the hollow fiber membrane contactor in the opposite direction. The CO2 gas diffuses and passes through the membrane micropores to the gas-liquid contact surface and is absorbed by the MEA solution under the driving force of the concentration gradient. At the same time, the hydrophobic membrane material can prevent the absorbent solution from entering the gas phase, thereby achieving the purpose of separating CO2 from the flue gas. For the membrane gas absorption system, the liquid absorbents provide the selectivity, and the microporous membrane only acts as the physical barrier between the gas and liquid phases. After absorption, the CO2-rich absorbent is pumped into the heat exchanger. The heated CO2-rich absorbent is further pumped into the bottom and flows upwards in the lumen side of the hollow fiber membrane contactors. The gas steam from the reboiler is fed through the shell side of the membrane contactors as the sweeping gas during the regeneration process. The membrane contactors for regeneration are kept at a pressure of 0.3 bar in order to meet the requirements of membrane stability and minimize the regeneration energy penalty [28]. After condensation, pure CO2 can be collected from the vacuum pump for storage or utilization. The regenerated absorbent is cooled in the heat exchanger and pumped back to absorption membrane contactors for the next recycle capture process.
The main parameters of the hollow fiber membrane contactors are provided in Table 1.
Figure 2 illustrates the process flow diagram for CO2 capture utilizing MEA-based chemical absorption technology, which is closely similar to the configuration depicted in Figure 1. The notable distinction is that the membrane contactors are replaced with packed or bubble towers for the absorption and desorption stages. The flue gas from the power plant is introduced into the absorber column, where it contacts the MEA solution flowing counter-currently. CO2 from the flue gas reacts with MEA to form a bicarbonate ion, and the reaction is exothermic, leading to a temperature increase in the solution. The CO2-rich absorbent is then regenerated in the stripper at a temperature of 110–120 °C by steam extracted from the reboiler. Pure CO2 is released from the absorbent, cooled and compressed for storage or utilization, while the lean absorbent is recycled to the absorber for the next absorption process.
Figure 3 illustrates the flow chart of CO2 capture by a two-stage membrane gas separation system. Both stages use the Polyactive™ membrane (Helmholtz-Zentrum Hereon, Geesthacht, Germany) [30], characterized by higher selectivity for CO2, to ensure fine separation and achieve high purity levels. The membrane has a dense active layer with a thickness of 1.5 μm. This two-stage approach optimizes the balance between CO2 permeability and selectivity, resulting in improved capture rates and efficiency for industrial applications.

3. Life Cycle Assessment Methodology

Life cycle assessment is a comprehensive framework that can be used to evaluate the environmental aspects and potential environmental impacts associated with all the life stages of a specific product, process or service, from raw material extraction up to end-of-life disposal or recycling. The application of LCA methodology in the field of CO2 capture can identify the critical environmental hotspots within the CO2 capture chain and provide support for decision making from the perspectives of process design optimization and environmental sustainability. According to ISO 14040:2006 and ISO 14044:2006 standards issued by the International Organization for Standardization, LCA is composed of four fundamental steps: goal and scope definition, life cycle inventory, life cycle impact assessment and interpretation [31,32].

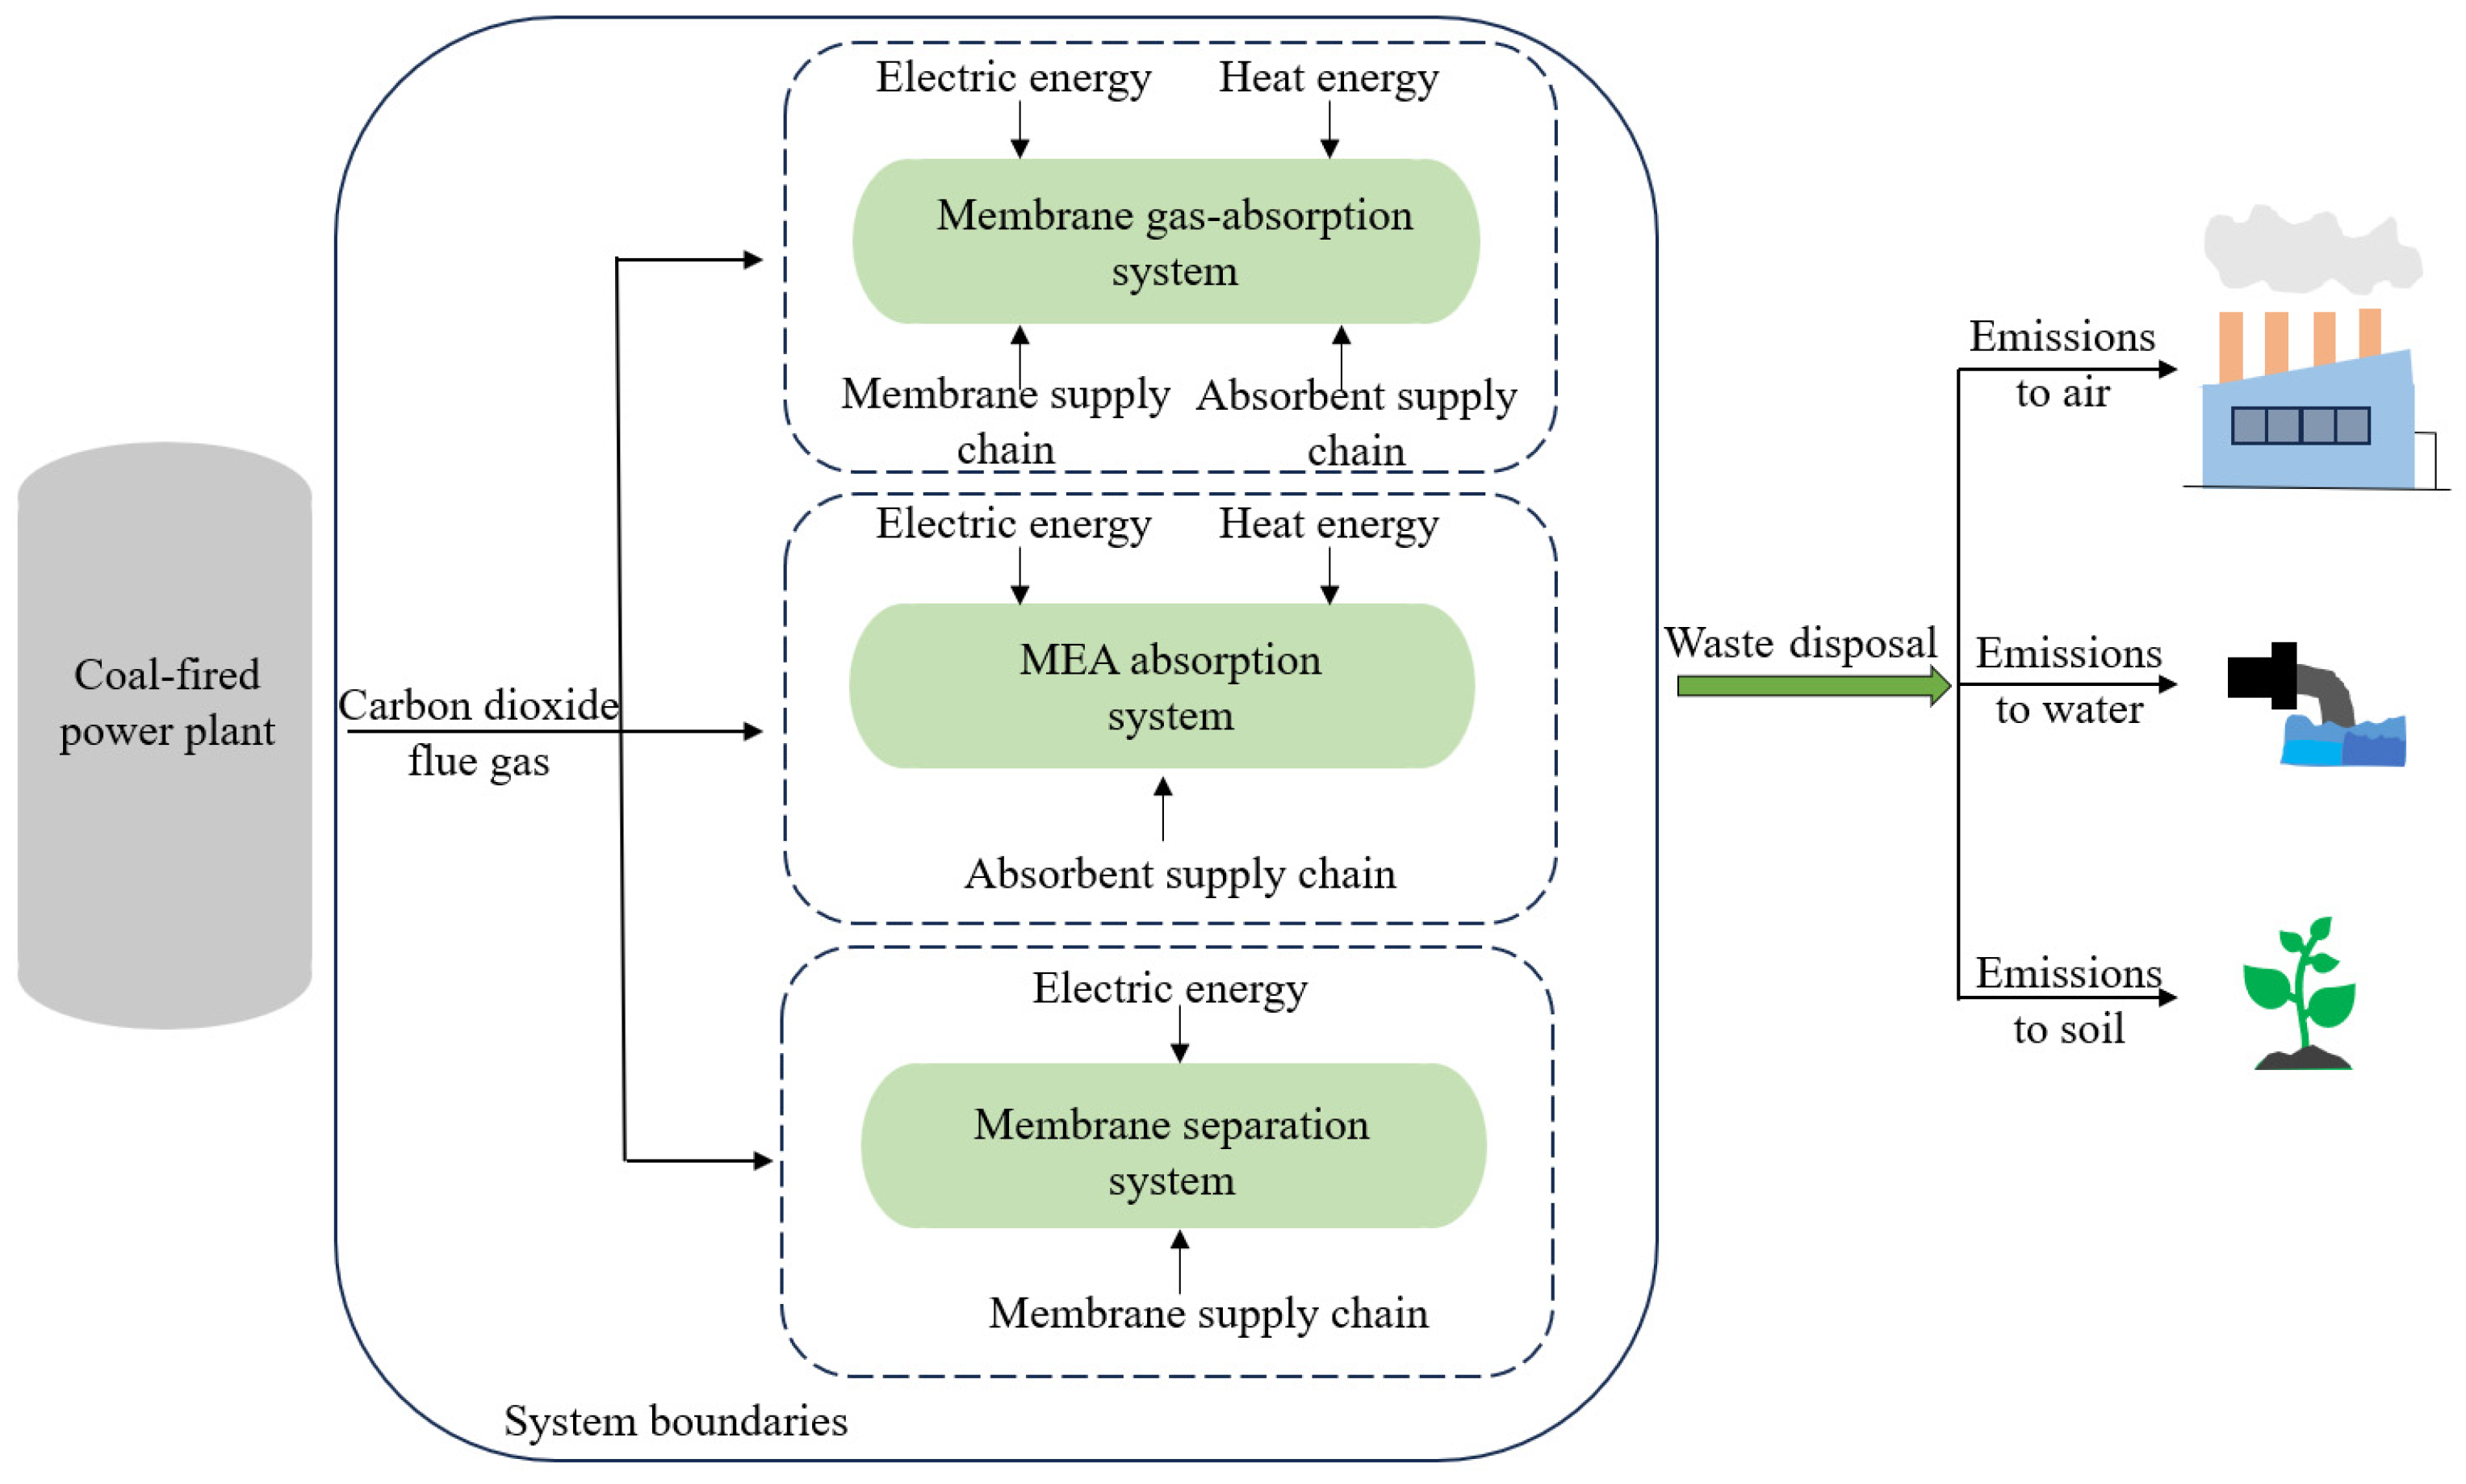
3.1. Goal and Scope Definition

The goal and scope definition establishes the LCA objective, the system boundary and the function unit of the study to lay the foundation for the assessment. The goal of the present study is to evaluate the environmental impact of applying membrane gas absorption technology to capture CO2 from the flue gas of a coal-fired power plant. Chemical absorption and membrane gas separation technologies are also considered for comparison. Based on the study focus, a “gate to gate” instead of “cradle to grave” approach is adopted to evaluate the capture process of CO2 in absorption and desorption equipment. The overall system boundary of CO2 capture and recovery by membrane gas absorption, chemical absorption and membrane gas separation systems is shown in Figure 4. The construction of a coal-fired power plant, human activities, equipment maintenance and waste disposal stages are not considered in this study. The function unit in an LCA study serves as a key reference to quantify the system performance for comparison and assessment of environmental impacts, energy consumption and resource utilization in CO2 capture systems. In this study, the function unit is defined as 1 ton of CO2 captured from the power plant.

3.2. Life Cycle Inventory

Life cycle inventory is a crucial step of the LCA methodology, which involves the collection and quantification of data inputs and outputs for all processes within the studied system boundaries. Inventory analysis is supported by two primary categories of data: background data and foreground data. Background data refers to generic data that is not specific to the capture process under study but is essential for the comprehensive analysis of the life cycle. Background data provides the necessary context for understanding the broader environmental implications. In this study, the background data are sourced from the commercially available Ecoinvent v3.0 database integrated within SimaPro software [33]. On the other hand, foreground data is specific to the particular process being assessed, which is critical for accurately representing the unique aspects of the CO2 capture system’s life cycle and for assessing the direct environmental impacts of its production, use and disposal. In this study, the foreground data is mainly collected through relevant literature, professional research reports and open data sets. Adjustments have been made to the values of these foreground data to align with the flow charts for each studied capture process. Table 2 lists the foreground data for further calculation. Table 3 and Table 4 present the inputs and outputs of membrane and MEA, respectively.

3.3. Life Cycle Impact Assessment

The ReCipe 2016 Midpoint method, which integrates the midpoint assessment of CML-IA and the endpoint assessment of Eco-Indicator 99, is selected as the impact assessment method. The ReCipe 2016 Midpoint method contains the widest range of midpoint impact categories, allowing for the application of characterization factors within these categories at an international scale [35]. In addition, the ReCipe 2016 Endpoint method is also used, including damage to human health, damage to ecosystem quality and damage to resources. Table 5 shows the list of 18 midpoint and 3 endpoint impact categories used as indicators of environmental impacts.

3.4. Interpretation

Interpretation is the final stage where the results are evaluated to provide conclusions and recommendations for the decision-making process.

4. Results and Discussion

4.1. Environmental Impact Comparison of Different CO2 Capture Systems

The results of the environmental impact assessment of three studied CO2 capture systems at the midpoint level are shown in Figure 5. The highest value in each impact category is considered the reference value of 100%, while other impact categories with lower values are presented as a ratio to the reference value. In summary, the membrane gas absorption system exhibits the lowest environmental impacts across the majority of assessed categories in comparison with chemical absorption and membrane gas separation systems. At the given function unit of 1 ton CO2 captured from the power plant, the GWP indicator values for membrane gas absorption, chemical absorption and membrane gas separation systems are 393 kgCO2 eq., 456 kgCO2 eq. and 461 kgCO2 eq., respectively. It indicates that the membrane absorption system has superior efficiency in mitigating CO2 emissions, which can be primarily attributed to its reduced energy requirements during the capture phase. Even though membrane gas separation has the highest GWP value among the three capture systems, it exhibits the lowest environmental impact over water-related impact categories such as WCP, TAP, FEP and MEP. That is because the dry operating condition of the membrane gas separation system eliminates the demand for water consumption or wastewater treatment. In contrast, chemical absorption systems present the most significant impact on water-related indicators, primarily because of pollution from absorbent discharges and the ensuing necessity for wastewater treatment. Water-related indicators of the membrane gas absorption system are higher than those of the membrane gas separation system but lower than those of the chemical absorption system, which can prove the advantage of such an integrated system in reducing absorbent losses.
To comprehensively evaluate the environmental performance of CO2 capture systems, the ReCipe Endpoint method with three categories is further employed, with the results shown in Figure 6. In the evaluation of the impacts on human health, ecosystems and resources, the indicator results derived from the characterization phase are aggregated based on their respective damage categories. The damage levels to human health, ecosystems and resources through standardization are converted into dimensionless impact potentials. The three types of impact potentials are weighted and added to form the single score. The standardized benchmark and damage weight values adopt the default values set within the SimaPro software framework. As shown in Figure 6, the impact of CO2 capture on the damage to human health is much higher than the other two indicators regardless of capture systems, which can be attributed to the strong reliance on fossil-based heat and electricity consumption, which has high emissions of harmful substances such as HF, HCl and PM. Regarding the harm to resources and ecosystems, the impact of membrane gas absorption is slightly lower than that of the other two capture systems. In the case of the total damage indicator, the impact value of the membrane gas absorption system is 20% and 10% lower than that of the chemical absorption system and membrane gas separation system, respectively.

4.2. Process Contribution Analysis of the Membrane Gas Absorption System

The contribution of inputs and outputs of the CO2 capture process via the membrane gas absorption system to the total impact in each mid-point category is presented in Figure 7, and its corresponding normalized diagram is shown in Figure 8. Although membrane gas absorption systems can reduce electricity and heat consumption compared to membrane gas separation systems and chemical absorption systems, the contribution of electricity supply and heat consumption remain the primary sources of environmental impact for the life cycle of the entire system, varying from 8% to 88% and from 7% to 91%, respectively. Except for terrestrial ecotoxicity potential and water consumption potential, electricity consumption contributes more than 32% to other impact categories. Notably, electricity consumption leads to dominant impacts in IRP, which contributes 88% of this impact category. Heat consumption for solvent regeneration accounts for 7% and 14% in the IRP and TETP indicators, respectively. Heat consumption contributes more than 50% to TAP, FEP, FETP, MEP, HNCTP and WCP indicators. Especially, the heat consumption contribution to the water consumption potential is more than 90%, due to the large amount of water consumed during the heat production and supply processes. The MEA absorbent used in the membrane contactor accounts for 20% and 66% in the case of MEP and TEP, respectively. It can be attributed to the ammonia-related emissions associated with MEA production, which can cause eutrophication and toxicity in water bodies. It is a bit of a surprise that the membrane materials used during the capture process have negligible influences over all the impact categories, with the minimization and maximization contributions at 0.06% for the WCP indicator and 0.45% for the MRS indicator. The captured CO2 has less impact on other indicators except in the case of global warming potential, which is 28%.
As illustrated in Figure 8, the CO2 capture process via membrane gas absorption has the most significant impact on the METP category, with heat consumption as the primary contributing factor accounting for 55%, followed by electricity consumption accounting for 43.1%. FETP, HCTP and HNCTP are also predominantly influenced by heat and electricity consumption. The most considerable impact on TEP originates from MEA absorbent, which is mainly due to ammonia emissions within the MEA production supply chain. Based on the results shown in Figure 7 and Figure 8, it can be concluded that electricity and heat consumption are the primary contributors to environmental impacts, while MEA absorbent and uncaptured CO2 have influences on limited indicators. Therefore, from the perspective of environmental impact, more efforts should be made to optimize the energy efficiency of membrane gas absorption systems.
To further discuss the impacts of membrane gas absorption systems on human health, ecosystems and resources, the ReCipe Endpoint method is utilized to analyze the above processes, with results presented in Figure 9 and Figure 10. In Figure 9, according to the results obtained from SimaPro 9 software, heat consumption and electricity consumption are identified as the most significant factors among the above three indicators. Specifically, the impact of heat consumption on human health, ecosystems and resource consumption accounts for 42%, 39% and 38%, respectively, while the impact of electricity consumption corresponds to 43%, 40% and 49%, respectively. In addition, the impact of uncaptured CO2 emissions on human health and ecosystems is 14% and 19%, respectively. The production supply chain of MEA absorbent accounts for 13% of the resources, which is much higher than that for human health and ecosystems.
It can be clearly observed in Figure 10 that the impact of the CO2 capture process by membrane gas absorption on human health is much more obvious than ecosystems and resources.

5. Sensitivity Analysis

The analysis of the environmental impacts of CO2 capture by the membrane gas absorption system reveals that heat consumption and electricity consumption are the most critical environmental impact factors within the life cycle of the system. Consequently, the sensitivity analysis of heat and electricity consumption is crucial for the decision-making process.

5.1. Sensitivity Analysis of Heat Supply Sources

The heat required for absorbent regeneration in the membrane gas absorption system can be replaced by steam generated from natural gas combustion, biogas combustion and heat pump technology. Figure 11 shows the change in 18 midpoint indicators under different heat supply sources. Switching the heat supply from coal-fired steam to natural gas can reduce the majority of the impact categories, with a GWP reduction of 12%. The most observable reduction is in WCP, which is reduced nearly by 90%, but the MRS and FFP indicators are increased by 15% and 5%, respectively. In the case of heating by biomass combustion, the WCP indicator presents the most significant reduction by five times, and GWP has a 24% reduction in comparison with the heating method in this study. However, the utilization of biomass combustion leads to a 53% increase in ODP, and a 25-fold increase in LU. The substitution of the heat source with a heat pump brings an unclear improvement to most environmental indicators. For example, the GWP is only reduced by 5% at the cost of an increase in TAP and WCP of 30% and 80%, respectively. In summary, heating with natural gas shows better performance in improving overall environmental impacts. Although biomass combustion heating brings the largest reduction in GWP, which enhances the emission reduction efficiency of the carbon capture process, caution should be exercised as it greatly increases the risk of LU.

5.2. Sensitivity Analysis of Electricity Supply

With the improvement of China’s energy structure, the share of renewable energy for electricity generation is increasing. Therefore, the impact of electricity supply from the national grid will continue to decrease with time. From 2030 to 2050, China’s power structure will decarbonize progressively in order to achieve carbon neutrality goals. The electricity supply structure will transition from being coal-dominated to being primarily based on renewable energy generation, which will have a significant influence on the net emissions reduction and environmental impacts of CO2 capture by membrane gas absorption systems. As the energy structure shifts in a more sustainable direction, the increase in the proportion of renewable energy generation indicates that the environmental impact of electricity from the grid will gradually decrease. Table 6 lists the electricity generation forecast taken from the China Energy Outlook 2020 [36]. The GWP of the electricity mix is calculated by modifying the Ecoinvent database by elaborating on different production mixes based on different years.
Figure 12 presents the sensitivity analysis of electricity supply under different scenarios. The environmental impacts of membrane gas absorption technology on greenhouse gas emissions, fossil resource consumption, ozone formation and eutrophication will be gradually decreased with the green transformation of the power structure. It is expected that by 2030, the global warming potential will decrease by 12% with the initial decarbonization of power structures and the increasing proportion of renewable energy. However, the expected reduction in global warming potential is 5% as the decarbonization process slows down between 2030 and 2040. Subsequently, with the rapid increase in renewable energy and the significant reduction in the use of fossil fuels from 2040 to 2050, the reduction in global warming potential will exceed 15%. The trends in the impact of fossil resource consumption and ozone formation are similar to those of global warming potential, which have a significant reduction in 2030 and an expected decrease of more than 15% by 2050, mainly due to the substantial reduction in the use of fossil fuels. The analysis of impact indicators for freshwater eutrophication, marine eutrophication, human carcinogenic toxicity and human non-carcinogenic toxicity shows that the related impacts are gradually decreasing with the improvement in the energy structure. It can be mainly attributed to the reduction in coal use, which alleviates the environmental impacts of waste generated during its extraction process. With increasing reliance on renewable energy from 2030 to 2050, there is an increasing demand for mineral resource extraction, leading to an upward trend in the impacts of ionizing radiation, mineral resource consumption, terrestrial ecotoxicity, freshwater ecotoxicity and marine ecotoxicity. The results reflect the challenges of the increasing utilization of renewable energy, especially the ecological and environmental issues caused by mineral resource extraction.

6. Conclusions

In this study, a membrane gas absorption system for CO2 capture was retrofitted to a 685 MWe supercritical pulverized coal power plant, which uses hollow fiber membrane contactors as the absorber and desorber. A life cycle assessment was carried out to evaluate the environmental impacts of the membrane gas absorption technology. Furthermore, sensitivity analysis was conducted in order to find out the critical factors affecting the system’s environmental performance. Based on the research results, the following conclusions can be drawn:
(1)
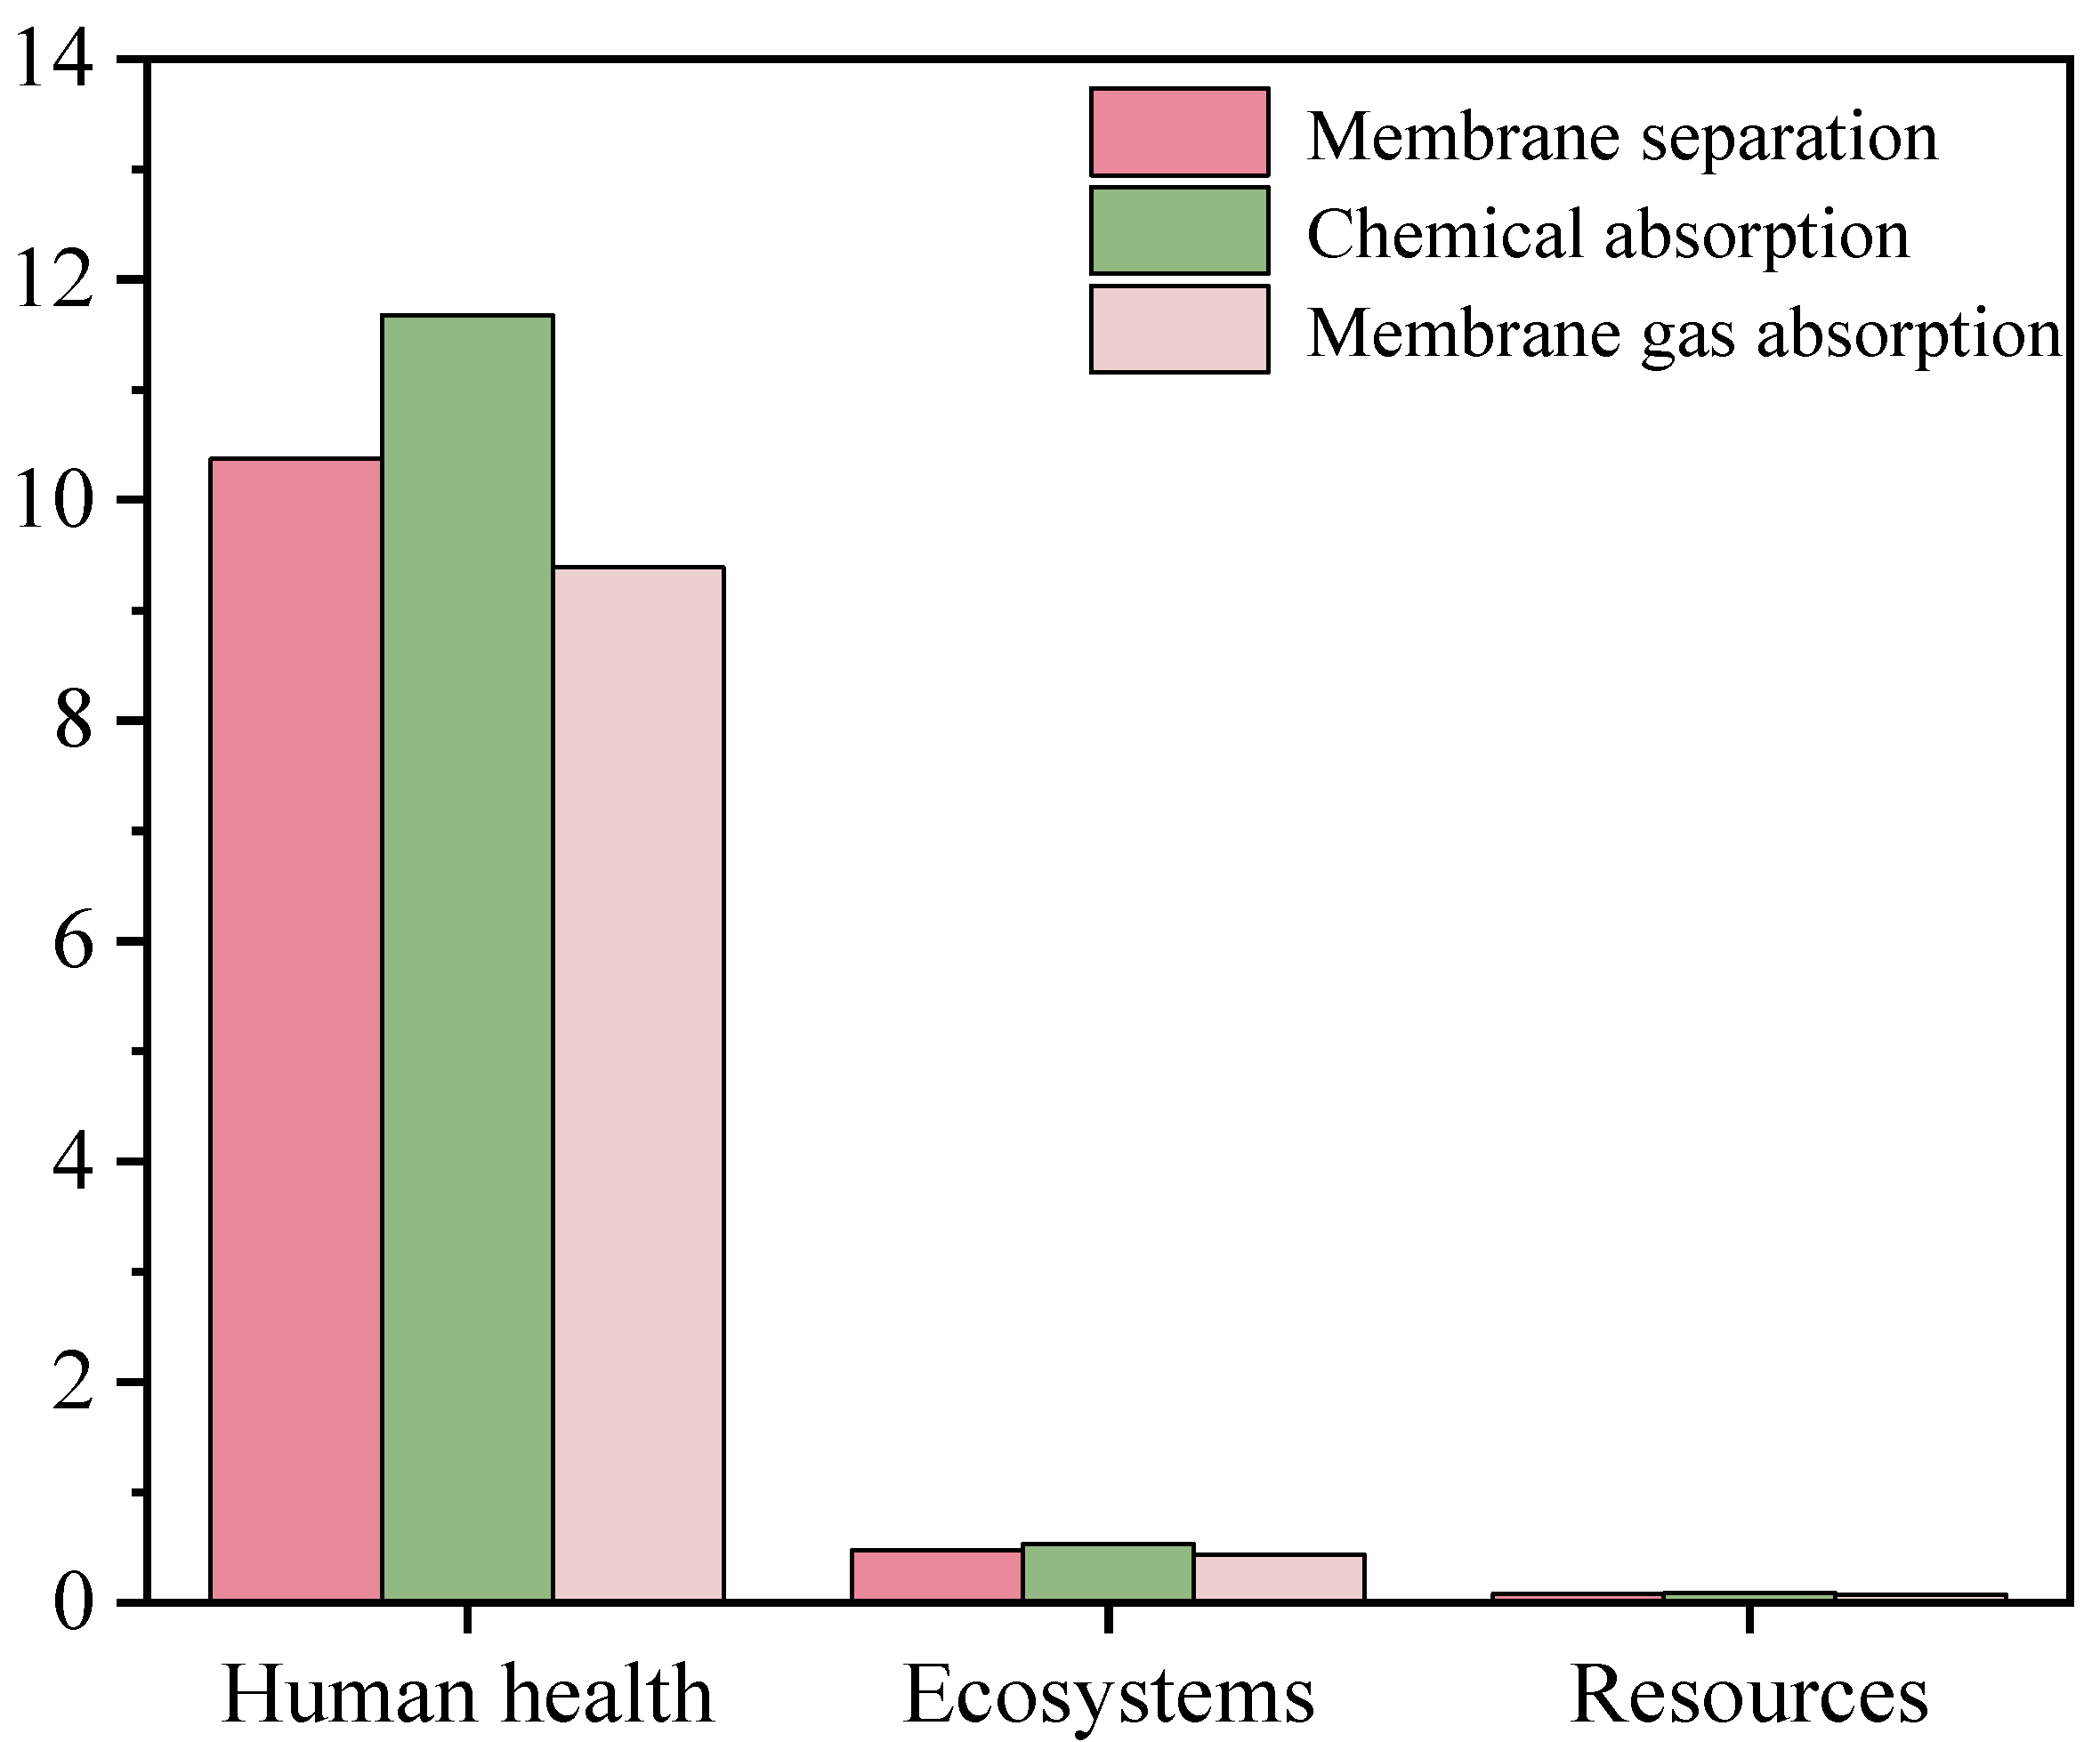
At the given function unit of 1 ton CO2 captured from the power plant, the membrane gas absorption system exhibits the lowest environmental impacts across the majority of evaluated categories in comparison with chemical absorption and membrane gas separation systems. In particular, the GWP indicator values are 393 kgCO2 eq., 456 kgCO2 eq. and 461 kgCO2 eq. for membrane gas absorption, chemical absorption and membrane gas separation systems, respectively. Furthermore, membrane gas separation exhibits the lowest environmental impact over water-related impact categories such as WCP, TAP, FEP and MEP.
(2)
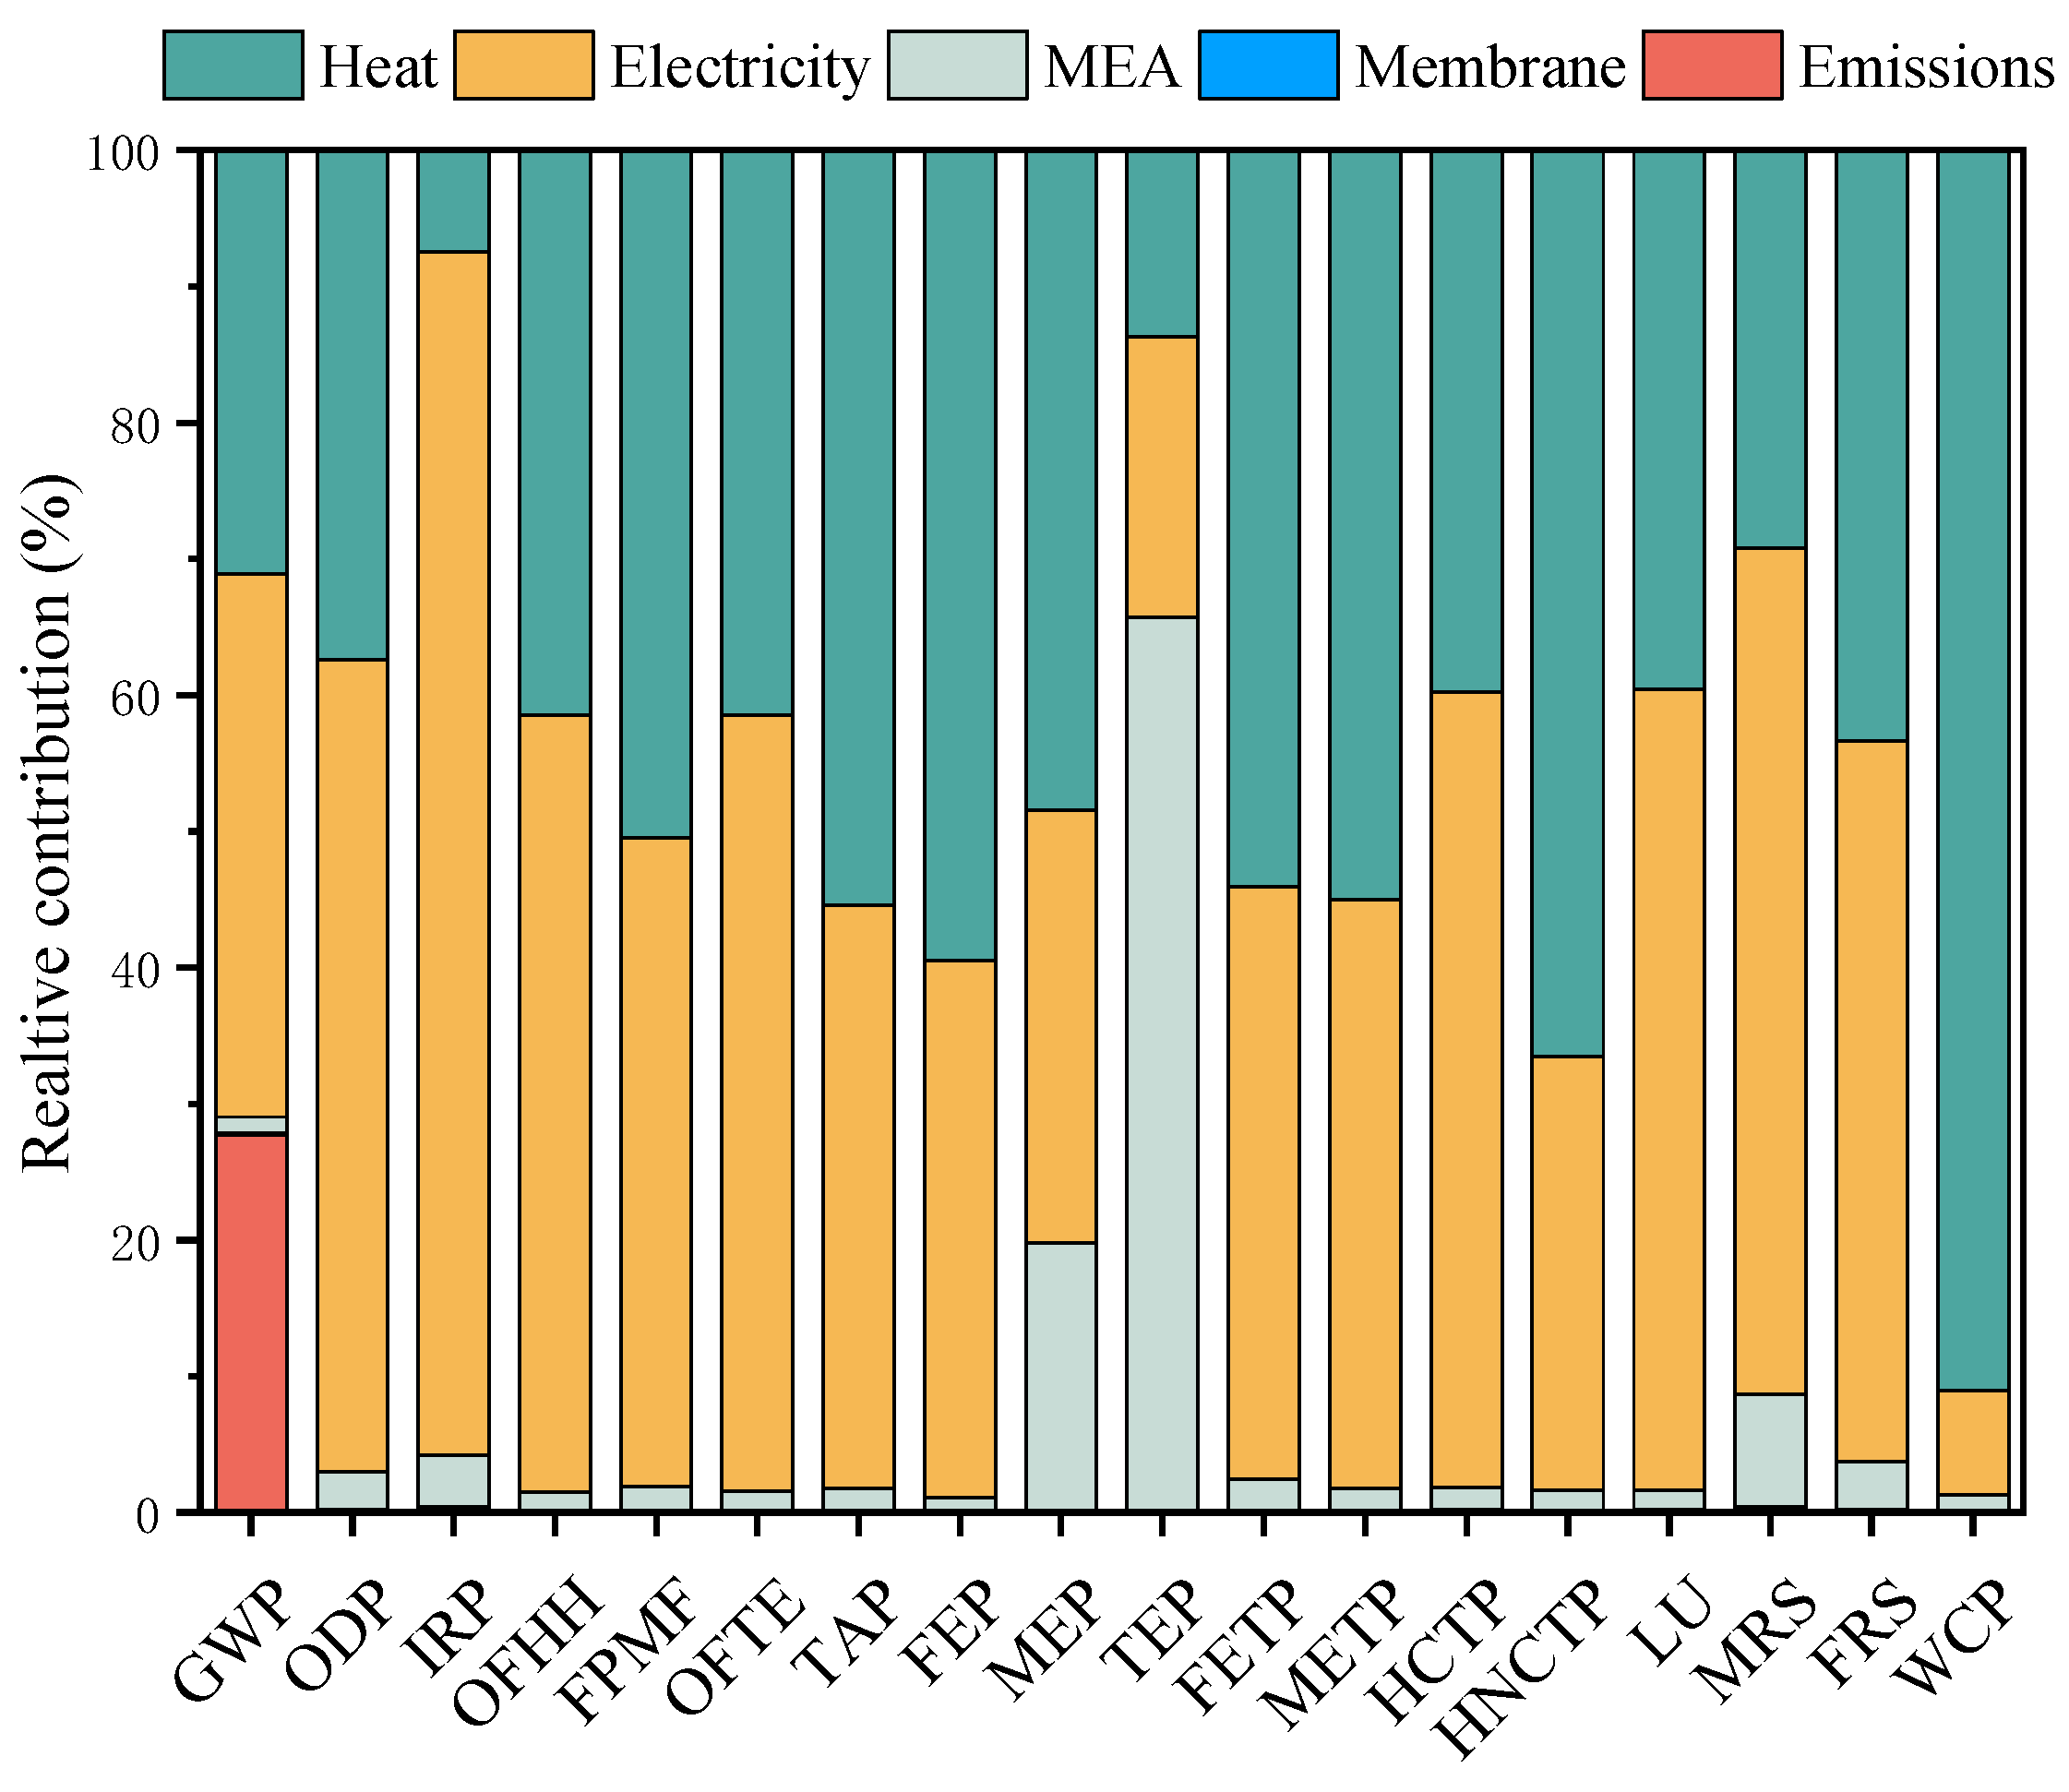
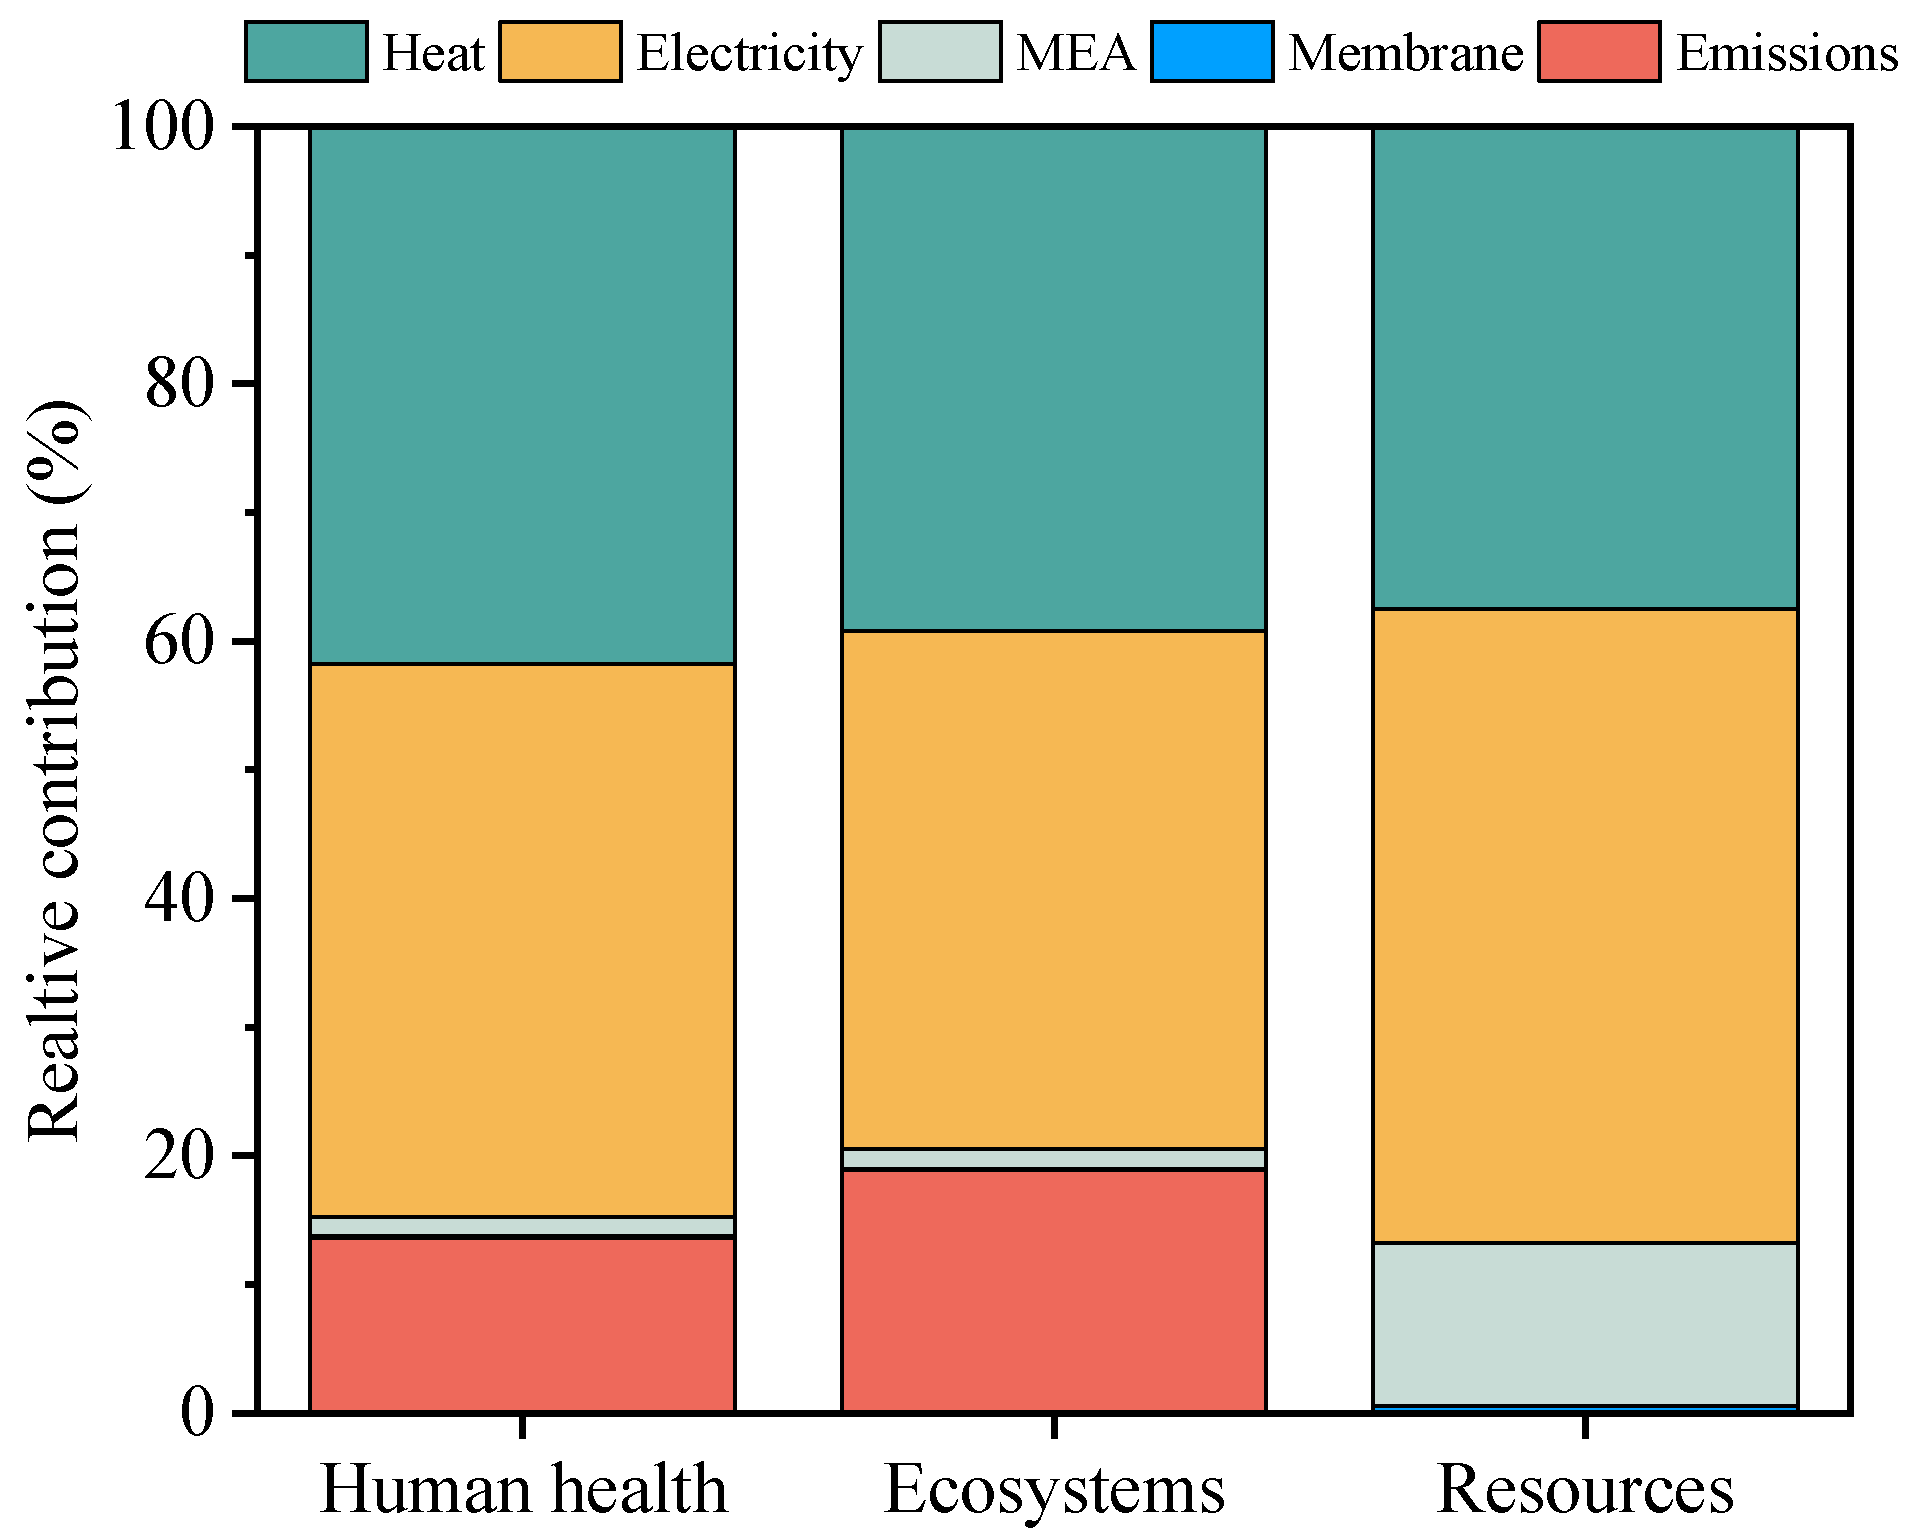
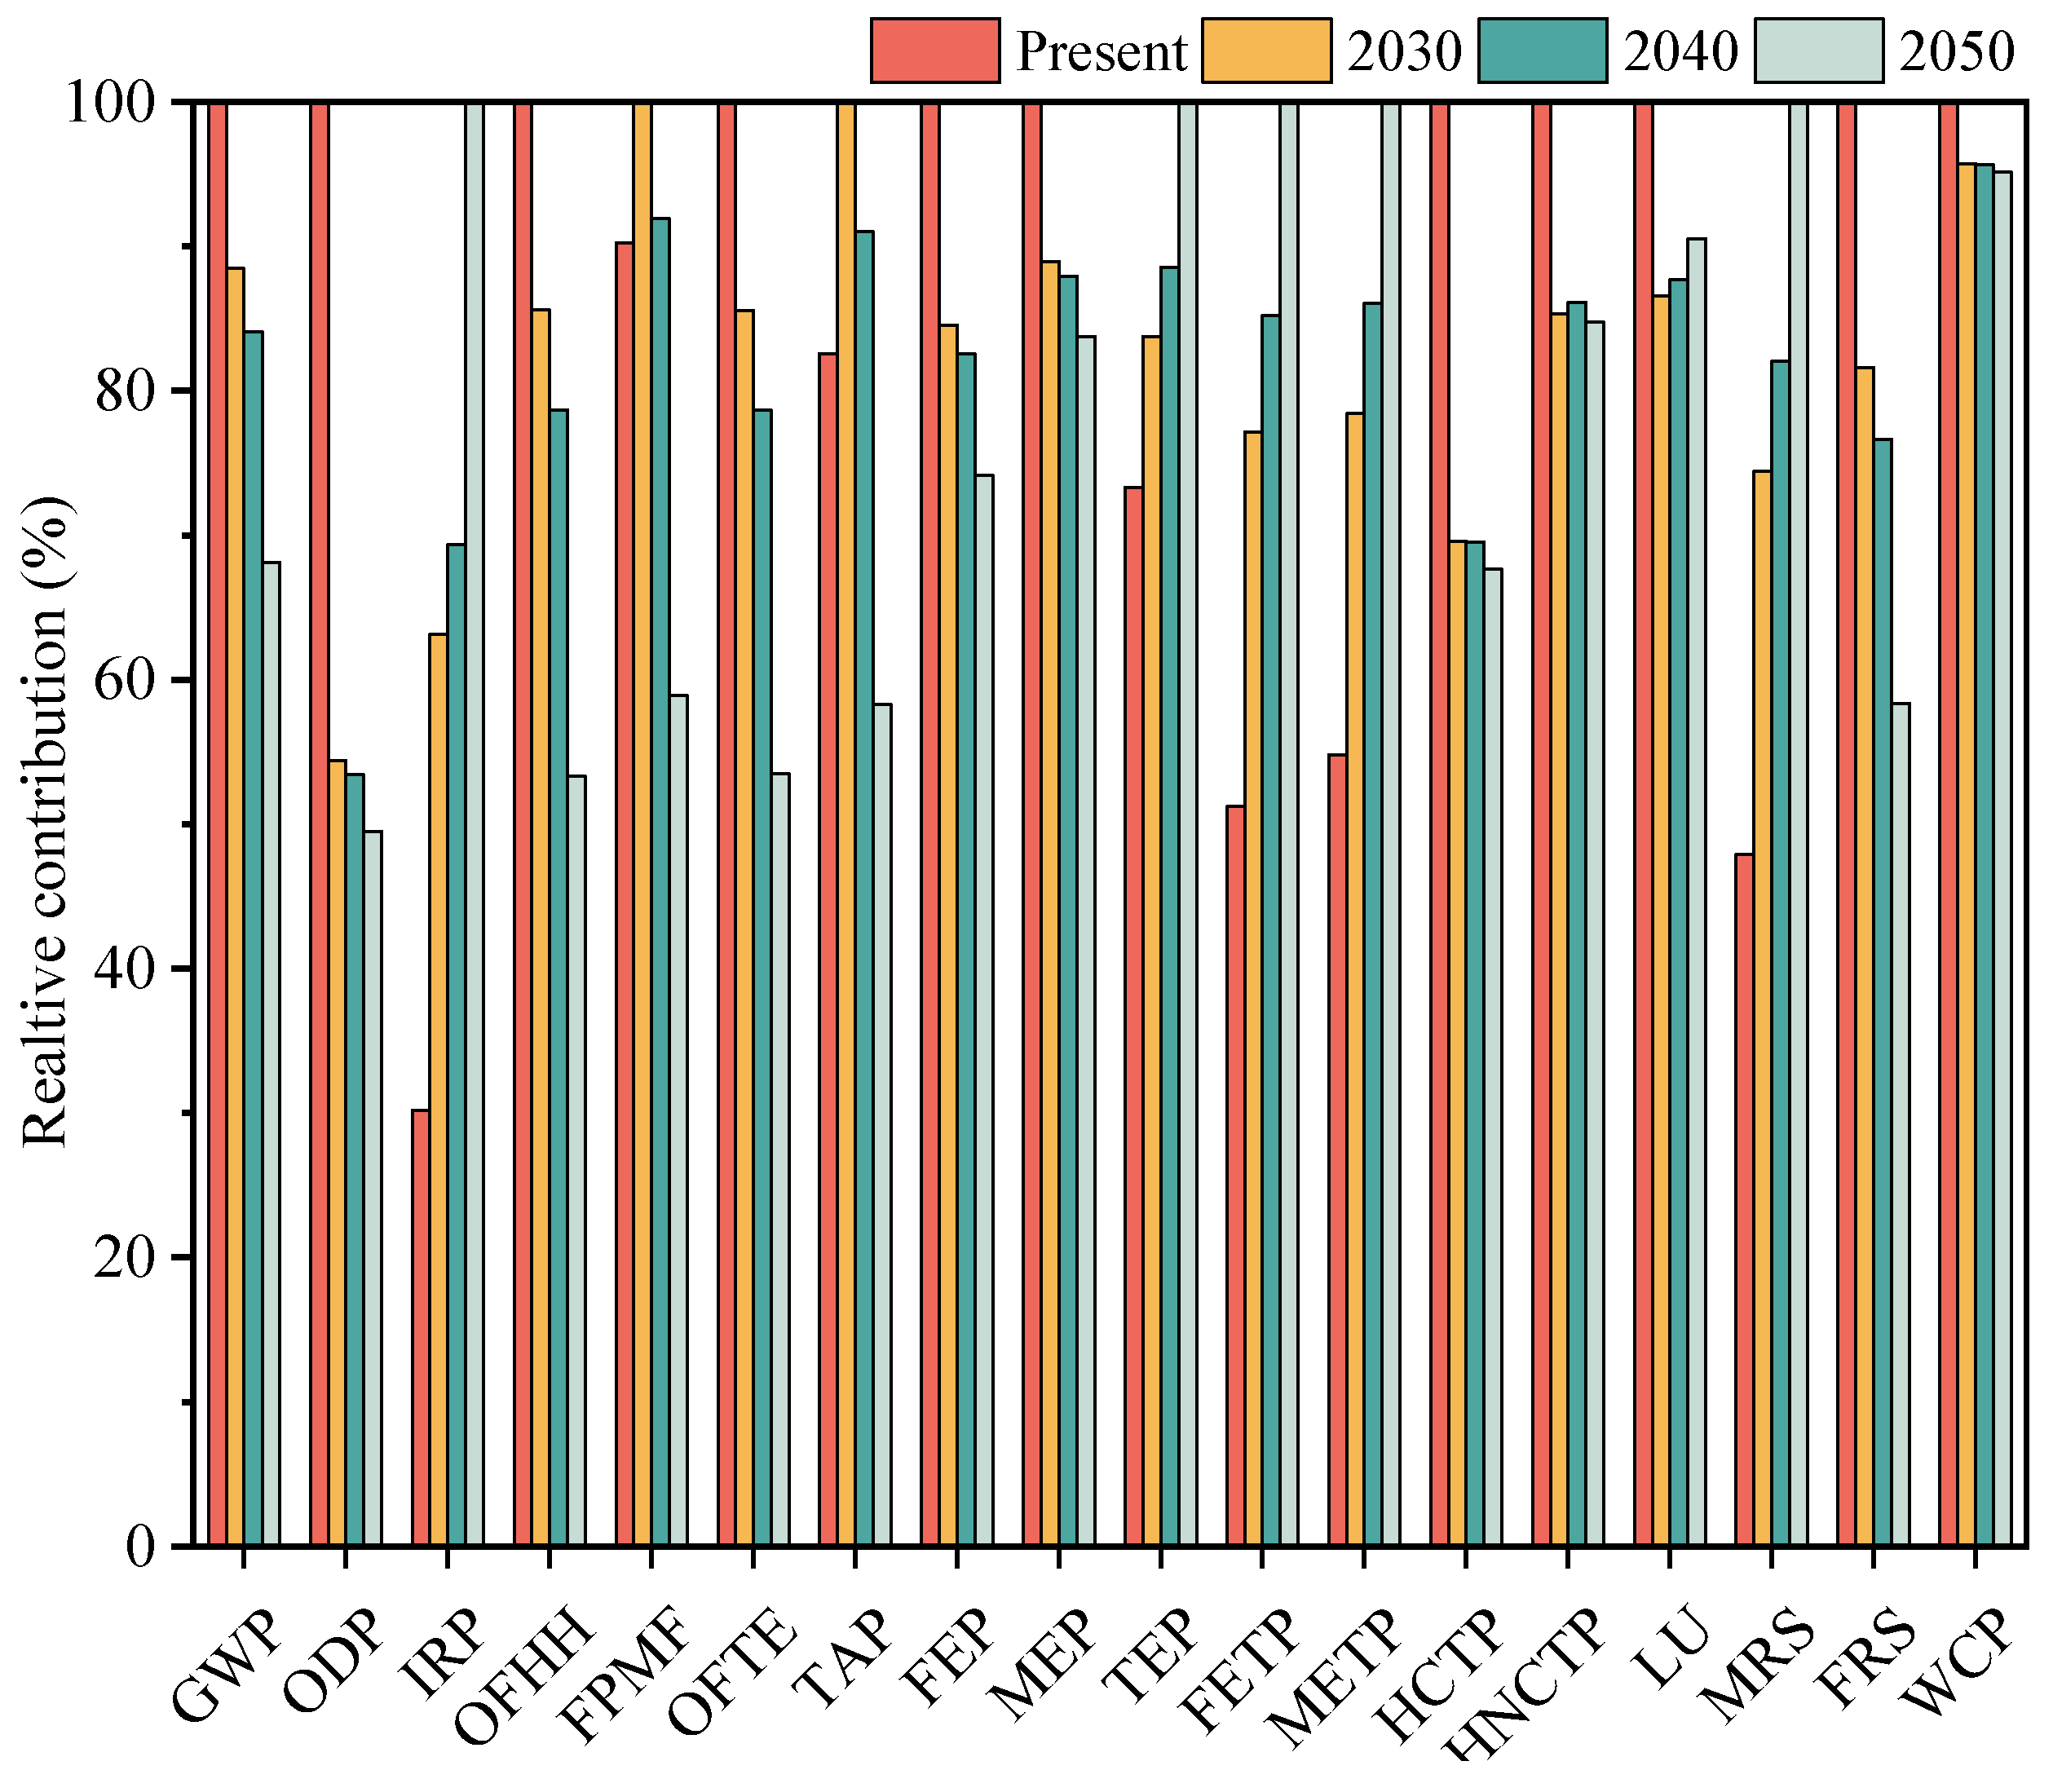
For the membrane gas absorption system, the contribution of electricity supply and heat consumption are the primary sources of environmental impact within the system life cycle, varying from 8% to 88%, and from 7% to 91%, respectively. Electricity consumption leads to significant impacts in IRP, which contributes 88% of this impact category. Heat consumption’s contribution to water consumption potential is more than 90%, due to the large amount of water consumed during the heat production and supply processes. The impact of heat consumption on human health, ecosystems and resource consumption accounts for 42%, 39% and 38%, respectively, while the impact of electricity consumption corresponds to 43%, 40% and 49%, respectively.
(3)
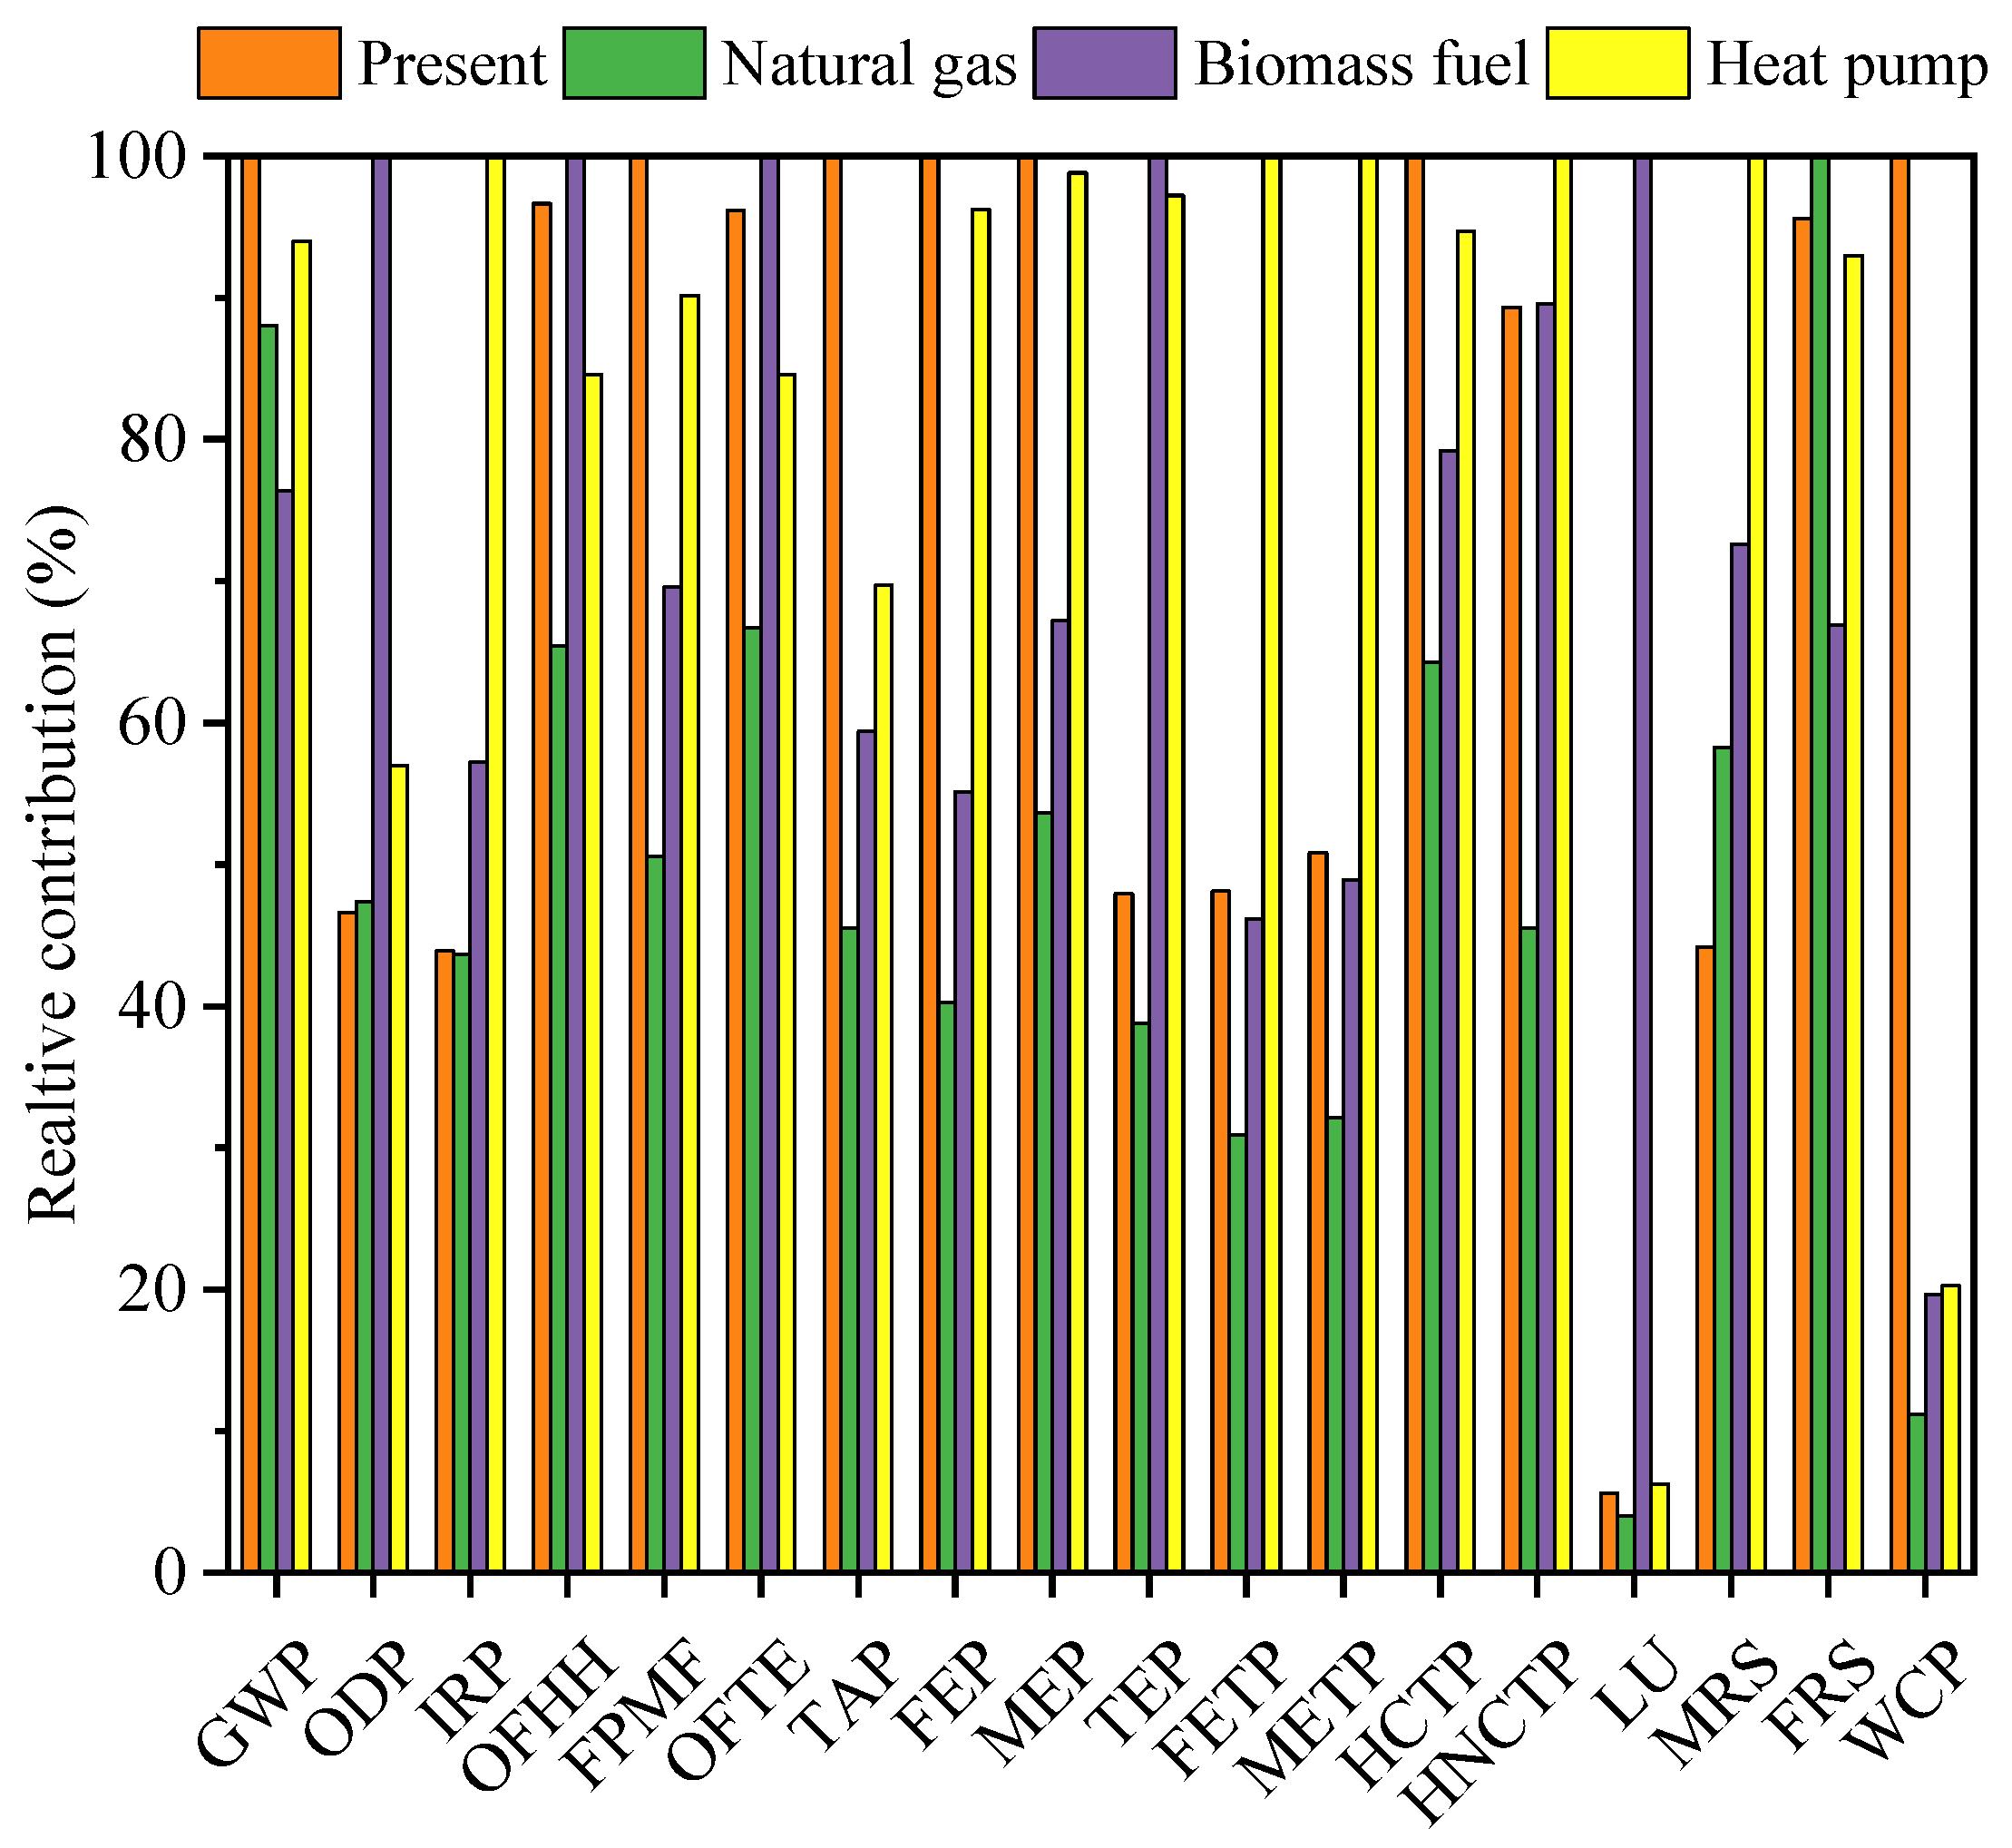
Sensitivity analysis results show that switching the heat supply from coal-fired steam to natural gas can reduce the majority of the impact categories, with a GWP reduction of 12%. The most observable reduction in WCP was nearly 90%, but the SOP and FFP indicators increased by 15% and 5%, respectively. Considering the power structure decarbonization from 2030 to 2050 in China, the global warming potential, fossil resource consumption and ozone formation can be significantly reduced by increasing the utilization of renewable energy. However, ecological and environmental issues are also caused by mineral resource extraction.

Author Contributions

Methodology, F.L., Y.L. and W.Z.; Software, F.L.; Validation, F.L. and W.Z.; Formal analysis, F.L. and J.B.; Investigation, F.L.; Resources, F.L., H.Z. and Y.S.; Data curation, J.B., H.Z. and J.M.; Writing—original draft, F.L. and J.B.; Writing—review & editing, Y.L., H.Z. and T.D.; Supervision, Y.L.; Project administration, Y.L.; Funding acquisition, Y.L., Y.S. and T.D. All authors have read and agreed to the published version of the manuscript.

Funding

The research was carried out with the financial support of Young Innovative Talents Introduction & Cultivation Program for Colleges and Universities of Shandong Province (Sub-title: Innovative Research Team of Advanced Energy Equipment) granted by Department of Education of Shandong Province, Natural Science Foundation of Shandong Province (No. ZR2021ME174, No. ZR2020ME178) and Shenzhen Fundamental Research Program (No. JCYJ20220530141009020).

Data Availability Statement

Data are contained within the article.

Conflicts of Interest

The authors declare no conflict of interest.

References

  1. The Intergovernmental Panel on Climate Change. Available online: https://www.ipcc.ch/sr15/ (accessed on 26 October 2023).
  2. EU Action. Available online: https://climate.ec.europa.eu/eu-action/european-climate-law_en (accessed on 26 October 2023).
  3. Silva Herran, D.; Fujimori, S. Beyond Japanese NDC: Energy and macroeconomic transitions towards 2050 in emission pathways with multiple ambition levels. Sustain. Sci. 2021, 16, 489–501. [Google Scholar] [CrossRef]
  4. The Long-Term Strategy of the United States. Available online: https://www.whitehouse.gov/wp-content/uploads/2021/10/us-long-term-strategy.pdf (accessed on 8 November 2023).
  5. China’s Route to Carbon Neutrality: Perspectives and the Role of Renewables. Available online: https://www.irena.org/publications/2022/Jul/Chinas-Route-to-Carbon-Neutrality (accessed on 26 October 2023).
  6. Zarei, F.; Keshavarz, P. High performance CO2 Absorption/Desorption using Amine-Functionalized magnetic nanoparticles. Sep. Purif. Technol. 2023, 323, 124438. [Google Scholar] [CrossRef]
  7. Guo, B.; Zhang, J.; Wang, Y.; Qiao, X.; Xiang, J.; Jin, Y. Study on CO2 adsorption capacity and kinetic mechanism of CO2 adsorbent prepared from fly ash. Energy 2023, 263 Pt B, 125764. [Google Scholar] [CrossRef]
  8. Nandakishora, Y.; Sahoo, R.K.; Murugan, S.; Gu, S. 4E analysis of the cryogenic CO2 separation process integrated with waste heat recovery. Energy 2023, 278 Pt A, 127922. [Google Scholar]
  9. Ahmadijokani, F.; Molavi, H.; Ahmadipouya, S.; Rezakazemi, M.; Ghaffarkhah, A.; Kamkar, M.; Shojaei, A.; Arjmand, M. Polyurethane-based membranes for CO2 separation: A comprehensive review. Prog. Energy Combust. Sci. 2023, 97, 101095. [Google Scholar] [CrossRef]
  10. Khan, U.; Ogbaga, C.C.; Abiodun, O.-A.O.; Adeleke, A.A.; Ikubanni, P.P.; Okoye, P.U.; Okolie, J.A. Assessing absorption-based CO2 capture: Research progress and techno-economic assessment overview. Carbon Capture Sci. Technol. 2023, 8, 100125. [Google Scholar] [CrossRef]
  11. Han, Y.; Yang, Y.; Ho, W.W. Recent progress in the engineering of polymeric membranes for CO2 capture from flue gas. Membranes 2020, 10, 365. [Google Scholar] [CrossRef]
  12. Villeneuve, K.; Zaidiza, D.A.A.; Roizard, D.; Rode, S. Modeling and simulation of CO2 capture in aqueous ammonia with hollow fiber composite membrane contactors using a selective dense layer. Chem. Eng. Sci. 2018, 190, 345–360. [Google Scholar] [CrossRef]
  13. Jang, M.-G.; Yun, S.; Kim, J.-K. Process design and economic analysis of membrane-integrated absorption processes for CO2 capture. J. Clean. Prod. 2022, 368, 133180. [Google Scholar] [CrossRef]
  14. Molina-Fernández, C.; Renson, T.; Deveen, V.; Martín-Chinarro, C.; Chaplier, G.; Vitola, G.; Mazzei, R.; Giorno, L.; Luis, P. Immobilization of carbonic anhydrase on poly(ionic liquid) composite membranes for CO2 absorption by gas-liquid membrane contactors. J. Membr. Sci. 2023, 687, 122011. [Google Scholar] [CrossRef]
  15. Eskandari, M.; Khaksar, S.A.N.; Keshavarz, P. CO2 absorption using benzylamine as absorbent and promoter in a hollow fiber membrane contactor: A numerical study. J. CO2 Util. 2022, 66, 102287. [Google Scholar] [CrossRef]
  16. Vaezi, M.; Sanaeepur, H.; Amooghin, A.E.; Nakhjiri, A.T. Modeling of CO2 absorption in a membrane contactor containing 3-diethylaminopropylamine (DEAPA) solvent. Int. J. Greenh. Gas Control 2023, 127, 103938. [Google Scholar] [CrossRef]
  17. Kim, K.; Lee, H.; Park, H.S.; Song, H.; Kim, S. Surface modification of polypropylene hollow fiber membranes using fluorosilane for CO2 absorption in a gas-liquid membrane contactor. Heliyon 2023, 9, e19829. [Google Scholar] [CrossRef]
  18. Imtiaz, A.; Othman, M.H.D.; Jilani, A.; Khan, I.U.; Kamaludin, R.; Ayub, M.; Samuel, O.; Kurniawan, T.A.; Hashim, N.; Puteh, M.H. A critical review in recent progress of hollow fiber membrane contactors for efficient CO2 separations. Chemosphere 2023, 325, 138300. [Google Scholar] [CrossRef]
  19. Shiravi, A.; Maleh, M.S.; Raisi, A.; Sillanpää, M. Hollow fiber membrane contactor for CO2 capture: A review of recent progress on membrane materials, operational challenges, scale-up and economics. Carbon Capture Sci. Technol. 2024, 10, 100160. [Google Scholar] [CrossRef]
  20. Kim, S.; Scholes, C.A.; Heath, D.E.; Kentish, S.E. Gas-liquid membrane contactors for carbon dioxide separation: A review. Chem. Eng. J. 2021, 411, 128468. [Google Scholar] [CrossRef]
  21. Koornneef, J.; van Keulen, T.; Faaij, A.; Turkenburg, W. Life cycle assessment of a pulverized coal power plant with post-combustion capture, transport and storage of CO2. Int. J. Greenh. Gas Control 2008, 2, 448–467. [Google Scholar] [CrossRef]
  22. Petrescu, L.; Bonalumi, D.; Valenti, G.; Cormos, A.-M.; Cormos, C.-C. Life Cycle Assessment for supercritical pulverized coal power plants with post-combustion carbon capture and storage. J. Clean. Prod. 2017, 157, 10–21. [Google Scholar] [CrossRef]
  23. Surprenant, R. Comparison of life-cycle assessment between bio-catalyzed and promoted potassium carbonate processes and amine-based carbon capture technologies. Int. J. Greenh. Gas Control 2019, 88, 134–155. [Google Scholar]
  24. Giordano, L.; Roizard, D.; Favre, E. Life cycle assessment of post-combustion CO2 capture: A comparison between membrane separation and chemical absorption processes. Int. J. Greenh. Gas Control 2018, 68, 146–163. [Google Scholar] [CrossRef]
  25. Wang, Y.; Pan, Z.; Zhang, W.X.; Huang, S.C.; Yu, G.J.; Soltanian, M.R.; Lichtfouse, E.; Zhang, Z.E. Higher efficiency and lower environmental impact of membrane separation for carbon dioxide capture in coal power plants. Environ. Chem. Lett. 2023, 21, 1951–1958. [Google Scholar] [CrossRef]
  26. Akan, A.P.; Chau, J.; Gullu, G.; Sirkar, K.K. Life Cycle Assessment of Post-Combustion CO2 Capture and Recovery by Hydrophobic Polypropylene Cross-Flow Hollow Fiber Membrane Contactors with Activated Methyldiethanolamine. Atmosphere 2023, 14, 490–513. [Google Scholar] [CrossRef]
  27. James, R.E., III; Kearins, D.; Turner, M.; Woods, M.; Kuehn, N.; Zoelle, A. Cost and Performance Baseline for Fossil Energy Plants Volume 1: Bituminous Coal and Natural Gas to Electricity; NETL: Pittsburgh, PA, USA; Morgantown, WV, USA, 2019.
  28. Scholes, C.A. Membrane contactors modelled for process intensification post combustion solvent regeneration. Int. J. Greenh. Gas Control 2019, 87, 203–210. [Google Scholar] [CrossRef]
  29. Nguyen, K.; Iliuta, I.; Bougie, F.; Pasquier, L.-C.; Iliuta, M.C. Techno-economic assessment of enzymatic CO2 capture in hollow fiber membrane contactors with immobilized carbonic anhydrase. Sep. Purif. Technol. 2023, 307, 122702. [Google Scholar] [CrossRef]
  30. Lillepärg, J.; Georgopanos, P.; Shishatskiy, S. Stability of blended polymeric materials for CO2 separation. J. Membr. Sci. 2014, 467, 269–278. [Google Scholar] [CrossRef]
  31. ISO 14040:2006; Environmental Management—Life Cycle Assessment—Principles and Framework. ISO: Geneva, Switzerland, 2006.
  32. ISO 14044:2006; Environmental Management—Life Cycle Assessment—Requirements and Guidelines. ISO: Geneva, Switzerland, 2006.
  33. Ecoinvent. Available online: https://ecoinvent.org/the-ecoinvent-database/ (accessed on 26 October 2023).
  34. Yadav, P.; Ismail, N.; Essalhi, M.; Tysklind, M. Assessment of the environmental impact of polymeric membrane production. J. Membr. Sci. 2021, 622, 118987. [Google Scholar] [CrossRef]
  35. Huijbregts, M.A.J.; Steinmann, Z.J.N.; Elshout, P.M.F.; Stam, G.; Verones, F.; Vieira, M.; Zijp, M.; Hollander, A.; van Zelm, R. ReCipe2016: A harmonised life cycle impact assessment method at midpoint and endpoint level. Int. J. Life Cycle Assess. 2017, 22, 138–147. [Google Scholar] [CrossRef]
  36. China Energy Outlook. Available online: https://international.lbl.gov/china-energy-outlook-0 (accessed on 26 October 2023).
Figure 1. Schematic drawing of CO2 capture by membrane gas absorption.
Energies 17 02371 g001
Figure 2. Schematic drawing of CO2 capture by the MEA-based chemical absorption process.
Energies 17 02371 g002
Figure 3. Schematic drawing of CO2 capture by two-stage membrane gas separation.
Energies 17 02371 g003
Figure 4. System boundary of CO2 capture and recovery by three studied technologies.
Energies 17 02371 g004
Figure 5. Environmental impact comparison based on 18 midpoint methods.
Energies 17 02371 g005
Figure 6. Comparison of three indicators of resources, ecosystems and human health.
Energies 17 02371 g006
Figure 7. Contributions of membrane gas absorption to midpoint indicators.
Energies 17 02371 g007
Figure 8. Normalized diagram of the CO2 capture process by the membrane gas absorption system.
Energies 17 02371 g008
Figure 9. Process contributions of membrane gas absorption on endpoint indicators.
Energies 17 02371 g009
Figure 10. Normalized diagram of three endpoint indicators during the CO2 capture process.
Energies 17 02371 g010
Figure 11. Sensitivity analysis on different heat supply sources.
Energies 17 02371 g011
Figure 12. Sensitivity analysis of electricity supply.
Energies 17 02371 g012
Table 1. Parameters of hollow fiber membrane contactors [29].
ParametersValue
Fiber inner diameter (m)3.0 × 10⁻⁴
Fiber outer diameter (m)5.0 × 10⁻⁴
Pore diameter (m)1.0 × 10⁻⁷
Porosity0.5
Outer specific area (m2/m3)1500
Inner specific area (m2/m3)900
Gas velocity (m/s)1.0
Liquid velocity (m/s)0.07
Number of absorber contactors
Number of desorber contactors
100
100
Effective height (m)4.0
Membrane materialPolysulfone
Table 2. Foreground data on material and energy consumption.
System ParametersUnitValue
Membrane gas absorption [29]
MEA consumptionkg/t CO20.9
Membrane area103 m24400
Regeneration heatGJ/t CO22
CompressorkWh/t CO283.3
Auxiliary equipmentkWh/t CO267.96
Chemical absorption [24]
MEA consumptionkg/t CO21.44
Regeneration heatGJ/t CO23.2
CompressorkWh/t CO264.5
Auxiliary equipmentkWh/t CO233.8
Membrane gas separation system [24]
Membrane area103 m22828.5
CompressorkWh/t CO277.1
Auxiliary equipmentkWh/t CO2230.4
Table 3. Inputs and outputs for producing 1000 m2 of hollow fiber membrane [34].
UnitValue
InputWater, unspecified natural originL3000
Oxygenkg32.8
Water, deionizedkg3.2
2,4-dichlorophenolkg75.2
Benzenekg79.2
Bisphenolkg28.8
Electricitykg2871.84
Heatkg72.27
Carbon dioxide, liquidkg161.59
Ethylene oxidekg160.17
NitrogenL0.561
OutputHollow fiber membranem21000
Wastewater, averageL5000
Ethylene oxidekg0.08
Carbon dioxide, fossilkg1.7
Spent catalyst base from ethylene oxide productionkg1.6
Phenolkg0.056
Phenol, 2,4-dichlorokg0.16
Waterm30.96
Table 4. List of inputs and outputs for producing 1 kg of MEA [35].
UnitAmount
InputEthylene oxideg816
Ammoniag788
ElectricitykWh0.333
Natural gasMJ2
Transport (truck and train)t × km11.23
Infrastructure chemical plantp4 × 1010
OutputMonoethanolaminekg1
Waste heatMJ1.2
Ethylene oxide to airg1.63
Ethylene oxide to waterg1.47
Ammonia to airg1.58
Ammonium to waterg3.04
CO2g26.5
Nitrate (NO2) to waterg6.97
COD.BODg21.3
TOC.DOCg8.02
Table 5. List of life cycle impact categories.
Name of the Impact CategoryExpression in Equivalent UnitAbbreviation
ReCipe 2016 Midpoint indicators
Global warming potentialkg CO2 to air eq.GWP
Ozone layer depletion potentialkg CFC-11 eq.ODP
Ionizing radiation potentialkBq Cobalt-60 to air eq.IRP
Ozone formation, human healthkg NOx eq.OFHH
Fine particulate matter formationkg PM2.5 to air eq.FPMF
Ozone formation, terrestrial ecosystemskg NOx eq.OFTE
Terrestrial acidification potentialkg SO2 eq.TAP
Freshwater eutrophication potentialkg P eq.FEP
Marine eutrophication potentialkg N eq.MEP
Terrestrial ecotoxicity potentialkg 1,4-DCB to industrial soil eq.TEP
Freshwater ecotoxicity potentialkg 1,4-DCB to freshwater eq.FETP
Marine ecotoxicity potentialkg 1,4-DCB to marine water eq.METP
Human carcinogenic toxicity potentialkg 1,4-DCB eq.HCTP
Human non-carcinogenic toxicity potentialkg 1,4-DCB eq.HNCTP
Land usem2 × year annual cropland eq.LU
Mineral resource scarcitykg Cu eq.MRS
Fossil resource scarcitykg oil-eq.FRS
Water consumption potentialm3 water-eq. consumedWCP
ReCipe 2016 Endpoint indicators
Damage to human healthpoints
Damage to ecosystem qualitypoints
Damage to resourcespoints
Table 6. Electricity generation structure forecast.
2020202520302035204020452050
Coal55%54%52%42%34%20%5%
Natural gas4%5%5%5%5%6%5%
Hydro21%19%17%16%15%16%18%
Nuclear6%7%8%10%11%13%16%
Wind8%11%13%18%22%25%29%
Solar5%4%6%9%13%19%27%
Electricity GWP kgCO2 eq/kWh0.7240.7140.6910.5860.4820.3290.143
Note: Electricity mix production considers transmission loss and associated emissions from the grid.
Disclaimer/Publisher’s Note: The statements, opinions and data contained in all publications are solely those of the individual author(s) and contributor(s) and not of MDPI and/or the editor(s). MDPI and/or the editor(s) disclaim responsibility for any injury to people or property resulting from any ideas, methods, instructions or products referred to in the content.

