Article

Techno-Economic Evaluation on Solar-Assisted Post-Combustion CO2 Capture in Hollow Fiber Membrane Contactors

1
School of Mechanical Engineering, Qilu University of Technology (Shandong Academy of Sciences), Jinan 250353, China
2
Shandong Institute of Mechanical Design and Research, Jinan 250031, China
3
School of Energy and Power Engineering, Shandong University, Jinan 250061, China
4
Shenzhen Research Institute, Shandong University, Shenzhen 518057, China
*
Author to whom correspondence should be addressed.
Energies 2024, 17(9), 2139; https://doi.org/10.3390/en17092139
Submission received: 7 April 2024 / Revised: 22 April 2024 / Accepted: 29 April 2024 / Published: 30 April 2024
(This article belongs to the Special Issue Sustainable Technologies for Decarbonising the Energy Sector)

Abstract

:
In this study, a novel system which integrates solar thermal energy with membrane gas absorption technology is proposed to capture CO2 from a 580 MWe pulverized coal power plant. Technical feasibility and economic evaluation are carried out on the proposed system in three cities with different solar resources in China. Research results show that the output capacity and net efficiency of the SOL-HFMC power plant are significantly higher than those of the reference power plant regardless of whether a TES system is applied or not. In addition, the CEI of the SOL-HFMC power plant with the TES system is 4.36 kg CO2/MWh, 4.45 kg CO2/MWh and 4.66 kg CO2/MWh lower than that of the reference power plant. The prices of the membrane, vacuum tube collector and phase change material should be reduced to achieve lower LCOE and COR values. Specifically for the SOL-HFMC power plant with the TES system, the corresponding vacuum tube collector price shall be lower than 25.70 $/m2 for Jinan, 95.20 $/m2 for Xining, and 128.70 $/m2 for Lhasa, respectively. To be more competitive than a solar-assisted ammonia-based post-combustion CO2 capture power plant, the membrane price in Jinan, Xining and Lhasa shall be reduced to 0.012 $/m, 0.015 $/m and 0.016 $/m for the sake of LCOE, and 0.03 $/m, 0.033 $/m and 0.034 $/m for the sake of COR, respectively.

1. Introduction

Global warming due to increasing concentrations of greenhouse gases in the atmosphere has resulted in profound and detrimental effects on our planet, such as sea level rise, extreme weather events, and disruptions to ecosystems and biodiversity. The Intergovernmental Panel on Climate Change (IPCC) highlighted that the rise in the global average temperature shall be limited to 1.5 °C above the preindustrial level to achieve the ambitions of the Paris Agreement [1]. The European Union and the US White House both have the ambitious targets of achieving net-zero greenhouse gas emissions by 2050 [2]. Similarly, China has announced its commitment to peak its carbon dioxide emissions before 2030 and attain carbon neutrality by 2060 [3]. Transitioning to sustainable renewable energy, improving energy efficiency, and carbon capture and storage (CCS) have been considered as three effective approaches to reduce greenhouse gas emissions and the global average temperature rise [4]. CCS is an attractive strategy to stabilize or reduce atmospheric CO2 levels in the short term, which involves the CO2 capture from industrial processes, transportation from large-scale emission sources via ship or in a pipeline, and final storage in deep underground geological formations.
A CO2 post-combustion capture system is promising to mitigate CO2 emissions from coal-fired power plants due to its applicability in existing power plants and industrial facilities without major modifications. The most well-established chemical absorption technology is facing high regeneration costs and operation problems such as flooding, absorbent losses, entrainment, liquid channeling and foaming. Furthermore, the solvent is generally regenerated via the thermal energy extracted from steam turbine cycles proposing extra energy consumption, resulting in a dramatic drop of 20–25% in electricity production during power generation [5]. Therefore, a variety of efforts have been made to reduce the heavy energy penalty associated with the solvent regeneration process [6,7,8,9].
In the past two decades, membrane gas absorption technology has been attracting more and more attention as an energy-efficient and cost-effective alternative because it combines the advantages of high selectivity from chemical absorption and compact design from membrane separation. Membrane gas absorption technology offers several advantages, including high efficiency, low energy consumption, compact system design, and scalability, which has been extensively utilized in various industries such as power plants, refineries, and manufacturing facilities to reduce greenhouse gas emissions [10,11]. For a studied 685 MWe coal-fired power plant, the energy consumption and capital cost of CO2 capture in hollow fiber membrane contactors were reduced by 43% and 31% compared with packed bed columns, respectively [12]. An energy saving of 4.83% and a capital cost reduction of 6.11% can be achieved by a membrane–absorption hybrid CO2 capture process compared to a stand-alone absorption process [13]. In comparison with traditional desorber columns, the hollow fiber membrane contactors can reduce the energy duty for desorbing CO2 by half, from 4 MJ/kg CO2 to 2 MJ/kg CO2, indicating that membrane gas absorption technology is a promising alternative approach to regenerate a CO2-rich absorbent [14].
In parallel, the utilization of renewable solar energy has also emerged as a sustainable solution to reduce the reliance on thermal energy from the power plant during the CO2 regeneration stage to avoid a significant reduction in power generation efficiency. Correspondingly, numerous studies have been carried out to investigate the technical and economic feasibility of such integration methods [15,16]. To overcome the major drawback of the intermittent supply of renewable solar energy, the solar-assisted regeneration system is generally coupled with a thermal energy storage (TES) system [17]. The idea of integrating solar thermal concentrators into the CO2 capture process from the flue gas of a 300 MWe power plant for solvent regeneration was firstly proposed in New South Wales, Australia [18]. Liu et al. [19] evaluated the influences of the types of solar thermal collectors involved in ammonia-based solar-assisted post-combustion carbon capture (PCC) in three typical locations in China. They concluded that the vacuum tube collector (VTC) was more attractive than the parabolic trough collector in the studied cases, and calculated the critical collector prices to achieve lower levelized costs of electricity (LCOE) and the cost of CO2 removed (COR) than those of the traditional PCC system. More recently, Khalilpour et al. [20] presented a novel solvent regeneration system by replacing the complex desorber column with a parabolic trough pipe to the eliminate steam generation process, which reduced the capital expenditure by approximately 15–30% and increased the operation flexibility of the power plant with the PCC process. The life cycle impact assessment for solar thermal integration in post-combustion carbon capture showed that the levelized global warming potential per unit of electricity production for the 100% solar-powered PCC is the lowest in comparison with conventional PCC and solar-assisted PCC at a solar fraction of 23%. Thus, it has a global warming reduction of 38.1% for the 330 MWe and 18.1% for the 660 MWe power plant, respectively [21]. Obviously, the integration of solar thermal energy offers a promising pathway towards achieving more environmentally friendly and economically feasible carbon capture solutions.
As previously mentioned, membrane gas absorption technology and solar-assisted absorbent regeneration are two promising approaches to reduce the associated energy penalty and even achieve sustainability of the CO2 post-combustion capture process. By integrating these two technologies, there is potential to achieve more CO2 elimination with lower energy requirements, thereby addressing the challenges of climate change and reducing the environmental impact of carbon emissions. However, up to now, there has been no literature reported on the technical feasibility and application potential of integrating membrane gas absorption technology and the solar-assisted regeneration method for post-combustion carbon capture. Correspondingly, it is the interest of the present study to design a novel system to capture CO2 by membrane gas absorption with the assistance of solar thermal energy for solvent regeneration, named the solar-assisted hollow fiber membrane contactor (SOL-HFMC) system. The reference power plant that absorbs and desorbs CO2 in hollow fiber membrane contactors by 100% extracted steam is called the STE-HFMC power plant. Three locations in China with different solar radiation conditions have been selected as the study cases to investigate the technical potential of the proposed SOL-HFMC system. Furthermore, the total capital requirement (TCR), levelized cost of electricity and cost of CO2 removed are calculated to explore the economic performance of the proposed SOL-HFMC system. Finally, sensitivity analysis is carried out to assess the impact of changes in key parameters on the performance and cost-effectiveness of the proposed system to provide guidance for practical industrial applications.

2. System Description

The schematic drawing of the solar-assisted CO2 capture system using hollow fiber membrane contactors in a coal fired power plant is shown in Figure 1. The SOL-HFMC power plant is composed of three main parts: a coal fired power plant, a solar thermal energy collection and storage system, and a membrane contactor-based CO2 absorption-desorption system.

2.1. Membrane Contactor-Based CO2 Absorption–Desorption System

In this paper, the 580 MWe power plant is selected according to The NETL Baseline Studies for Fossil Energy Plants [22]. In total, 20 wt% monoethanolamine (MEA) is used as the absorbent due to its advantages of high absorption capacity, low volatility and regeneration energy, easy availability and cost effectiveness [23]. Specific to the membrane material, the polypropylene (PP) membrane is selected in this study due to its high void volume, wide commercial size, cost effectiveness, high chemical stability, and thermal stability [24]. The flue gas emitted from the power plant first passes through a heat exchanger chilled by air to reduce the gas temperature, and is further pretreated with desulfurization and dust removal processes before entering the hollow fiber membrane contactor. The main composition of the purified flue gas is mainly N2 and CO2.
In the CO2 absorption process, the flue gas and the absorbent flow in counter-current directions on the shell side and tube side of the hydrophobic PP membrane contactor, respectively. Driven by concentration gradients, the CO2 in the flue gas diffuses through the micropores of the membrane wall to the gas–liquid interface and is absorbed into the liquid phase by MEA solution. Meanwhile, the hydrophobic PP membrane material prevents the MEA solution from entering the gas phase, thereby achieving the separation of CO2 from flue gas. Unlike a traditional gas separation membrane based on pore size sieving, and dissolution–diffusion separation mechanisms, the microporous hollow fiber membrane material used in membrane gas absorption technology does not provide selectivity for the gas to be separated. It serves only as the interface between the gas and liquid phases, with selectivity provided by the liquid phase MEA solution, achieving gas separation through a diffusion–absorption mechanism. The exhaust gas, after eliminating CO2, is mainly N2 to be emitted directly into the atmosphere.
The rich absorbent containing the absorbed CO2 is brought to the heat exchanger and then pumped into other hollow fiber membrane contactors for further desorption. The rich absorbent flows in the lumen side and counter-currently contacts the sweeping steam supplied from the bottom. The regenerated lean absorbent is pumped from the bottom of the desorption unit and circulated back to the absorption membrane contactors for the continuous absorption cycle. The CO2 extracted from the top of the desorption unit is condensed in a condenser to remove the water vapor, and the released CO2 can be captured for storage or further utilization. To guarantee the long-time operation stability of the PP membrane and minimize the regeneration energy consumption of the rich absorbent, the regeneration process is maintained at a temperature of 80 °C and a pressure of 30 kPa [25].

2.2. Solar Thermal Energy Collection and Storage System

As shown in Figure 1, the thermal energy required for regenerating the CO2-rich absorbent is primarily provided by solar thermal energy, and supplemented by the steam extracted from the turbine in case of insufficient solar radiation. In this study, the desorption temperature of the CO2-rich absorbent is set at 80 °C, and thus, the low-temperature range of the solar thermal collectors with a range of 50–150 °C is applied. Under the condition of meeting desorption temperature requirements, the solar radiation is collected by vacuum tube collectors due to its advantages of lower cost and easier maintenance in comparison with other types of solar thermal collectors [26]. The vacuum tube collector absorbs sunlight through its surface and heats the working fluid inside the collector. The heated working fluid achieves thermal energy transfer to condenser water to generate low-pressure steam through the heat exchanger, and then pumped back to the vacuum tube collector for process recycling. Thermal oil is used as the working fluid in the collector to prevent the solar collector from operating under high pressure. To eliminate the intermittence and instability features of solar energy, a TES system is also designed according to the principle given by Mokhtar et al. [18] to achieve the stable and efficient operation of solar thermal utilization systems. Erythritol is selected as the phase change material (PCM) for thermal management because of its excellent superior phase–transition properties.

3. Methodology and Study Case

3.1. Net Efficiency and Carbon Emission of Coal-Fired Power Plants

It is assumed that the studied power plant works continuously for 24 h every day with an idle month for maintenance in August. The parameters of the hollow fiber membrane contactor are identical to those of the reference [12]. The detailed parameters of the power plant without and with CCS are shown in Table 1.
Due to the steam extracted from the steam turbine for CO2-rich absorbent regeneration, the integration of the CO2 capture unit with a coal-fired power plant results in the work loss of the steam turbine and net efficiency reduction of the power plant. The corresponding work loss per unit mass of the desorbed CO2 of the steam turbine Wlost (MJe/kgCO2) can be calculated by the following equation:
W l o s t = Q t h × α = Q t h × 1 T a b s T r e g + T
where Qth is the thermal energy required per unit mass of CO2 desorption, MJth/kgCO2; α is the steam equivalent coefficient, MJe/MJth; Tabs is the absorption temperature (K), taking 300 K in this study; Treg is the CO2-rich absorbent regeneration temperature (K), taking 353 K in this study; Ttur is the temperature of the steam extracted from the steam turbine (K), and is assumed to be 363 K in this study; and △T is the temperature difference between the extracted steam and CO2-rich absorbent regeneration temperature, K.
When a solar thermal energy collection and storage system is applied for absorbent regeneration, solar thermal energy can be used to replace partial steam extracted from the power plant, which can reduce the work loss of steam turbines and improve the net electricity generation of the power plant. The net output capacity of the plant integrated with the SOL-HFMC system can be expressed by the following equation:
P S O L H F M C = P S T E H F M C + P s o l a r
where PSOL-HFMC is the net output capacity of the SOL-HFMC power plant, MWe; PSTE-HFMC is the net output capacity of the STE-HFMC power plant, MWe; Psolar is the incremented net output capacity due to the existence of the solar thermal energy collection and storage system, MWe.
Thus, the net efficiency of the SOL-HFMC power plant can be improved compared with that of the STE-HFMC power plant, which can be calculated by the following equation:
η S O L H F M C = P S O L H F M C m f u e l × L H V
where mfuel is the fuel mass consumption flow, kg/h; LHV is the low heating value of the fuel, kJ/kg fuel.
Carbon emission intensity (CEI, kgCO2/MWh) typically refers to the amount of CO2 emitted to the atmosphere per unit of electricity generated, which can be used to evaluate the design of the SOL-HFMC system from the perspective of greenhouse gas emission. CEI is calculated by Equation (4) as follows:
C E I = C O 2 , o u t E l e c t r i c i t y o u t
where CO2,out is the CO2 emitted from the power plant with different CO2 capture systems, kg; and Electricityout is the net output electricity of the power plant with different CO2 capture systems, MWh.

3.2. Area of Solar Thermal Collectors

To maximize the utilization of solar energy, the vacuum tube collector is installed facing south and its tilt angle is approximately equivalent to the location latitude [27]. The solar irradiation intensity varies with the climatic weather conditions. When the vacuum tube collectors are designed based on the highest monthly collected solar thermal energy divided by monthly sunshine hours throughout the year, the thermal energy harvested by the solar collectors during other months with lower solar irradiation is less than the regeneration energy demand during sunshine time. Under this condition, all harvest thermal energy is utilized to meet the regeneration energy demand of CO2-rich absorbent during sunshine time, and the TES system is deactivated because there is no residual heat for further storage. In this study, for the SOL-HFMC system without TES, the collector area corresponding to the highest value of monthly collected solar thermal energy divided by monthly sunshine hours is defined as Critical Area 1. On the other hand, the vacuum tube collectors can also be designed based on the lowest value of the monthly collected solar thermal energy divided by monthly sunshine hours. In this case, the thermal energy harvested by the solar collectors during other months with higher solar irradiation is more than the regeneration energy demand during sunshine time, and surplus thermal energy is wasted. The corresponding collector area in this case is defined as Critical Area 2 in this study.
The thermal energy harvested by vacuum tube collectors Q (kWh) can be calculated by the following equation:
Q = G × S × η s o l a r
where G is the global horizontal radiation, kWh/m2; S is the area of vacuum tube collectors, m2; and ηsolar is the efficiency of vacuum tube collectors, which can be calculated by Equation (6) as follows:
η s o l a r = α 0 α 1 × T c T a G α 2 × T c T a 2 G
where Tc is the temperature of the working fluid in the collector, K; Ta is the ambient temperature, K; and α0, α1, α2 are the optical efficiency parameters of the vacuum tube collector, taking α0 = 0.71, α1 = 0.5 W/m2/K, α2 = 0.0035 W/m2/K2, respectively [28].
Solar load fraction (SF) refers to the proportion of heat provided by solar energy to the total energy consumption required for the regeneration of the CO2-rich absorbent, which is used to specifically quantify the extent to which solar energy contributes to meeting overall regeneration energy demands. A higher SF indicates greater reliance on renewable energy sources and reduced dependence on the steam extracted from the steam turbines of power plants for CO2 regeneration. Mathematically, the SF for CO2-rich absorbent regeneration can be expressed as follows:
S F = Q s o l a r Q t
where Qsolar is the energy provided by the solar resource, kWh; and Qt is the total energy required for CO2 regeneration, kWh.

3.3. Economic Evaluation Indicators

Undoubtedly, the integration of solar thermal collection and a storage system will increase the investment costs of the CO2 post-combustion capture system. The economic parameters of the of studied SOL-HFMC power plant are listed in Table 2.
TCR, LCOE and COR are calculated to investigate the economic performance of the proposed SOL-HFMC power plant. TCR for the studied SOL-HFMC system is the sum of TCR for the coal-fired power plant without CCS, the HFMC capture unit, and the solar energy collection and storage system. TCR for the vacuum tube collectors and thermal storage system can be estimated using the parameters listed in Table 2. TCR for the power plant without CCS and the HFMC capture unit are estimated according to the methodology proposed in references [12,30,31,32], with detailed information presented in Table 3. Due to the new technology with limited data, higher project contingencies are applied for the HFMC capture unit in comparison with those for the power plant without CCS. It can be calculated that TCR for the power plant without a CCS system and a HFMC capture unit is 1491.9 M$ and 626.2 M$, respectively.
Levelized cost of electricity, is an indicator which is frequently applied to assess the cost-effectiveness of integrating CCS technology into the power generation process, which can be calculated by the following equation:
L C O E = T C R · F C F + F O M E l e c t r i c i t y o u t + V O M + F u e l
F C F = r 1 + r t 1 + r t 1
where TCR is the total capital requirement, $; FCF represents the fixed-change factor, fraction/year, which can be calculated by Equation (9); FOM represents the fixed O&M costs, accounting for 3.5% of the TCR [30], $/year; VOM is the sum of the MEA cost and fuel consumption cost, $/MWh; Fuel is the fuel cost, $/MWh; Electricityout is the annual net electricity generation of the power plant, MWh/year; r is the discount rate, %; and t is the service lifespan of the power plant, year.
The cost of CO2 removed represents the additional cost incurred by implementing CCS technology to reduce carbon emissions compared to the baseline power plant without CCS (baseline PP), which can be used to evaluate the economic feasibility of adopting CCS technology. COR can be expressed by the following equation:
C O R = L C O E c a p L C O E b a s e C E I b a s e C E I c a p
where LCOEcap is the LCOE of a power plant with CCS, $/MWh; LCOEbase is the LCOE of a power plant without CCS, $/MWh; CEIbase is the carbon emission intensity of a power plant without CCS, t/MWh; and CEIcap is the carbon emission intensity of a power plant with CCS, t/MWh.

3.4. Study Case

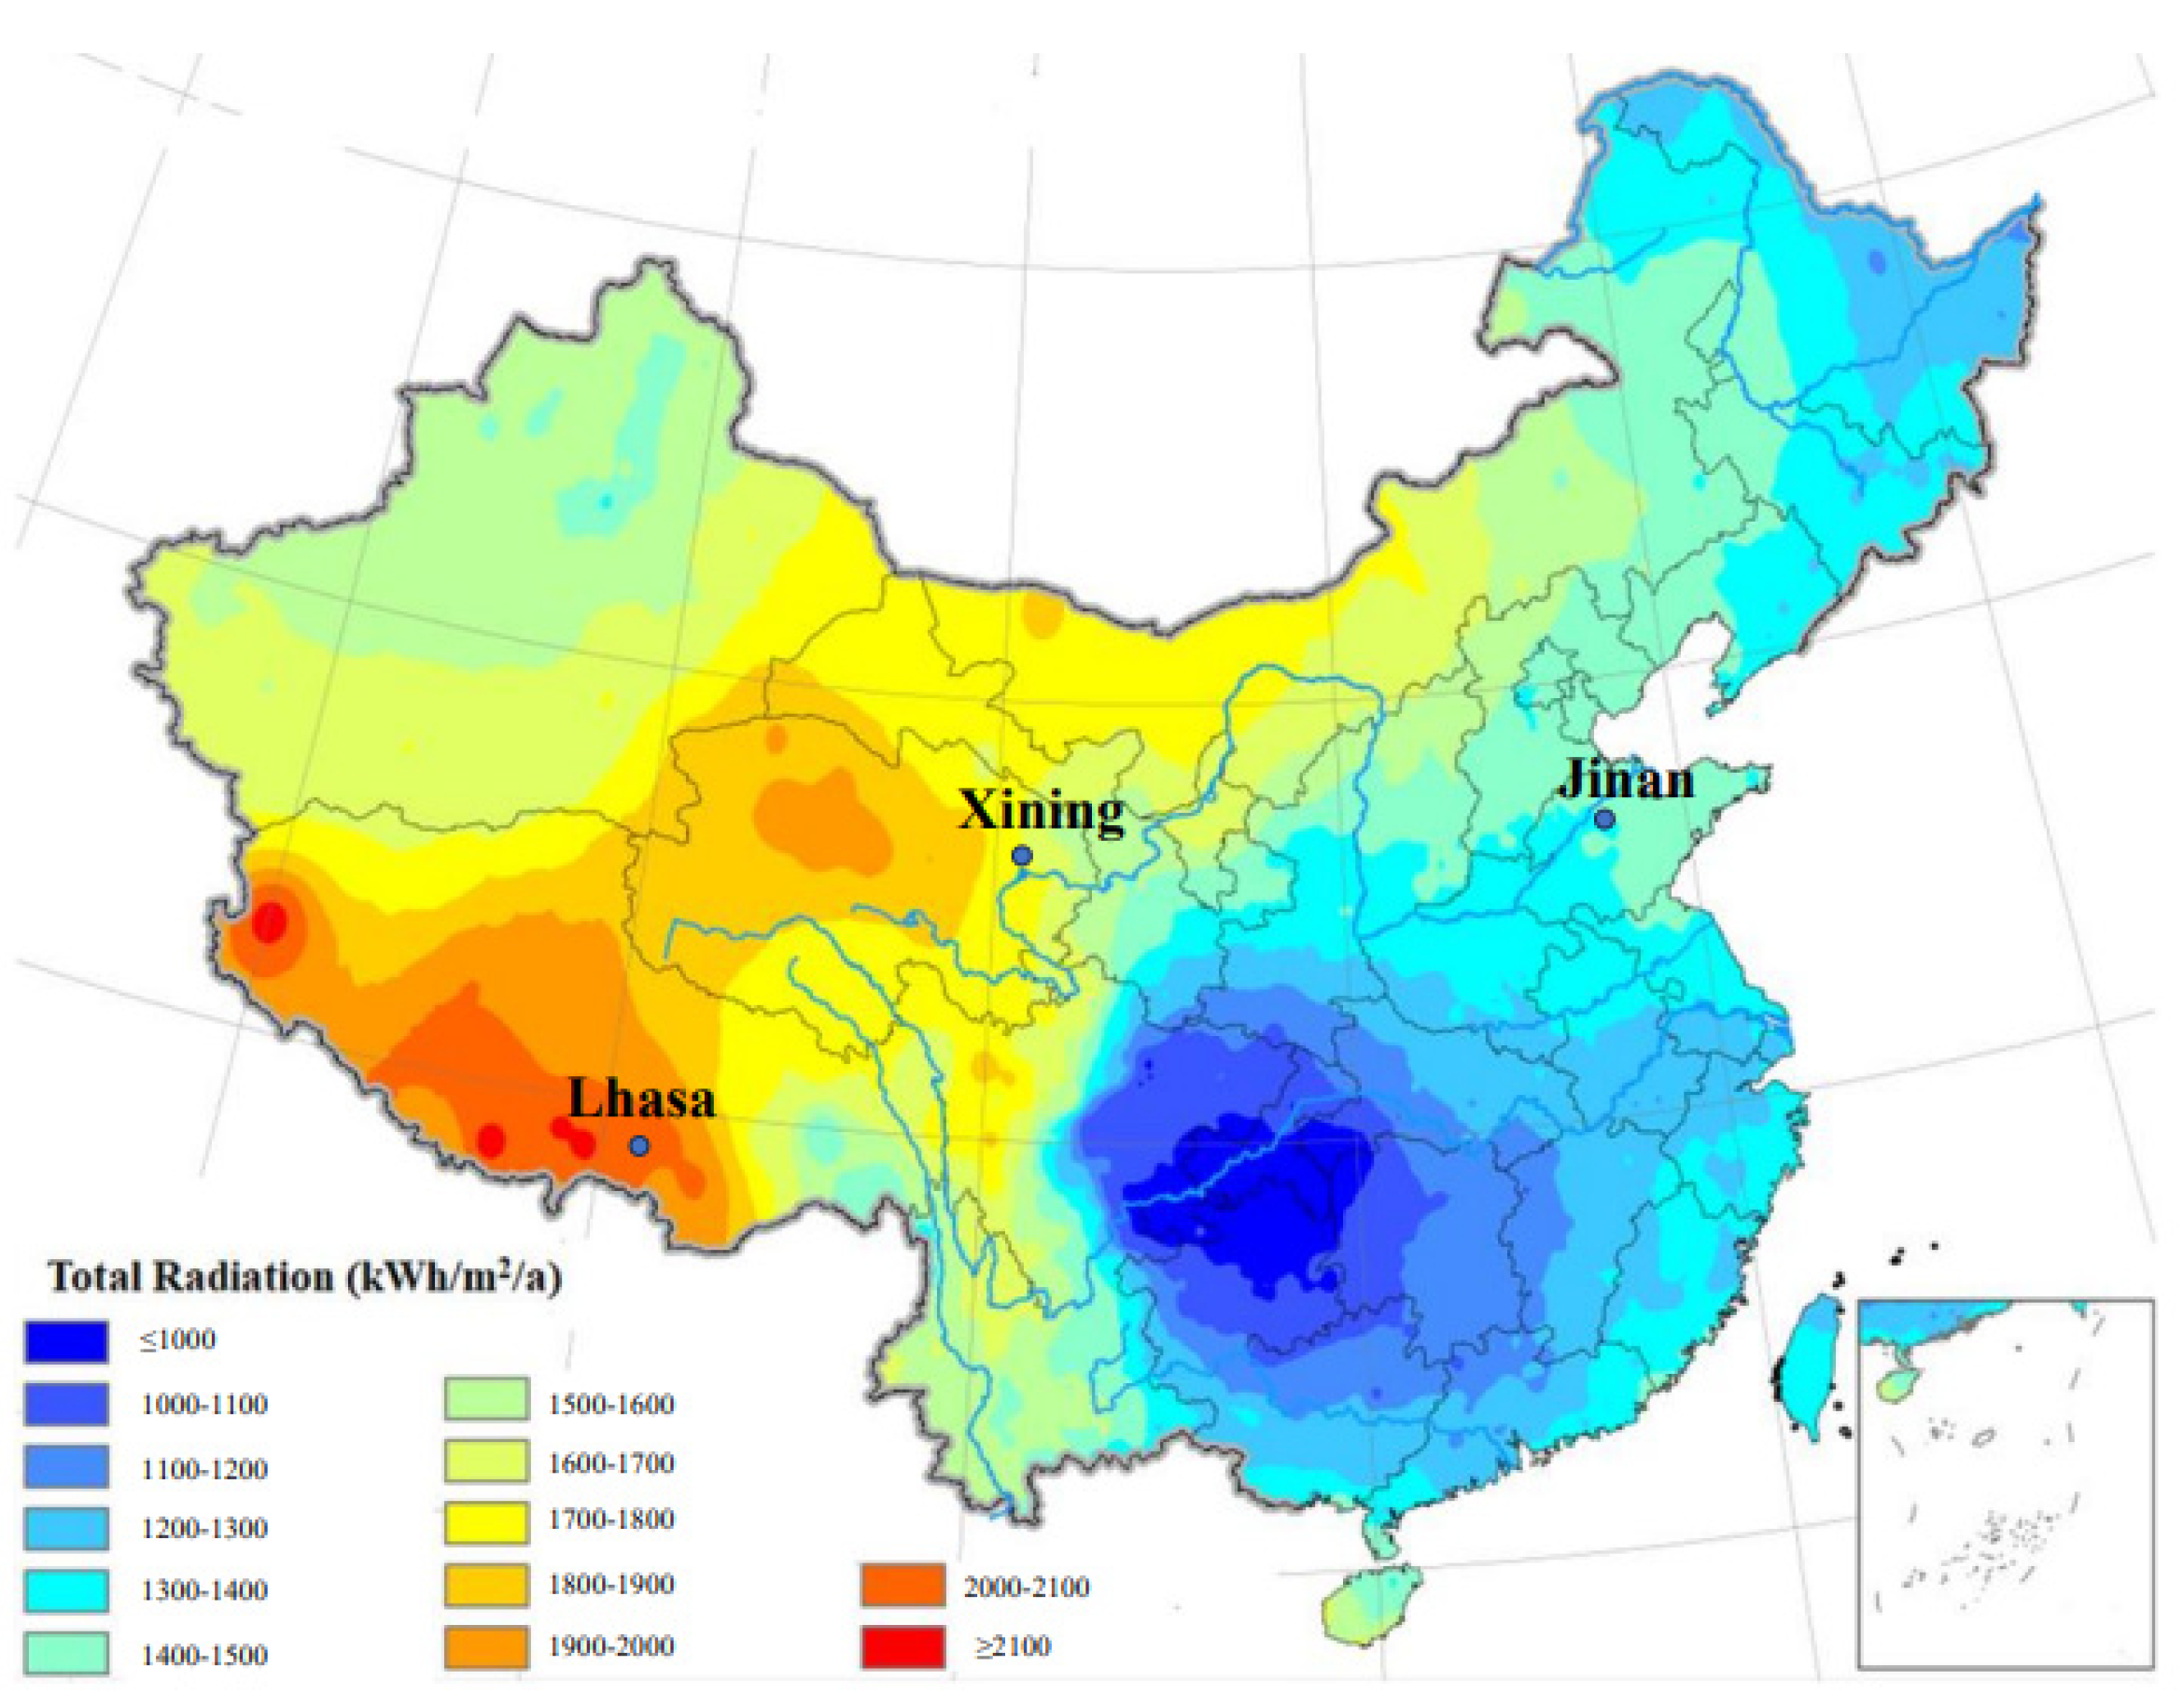
The thermal collection capacity of a specified vacuum tube collector highly depends on the solar radiation incident on the collector surface. To assess the technical feasibility and economic benefits of the proposed system, three locations with different solar irradiation intensities are considered in the present study, namely Lhasa (29.6° N, 91.1° E), Xining (36.7° N, 101.7° E) and Jinan (36.5° N, 116.8° E). The distribution of total solar radiation on the horizontal surface in China, as well as the detailed locations of the three studied cases, is presented in Figure 2.
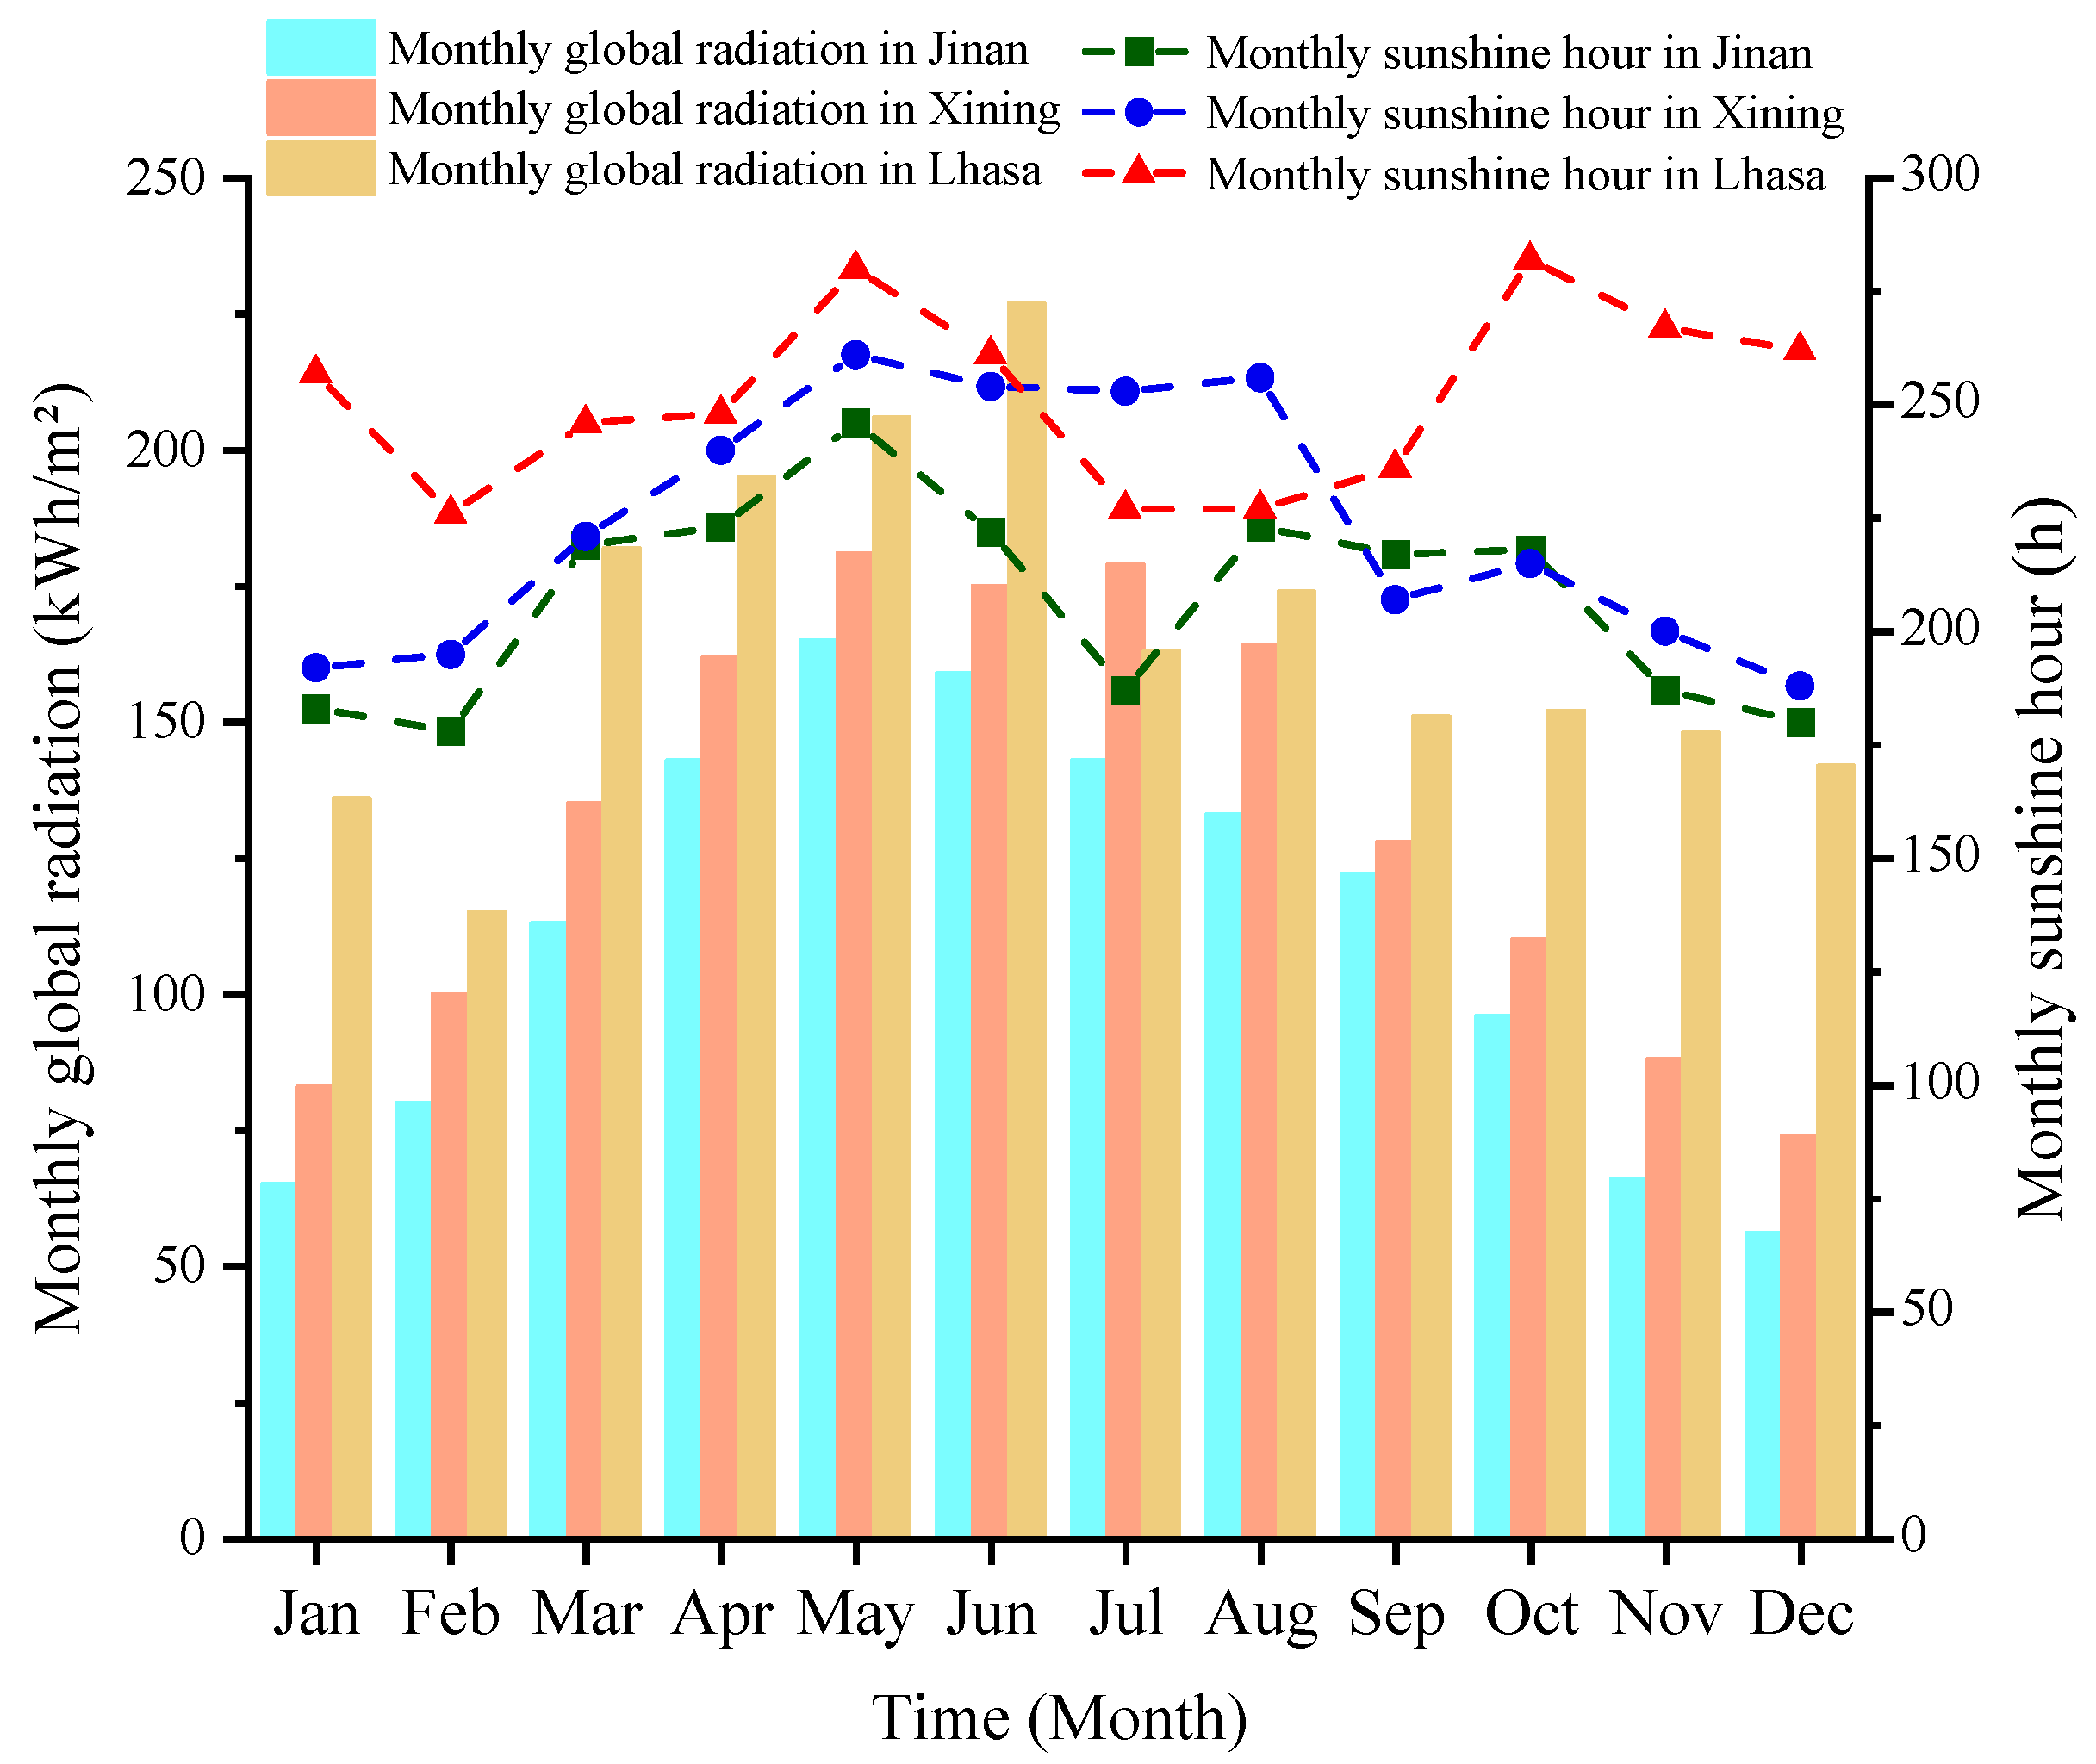
The main meteorological parameters of the three studied cities were acquired from METEONORM Global Meteorological Database [33]. The monthly global horizontal radiation and monthly average sunshine hours of the three studied cities are given in Figure 3. The annual global horizontal radiation in Lhasa, Xining and Jinan is 1988 kWh/m2, 1578 kWh/m2, and 1340 kWh/m2, respectively. In Lhasa, the highest monthly global radiation is in June at 227 kWh/m2, and the lowest is in February at 115 kWh/m2. In Xining and Jinan, the highest radiation values are in May at 181 kWh/m2 and 165 kWh/m2, respectively, while the lowest values are in December at 74 kWh/m2 and 56 kWh/m2. Additionally, in terms of sunshine duration, the cities of Lhasa, Xining, and Jinan have the longest monthly sunshine durations of 280 h, 261 h, and 246 h, respectively. The annual average ambient temperatures in Lhasa, Xining, and Jinan are 9.5 °C, 6.4 °C, and 14.9 °C, respectively.

4. Results and Discussion

4.1. Technical Feasibility Evaluation

Figure 4 shows the monthly thermal energy collected by per unit area of vacuum tube collectors in three studied locations. To maximize the utilization of solar energy, the vacuum tube collectors are all installed towards the south, and the optimal tilt angles are set approximately equivalent to the location latitude, which is 30°, 37°, and 36° for Lhasa, Xining, and Jinan, respectively. It can be observed that the maximum solar thermal energy can be obtained in Lhasa city due to the highest solar irradiation and the longest sunshine durations, followed by Xining City and Jinan City.
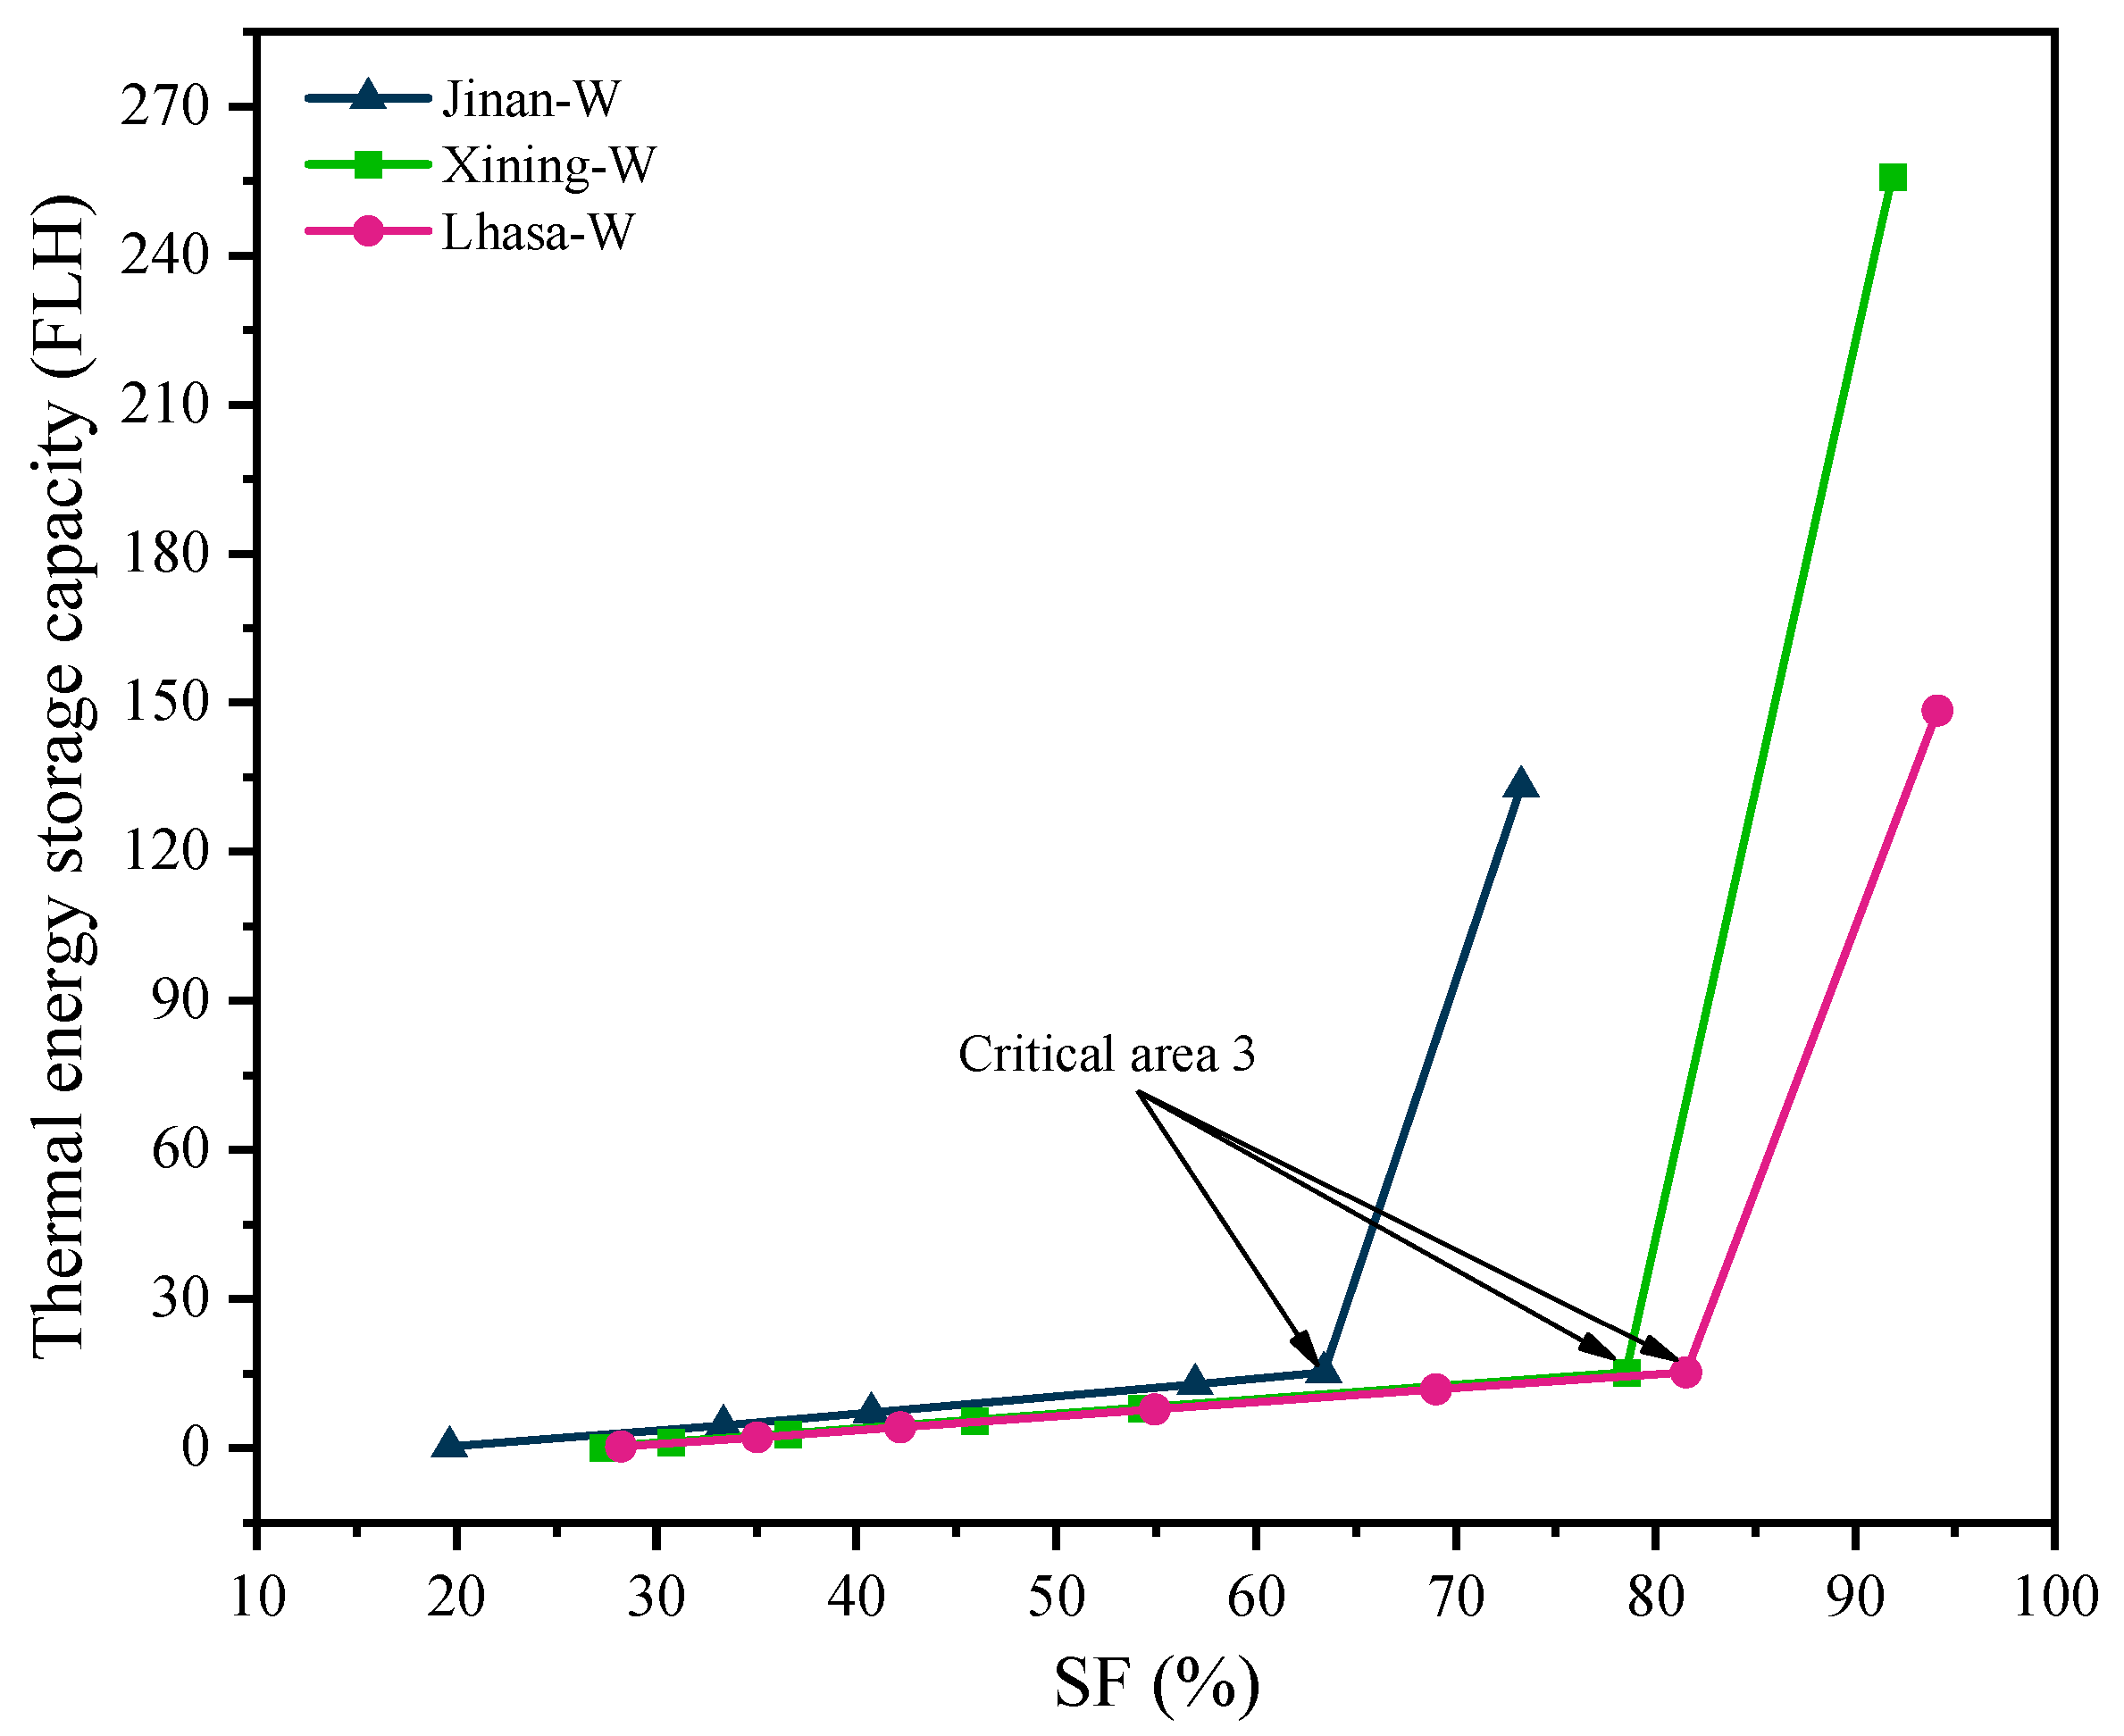
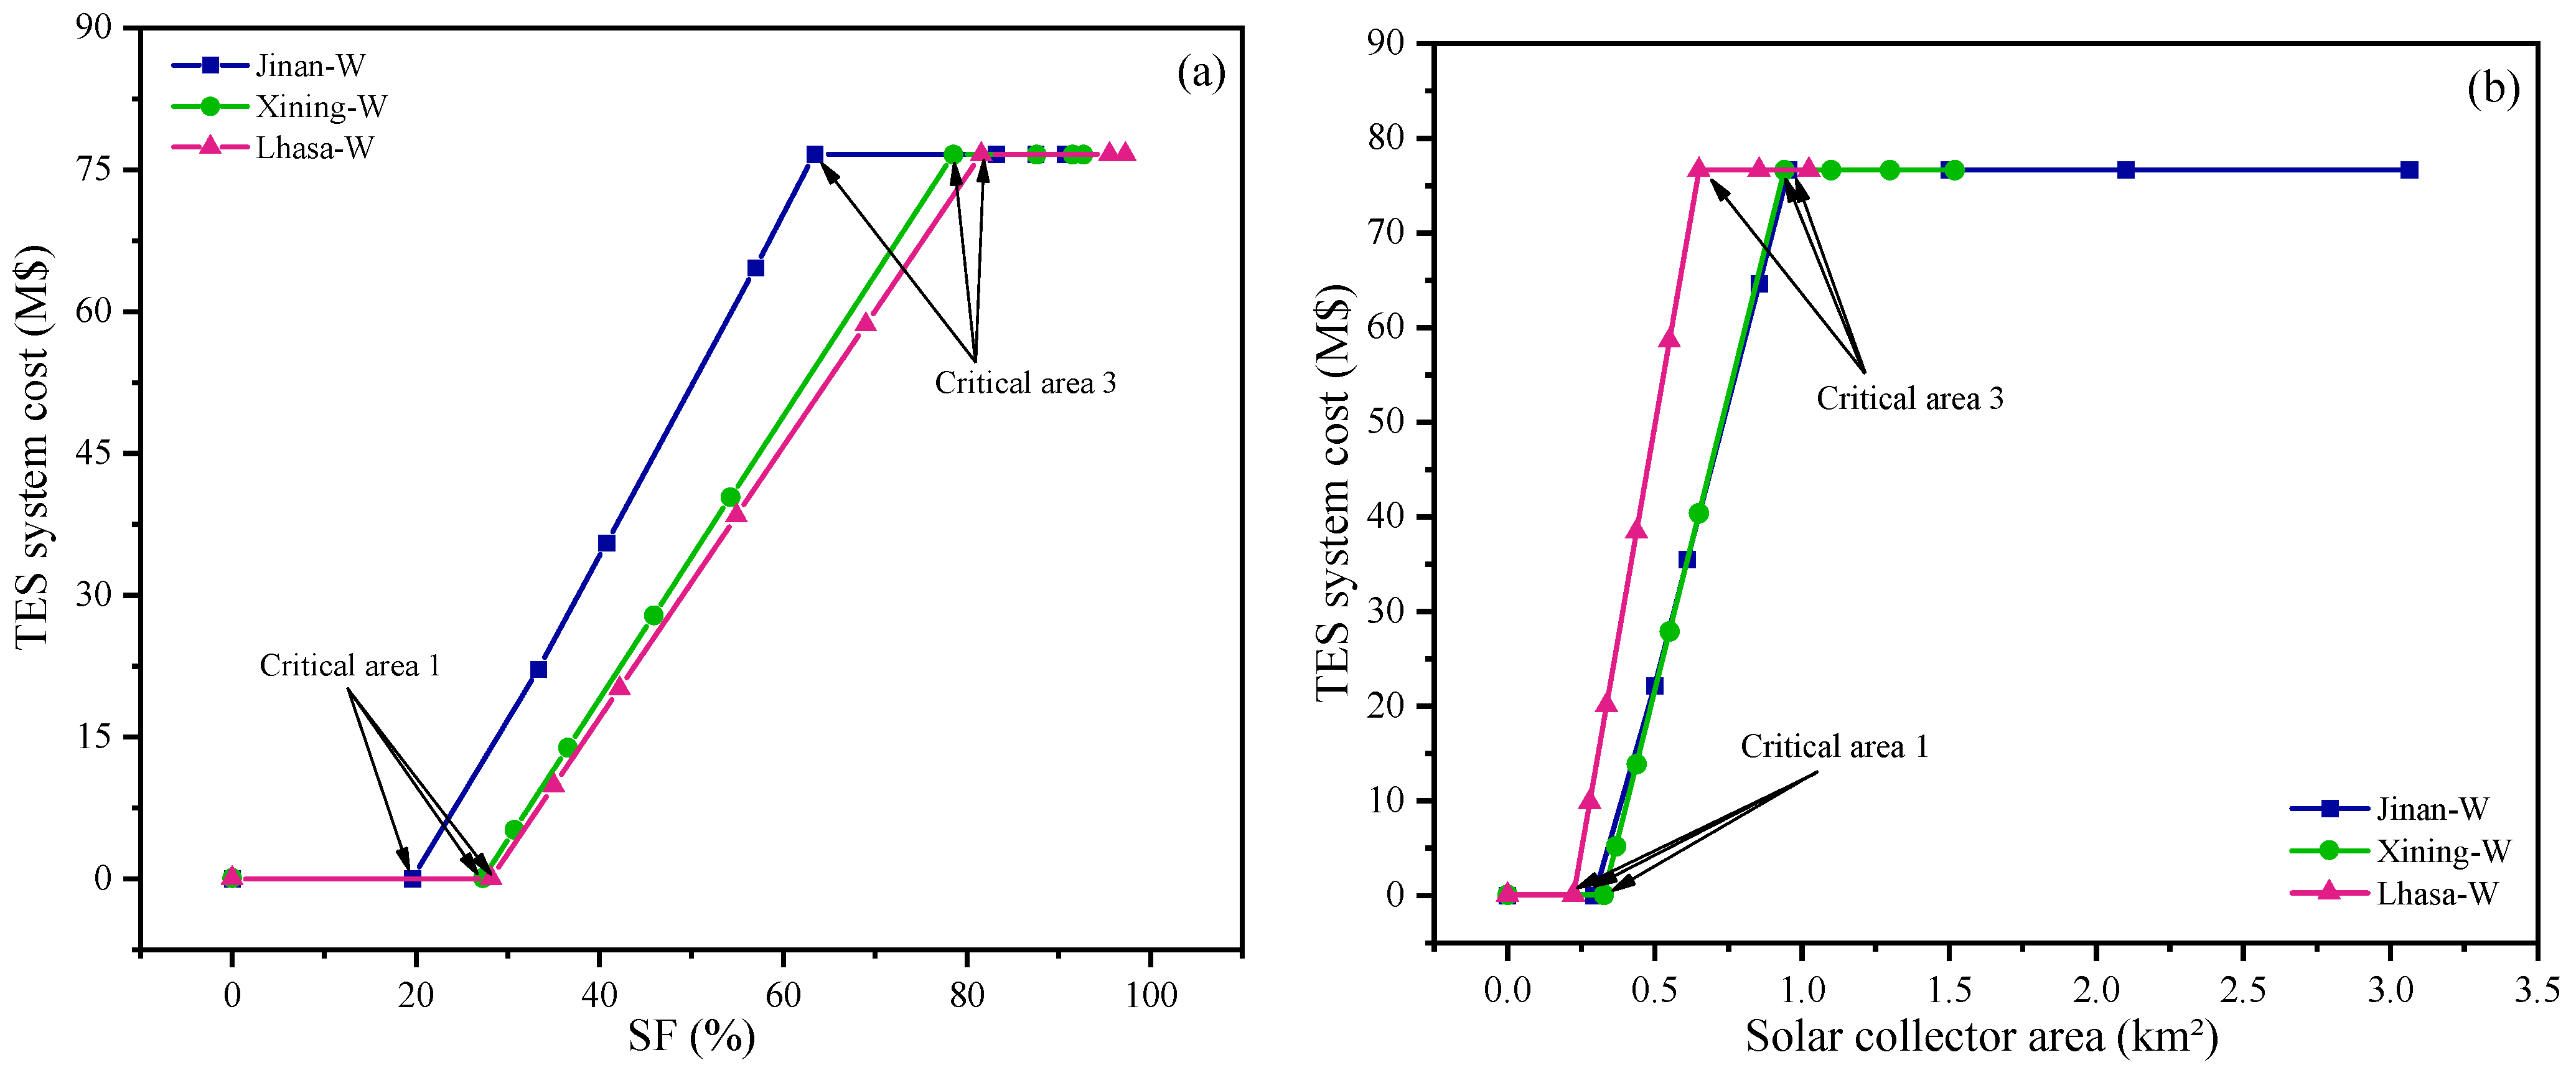
The TES system can be integrated with solar collectors to buffer the intermittency and fluctuation of solar energy resources for absorbent regeneration. The TES capacity depends on the area of the vacuum tube collectors. Figure 5 illustrates the relationship between thermal storage capacity and the solar load fraction. The symbol “W” in this study indicates the system with TES, and the symbol “W/O” indicates the system without TES. The required thermal storage capacity increases with an increase in the solar load fraction. Specifically, the relationship is almost linear when the SF ranges are within 20–63%, 27–79%, and 28–82% for Jinan, Xining, and Lhasa, respectively. Within the above specified ranges, the thermal storage capacity increases relatively slowly with the increase in SF for all three studied cases. However, the required thermal storage capacity increases dramatically when the SF further increases beyond 63%, 79%, and 82% for Jinan, Xining, and Lhasa, respectively. Comprehensively considering the cost of PCM material and the benefits of an SF increase, the upper limit of thermal storage capacity is set at 15 Full Load Hours (FLHs), which indicates that the TES system can support CO2-rich absorbent regeneration energy demand for up to 15 h. The minimum and maximum area of the vacuum tube collectors required to meet the thermal storage capacity of 15FLH are defined as Critical Area 3 and Critical Area 4, respectively. The values of the Critical Area shown in Figure 6 are summarized in Table 4.
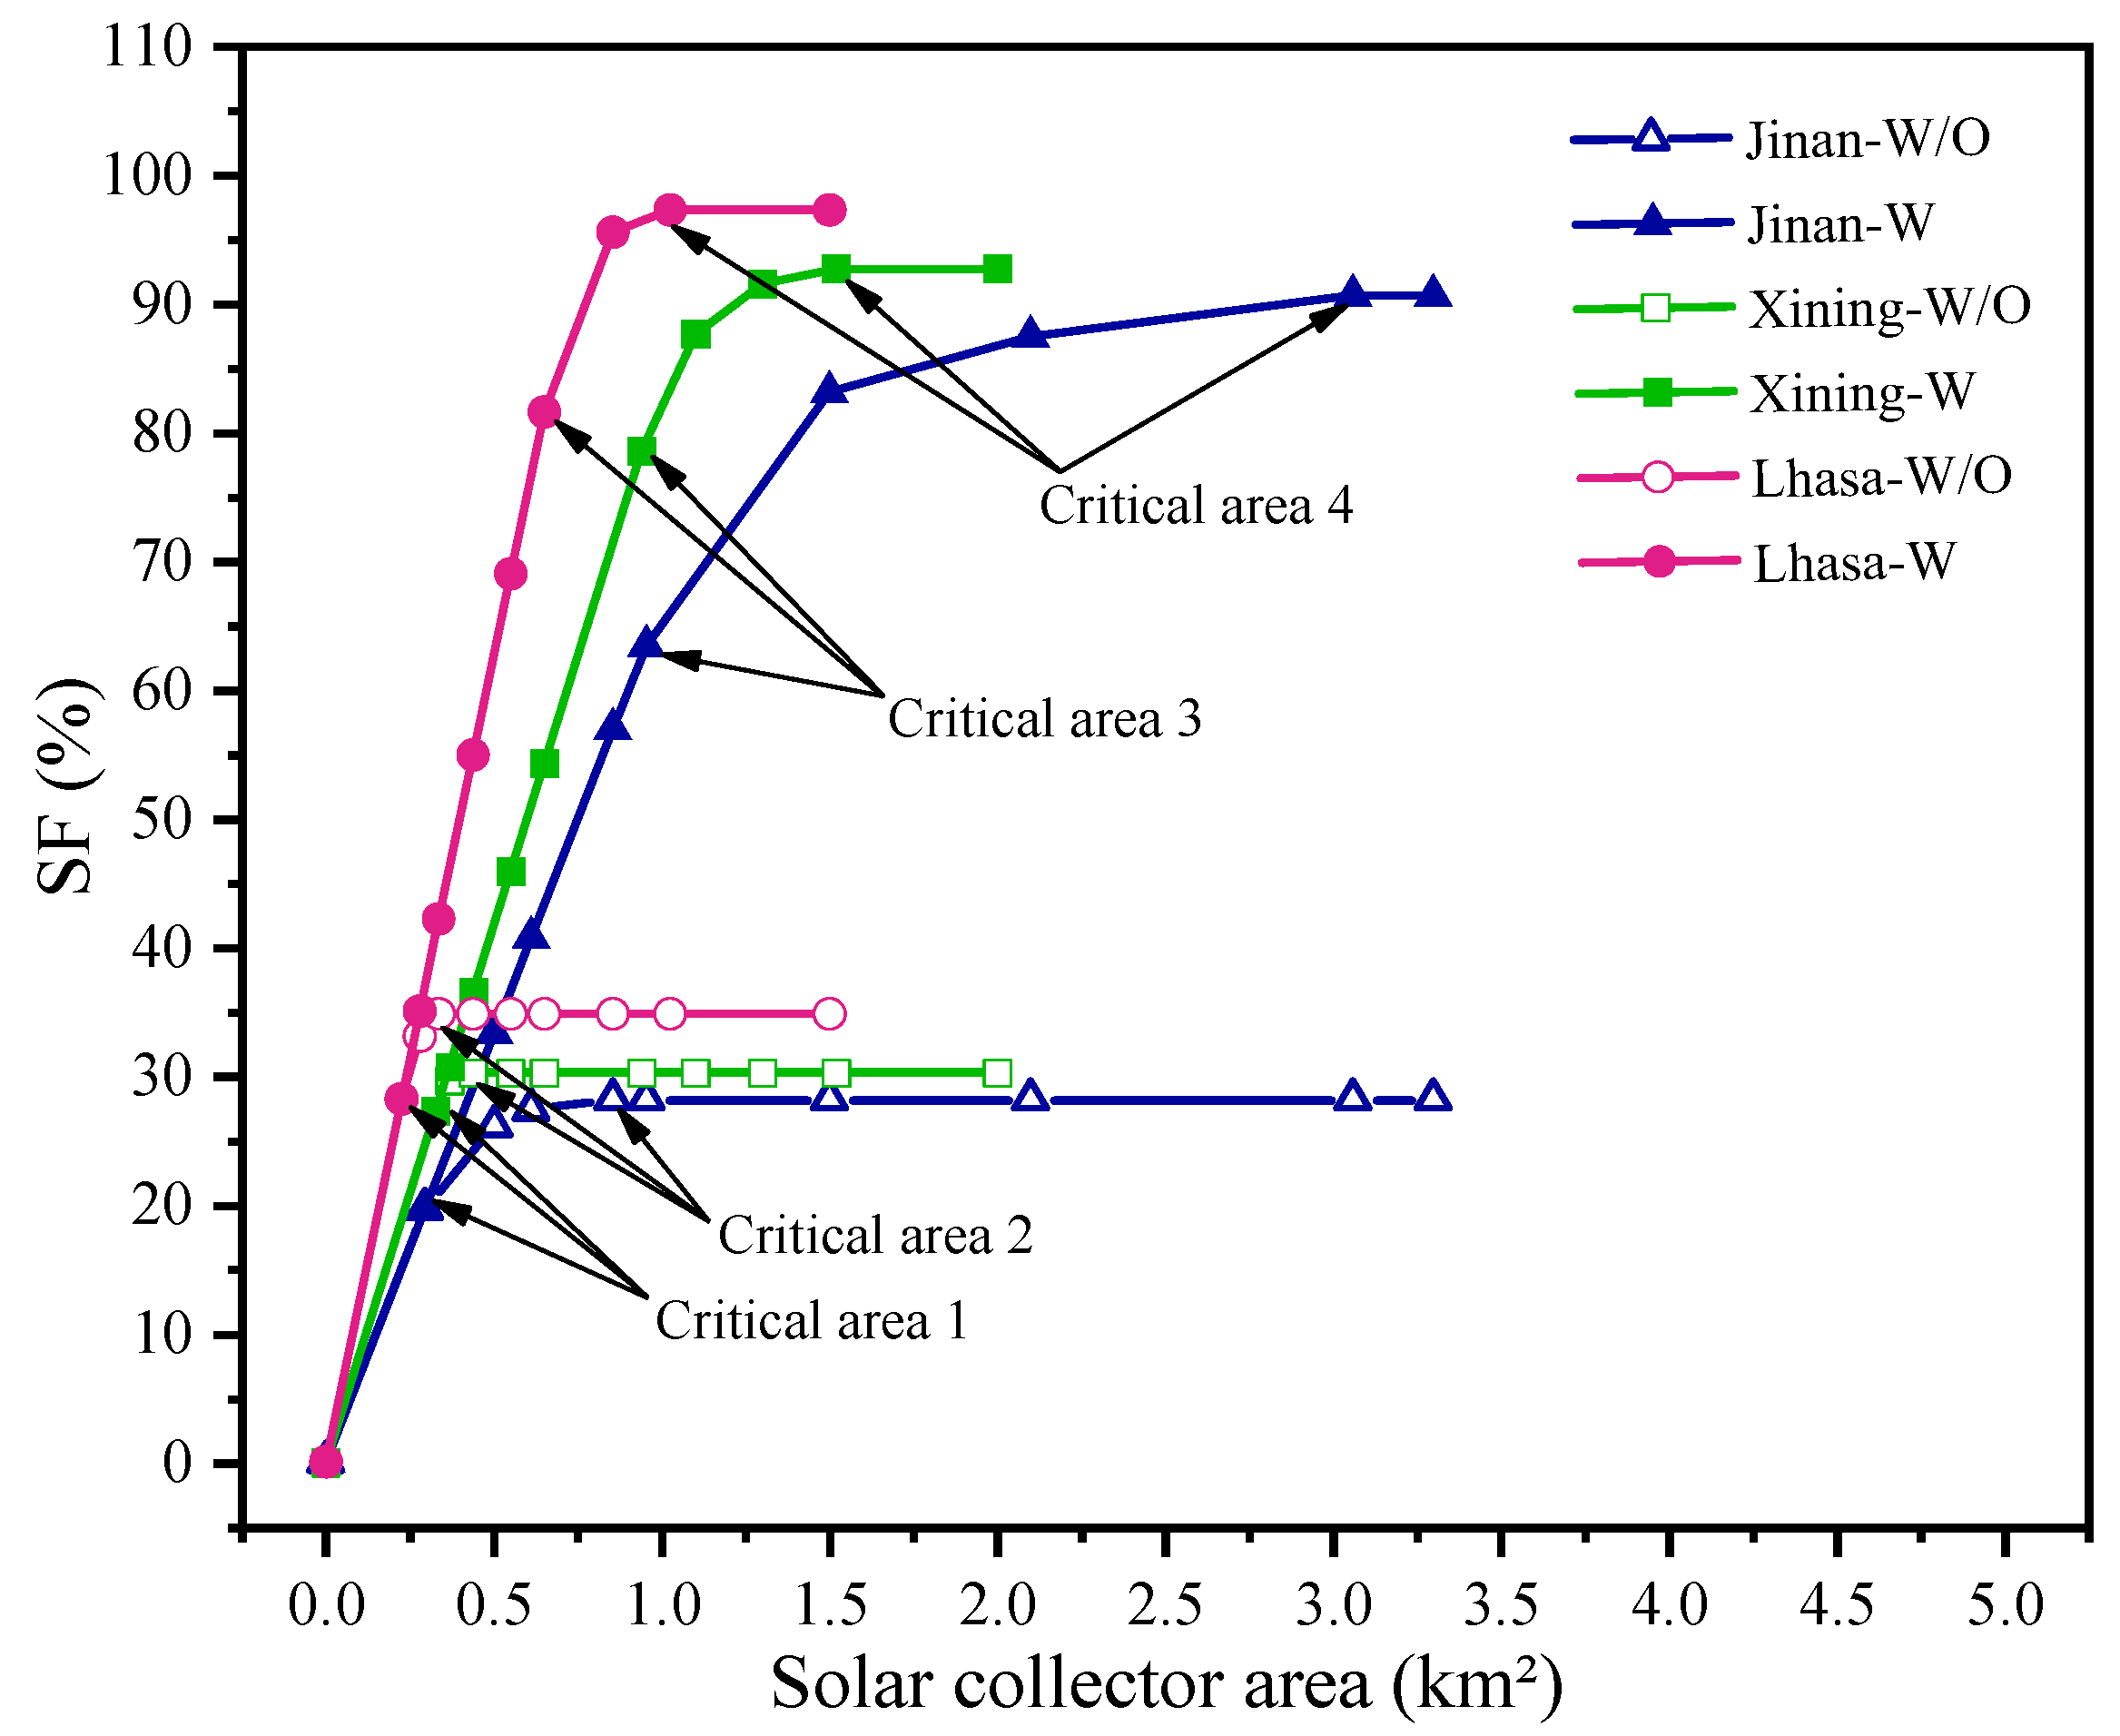
Figure 6 presents the calculation result of SF variations with the change in the solar collector area. For the SOL-HFMC system without TES system, the SF increases rapidly with an increase in the solar collector area. When the solar collector area is increased beyond Critical Area 1, the SF still increases with the increase in the solar collector area, but the increase rate of SF gradually decreases. When the solar collector area reaches Critical Area 2, SF reaches its maximum value of 28.19%, 30.26%, and 34.84% for Jinan, Xining, and Lhasa cities, respectively. SF is stabilized at its maximum value even if the solar collector area is further increased beyond Critical Area 2. The reason is that the thermal energy supplied by solar collectors under Critical Area 2 is excessive for solvent regeneration during any sunshine hours, and surplus thermal energy is wasted due to the absence of a TES system.
As shown in Figure 6, for the SOL-HFMC system equipped with TES system, SF is almost linear with the collector area, which significantly increases with the increase in the solar collector area. When the solar collector area reaches Critical Area 3, the growth rate of SF is slowed down. When the solar collector area reaches Critical Area 4, the SF of the three studied locations is stabilized at the maximum value of 90.7%, 92.76%, and 97.34% for Jinan, Xining, and Lhasa, respectively. Under the same solar collector area, regardless of whether equipped with a TES system, SF in Lhasa is the highest, followed by Xining, while the SF value in Jinan is the lowest. This is because the Lhasa region has the richest solar energy resources, and the solar collectors in the same area can collect more solar irradiation to provide energy for solvent regeneration.
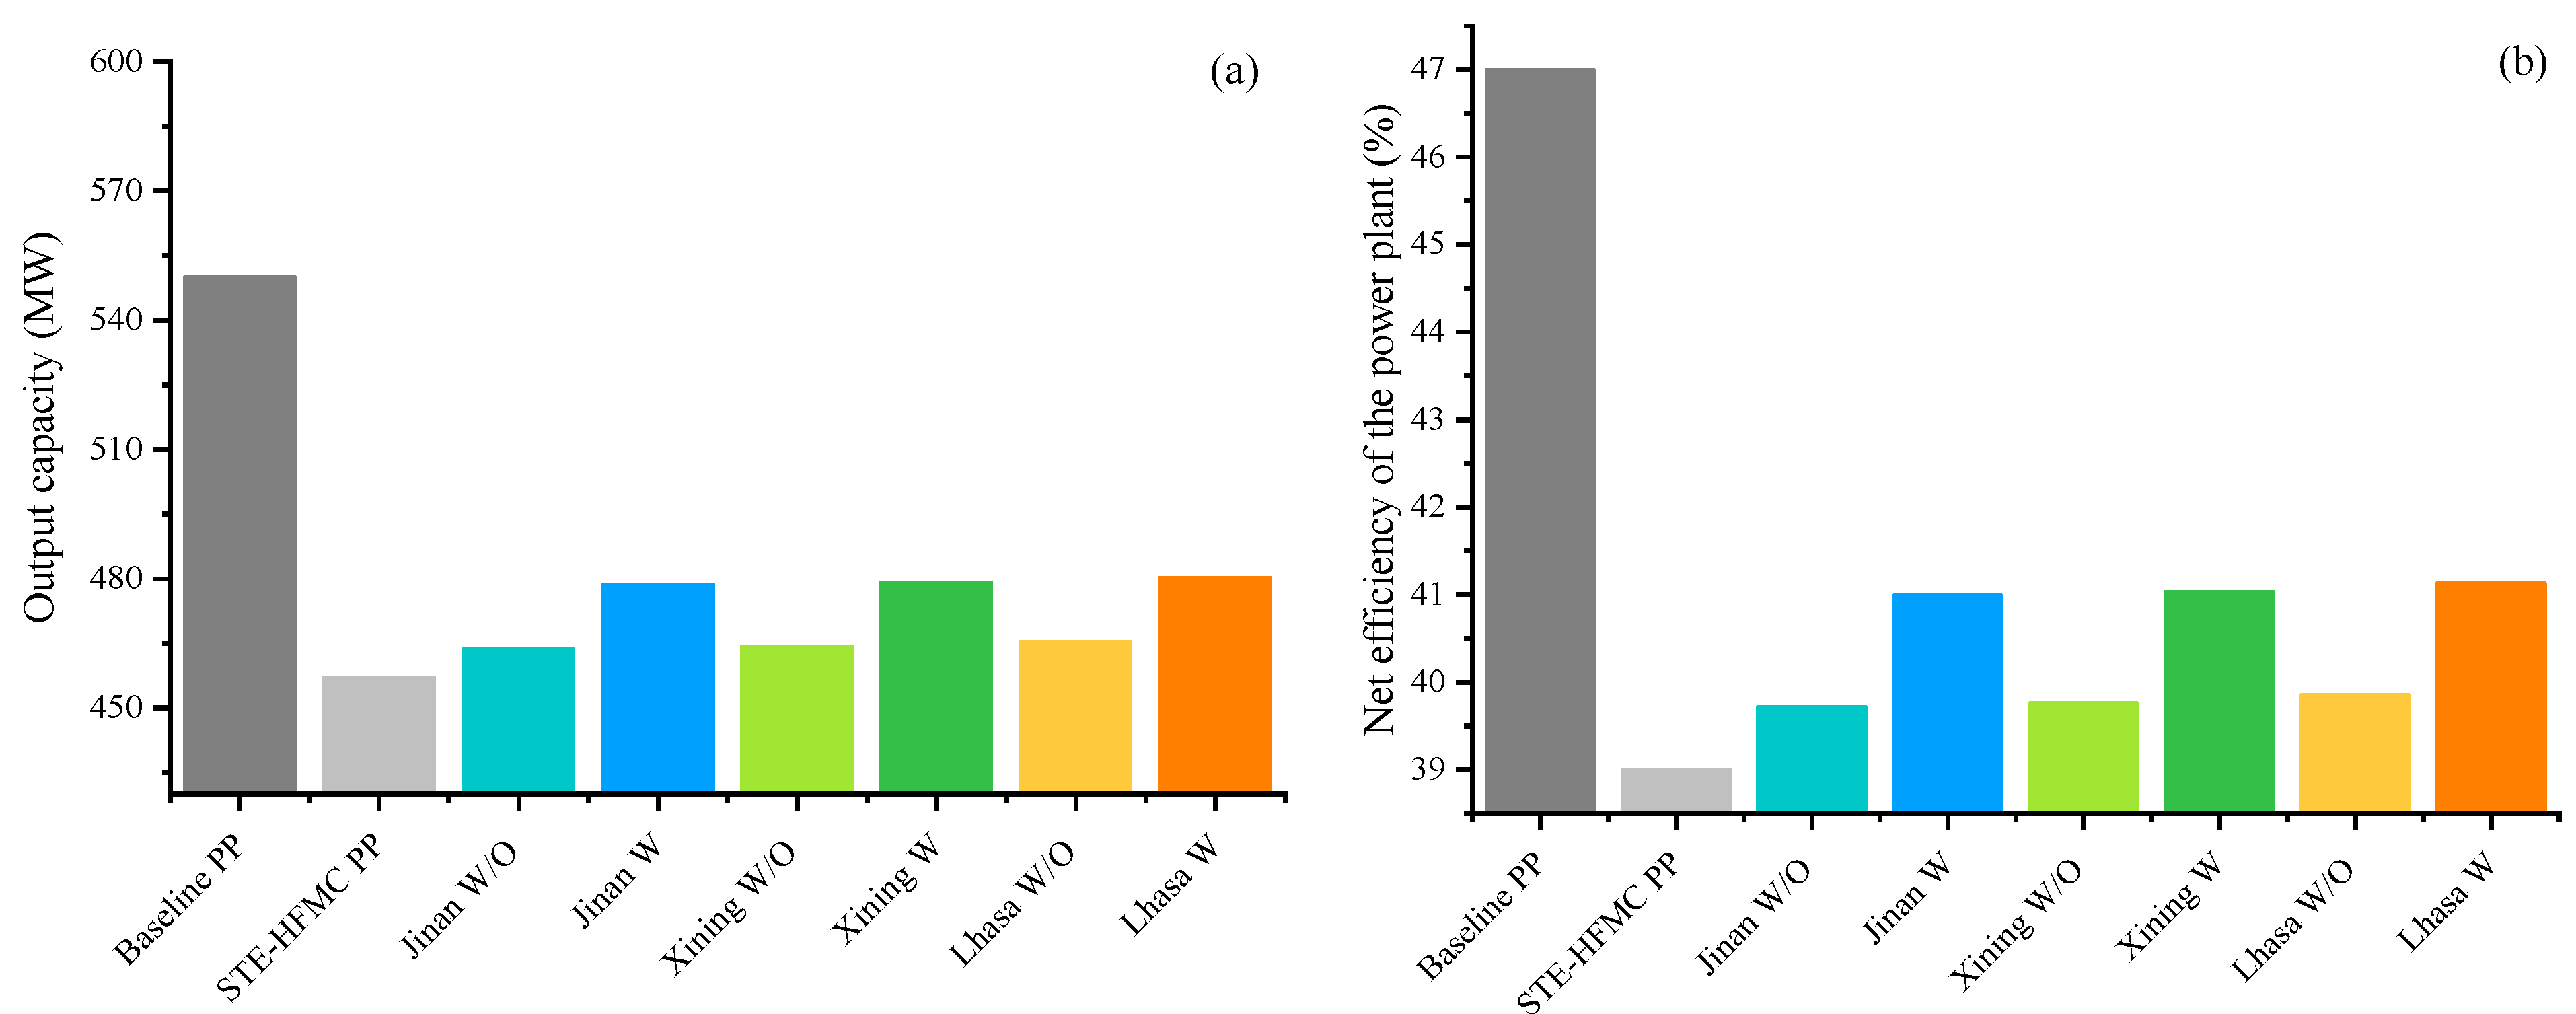
In comparison with the STE-HFMC power plant, the work loss of the steam turbine is reduced and the output capacity of the SOL-HFMC power plant is increased with the assistance of solar thermal energy for absorbent regeneration. Under the maximum SF, the differences in output capacity and net efficiency between the power plant with and without the assistance of solar energy are illustrated in Figure 7. It can be observed that the output capacity and net efficiency of the power plant both decreased significantly by 17% and 39% for the STE-HFMC system in comparison with the baseline power plant, respectively. Compared to the STE-HFMC power plant, the output capacity and net efficiency of the SOL-HFMC power plant increased significantly, regardless of whether the TES system was applied or not. The most significant improvement was observed in Lhasa, followed by Xining and Jinan. Furthermore, the performance of the SOL-HFMC power plant equipped with the TES system was superior to that of the SOL-HFMC power plant without the TES system, with net efficiency increased by 2.00%, 2.04%, and 2.13% in Jinan, Xining, and Lhasa, respectively. The reason can be attributed to the fact that the TES system provides more energy for solvent regeneration and more steam can be used for power generation.
Figure 8 presents the influence of the solar collector area on carbon emission intensity. The CEI value of the STE-HFMC power plant is 96.50 kg CO2/MWh. For the SOL-HFMC power plant without the TES system, the CEI decreases rapidly with an increase in the solar collector area. The reduction rate is slowed down when the solar collector area is higher than Critical Area 1. When the solar collector area reaches Critical Area 2, the SF values for Jinan, Xining, and Lhasa are 28.19%, 30.26%, and 34.84%, with the corresponding CEI values stabilized at its minimum value of 95.10 kg CO2/MWh, 95.00 kg CO2/MWh, and 94.78 kg CO2/MWh, respectively. Under Critical Area 2, the thermal energy provided by solar collectors reaches its maximum value and no more extracted steam can be saved to generate more electricity in the power plant. For the SOL-HFMC power plant with the TES system, the CEI also decreases rapidly before the solar collector area reaches Critical Area 3. Then, CEI decreases slowly and is stabilized under Critical Area 4 at its minimum value of 92.14 kg CO2/MWh, 92.05 kg CO2/MWh, and 91.84 CO2/MWh, with the corresponding SF values of 90.7%, 92.76%, and 97.34% for Jinan, Xining, and Lhasa, respectively. For the same system under the same solar collector area, the CEI is the highest in Jinan, followed by Xining and Lhasa, because CEI strongly depends on the solar irradiation of the studied location.

4.2. Economic Performance Evaluation

It is obvious that the SF of the SOL-HFMC power plant with the TES system is relatively higher than that without the TES system, leading to the enhancement of the output capacity of the power plant. However, the introduction of the TES system also increases investment costs, mainly due to the cost of the phase change material. Figure 9 presents the dependence of the TES system cost on SF and the solar collector area under the condition of a maximum thermal storage capacity of 15FLH. As shown in the figure, the TES system is deactivated and has no cost when the SF is lower than the SF value corresponding to Critical Area 1, which is 19.65%, 27.34%, and 28.24% for Jinan, Xining, and Lhasa, respectively. Then, the TES system is activated when the SF is higher than the point corresponding to Critical Area 1 to utilize the solar energy resources to their maximum extent, with the TES system cost linearly increasing with the SF increase. When the solar collector area reaches Critical Area 3, the TES system capacity is 15FLH and the TES cost achieves its height. At the given value of SF, the TES system cost in Jinan City is the highest, followed by Xining and Lhasa.
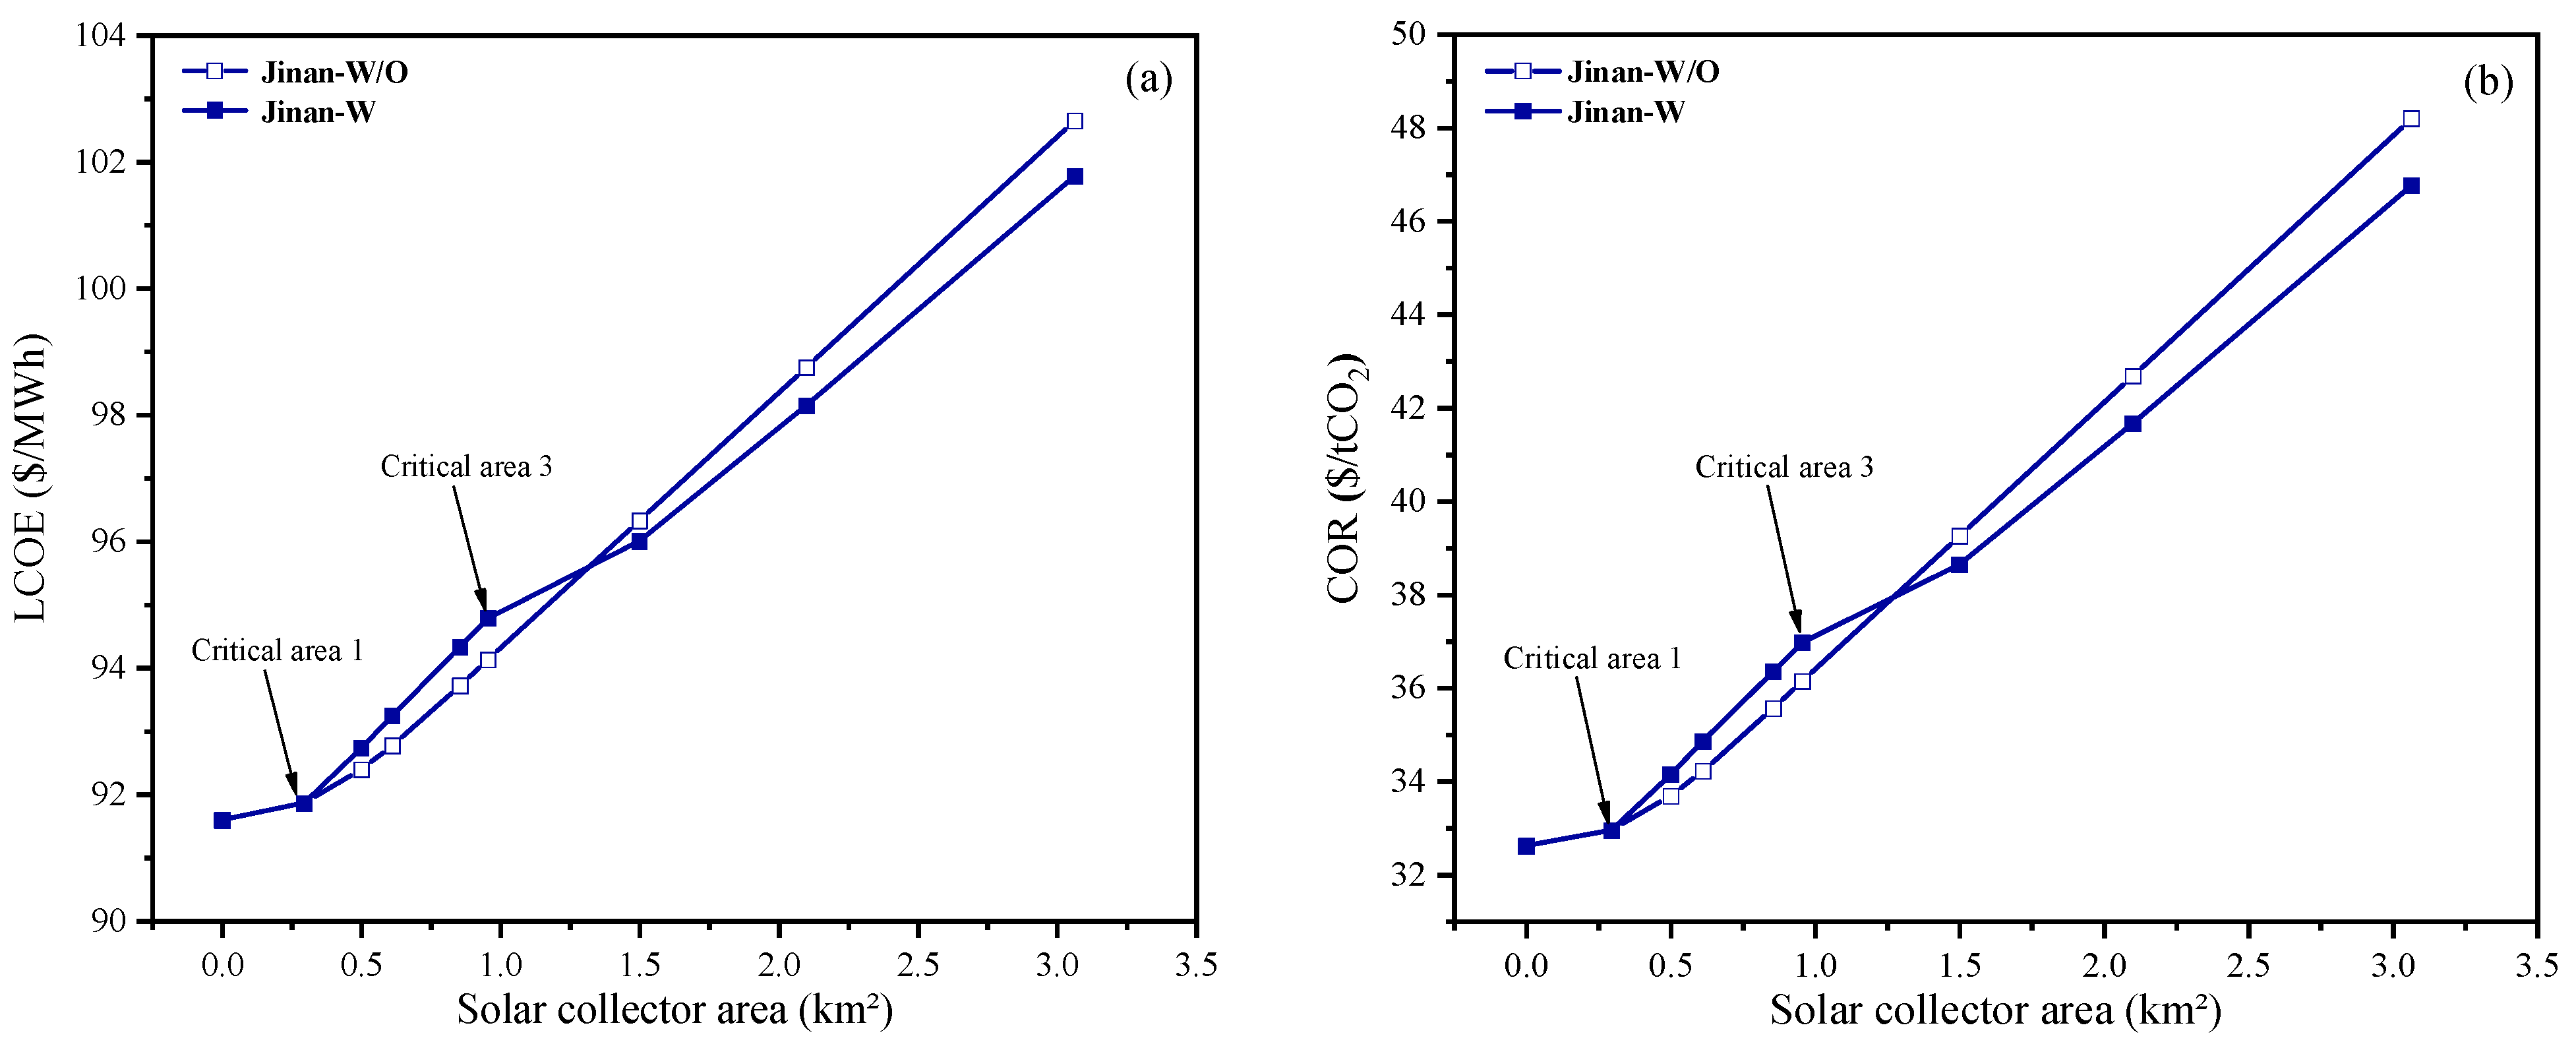
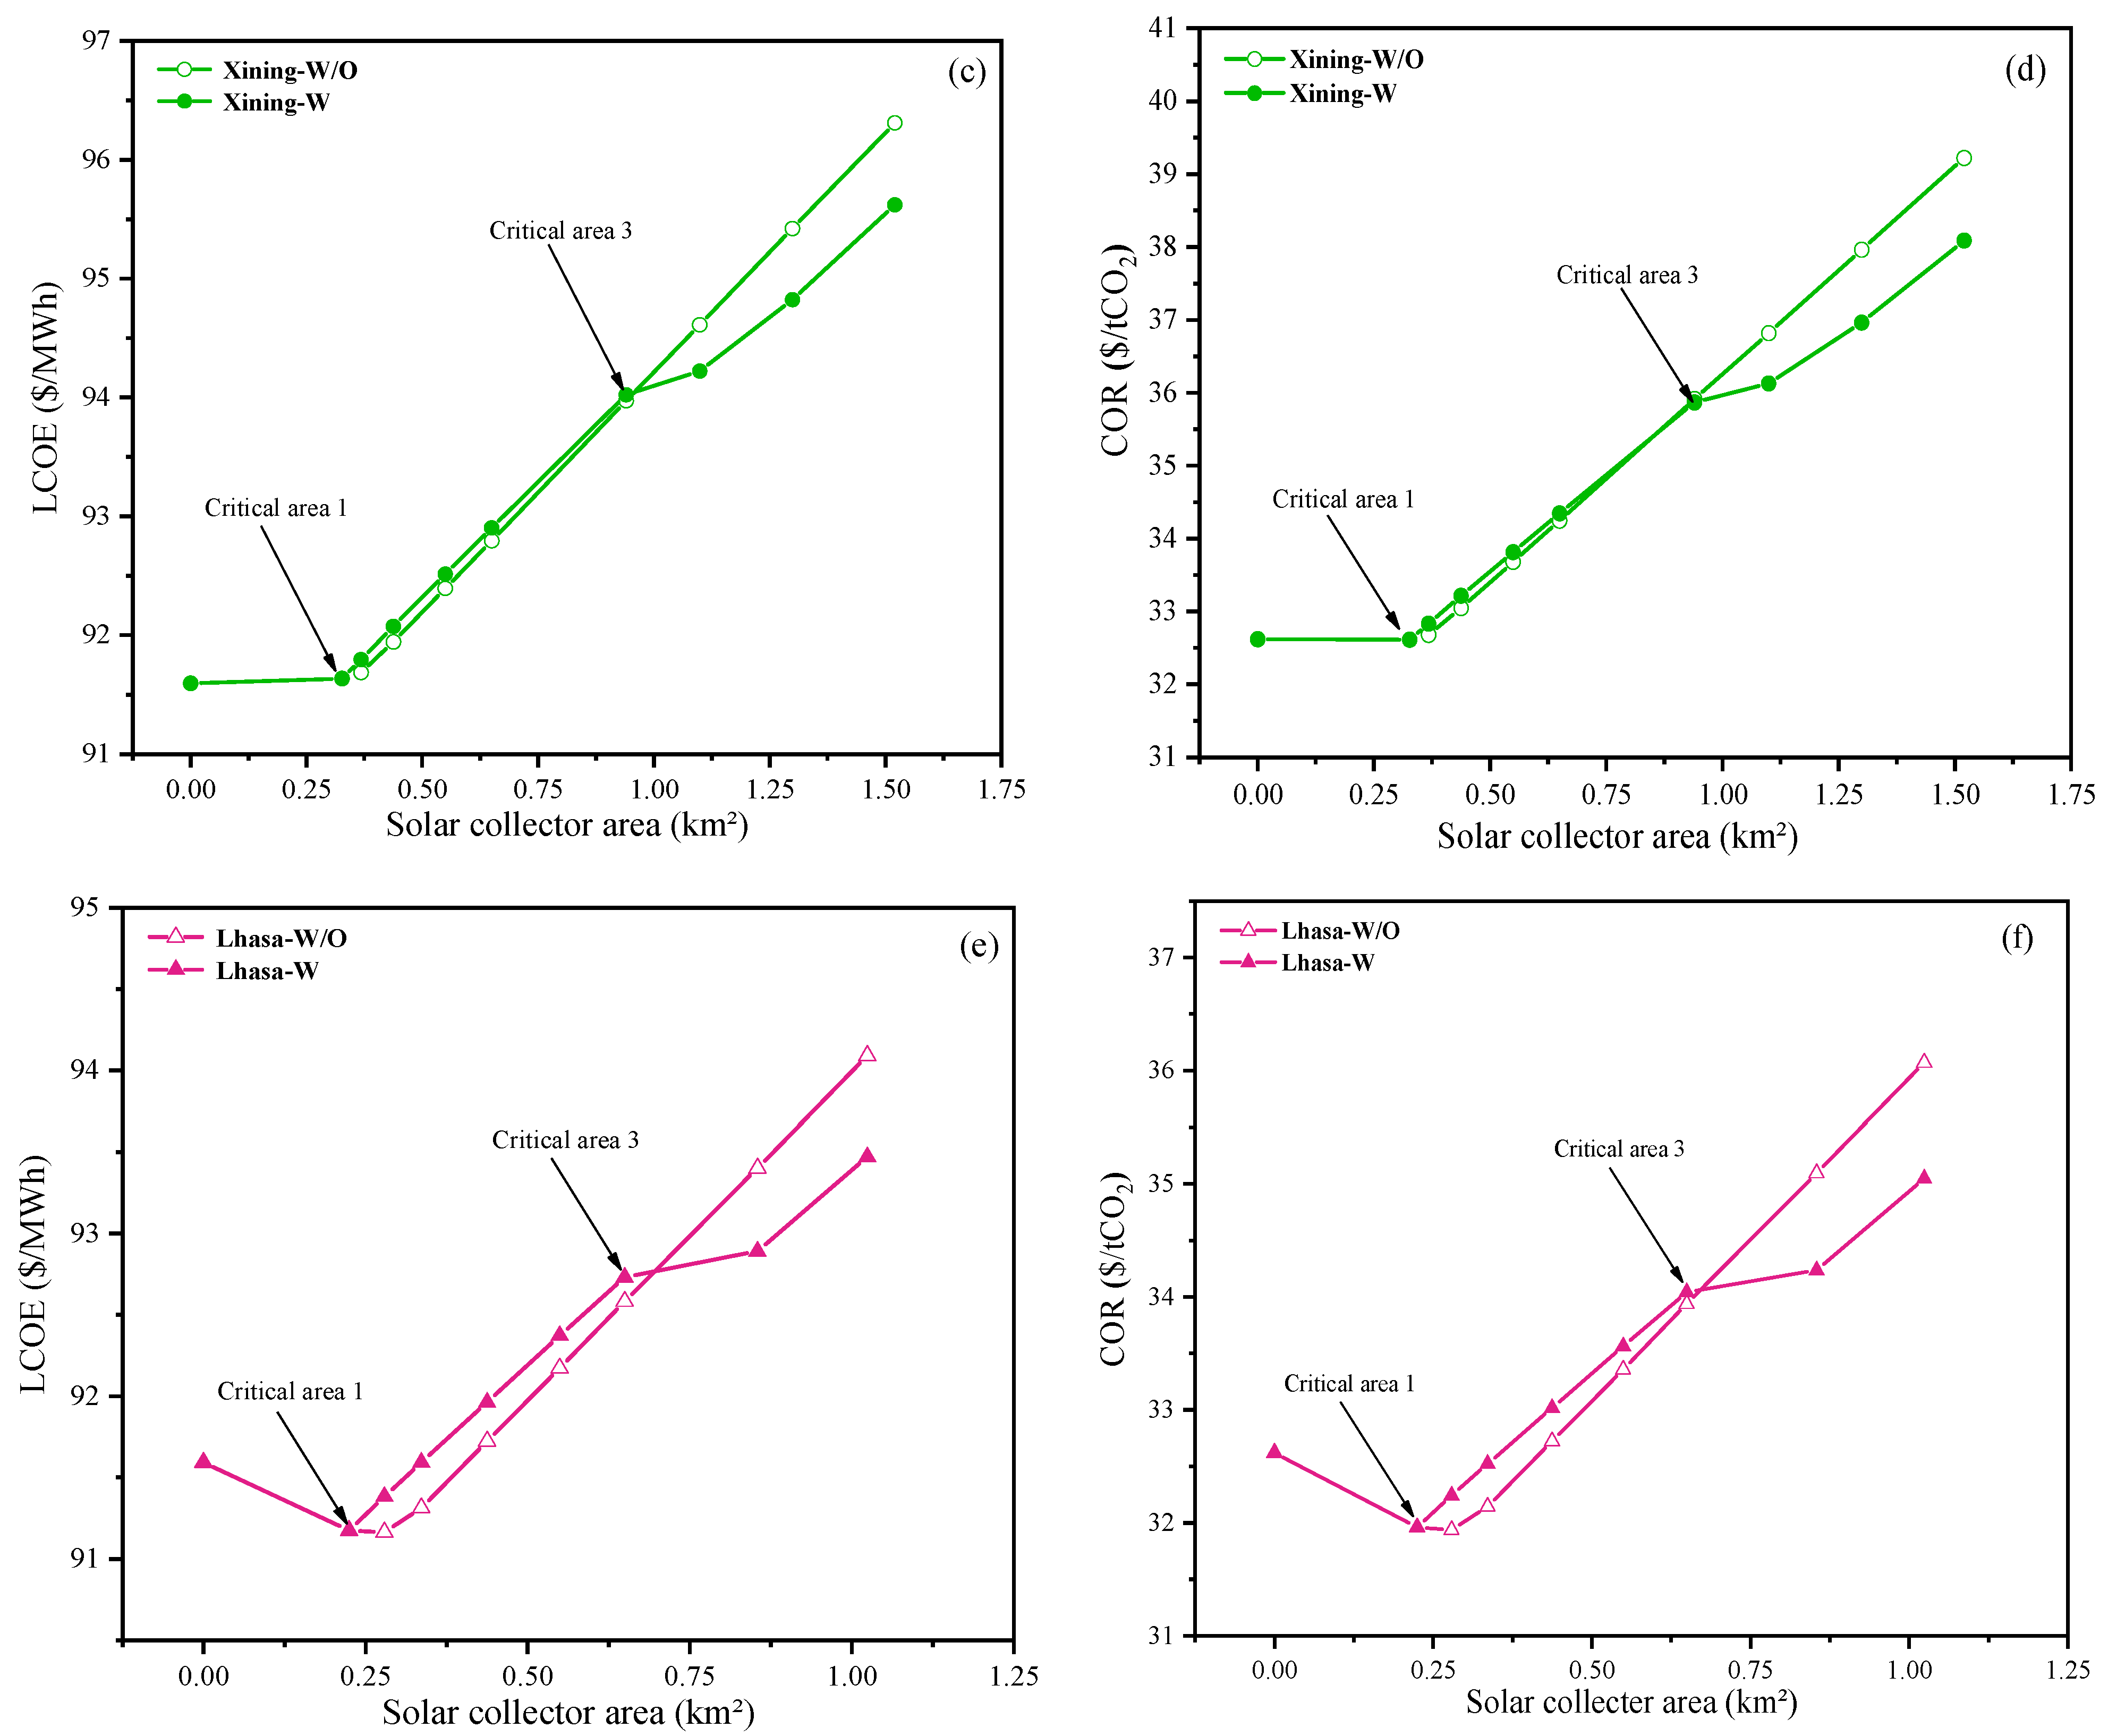
The total capital requirements of the SOL-HFMC power plant are increased due to the existence of a solar thermal energy collection and storage system. The LOCE and COR of the SOL-HFMC power plant with the TES system are further calculated, with the results shown in Figure 10. When the area of the solar collectors is zero, the LCOE and COR values of the SOL-HFMC power plant with or without the TES system are the same as those of the STE-HFMC power plant, which are 91.59 $/MWh and 32.61 $/tCO2, respectively.
For the SOL-HFMC power plant without the TES system, the LCOE and COR values in Jinan and Xining cities both increase with the increase in the solar collector area. However, in Lhasa, the LCOE and COR values show a difference tendency, with a decrease and then an increase with the increase in the solar collector area. This can be attributed to the fact that more steam is used for electricity generation due to higher solar irradiation intensity and longer sunshine hours in Lhasa; thus, steam saved per unit area of the solar collector has better economic benefits than the cost increase with the introduction of solar collectors before the area reaches Critical Area 1.
For the SOL-HFMC power plant with the TES system, the LCOE and COR values of the three studied locations are identical to the SOL-HFMC power plant without the TES system when the collector area varies within the range from 0 to Critical Area 1. Within the range from Critical Area 1 to Critical Area 3, the LCOE and COR values increase rapidly with the increase in the collector area, no matter what location is studied. When the collector area further exceeds Critical Area 3, the growth rate of LCOE and COR is reduced. At a given collector area, the LCOE and COR values of the SOL-HFMC power plant equipped with the TES system gradually become lower than those of the plant without the TES system because the TES system cost reaches its maximum value and no longer increases with the increasing collector area. Therefore, when the solar collector area is higher than Critical Area 3, the STE-HFMC power plant shall be equipped with a TES system from an economic perspective. The LCOE, COR and TES cost of SOL-HFMC system is summarized in Table 5.

5. Sensitivity Analysis

5.1. Sensitivity Study on Membrane Prices

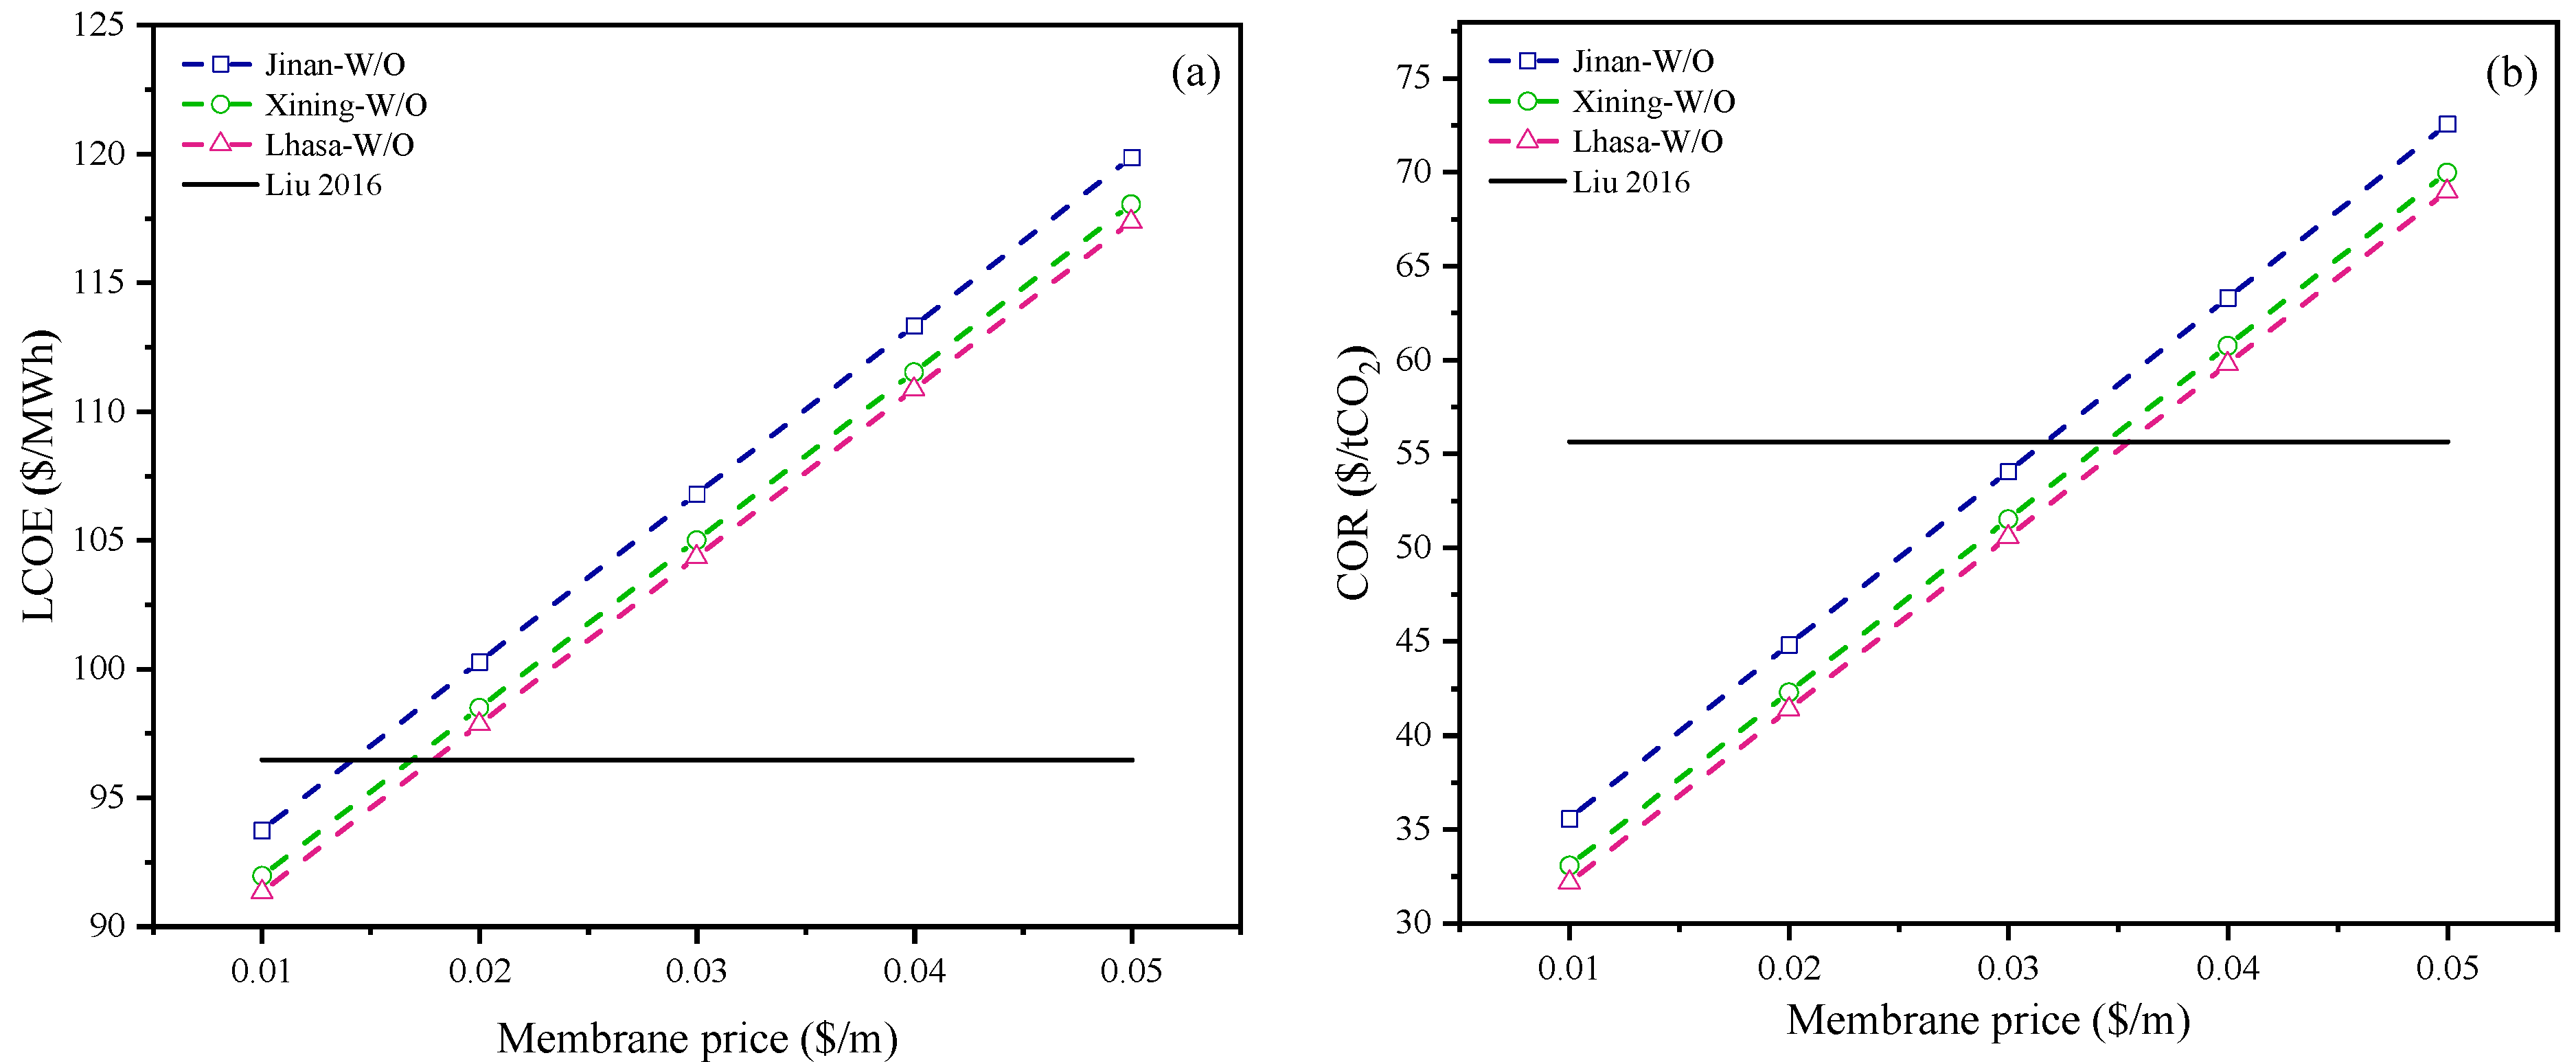
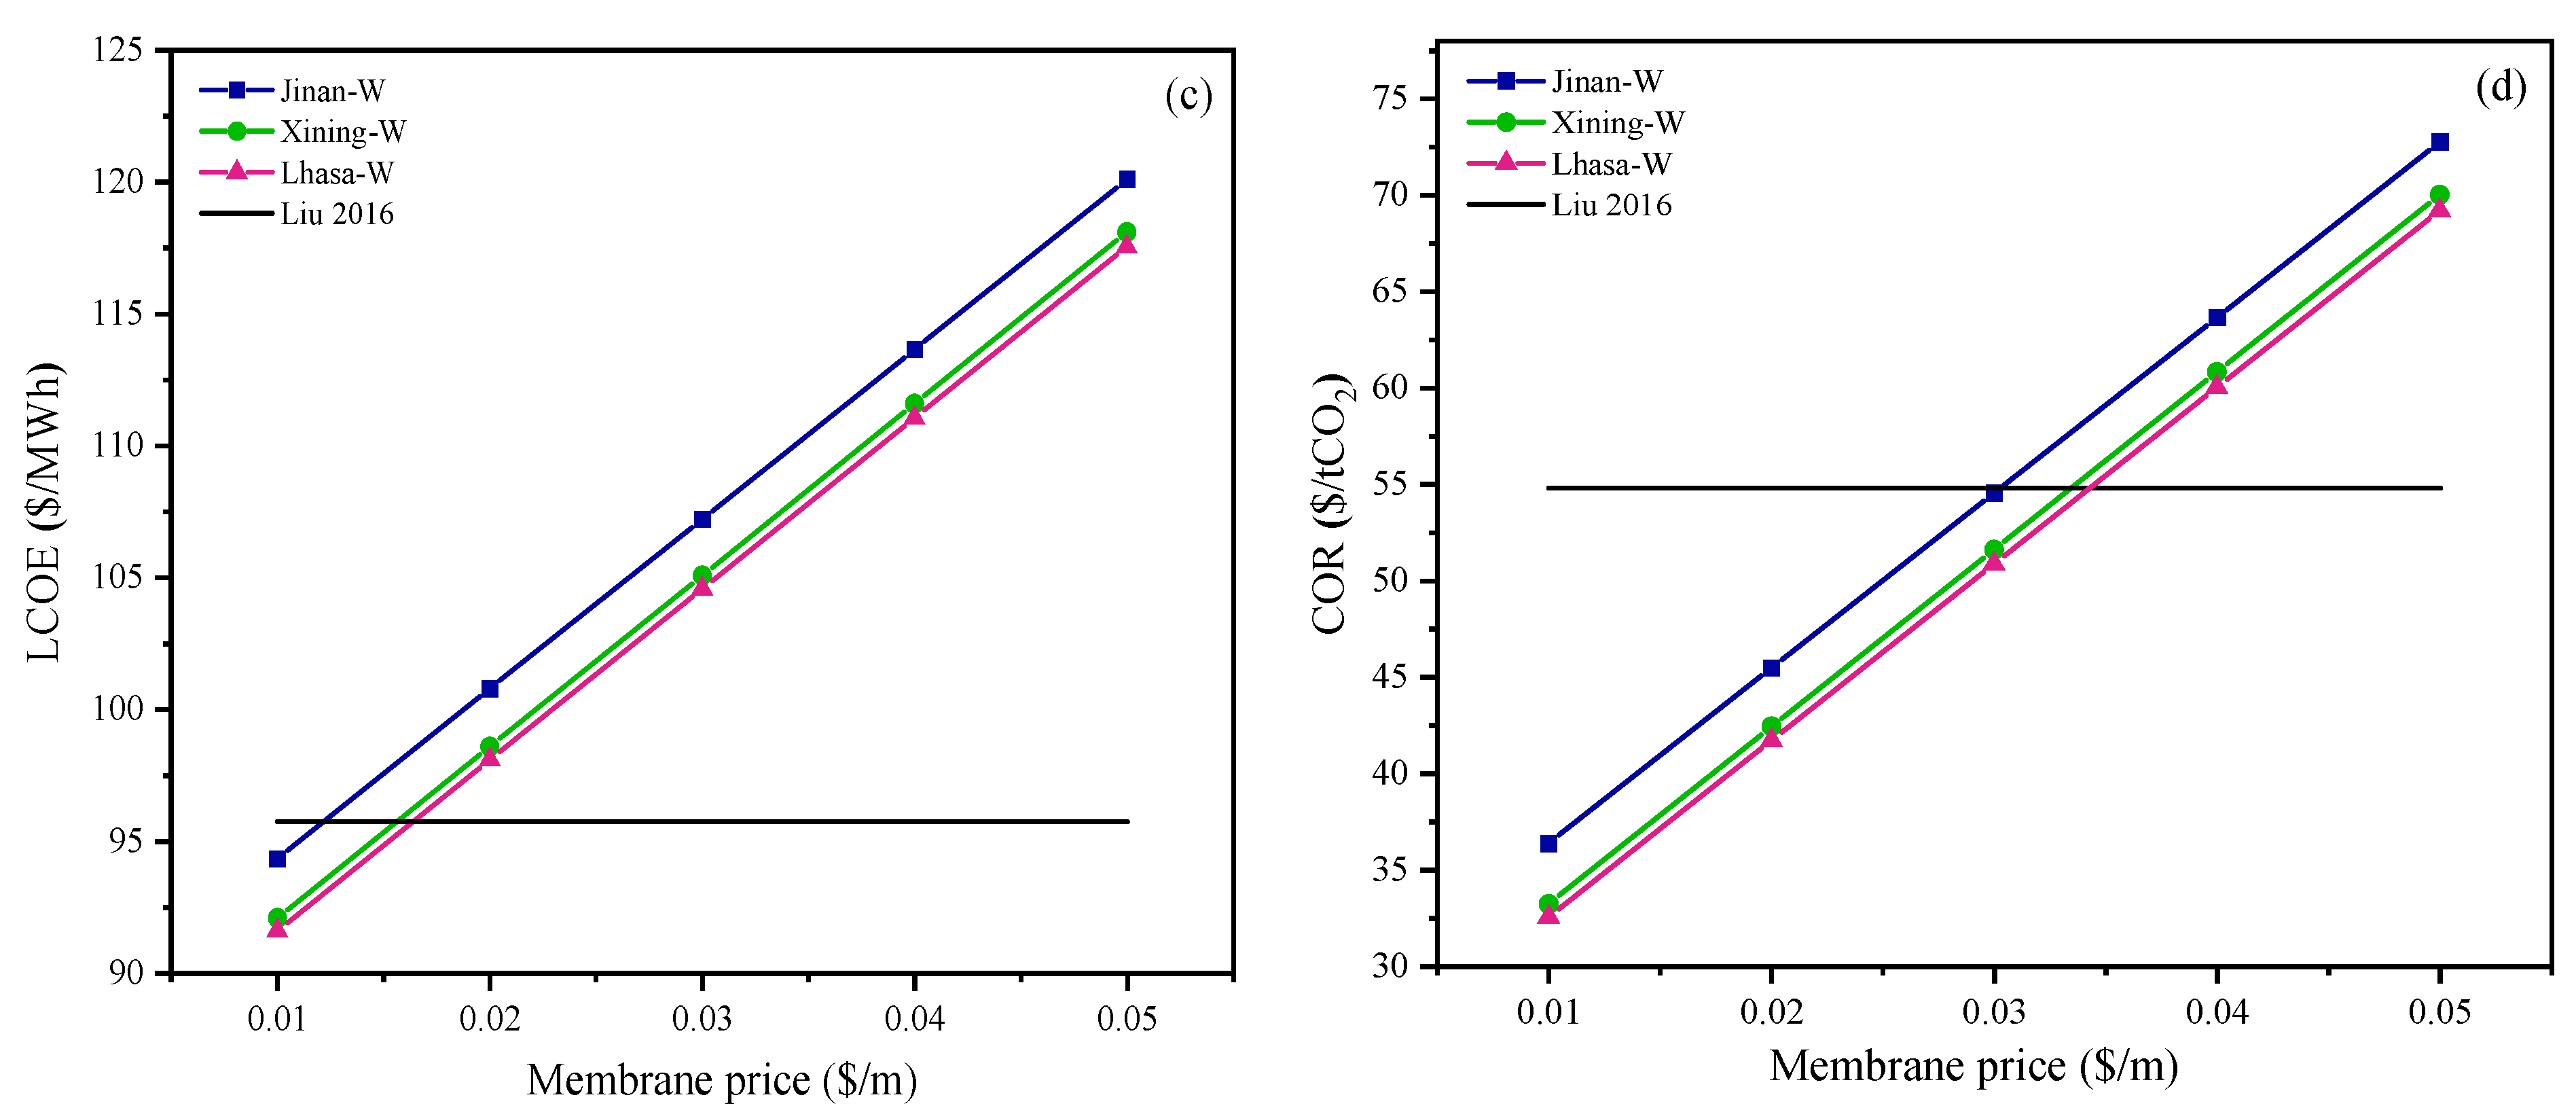
The cost of the polypropylene membrane material accounts for 64% of the total cost of hollow fiber membrane contactors [12]. Therefore, the membrane price is a critical parameter evaluating the economic performance of the SOL-HFMC power plant. Figure 11 shows the variation of the LCOE and COR values with changes in the membrane prices. The LCOE and COR values corresponding to Critical Area 2 of the vacuum tube collector in a solar-assisted ammonia-based power plant in Xi’an City calculated by Liu et al. [19] are also expressed in Figure 11 as the comparison point. It can be found that the values of LCOE and COR linearly increase when the membrane price varies within the range of 0.01–0.05 $/m for all three studied locations.
For the SOL-HFMC power plant without the TES system, when the membrane price is set at 0.01 $/m, the LCOE is reduced by 2.9%, 4.7%, and 5.3%, and COR is reduced by 36.1%, 40%, and 42.2% compared with the reference point in Lhasa, Xining, and Jinan, respectively. From the perspective of LCOE, the LCOE value is better than the value of the comparison point when the membrane price is lower than 0.014 $/m, 0.017 $/m, and 0.018 $/m for Jinan, Xining, and Lhasa cities, respectively. From the perspective of COR, the COR value is lower than the value of the comparison point when the membrane price is lower than 0.032 $/m, 0.034 $/m, and 0.036 $/m for Jinan, Xining, and Lhasa cities, respectively.
For the SOL-HFMC power plant with the TES system, when the membrane price is set at 0.01 $/m, the LCOE is reduced by 1.5%, 3.9%, and 4.4%, and COR is reduced by 33.7%, 39.4%, and 40.7% compared with the comparison point in Lhasa, Xining and Jinan, respectively. From the perspective of LCOE, the LCOE value is superior to the value of the comparison point when the membrane price is lower than 0.012 $/m, 0.015 $/m, and 0.016 $/m for Jinan, Xining, and Lhasa cities, respectively. From the perspective of COR, the COR value is lower than the value of the comparison point when the membrane price is lower than 0.030 $/m, 0.033 $/m, and 0.034 $/m for Jinan, Xining, and Lhasa cities, respectively.
Table 6 gives a preliminary comparison of the proposed SOL-HFMC system with other solar-assisted post-combustion CO2 capture systems in terms of CEI, LCOE, and COR. It can be evidently observed that the novel system proposed in this study shows better performance from an economic perspective.

5.2. Sensitivity Study on Solar Collector Prices

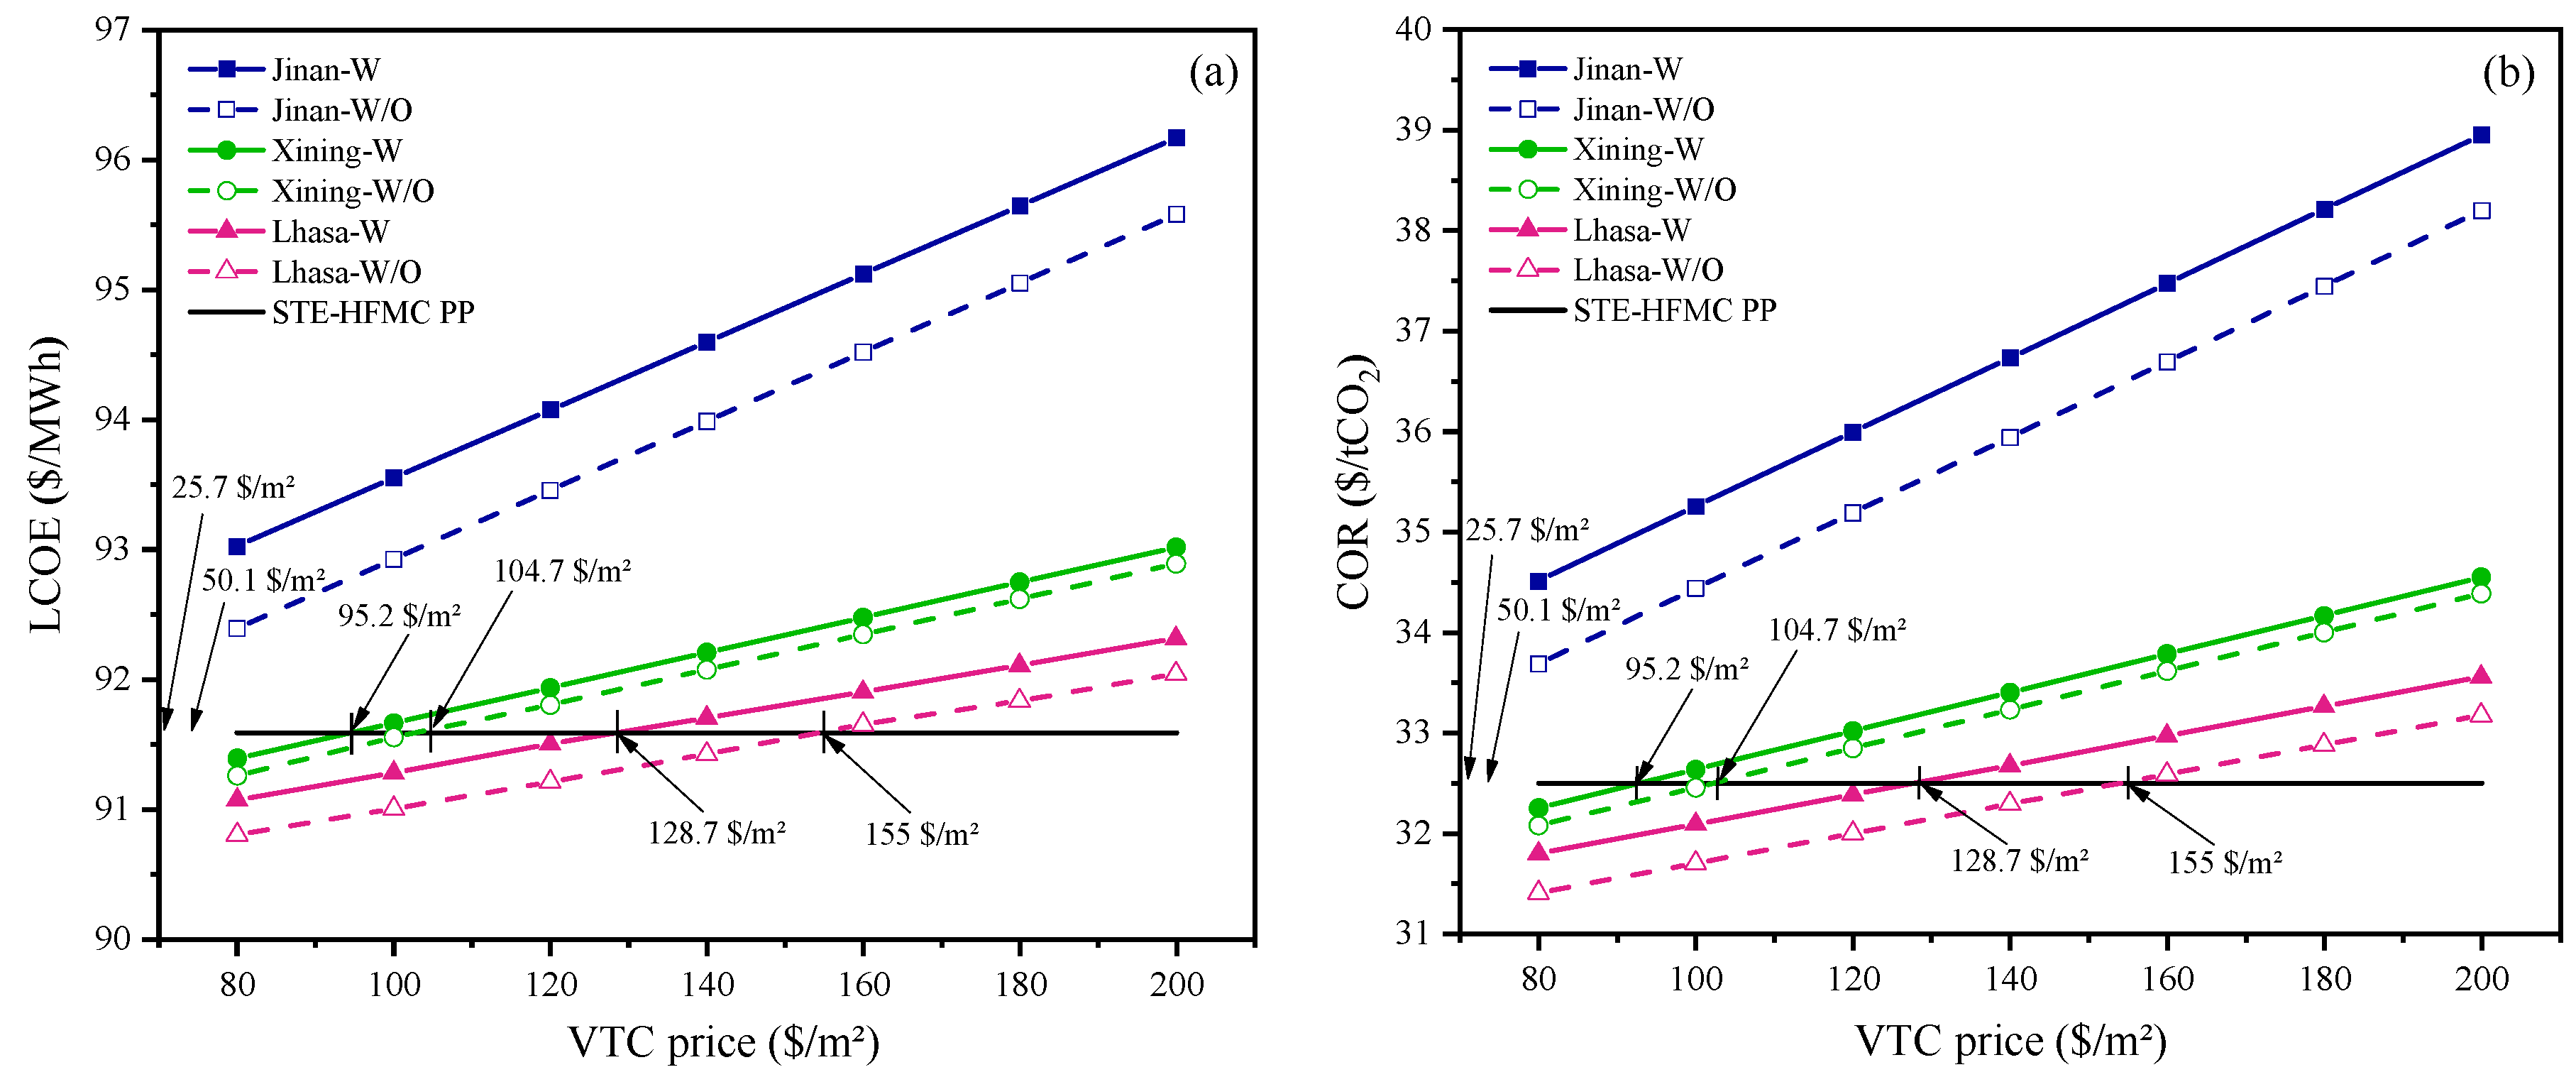
To investigate the influence of the price variation of vacuum tube collectors on the economic viability of the SOL-HFMC power plant, Figure 12 and Figure 13 present the variations in LCOE and COR values with changes in VTC and PCM prices. For comparison, the LCOE and COR values of the STE-HFMC power plant are also drawn in Figure 12 and Figure 13. It can be found that the LCOE and COR values of the STE-HFMC power plant are fixed values which are not influenced by the price variations of the vacuum tube collector because the regeneration energy is supplied by the steam extracted from the steam turbine. When the price of the vacuum tube collector varies in the range of 80–200 $/m2, the LCOE and COR values of the SOL-HFMC power plant with or without the TES system linearly increase with the increasing solar collector price for all three studied locations. At a given VTC price, the LCOE and COR values of Lhasa are lower than those of Xining, and Jinan has the highest LCOE and COR values. For the same studied location, the introduction of the TES system increases the LCOE and COR values of the STE-HFMC power plant under the same VTC price. To achieve better economic performance compared to the STE-HFMC power plant, if the TES system is not applied, the critical VTC price is 50.1 $/m2 for Jinan, 104.7 $/m2 for Xining, and 155 $/m2 for Lhasa, respectively. When the TES system is applied, the corresponding VTC prices shall be reduced to be lower than 25.7 $/m2 for Jinan, 95.2 $/m2 for Xining, and 128.7 $/m2 for Lhasa, respectively. It can be concluded that the critical price in a location with higher solar irradiation resources is higher than that of a location with poorer solar resources. Thus, it is more attractive to apply the proposed SOL-HFMC system in power plants with rich solar resources.

5.3. Sensitivity Study on PCM Prices

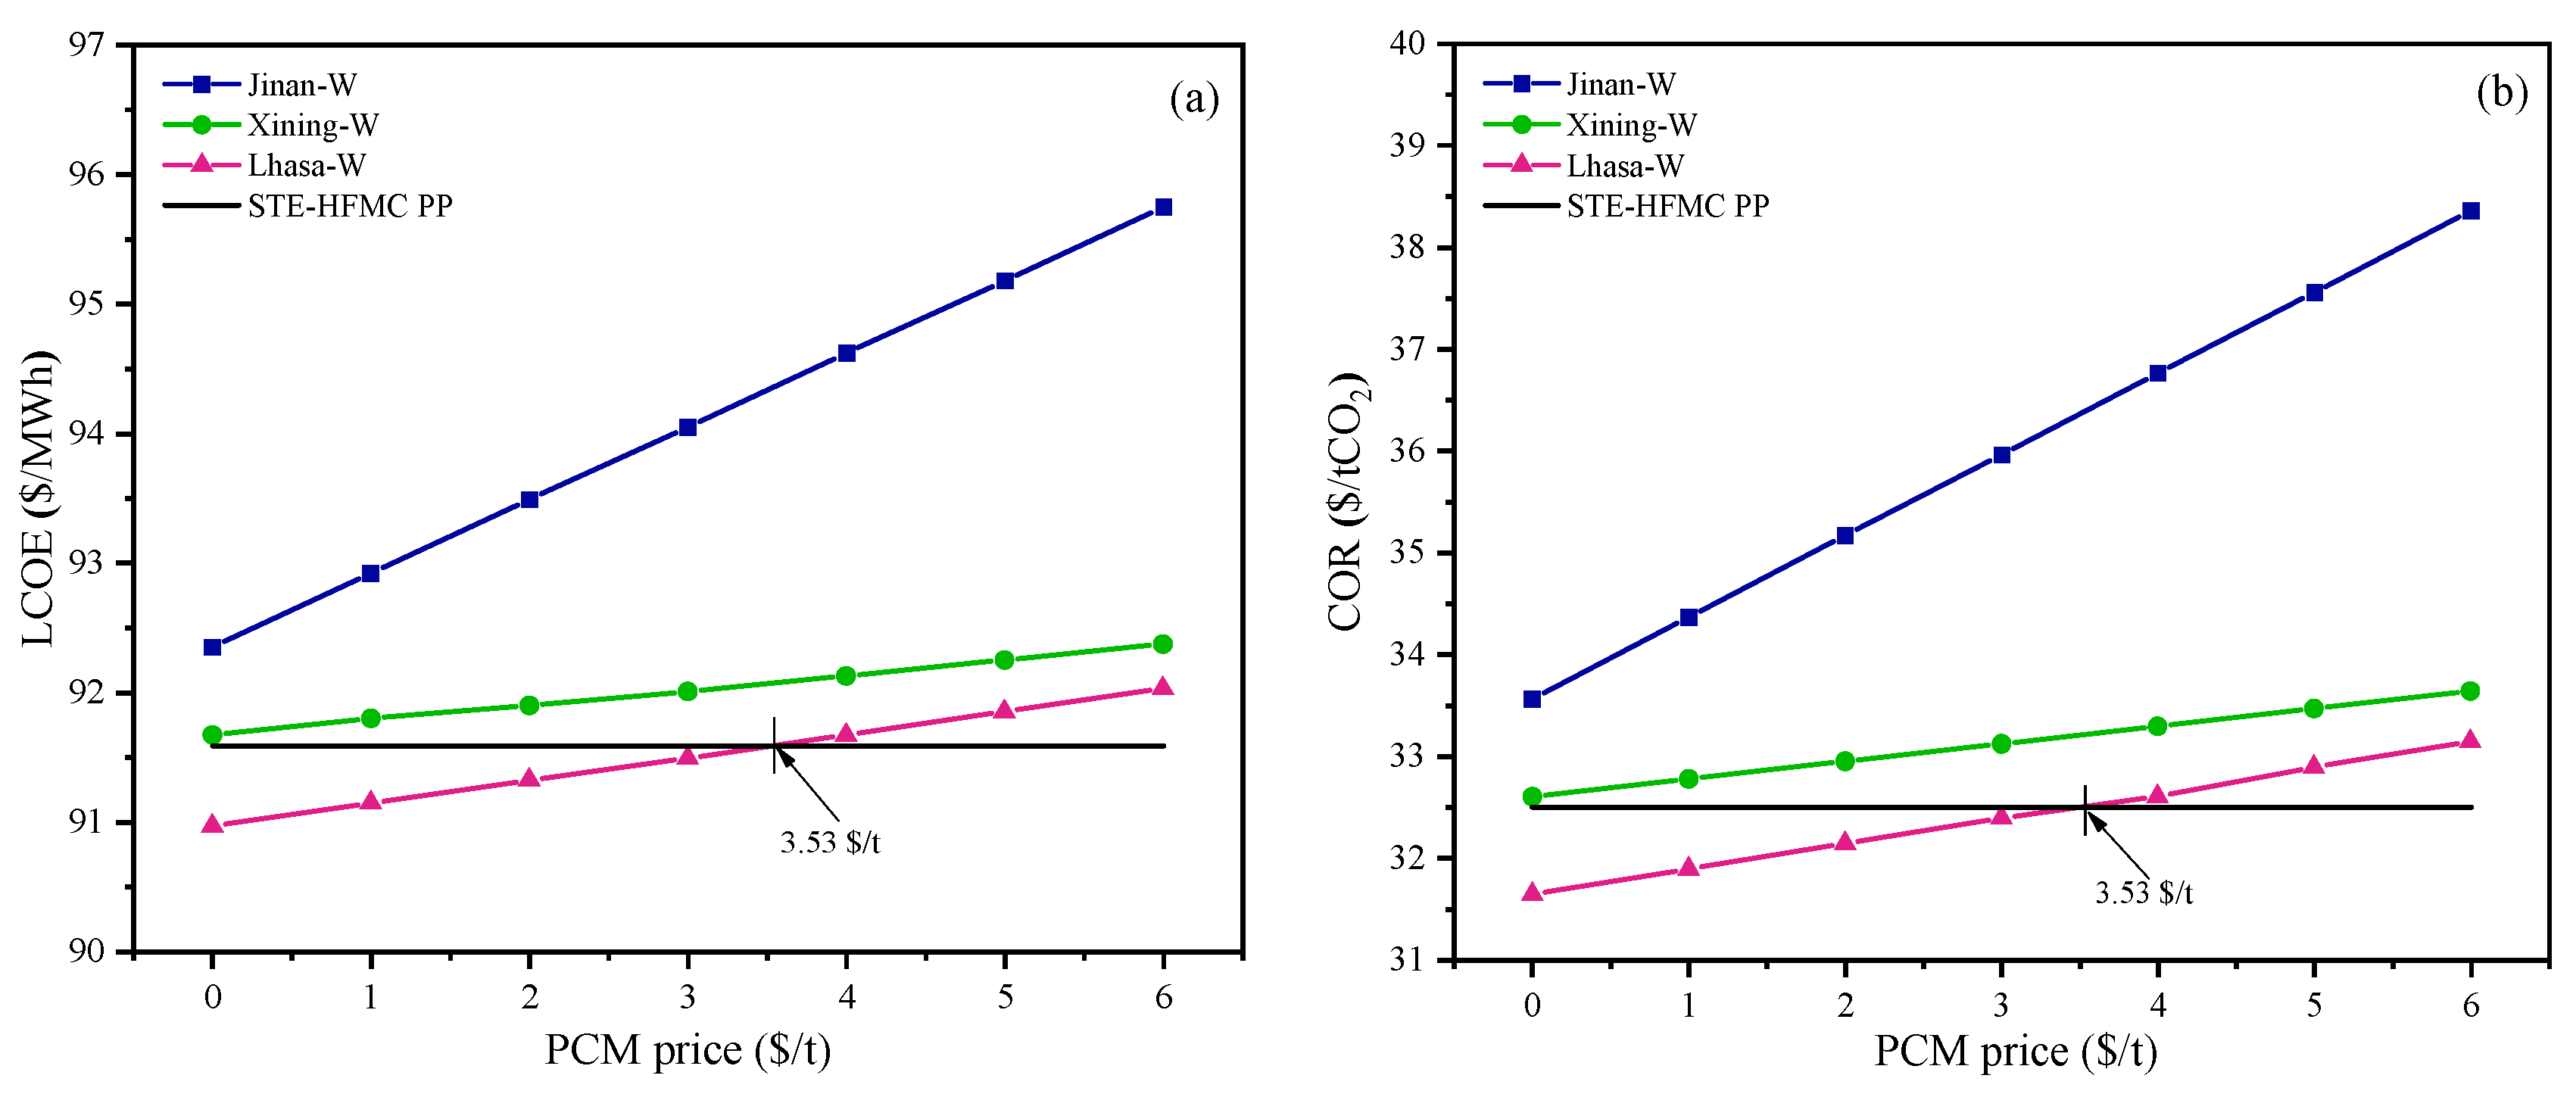
If the TES system is integrated with the SOL-HFMC power plant, the PCM prices will affect the LCOE and COR values. As shown in Figure 13, the LCOE and COR values linearly increase with an increase in the PCM price for all three studied locations. Even though the PCM price is reduced to 1.00 $/t, it cannot make the LCOE and COR values of Jinan and Xining lower than the corresponding values of the STE-HFMC power plant. However, for Lhasa city, the SOL-HFMC power plant is more competitive than the STE-HFMC power plant when the PCM price is reduced to be lower than 3.53 $/t.

6. Conclusions

In the present paper, a novel hybridization system, which utilizes solar thermal energy to assist with the CO2-rich absorbent regeneration process by membrane gas absorption technology, has been proposed to capture CO2 from the flue gas of fossil fuel power plants. Three locations with different weather conditions have been selected to evaluate the technical potential and economic feasibility of the proposed system. Based on the research results, the following conclusions can be drawn:
(1)
Specific to the SF of the SOL-HFMC power plant without a TES system, the SF reaches its maximum value of 28.19%, 30.26%, and 34.84% when the solar collector area reaches Critical Area 2 in Jinan, Xining, and Lhasa cities, respectively; if the TES system is applied, the SF can reach its maximum value of 90.7%, 92.76%, and 97.34% for Jinan, Xining, and Lhasa, respectively; in this study, the SF value could not reach 100% due to the TES capacity limitation of 15 FLH;
(2)
From the perspective of technical potential, the output capacity and net efficiency of the SOL-HFMC power plant are both significantly improved in comparison with the STE-HFMC power plant, regardless of whether the TES system is equipped or not; the performance of the SOL-HFMC power plant equipped with the TES system is superior to that of the SOL-HFMC power plant without the TES system, with the net efficiency increased by 2.00%, 2.04%, and 2.13% in Jinan, Xining, and Lhasa, respectively;
(3)
Specific to the CEI value, the minimum CEI value of the proposed SOL-HFMC power plant with the TES system can be stabilized at 92.14 kg CO2/MWh, 92.05 kg CO2/MWh and 91.84 CO2/MWh in Jinan, Xining, and Lhasa, respectively; for the SOL-HFMC power plant without the TES system, the CEI value is decreased by 1.40 kg CO2/MWh, 1.50 kg CO2/MWh, and 1.73 kg CO2/MWh in Jinan, Xining, and Lhasa, respectively, compared to 96.50 kg CO2/MWh in the STE-HFMC power plant;
(4)
To achieve better economic performance compared to the STE-HFMC power plant, if the TES system is not applied, the critical VTC price is 50.1 $/m2 for Jinan, 104.7 $/m2 for Xining, and 155.1$/m2 for Lhasa, respectively; when TES system is applied, the corresponding VTC prices shall be reduced to be lower than 25.7 $/m2 for Jinan, 95.2 $/m2 for Xining, and 128.7 $/m2 for Lhasa, respectively; for Lhasa city with rich solar resources, the SOL-HFMC power plant is more competitive than the STE-HFMC power plant when the PCM price is lower than 3.53 $/t;
(5)
The membrane price is also critical for the economic performance of the SOL-HFMC power plant; in comparison with the reference point, for the SOL-HFMC power plant with the TES system, the LCOE is reduced by 1.5%, 3.9%, and 4.4%, and COR is reduced by 33.7%, 39.4%, and 40.7% at a given membrane price of 0.01 $/m in Lhasa, Xining, and Jinan, respectively.
In order to comprehensively evaluate the SOL-HFMC system proposed in this study, a more detailed comparative analysis with other solar-assisted post-combustion CO2 capture systems, as well as the environmental impact evaluation by the life cycle assessment method, shall be carried out in our future research.

Author Contributions

J.M.: methodology, validation, formal analysis, writing—original draft preparation; J.B.: writing—original draft preparation, data curation, visualization, validation; Y.L.: conceptualization, methodology, writing—review and editing, Supervision; Y.S.: writing—review and editing, funding acquisition, supervision; W.Z.: visualization, validation, formal analysis; H.Z. (Hui Zhang): resources, formal analysis; T.D.: writing—review and editing, funding acquisition; F.L.: data curation; H.Z. (Hongyang Zhou): visualization. All authors have read and agreed to the published version of the manuscript.

Funding

This research was carried out with the financial support of Young Innovative Talents Introduction & Cultivation Program for Colleges and Universities of Shandong Province (Sub-title: Innovative Research Team of Advanced Energy Equipment) granted by Department of Education of Shandong Province, Natural Science Foundation of Shandong Province (No. ZR2021ME174, No. ZR2020ME178) and Shenzhen Fundamental Research Program (No. JCYJ20220530141009020).

Data Availability Statement

Data are contained within the article.

Conflicts of Interest

The authors declare no conflicts of interest.

References

  1. Available online: https://www.ipcc.ch/sr15/ (accessed on 13 October 2023).
  2. Available online: https://net0.com/blog/net-zero-countries (accessed on 8 March 2024).
  3. Available online: https://www.irena.org/publications/2022/Jul/Chinas-Route-to-Carbon-Neutrality (accessed on 26 October 2023).
  4. Ghoniem, A.F. Needs, resources and climate change: Clean and efficient conversion technologies. Prog. Energy Combust. 2011, 37, 15–51. [Google Scholar] [CrossRef]
  5. Goto, K.; Yogo, K.; Higashii, T. A review of efficiency penalty in a coal-fired power plant with post-combustion CO2 capture. Appl. Energy 2013, 111, 710–720. [Google Scholar] [CrossRef]
  6. Zahedi, R.; Ayazi, M.; Aslani, A. Comparison of amine adsorbents and strong hydroxides soluble for direct air CO2 capture by life cycle assessment method. Environ. Technol. Innov. 2022, 28, 102854. [Google Scholar] [CrossRef]
  7. Li, X.L.; Zhou, X.B.; Wei, J.W.; Fan, Y.M.; Liao, L.; Wang, H.Q. Reducing the energy penalty and corrosion of carbon dioxide capture using a novel nonaqueous monoethanolamine-based biphasic solvent. Sep. Purif. Technol. 2021, 265, 118481. [Google Scholar] [CrossRef]
  8. Aghel, B.; Janati, S.; Wongwises, S.; Shadloo, M.S. Review on CO2 capture by blended amine solutions. Int. J. Greenh. Gas Control 2022, 119, 103715. [Google Scholar] [CrossRef]
  9. Bravo, J.; Drapanauskaite, D.; Sarunac, N.; Romero, C.; Jesikiewicz, T.; Baltrusaitis, J. Optimization of energy requirements for CO2 post-combustion capture process through advanced thermal integration. Fuel 2021, 283, 118940. [Google Scholar] [CrossRef]
  10. Lv, Y.X.; Yu, X.H.; Tu, S.T.; Yan, J.Y.; Dahlquist, E. Experimental studies on simultaneous removal of CO2 and SO2 in a polypropylene hollow fiber membrane contactor. Appl. Energy 2012, 97, 283–288. [Google Scholar] [CrossRef]
  11. Belaissaoui, B.; Favre, E. Novel dense skin hollow fiber membrane contactor based process for CO2 removal from raw biogas using water as absorbent. Sep. Purif. Technol. 2018, 193, 112–126. [Google Scholar] [CrossRef]
  12. Nguyen, K.; Iliuta, I.; Bougie, F. Techno-economic assessment of enzymatic CO2 capture in hollow fiber membrane contactors with immobilized carbonic anhydrase. Sep. Purif. Technol. 2023, 307, 122702. [Google Scholar] [CrossRef]
  13. Jang, M.G.; Yun, S.; Kim, J.K. Process design and economic analysis of membrane-integrated absorption processes for CO2 capture. J. Clean. Prod. 2022, 368, 133180. [Google Scholar] [CrossRef]
  14. Scholes, C.A. Membrane contactors modelled for process intensification post combustion solvent regeneration. Int. J. Greenh. Gas Control 2019, 87, 203–210. [Google Scholar] [CrossRef]
  15. Kumar, A.; Tiwari, A.K. Solar-assisted post-combustion carbon-capturing system retrofitted with coal-fired power plant towards net-zero future: A review. J. CO2 Util. 2022, 65, 102241. [Google Scholar] [CrossRef]
  16. Alzhrani, A.; Romero, C.E.; Baltrusaitis, J. Sustainability Assessment of a Solar Energy-Assisted Flue Gas Amine-Based CO2 Capture Process Using Fully Dynamic Process Models. ACS Sustain. Chem. Eng. 2023, 11, 11385–11398. [Google Scholar] [CrossRef]
  17. Quang, D.V.; Milani, D.; Zahra, M.A. A review of potential routes to zero and negative emission technologies via the integration of renewable energies with CO2 capture processes. Int. J. Greenh. Gas Control 2023, 124, 103862. [Google Scholar] [CrossRef]
  18. Mokhtar, M.; Ali, M.T.; Khalilpour, R.; Abbas, A.; Shah, N.; Hajaj, A.A.; Armstrong, P.; Chiesa, M.; Sgouridis, S. Solar-assisted Post-combustion Carbon Capture feasibility study. Appl. Energy 2012, 92, 668–676. [Google Scholar] [CrossRef]
  19. Liu, L.X.; Zhao, J.; Deng, S.; An, Q.S. A technical and economic study on solar-assisted ammonia-based post-combustion CO2 capture of power plant. Appl. Therm. Eng. 2016, 102, 412–422. [Google Scholar] [CrossRef]
  20. Khalilpour, R.; Milani, D.; Qadir, A.; Chiesa, M.; Abbas, A. A novel process for direct solvent regeneration via solar thermal energy for carbon capture. Renew. Energy 2017, 104, 60–75. [Google Scholar] [CrossRef]
  21. Kev, K.; Modi, N.; Milani, D.; Luu, M.T.; Nelson, S.; Manaf, N.A.; Wang, X.L.; Negnevitsky, M.; Abbas, A. A comparative life cycle impact assessment for solar heat integration in post-combustion carbon capture. Energy Convers. Manag. 2023, 297, 117745. [Google Scholar] [CrossRef]
  22. Cost NETL. Performance Baseline for Fossil Energy Plants, Volume 1: Bituminous Coal and Natural Gas to Electricity, Revision 2; DOE/NETL-2010/1397; National Energy Technology Laboratory: Albany, OR, USA, 2010. [Google Scholar]
  23. Vinjarapu, S.H.B.; Regueira, T.; Neerup, R.; Solms, N.V.; Fosbøl, P.L. Heat of absorption of CO2 in 30 wt% MEA with monoethyleneglycol and urea as vapour reduction additives. Energy 2024, 294, 130609. [Google Scholar] [CrossRef]
  24. Kim, K.; Lee, H.; Park, H.S.; Song, H.; Kim, S. Surface modification of polypropylene hollow fiber membranes using fluorosilane for CO2 absorption in a gas-liquid membrane contactor. Heliyon 2023, 9, e19829. [Google Scholar] [CrossRef]
  25. Wang, Z.; Fang, M.X.; Ma, Q.H.; Zhao, Z.; Wang, T.; Luo, Z.Y. Membrane Stripping Technology for CO2 Desorption from CO2-rich Absorbents with Low Energy Consumption. Energy Procedia 2014, 63, 765–772. [Google Scholar] [CrossRef]
  26. Yan, Q.; Yang, Y.; Nishimura, A.; Kouzani, A.; Hu, E. Multi-point and multi-level solar integration into a conventional coal-fired power plant. Energy Fuels 2010, 24, 3733–3738. [Google Scholar] [CrossRef]
  27. Sweet, M.L.; McLeskey, J.T., Jr. Numerical simulation of underground Seasonal Solar Thermal Energy Storage (SSTES) for a single-family dwelling using TRNSYS. Sol. Energy 2012, 86, 289–300. [Google Scholar] [CrossRef]
  28. Chen, J.F.; Dai, Y.J.; Wang, R.Z. Experimental and analytical study on an air-cooled single effect LiBr-H2O absorption chiller driven by evacuated glass tube solar collector for cooling application in residential buildings. Sol. Energy 2017, 151, 110–118. [Google Scholar] [CrossRef]
  29. Zhao, R.K.; Liu, L.C.; Zhao, L.; Deng, S.; Li, S.J.; Zhang, Y.; Li, H.L. Techno-economic analysis of carbon capture from a coal-fired power plant integrating solar-assisted pressure-temperature swing adsorption (PTSA). J. Clean. Prod. 2019, 214, 440–451. [Google Scholar] [CrossRef]
  30. Li, K.; Leigh, W.; Feron, P.; Yu, H.; Tade, M. Systematic study of aqueous monoethanolamine (MEA)-based CO2 capture process: Techno-economic assessment of the MEA process and its improvements. Appl. Energy 2016, 165, 648–659. [Google Scholar] [CrossRef]
  31. Rubin, E.S.; Short, C.; Booras, G.; Davsion, J.; Ekstrom, C.; Matuszewski, M.; McCoy, S. A proposed methodology for CO2 capture and storage cost estimates. Int. J. Greenh. Gas Control 2013, 17, 488–503. [Google Scholar] [CrossRef]
  32. Theis, J. Quality Guidelines for Energy Systems Studies: Cost Estimation Methodology for NETL Assessments of Power Plant Performance; National Energy Technology Laboratory (NETL): Albany, OR, USA, 2021. [Google Scholar]
  33. Meteotest, J.R.; Kunz, S. MeteonormData (Worldwide). Available online: https://meteonorm.com/en/ (accessed on 11 December 2023).
  34. Li, H.; Yan, J.; Campana, P.E. Feasibility of integrating solar energy into a power plant with amine-based chemical absorption for CO2 capture. Int. J. Greenh. Gas Control 2012, 9, 272–280. [Google Scholar] [CrossRef]
  35. Cau, G.; Cocco, D.; Tola, V. Performance assessment of USC power plants integrated with CCS and concentrating solar collectors. Energy Convers. Manag. 2014, 88, 973–984. [Google Scholar] [CrossRef]
  36. Wang, F.; Li, H.; Zhao, J.; Deng, S.; Yan, J.Y. Technical and economic analysis of integrating low-medium temperature solar energy into power plant. Energy Convers. Manag. 2016, 112, 459–469. [Google Scholar] [CrossRef]
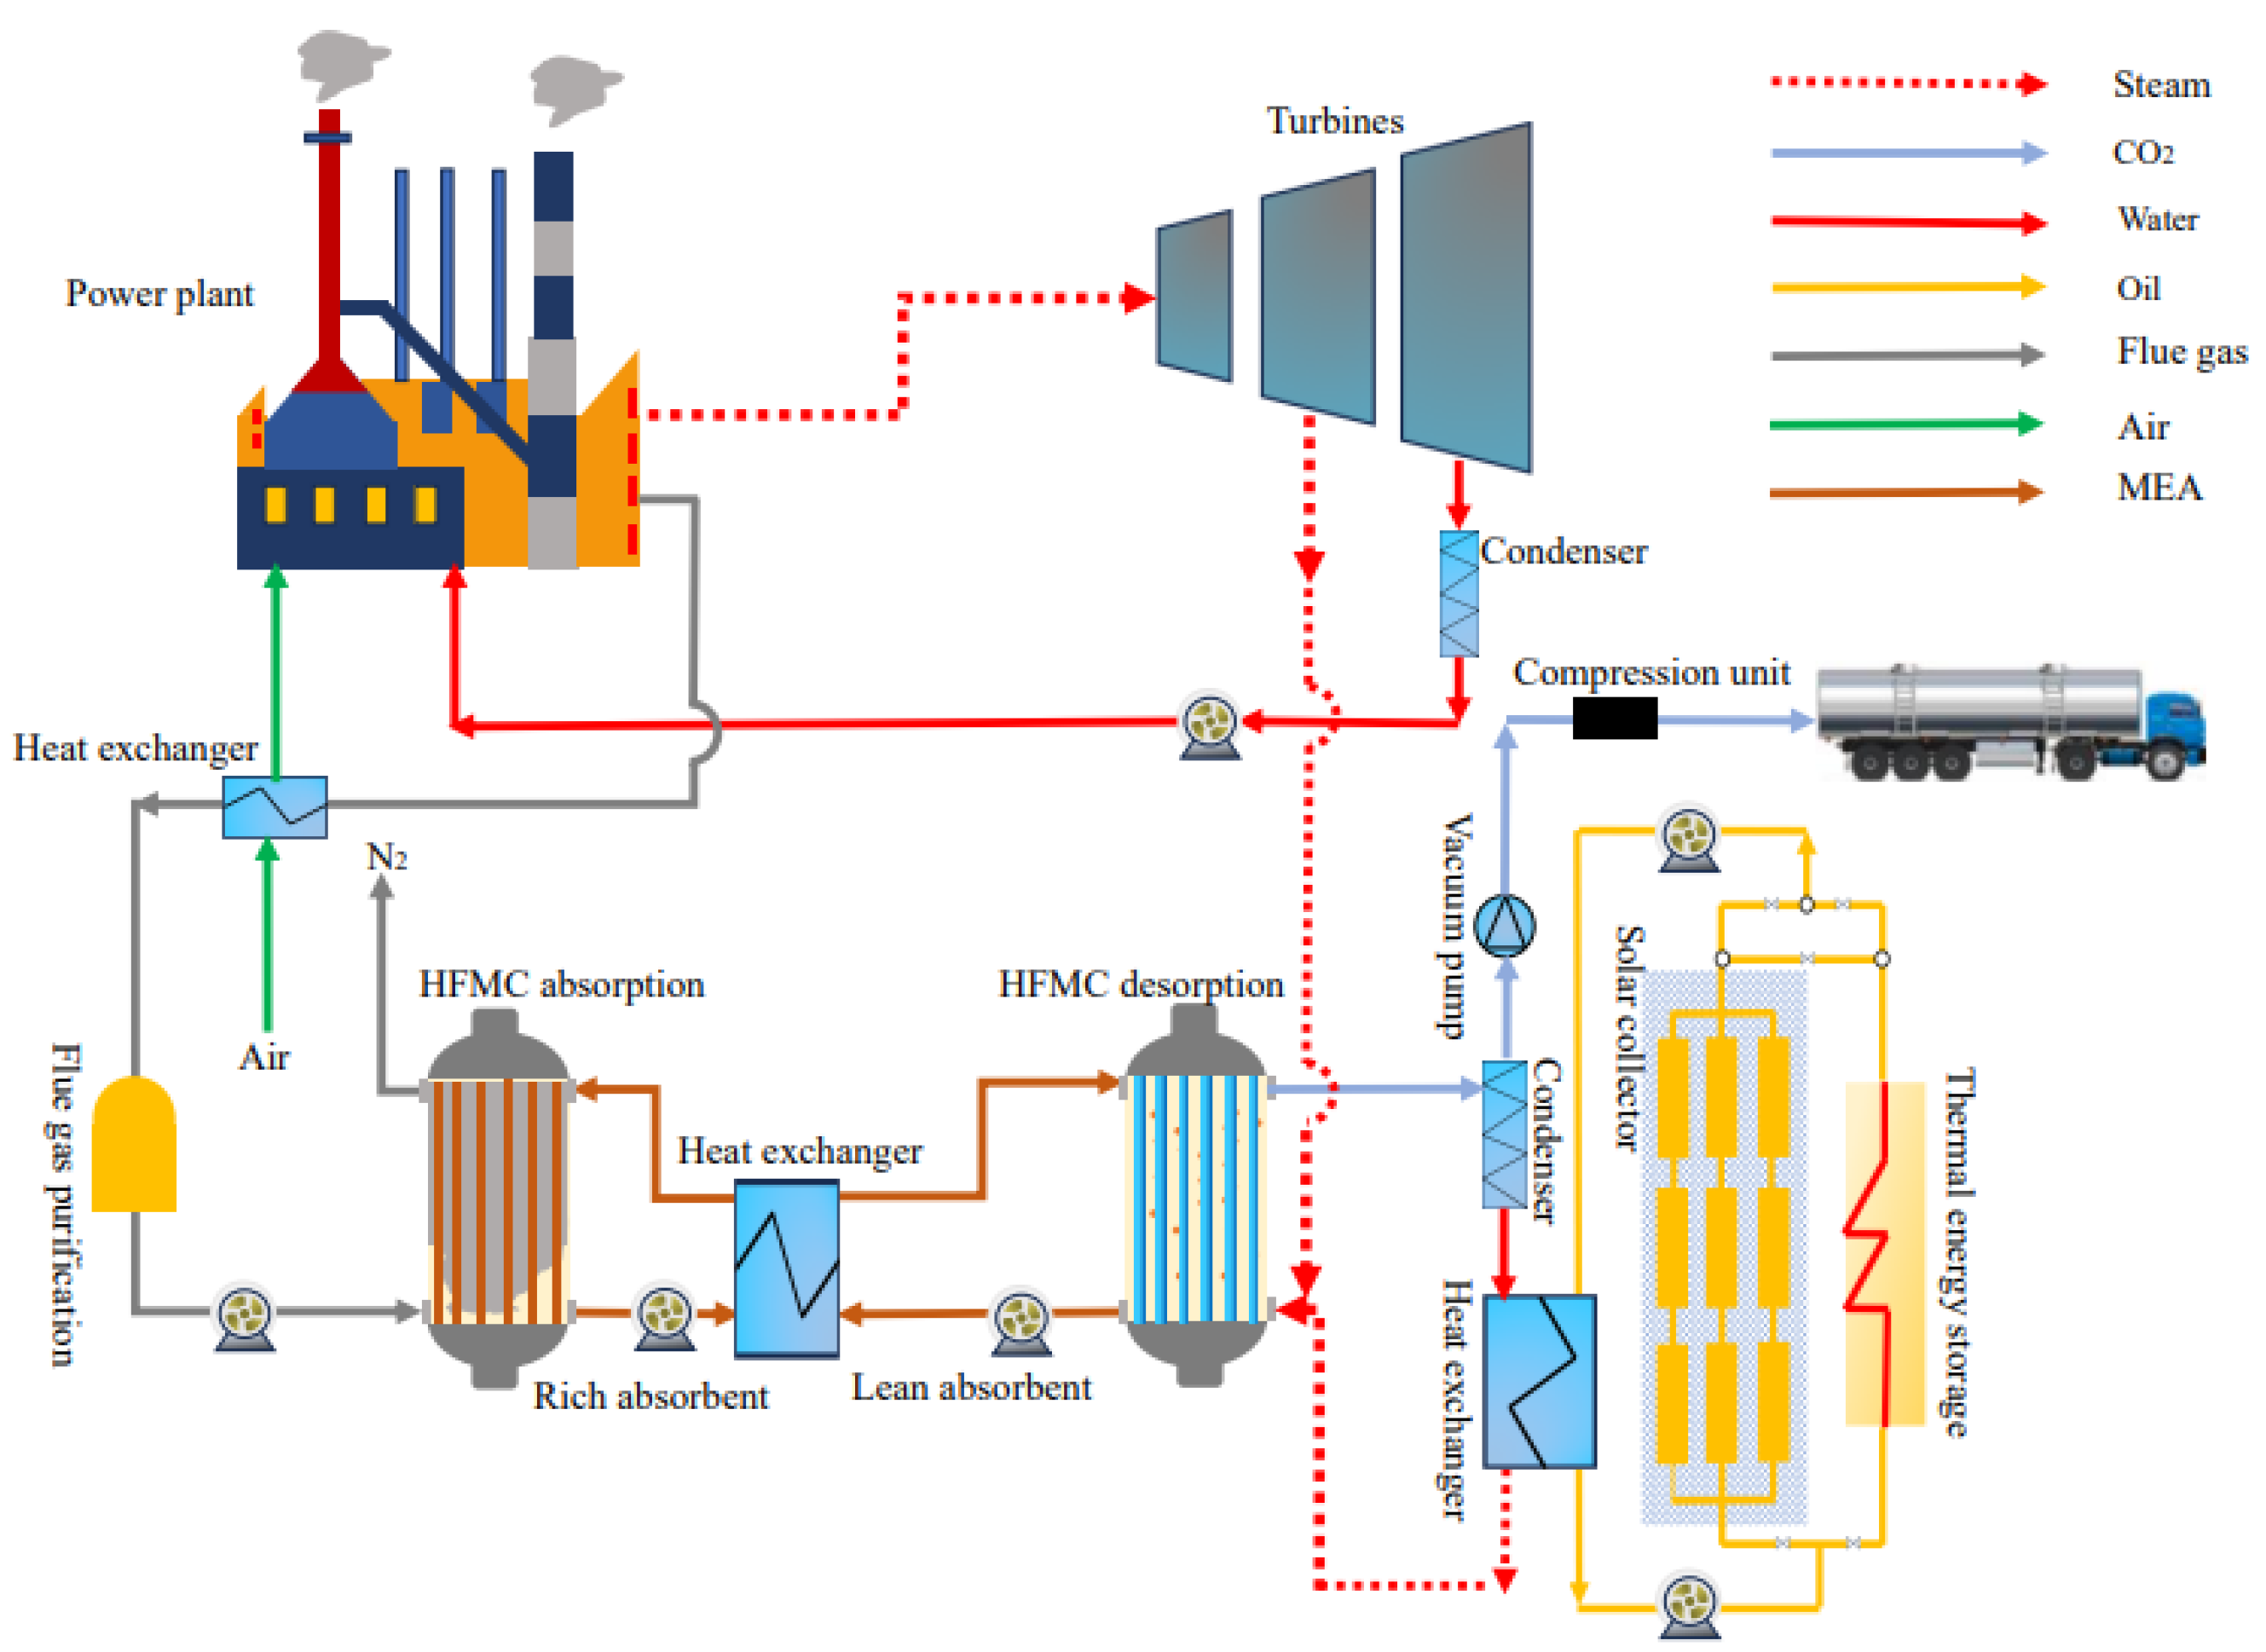
Figure 1. Schematic drawing of the proposed SOL-HFMC power plant.
Energies 17 02139 g001
Figure 2. Solar radiation and location of three study cases.
Energies 17 02139 g002
Figure 3. Main meteorological parameters of the three cities.
Energies 17 02139 g003
Figure 4. Monthly thermal energy harvested by the ETC at studied locations.
Energies 17 02139 g004
Figure 5. Relationship between thermal energy storage capacity and solar load fraction.
Energies 17 02139 g005
Figure 6. Relationship between SF and solar collector area.
Energies 17 02139 g006
Figure 7. Output capacity and net efficiency of the power plant with different configurations. (a) Output capacity. (b) Net efficiency of the power plant.
Energies 17 02139 g007
Figure 8. Change in CEI with the solar collector area.
Energies 17 02139 g008
Figure 9. Dependence of TES system cost on SF and solar collector area. (a) SF. (b) Solar collector area.
Energies 17 02139 g009
Figure 10. Variations of the LCOE and COR with solar collector area. (a) LCOE in Jinan. (b) COR in Jinan. (c) LCOE in Xining. (d) COR in Xining. (e) LCOE in Lhasa. (f) COR in Lhasa.
Energies 17 02139 g010aEnergies 17 02139 g010b
Figure 11. Variations of LCOE and COR with the membrane prices [19]. (a) LCOE without TES. (b) COR without TES. (c) LCOE with TES. (d) COR with TES.
Energies 17 02139 g011aEnergies 17 02139 g011b
Figure 12. Variations of LCOE and COR with the VTC price. (a) LCOE. (b) COR.
Energies 17 02139 g012
Figure 13. Variations of LCOE and COR with PCM price. (a) LCOE. (b) COR.
Energies 17 02139 g013
Table 1. Performance parameters of the power plant.
Technical ParametersValueReferences
Baseline power plant without CCS
Auxiliary load (MWe)30[22]
Net output power (MWe)550[22]
Coal consumption (kg/h)185,759[22]
CO2 emission (t/h)441[22]
CO2 concentration of flue gas (% mol)13.53[22]
STE-HFMC power plant
Number of HFMC200[12]
HFMC diameter (m)2.8[12]
HFMC effective height (m)4.0[12]
HFMC total height (m)4.2[12]
Chemical absorbentMEA
Absorbent mass fraction (wt %)20
Regeneration energy consumption (MJth/kg CO2)1.25[25]
CO2 capture rate (%)90
Gas velocity (m/s)
Purity of desorbed CO2 (%)
1.0
98
[12]
Absorption temperature (K)300
Regeneration temperature (K)353
Liquid velocity (m/s)0.07[12]
Blower and pump power (MWe)5[12]
Vacuum pump power (MWe)26[12]
Compression power (MWe)38[12]
Capacity reduction due to steam extraction (MWe)24
Power output after CO2 capture (MWe)457
Table 2. Economic parameters of the studied system.
Economic ParametersValueReferences
Service lifespan of the project (years)30
Discount rate (%)7[29]
Power plant total equipment cost (M$)444.7[22]
Membrane contactor cost (M$)76.2[12]
Heat Exchanger (M$)8.3[12]
Pumps, blowers, coolers (M$)10.7[12]
Compression unit (M$)50.1[12]
Fuel cost (M$/year)58.2[22]
MEA replenishment (kg/t CO2)1.5[30]
MEA cost ($/kg)2.5[12]
Vacuum tube collector price (USD/m2)130[19]
Energy storage material density (kJ/kg)339.8[19]
Energy storage material price ($/kg)3.5[19]
Table 3. TCR Calculation method.
Capital Cost ItemsQuantification
Process equipment cost444.7 M$ for power plant without CCS [22]
145.3 M$ for HFMC capture unit [12]
Supporting facilities cost10% of process equipment cost
Direct and indirect labor cost50% of process equipment cost
Bare Erected Cost (BEC)The sum of the above items
Engineering services cost18% of BEC
Process contingencies5% of BEC for power plant without CCS
40% of BEC for HFMC capture unit
Project contingencies15% of all above
Total Plant Cost (TPC)BEC + Engineering services + Contingencies
Owner’s costs15% of TPC
Total Overnight cost (TOC)TPC + Owner’s costs
Total Capital Requirement 1.289 × TOC
Table 4. Value of Critical Area in three studied locations.
Critical Area 1Critical Area 2Critical Area 3Critical Area 4
JinanCollector area (km2)0.290.860.963.06
SF (%)19.6557.0063.4590.69
XiningCollector area (km2)0.330.440.941.52
SF (%)27.3436.5878.5992.76
LhasaCollector area (km2)0.220.340.651.02
SF (%)28.2442.2281.6397.34
Table 5. LCOE, COR, and TES cost of SOL-HFMC system.
LCOE ($/MWh)COR ($/t CO2)TES System Cost (M$)
Critical Area 1Critical Area 3Critical Area 1Critical Area 3Critical Area 1Critical Area 3
Jinan-W91.8694.7832.9536.97076.65
Jinan-W/O91.8694.1332.9536.14076.65
Xining-W91.6394.0232.6135.87076.65
Xining-W/O91.6393.9732.6135.91076.65
Lhasa-W91.1792.7331.9534.04076.65
Lhasa-W/O91.1792.5831.9533.93076.65
Table 6. Comparison with other solar-assisted post-combustion CO2 capture systems.
ReferenceCapture SystemCEI (kg CO2/MWh)LCOE ($/MWh)COR ($/t CO2)
PresentMembrane gas absorption91.84–95.5291.17–102.6531.95–48.20
[19]Chemical absorption-95–10547–65
[34]Chemical absorption 70–11446–117
[35]Chemical absorption103.5216-
[36]Chemical absorption-11762
Disclaimer/Publisher’s Note: The statements, opinions and data contained in all publications are solely those of the individual author(s) and contributor(s) and not of MDPI and/or the editor(s). MDPI and/or the editor(s) disclaim responsibility for any injury to people or property resulting from any ideas, methods, instructions or products referred to in the content.