Abstract
Classical kinetic models describing the hydrogen absorption of nanocrystalline metallic hydrides generally do not involve any parameter related to the change in the crystallite size during the hydrogenation at constant temperature. In the present investigation, ball-milled nanocrystalline Mg powders exhibiting lognormal crystallite size distribution have been subjected to hydrogen absorption in a Sievert-type apparatus. Partially absorbed states were achieved by interrupting the hydrogenation cycle at different hydrogen content, i.e., when 15%, 50%, and 90% of Mg powder transformed to MgH2. The evolution of the characteristic size of the nucleating MgH2 phase was determined from X-ray diffraction analysis. Considering the crystallite size distribution of the as-milled powder agglomerate as well as the growth during the isothermal hydrogenation process, a time-dependent multi-particle reaction function was developed. It was shown unambiguously for this case study that the measured hydrogen absorption curve of the ball-milled Mg powder shows the best correlation with this model when it is compared to classical kinetic functions or the previously developed multi-particle reaction function excluding the change in the average crystallite size during hydrogenation.
1. Introduction
The world’s overall energy consumption is still satisfied by conventional fossil fuels up to 90% [1]; however, mankind should transform its energy technology from exhaustive CO2 emission to clean and renewable energy sources [2,3]. Unfortunately, the integration of solar and wind energy into the existing energy grid is restricted at the moment due to their unavoidable dependence on weather conditions [2]. Recent researches consider hydrogen as a clean and efficient energy vector that can significantly contribute to the world’s energy solutions due to its very high energy density per mass (120–140 MJ/kg), non-toxicity, and harmless reactions when applied in fuel cells to convert its chemical energy to electric energy [4,5]. However, a hydrogen storage system has to meet several requirements in order to be efficiently applied in regular on-board and off-board use [6]. These necessities should include high volumetric and gravimetric density, reasonable hydrogenation and dehydrogenation sorption rate at conventional operating temperature ranges, and a reliable life cycle [7]. The major bottleneck is the effective and economical storage of hydrogen fuel. Conventional technologies based on gaseous storage are not suitable for vehicular usage, mainly due to low volume requirements and safety issues [8]. Liquification of hydrogen is also a non-practical approach, since instant cooling requires intensive energy supply, while the boil-off of hydrogen is unavoidable.
Currently, intensive worldwide research has been targeting the utilization of efficient storage of hydrogen in the solid state with appropriate hydrogen density [9,10]. Among a large number of different materials, such as elements, alloys, compounds, and complex systems, metal hydrides have received significant attention as they possess large H-storage capacity and remarkable reversibility [11,12,13,14]. Elemental magnesium with its excellent absorption capacity (7.6 wt. %, or 2600 Wh/kg), good reversibility, small density, low cost, high abundancy (~2% of the earth’s crust), relatively safe operation, and environmental friendliness has been investigated for up to 50 years [15,16,17,18,19]. Unfortunately, the direct use of commercial Mg in regular applications is hampered due to sluggish kinetics, high sorption temperature, and high hydrogenation enthalpy [20,21].
To tailor the hydrogen storage performance of Mg/MgH2, several experimental strategies have been proposed including nanostructuring [22] and catalyst addition [23]. Nanocrystallization usually achieved by severe plastic deformation (SPD) can significantly improve the hydrogenation/dehydrogenation kinetics performance and temperature of sorption of Mg-based systems [24,25,26]. The most frequent method to prepare nanostructured hydrogen storage materials by SPD is high energy ball milling (HEBM) [26], resulting in powders with an average crystallite size in the order of 10–100 nm, abundant grain boundaries, and high specific surface area [27,28]. These parameters can drastically improve the sorption kinetics by promoting faster diffusion of hydrogen from the surface to the interior of the nanocrystals [29,30,31,32,33]. Besides the 2D grain boundaries, the large density of 1D lattice defects, such as dislocations, created by HEBM can further promote hydrogen sorption due to the enhanced diffusion length of hydrogen [34,35]. The catalytic effect of various additives, such as transition metals [36,37,38,39,40], metal oxides [32,41,42,43,44,45], and carbon-based materials [46,47,48] incorporates an easier H2 molecule dissociation at the surface of the nanoparticles, resulting in the reduction in hydride formation enthalpy. The hydriding reaction of Mg-based materials with hydrogen includes several stages, such as
- (I)
- Physisorption of the H2 molecules by weak van der Waals interaction onto the free surface of magnesium powder particles;
- (II)
- Dissociation of hydrogen molecules into two H atoms;
- (III)
- Chemisorption of hydrogen atoms;
- (IV)
- Diffusion into bulk lattice sites, preferably along grain boundaries and dislocations and as a final step;
- (V)
- The nucleation and growth of the MgH2 takes place [23,49].
The overall hydrogen absorption rate of this reaction sequence is determined by the slowest stage, also called the “rate limiting step” [49,50]. Usually, a thin oxide layer is present at the initial stage of the hydrogen reaction, which presents a barrier [51]. In order to improve the absorption kinetics, this oxide layer should be broken.
In the present paper, we demonstrate the modification of the classical kinetic model of hydrogen absorption of ball-milled nanocrystalline Mg/MgH2 by incorporating crystallite size distribution of the as-milled powder agglomerate as well as growth during the isothermal hydrogenation process.
2. Classical Kinetic (Single Particle) Models of Hydrogenation
In order to improve the hydriding performance of different metal hydride systems, including Mg-based nanopowders [52,53,54], it is important to elucidate the underlying kinetic mechanisms [55,56]. Up to date, several kinetic models have been developed and targeted to predict the character of sorption curves based on different rate-controlling mechanisms, hydrogen diffusion coefficients, and shapes of particles [57]. In some cases, the HEBM conditions and parameters, such as milling time, size and number of balls, total powder mass, ball-to-powder mass ratio, and the type of catalyst additive can even change the rate-controlling step [58]. Most of the studies involve the fitting of the normalized reacted fraction (α) in a hydrogenation/dehydrogenation process [58,59,60]. It is assumed that in the conventional isothermal hydrogenation experiment, the shape of α only depends on time (t), the average radius of the absorbing/desorbing powder crystallites (R), and on the type of the mechanism (s) governing the kinetics [52,59]:
In general, there are three basic single particle models describing different mechanisms of hydrogen uptake/release. These kinetics models are a bit oversimplified, i.e., it is assumed that the hydriding particles are uniform spheres; however, several modifications of these models have been developed [58].
2.1. Surface Controlled Model
The rate limiting step of the reaction in the surface controlled process (SC) is the chemisorption, e.g., the dissociation or recombination of hydrogen molecules onto or from the surface of the hydride powder particles [52]. In this case, α depends linearly on time
where k is the reaction constant. Usually, such a mechanism takes place during hydrogen desorption of Mg-based nanopowders, HEBMed, for short times with low catalyst content [57].
2.2. Contracting Volume Model
The contracting volume model (CV) is valid when the nucleation of the hydride phase begins at the surface and growth occurs from the surface into the bulk of the transforming particles. The key assumption of the CV model is that the initial nucleation of the new phase on the surface is significantly faster than the global growth kinetics and the thickness of the nucleation zone is smaller than the particle diameter [61]. When hydrogen diffusion is not rate-limiting, the growth of the hydride phase occurs at a constant interface velocity penetrating from the surface of the powder particles into the bulk interiors. The corresponding kinetics can be described as
where U is the velocity of the hydride–metal interface motion and n is the dimensionality of the growth. Such CV kinetics has been obtained for hydrogen absorption of Mg ball-milled for longer times [57,62].
2.3. Johnson–Mehl–Avrami Model
When the nucleation and growth of the new phase commences randomly in the volume or at the surface of the powder particles, the kinetics can satisfactorily be described by the Johnson–Mehl–Avrami (JMA) model [61,63]. The corresponding equation can be written as
where m is the Avrami-exponent and refers to the dimensionality of the growth process and c is a temperature dependent constant determining the rate of the process. JMA kinetics are usually valid for the desorption of catalyzed MgH2 processed for prolonged HEBM time [54,62,64].
3. Multi-Particle Model of Hydrogenation
Recently, the classical models have been extended in the literature; nevertheless, some modifications are so complex that they cannot offer an explicit analytic expression [51,56,58]. At the same time, the main assumptions did not change significantly, i.e., the governing mechanism can be obtained by fitting the measured sorption curves by different functions [57]. In addition, the sorption reaction rate is often affected by the density of the nucleation sites [53] and therefore strongly influenced by the preparation conditions and the details of microstructure and morphology. It has been proven by different research that SPD during ball-milling of metallic powders often results in a log-normal crystallite size distribution [33,62,65,66,67]:
where σ and m are the variance and median of the lognormal size distribution, respectively. Some selected normalized log-normal functions of typical σ and m values are plotted in Figure 1 according to Equation (5). It is noted that the m has a dimension of length, while σ is dimensionless. It is seen that at fixed median (m = 0.5) the sharpest distribution corresponds to the largest variance (σ = 1.5), describing a homogeneous microstructure (Figure 1a). At the same time, decreasing the median at constant variance (σ = 0.5) corresponds to a sharper distribution, as seen in Figure 1b.
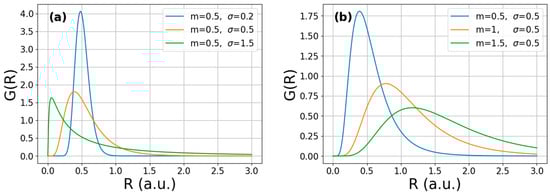
Figure 1.
Calculated log-normal crystallite-size distribution functions corresponding to (a) a fixed m value and different σ values and (b) a fixed σ value and different m values.
As mentioned, none of the classical single-particle models incorporate the non-uniform crystallite-size distribution. In order to overcome these deficiencies, some years ago, we created a total reaction function, also called a multi-particle reacting model, which incorporates the size distribution of the hydrogen absorbing/desorbing nanocrystalline powder agglomerates [68,69]. It was concluded that the shape of the measured reaction fraction curves do not unambiguously determine the type of the hydrogenation/dehydrogenation reaction; in other words, the rate controlling mechanism of nanocrystalline powder agglomerates, since the microstructure has a strong effect on the kinetics as well. For example, if the multi-particle function is taken into account, the first absorption (activation) of nanocrystalline Mg/MgH2 powders can be described by SC kinetics, while the subsequent dehydrogenation and hydrogenation follows JMA and CV reactions, respectively, [69].
In brief, the multi-particle reaction function involves a large number of nanocrystals, each of them having different radius (Ri) and obeying the same hydriding mechanism. The reacted fraction for the ith nanocrystal at time t can be written as
The total reacted volume of the ith crystal, e.g., for a CV reaction, can be expressed as
while the total transformed volume of the powder agglomerate containing N particles at time t can be written as
Now, let the variation in the crystallite size continuous and assume that they follow the distribution described by G(R) (see Equation (5)); then, the normalized multi-particle reaction function of a powder agglomerate at time t can be calculated as [69]
Figure 2 presents the calculated multi-particle reaction curves for a CV reaction on arbitrary time scale obtained for different m and σ parameters, according to Equation (9). For the fixed median value, the reaction completes on a shorter time scale when the variance is smaller, i.e., saturation occurs at t~0.2 arbitrary time for σ = 0.2; however, when larger crystallites are also present in the agglomerate in a significant amount (σ = 1.5), the hydrogenation is completed at only t~0.7 (Figure 2a). As shown in Figure 2b, the saturation of the absorption occurs at shorter times with decreasing median at constant variance (i.e., with decreasing average crystallite size of the same homogeneity).
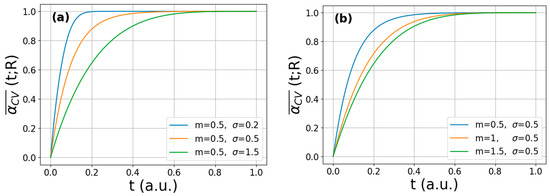
Figure 2.
Calculated multi-particle CV-reaction curves obtained from Equation (9) corresponding to (a) a fixed m value and different σ values and (b) a fixed σ value and different m values.
4. Experimental Section
In total, 1 g of commercial polycrystalline MgH2 powder (90 wt.% MgH2, remainder Mg; Sigma-Aldrich, CAS number: 7693-27-8) was ball-milled in an SPEX 8000 vibratory mill for a total 10 h under Ar atmosphere with a ball-to-powder mass ratio 10:1. The procedure of ball-milling was interrupted after 60 min when the stainless steel container was rotated by 90 deg along its symmetrical axis in order to reduce the stick of the powder particles onto the inner surfaces of the container. Noteworthy ball-milling may not fully represent real-world conditions and up-scaling of powder production is still a technological challenge; however, it is not the goal of the current study.
The hydrogen kinetic measurement of the nanocrystalline MgH2 powder was carried out in a home-made Sieverts’ type equipment [64]. Isothermal dehydrogenation (10 kPa) and hydrogenation (1 MPa) experiments were obtained at 573 K. Partially absorbed states were achieved during the second hydrogenation cycle, when the absorption was interrupted at different hydrogen content, i.e., when 15%, 50%, and 90% of the Mg→MgH2 reaction was completed. Each partially absorbed state was performed on a new amount of milled powder. For each experiment, ~100 mg of powder was applied. It has to be mentioned that the hydrogen absorption process in practical applications may differ from laboratory conditions.
X-ray diffraction (XRD) experiments on the partially absorbed powders were performed on a high-resolution double-crystal powder diffractometer equipped with a fine-focus rotating copper anode (Rigaku Multmax-9) operating at 40 kV and 100 mA. The negligible instrumental broadening provides highly monochromatic Cu Kα radiation. The two-dimensional XRD patterns registered by the imaging plate were integrated after spatial distortion correction. The average crystallite size (D) of MgH2 corresponding to the partially absorbed states has been obtained by the convolutional whole profile fitting algorithm (CMWP) of the patterns. In brief, the CMWP routine incorporates the direct fit of the total measured diffraction profile by the sum of theoretical profile functions, the measured instrumental profile, and a manually adjusted background. The details of the algorithm can be found elsewhere [41,62,70,71].
5. Results and Discussion
Figure 3a presents the measured hydrogen absorption curve of nanocrystalline magnesium during the second uptake. As seen, the kinetics are fast and finish within 800 s, reaching a maximum hydrogen capacity value of about 5.8 wt.%. The phase evolution during hydrogenation can be monitored from the XRD patterns of the partially hydrided states (Figure 3b). The diffractogram of the 15 % desorbed state is mainly characterized by the Bragg-peaks of hexagonal Mg (space group: P63/mmc); however, some traces of tetragonal MgH2 (space group: P42/mnm) are already present. As the H-content increases continuously, the intensity of the MgH2–peaks increases significantly, while the Mg-reflections almost diminish. An example of the fitted diffractogram by the CMWP method together with the difference plot between the measured and fitted patterns is presented in Figure 3c. The evolution of coherently scattering crystalline domains obtained from the CMWP analysis during the Mg→MgH2 reaction can be followed in Figure 3d. As one can notice, D increases practically linearly with the respective hydrogen content, reaching a maximum value of D~20 nm, in accordance with previous findings [62]. The continuously increasing hydride size assumes a mechanism where the hydrogen atoms are bonded to the surface first and then the transformed hydride volume penetrates into the bulk of the Mg crystallites. This kind of hydrogenation transformation can be described by the CV model, see Section 2.2. As a side note, this nanocrystalline structure of Mg/MgH2 is preserved throughout several subsequent hydrogenation/dehydrogenation cycles, which is crucial for potential applications [33].
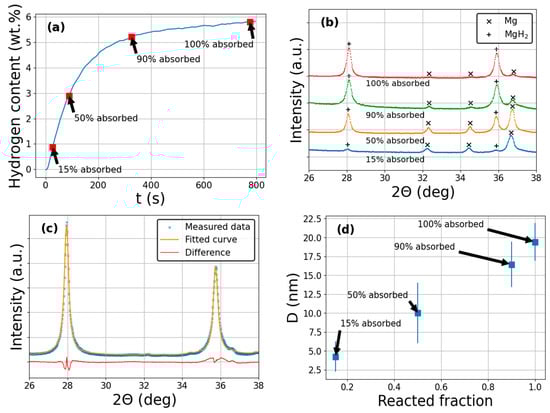
Figure 3.
(a) Hydrogen absorption measurement of ball-milled nanocrystalline Mg. Red squares indicate the partially absorbed states. (b) Series of high-resolution XRD patterns corresponding to different hydrided states of Mg/MgH2. (c) A measured XRD pattern, the fitted CMWP function and difference plot between the measured and fitted data. (d) Variation in average coherent crystallite size of MgH2 during hydrogen absorption as a function of the reacted fraction.
The variation in the crystallite size of the nano-sized powders at constant temperature usually obeys a generalized parabolic law [72]
where D0 is the initial crystallite size, p is the growth exponent, and k is an Arrhenius-type temperature dependent constant. Such behavior has previously been obtained for nanocrystalline magnesium by Zhou et al. [73]. Deducted from Figure 3a,d, Figure 4 presents the variation in the average crystallite size of MgH2 as a function of the normalized time. It is noted that t = 1 in arbitrary units is equals to t = 790 s at which the maximum capacity has been reached. It is evident form Figure 4 that the average size is increasing monotonously not just with the absorbed hydrogen content (Figure 3d) but also with the normalized time. The red line denotes the fit of the measured data points by the parabolic growth law, see Equation (10). The growth rate can be expressed from Equation (10) by differentiating both sides of the equation with respect to t, as follows:
where the growth rate can be obtained from the tangent of the fitted curve. According to Equation (11), the vs. lnD function should follow a linear relationship, as shown in Figure 5a. The slope of the fitted straight line provides the 1 − p.
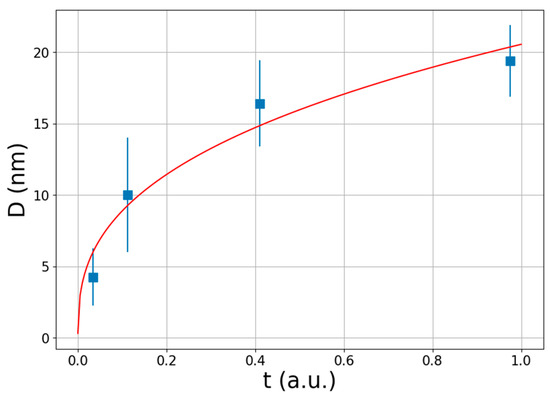
Figure 4.
Variation in average coherent crystallite size of MgH2 during hydrogen absorption as a function of arbitrary time. Red line denotes the fit of the measured data points by the parabolic growth law, see Equation (10).
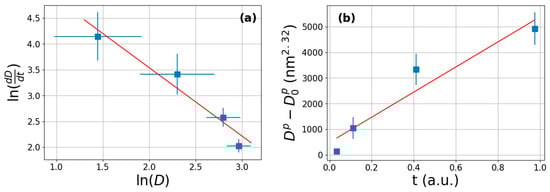
Figure 5.
(a) The logarithm of the growth rate as a function of the logarithm of the average crysttalite size of MgH2. The red straight line is the fit according to Equation (11). (b) Linear relationship between vs. t function.
From the fit, the obtained growth exponent is p = 2.32 and D0 is practically 0. This value is bit lower than that obtained for other nanocrystalline Mg [74]. It is known that the crystallite growth is achieved by boundary motion of the crystallites; however, the present case is more complex, since simple growth is coupled with a continuous Mg→MgH2 transformation, which might cause such discrepancy. According to Equation (10), the vs. the normalized time function should follow a linear relationship, as presented in Figure 5b.
With the available evolution of D(t) during the hydrogenation process, the multi-particle reaction function of a powder agglomerate (see Equation (9)) can further be improved by substituting the R variable by the time dependent R(t) function. Accordingly, the normalized time-dependent multi-particle reaction function can be written as
which simultaneously incorporates the size distribution of the initial powder agglomerate as well as its growth kinetics during the hydrogen absorption process. Such calculated transformation curves are plotted in Figure 6a,b. If one compares these hydriding kinetic curves with the original multi-particle reaction functions (see Figure 2), some remarkable differences can be realized. For example, the powder characterized by m = 0.5 and σ = 1.5 exhibits very fast initial kinetics, reaching the maximum capacity at t = 0.05 arbitrary units of time, when growth is included in the model. Without crystallite growth, this occurs only at t~0.7 (see Figure 2a). The reason of this feature is that this powder is abundant in very small crystallites (Figure 1a), which significantly contribute to the Mg→MgH2 transformation at the early stage of the reaction while the hydride front continuously penetrates into the interior of the Mg particles. In other words, the small Mg crystallites occupying a relatively large volume fraction of the powder agglomerate can transform into pure and growing hydride crystallites very fast in a CV reaction. Another important difference can be obtained between the two models, i.e., for the broader crystallite size distributions, the maximum capacity is not attained even at t = 1 for the time-dependent reaction (see Figure 6). The continuous expansion of the diameter of the partially hydrided crystallites during the hydrogenation reaction slows down of the overall transformation kinetics when compared to a crystallite size independent of time.
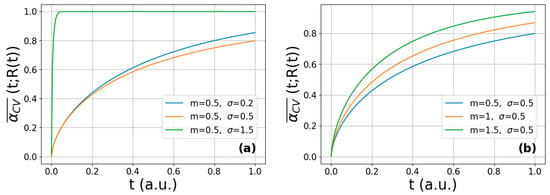
Figure 6.
Calculated time-dependent multi-particle CV-reaction curves obtained from Equation (12) corresponding to (a) a fixed m value and different σ values and (b) a fixed σ value and different m values.
In order to validate the time-dependent multi-particle reaction model, its dependence on the parameters m and σ was investigated. To this end, was calculated according to Equation (12) for 11 × 11 different parameter values ranging from m = 0.5 to 1.5 (step size of 0.1) and σ = 0.5 to 1.5 (step size of 0.1). To determine the optimal parameters to describe the measured hydrogenation curve (see Figure 3a), a 2D map showing the mean squared error between the measured and calculated curves has been constructed. As seen in Figure 7a, the smallest error corresponds to G(R) distributions in the range denoted by a white square. As a second step, another 11 × 11 series of functions were generated in the range of m = 0.9 to 1.0 (step size 0.01) and σ = 0.9 to 1.0 (step size 0.01), see Figure 7b. Accordingly, the optimal choice of parameters was found to be m = 0.99 and σ = 0.93.
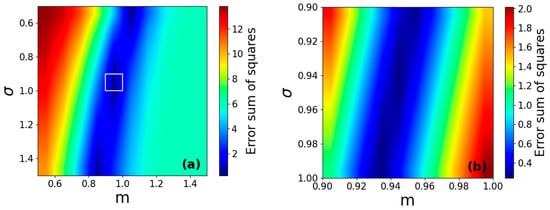
Figure 7.
(a) Two-dimensional parameter map showing the mean squared error between the measured hydrogenation curve and calculated time-dependent multi-particle reaction functions for different values of m and σ. White square denotes the region of the best match. (b) Detailed parameter map in the vicinity of the best match.
Figure 8 presents the measured hydrogen absorption curve of nanocrystalline magnesium together with the different model functions with their respective optimal parameters. It is noted that the figure presents the normalized model functions multiplied by the maximum hydrogen storage capacity (5.8 wt.%). Despite the unsatisfactorily fit by the classical single-particle CV- function (see Equation (2)), the obtained fitting parameters are close to the literature values, i.e., the dimensionality of the growth was found to be n = 3.14, while U/R = 1.3 × 10⁻³ s−1 [68]. As one can realize from the image, the multi-particle reaction model (see Equation (9)) with the optimal parameters (m = 0.24 and σ = 1.16) matches significantly better with the experimental absorption function; however, some deviation takes place from ~150 s of hydrogen absorption. It is unambiguous that a perfect correlation can only be obtained when the time-dependent multi-particle reaction model is applied with the parameters determined from Figure 7. It is noted that the present analysis is only a case study, specifically applied to MgH2, the most studied metal–hydride system in the literature. The adaptation of the model to other metal–hydride systems is unfortunately restricted since the literature lacks the size evolution of the coherent scattering crystalline domains of partially absorbed states during hydrogenation. As was demonstrated by Equation (12) it is crucial, since the time-dependent variation in R(t) is incorporated in the model function. The most detailed study on this issue was published by Yartys and co-workers who applied in situ X-ray diffraction to reveal the phase evolution of different Mg-based systems during hydrogentation–dehydrogation; however, no data are available on the crystallite size during isothermal absorption [75,76]. For more complex systems, such as Mg-TM [77] or complex hydrides [78], hydrogen uptake is usually a multi-step process; therefore, fitting the absorption curve by a single function is not possible.
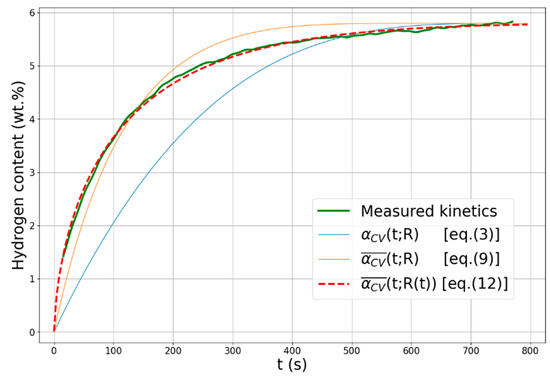
Figure 8.
Measure the kinetic absorption curve of nanocrystalline Mg together with the classical CV function, the multi-particle reaction function , and the time-dependent multi-particle reaction function .
6. Conclusions
In the present investigation, we have shown that classical kinetic models describing the hydrogen absorption of nanocrystalline metallic hydrides are sometimes not sufficient to fit the measured kinetic function; therefore, we have developed a time-dependent multi-particle reaction model . This model simultaneously incorporates the parameters of the lognormal size distribution of the initial powder agglomerate, i.e., the median (m) and variance (σ) as well as its growth kinetics during the hydrogen absorption process. We have shown that the hypothetic powder characterized by m = 0.5 and σ = 1.5 exhibits very fast initial kinetics due to the significant contribution of the abundant small crystallites to the Mg→MgH2 transformation at the early stage of the reaction. To determine the optimal parameters to describe the real experimental hydrogenation curve of HEBM Mg nanopowder, a 2D map presenting the mean squared error between the measured and calculated curves has been constructed. Accordingly, the optimal choice of parameters was found to be m = 0.99 and σ = 0.93. It was shown unambiguously that the measured hydrogen absorption curve shows the best correlation with this model when it is compared to classical kinetic functions or to the previously developed multi-particle reaction function, excluding the growth of the crystallites at the hydrogenation temperature. The time-dependent multi-particle reaction model can only be validated for other systems in the future if the crystallite size of the absorbing material is available for several partially absorbed states.
Author Contributions
CMWP analysis conceptualization, writing, and editing, Á.R. Powder processing, data processing, computing, and numerical analysis, Á.P. All authors have read and agreed to the published version of the manuscript.
Funding
This research received no external funding.
Data Availability Statement
Data available on request.
Conflicts of Interest
The authors declare no conflicts of interest. The funders had no role in the design of the study; in the collection, analyses, or interpretation of data; in the writing of the manuscript; or in the decision to publish the results.
References
- Borgschulte, A. The Hydrogen Grand Challenge. Front. Energy Res. 2016, 4, 11. [Google Scholar] [CrossRef]
- Jackson, R.B.; Friedlingstein, P. Persistent fossil fuel growth threatens the Paris Agreement and planetary health. Environ. Res. Lett. 2019, 14, 12001. [Google Scholar] [CrossRef]
- Rönnebro, E.C.E.; Majzoub, E.H. Recent advances in metal hydrides for clean energy applications. MRS Bull. 2013, 38, 452–458. [Google Scholar] [CrossRef]
- Abdalla, A.M.; Hossain, S.; Nisfindy, O.B.; Azad, A.T.; Dawood, M.; Azad, A.K. Hydrogen Production, Storage, Transportation and Key Challenges with Applications: A Review. Energy Convers. Manag. 2018, 165, 602–627. [Google Scholar] [CrossRef]
- Hirscher, M.; Yartys, V.A.; Baricco, M.; Bellosta von Colbe, J.; Blanchard, D.; Bowman, R.C.; Broom, D.P.; Buckley, C.E.; Chang, F.; Chen, P.; et al. Materials for hydrogen-based energy storage—Past, recent progress and future outlook. J. Alloys Compd. 2020, 827, 153548. [Google Scholar] [CrossRef]
- Yang, J.; Sudik, A.; Wolverton, C.; Siegel, D.J. High capacity hydrogenstorage materials: Attributes for automotive applications and techniques for materials discovery. Chem. Soc. Rev. 2010, 39, 656–675. [Google Scholar] [CrossRef] [PubMed]
- Schlabach, L.; Zuttel, A. Hydrogen-Storage Materials for Mobile Applications. Nature 2001, 414, 353–358. [Google Scholar] [CrossRef] [PubMed]
- Aguey-Zinsou, K.-F.; Ares-Fernández, J.-R. Hydrogen in Magnesium: New Perspectives toward Functional Stores. Energy Environ. Sci. 2010, 3, 526–543. [Google Scholar] [CrossRef]
- von Colbe, J.B.; Ares, J.-R.; Barale, J.; Baricco, M.; Buckley, C.; Capurso, G.; Gallandat, N.; Grant, D.M.; Guzik, M.N.; Jacob, I.; et al. Application of hydrides in hydrogen storage and compression: Achievements, outlook and perspectives. Int. J. Hydrogen Energy 2019, 44, 7780–7808. [Google Scholar] [CrossRef]
- Lin, H.-J.; Lu, Y.-S.; Zhang, L.-T.; Liu, H.-Z.; Edalati, K.; Révész, Á. Recent Advances in Metastable Alloys for Hydrogen Storage: A Review. Rare Met. 2022, 41, 1797–1817. [Google Scholar] [CrossRef]
- Drawer, C.; Lange, J.; Kaltschmitt, M. Metal Hydrides for Hydrogen Storage—Identification and Evaluation of Stationary and Transportation Applications. J. Energy Storage 2024, 77, 109988. [Google Scholar] [CrossRef]
- Klopčič, N.; Grimmer, I.; Winkler, F.; Sartory, M.; Trattner, A. A review on metal hydride materials for hydrogen storage. J. Energy Storage 2023, 72, 108456. [Google Scholar] [CrossRef]
- Huot, J.; Cuevas, F.; Deledda, S.; Edalati, K.; Filinchuk, Y.; Grosdider, T.; Hauback, B.C.; Heere, M.; Jensen, T.R.; Latroche, M.; et al. Mechanochemistry of Metal Hydrides: Recent Advances. Materials 2019, 12, 2778. [Google Scholar] [CrossRef]
- Liu, Y.; Chabane, D.; Elkedim, O. Intermetallic Compounds Synthesized by Mechanical Alloying for Solid-State Hydrogen Storage: A Review. Energies 2021, 14, 5758. [Google Scholar] [CrossRef]
- Yartys, V.A.; Lototskyy, M.V.; Akiba, E.; Albert, R.; Antonov, V.E.; Ares, J.R.; Baricco, M.; Bourgeois, N.; Buckley, C.E.; Bellosta von Colbe, J.M.; et al. Magnesium based materials for hydrogen based energy storage: Past, present and future. Int. J. Hydrogen Energy 2019, 44, 7809–7859. [Google Scholar] [CrossRef]
- Li, Q.; Peng, X.; Pan, F. Magnesium-Based Materials for Energy Conversion and Storage. J. Magnes. Alloys 2021, 9, 2223–2224. [Google Scholar] [CrossRef]
- Gupta, A.; Faisal, M. Magnesium Based Multi-Metallic Hybrids with Soot for Hydrogen Storage. Int. J. Hydrogen Energy 2024, 53, 93–104. [Google Scholar] [CrossRef]
- Song, J.; She, J.; Chen, D.; Pan, F. Latest Research Advances on Magnesium and Magnesium Alloys Worldwide. J. Magnes. Alloys 2020, 8, 1–41. [Google Scholar] [CrossRef]
- Ouyang, L.; Liu, F.; Wang, H.; Liu, J.; Yang, X.S.; Sun, L.; Zhu, M. Magnesium-based hydrogen storage compounds: A review. J. Alloys Compd. 2020, 832, 154865. [Google Scholar] [CrossRef]
- Li, Z.-Y.; Sun, Y.-J.; Zhang, C.-C.; Wei, S.; Zhao, L.; Zeng, J.-L.; Cao, Z.; Zou, Y.-J.; Chu, H.-L.; Xu, F.; et al. Optimizing hydrogen ad/desorption of Mg-based hydrides for energy-storage applications. Mater Sci. Technol. 2023, 141, 221–235. [Google Scholar] [CrossRef]
- Zhu, M.; Lu, Y.; Ouyang, L.; Wang, H. Thermodynamic Tuning of Mg-Based Hydrogen Storage Alloys: A Review. Materials 2013, 6, 4654–4674. [Google Scholar] [CrossRef] [PubMed]
- Pasquini, L. The Effects of Nanostructure on the Hydrogen Sorption Properties of Magnesium-Based Metallic Compounds: A Review. Crystals 2018, 8, 106. [Google Scholar] [CrossRef]
- Yang, Y.; Zhang, X.; Zhang, L.; Zhang, W.; Liu, H.; Huang, Z.; Yang, L.; Gu, C.; Sun, W.; Gao, M.; et al. Recent Advances in Catalyst-Modified Mg-Based Hydrogen Storage Materials. J. Mater. Sci. Technol. 2023, 163, 182–211. [Google Scholar] [CrossRef]
- Révész, Á.; Gajdics, M. Improved H-Storage Performance of Novel Mg-Based Nanocomposites Prepared by High-Energy Ball Milling: A Review. Energies 2021, 14, 6400. [Google Scholar] [CrossRef]
- Edalati, K.; Akiba, E.; Botta, W.J.; Estrin, Y.; Floriano, R.; Fruchart, D.; Grosdidier, T.; Horita, Z.; Huot, J.; Li, H.W.; et al. Impact of Severe Plastic Deformation on Kinetics and Thermodynamics of Hydrogen Storage in Magnesium and Its Alloys. J. Mater. Sci. Technol. 2023, 146, 221–239. [Google Scholar] [CrossRef]
- Lyu, J.; Lider, A.; Kudiiarov, V. Using Ball Milling for Modification of the Hydrogenation/Dehydrogenation Process in Magnesium-Based Hydrogen Storage Materials: An Overview. Metals 2019, 9, 768. [Google Scholar] [CrossRef]
- Suryanarayana, C. Mechanical alloying and milling. Prog. Mater. Sci. 2001, 46, 1–184. [Google Scholar] [CrossRef]
- Edalati, K.; Bachmaier, A.; Beloshenko, V.A.; Beygelzimer, Y.; Blank, V.D.; Botta, W.J.; Bryła, K.; Čížek, J.; Divinski, S.; Enikeev, N.A.; et al. Nanomaterials by Severe Plastic Deformation: Review of Historical Developments and Recent Advances. Mater. Res. Lett. 2022, 10, 163–256. [Google Scholar] [CrossRef]
- Sadhasivam, T.; Kim, H.-T.; Jung, S.; Roh, S.-H.; Park, J.-H.; Jung, H.-Y. Dimensional effects of nanostructured Mg/MgH2 for hydrogen storage applications. Renew. Sustain. Energy Rev. 2017, 72, 523–534. [Google Scholar] [CrossRef]
- Bennett, C.M.J.; Patman, A.J.; Milanese, C.; Eastwick, C.N.; Walker, G.S. Effect of powder characteristics for a magnesium based metal hydride store. Int. J. Hydrogen Energy 2014, 39, 19646–19655. [Google Scholar] [CrossRef]
- Varin, R.A.; Czujko, T.; Wronski, Z. Particle size, grain size and γ-MgH2 effects on the desorption properties of nanocrystalline commercial magnesium hydride processed by controlled mechanical milling. Nanotechnology 2006, 17, 3856–3865. [Google Scholar] [CrossRef]
- Fátay, D.; Révész, Á.; Spassov, T. Particle size and catalytic effect on the dehydriding of MgH2. J. Alloys Compd. 2005, 399, 237–241. [Google Scholar] [CrossRef]
- Fátay, D.; Spassov, T.; Delchev, P.; Ribárik, G.; Révész, Á. Microstructural development in nanocrystalline MgH2 during H-absorption/desorption cycling. Int. J. Hydrogen Energy 2007, 32, 2914–2919. [Google Scholar] [CrossRef]
- Novakovic, J.G.; Novakovic, N.; Kurko, S.; Govedarovic, S.M.; Pantic, T.; Mamula, B.P.; Batalovic, K.; Radakovic, J.; Rmus, J.; Shelyapina, M.; et al. Influence of defects on the stability and hydrogen-sorption behavior of Mg-based hydrides. Chem. Phys. Chem. 2019, 20, 1216–1247. [Google Scholar] [CrossRef] [PubMed]
- Révész, Á.; Kánya, Z.; Verebélyi, T.; Szabó, P.J.; Zhilyaev, A.P.; Sapssov, T. The effect of high-pressure torsion on the microstructure and hydrogen absorption kinetics of ball-milled Mg70Ni30. J. Alloys Compd. 2010, 504, 83–88. [Google Scholar] [CrossRef]
- Khan, D.; Zou, J.; Zeng, X.; Ding, W. Hydrogen storage properties of nanocrystalline Mg2Ni prepared from compressed 2MgH2–Ni powder. Int. J. Hydrogen Energy 2018, 43, 22391–22400. [Google Scholar] [CrossRef]
- Révész, Á.; Gajdics, M.; Spassov, T. Microstructural evolution of ball-milled Mg–Ni powder during hydrogen sorption. Int. J. Hydrogen Energy 2013, 38, 8342–8349. [Google Scholar] [CrossRef]
- Varin, R.A.; Czujko, T.; Wasmund, E.B.; Wronski, Z.S. Catalytic effects of various forms of nickel on the synthesis rate and hydrogen desorption properties of nanocrystalline magnesium hydride (MgH2) synthesized by controlled reactive mechanical milling (CRMM). J. Alloys Compd. 2007, 432, 217–231. [Google Scholar] [CrossRef]
- Antiqueira, F.J.; Leiva, D.R.; Zepon, G.; de Cunha, B.F.R.F.; Figueroa, S.J.A.; Botta, W.J. Fast Hydrogen Absorption/Desorption Kinetics in Reactive Milled Mg-8 Mol% Fe Nanocomposites. Int. J. Hydrogen Energy 2020, 45, 12408–12418. [Google Scholar] [CrossRef]
- Song, M.; Zhang, L.; Yao, Z.; Zheng, J.; Shang, D.; Chen, L.; Li, H. Unraveling the Degradation Mechanism in Hydrogen Storage Property of Fe Nanocatalysts Modified MgH2. Inorg. Chem. Front. 2022, 9, 3874–3884. [Google Scholar] [CrossRef]
- Paramonov, R.; Spassov, T.; Nagy, P.; Révész, Á. Synergetic Effect of FeTi in Enhancing the Hydrogen-Storage Kinetics of Nanocrystalline MgH2. Energies 2024, 17, 794. [Google Scholar] [CrossRef]
- Barkhordarian, G.; Klassen, T.; Bormann, R. Fast hydrogen sorption kinetics of nanocrystalline Mg using Nb2O5 as catalyst. Scr. Mater. 2003, 49, 213–217. [Google Scholar] [CrossRef]
- Croston, D.L.; Grant, D.M.; Walker, G.S. The catalytic effect of titanium oxide based additives on the dehydrogenation and hydrogenation of milled MgH2. J. Alloys Compd. 2010, 492, 251–258. [Google Scholar] [CrossRef]
- Song, M.Y.; Kwon, I.H.; Kwon, S.N.; Park, C.G.; Park, H.R.; Bae, J.-S. Preparation of hydrogen-storage alloy Mg–10wt% Fe2O3 under various milling conditions. Int. J. Hydrogen Energy 2006, 31, 43–47. [Google Scholar] [CrossRef]
- Yun, H.; Wang, H.; Bai, J.; Wang, X.; Dai, X.; Hou, X.; Xu, Y. Activation and Hydrogen Storage Properties of Mg-Based Composites Synthesized by Catalytic Mechanochemical Hydrogenation Strategy. Int. J. Hydrogen Energy 2024, 50, 1025–1039. [Google Scholar] [CrossRef]
- Campos, R.B.V.; Camargo, S.A.S., Jr.; Brum, M.C.; Dos Santos, D.S. Hydrogen uptake enhancement by the use of a magnesium hydride and carbon nanotubes mixture. Mater. Res. 2017, 20, 85–88. [Google Scholar] [CrossRef]
- Chen, J.; Kuo, C.-H.; Ku, J.-R.; Yan, P.-S.; Huang, C.-J.; Jeng, M.-S.; Tsau, F.-H. Highly improved with hydrogen storage capacity and fast kinetics in Mg-based nanocomposites by CNTs. J. Alloys Compd. 2013, 568, 78–83. [Google Scholar] [CrossRef]
- Gajdics, M.; Spassov, T.; Kis, V.K.; Schafler, E.; Révész, Á. Microstructural and Morphological Investigations on Mg-Nb2O5-CNT Nanocomposites Processed by High-Pressure Torsion for Hydrogen Storage Applications. Int. J. Hydrogen Energy 2020, 45, 7917–7928. [Google Scholar] [CrossRef]
- Crivello, J.-C.; Dam, B.; Denys, R.V.; Dornheim, M.; Grant, D.M.; Huot, J.; Jensen, T.R.; de Jongh, P.; Latroche, M.; Milanese, C.; et al. Review of Magnesium Hydride-Based Materials: Development and Optimisation. Appl. Phys. A 2016, 122, 97. [Google Scholar] [CrossRef]
- Pang, Y.; Li, Q. A review on kinetic models and corresponding analysis methods for hydrogen storage materials. Int. J. Hydrogen Energy 2016, 41, 18072–18087. [Google Scholar] [CrossRef]
- Shang, Y.; Pistidda, C.; Gizer, G.; Klassen, T.; Dornheim, M. Mg-based materials for hydrogen storage. J. Magnes. Alloys 2021, 9, 1837–1860. [Google Scholar] [CrossRef]
- Mintz, M.H.; Zeiri, Y. Hydriding kinetics of powders. J. Alloys Compd. 1995, 216, 159–175. [Google Scholar] [CrossRef]
- Asakuma, Y.; Miyauchi, S.; Yamamoto, T.; Aoki, H.; Miura, T. Numerical analysis of absorbing and desorbing mechanism for the metal hydride by homogenization method. Int. J. Hydrogen Energy 2003, 28, 529. [Google Scholar] [CrossRef]
- Chou, K.C.; Li, Q.; Lin, Q.; Jiang, L.J.; Xu, K.D. Kinetics of absorption and desorption of hydrogen in alloy powder. Int. J. Hydrogen Energy 2005, 30, 301. [Google Scholar] [CrossRef]
- Luo, Q.; Li, J.; Li, B.; Liu, B.; Shao, H.; Li, Q. Kinetics in Mg-based hydrogen storage materials: Enhancement and mechanism. J. Magnes. Alloys 2019, 7, 58–71. [Google Scholar] [CrossRef]
- Evard, E.; Gabis, I.; Yartys, V.A. Kinetics of hydrogen evolution from MgH2: Experimental studies, mechanism and modelling. Int. J. Hydrogen Energy 2010, 35, 9060–9069. [Google Scholar] [CrossRef]
- Barkhordarian, G.; Klassen, T.; Borman, R. Kinetic investigation of the effect of milling time on the hydrogen sorption reaction of magnesium catalysed with different Nb2O5 contents. J. Alloys Compd. 2006, 407, 249–255. [Google Scholar] [CrossRef]
- Liu, J.; Zhang, X.; Li, Q.; Chou, K.C.; Xu, K.D. Investigation on kinetics mechanism of hydrogen absorption in the La2Mg17-based composites. Int. J. Hydrogen Energy 2009, 34, 1951–1957. [Google Scholar] [CrossRef]
- Schweppe, F.; Martin, M.; Fromm, E. Model on hydride formation describing surface control, diffusion control and transition regions. J. Alloys Compd. 1997, 261, 254–258. [Google Scholar] [CrossRef]
- Gabis, I.E.; Voit, A.P.; Evard, E.A.; Zaika, Y.V.; Chernov, I.A.; Yartys, V.A. Kinetics of hydrogen desorption from the powders of metal hydrides. J. Alloys Compd. 2005, 404–406, 312–316. [Google Scholar] [CrossRef]
- Jacobs, P.W.M.; Tompkins, F.C. Classification and Theory of Solid Reactions. In Chemistry of the Solid State; Garner, W.E., Ed.; Butterworth: London, UK, 1955; pp. 184–212. [Google Scholar]
- Révész, Á.; Fátay, D. Microstructural evolution of ball-milled MgH2 during a complete dehydrogenation–hydrogenation cycle. J. Power Sources 2010, 195, 6997–7002. [Google Scholar] [CrossRef]
- Avrami, M. Kinetics of phase change II. J. Chem. Phys. 1940, 8, 212–224. [Google Scholar]
- Révész, Á.; Paramonov, R.; Spassov, T.; Gajdics, M. Microstructure and Hydrogen Storage Performance of Ball-Milled MgH2 Catalyzed by FeTi. Energies 2023, 16, 1061. [Google Scholar] [CrossRef]
- Krill, C.E.; Birringer, R. Estimating grain-size distributions in nanocrystalline materials from X-ray diffraction profile analysis. Phil. Mag. 1998, 77, 621–640. [Google Scholar] [CrossRef]
- Gubicza, J.; Szépvölgyi, J.; Mohai, I.; Zsoldos, L.; Ungár, T. Particle size distribution and dislocation density determined by high resolution X-ray diffraction in nanocrystalline silicon nitride powders. Mater. Sci. Eng. 2000, 280, 263–269. [Google Scholar] [CrossRef]
- Révész, Á.; Gajdics, M.; Varga, L.K.; Krállics, G.; Péter, L.; Spassov, T. Hydrogen Storage of Nanocrystalline Mg–Ni Alloy Processed by Equal-Channel Angular Pressing and Cold Rolling. Int. J. Hydrogen Energy 2014, 39, 9911–9917. [Google Scholar] [CrossRef]
- Révész, Á. Multiparticle Reaction Function of Ball-Milled MgH2 Powders. Jpn. J. Appl. Phys. 2009, 48, 076511. [Google Scholar] [CrossRef]
- Révész, Á.; Fátay, D.; Spassov, T. Hydriding kinetics of ball-milled nanocrystalline MgH2 powders. J. Mater. Res. 2007, 22, 3144–3151. [Google Scholar] [CrossRef]
- Ribárik, G.; Jóni, B.; Ungár, T. Global optimum of microstructure parameters in the CMWP line-profile-analysis method by combining Marquardt-Levenberg and Monte-Carlo procedures. J. Mater. Sci. Technol. 2019, 35, 1508–1514. [Google Scholar] [CrossRef]
- Ribárik, G.; Gubicza, J.; Ungár, T. Correlation between strength and microstructure of ball-milled Al–Mg alloys determined by X-ray diffraction. Mater. Sci. Eng. A 2004, 387, 343–347. [Google Scholar] [CrossRef]
- Atkinson, H.V. Overview no. 65: Theories of normal grain growth in pure single phase systems. Acta Metall. 1988, 3, 469–491. [Google Scholar] [CrossRef]
- Zhou, C.; Peng, Y.; Zhang, Q. Growth kinetics of MgH2 nanocrystallites prepared by ball milling. J. Mater. Sci. Technol. 2020, 50, 178–183. [Google Scholar] [CrossRef]
- Zhou, C.Q.; Zhang, Q.A. Effect of Pr3Al11 nanoparticles on crystallite growth kinetics of nanocrystalline Mg. J. Alloys Compd. 2019, 804, 299–304. [Google Scholar] [CrossRef]
- Denys, R.V.; Riabov, A.B.; Maehlen, J.P.; Lotosky, M.V.; Solberg, J.K.; Yartis, V.A. In Situ synchrotron X-ray diffraction studies of hydrogen desorption and absorption properties of Mg and Mg–Mm–Ni after reactive ball milling in hydrogen. Acta Mater. 2009, 13, 3989–4000. [Google Scholar] [CrossRef]
- Denys, R.V.; Poletaev, A.A.; Maehlen, J.P.; Solberg, J.K.; Tarasov, B.P.; Yartis, V.A. Nanostructured rapidly solidified LaMg11Ni alloy. II. In Situ synchrotron X-ray diffraction studies of hydrogen absorption–desorption behaviours. Int. J. Hydrogen Energy 2012, 7, 5710–5722. [Google Scholar] [CrossRef]
- Gajdics, M.; Calizzi, M.; Pasquini, L.; Schafler, E.; Révész, Á. Characterization of a nanocrystalline Mg–Ni alloy processed by high-pressure torsion during hydrogenation and dehydrogenation. Int. J. Hydrogen Energy 2016, 23, 9803–9809. [Google Scholar] [CrossRef]
- Ahmad, M.A.N.; Sazelee, N.; Ali, N.A.; Ismail, M. An Overview of the Recent Advances of Additive-Improved Mg(BH4)2 for Solid-State Hydrogen Storage Material. Energies 2022, 15, 862. [Google Scholar] [CrossRef]
Disclaimer/Publisher’s Note: The statements, opinions and data contained in all publications are solely those of the individual author(s) and contributor(s) and not of MDPI and/or the editor(s). MDPI and/or the editor(s) disclaim responsibility for any injury to people or property resulting from any ideas, methods, instructions or products referred to in the content. |
© 2024 by the authors. Licensee MDPI, Basel, Switzerland. This article is an open access article distributed under the terms and conditions of the Creative Commons Attribution (CC BY) license (https://creativecommons.org/licenses/by/4.0/).