Reservoir Simulations of Hydrogen Generation from Natural Gas with CO2 EOR: A Case Study
Abstract
1. Introduction
2. Static and Dynamic Models of the Reservoir
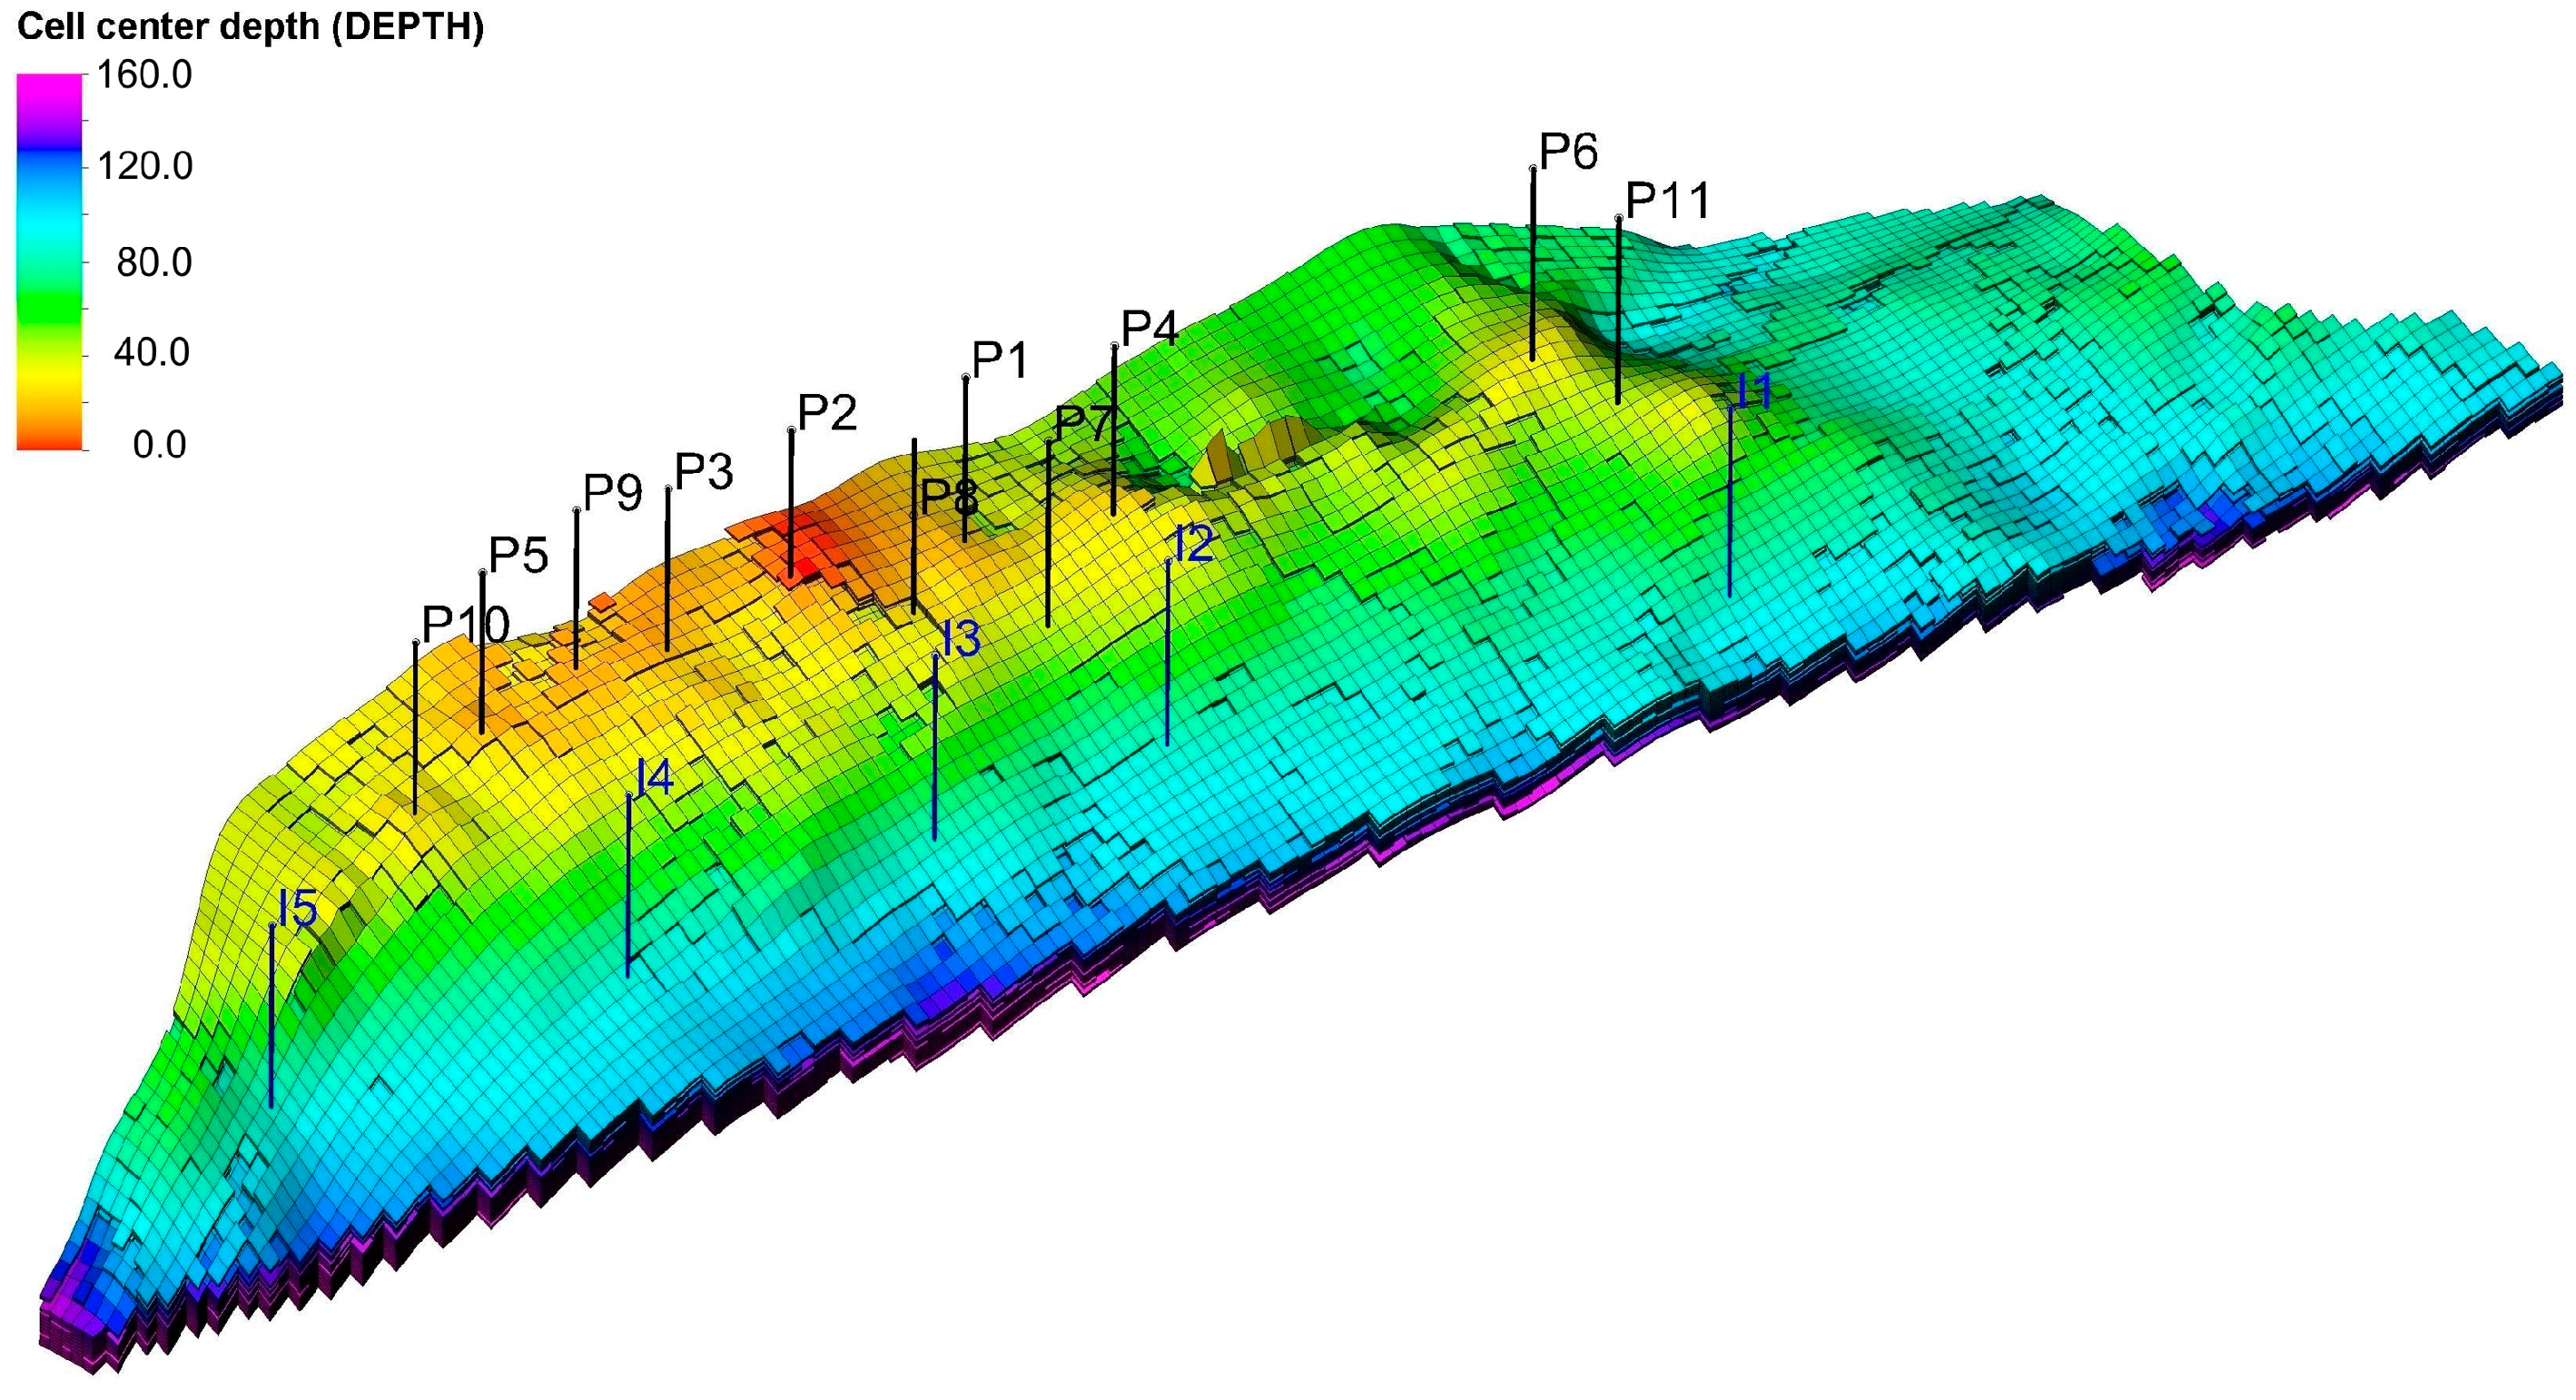
2.1. Static Model of the Reservoir
2.2. PVT Model of Hydrocarbon Formation Fluid
2.3. PVT Properties of Hydrocarbons
2.4. PVT Properties of Formation Water
- Water formation volume factor, Bw = 1.0092 m3/Nm3;
- Isothermal compressibility, cw = 5 10−4 1/bar;
- Viscosity, μw = 0.47 cP;
- Coefficient of viscosity change with pressure, .
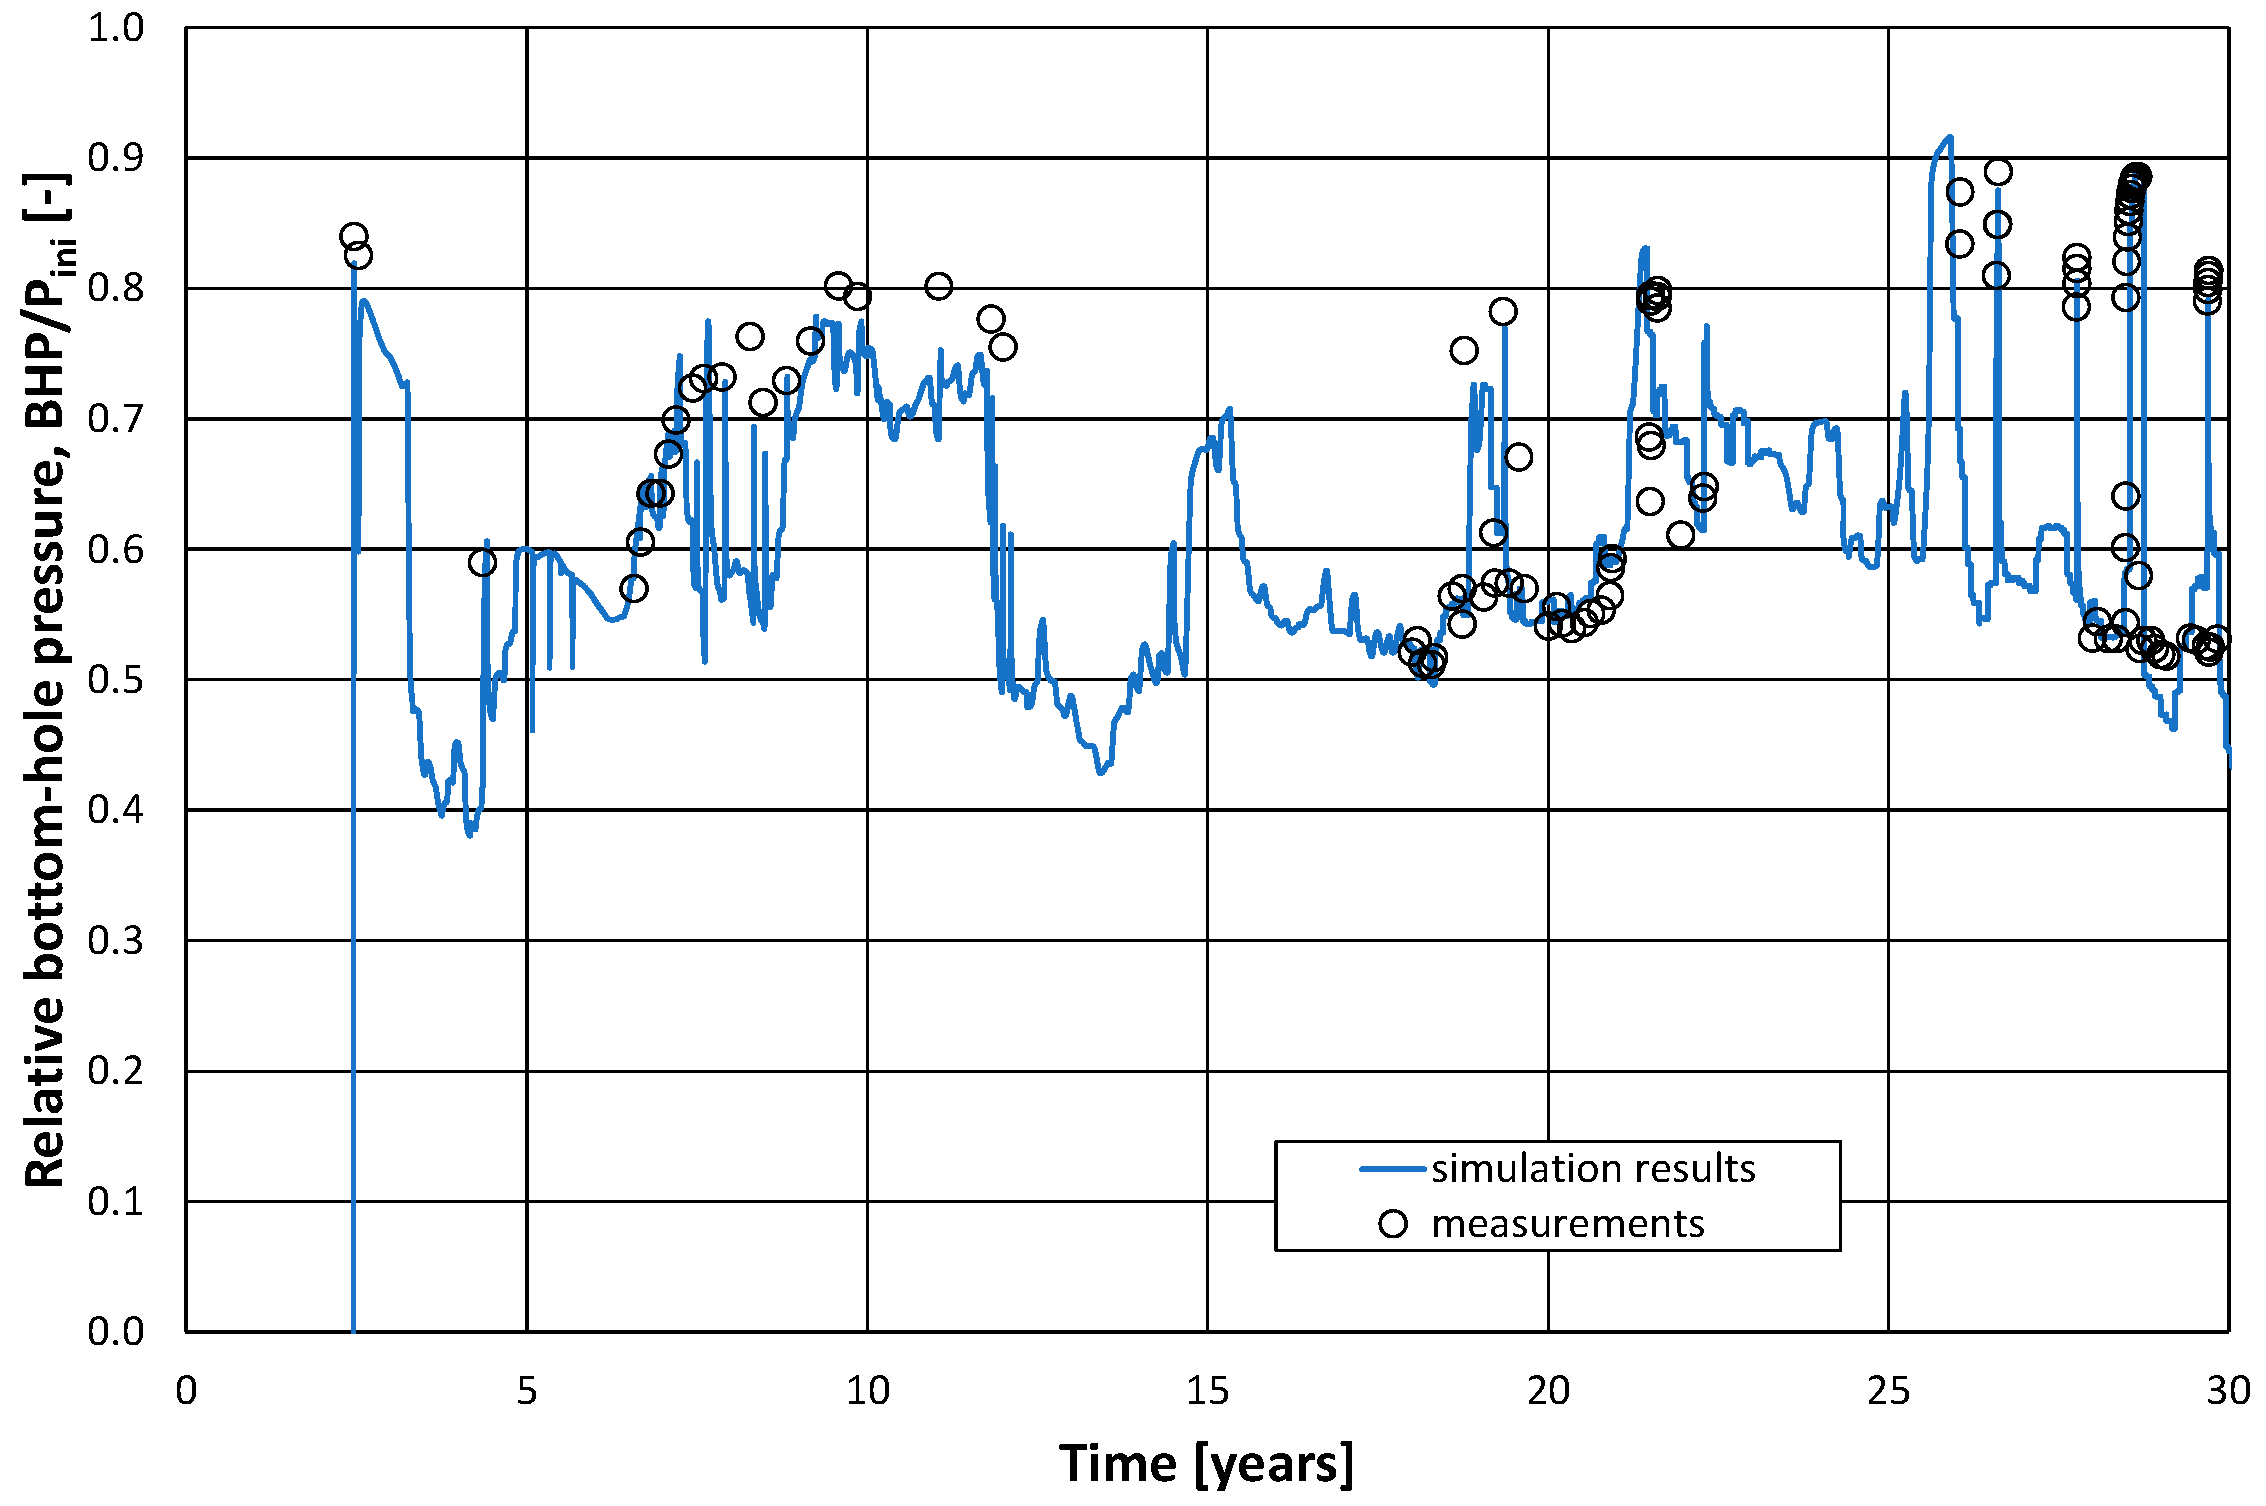
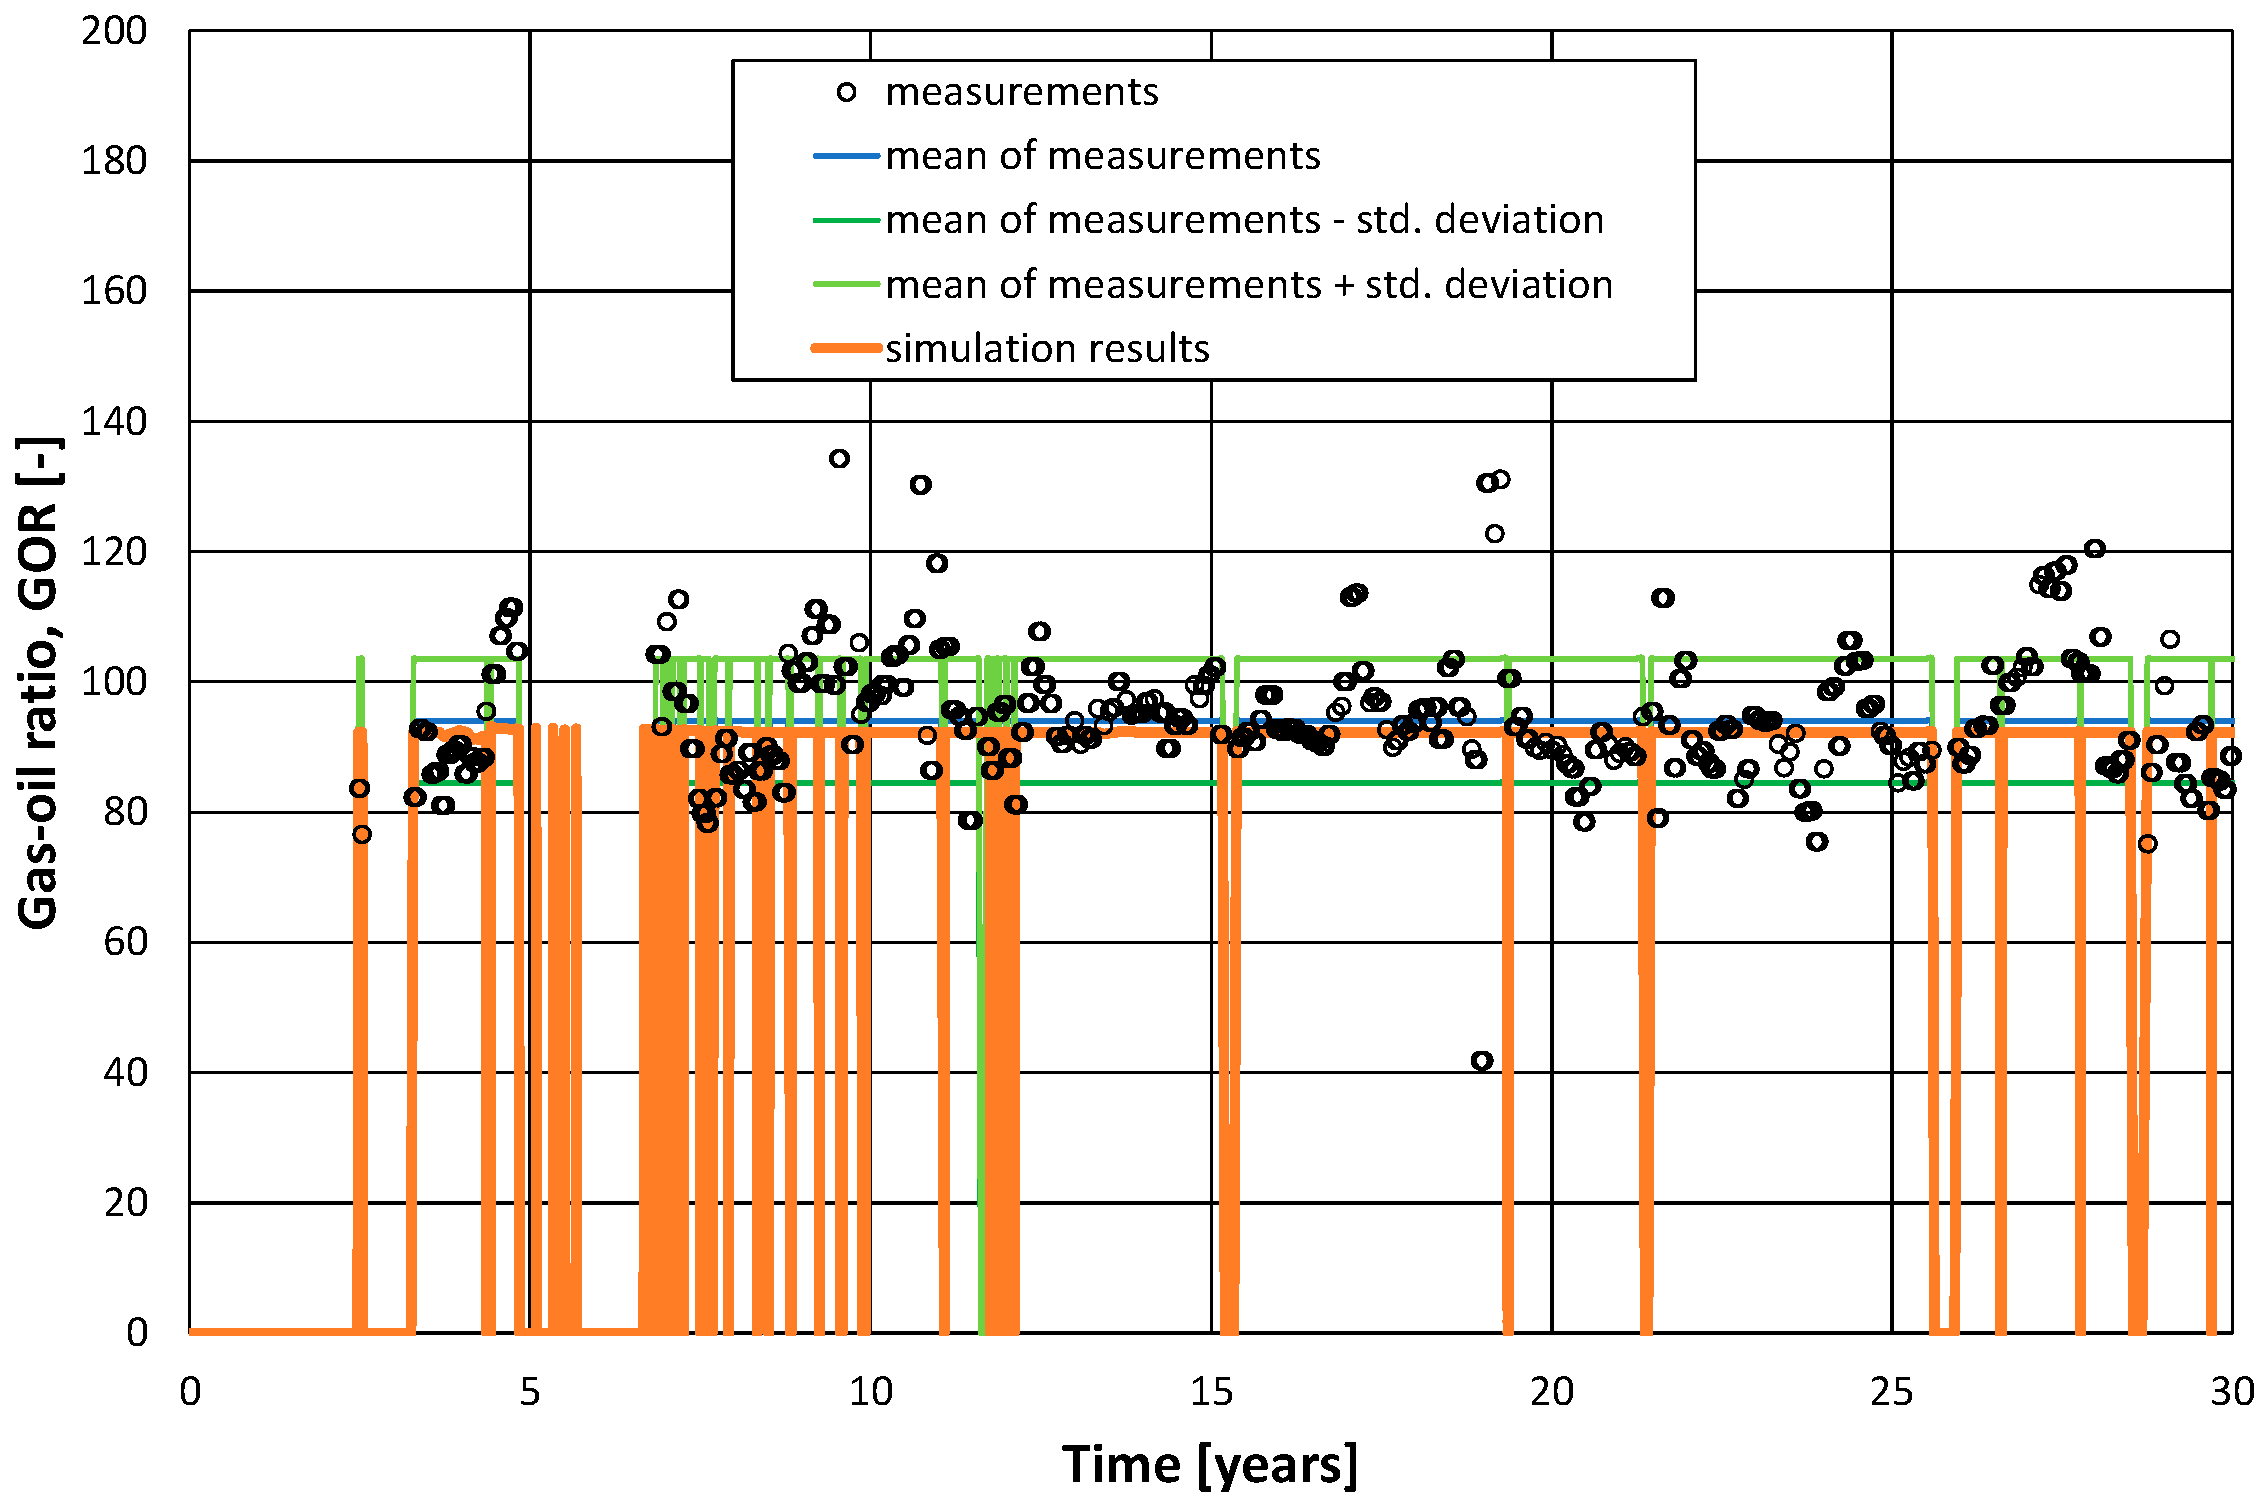
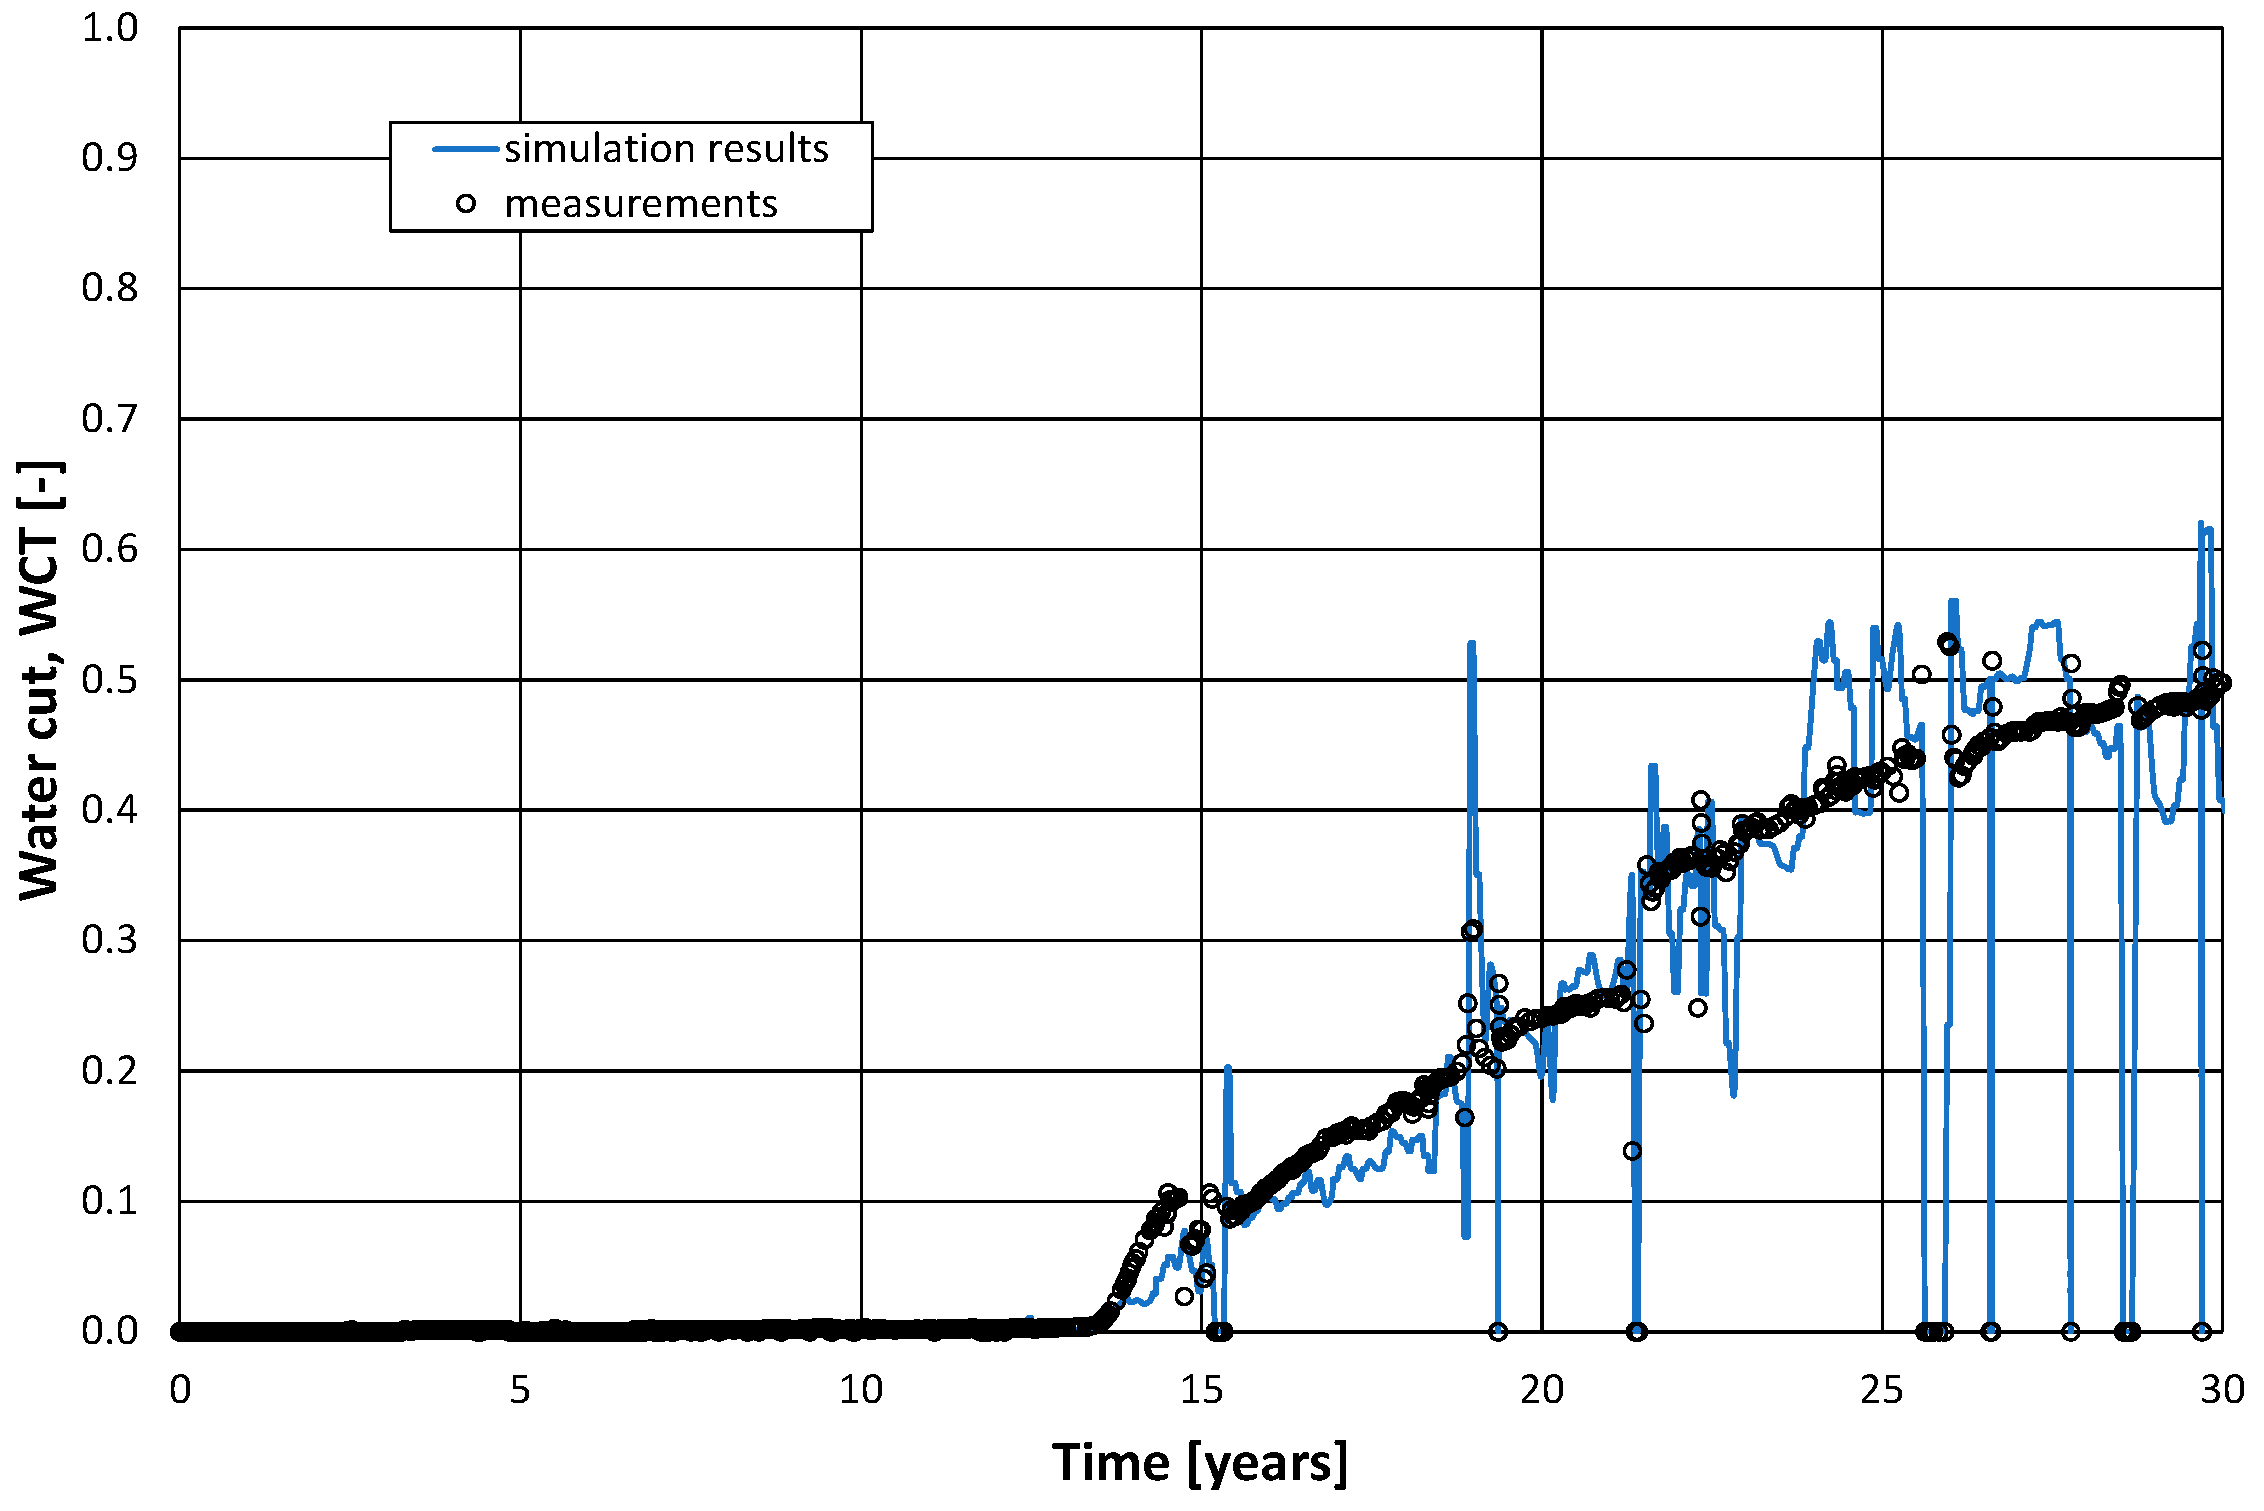
2.5. History Matching
3. Simulation Forecasts of the EOR Process with CO2 Injection
3.1. General Assumptions
- –
- Initial oil production rate: qo,prod,0 = 600 Nm3/d;
- –
- Composition of the injected gas: cCO2inj = 100%;
- –
- Water injection rate in terms reservoir volume: qvw,inj = qv,prod − qvCO2,inj [Rm3/d];
- –
- Minimum water injection rate: qw,inj,min = qw,prod [Sm3/d];
- –
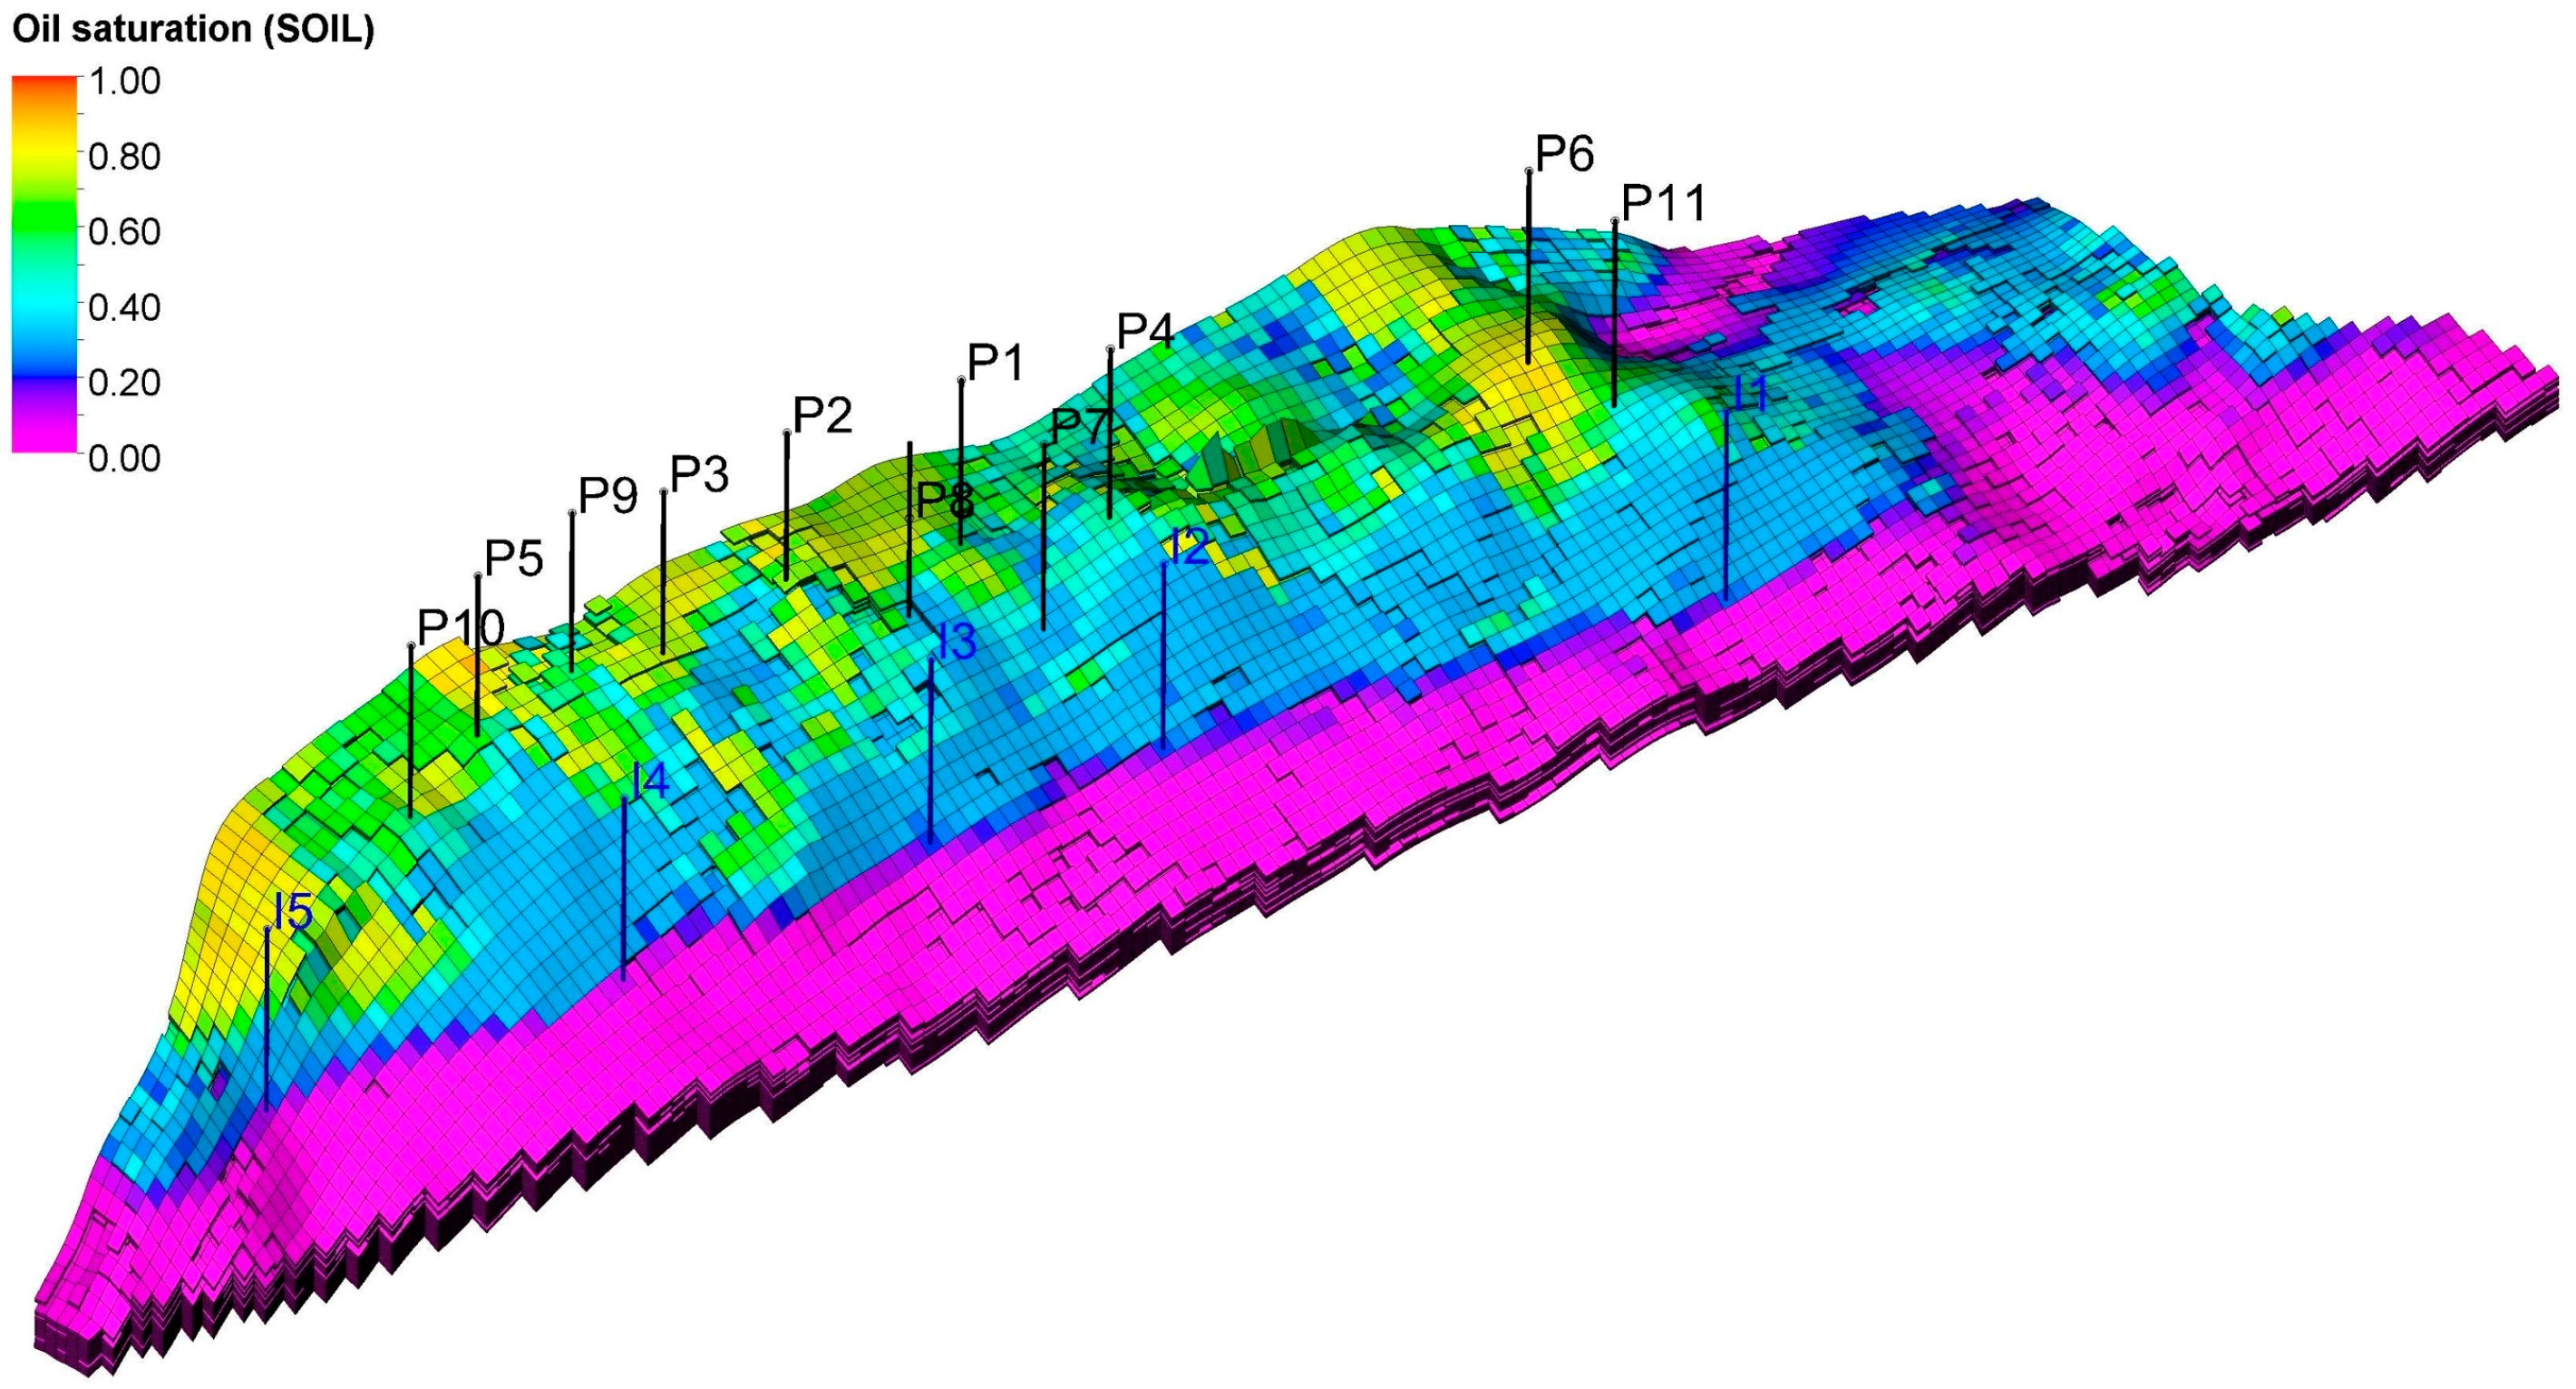
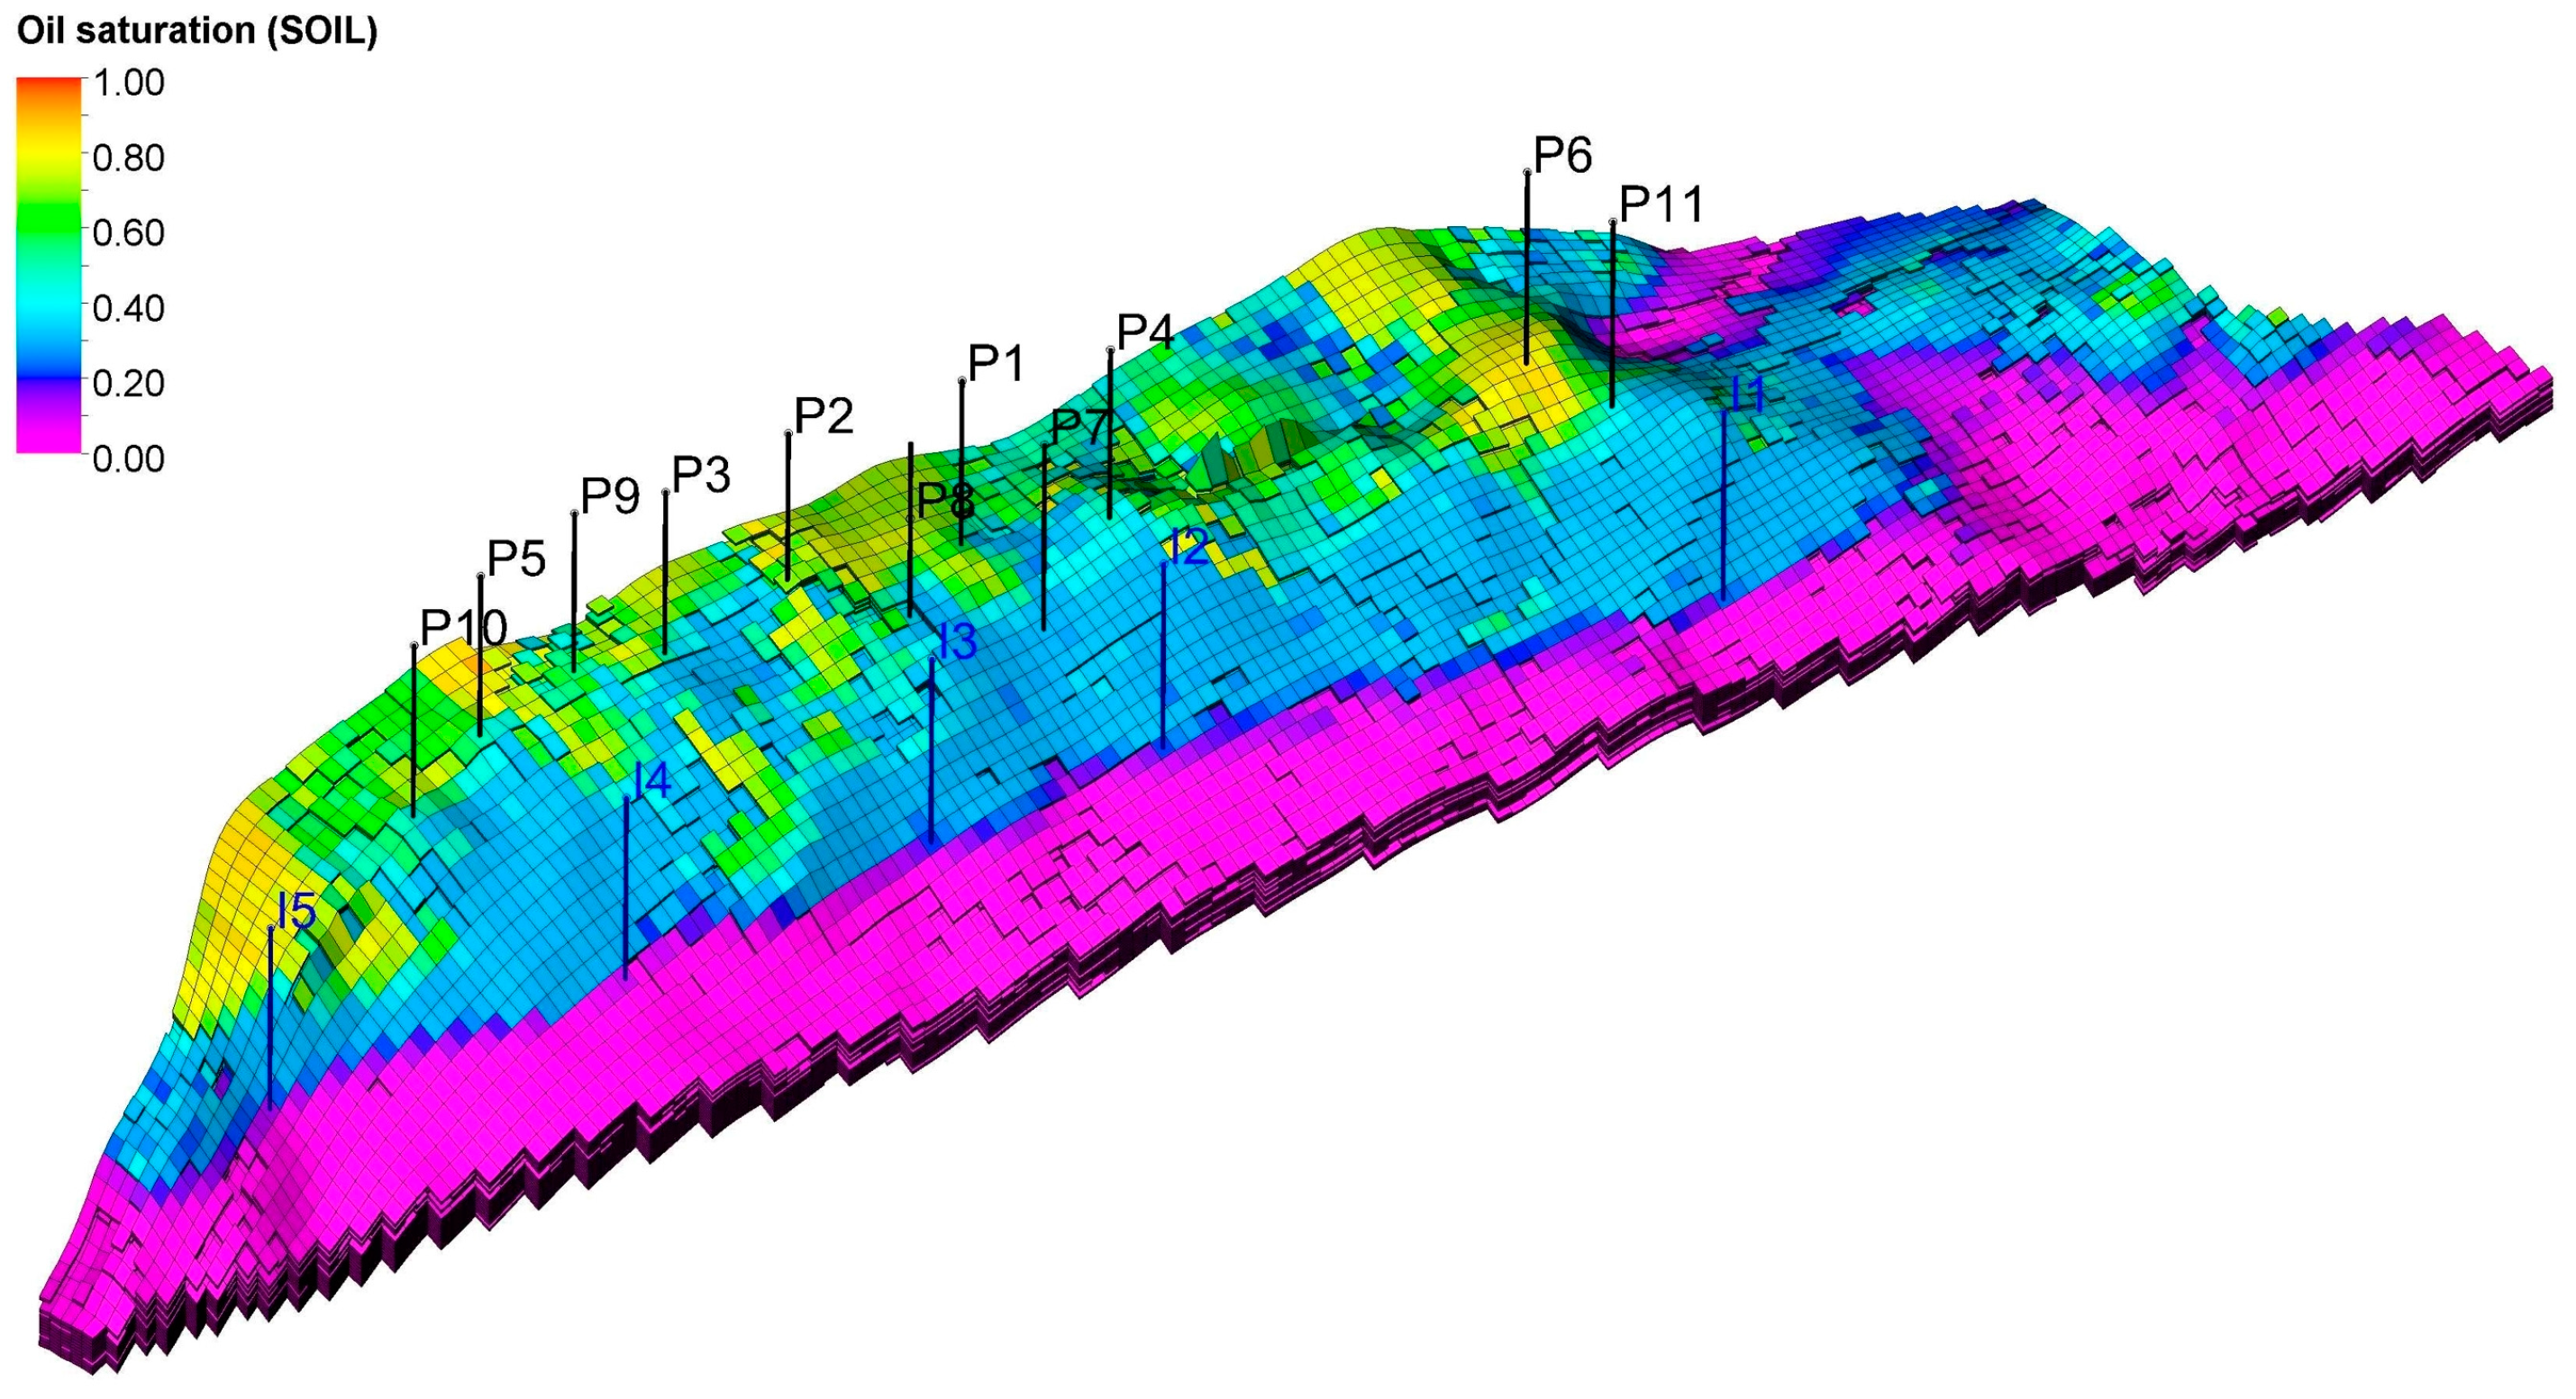
- List of producers: P1, P2, P3, P4, P5, P6, P7, P8, P9, P10, P11;
- –
- List of water/CO2 injectors: I1, I2, I3, I4, I5, and converted wells;
- –
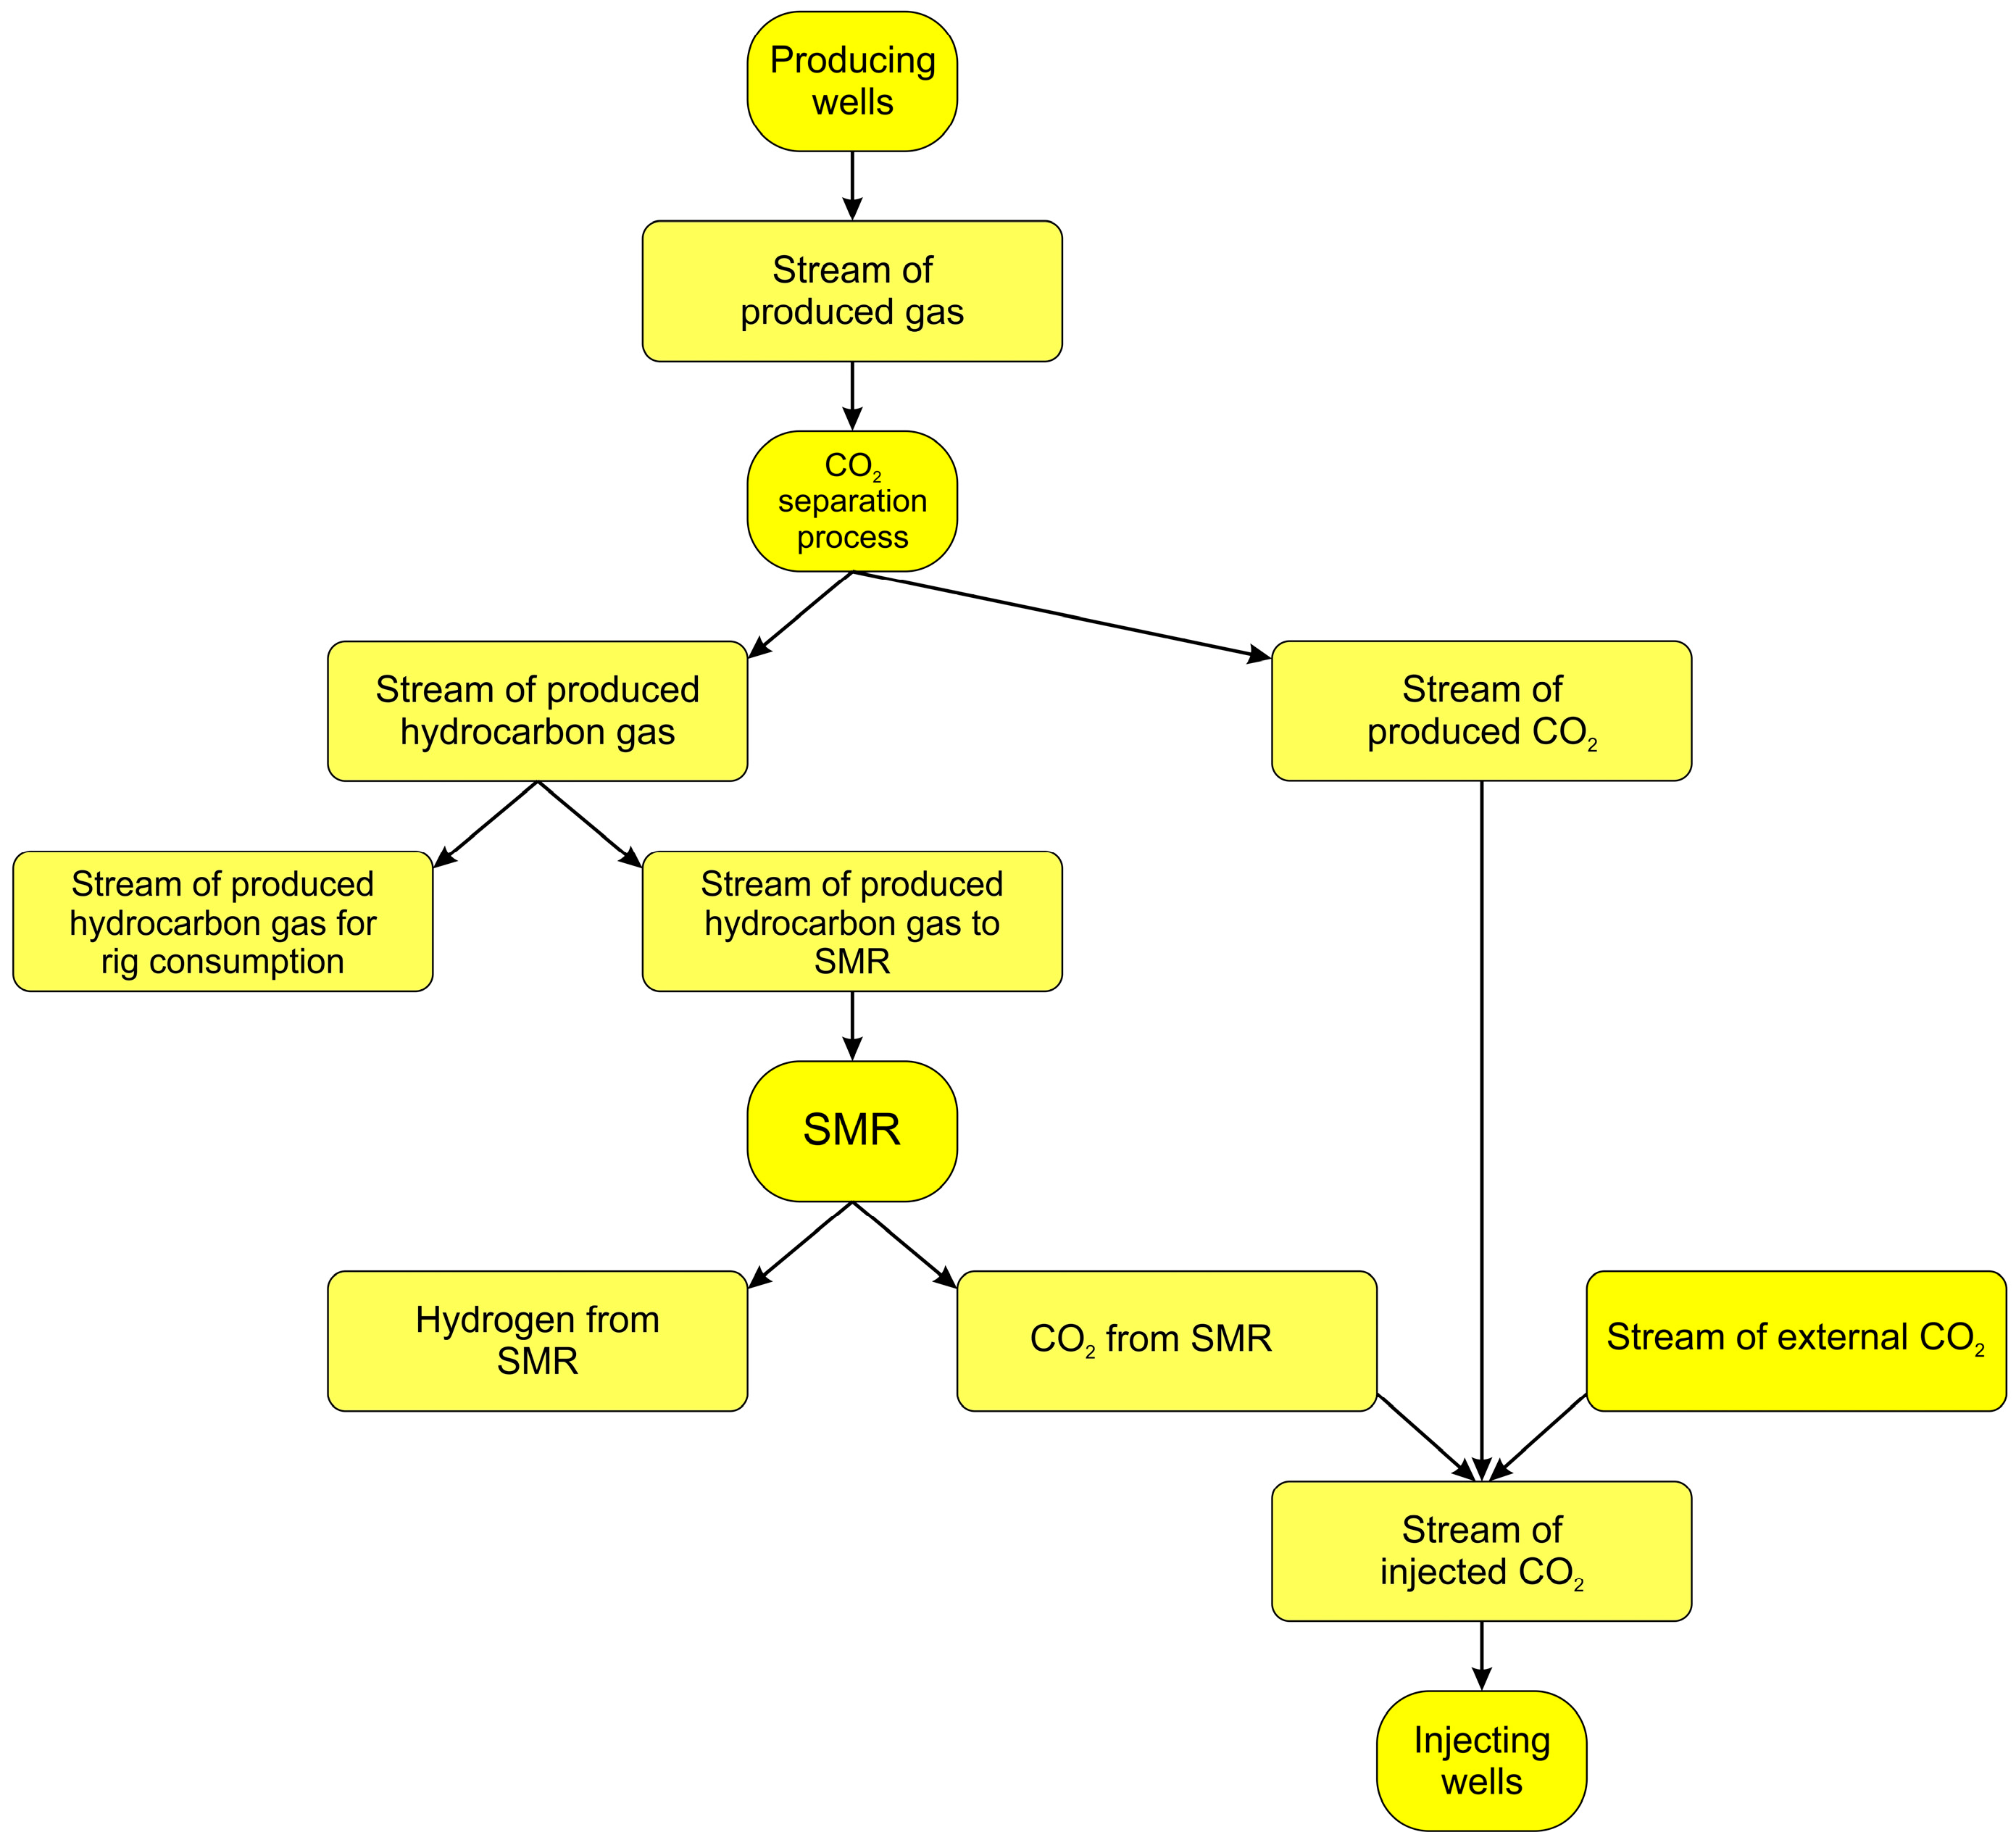
- Rate of hydrocarbon gas used for the rig’s consumption: qg,cons = 18,000 Nm3/d;
- –
- Maximum rate of injected CO2 originating from the SMR process of the hydrocarbons in the produced gas and separated from that gas, assuming 100% efficiency of these processes;
- –
- Maximum rate of injected CO2 originating from the outside sources (determined by the capacity of the tanker and the cyclical nature of deliveries): qCO2ext = 500,000 Nm3/d;
- –
- Minimum bottom-hole pressure of producers, Pbhp,prod,min = 90 bar;
- –
- Maximum bottom-hole pressure of CO2 injectors, Pbhp,injCO2,max = 220 bar;
- –
- Maximum bottom-hole pressure of water injectors, Pbhp,injH2O,max = 250 bar;
- –
- Contributions of individual producing wells to the total produced stream according to the last year’s historical data;
- –
- Contributions of individual injecting wells to the total injected stream according to the well injection potentials.
3.2. SMR
3.3. Base Forecast—Scenario I
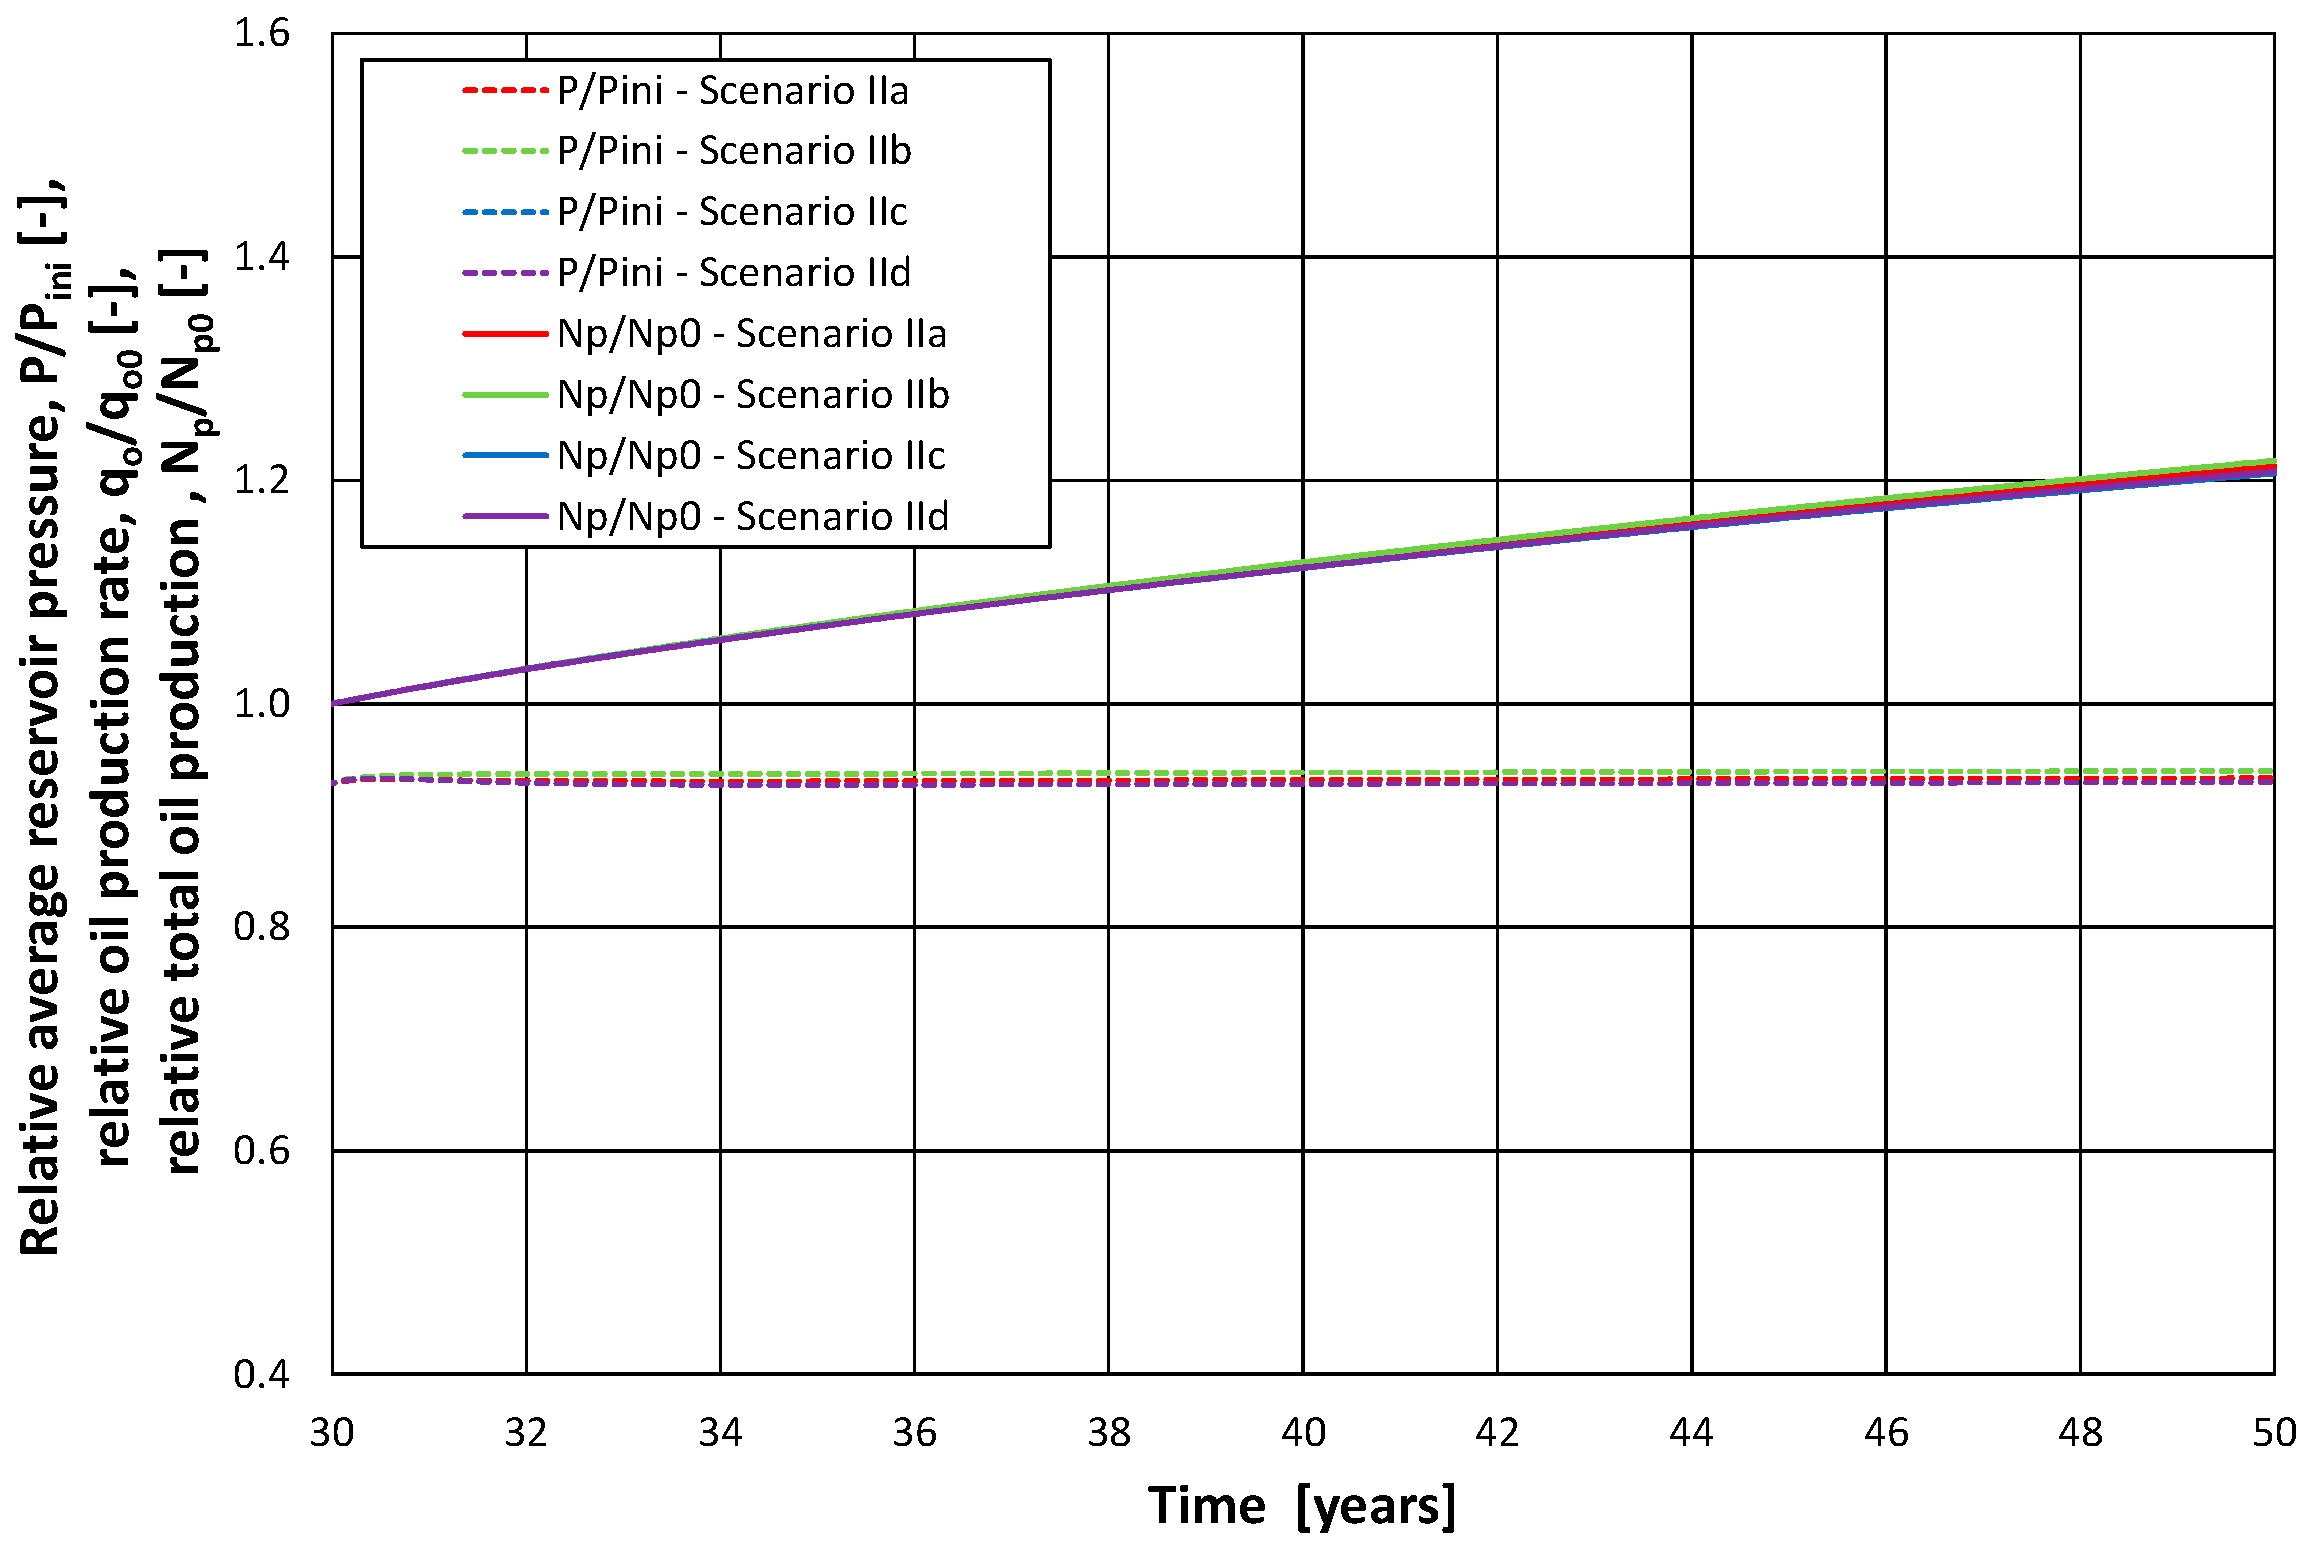
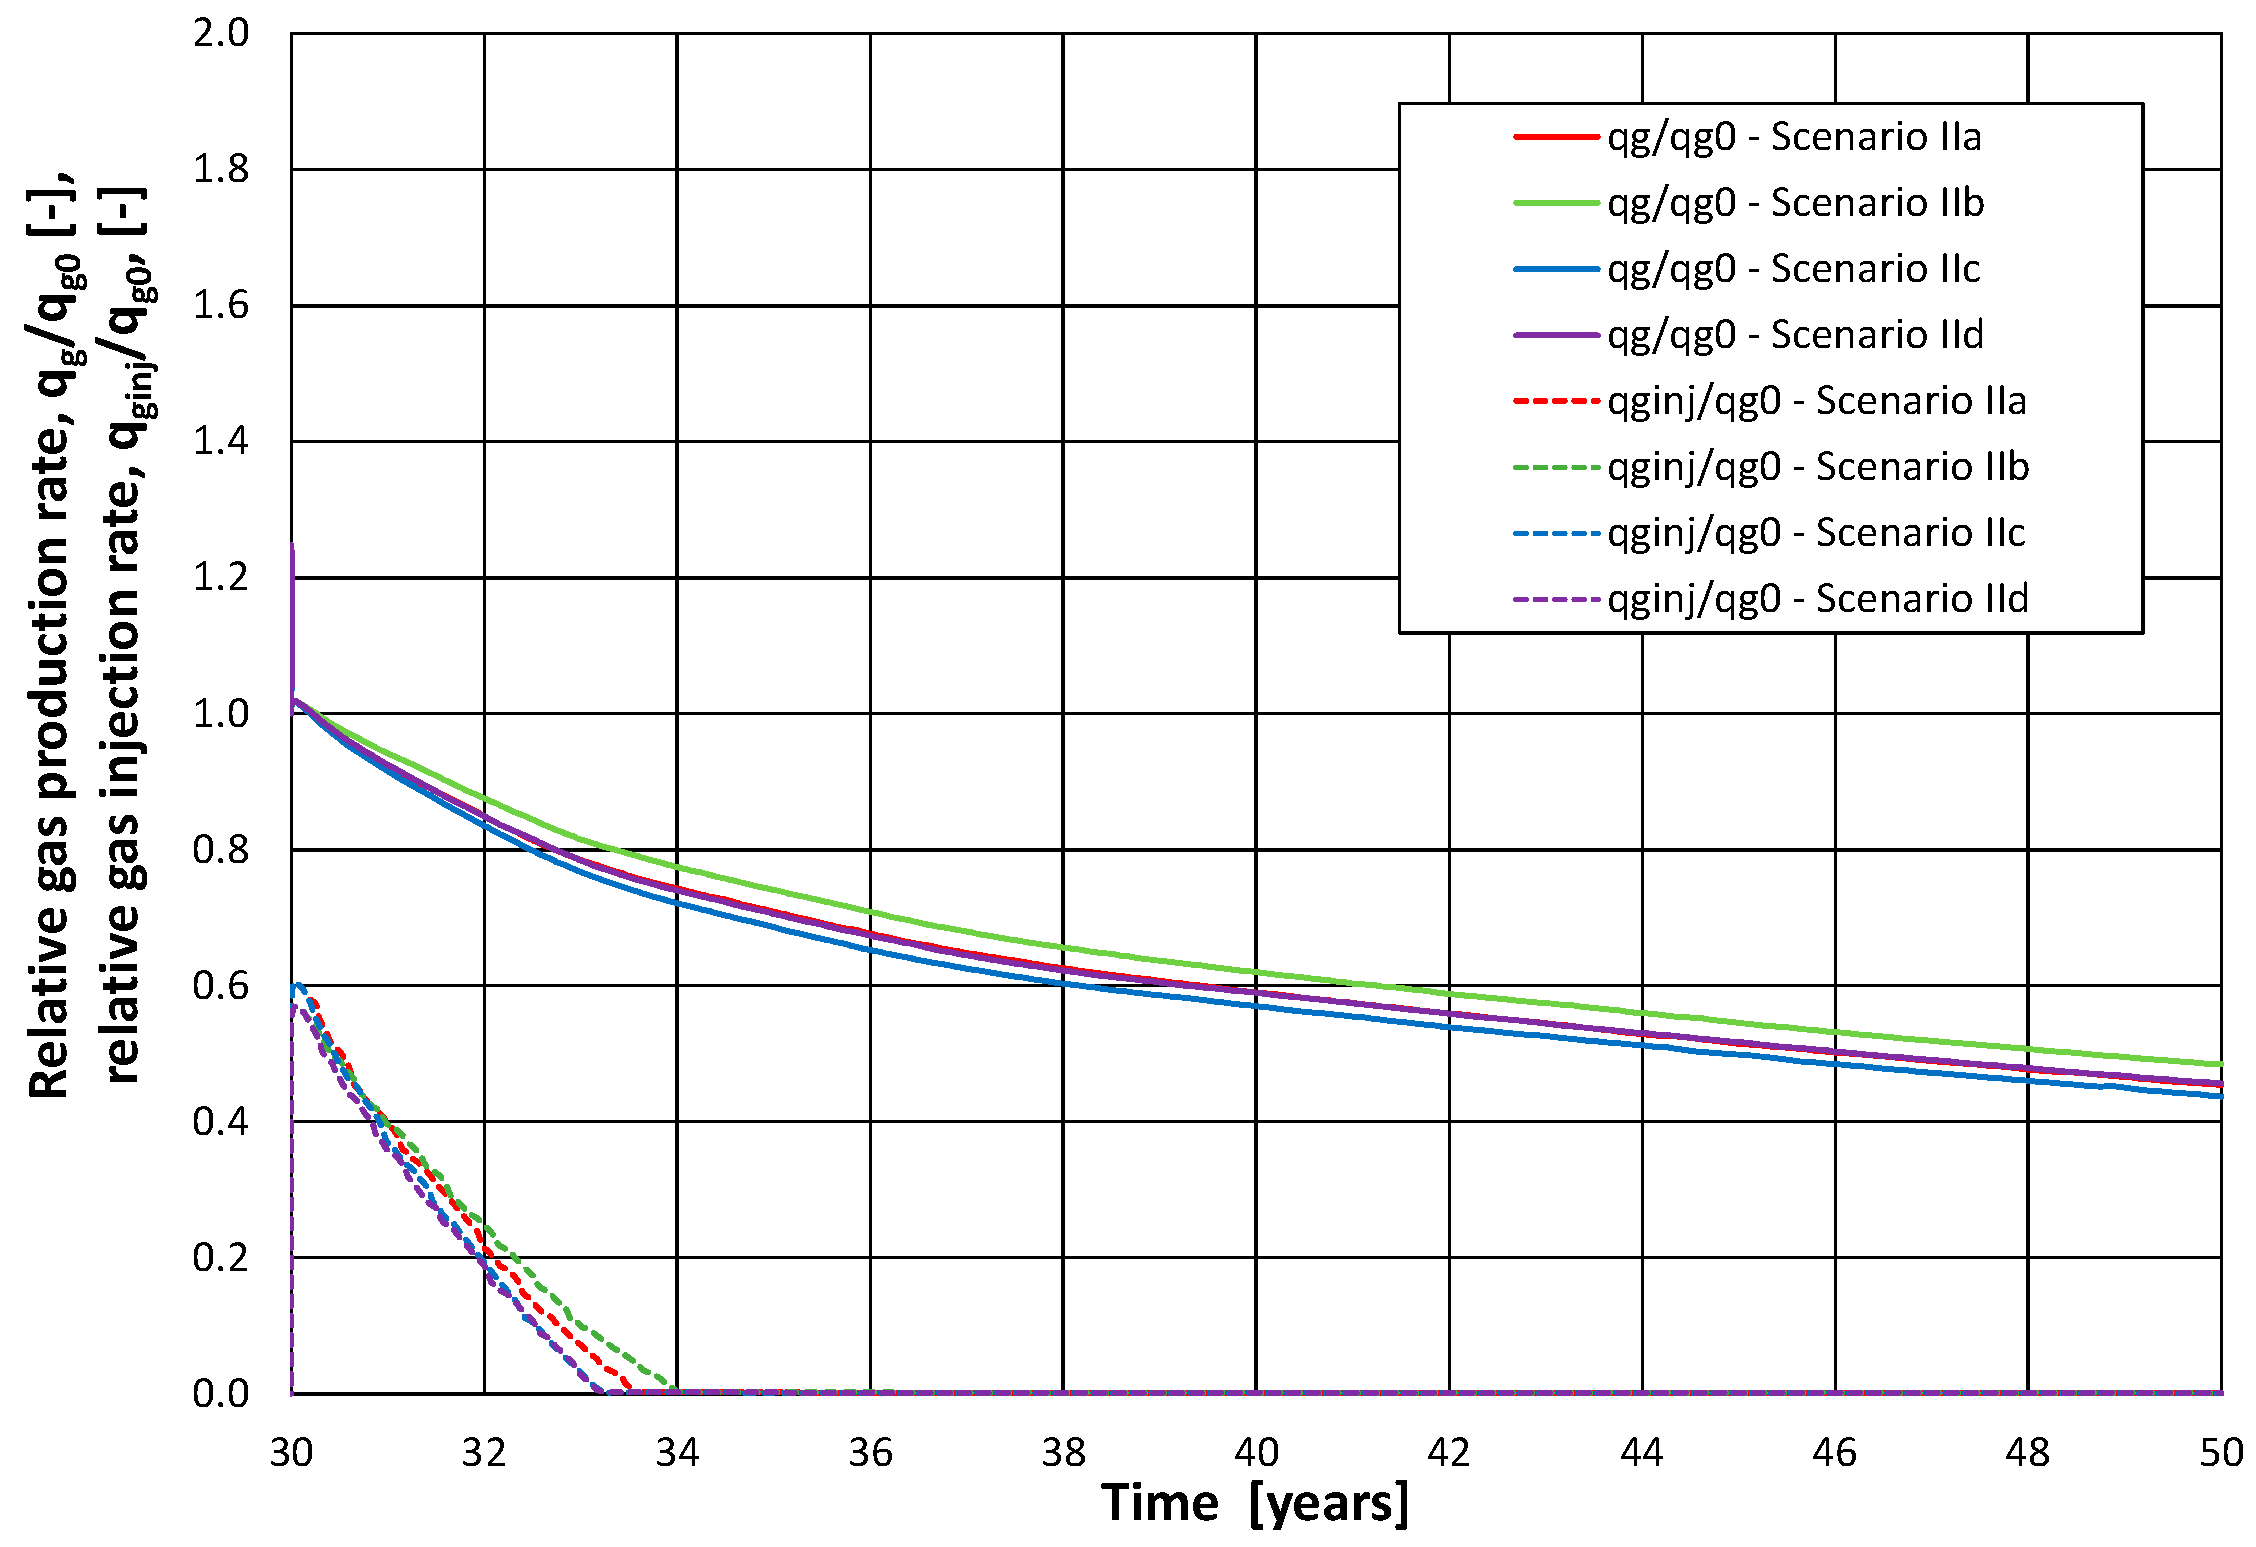
3.4. Forecasts with the Injection of CO2 from the SMR—Scenario II
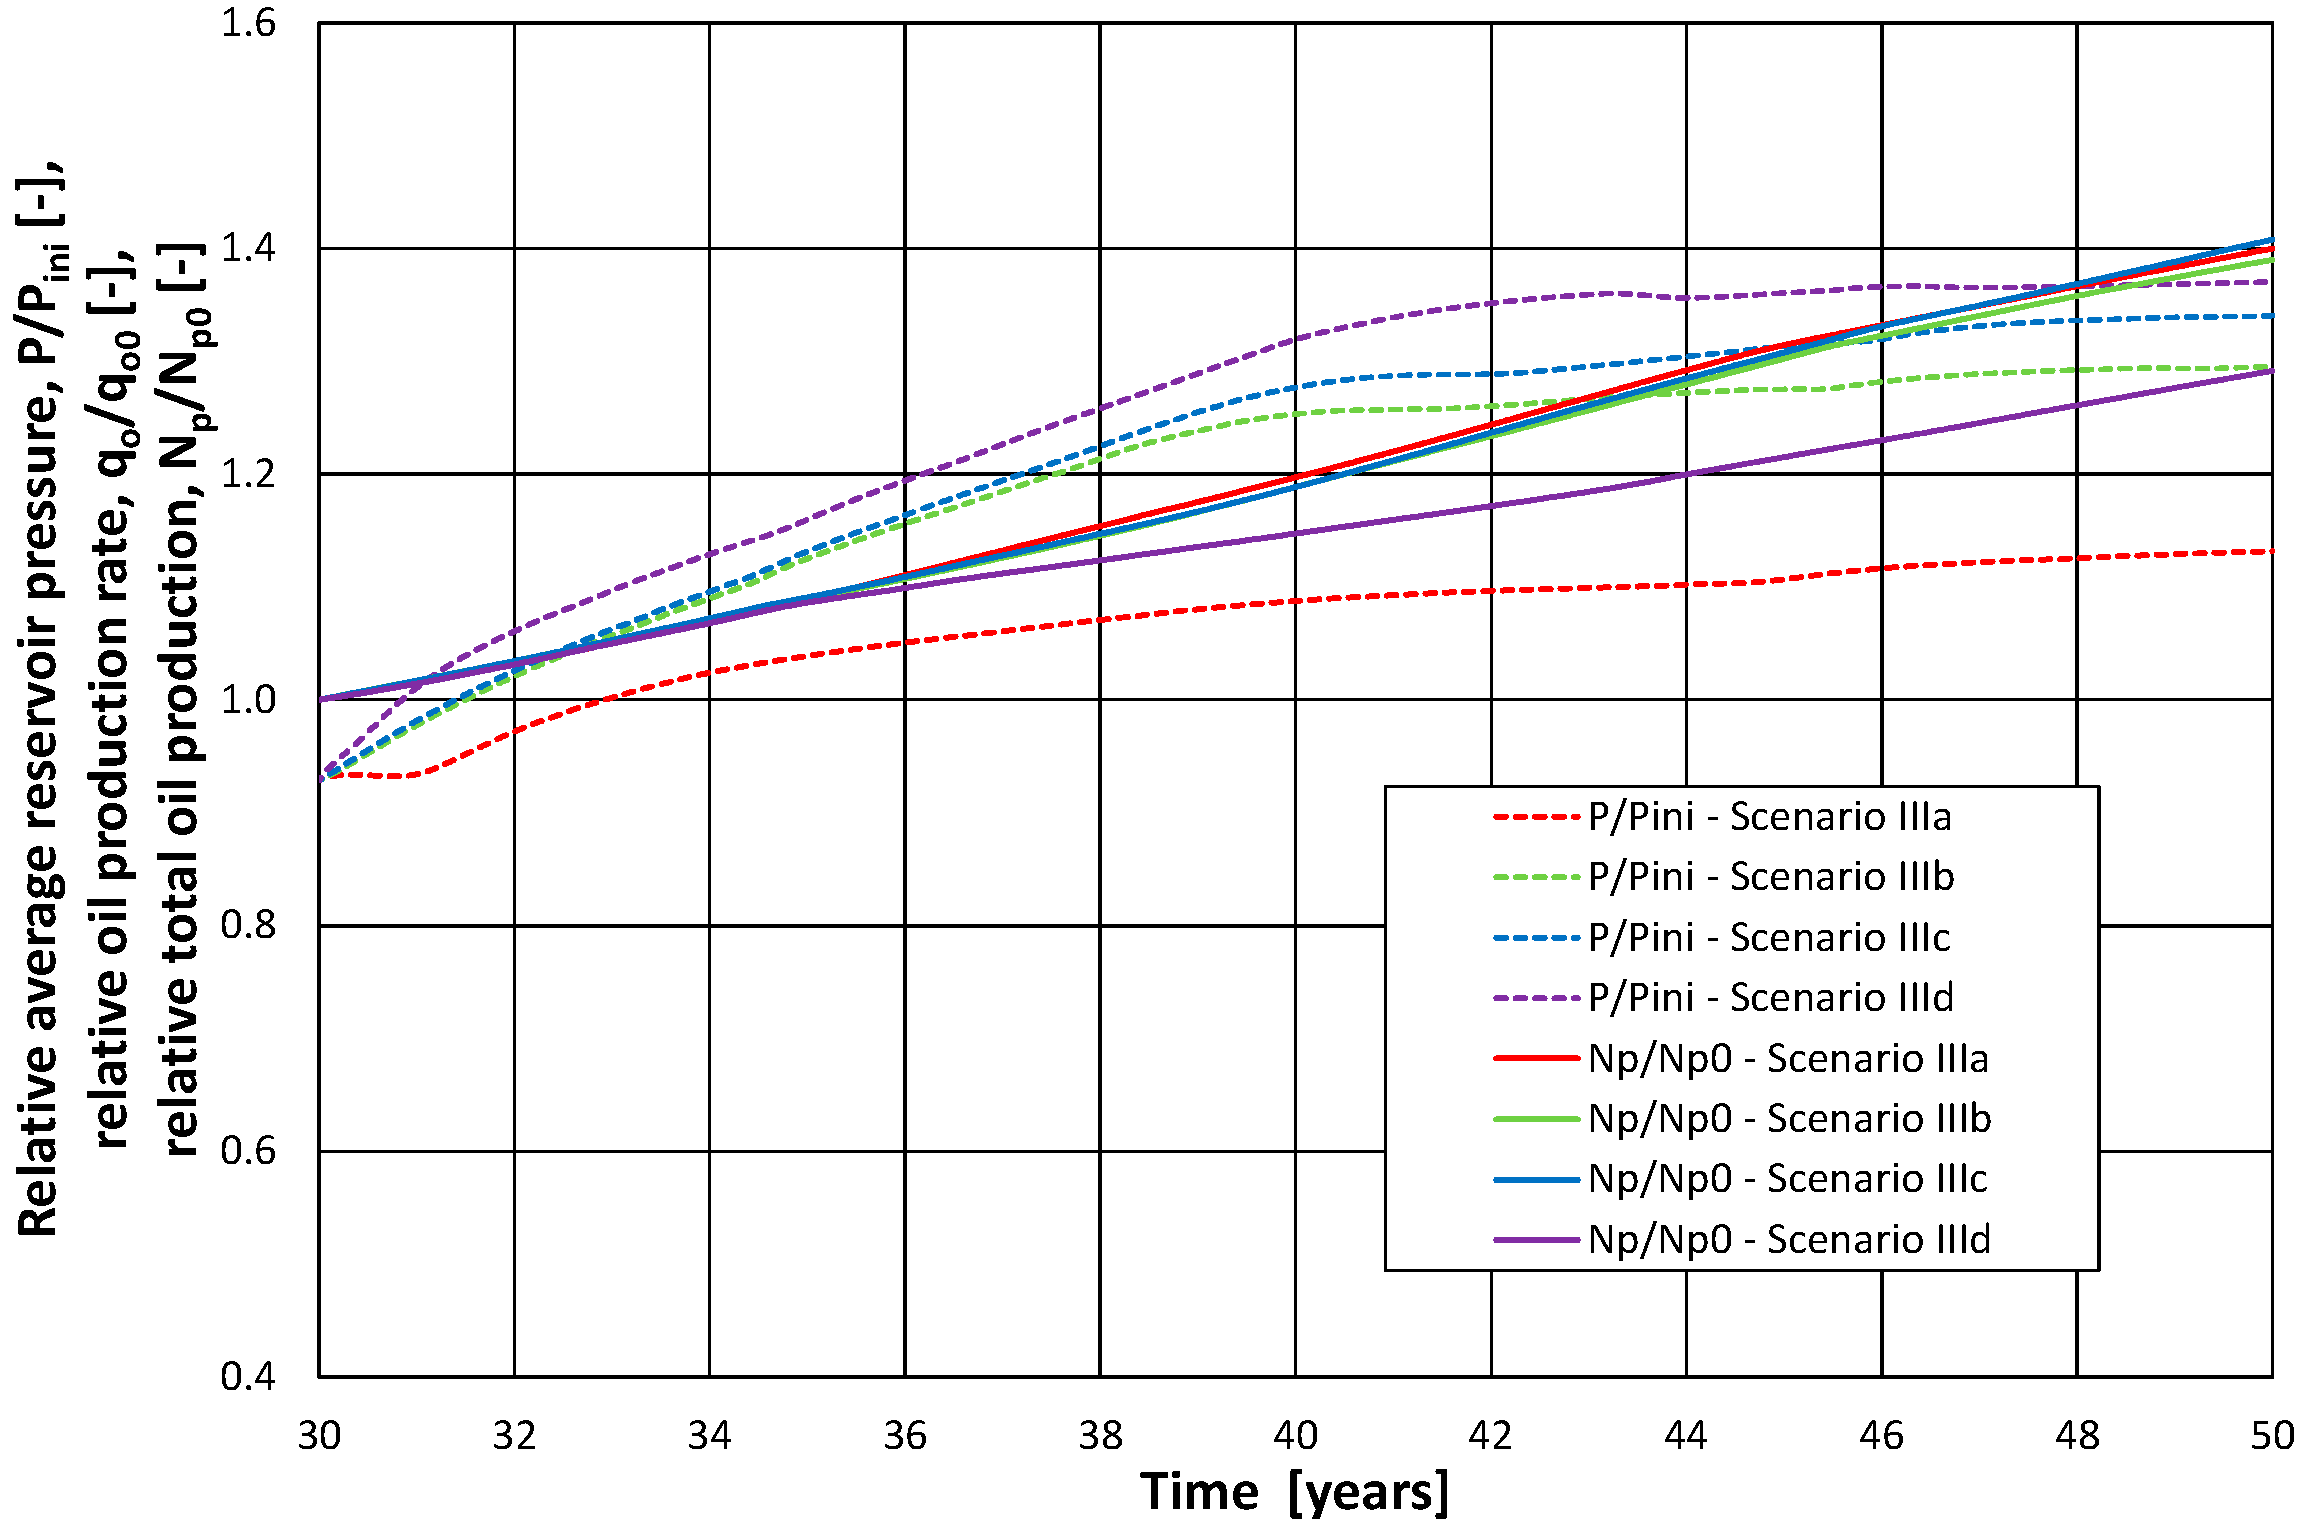
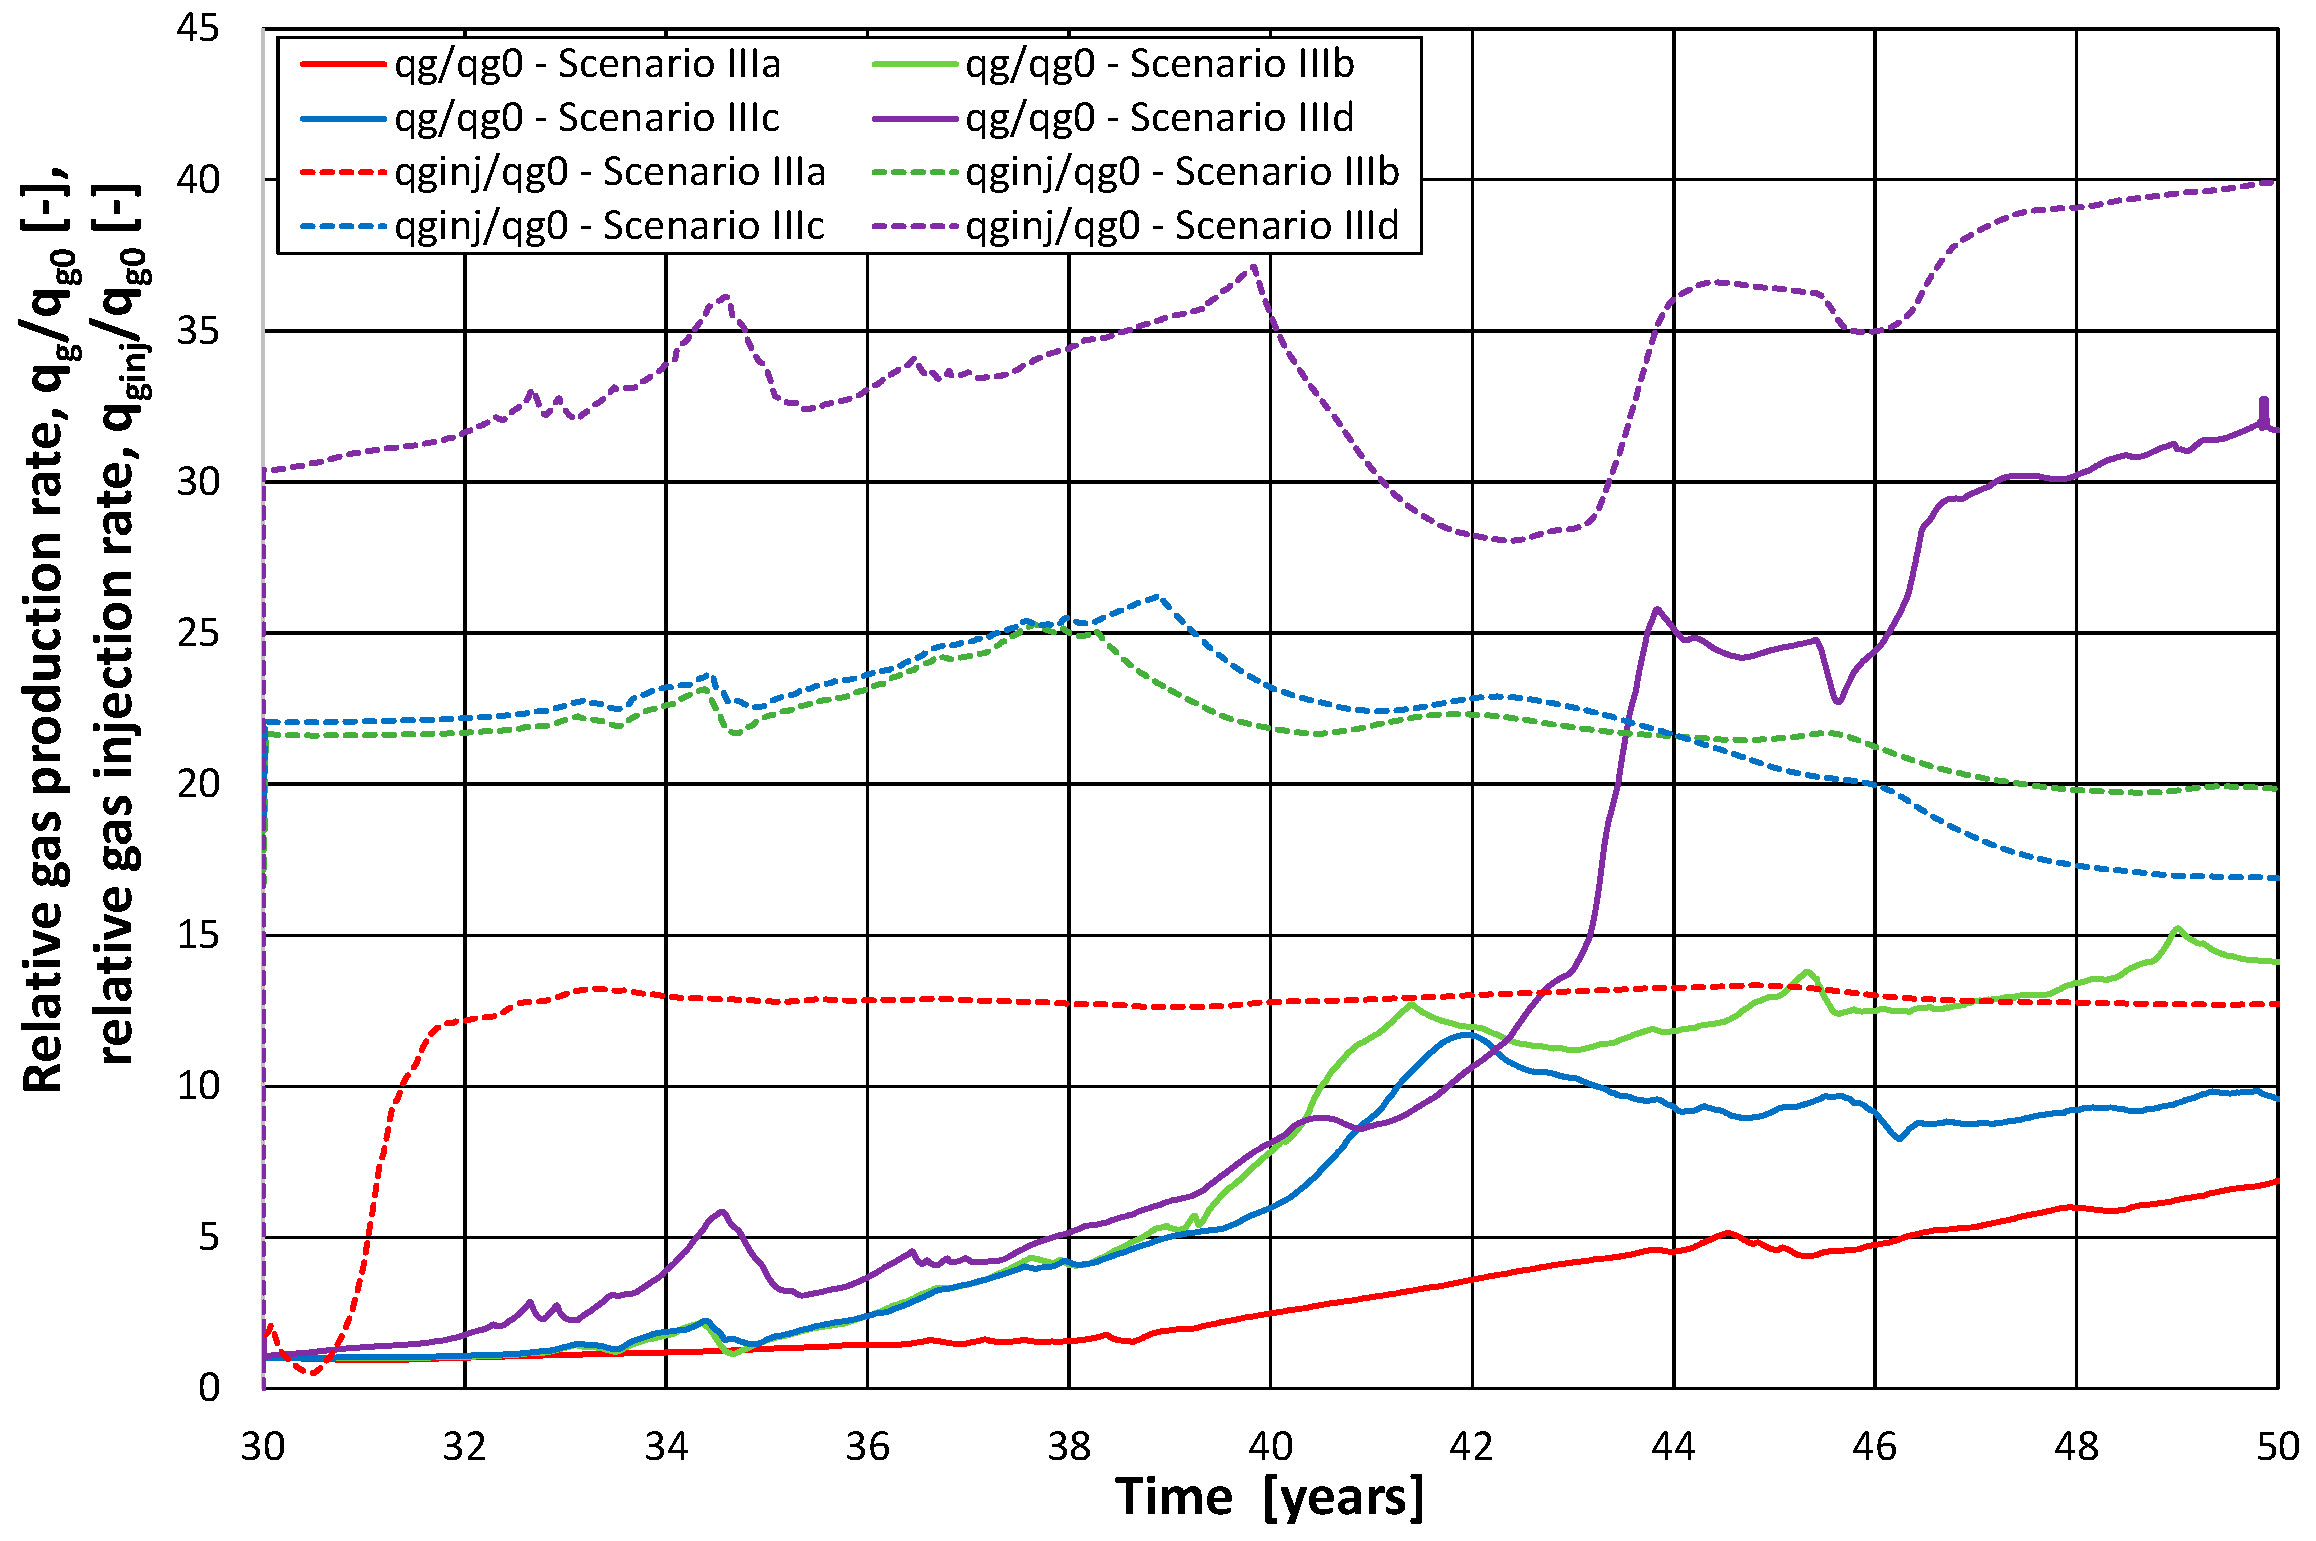
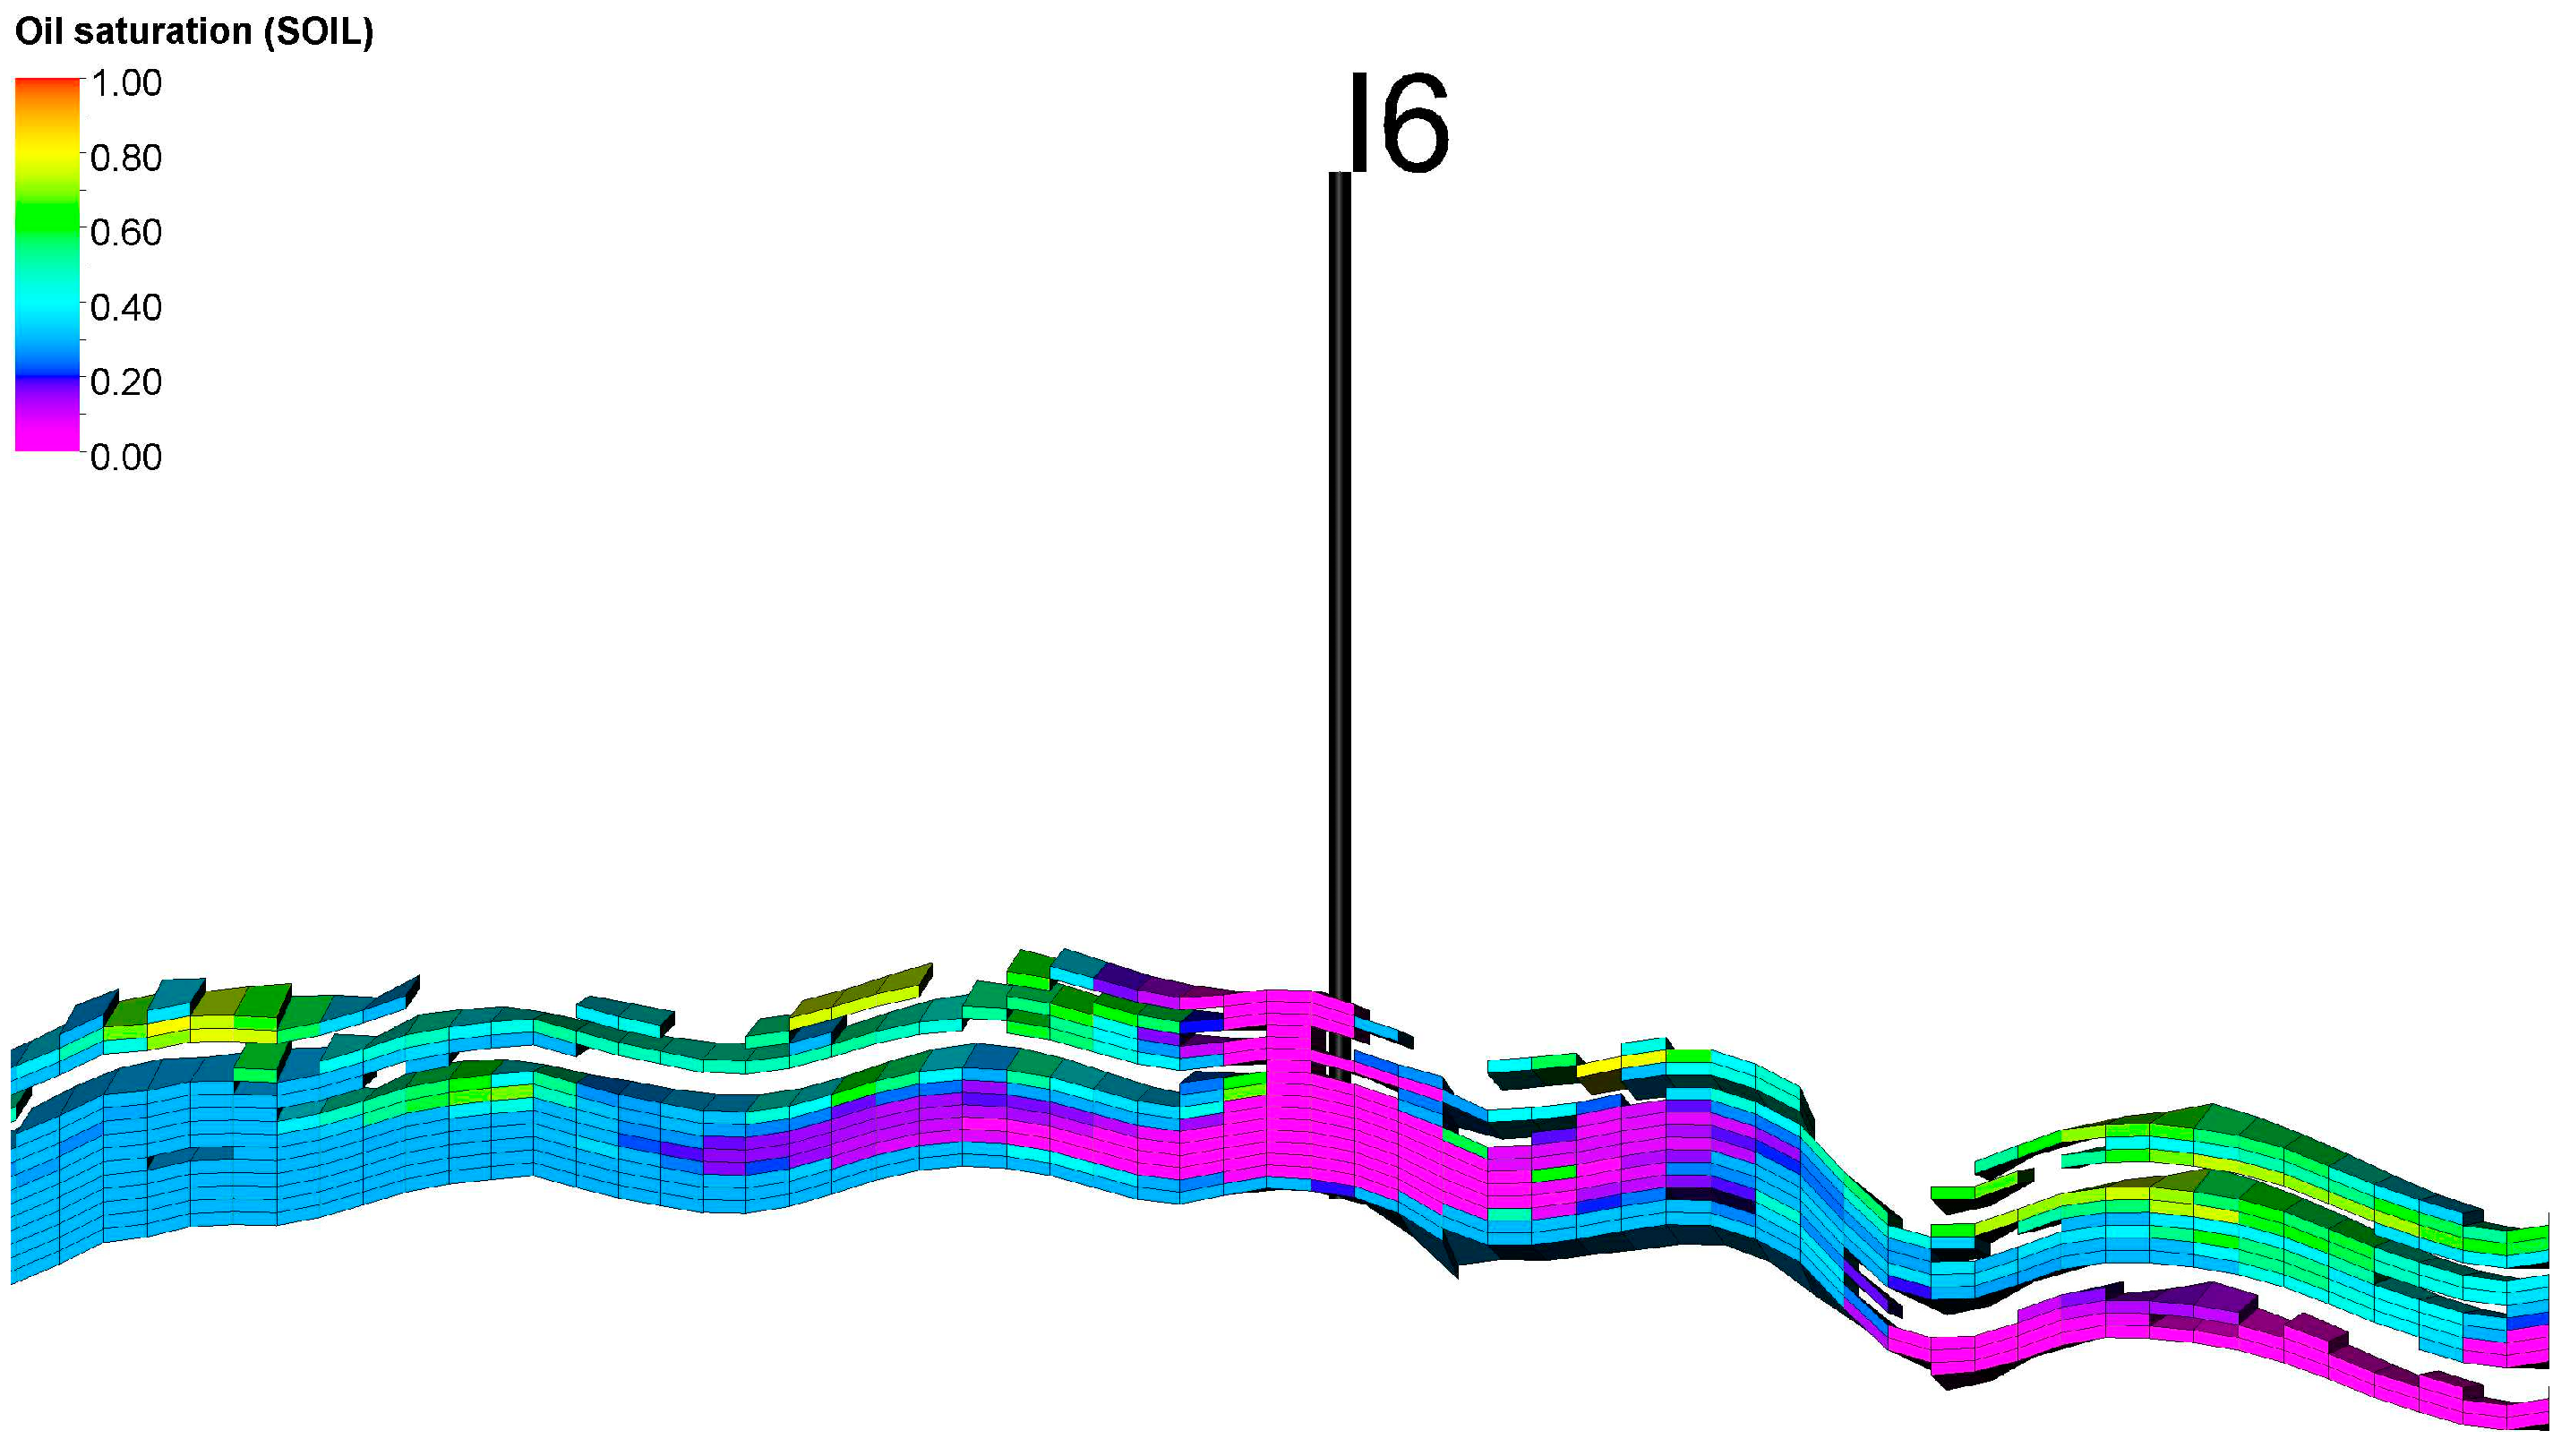
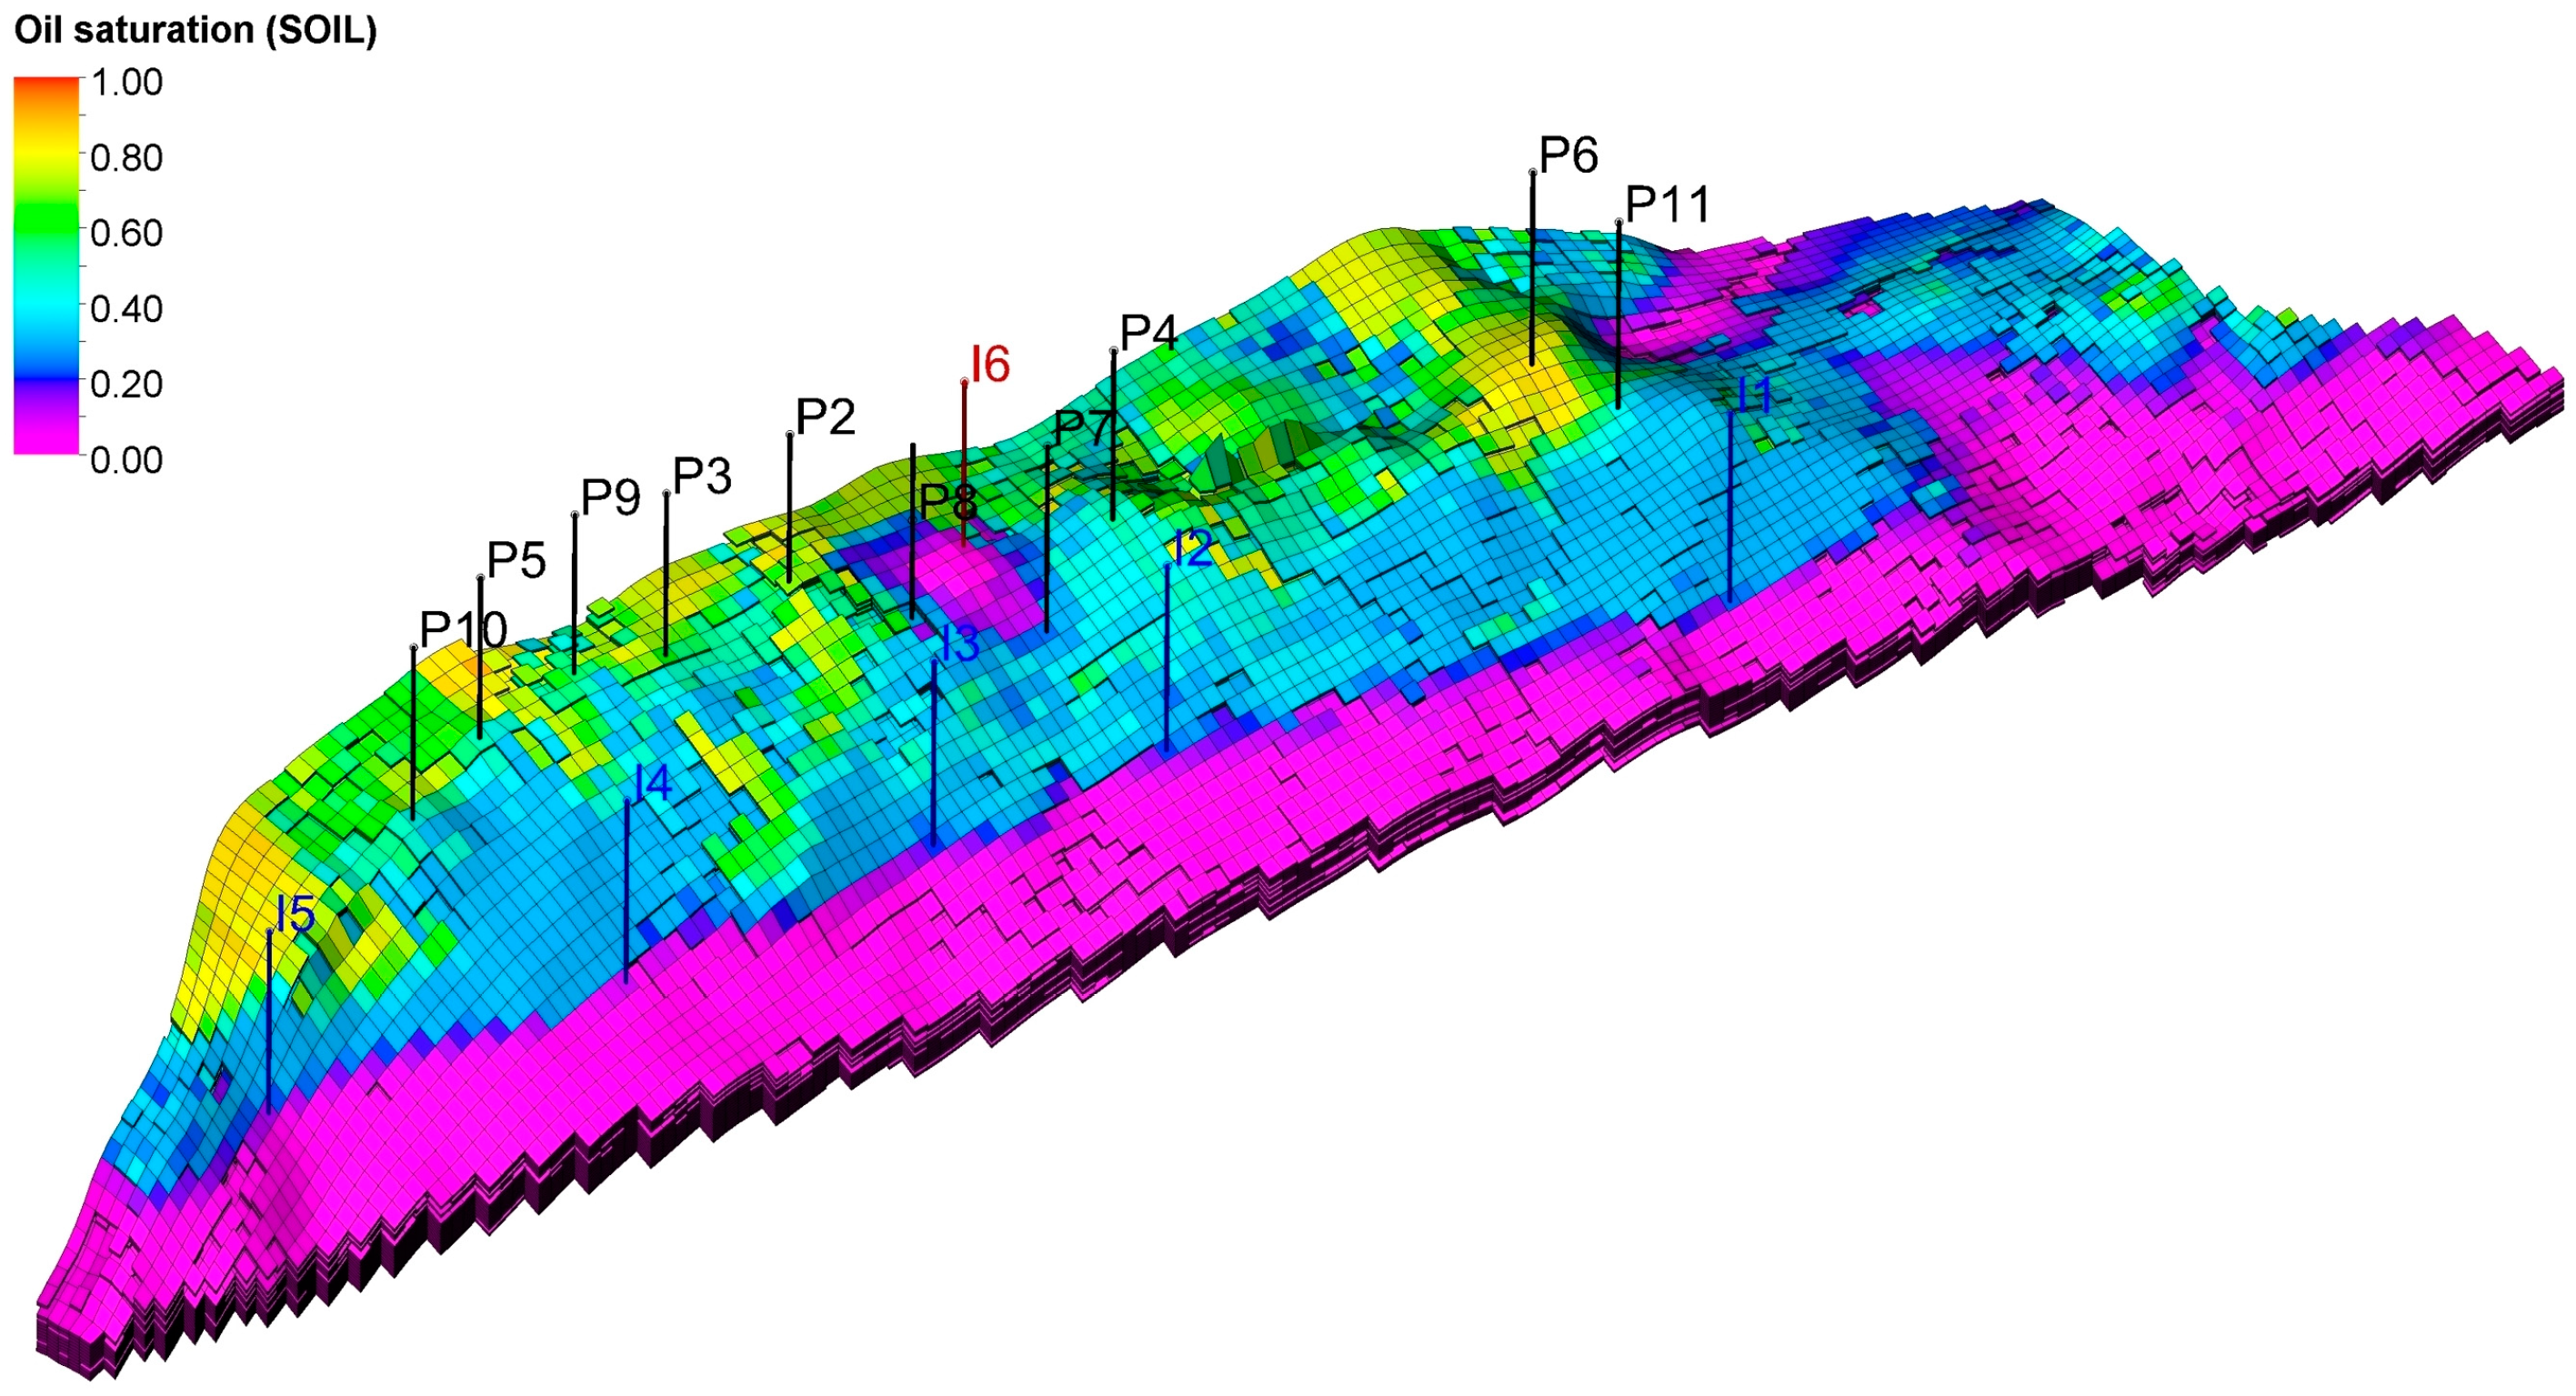
3.5. Forecasts with the Injection of Additional CO2—Scenario III
4. Summary and Conclusions
Author Contributions
Funding
Data Availability Statement
Conflicts of Interest
Nomenclature
| Latin: | |
| BHP | bottom hole pressure [bar], |
| Bw | water formation volume factor [Rm3/Sm3], |
| cCO2,inj | mole fraction of CO2 in the injected gas [-], |
| cw | isothermal compressibility of water [1/bar], |
| DGinj | total CO2 injection [Sm3], |
| DNp | increase in total oil production [Sm3], |
| GOR | gas-oil ratio [-], |
| Gp | total gas production [Sm3], |
| kh | horizontal permeability [mD], |
| kv | vertical permeability [mD], |
| MWCO2 | molar weight of CO2 [kg/kmol], |
| MWi | molar weight of the i-th component in the produced gas [kg/kmol], |
| MWg,prod | molar weight of produced gas [kg/kmol], |
| Np | total oil production [Sm3], |
| Pini | initial reservoir pressure [bar], |
| Pbhp,prod,min | minimum bottom-hole pressure of producers [bar], |
| Pbhp,inj,CO2,max | maximum bottom-hole pressure of CO2 injectors [bar], |
| Pbhp,inj,H20,max | maximum bottom-hole pressure of water injectors [bar], |
| qCO2,inj | CO2 injection rate [Sm3/d], |
| qCO2,ext | the maximum rate of injected CO2 originating from the outside sources [Sm3/d], |
| qv,CO2,inj | CO2 injection rate in terms of reservoir volume [Rm3/d], |
| qg,prod | gas production rate [Sm3/d], |
| qg,cons | gas consumption rate [Sm3/d], |
| qo,prod | oil production rate [Sm3/d], |
| qw,prod | water production rate [Sm3/d], |
| qw,inj | water injection rate [Sm3/d], |
| qv,w,inj | water injection rate in terms of reservoir volume [Rm3/d], |
| qw,inj,min | minimum water injection rate [Sm3/d], |
| qv,prod | fluids production rate in terms of reservoir volume [Rm3/d], |
| Socr | critical oil saturation [-], |
| ug,prod | gas production molar rate [kmol/d], |
| ug,cons | gas consumption molar rate [kmol/d], |
| uCO2,prod | CO2 production molar rate [kmol/d], |
| uCH,SMR | SMR inflow molar rate [kmol/d], |
| uCO2,SMR | SMR outflow CO2 molar rate [kmol/d], |
| uCO2,inj | CO2 injection molar rate [kmol/d], |
| WCT | water cut [-], |
| Wp | total water production [Sm3], |
| Winj | total water injection [Sm3]. |
| Greek: | |
| coefficient of viscosity change with pressure [1/bar], | |
| ρCH,prod | density of produced gas hydrocarbon components [kg/Sm3], |
| ρg,prod | produced gas density [kg/Sm3], |
| ρw | water density [kg/Sm3], |
| φ | porosity [%]. |
| Subscripts: | |
| 0 | value at the beginning of the forecast. |
References
- IEA. Global Hydrogen Review 2022. 2022. Available online: https://www.iea.org/reports/global-hydrogen-review-2022 (accessed on 5 September 2023).
- Arcos, J.M.M.; Santos, D.M.F. The Hydrogen Color Spectrum: Techno-Economic Analysis of the Available Technologies for Hydrogen Production. Gases 2023, 3, 25–46. [Google Scholar] [CrossRef]
- Simpson, A.P.; Lutz, A.E. Exergy analysis of hydrogen production via steam methane reforming. Int. J. Hydrog. Energy 2007, 32, 4811–4820. [Google Scholar] [CrossRef]
- Baykara, S.Z. Hydrogen: A brief overview of its sources, production and environmental impact. Int. J. Hydrog. Energy 2018, 43, 10605–10614. [Google Scholar] [CrossRef]
- Katebah, M.; Linke, P. Analysis of hydrogen production costs in Steam-Methane Reforming considering integration with electrolysis and CO2 capture. Clean. Eng. Technol. 2022, 10, 100552. [Google Scholar] [CrossRef]
- Shahid, M.Z.; Kim, J.-K. Design and economic evaluation of a novel amine-based CO2 capture process for SMR-based hydrogen production plants. J. Clean. Prod. 2023, 402, 136704. [Google Scholar] [CrossRef]
- Rock, L.; O’Brien, S.; Tessarolo, S.; Duer, J.; Bacci, V.O.; Hirst, B.; Randell, D.; Helmy, M.; Blackmore, J.; Duong, C.; et al. The Quest CCS Project: 1st Year Review Post Start of Injection. Energy Procedia 2017, 114, 5320–5328. [Google Scholar] [CrossRef]
- Air Products Announces Multi-Billion Dollar Net-Zero Hydrogen Energy Complex in Edmonton, Alberta, Canada, 6 June 2021. Available online: https://hydrogen-central.com/air-products-multi-billion-dollar-net-zero-hydrogen-energy-complex-edmonton-alberta-canada/ (accessed on 8 September 2023).
- First Integrated Hydrogen Manufacturing Facility in the Philippines. 2020. Available online: https://pilipinas.shell.com.ph/sustainability/pilipinas-shell-annual-sustainability-report-2019/first-integrated-hydrogen-manufacturing-facility.html (accessed on 8 September 2023).
- Production of Blue Hydrogen Begins in Changwon City. 2021. Available online: https://energynews.biz/production-of-blue-hydrogen-begins-in-changwon-city/ (accessed on 8 September 2023).
- Equinor, Evaluating Conversion of Natural Gas to Hydrogen, 7 July 2017. Available online: https://www.equinor.com/news/archive/evaluating-conversion-natural-gas-hydrogen (accessed on 8 September 2023).
- Acorn, Projects CCS. Available online: https://www.theacornproject.uk/projects (accessed on 8 September 2023).
- Net Zero Teesside. Available online: https://www.netzeroteesside.co.uk/ (accessed on 8 September 2023).
- Drax, Leading Energy Companies Announce New Zero-Carbon UK Partnership. 2019. Available online: https://www.drax.com/press_release/energy-companies-announce-new-zero-carbon-uk-partnership-ccus-hydrogen-beccs-humber-equinor-national-grid/ (accessed on 8 September 2023).
- Equinor, H2H Saltend. Available online: https://www.equinor.com/energy/h2h-saltend (accessed on 8 September 2023).
- H-vision. H-vision Is Ready for the Next Phase. Available online: https://www.h-vision.nl/en (accessed on 9 August 2023).
- Den Helder. Blue Hydrogen Factory in Den Helder in Sight. Available online: https://portofdenhelder.nl/news/blue-hydrogen-factory-in-den-helder-in-sight (accessed on 8 September 2023).
- Aker Solutions. Aker Solutions Starts CCS Test Program at Preem Refinery in Sweden. 26 May 2020. Available online: https://www.akersolutions.com/news/news-archive/2020/aker-solutions-starts-ccs-test-program-at-preem-refinery-in-sweden/ (accessed on 8 September 2023).
- HESC. Hydrogen Gas Now Produced at Latrobe Valley Site. 2 February 2021. Available online: https://www.hydrogenenergysupplychain.com/hesc-project-milestone-hydrogen-gas-now-produced-at-latrobe-valley-site/ (accessed on 8 September 2023).
- Hill, L.B.; Li, X.; Wei, N. CO2-EOR in China: A comparative review. Int. J. Greenh. Gas Control 2020, 103, 103173. [Google Scholar] [CrossRef]
- Szott, W.; Łętkowski, P.; Gołąbek, A.; Miłek, K. Ocena efektów wspomaganego wydobycia ropy naftowej i gazu ziemnego z wybranych złóż krajowych z zastosowaniem zatłaczania CO2 (Assessment of EOR/EGR processes by CO2 injection for selected Polish oil and gas reservoirs). Pr. Nauk. INiG Nr 2012, 184, 35. [Google Scholar]
- Wang, F.; Liao, G.; Su, C.; Wang, F.; Ma, J.; Yang, Y. Carbon emission reduction accounting method for a CCUS-EOR project. Pet. Explor. Dev. 2023, 50, 989–1000. [Google Scholar] [CrossRef]
- Lindeberg, E.; Grimstad, A.-A.; Bergmo, P.; Wessel-Berg, D.; Torsæter, M.; Holt, T. Large Scale Tertiary CO2 EOR in Mature Water Flooded Norwegian Oil Fields. Energy Procedia 2017, 114, 7096–7106. [Google Scholar] [CrossRef]
- Miłek, K.; Szott, W. Zastosowanie symulacji złożowych do analizy porównawczej procesu EOR na przykładzie wybranych metod wspomagania (Application of reservoir simulations for comparative analysis of EOR by selected methods). Nafta-Gaz 2015, 3, 167–176. [Google Scholar]
- Karimaie, H.; Bamshad Nazarian, B.; Terje Aurdal, T.; Nøkleby, P.H.; Hansen, O. Simulation Study of CO2 EOR and Storage Potential in a North Sea Reservoir. Energy Procedia 2017, 114, 7018–7032. [Google Scholar] [CrossRef]
- Szott, W.; Miłek, K. Analysis of the enhanced oil recovery process through a bilateral well using WAG-CO2 based on reservoir simulation. Part I—Synthetic reservoir model. Nafta-Gaz 2018, 4, 270–278. [Google Scholar] [CrossRef]
- Szott, W.; Miłek, K. Analysis of the enhanced oil recovery process through a bilateral well using WAG-CO2 based on reservoir simulation. Part II—Real reservoir model. Nafta-Gaz 2018, 7, 62–69. [Google Scholar] [CrossRef]
- Benham, A.L.; Dowden, W.E.; Kunzman, W.J. Miscible Fluid Displacement—Prediction of Miscibility. Trans. AIME 1960, 219, 229–237. [Google Scholar] [CrossRef]
- Shen, B.; Yang, S.; Gao, X.; Li, S.; Yang, K.; Hu, J.; Chen, H. Interpretable knowledge-guided framework for modelling minimum miscible pressure of CO2-oil system in CO2-EOR projects. Eng. Appl. Artif. Intell. 2023, 118, 105687. [Google Scholar] [CrossRef]
- Habera, Ł. Aspekty termodynamiczne zatłaczania dwutlenku węgla w procesach intensyfikacji wydobycia ropy naftowej i gazu ziemnego (EOR/EGR) (Thermodynamic aspects of carbon dioxide injection in enhanced oil/gas recovery processes (EOR/EGR). Pr. Nauk. Inst. Naft. Gazu 2016. [Google Scholar] [CrossRef]
- Ahmadi, Y. Relationship between Asphaltene Adsorption on the Surface of Nanoparticles and Asphaltene Precipitation Inhibition During Real Crude Oil Natural Depletion Tests. Iran. J. Oil Gas Sci. Technol. 2021, 10, 69–82. Available online: http://ijogst.put.ac.ir (accessed on 1 April 2024).
- Ahmadi, Y.; Mansouri, M.; Jafarbeigi, E. Improving Simultaneous Water Alternative Associate Gas Tests in the Presence of Newly Synthesized γ-Al2O3/ZnO/Urea Nano-Composites: An Experimental Core Flooding Tests. ACS Omega 2023, 8, 1443–1452. [Google Scholar] [CrossRef]
- Li, S.; Zhu, J.; Wang, Z.; Li, M.; Wei, Y.; Zhang, K. Chemical strategies for enhancing CO2-Hydrocarbon miscibility. Sep. Purif. Technol. 2024, 337, 126436. [Google Scholar] [CrossRef]
- Penspen, Miller DF1, CCS Project. Available online: https://www.penspen.com/experience/miller-df1-ccs-project/ (accessed on 8 September 2023).
- Terrien, P.; Lockwood, F.; Granados, L.; Morel, T. CO2 Capture from H2 Plants: Implementation for EOR. Energy Procedia 2014, 63, 7861–7866. [Google Scholar] [CrossRef]
- IEAGHG. Techno-Economic Evaluation of SMR Based Standalone (Merchant) Plant with CCS, 2017/02. Available online: https://ieaghg.org/exco_docs/2017-02.pdf (accessed on 1 April 2024).
- Jarrell, P.; Fox, C.; Stein, M.; Webb, S. Practical Aspects of CO2 Flooding. SPE Monogr. 2002, 22, 1–10. [Google Scholar]
- Corey, A.T. The interrelation between gas and oil relative permeabilities. Prod. Mon. 1954, 19, 38–41. [Google Scholar]
- Brooks, R.H.; Corey, A.T. Hydraulic Properties of Porous Media; Hydrological Paper 3; Colorado State University: Fort Collins, CO, USA, 1964; pp. 22–27. [Google Scholar]
- Manual PVTSim. Available online: https://www.scribd.com/document/289452761/PVTSim-Manual# (accessed on 8 September 2023).
- García, L. Hydrogen production by steam reforming of natural gas and other nonrenewable feedstocks. In Compendium of Hydrogen Energy, Hydrogen Production and Purification; A volume in Woodhead Publishing Series in Energy; Woodhead Publishing: Cambridge, UK, 2015. [Google Scholar]
- Luboń, K. Influence of Injection Well Location on CO2 Geological Storage Efficiency. Energies 2021, 14, 8604. [Google Scholar] [CrossRef]



| Component | Mole Fraction [%] |
|---|---|
| N2 | 1.09 |
| CO2 | 0.13 |
| H2S | 0.00 |
| CH4 | 19.17 |
| C2H6 | 12.58 |
| C3H8 | 11.93 |
| i-C4H10 | 1.30 |
| n-C4H10 | 5.59 |
| i-C5H12 | 1.56 |
| n-C5H12 | 4.23 |
| pseudo C6H14 | 5.52 |
| pseudo C7H16 | 6.58 |
| pseudo C8H18 | 6.54 |
| pseudo C9H20 | 4.45 |
| pseudo C10H22 | 3.56 |
| pseudo C11H24 | 2.23 |
| C12+ | 13.54 |
| Scenario | Water Injectors | CO2 Injectors |
|---|---|---|
| IIa | I1, I5, I2, I4 | I3 |
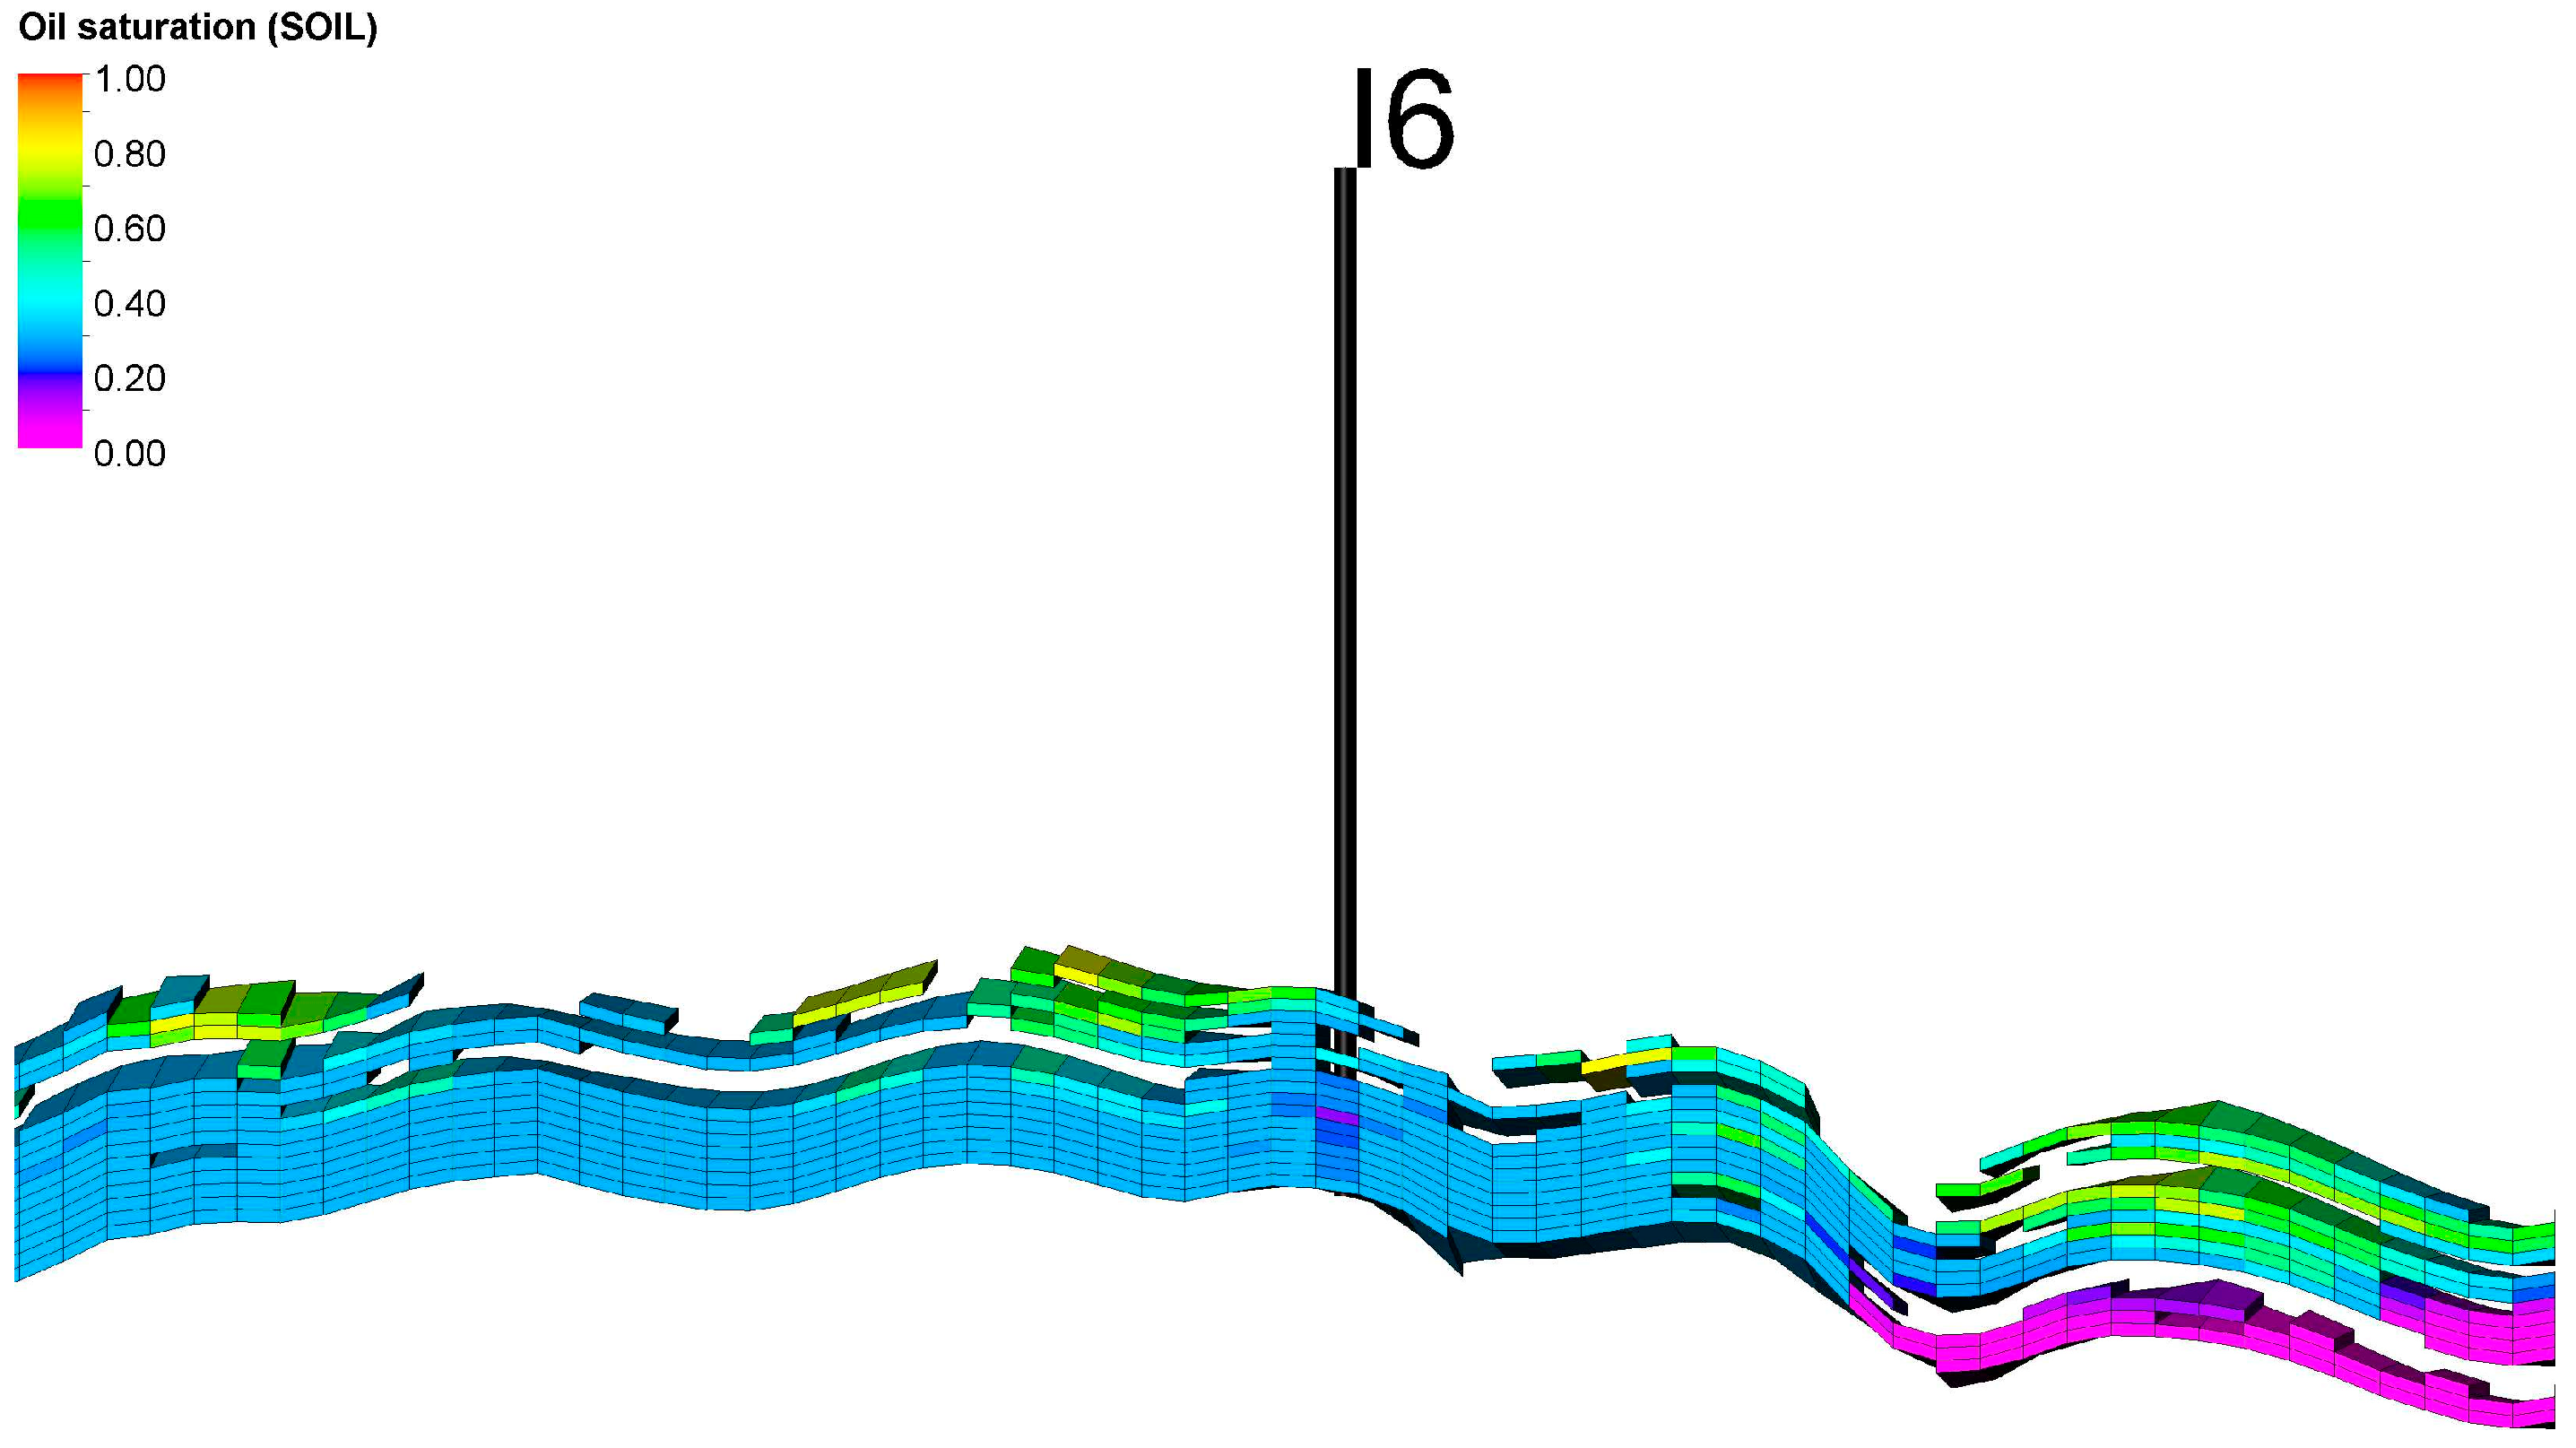
| IIb | I1, I5, I2, I3, I4 | I6 converted from P1 |
| IIc | I1, I5 | I2, I3, I4 |
| IId | I1, I5 | I2, I3, I4, I6 |
| Scenario | Water Injecting Wells | CO2 Injecting Wells |
|---|---|---|
| IIIa | I1, I5, I2, I4 | I6 |
| IIIb | I1, I5 | I2, I3, I4 |
| IIIc | I1, I5 | I2, I3, I4, I6, |
| IIId | I1, I5 | I2, I3, I4, I6, I7 converted from P3, I8 converted from P5 |
| Scenario | Total Water Production, Wp/Wp0 [-] | Total Water Injection, Winj/Winj0 [-] | Total Gas Production, Gp/Gp0 [-] | Total CO2 Injection, Ginj/Gp0 [-] | Total Oil Production, Np/Np0 [-] | Oil Production Increase [% obj.] | Replacement Factor, DGinj/DNp [Nm3 CO2/1 Nm3 of Oil] | Replacement Factor, DGinj/DNp [kg CO2/1 kg of Oil] |
|---|---|---|---|---|---|---|---|---|
| I | 1.737 | 0.496 | 0.214 | 0.000 | 0.214 | 0.00% | ||
| IIa | 1.724 | 0.489 | 0.212 | 0.017 | 0.212 | ≈0.00% | ||
| IIb | 1.522 | 0.449 | 0.210 | 0.015 | 0.210 | ≈0.00% | ||
| IIc | 1.697 | 0.479 | 0.206 | 0.015 | 0.206 | ≈0.00% | ||
| IId | 1.523 | 0.448 | 0.208 | 0.014 | 0.208 | ≈0.00% | ||
| IIIa | 1.569 | 0.297 | 1.011 | 4.047 | 0.400 | 87.21% | 883 | 4.60 |
| IIIb | 2.379 | 0.450 | 2.555 | 7.433 | 0.390 | 82.54% | 1664 | 8.81 |
| IIIc | 2.113 | 0.400 | 1.978 | 7.256 | 0.408 | 90.92% | 1553 | 7.85 |
| IIId | 1.266 | 0.239 | 3.024 | 7.999 | 0.291 | 36.43% | 2396 | 20.44 |
Disclaimer/Publisher’s Note: The statements, opinions and data contained in all publications are solely those of the individual author(s) and contributor(s) and not of MDPI and/or the editor(s). MDPI and/or the editor(s) disclaim responsibility for any injury to people or property resulting from any ideas, methods, instructions or products referred to in the content. |
© 2024 by the authors. Licensee MDPI, Basel, Switzerland. This article is an open access article distributed under the terms and conditions of the Creative Commons Attribution (CC BY) license (https://creativecommons.org/licenses/by/4.0/).
Share and Cite
Miłek, K.; Szott, W.; Tyburcy, J.; Lew, A. Reservoir Simulations of Hydrogen Generation from Natural Gas with CO2 EOR: A Case Study. Energies 2024, 17, 2321. https://doi.org/10.3390/en17102321
Miłek K, Szott W, Tyburcy J, Lew A. Reservoir Simulations of Hydrogen Generation from Natural Gas with CO2 EOR: A Case Study. Energies. 2024; 17(10):2321. https://doi.org/10.3390/en17102321
Chicago/Turabian StyleMiłek, Krzysztof, Wiesław Szott, Jarosław Tyburcy, and Alicja Lew. 2024. "Reservoir Simulations of Hydrogen Generation from Natural Gas with CO2 EOR: A Case Study" Energies 17, no. 10: 2321. https://doi.org/10.3390/en17102321
APA StyleMiłek, K., Szott, W., Tyburcy, J., & Lew, A. (2024). Reservoir Simulations of Hydrogen Generation from Natural Gas with CO2 EOR: A Case Study. Energies, 17(10), 2321. https://doi.org/10.3390/en17102321


