Article

Analysis of Grid Performance with Diversified Distributed Resources and Storage Integration: A Bilevel Approach with Network-Oriented PSO

Electrical and Electronics Engineering Department, Ozyegin University, Istanbul 34794, Turkey
*
Author to whom correspondence should be addressed.
Energies 2024, 17(10), 2270; https://doi.org/10.3390/en17102270
Submission received: 1 April 2024 / Revised: 26 April 2024 / Accepted: 27 April 2024 / Published: 8 May 2024

Abstract

:
The growing deployment of distributed resources significantly affects the distribution grid performance in most countries. The optimal sizing and placement of these resources have become increasingly crucial to mitigating grid issues and reducing costs. Particle Swarm Optimization (PSO) is widely used to address such problems but faces computational inefficiency due to its numerical convergence behavior. This limits its effectiveness, especially for power system problems, because the numerical distance between two nodes in power systems might be different from the actual electrical distance. In this paper, a scalable bilevel optimization problem with two novel algorithms enhances PSO’s computational efficiency. While the resistivity-driven algorithm strategically targets low-resistivity regions and guides PSO toward areas with lower losses, the connectivity-driven algorithm aligns solution spaces with the grid’s physical topology. It prioritizes actual physical neighbors during the search to prevent local optima traps. The tests of the algorithms on the IEEE 33-bus and the 69-bus and Norwegian networks show significant reductions in power losses (up to 74% for PV, wind, and storage) and improved voltage stability (a 21% reduction in mean voltage deviation index) with respect to the results of classical PSO. The proposed network-oriented PSO outperforms classical PSO by achieving a 2.84% reduction in the average fitness value for the IEEE 69-bus case with PV, wind, and storage deployment. The Norwegian case study affirms the effectiveness of the proposed approach in real-world applications through significant improvements in loss reduction and voltage stability.

1. Introduction

Modern power systems are facing various technical, environmental, and economic issues. Traditional power plants are not emission-free and create environmental pollution, leading to health problems and other global concerns. Therefore, the necessity of integrating renewable energy sources naturally emerges. Power system planners have been looking to distributed generation units as a solution to serve the distribution system’s needs. Small-scale generators built near load centers are distributed generation (DG) or distributed energy resource (DER) units. DER units are dispersed throughout a utility’s distribution system to reduce distribution losses and voltage disturbances [1]. The International Energy Agency (IEA) describes DG as “a type of generating plant that is tied to the grid at the distribution level voltages to serve a customer on-site and at the same time to provide support to a distribution network” [2]. This shift toward decentralized energy is also a trend in research because it helps create more reliable and sustainable energy systems. It is not just about being green; optimally sizing and allocating resources within distribution systems holds significance for several reasons. It is about making the energy system more reliable, adaptable, and self-sufficient.
Numerous studies have examined various optimization algorithms for the sizing and allocation of distributed generators (DGs) in radial networks, all aiming to enhance distribution system performance. A comprehensive review of these studies examines optimal allocation methods and their impacts [3]. Among these methods, Particle Swarm Optimization (PSO) emerges as the dominant approach, as evidenced by its repeated utilization across multiple investigations. While some focus on minimizing total costs [4], power losses [4,5,6,7,8,9,10,11], and voltage disturbances [4,9,10,12], others explore the flexibility of PSO through variant analyses [6,13], as well as its hybridization with complementary algorithms [9,10,14]. Concurrently, strategies to enhance power factor correction have garnered attention, especially while addressing seasonal load fluctuations and overall system efficiency improvement [15]. Moreover, the adoption of PSO in multi-objective frameworks, such as those emphasizing simultaneous optimization of cost, loss, and voltage quality, underscores its flexibility and effectiveness [4,9,16]. As a more realistic case, integrating multiple DG units may cause scalability challenges in PSO frameworks [17]. The recent advancements have led to the development of PSO variants [11,14,18] showcasing improved convergence time and solution quality. Furthermore, emerging applications of PSO extend beyond traditional DG planning contexts, encompassing renewable resource planning in microgrid systems [19], energy storage system optimization [18], electric vehicle charging station (EVCS) integration [11], and mitigation of distribution system challenges [7,8].
Alongside PSO, various heuristic and metaheuristic algorithms are also examined in the context of DG planning problems in distribution systems, aiming to enhance system performance. These include the Jaya Algorithm, the Genetic Algorithm (GA) [20], the Firefly Algorithm [20,21], the Improved Harmony Search Algorithm (IHSA) [22], the Hummingbird Algorithm [23], the Artificial Bee Colony (ABC) Algorithm [24], and Harris Hawks Optimization (HHO) [25]. Each of these methods offers different strengths in optimizing voltage profiles and minimizing power losses while integrating DGs. Hybrid techniques, such as the KHO-GWO Algorithm [26], aim to enhance network resilience during floods and earthquakes while achieving economic and operational improvements. Furthermore, the exploration of physics-based metaheuristic techniques showcases promising results. For instance, Black Hole Optimization (BHO) and the Lightning Search Algorithm (LSA) have shown potential performance in optimizing microgrid (MG) operations [27]. Moreover, the Comprehensive Teaching–Learning-Based Optimization (CTLBO) Algorithm [28] and the Shuffled Frog Leap Algorithm with the Ant Lion Optimizer (SFLA-ALO) [12] can be used to address the simultaneous sizing and siting of DGs and energy storage systems. Bilevel Optimization and Unscented Transformation (UT) methods have been proposed to enable optimal siting and sizing of flexi-renewable virtual power plants (FRVPPs) in distribution systems while minimizing expected energy not supplied [26]. Additionally, the Artificial Electric Field Algorithm (MOAEFA) consistently demonstrates superior performance in achieving optimal wind turbine placements [29]. Finally, the Hybrid Soccer League Competition–Pattern Search (SLC-PS) Algorithm is used to size and site the DGs, EVCSs, and ESSs within the distribution system [30].
The existing literature on the sizing and allocation of DGs limits discussions on integrated distributed resources, particularly hybrid renewables (solar, wind, etc.) and storage, which hinders the leveraging of their integrated sustainability and reliability benefits for the grid. Moreover, research often overlooks dynamic seasonal demand and generation scenarios. On the other hand, common metaheuristic optimization methods have limitations in addressing crucial electrical network characteristics due to their numerical bias. This limits their effectiveness because the numerical distance between two nodes in power systems might be different from the actual electrical distance.
The proposed bilevel optimization framework addresses these issues by incorporating energy storage and diversified renewable resources in the sizing module. Additionally, it introduces two algorithms to enhance PSO searching efficiency: the Connectivity-Driven Neighbor Generator and the Resistivity-Driven Candidate Generator in the sitting module to take into account the electrical characteristics during the searching process.

2. Problem Definition

Consideration of the realistic integration of diversified distributed resources and dynamic aspects of power systems in optimizing DG planning is crucial. This enables leveraging their integrated sustainability and reliability benefits. Moreover, common metaheuristic optimization methods, notably PSO, have limitations in addressing crucial electrical network characteristics due to their numerical bias. Figure 1 illustrates a radial distribution network with nodes that exhibit disparities between numerical and physical connections. Certain nodes are physically connected despite lacking direct numerical connections (e.g., 3 and 23), while others are numerically but not physically connected (e.g., 18 and 19). This presents challenges for metaheuristic algorithms such as PSO when searching for optimal solutions. As the algorithm progresses towards convergence, the difficulty arises of navigating from numerically connected nodes to physically connected ones due to limitations in step size. For instance, transitioning from node 3 to a physically close optimal node like 23 with a small step size may lead to local optima traps. Therefore, instead of strict numerical connections, node connections can cause the classical PSO search step to overlook actual node neighbors and shift towards more numerical-based neighbors during the solution search.
Furthermore, Figure 1 highlights a certain branch resistivity in this particular radial distribution network. Certain branches, such as those connecting nodes 1 and 2, 2 and 19, 3 and 23, and 6 and 26, exhibit lower resistance than others. These areas of low resistivity provide valuable guidance for PSO. By concentrating its search efforts in these regions, PSO can more effectively minimize power losses within the system. Leveraging this information enhances the algorithm’s efficiency in locating optimal solutions within the network.
A bilevel optimization module is proposed to fill the gap in the existing literature. First, the ‘sizing module’ contributes by incorporating energy storage to handle variations in renewables, providing storage dispatch, and operating as an integrated DER unit. This hybrid system can be extended to accommodate additional renewable units, making the proposed framework adaptable and scalable for evolving power system requirements. Second, the proposed framework introduces two innovative algorithms to enhance PSO’s efficiency in addressing power system challenges: the Connectivity-Driven Neighbor Generator and the Resistivity-Driven Candidate Generator.
The Connectivity-Driven Neighbor Generator analyzes electrical connectivity among nodes, generating solution candidates aligned with the grid’s physical topology. This ensures that the PSO explores spaces aligned with the electrical structure, prioritizing actual physical neighbors over numerical ones during the search. This approach prevents getting stuck at local optima, especially in later iterations where the step size is smaller. Additionally, the Resistivity-Driven Candidate Generator strategically targets low-resistivity regions, addressing resource allocation challenges and guiding the PSO toward regions with better potential for lower losses.

3. Methodology

The methodology employed in this study consists of two main modules: the Hybrid DER Sizing and the Hybrid DER Sitting Modules. The former utilizes a Mixed-Integer Linear Program (MILP) to determine the optimal sizes of renewables and BESSs, while the latter employs a network-oriented PSO to find the best locations for these resources.

3.1. Hybrid DER Sizing Module

The Hybrid DER Sizing Module aims to determine the optimal size for renewables and storage. The mathematical model is a Mixed-Integer Linear Program (MILP).
The Solar PV System has the following set of constraints. Constraint (1) defines the generated power at time t using the solar profile and sizing decision variable. Constraint (2) ensures that the solar generation can feed the load or be used to charge the battery or be curtailed. Constraints (3) and (4) set a maximum limit for each task. Constraint (5) restricts the curtailed solar power at time t to be within a fraction, γ, of the generated solar energy. Adjusting γ to 1 allows for the curtailment of the whole solar generation; however, changing it to 0 prevents curtailment. Thus, γ should be adjusted based on simulation preference.
P t p v , g e n = P t p v , p r o f i l e   S c a p       t T
P t p v , g e n = P t p v , l o a d + P t p v , c h + P t p v , c u r t a i l e d   t T
P t p v , l o a d P t d e m a n d   t T
P t p v , c h P t p v , g e n   t T
P t p v , c u r t a i l e d γ   P t p v , g e n     t T
The Wind Energy System has the following set of constraints. Constraint (6) is similar to (1) and defines the generated power at time t using the known wind profile for the location and the sizing decision variable. Constraint (7) ensures that the wind generation can feed the load or be used to charge the battery or be curtailed. Constraints (8) and (9) set a maximum limit for each task. Constraint (10) acts as a constraint, restraining curtailed wind power at time t to be within a fraction, γ, of the total generated wind power. Adjusting γ to 1 allows curtailment of the whole wind generation; however, changing it to 0 prevents curtailment. Thus, γ should be adjusted based on simulation preference.
P t w , g e n = P t w , p r o f i l e   W c a p   t T
P t w , g e n = P t w , l o a d + P t w , c h + P t w , c u r t a i l e d   t T
P t w , l o a d P t d e m a n d   t T
P t w , c h P t w , g e n   t T
P t w , c u r t a i l e d γ   P t w , g e n   t T
The Battery Energy Storage System (BESS) plays a role in managing temporal supply and demand balance. Firstly, Constraint (11) tracks the state of energy (SOE) at time t by considering the previous state and the charging and discharging power, incorporating efficiencies μ c and μ d . The state of energy here is different from the state of charge. It tracks the amount of energy stored in the BESS. By doing so, the sizing of the BESS becomes a decision variable reflected as the maximum energy capacity, E c a p , in Constraint (12). The depth of discharge can also be modeled as the minimum limit for the state of energy. Constraint (13) limits the charging power by the available energy capacity in the ESS, while Constraint (14) models the C-rate of the BESS by introducing a maximum limit on charging power. For example, an LFP-type BESS has a C-rate of 1, where the maximum charging power can be as much as E c a p ; however, a flow battery storage has a C-rate of ¼, where the maximum charging power is at most one-fourth of E c a p . Constraints (14) and (15) are similar to (12) and (13) but from the perspective of discharging action. Constraints (17) and (18) prevent the simultaneous charging and discharging event at time t by introducing a binary decision variable, u t . Lastly, the model assumes that the BESS can only be charged from either the solar PV or the wind, as given in Constraint (19).
s o e t = s o e t 1 + μ c   P t c h t 1 μ d P t d c h t   t T
α m i n   E c a p s o e t E c a p   t T
P t c h E c a p s o e t 1   t T
P t c h β   E c a p   t T
P t d c h s o e t 1   t T
P t d c h β   E c a p   t T
P t c h M   u t   t T
P t d c h M 1 u t   t T
P t c h = P t P V , c h + P t w , c h   t T
After the asset modeling, the next step is maintaining the supply and demand balance at each time step. The supply side includes power from the grid, solar generation, wind generation, and BESS discharge. Meanwhile, the demand side consists of the hourly demand, BESS charging from solar and wind, and curtailments of solar and wind. These constraints contribute to a comprehensive formulation defining the demand components, including solar to load, wind to load, grid power, and BESS hourly discharge. This systematic approach ensures a balance, guiding the system towards optimal resource utilization.
P t g r i d + P t p v , g e n + P t w , g e n + P t d c h = P t d e m a n d + P t p v , c h + P t w , c h + P t p v , c u r t a i l e d + P t w , c u r t a i l e d   t T
P t d e m a n d = P t p v , l o a d + P t w , l o a d + P t g r i d + P t d c h   t T
The model’s objective function minimizes the potential investment’s combined capital expenditure (CAPEX) and operational expenditure (OPEX). Operational expenditure (OPEX), in (23), is calculated as the sum of the grid power consumption ( P t g r i d ) multiplied by the corresponding coefficient ( a t 1 ) for each time period (t) within the optimization horizon (T). The coefficient ( a t 1 ) accounts for the cost associated with grid power consumption at each time period.
Capital expenditure (CAPEX), in (24), is the sum of the initial investment costs related to the solar, energy storage, and wind systems. The overnight costs ( C S , C E , and C W ) represent the upfront capital costs for installing each system type. These costs are then multiplied by the installed capacity of each system ( S c a p , E c a p , and W c a p ) and the scaled lifetime coefficient ( L ) associated with each system type. The time factor is incorporated by considering the number of days ( d ) in the 1-year optimization period (365 days). This enables the simulations to be performed in a shorter time, for computational simplicity, especially when introducing representative days for the whole 1-year horizon.
M i n i m i z e       O P E X + C A P E X
O P E X = t a t 1     P t g r i d   t T
C A P E X = d 365   C s   S c a p   L s + C e   E c a p   L e + C w   W c a p   L w   t T

3.2. Hybrid DER Sitting Module

PSO represents an optimization method for the DER allocation problem. This technique operates on a swarm intelligence principle, where individuals (particles) iteratively navigate a solution space, guided by their own best positions and the collective best positions found by the swarm. PSO’s strength lies in its simplicity and ability to explore large solution spaces efficiently. The method’s working mechanism involves particles adjusting their positions based on their own historical best positions and the global best position found by the swarm, allowing for efficient convergence toward optimal solutions.
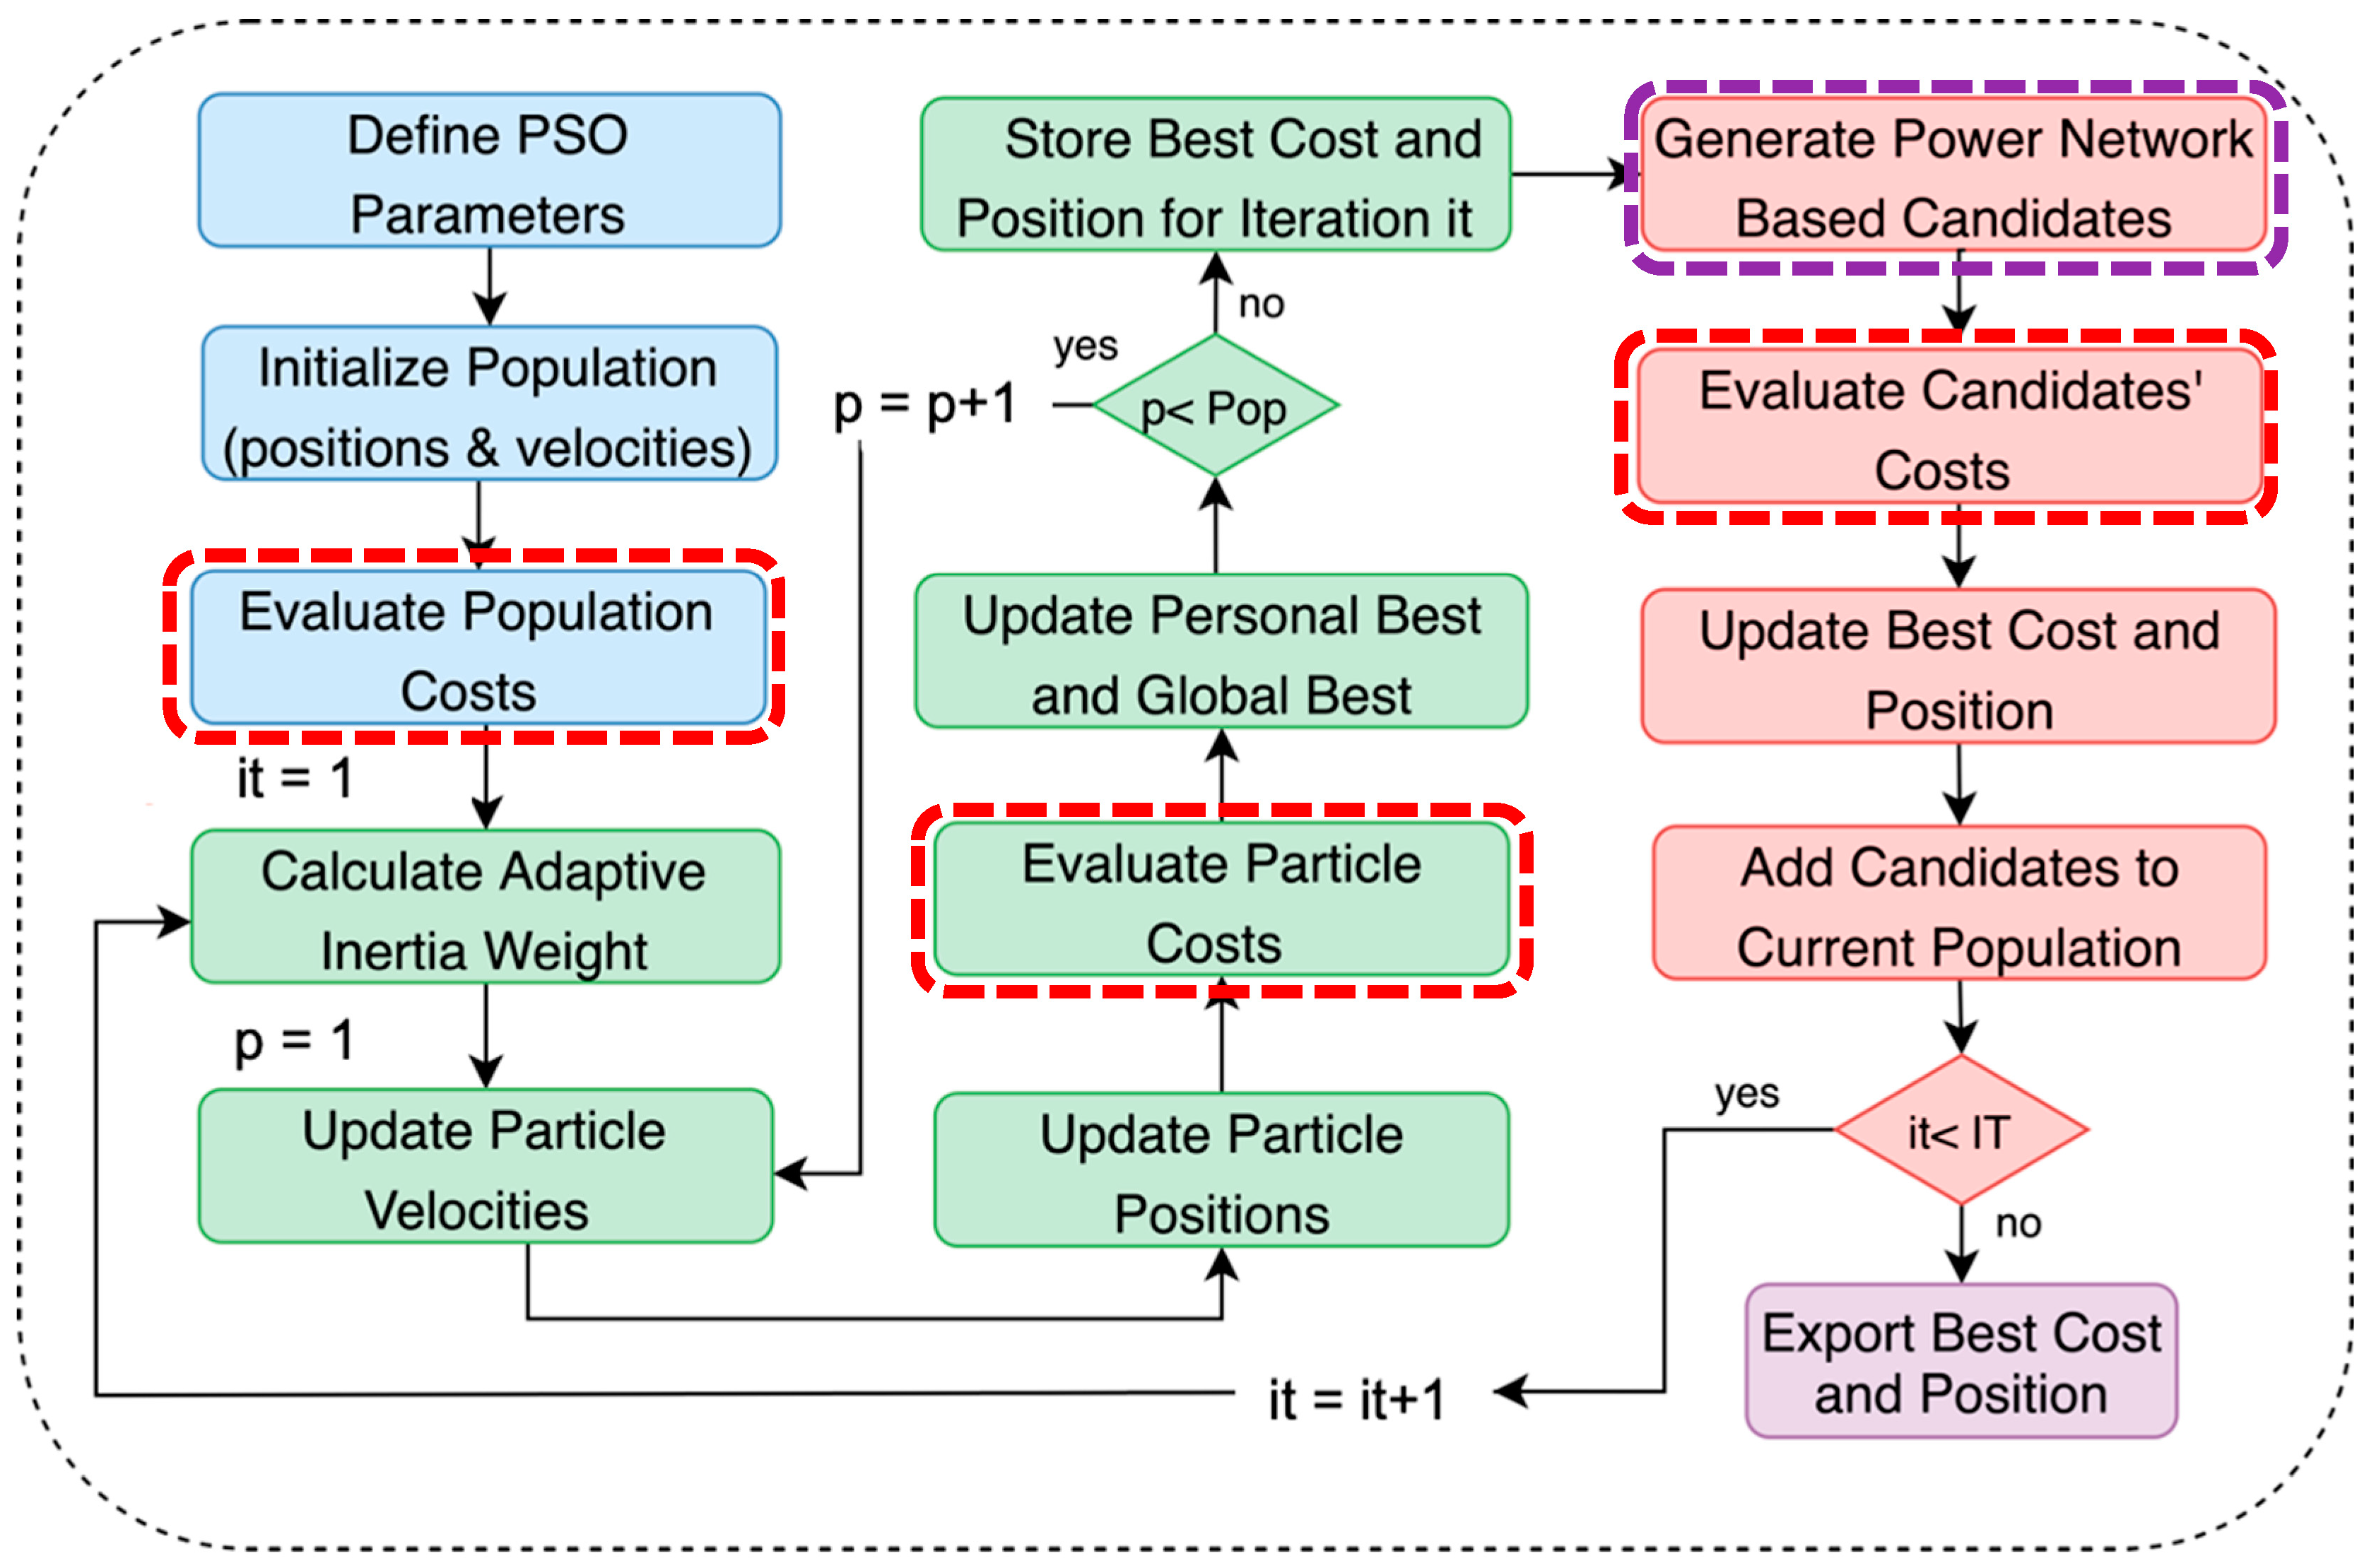
The improved, network-oriented Particle Swarm Optimization algorithm is illustrated in Figure 2. A population of potential solutions is initialized randomly, including their positions and velocities. This population comprises renewable units and BESS allocation within the distribution network. For each initialized particle, the fitness function value is evaluated, indicating its overall quality with respect to the optimization objective. A network validation and cost function module, described in detail later, has been developed to assess power loss costs and costs related to power flow operational limits.
The particles then undergo iterative updates. Each particle adjusts its position within the solution space based on its previous best position and the best position found by any particle in the population. The PSO algorithm proceeds through multiple iterations, seeking to converge toward a solution that balances the trade-offs between costs, constraints, and the allocation of DER components across the network.
Convergence behavior is shaped by the adaptive parameters; the inertia weight, which determines the trade-off between exploration and exploitation; and, crucially, the diversity among the solutions.
The parameter k in the adaptive weight equation is crucial in PSO, determining the rate of weight reduction during optimization. A higher k promotes exploration, while a lower k emphasizes exploitation. Choosing the right k balance is essential for efficient convergence and problem-specific optimization. The equation of the adaptive inertia weight is shown in (25).
w a d a p t i v e = max w f i n a l , w i n i t i a l e x p k i t I T
Updating the particle velocities with the new adaptive inertia weight takes place as in (26).
V e l p a r t i c l e = w a d a p t i v e V e l p a r t i c l e + c 1 r a n d P o s p a r t i c l e , b e s t P o s p a r t i c l e + c 2 r a n d P o s g l o b a l , b e s t P s o p a r t i c l e
A particle’s position update occurs based on the current position and the new velocity calculated previously, as shown in (27).
P o s p a r t i c l e = P o s p a r t i c l e + V e l p a r t i c l e
The conventional application of PSO in power and energy system planning tends to exhibit specific drawbacks. It often showcases a numerical bias; it emphasizes numerical optimization over crucial electrical aspects intrinsic to the power grid. This narrow focus might lead to solutions that need more efficiency in complex electrical systems. Moreover, when confronted with large-scale problems, conventional PSO encounters scalability challenges, impeding computational efficiency and hindering its applicability in real-world scenarios.
For the basic PSO algorithm process (shown in green in Figure 2), additional steps (the red boxes) enhance its effectiveness in generating network-based candidates. These steps allow PSO to better explore the complexities of the power network. During each iteration, PSO evaluates the network topology to identify potential solution candidates that meet its objectives. If these candidates outperform existing solutions, PSO incorporates them into its search process. Otherwise, they are retained for further exploration. To generate network-based candidates, PSO uses two specialized algorithms: the Connectivity-Driven Neighbor Generator and the Resistivity-Driven Neighbor Generator. These algorithms leverage the power network’s structure to enrich PSO’s search strategy and improve the discovery of optimal solutions for distributed energy resource allocation.

3.2.1. Connectivity-Driven Neighbor Generator

The Connectivity-Driven Neighbor Generator, a core algorithm in the proposed framework, operates by examining the electrical connectivity among nodes in the power grid. By analyzing the network topology, it generates solution candidates that align with the physical nodal connections within the grid. This ensures that the PSO algorithm explores solution spaces that are aligned with the grid’s electrical structure, addressing a critical limitation of conventional PSO, which tends to overlook the profound impact of the physical node connections. The provided pseudocode demonstrates the implementation of the Connectivity-Driven Neighbor Generator. It begins by importing the branch data and then creates a connectivity matrix representing physical node connections. When utilized within the PSO process, the algorithm provides actual neighbor candidates for the current solution. As a result, this algorithm significantly enhances the PSO’s efficiency in navigating the search space, enabling it to yield better solutions (Algorithm 1).
Algorithm 1: Connectivity-Driven Neighbor Generator
Energies 17 02270 i001

3.2.2. Resistivity-Driven Candidate Generator

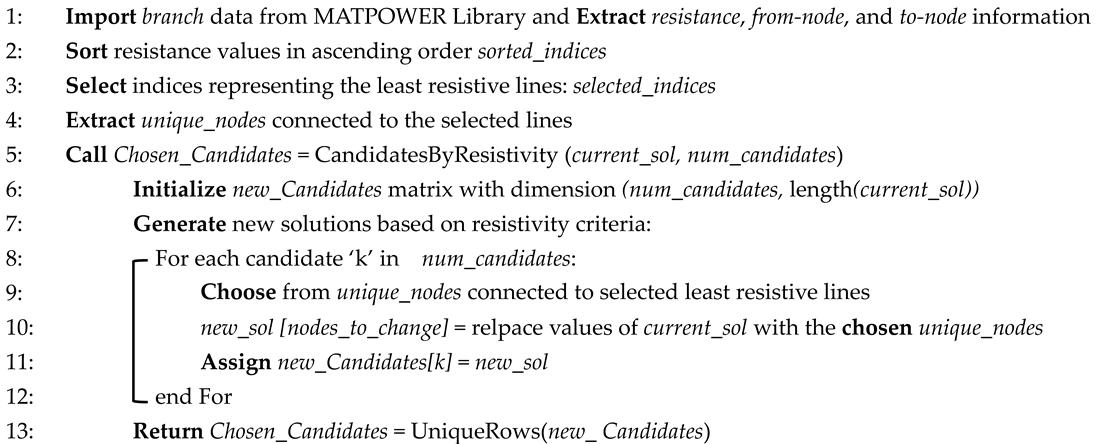
The Resistivity-Driven Candidate Generation algorithm addresses resource allocation challenges by targeting areas with lower resistivity indicative of optimal opportunities within the power grid. This algorithm initially identifies the least resistive lines, focusing on the lowest 25% based on resistivity values, and extracts unique nodes associated with these lines.
When generating multiple candidate solutions, shown in its pseudocode, the algorithm randomly selects nodes from this subset, promoting diversification while concentrating on areas favorable for optimal resource deployment. By introducing nodes from low-resistivity areas into the candidate solutions, the algorithm guides the PSO towards regions where the electrical properties suggest better potential for resource allocation. This strategy aligns to address PSO’s limitations related to purely numerical optimizations, providing a more directed and contextually informed search within the power network (Algorithm 2).
Algorithm 2: Resistivity-Driven Candidate Generator
Energies 17 02270 i002

3.2.3. Network Validation and Cost Function

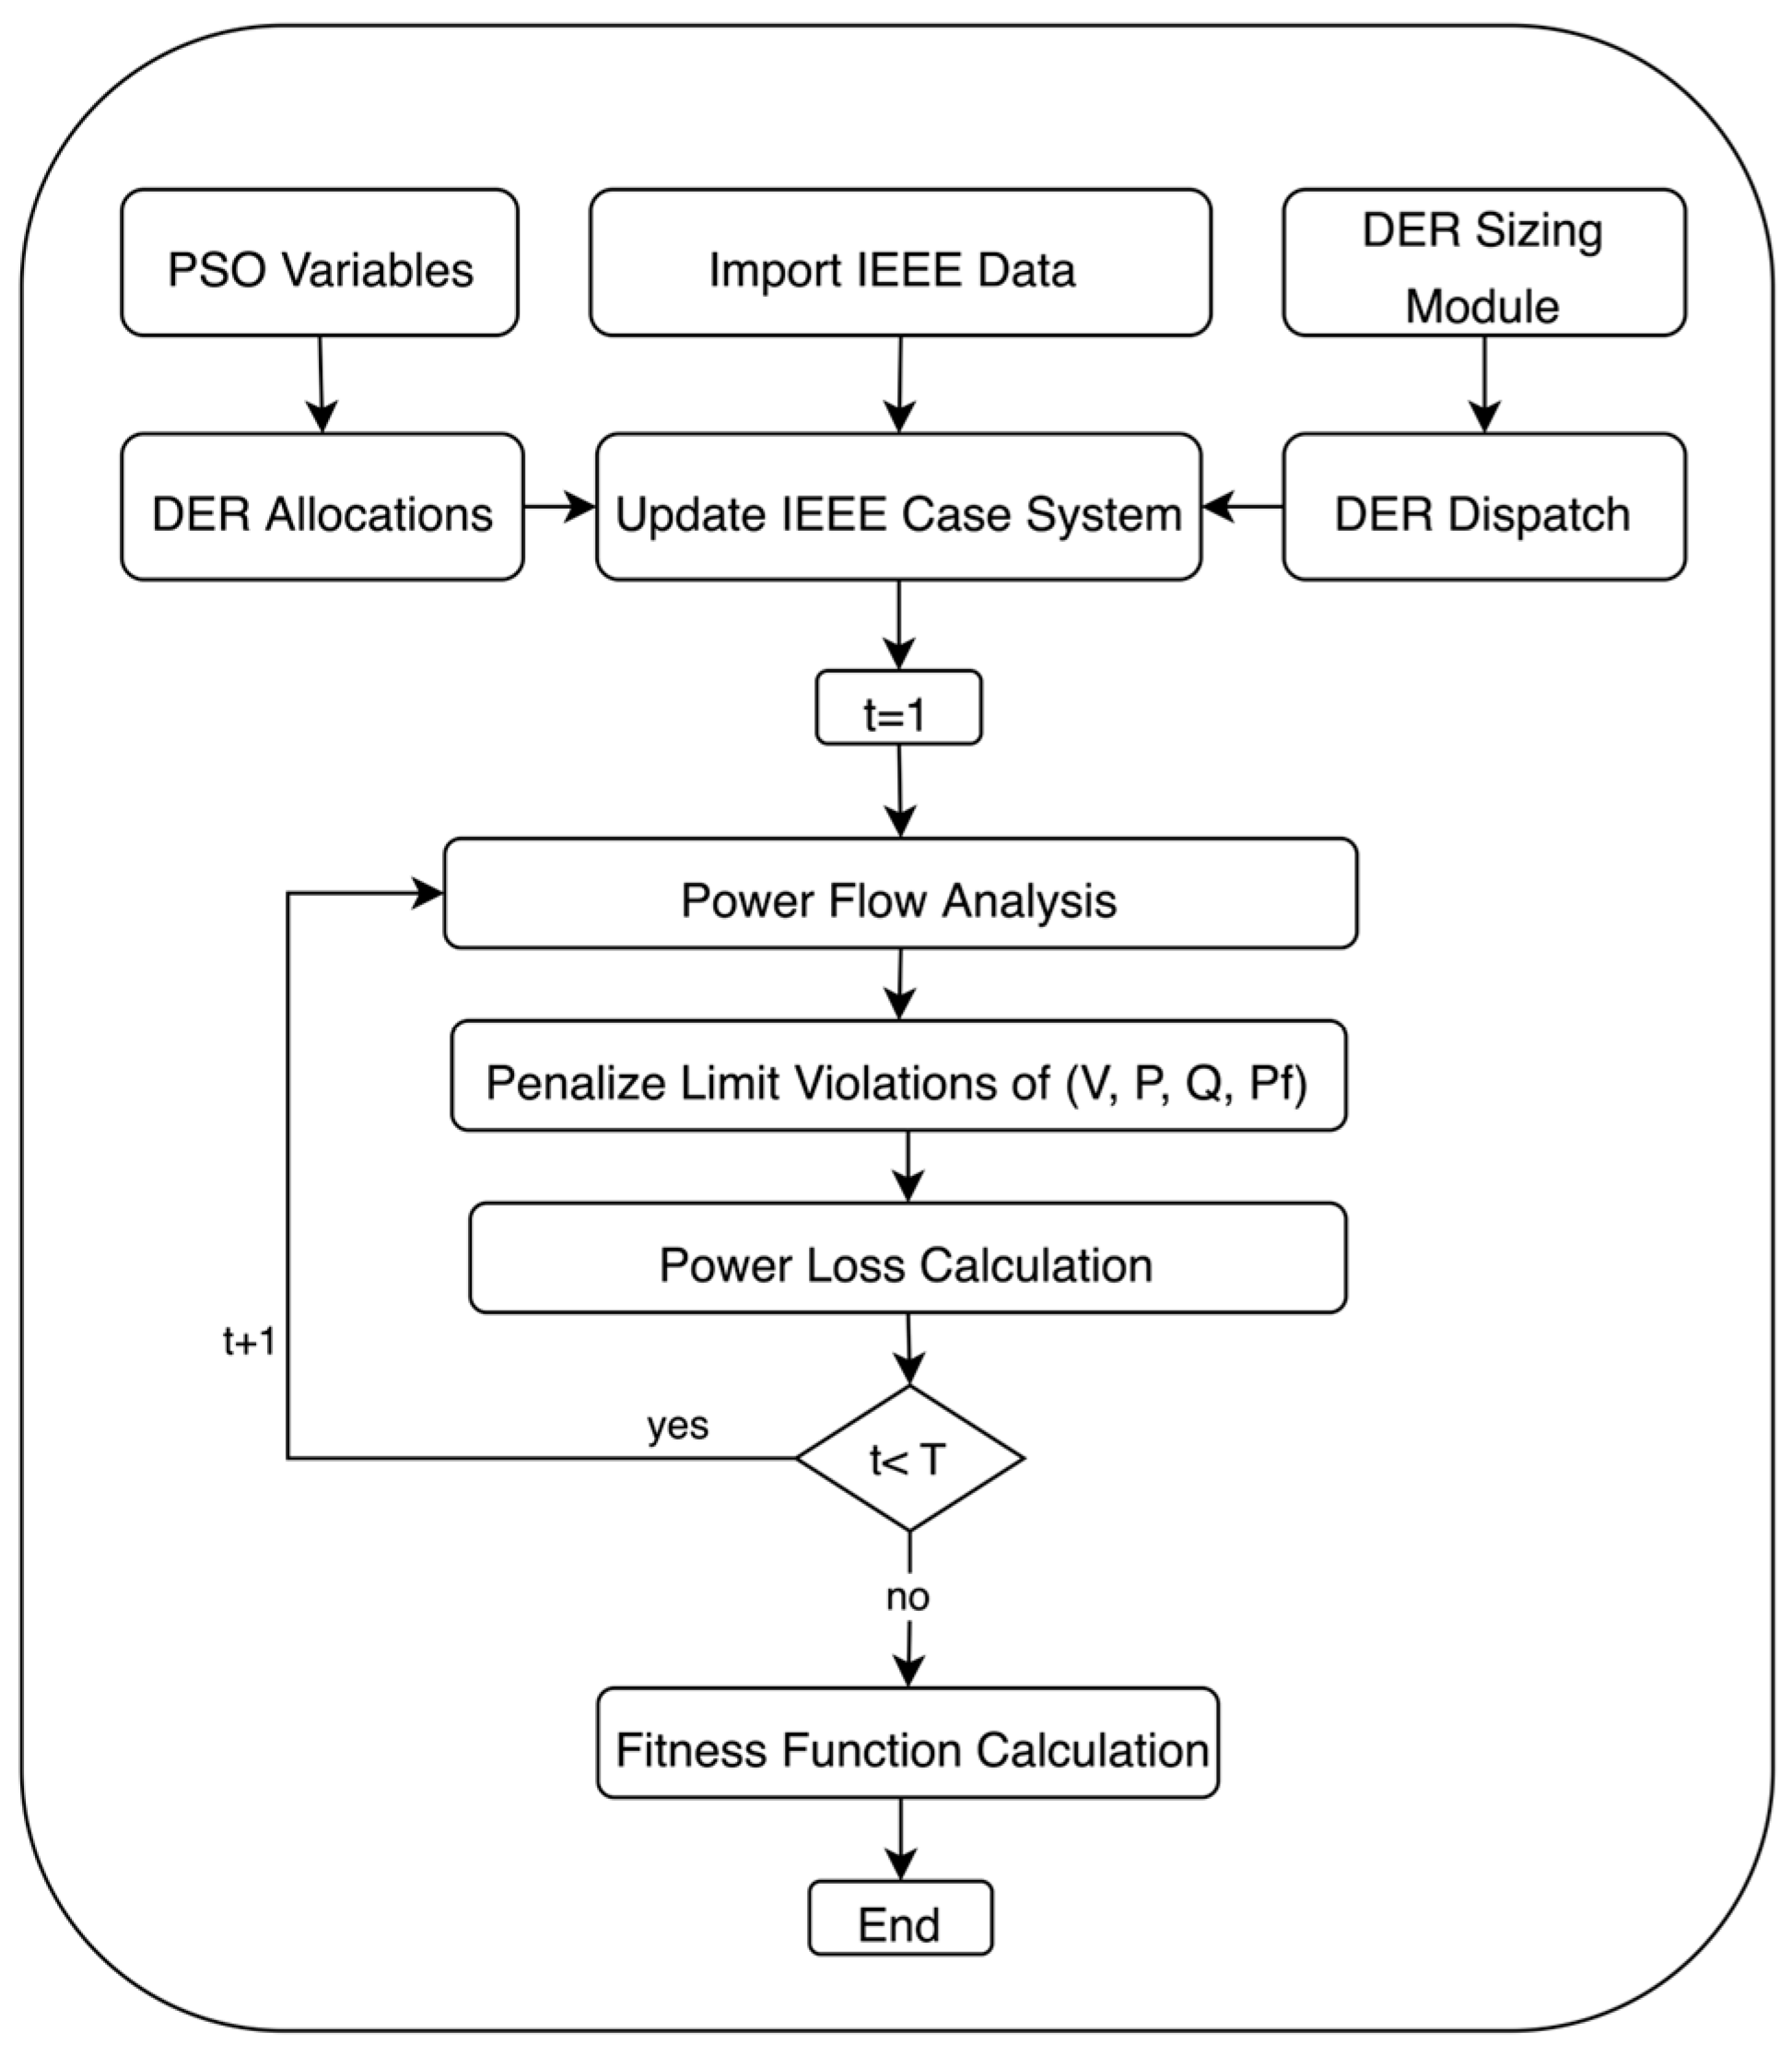
The intermittent nature of renewable generation and the varying charging and discharging patterns of batteries can introduce fluctuations and imbalances in the system. The Network Validation module and Cost Function Calculation are necessary when allocating battery and renewable systems to ensure operational safety, optimize hybrid system placement, maintain grid stability, and comply with regulatory standards. The module enables the effective integration of hybrid system technologies while preserving the reliability and performance of the distribution grid. Distribution systems have physical and operational limitations that must be considered to ensure safe and reliable operation. These constraints include voltage limits, thermal limits of power lines and transformers, and power flow balance requirements. The detailed process of the module is shown in Figure 3. Given the PSO control variables, which encompass the allocation decisions, load data, and results from the sizing module, the function dynamically configures the IEEE network parameters for each time step. It updates the generator allocation for renewable units and storage, demands data, then performs power flow simulations to assess the network’s behavior. It calculates penalty factors for violations such as slack bus power, bus voltage, reactive power generation, and line capacity. These penalties are used to evaluate the quality of the allocation solutions. Finally, Network Validation accumulates penalties across all time steps, providing a comprehensive measure of the network’s performance. These penalties are used to evaluate the quality of the allocation solutions. Finally, Network Validation accumulates penalties across all time steps, providing a comprehensive measure of the network’s performance. These penalties are used to evaluate the quality of the allocation solutions. Finally, Network Validation accumulates penalties across all time steps, providing a comprehensive measure of the network’s performance. These penalties are used to evaluate the quality of the allocation solutions. Finally, Network Validation accumulates penalties across all time steps, providing a comprehensive measure of the network’s performance.
The resulting fitness value and other vital information are then used to guide the optimization process, ensuring that the proposed methods lead to efficient and reliable hybrid DER integration.

3.2.4. Power Flow Analysis

Power flow analysis is a vital component of this distribution-level hybrid system planning. It is integral to the Network Validation and Cost Function Calculation, optimizing renewable and BESS unit allocation. Power flow ensures technical reliability, economic viability, and network constraint compliance throughout the evaluation. Power flow analysis yields insights into voltage, power, and constraint respect. Violations trigger penalties to quantify their impacts. It also calculates power losses to minimize them, enhancing system efficiency. MATPOWER [31] is used to execute power flow equations.

4. Case Studies

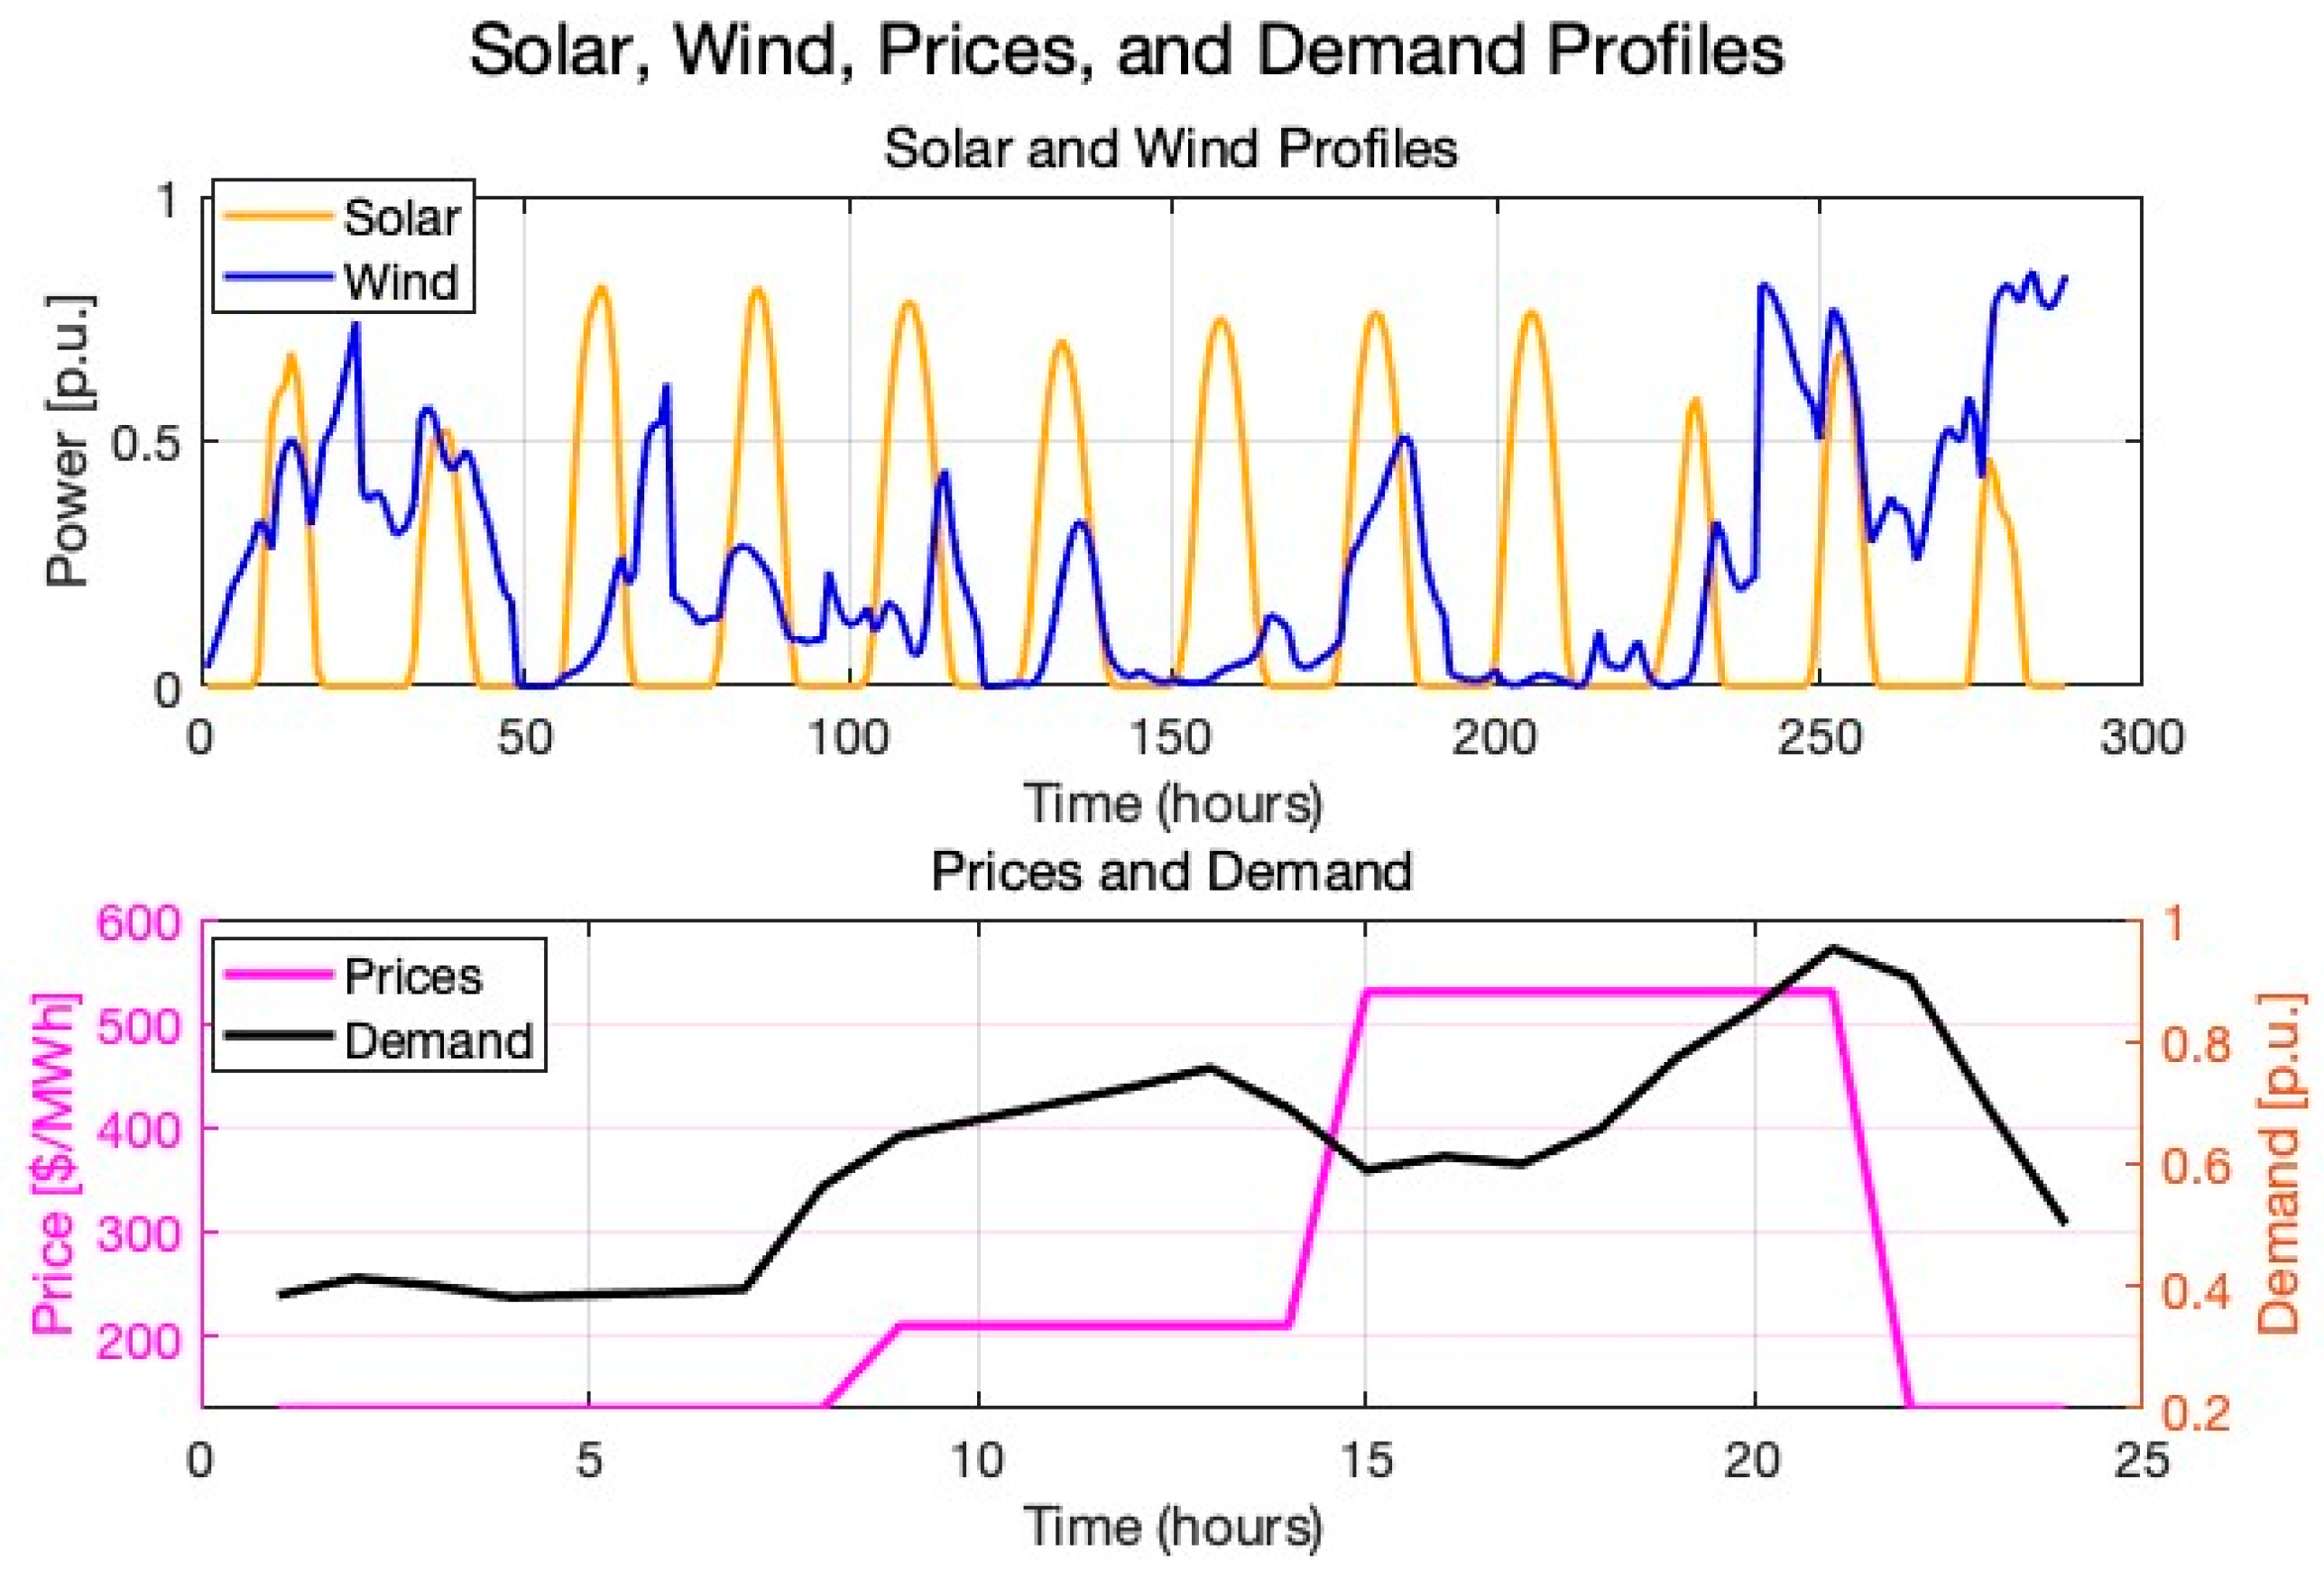
The simulations utilized a comprehensive dataset of 12 representative days of a year to validate the methods proposed in previous sections. Figure 4 illustrates the time series input data used in the case studies. The data included time series electricity prices, specifically Time of Use (TOU) prices, which are crucial for capturing dynamic price variations throughout the day.
Additionally, an hourly demand profile expressed in per units was incorporated, as illustrated in the simulations. This demand profile was scaled by the nodal peak demand values provided by IEEE cases, enabling a time-varying demand representation. The hourly solar PV and wind profiles, expressed in per units, for the specific site were utilized. These renewable generation profiles were employed to identify the optimal sizes of solar PV and wind systems in MW based on the mathematical model proposed in previous sections.
Financial and technical assumptions extracted from [32] were incorporated (and are given in Table 1) to ensure the feasibility and applicability of the methods in real-world scenarios. These assumptions encompassed overnight capital costs, lifetimes, and technical details of renewable systems and BESSs.
Three different networks, the IEEE 33-bus, the IEEE 69-bus [31], and the Norwegian medium voltage distribution network [33], were used to assess the practicality and effectiveness of the planning and allocation strategies proposed in previous sections. Utilizing data from these networks, different case studies were implemented and simulated in MATLAB to assess the effectiveness of the strategy utilizing network-oriented PSO configurations. The detailed parameters of the designed cases are summarized in Table 2.

5. Simulation Results and Discussion

5.1. Hybrid DER Sizing Simulations

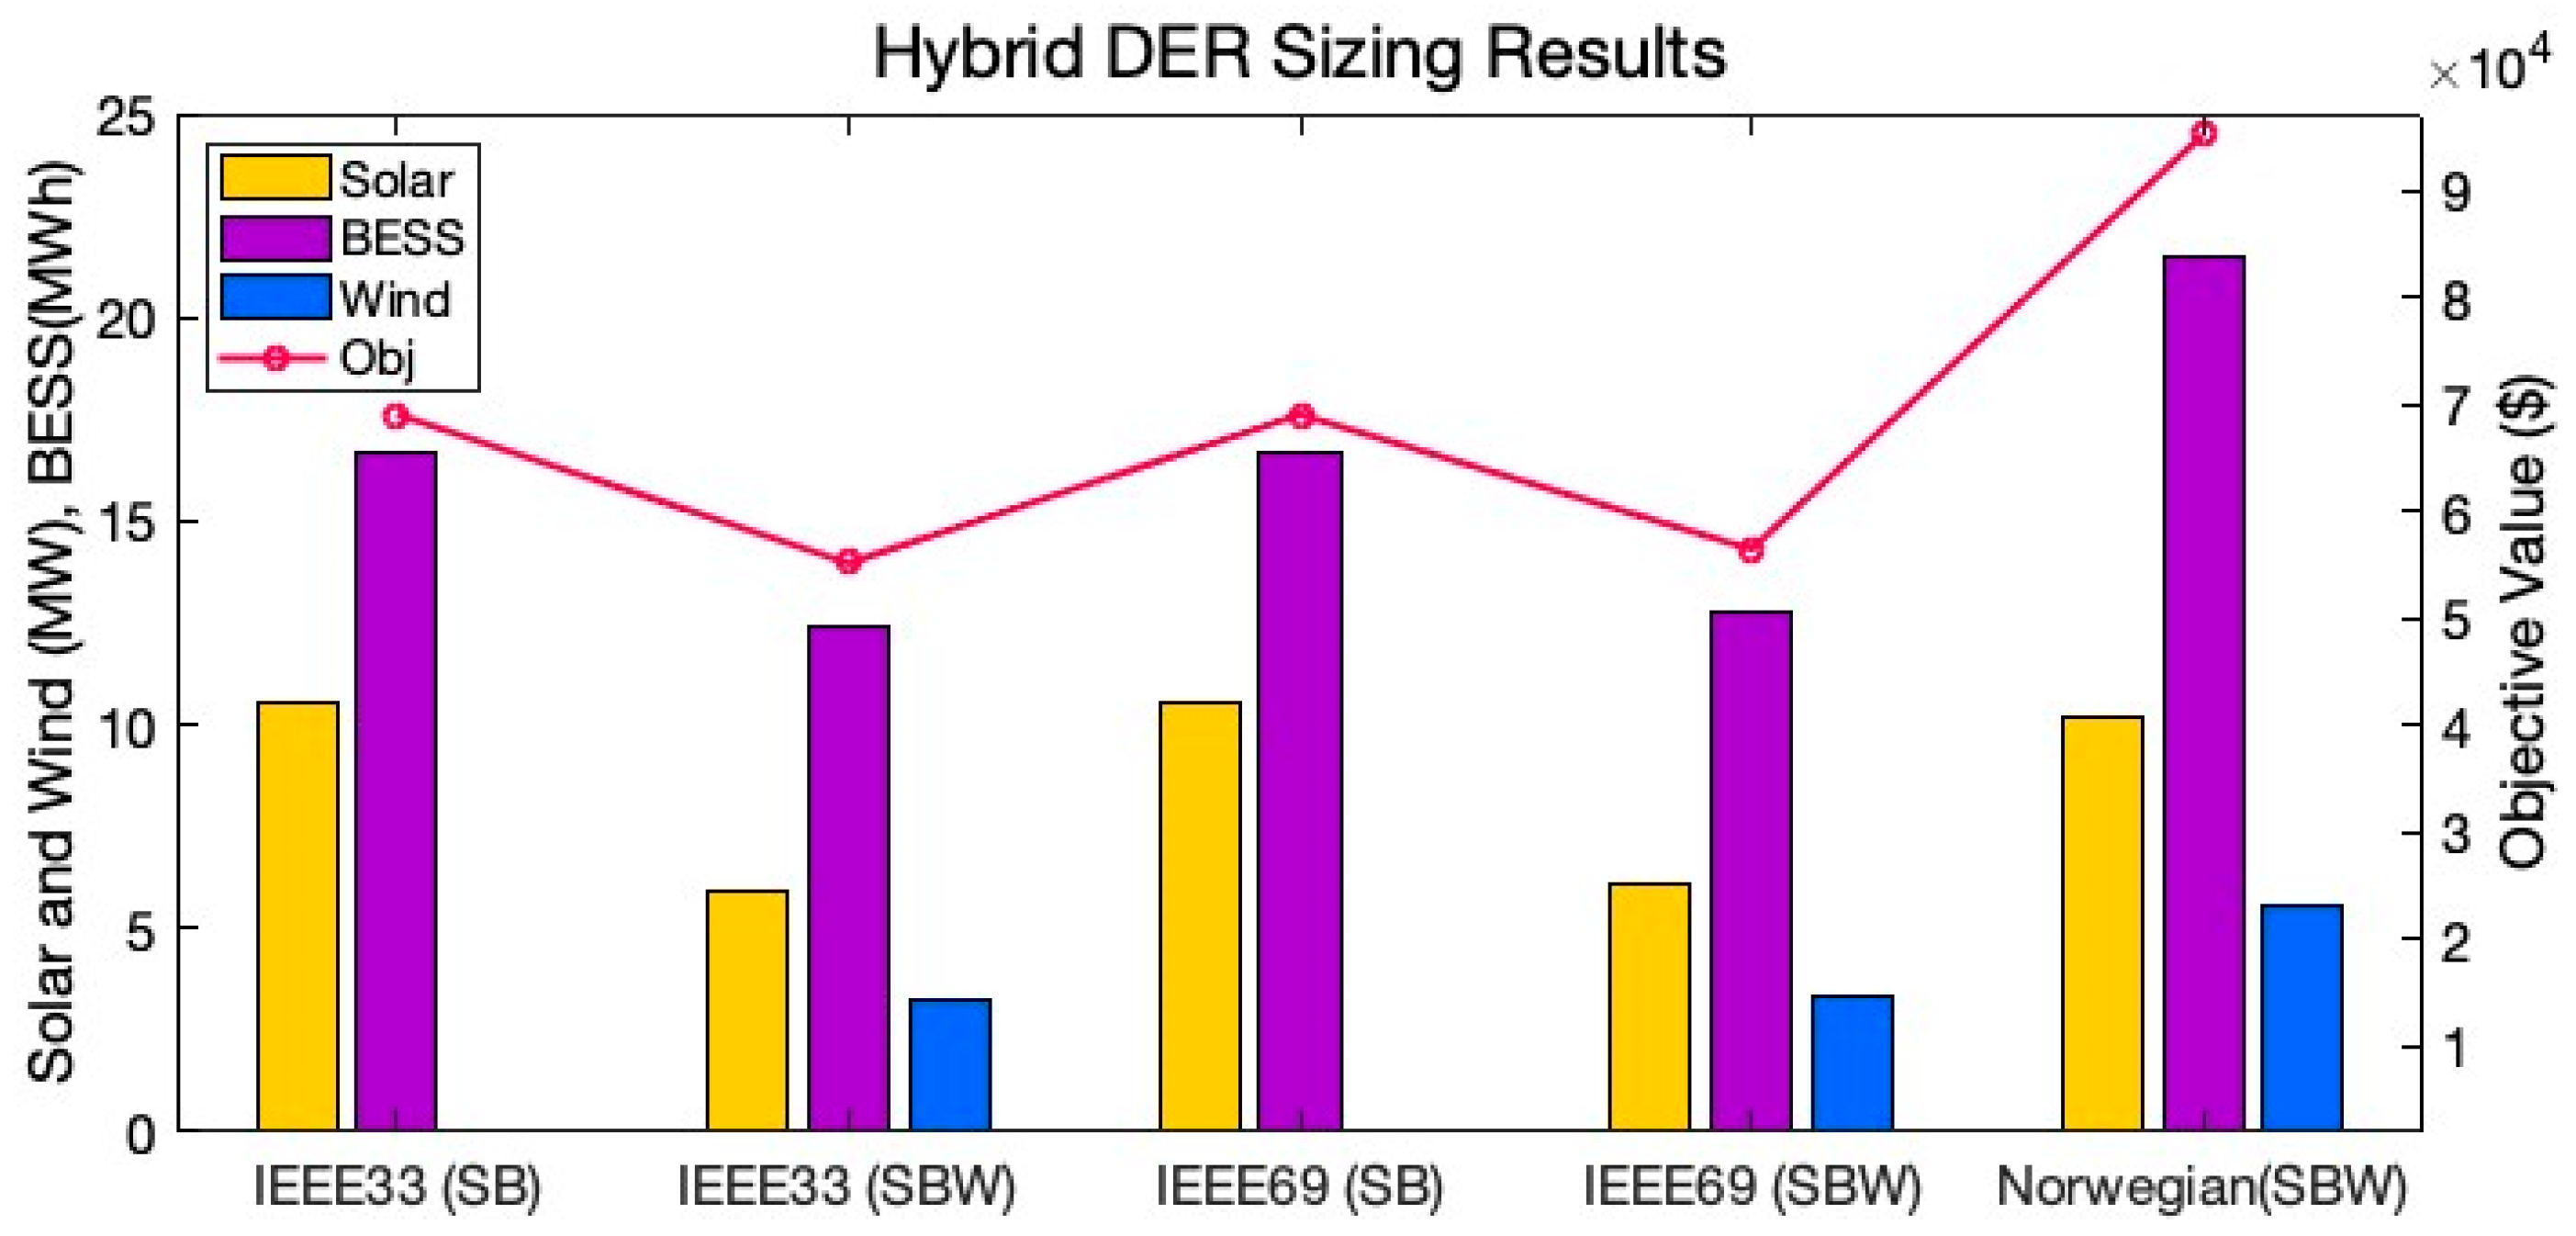
In evaluating DER sizing across the different case studies, IEEE33, IEEE69, and the Norwegian distribution system, significant findings are highlighted in Figure 5.
The Solar + Battery case yields an objective function of USD 69,089 in both the IEEE33 and IEEE69 systems, indicating an optimal sizing with a 10.56 MWp PV system and a 16.68 MWh (4 h) BESS. In contrast, the Solar + Wind + BESS case demonstrates a reduced objective function value of USD 55,209 in IEEE 33 and USD 56,504 in IEEE 69, with optimal sizes of 6.06 MWp for the PV array, 3.32 MWp for the wind system, and 12.73 MWh (4 h) for the BESS. In the Norwegian scenario, the Solar + Wind + BESS case achieves an objective function value of USD 95,218.30, with DER sizes of 10.22 MW, 5.6 MW, and 21,45 MWh for solar, wind, and the BESS, respectively. Therefore, the more diversified resources with the BESS demonstrate superior economic efficiency.

Self-Sufficiency Ratio

The Self-Sufficiency Ratio (SSR) [34] quantifies the extent to which a system relies on locally generated renewable energy and stored energy reserves to meet its energy demand over the system’s time horizon. Comprising solar PV, wind, and battery discharge, the SSR encapsulates the collective impact of DER sources on reducing the dependence of the load on the grid. Mathematically, SSR is calculated as the ratio of the sum of renewable and battery discharge energies to the total energy demand over the simulation horizon. The SSR formula is expressed as in (28):
S S R = t P t p v , l o a d + P t w , l o a d + P t d c h t i P L i , t 100
As illustrated in Table 3, despite a 68.60% SSR, the optimal size of assets exhibits a renewable curtailment of ~159 MWh. This solution achieves a lower renewable curtailment than the previous case with ~62 MWh for the simulation horizon (12 days). Lower curtailment also increases the SSR to 78.59% for the latter case. Thus, diversified renewables with the BESS enhanced self-sufficiency and optimized renewable energy utilization.
Figure 6a shows how the total load is satisfied at each time step. The supply side includes solar, wind, BESS discharge, and power grid contributions. Generally, the BESS is used when there is less renewable availability. Furthermore, grid imports exist when there is a need for more local resources, such as renewables and BESS discharge. Figure 6b illustrates the BESS dispatch and state of energy.

5.2. Hybrid DER Sitting Simulations

5.2.1. Computational Performance of PSO

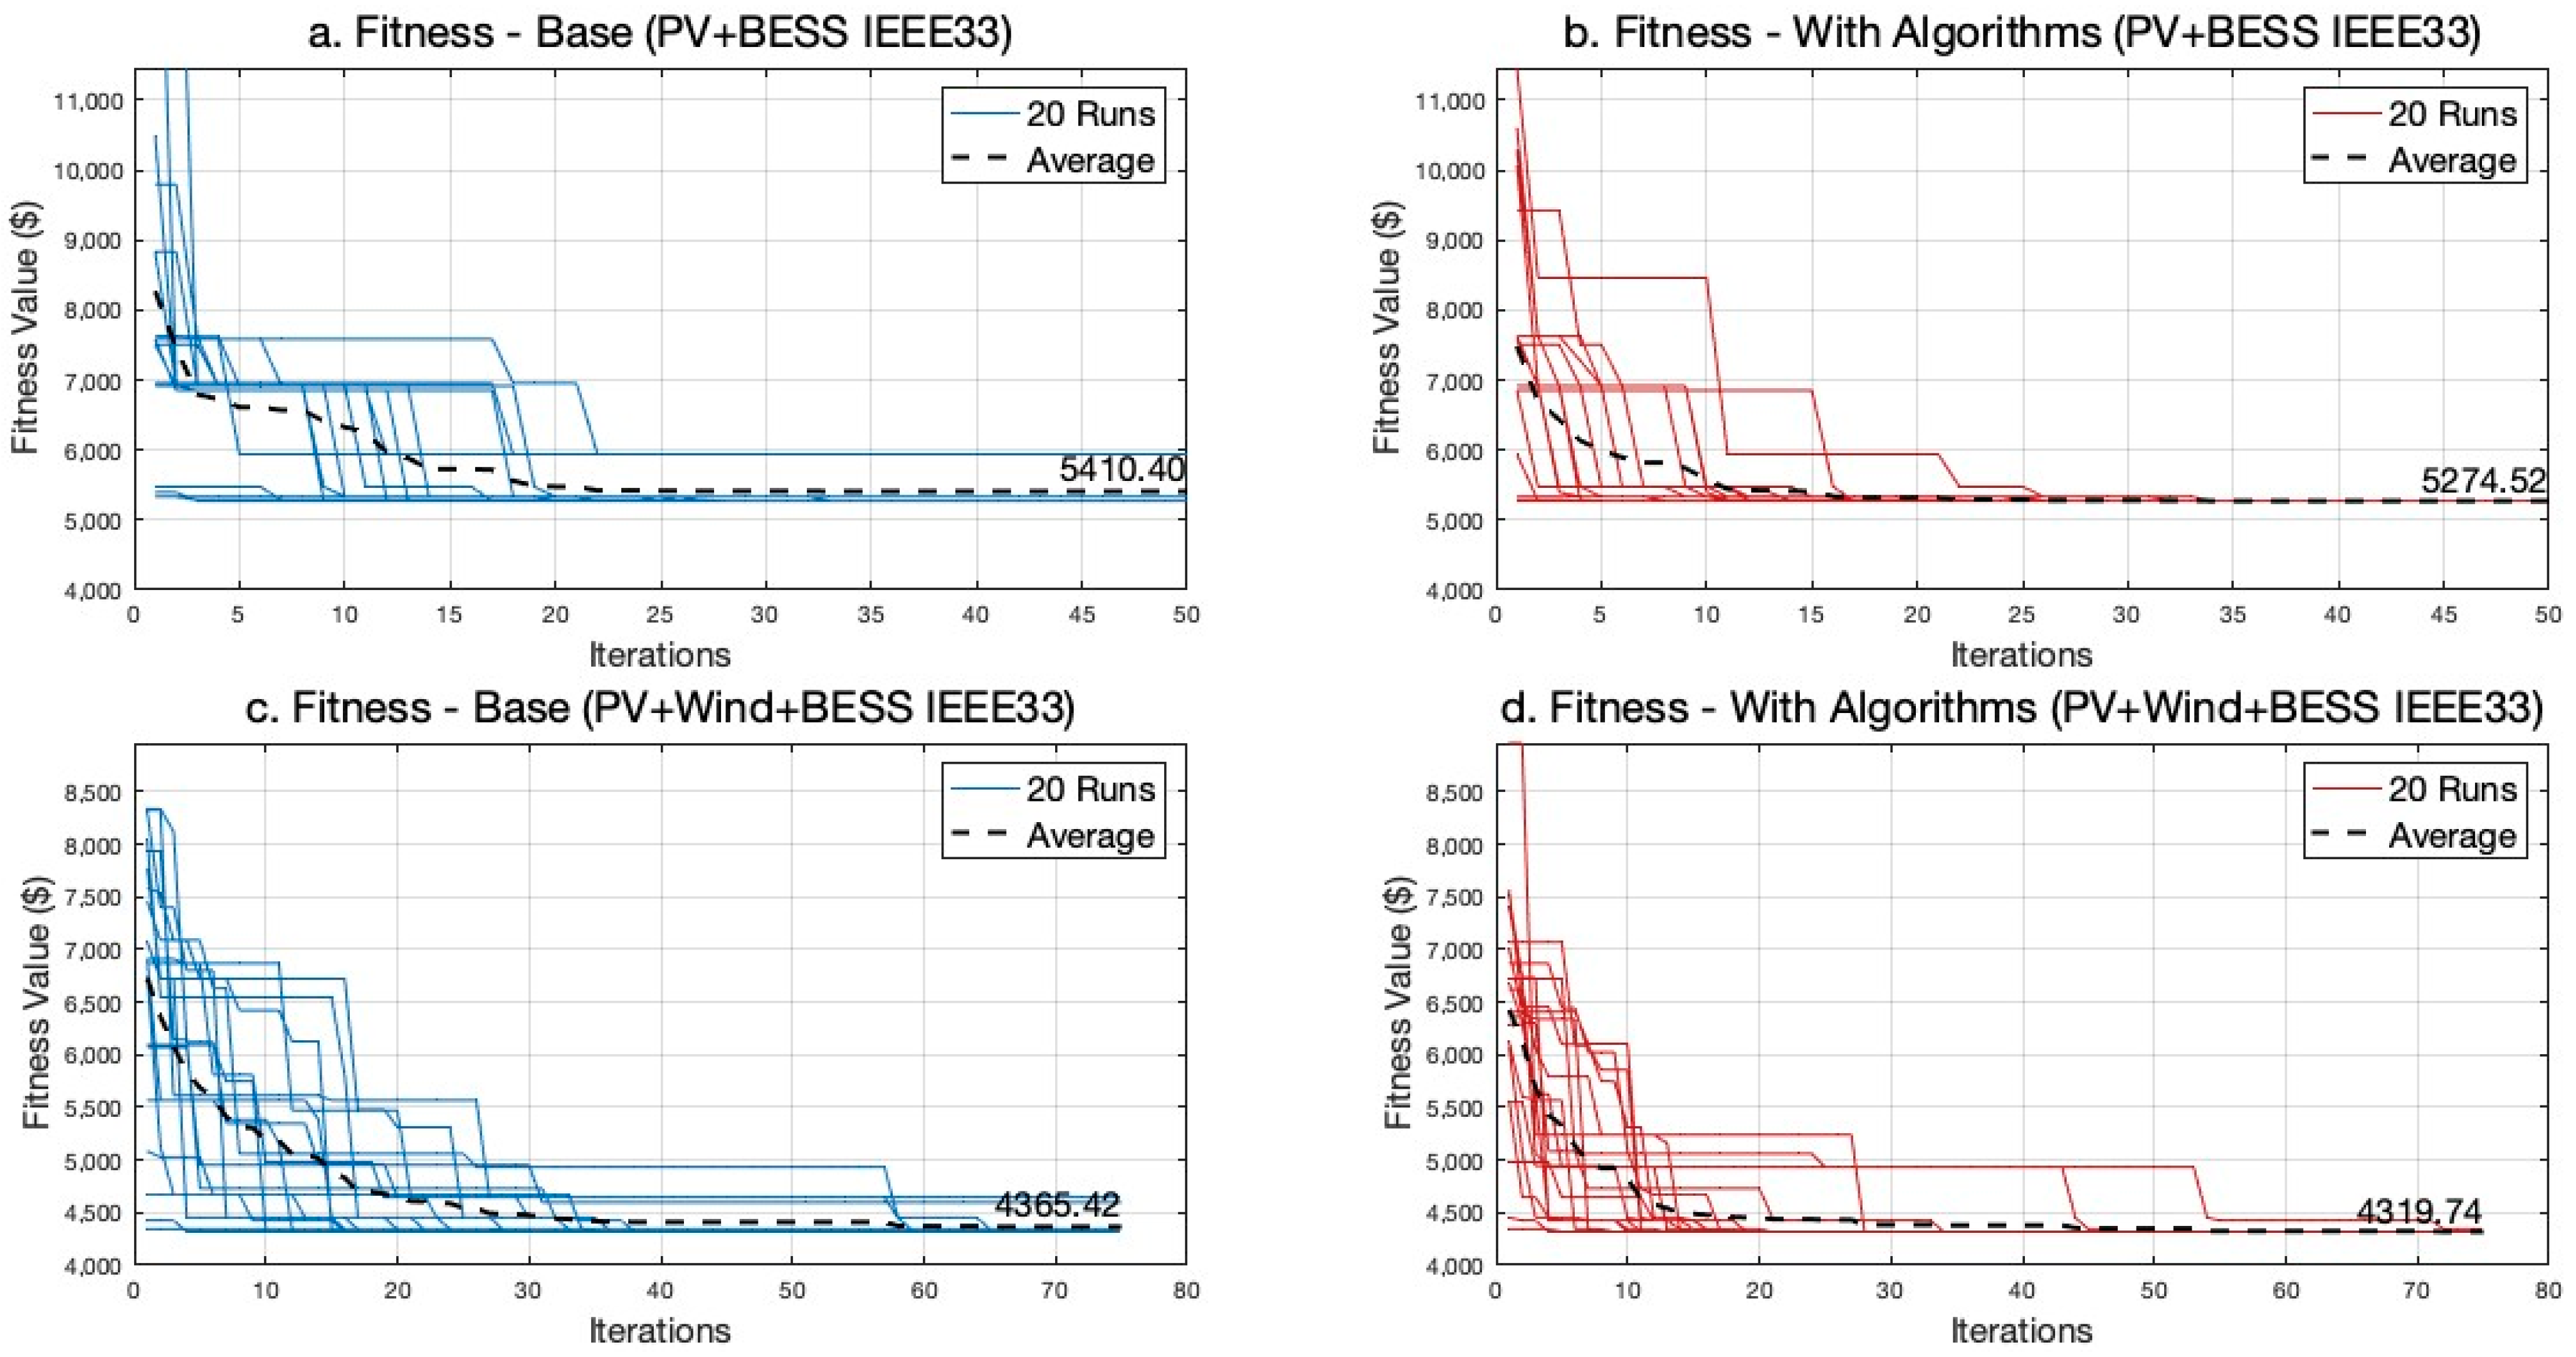
Ten simulations are presented in this section, including IEEE33, IEEE69, and the Norwegian 124 bus systems. In Figure 7a, the PSO without network-oriented algorithms is applied to the IEEE33 bus case for solar PV and BESS, resulting in different convergence values for some runs. The average final fitness value across the 20 runs is USD 5410.4. Figure 7b introduces network-oriented algorithms, showing improved convergence as all runs reach the same fitness value. The average fitness value for these runs is USD 5274.5. Comparing the two cases highlights that incorporating electrical-related methods leads to a global optimal solution with a lower average fitness value, emphasizing the significance of integrating domain-specific knowledge in enhancing PSO efficiency for complex power optimization tasks.
The fitness value results from Figure 7c,d show the optimization performance of a basic PSO algorithm and an enhanced version incorporating network-oriented algorithms in the IEEE33 bus case with three distributed resources—solar PV, wind, and BESS. The basic PSO algorithm without electrical methods faces challenges in terms of the increased complexity, resulting in different convergence values with an average final fitness value of USD 4365.4 after 75 iterations.
In contrast, Figure 7d illustrates that considering the network-oriented algorithms in the PSO searching process facilitates consistent convergence of all 20 runs to the same fitness value. It ensures improved exploration and convergence in the face of increased complexity. The average fitness value for these runs is notably lower at USD 4319.7. This comparison underscores the significance of power-related algorithms in enhancing PSO efficiency, particularly in scenarios involving multiple distributed resources, leading to reduced power losses and achieving optimal solutions in complex power system optimization.
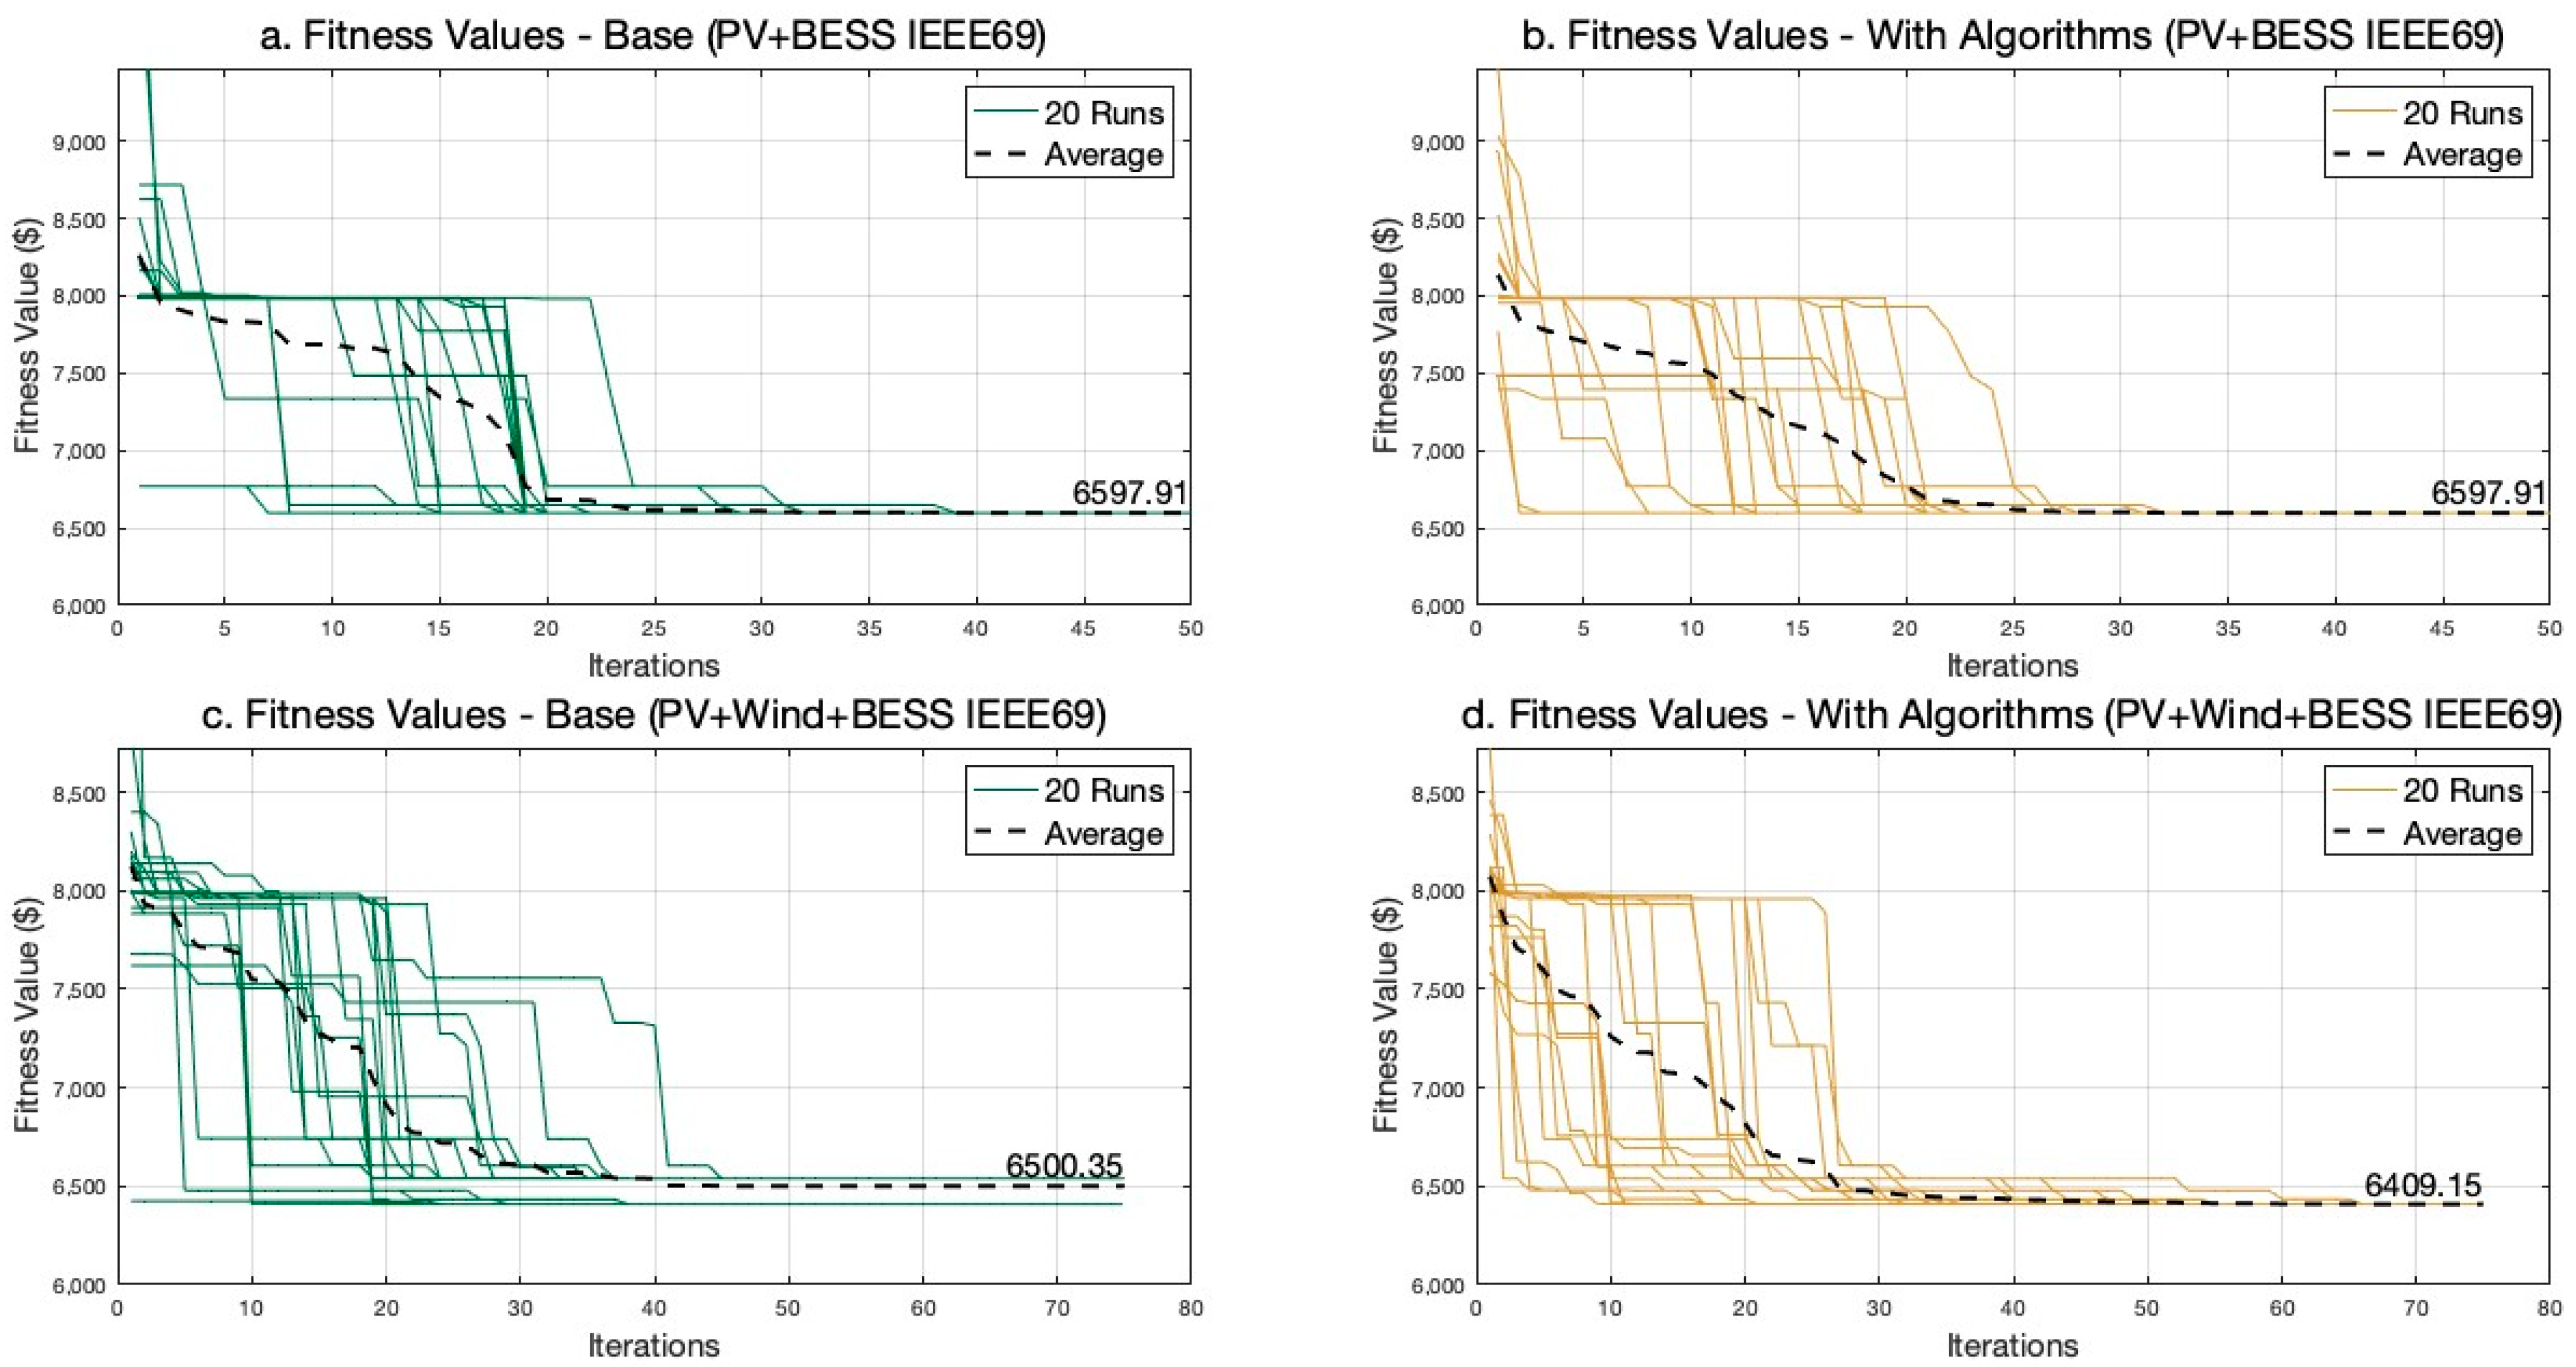
In Figure 8a,b, showing PSO applied to the IEEE69 case with PV and BESS, the convergence led to a fitness value of USD 6597.9 in both cases.
Extending the analysis to Figure 8c,d with the inclusion of PV, wind, and BESS in the IEEE69 case, (c), under basic PSO, shows instances where runs are trapped in local optima, concluding with a final average fitness value of USD 6500.35. Conversely, integrating developed algorithms in (d) guarantees convergence to the same fitness value for all runs, achieving a significantly lower average fitness value of USD 6409.15. This analysis underscores the crucial impact of network-oriented algorithms in optimizing PSO search for DER planning problems, especially in scenarios with multiple distributed resources, with all runs achieving a significantly lower average fitness value of USD 6409.15. This analysis underscores the crucial impact of network-oriented algorithms in optimizing PSO search for DER planning problems, especially in scenarios with multiple distributed resources.
In the results for the Norwegian case study, illustrated in Figure 9, the integration of network-oriented algorithms yielded promising PSO performance. Specifically, these algorithms led to a reduction in the average fitness value from USD 5303.1 to USD 5218.2 compared to the scenario without their use, indicating improved solution quality. Moreover, it appears that the proposed algorithms facilitated faster convergence, with most runs converging around iteration 50. These findings underscore the importance of the proposed algorithms for distributed energy resource planning and their validation in real-world networks.

5.2.2. Active Power Losses

Active power loss quantifies the active power dissipation in the system due to resistance in distribution lines. The total active power loss for a given time t, P l o s s , t , can be calculated as the difference between the total active power generation and the total active power demand, as shown in Equation (29).
P l o s s , t = i N P G i , t i N P L i , t
Table 4 reveals the outcomes of power loss reduction and other aspects through PSO simulations with proposed algorithms for the IEEE 33 bus, the IEEE 69 bus, and the Norwegian 124 bus cases. In the IEEE 33 bus case, the PV + BESS configuration results in a substantial 69% reduction, while adding wind resources in the PV + Wind + BESS scenario achieves a 74% reduction. Moving to the IEEE 69 bus case, PV + BESS yields a 65% reduction, and the integration of the PV + Wind + BESS scenario achieves a 66% reduction in power losses. The analysis underscores the effectiveness of these diversified distributed resources in mitigating power losses. However, it is notable that introducing multiple resources adds complexity, leading to slightly increased computational times, emphasizing the need for computational efficiency in optimizing DER planning. The Norwegian case, where PV + Wind + BESS reduces losses by 58%, further confirms the practical success of the proposed method in optimizing distributed resource deployment and reducing power losses.

5.2.3. Voltage Stability and VDI

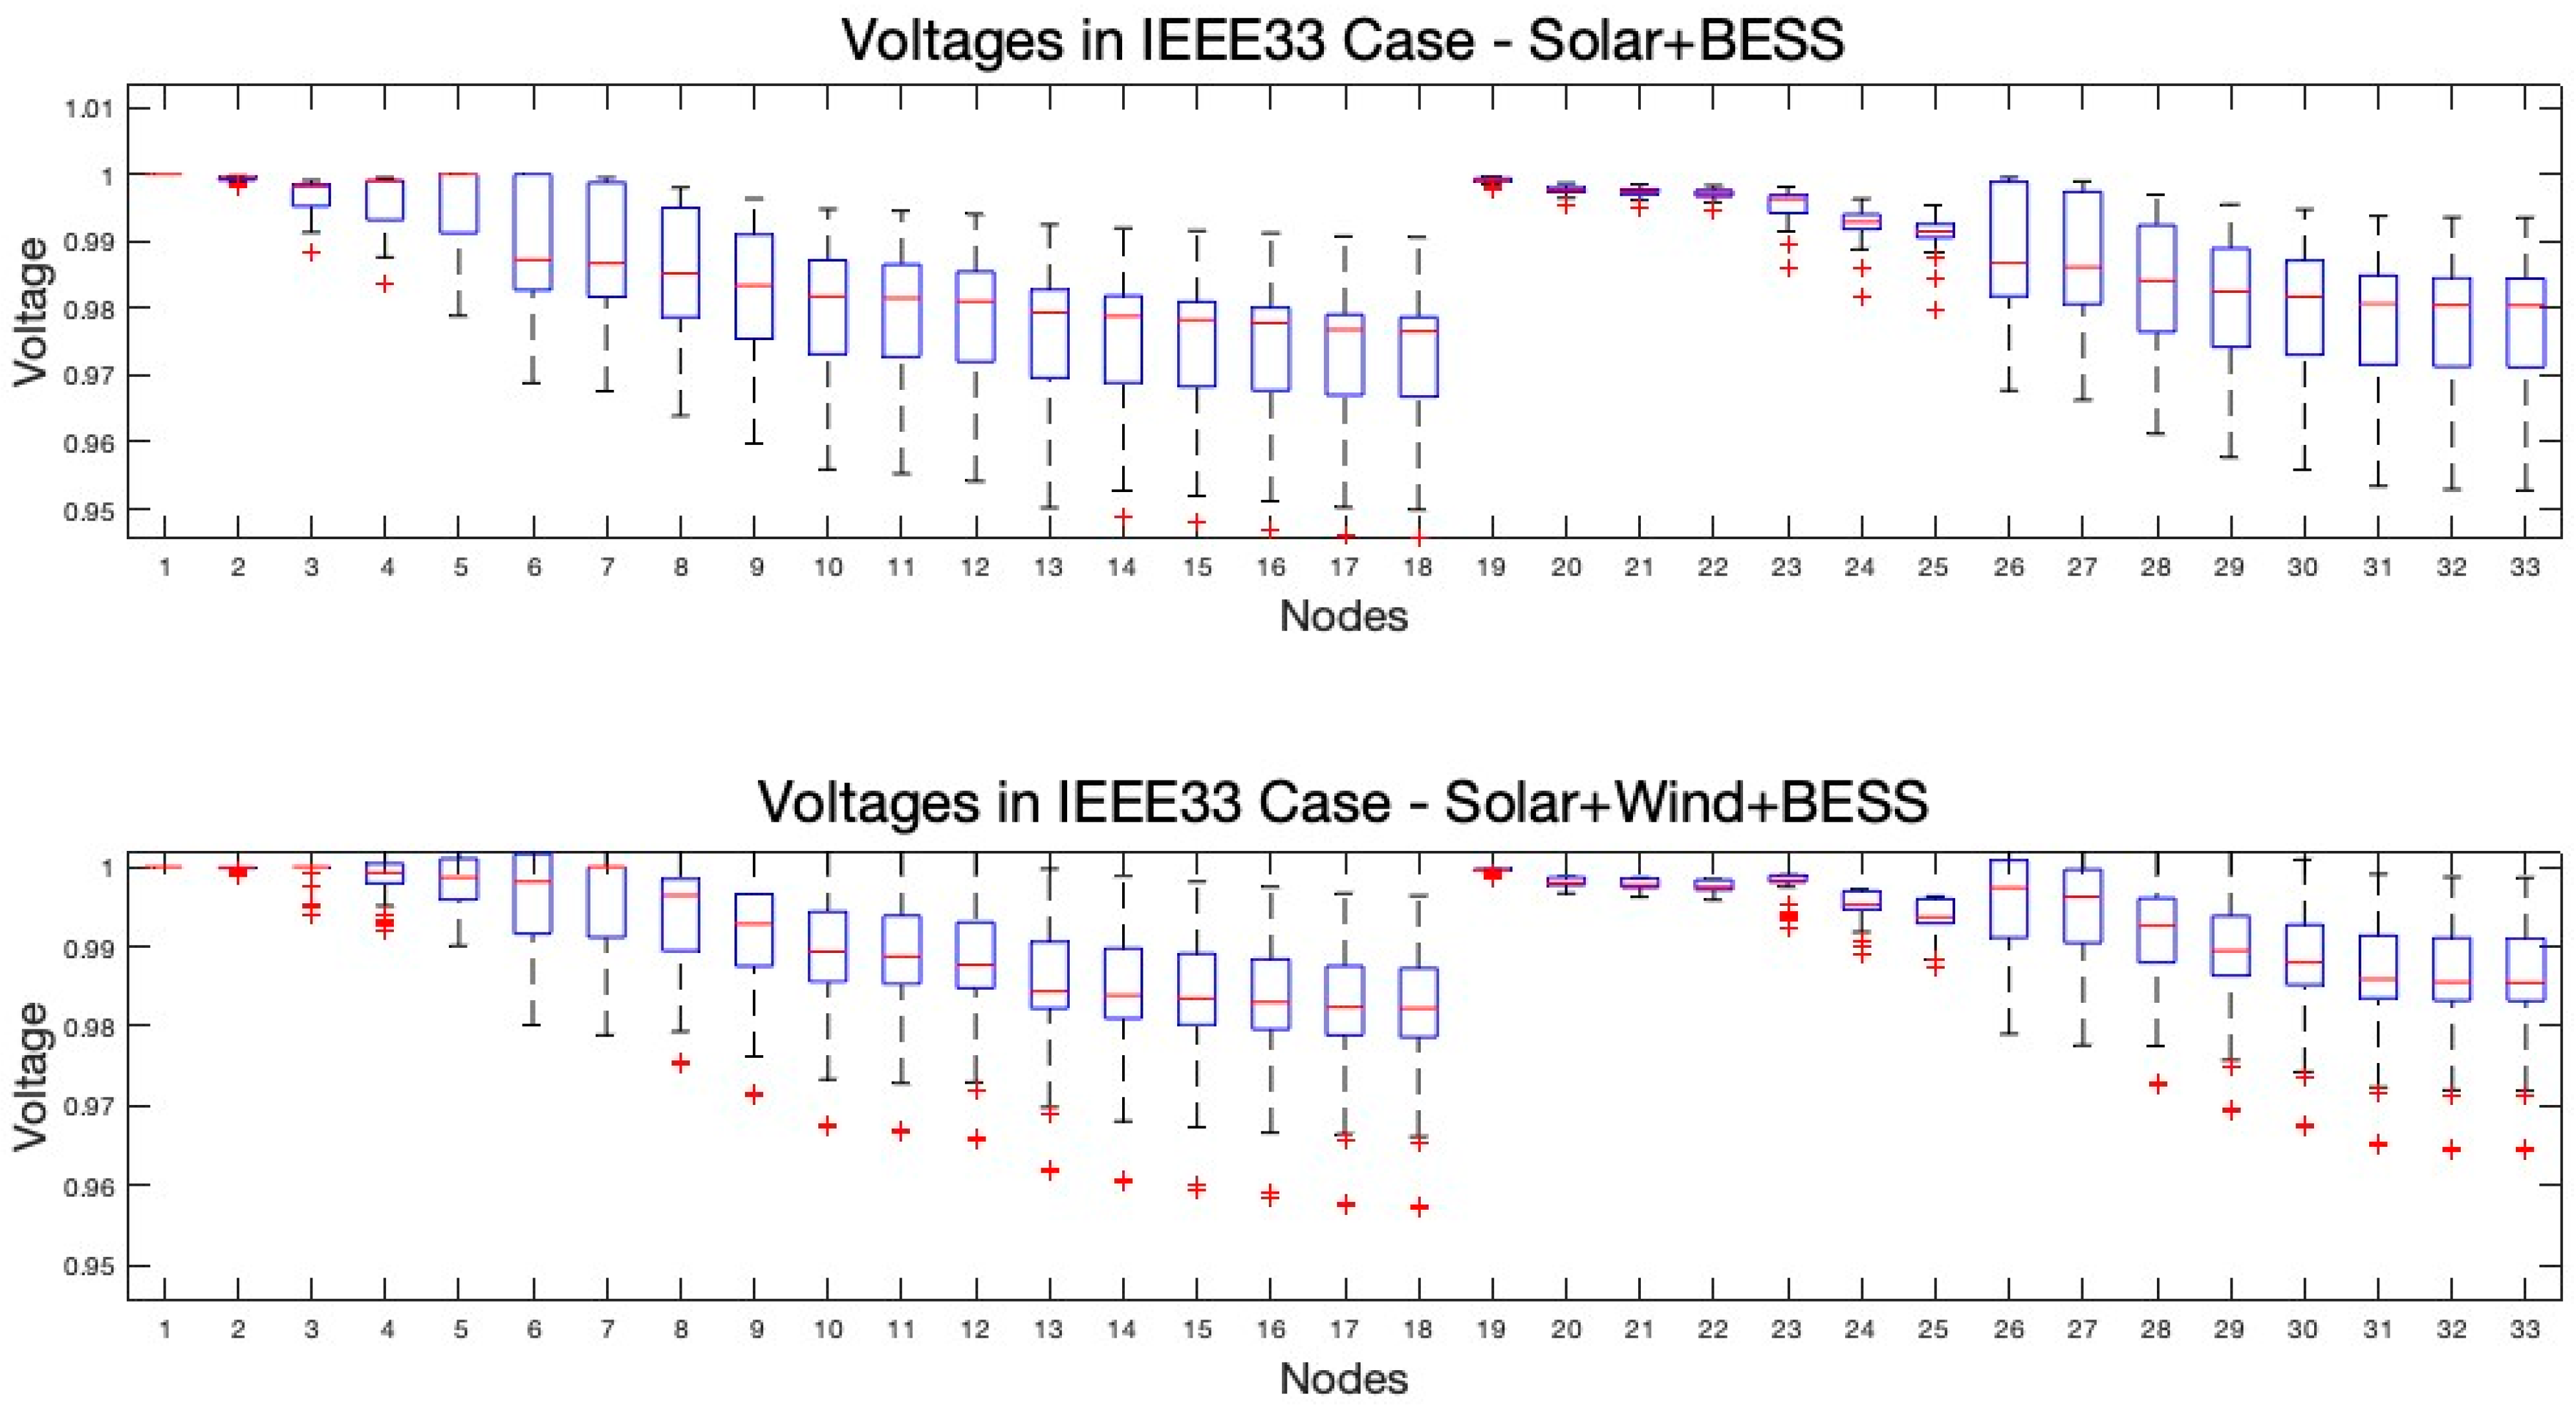
The voltage distribution analysis across 288 time steps in the IEEE33 distribution system shown in Figure 10 compares two scenarios: solar and BESS and solar, wind, and BESS. For the solar and BESS cases, voltage levels range from 0.946 to 1.000, averaging 0.986. In the solar, wind, and BESS cases, the distribution spans 0.957 to 1.013, indicating a stable voltage profile. The incorporation of three integrated resources improves the profile, reflected in the higher average (0.992), median (0.994), and maximum (1.013) values.
This analysis highlights voltage levels’ enhanced stability and reliability when integrating solar, wind, and BESSs, contributing to an optimized power distribution system.
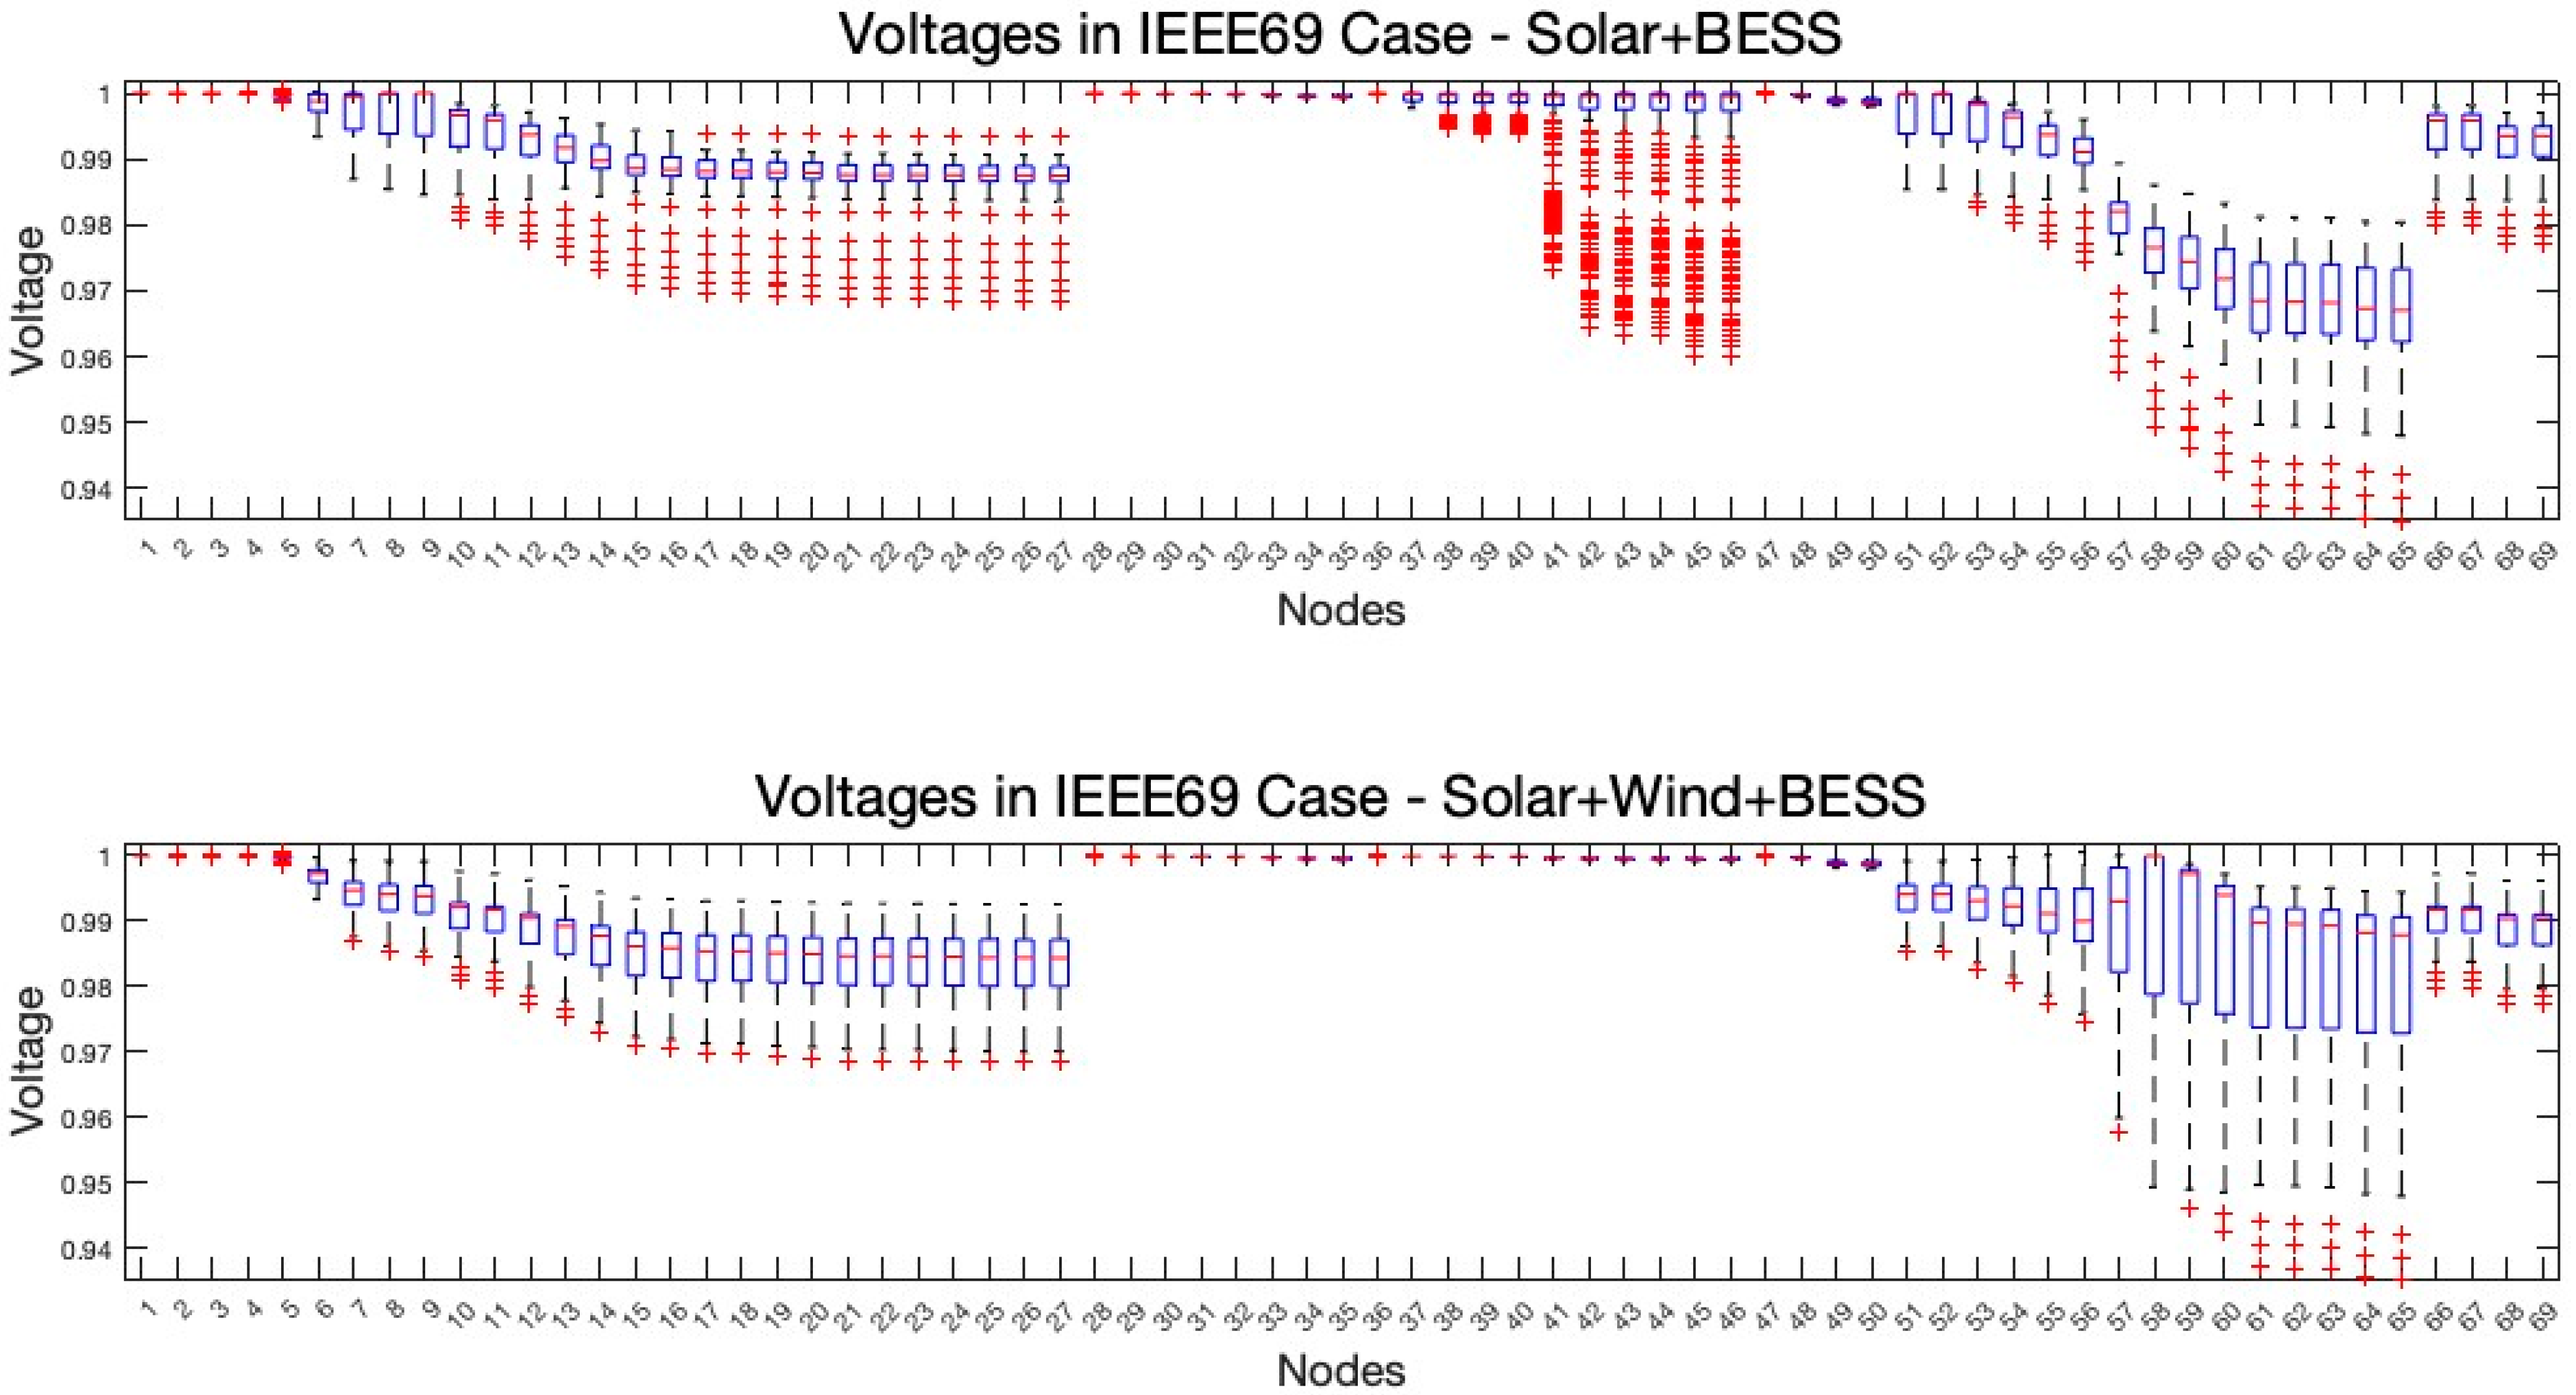
Figure 11 shows analyses of the IEEE69 distribution system in two scenarios, one involving solar and BESS and the other incorporating solar, wind, and BESS, revealing notable insights into the voltage distribution. In the solar and BESS case, the main voltage distribution consistently exhibits values above 0.96 per unit (p.u.). However, in the solar, wind, and BESS scenario, the entire voltage distribution notably increases, with more buses recording values of 1.0 p.u. This observed enhancement underscores the positive impact of integrating multiple DER units on the voltage profile. The findings suggest that an increased number of integrated DERs, specifically solar, wind, and BESSs, contributes to a more significant improvement in the voltage profile. This leads to further enhancement of the stability and reliability of the distribution system.
The voltage deviation index (VDI) quantifies the magnitude of voltage fluctuations within the distribution network, reflecting the system’s voltage stability and quality. The VDI is computed as the average deviation of bus voltages from their nominal values over a specified period [10], as given in Equation (30). A low VDI indicates high stability in voltage, while a high VDI indicates low stability.
V D I t = 1 N i N V i , t V n o m i n a l V n o m i n a l
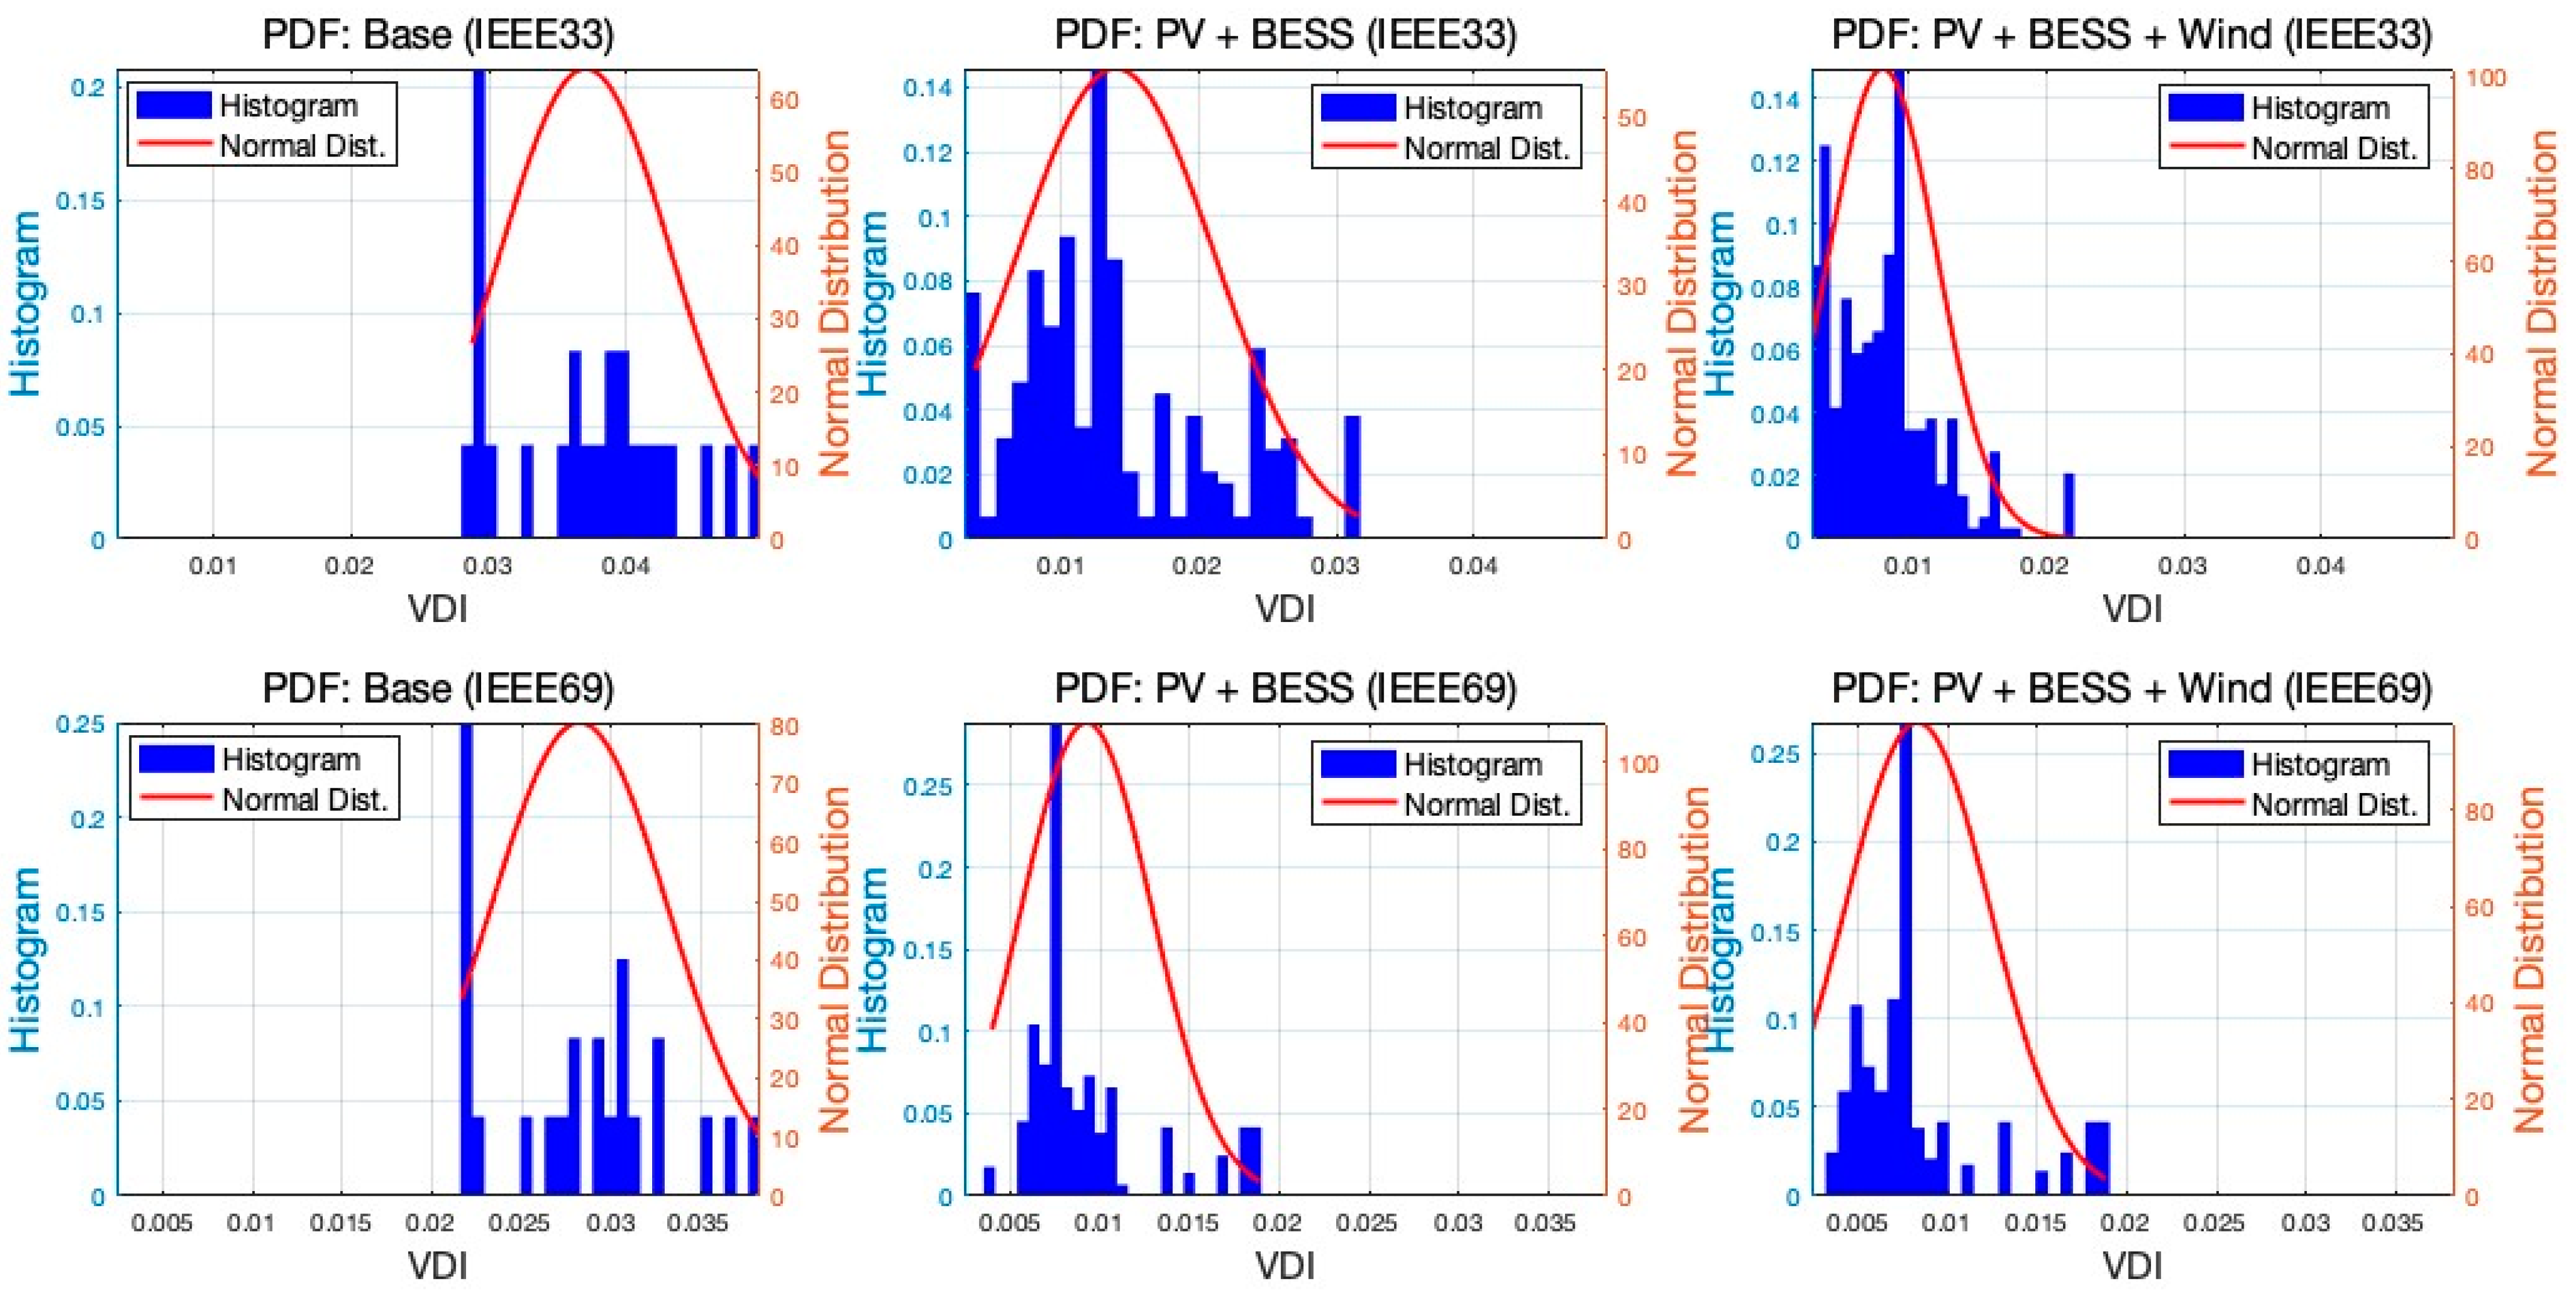
Figure 12 illustrates the VDI distribution in the two distribution network cases: IEEE33 and IEEE69. Each subplot represents a specific scenario, including the base case and scenarios incorporating DERs, such as PV, wind, and BESSs. Blue bars depict the VDI value histogram, while a red line overlays the histogram, representing a theoretical normal distribution curve. In the base cases of both systems, the mean VDI values are 0.037 (IEEE33) and 0.0185 (IEEE69), with standard deviations of 0.0062 and 0.0035, respectively. Integrating PV and BESS reduces the mean VDI to 0.014 (IEEE33) and 0.0092 (IEEE69), with standard deviations of 0.0072 and 0.0037. Further integration of PV, wind, and BESS in IEEE33 results in a mean VDI decrease of 0.0081, with a standard deviation of 0.0039, while in IEEE69, the mean VDI decreases to 0.0083, with a standard deviation of 0.0041. This analysis demonstrates the impact of the diversification of distributed resources especially renewables and storage, on VDI, offering insights into enhancing system stability and reliability.
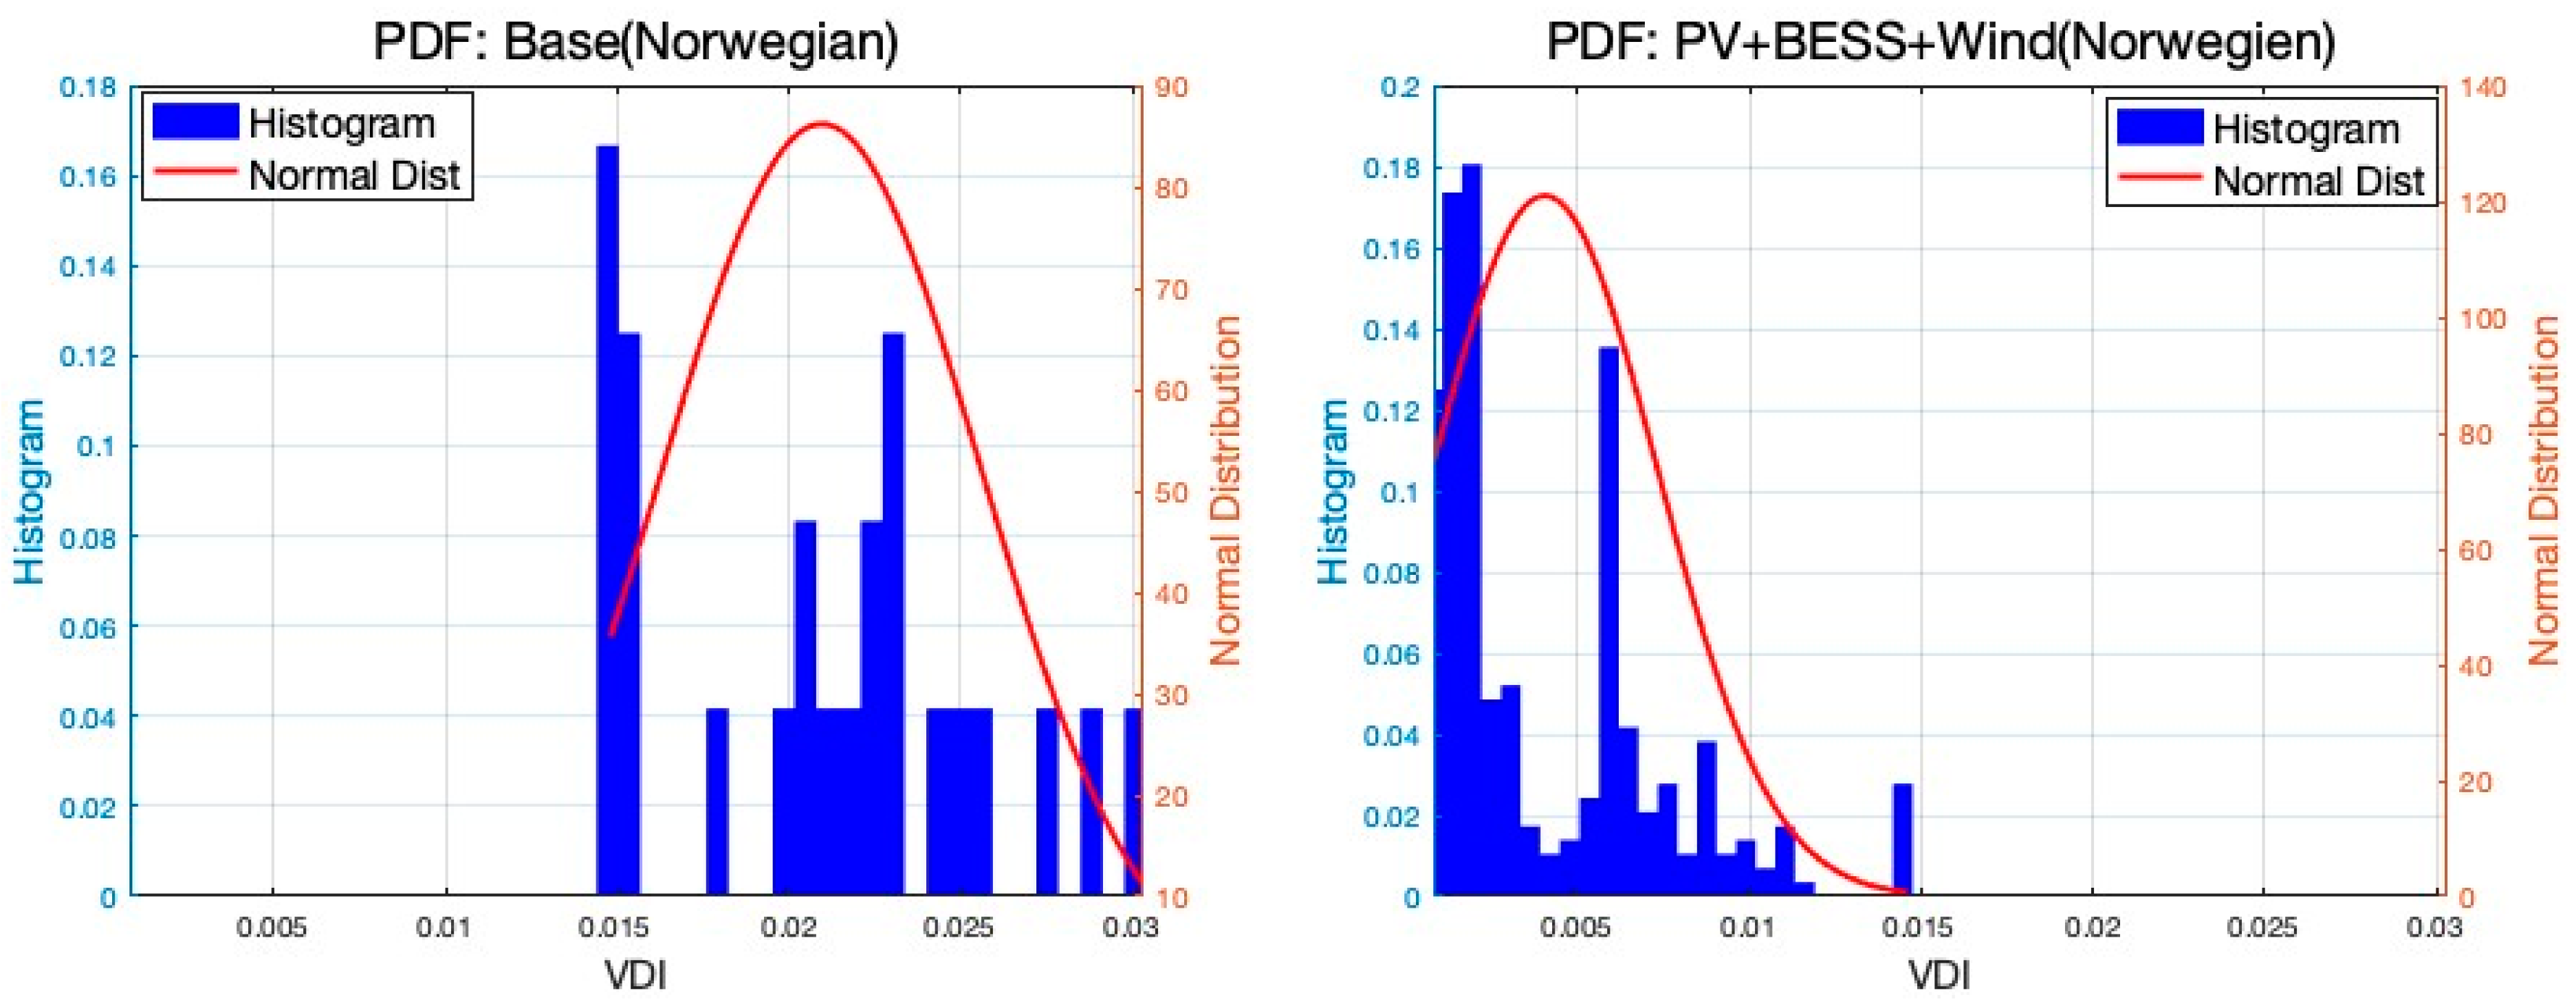
In the Norwegian case study, the distribution of VDIs shown in Figure 13 notably shifts towards the y-axis following the integration of solar, wind, and BESS. This shift indicates a significant reduction in VDI values over the analyzed horizon, reflecting minimized voltage deviations. Specifically, the mean VDI values for the base case and the case with Solar + Wind + BESS integration are 0.0210 and 0.0040, respectively, indicating a substantial decrease. Similarly, the standard deviation values decrease from 0.0046 in the base case to 0.0033 in the Solar + Wind + BESS integration case, showing improved voltage stability.

6. Conclusions

The distribution grid is more vulnerable than ever with the increased share of distributed energy resources. While the initial deployment of DERs shows no destructive impact on grid performance, the widespread deployment may negatively affect reliability. Therefore, finding the best capacity at the best location in the grid is becoming important now and will be more important soon. This study proposed a bilevel optimization framework for integrating diversified renewable resources and storage in distribution systems. The sizing module determines the optimal sizes of hybrid systems that effectively manage variations in renewable energy generation through energy storage deployment. The siting module searches for the best location for the hybrid system while ensuring technical reliability. One of the solution methods for such a problem is using the PSO algorithm; however, the numerical convergence methodology of PSO does not fit with the concept of electrical connectivity. The bus numbers in the power grid do not necessarily reflect the order of connection in the network; therefore, the two algorithms proposed in this paper enhance PSO’s computational efficiency by considering the electrical characteristics of power grids to optimize resource allocation. The Connectivity-Driven Neighbor Generator ensures the exploration of the solution space aligned with the grid’s network topology and hence overcomes local optima challenges in PSO for such power system problems. Secondly, the Resistivity-Driven Neighbor Generator strategically targets areas with lower resistivity. Simulations of IEEE 33-bus and IEEE 69-bus cases demonstrated reductions in power losses, with the integration of PV, wind, and BESS achieving a 74% loss reduction in the IEEE 33 bus case. Notably, the regular PSO in the IEEE69 case with PV and BESS demonstrated convergence to an average fitness value of USD 6597, while the integration of network-oriented methods guaranteed convergence to a significantly lower average fitness value of USD 6409 in a shorter computational time. Additionally, integrating renewables and storage systems reduces the VDI, thereby improving voltage profiles and enhancing system stability. The Norwegian case study further validated these findings, indicating major improvements in voltage stability and loss reduction, affirming the effectiveness of the proposed approach in real-world applications. These outcomes underscore the significance of the proposed methods in balancing technical reliability, economic viability, and computational efficiency in addressing the complexities of distributed resource planning.
In future work, the scope of the proposed power network-based algorithms will be extended to assess their effectiveness across various evolutionary optimization methods. Additionally, efforts will focus on addressing uncertainties in renewable energy generation to optimize renewable distributed resource planning. This will involve exploring stochastic optimization techniques aimed at managing the variability and intermittency inherent in renewable energy sources, ultimately facilitating their sustainable integration into distribution grid.

Author Contributions

Conceptualization, A.E.S. and G.P.; methodology, A.E.S. and G.P.; software, A.E.S.; validation A.E.S.; formal analysis, A.E.S. and G.P.; investigation, A.E.S. and G.P.; resources, A.E.S.; data curation, A.E.S.; writing—original draft preparation, A.E.S.; writing—review and editing, G.P.; visualization, A.E.S.; supervision, G.P.; project administration, A.E.S. All authors have read and agreed to the published version of the manuscript.

Funding

This research received no external funding.

Data Availability Statement

The original contributions presented in the study are included in the article; further inquiries can be directed to the corresponding authors.

Conflicts of Interest

The authors declare no conflicts of interest.

Nomenclature

Sets L s , L w , L e Scaled lifetime of solar PV, wind, and BESS
T Time steps (hour) P L i   Nodal active load (MW)
N Set of nodesDecision Variables
Parameters S c a p ,   W c a p ,   E c a p Solar PV, wind, and BESS sizes (MW), (MWh)
P t p v , p r o f i l e ,   P t w , p r o f i l e Solar and wind profiles (p.u.) P t p v , g e n ,   P t w , g e n Solar and wind power generation (MW)
P t D e m a n d Total hourly demand (MWh) P t p v , l o a d ,   P t w , l o a d Solar and wind to load power (MW)
γ Allowed renewable curtailment ratio (p.u.) P t p v , c h ,   P t w , c h Solar and wind to charging power (MW)
μ c BESS charging efficiency (p.u.) P t p v , c u r t a i l e d , P t w , c u r t a i l e d   Solar and wind curtailed power (MW)
μ d BESS discharging efficiency (p.u.) s o e t State of energy of BESS (MWh)
α m i n BESS minimum ration (p.u.) P t d c h Discharge power of BESS (MW)
M A large value (big M) P t c h Charge power of BESS (MW)
t Time granularity u t Binary to avoid simultaneous charge/discharge
β Charging capability ratio from BESS (p.u.) P t , g r i d Total hourly energy imports (MWh)
d Representative days of simulation O P E X Operational expenditure (USD)
C s , C w Overnight capital cost of PV and Wind (USD/MW) C A P E X Capital expenditure (USD)
C e Overnight capital cost of BESS (USD/MWh) P G i Nodal active power generation (MWh)

References

  1. Rashid, M.H. (Ed.) Energy Systems in Electrical Engineering Series. Available online: https://www.springer.com/series/13509 (accessed on 1 April 2024).
  2. Salam, I.U.; Yousif, M.; Numan, M.; Zeb, K.; Billah, M. Optimizing Distributed Generation Placement and Sizing in Distribution Systems: A Multi-Objective Analysis of Power Losses, Reliability, and Operational Constraints. Energies 2023, 16, 5907. [Google Scholar] [CrossRef]
  3. Tercan, S.M.; Demirci, A.; Unutmaz, Y.E.; Elma, O.; Yumurtaci, R. A Comprehensive Review of Recent Advances in Optimal Allocation Methods for Distributed Renewable Generation. IET Renew. Power Gener. 2023, 17, 3133–3150. [Google Scholar] [CrossRef]
  4. Maheshwari, P.; Jain, S. Particle Swarm Optimization Based Multi Objective Approach for Installation of Dispersed Generator. J. Integr. Sci. Technol. 2023, 11, 519. [Google Scholar]
  5. Jain College of Engineering; Institute of Electrical and Electronics Engineers. Bangalore Section; Institute of Electrical and Electronics Engineers. In Proceedings of the 2020 International Conference for Emerging Technology (INCET), Belgaum, India, 5–7 June 2020; IEEE: Piscataway, NJ, USA, 2020. ISBN 9781728162218. [Google Scholar]
  6. Ahmed, E.E.E.; Poyrazoglu, G. Optimizing Distributed Generation Sizing and Siting Using Particle Swarm Optimization: A Comparative Study. In Proceedings of the Proceedings—2023 IEEE International Conference on Environment and Electrical Engineering and 2023 IEEE Industrial and Commercial Power Systems Europe, EEEIC/I and CPS Europe 2023, Madrid, Spain, 6–9 June 2023; Institute of Electrical and Electronics Engineers Inc.: Piscataway, NJ, USA, 2023. [Google Scholar]
  7. Faruque, F.B.; Chowdhury, S.; Nazim, M.S.; Sowmitra, M.; Azad, A.K.M.A.M. Optimized Distributed Generation Planning for Radial Distribution System Using Particle Swarm Optimization Algorithm. In Proceedings of the Asia-Pacific Power and Energy Engineering Conference, APPEEC, Thiruvananthapuram, India, 21–23 November 2021; IEEE Computer Society: Washington, DC, USA, 2021; Volume 2021. [Google Scholar]
  8. Melić, E.; Hanjalić, M.; Šarić, M.; Hivziefendić, J. Distributed Generation Allocation in Distribution Network for Energy Losses Reduction. BH Electr. Eng. 2023, 17, 75–82. [Google Scholar] [CrossRef]
  9. Moses, I.A.; Kiprono, L.L.; Talai, S.M. Optimal Placement and Sizing of Distributed Generation (DG) Units in Electrical Power Distribution Networks. Int. J. Electr. Electron. Eng. Stud. 2023, 9, 66–124. [Google Scholar] [CrossRef]
  10. Ha, M.P.; Nazari-Heris, M.; Mohammadi-Ivatloo, B.; Seyedi, H. A Hybrid Genetic Particle Swarm Optimization for Distributed Generation Allocation in Power Distribution Networks. Energy 2020, 209, 118218. [Google Scholar] [CrossRef]
  11. Zaki, M.A.; Mahmoud, T.; Atia, M.; Osman, E.S.A.E.A. Optimal Sizing and Sitting of Electric Vehicle Charging Station by Using Archimedes Optimization Algorithm Technique. Int. J. Power Electron. Drive Syst. 2021, 12, 2557–2569. [Google Scholar] [CrossRef]
  12. Munisekhar, P.; Jayakrishna, G.; Visali, N. Optimal Placement of Multiple DG Units with Energy Storage in Radial Distribution System by Hybrid Techniques. Int. J. Softw. Innov. 2022, 11, 1–24. [Google Scholar] [CrossRef]
  13. Eid, A. Allocation of Distributed Generations in Radial Distribution Systems Using Adaptive PSO and Modified GSA Multi-Objective Optimizations. Alex. Eng. J. 2020, 59, 4771–4786. [Google Scholar] [CrossRef]
  14. Tejaswi, P.; Gnana Swathika, O.V. A Review on Optimum Location and Sizing of Dgs in Radial Distribution System. In Integrated Green Energy Solutions; Wiley Blackwell: Hoboken, NJ, USA, 2023; pp. 103–132. ISBN 9781394193738. [Google Scholar]
  15. Ahmadi, R.; Hosseini, S.A.; Mohammadi, S.; Naghizadeh, R.A.; Gharehpetian, G.B. Optimal Sizing and Sitting of Photovoltaic Distributed Generation Units Using PSO Algorithm. In Proceedings of the 2022 12th Smart Grid Conference, SGC 2022, Kerman, Iran, 13–15 December 2022; Institute of Electrical and Electronics Engineers Inc.: Piscataway, NJ, USA, 2022. [Google Scholar]
  16. Khalid, S.A.; Arumugam, M.; Shareef, H. Optimal Sitting and Sizing of Distributed Generators Using Pareto-Based Multi-Objective Particle Swarm Optimization for Improving Power System Operation. Elektr. J. Electr. Eng. 2022, 21, 35–41. [Google Scholar] [CrossRef]
  17. Tawfeek, T.S.; Ahmed, A.H.; Hasan, S. Analytical and Particle Swarm Optimization Algorithms for Optimal Allocation of Four Different Distributed Generation Types in Radial Distribution Networks. Energy Procedia 2018, 153, 86–94. [Google Scholar] [CrossRef]
  18. Alajmi, B.N.; AlHajri, M.F.; Ahmed, N.A.; Abdelsalam, I.; Marei, M.I. Multi-Objective Optimization of Optimal Placement and Sizing of Distributed Generators in Distribution Networks. IEEJ Trans. Electr. Electron. Eng. 2023, 18, 817–833. [Google Scholar] [CrossRef]
  19. Hassanzadehfard, H.; Jalilian, A.; Jamali, S. Optimal Location and Sizing of Renewable Energy Resources in Micro-Grid Considering Uncertainty and Voltage Quality. 2014. Available online: https://doc.iran-micro.com/download/optimal-location-and-sizing-of-renewable-energy-resources-in-micro-grid-considering-uncertainty-and-voltage-quality/ (accessed on 1 April 2024).
  20. Jahed, Y.G.; Mousavi, S.Y.M. Comparative Study in Optimal Sizing and Siting of DGs Based on Heuristic Optimization Algorithms. In Proceedings of the 2023 27th International Electrical Power Distribution Conference, EPDC 2023, Mashhad, Iran, 2–4 May 2023; Institute of Electrical and Electronics Engineers Inc.: Piscataway, NJ, USA, 2023; pp. 37–42. [Google Scholar]
  21. Anbuchandran, S.; Rengaraj, R.; Bhuvanesh, A.; Karuppasamypandiyan, M. A Multi-Objective Optimum Distributed Generation Placement Using Firefly Algorithm. J. Electr. Eng. Technol. 2022, 17, 945–953. [Google Scholar] [CrossRef]
  22. Varma, P.V.R.; Kar, M.K.; Singh, A.K. Optimal Sizing and Location of DG for Power Loss Reduction and Voltage Improvement of Distribution System Using IHSA Algorithm. In Proceedings of the IEEE 2nd International Conference on Applied Electromagnetics, Signal Processing, and Communication, AESPC 2021—Proceedings, Bhubaneswar, India, 26–28 November 2021; Institute of Electrical and Electronics Engineers Inc.: Piscataway, NJ, USA, 2021. [Google Scholar]
  23. Jayaraman Panneerselvam, S.; Krishnamoorthi, Y.; Ramamoorthy, S.; Selvaraj, J. Optimal Allocation of Distributed Generation for Power Flow Enhancement in Distribution Network. Optim. Control Appl. Methods 2023, 44, 3168–3184. [Google Scholar] [CrossRef]
  24. Nematollahi, A.F.; Shahinzadeh, H.; Nafisi, H.; Vahidi, B.; Amirat, Y.; Benbouzid, M. Sizing and Sitting of DERs in Active Distribution Networks Incorporating Load Prevailing Uncertainties Using Probabilistic Approaches. Appl. Sci. 2021, 11, 4156. [Google Scholar] [CrossRef]
  25. Chakraborty, S.; Verma, S.; Salgotra, A.; Elavarasan, R.M.; Elangovan, D.; Mihet-Popa, L. Solar-Based Dg Allocation Using Harris Hawks Optimization While Considering Practical Aspects. Energies 2021, 14, 5206. [Google Scholar] [CrossRef]
  26. Dehghan, M.; Zadehbagheri, M.; Kiani, M.J.; Nejatian, S. Virtual Power Plants Planning in the Distribution Network Constrained to System Resiliency under Extreme Weather Events. Energy Rep. 2023, 9, 4243–4256. [Google Scholar] [CrossRef]
  27. Vaish, J.; Tiwari, A.K.; Siddiqui, K.M. Optimization of Micro Grid with Distributed Energy Resources Using Physics Based Meta Heuristic Techniques. IET Renew. Power Gener. 2023, 1–17. [Google Scholar] [CrossRef]
  28. Quadri, I.A.; Bhowmick, S.; Joshi, D. A Comprehensive Technique for Optimal Allocation of Distributed Energy Resources in Radial Distribution Systems. Appl. Energy 2018, 211, 1245–1260. [Google Scholar] [CrossRef]
  29. Naderipour, A.; Abdul-Malek, Z.; Bin Mustafa, M.W.; Guerrero, J.M. A Multi-Objective Artificial Electric Field Optimization Algorithm for Allocation of Wind Turbines in Distribution Systems. Appl. Soft Comput. 2021, 105, 107278. [Google Scholar] [CrossRef]
  30. Dogan, A. Optimum Sitting and Sizing of WTs, PVs, ESSs and EVCSs Using Hybrid Soccer League Competition-Pattern Search Algorithm. Eng. Sci. Technol. Int. J. 2021, 24, 795–805. [Google Scholar] [CrossRef]
  31. Zimmerman, R.D.; Murillo-Sanchez, C.E. MATPOWER 2020. Available online: https://zenodo.org/records/4074135 (accessed on 1 April 2024).
  32. Mirletz, B.; Vimmerstedt, L.; Stehly, T.; Akar, S.; Stright, D.; Augustine, C.; Beiter, P.; Cohen, S.; Cole, W.; Duffy, P.; et al. 2023 Annual Technology Baseline (ATB) Cost and Performance Data for Electricity Generation Technologies. Available online: https://www.osti.gov/biblio/1987306 (accessed on 1 April 2024).
  33. Sperstad, I.B.; Fosso, O.B.; Jakobsen, S.H.; Eggen, A.O.; Evenstuen, J.H.; Kjølle, G. Reference Data Set for a Norwegian Medium Voltage Power Distribution System. Data Brief 2023, 47, 109025. [Google Scholar] [CrossRef] [PubMed]
  34. Tercan, S.M.; Demirci, A.; Gokalp, E.; Cali, U. Maximizing Self-Consumption Rates and Power Quality towards Two-Stage Evaluation for Solar Energy and Shared Energy Storage Empowered Microgrids. J. Energy Storage 2022, 51, 104561. [Google Scholar] [CrossRef]
Figure 1. Electrical network observations—IEEE33.
Energies 17 02270 g001
Figure 2. Flowchart of the proposed PSO.
Energies 17 02270 g002
Figure 3. Flowchart of Network Validation.
Energies 17 02270 g003
Figure 4. Time series input data.
Energies 17 02270 g004
Figure 5. Hybrid DER Sizing results across case studies.
Energies 17 02270 g005
Figure 6. Supply–demand balance and BESS dispatch—IEEE69.
Energies 17 02270 g006
Figure 7. Algorithm performance comparison—IEEE33.
Energies 17 02270 g007
Figure 8. Algorithm performance comparison—IEEE69.
Energies 17 02270 g008
Figure 9. Algorithm performance comparison—Norwegian case.
Energies 17 02270 g009
Figure 10. Nodal Voltage results—IEEE33.
Energies 17 02270 g010
Figure 11. Nodal Voltage results—IEEE69.
Energies 17 02270 g011
Figure 12. VDI distribution with/without hybrid DERs—IEEE cases.
Energies 17 02270 g012
Figure 13. VDI distribution with/without hybrid DERs—Norwegian case.
Energies 17 02270 g013
Table 1. Technical and financial assumptions.
DefinitionValueUnit
Solar PV Overnight Cost1.29 millionUSD/MW
Solar PV Lifetime25Years
Wind System Overnight Cost1.25 millionUSD/MW
Wind System Lifetime20Years
BESS Overnight Cost500 thousandUSD/MWh
BESS Lifetime15Years
BESS Duration4Hours
BESS Charging Efficiency0.9p.u.
BESS Discharging Efficiency0.9p.u.
BESS Depth of Discharge (DoD)20Percent
Table 2. Simulated case study parameters.
CaseSwarm SizeMaximum Iterationc1c2 w i n i w f i n k
IEEE 33Solar + BESS25502210.052
Solar + BESS + Wind50752210.052
IEEE 69Solar + BESS25502210.052
Solar + BESS + Wind50752210.052
NorwegianSolar + BESS + Wind501002210.052
Table 3. SSR and renewable curtailment—IEEE69.
FeatureSolar + BESSSolar + Wind + BESSUnit
Renewable Curtailment159.0161.89MWh
SSR68.6078.59Percent
Table 4. Hybrid DER Sitting results.
CasePower Loss (MWh)Power Loss Reduction (%)PV SiteWind SiteBESS SiteTime (s)
IEEE 33PV + BESS10.55696-6801
PV + Wind + BESS8.647471972907
IEEE 69PV + BESS13.2659-9824
PV + Wind + BESS12.8266552553416
NorwegianPV + Wind + BESS10.27584712479200
Disclaimer/Publisher’s Note: The statements, opinions and data contained in all publications are solely those of the individual author(s) and contributor(s) and not of MDPI and/or the editor(s). MDPI and/or the editor(s) disclaim responsibility for any injury to people or property resulting from any ideas, methods, instructions or products referred to in the content.