Article

Integrating Statistical Simulation and Optimization for Redundancy Allocation in Smart Grid Infrastructure

1
Department of Marketing, School of Business, University of Mississippi, Oxford, MS 38677, USA
2
Department of Marketing, School of Business, Texas A&M International University, Laredo, TX 78041, USA
3
Department of Management and Marketing, Angelo State University, San Angelo, TX 76909, USA
4
Department of Marketing and Management, Southern University and A&M College, Baton Rouge, LA 70807, USA
*
Author to whom correspondence should be addressed.
Energies 2024, 17(1), 225; https://doi.org/10.3390/en17010225
Submission received: 19 November 2023 / Revised: 22 December 2023 / Accepted: 29 December 2023 / Published: 31 December 2023
(This article belongs to the Special Issue Smart Energy Systems: Learning Methods for Control and Optimization)

Abstract

:
It is a critical issue to allocate redundancy to critical smart grid infrastructure for disaster recovery planning. In this study, a framework to combine statistical prediction methods and optimization models for the optimal redundancy allocation problem is presented. First, statistical simulation methods to identify critical nodes of very large-scale smart grid infrastructure based on the topological features of embedding networks are developed, and then a linear integer programming model based on generalized assignment problem (GAP) for the redundancy allocation of critical nodes in smart grid infrastructure is presented. This paper aims to contribute to the field by employing a general redundancy allocation problem (GRAP) model from high-order nonlinear to linear model transformation. The model is specifically implemented in the context of smart grid infrastructure. The innovative linear integer programming model proposed in this paper capitalizes on the logarithmic multiplication property to reframe the inherently nonlinear resource allocation problem (RAP) into a linearly separable function. This reformulation markedly streamlines the problem, enhancing its suitability for efficient and effective solutions. The findings demonstrate that the combined approach of statistical simulation and optimization effectively addresses the size limitations inherent in a sole optimization approach. Notably, the optimal solutions for redundancy allocation in large grid systems highlight that the cost of redundancy is only a fraction of the economic losses incurred due to weather-related outages.

1. Introduction

The advent of the smart grid, akin to previous technology revolutions in telecom and the internet, marks a crucial milestone in modernizing our electric grid. With its implementation, technology to enhance the efficiency, reliability, and affordability of electricity distribution is harnessed. This transformation shifts our electric system from a centralized, producer-controlled network to a more interactive, consumer-centric model.
Addressing the grid’s declining reliability, marked by a surge in outages, the smart grid becomes imperative. Currently, these interruptions cost Americans an estimated USD 150 billion annually. Furthermore, with a projected 30% increase in nationwide electricity demand by 2030, investments of around USD 1.5 trillion over the next two decades are essential for infrastructure development [1]. By fostering this transition to a smarter grid—a process already underway—and eventually adopting the smart grid, electricity will become more affordable, and our environment will benefit from reduced impact. During this transformative period, ensuring fairness, cost-effectiveness, and adequate customer protection will be paramount. The smart grid represents a significant leap forward, utilizing data in megabytes to move megawatts of electricity efficiently and reliably into the 21st century [2]. A key feature of the smart grid is its ability to conduct continuous self-assessments, allowing it to prevent disruptions proactively rather than merely reacting to them.
Ever-increasing energy demand coupled with increasing prices has prompted the energy industry to develop intelligent strategies for energy tracking, control, and conservation [3]. Electricity disruptions like blackouts can trigger cascading failures affecting banking, communications, and security, particularly in winter when heating is crucial. A smart grid enhances power system resilience, ensuring preparedness for storms, earthquakes, and emergencies. Its bidirectional communication reroutes power automatically during outages, minimizing their impact. Smart grid technology swiftly detects and isolates outages, prioritizing essential services for swift recovery. By integrating customer-owned generators, vital facilities remain operational during crises. Moreover, it addresses aging infrastructure, boosts energy efficiency, raises consumer awareness, and enhances national security, utilizing locally sourced, resilient electricity. On the other hand, interoperability among various grid components, data handling, and management across wide geographies with different environmental conditions pose challenges for traditional smart grids [4].
The increasing complexity of systems highlights the significance of optimal redundancy in business continuity. Systems failures can stem from a wide variety of causes (refer to the survey article [5]) ranging from the large-scale natural or human-caused disasters that can disrupt an entire region because of a defective electronic part or equipment. Wang et al. [6] argue that diversification is an effective approach in safeguarding multi-tier systems against disruptions resulting from failures, cyberattacks, or simply accidents. On the other hand, designing such diversified systems poses challenges due to factors such as combinatorial-explosive solution space and conflicting design objectives. Diversification is proposed to be the best course of application in defending against attacks on any system. Smart grid redundancy is a diversification technique aiming to defend the network system against a disruption. Smart grids heavily depend on the IT infrastructure for operations such as cloud computing and edge computing.
In addition to the tens of millions of computers and servers heavily dependent on the reliability of IT infrastructure using the cloud computing paradigm, the developments seen in the 5G cellular network, such as the Internet of Things (IoT) applications of smart home, smart city and smart transportation via auto-driving have made edge computing an indispensable infrastructure to connect cloud and end users. The emergence of the IoT coupled with the advances in the energy management sphere has resulted in the smart grid, also known as the Internet of Energy (IoE). Krishnan and Jacob [7] proposed a hybrid technique in developing an Energy Management System (EMS) for a distribution system with an IoT framework. IoE integrates several forms of energy and leverages the internet to collect, organize, optimize, and manage energy networks. Mishra and Singh [8] studied energy management techniques in smart cities using IoE in an effort to develop improvements in clean energy processes.
Edge computing utilizes the resource of cloud servers to direct the data and computing services to a real-time low-latency system at the edge of a network. For example, the 5G network in the edge computing infrastructure provides high-bandwidth access to end users on location services, data caching, video analytics, and augmented reality [9]. Unlike the data centers of cloud computing, the servers in edge computing of IOT systems must be located close to the end users in order to provide real-time high bandwidth and low-latency services. Thus, redundancy allocation in edge-to-cloud computing focuses on the network structure of the end user community, such as critical nodes and links of social connectivity [10]. The network structure of the user community can be revealed via community detection methods [11]. ML models are popular methods of community detection in edge computing [12,13]. The IoT systems follow the power law distribution [14,15,16,17]. Patsidis et al. [18] employed an architecture that includes edge-cloud communication to extract data-driven insights from microgrids.
Addressing the economic models of system security, Gordon and Loeb [19] underscored that an information set is characterized by the loss conditioned on the probability of a threat occurring and the vulnerability, defined as the probability of a disruption in the model. Interruptions in the services of large-scale service companies can potentially result in losses amounting to significant amounts of revenue. Consequently, these companies must implement specific disaster recovery or disaster avoidance strategies [20].
As a major concern, financial cost is always a component of any redundancy model. Companies face the challenge of determining the financial allocation for disaster recovery and, within that, the proportion to be allocated to smart grid redundancy. In order to protect their assets, businesses have to do their best due to the cost of redundancy allocation resources [21,22]. It is economically efficient to protect the critical nodes and links with redundancy resource. Multiple mathematical models have been proposed to determine the critical nodes and links in the smart grid (see Table 1).
The mathematical models above encounter challenges when it comes to identifying critical nodes and links in larger-scale problems. Recently, statistical models have been applied to identify the critical nodes and links in very large networks such as social networks and biology networks [27]. These models encompass both model-based and distribution-based methods. They utilize the topological features of the embedding networks for model training and validating the outcomes of critical nodes and links (See Table 2).
Once the critical nodes are identified, redundancy resources are allocated based on the importance of components (nodes) in smart grid infrastructure. The redundancy allocation problem (RAP) is typically formulated with two alternative objectives: maximizing the reliability within the budget constraints or minimizing the system costs to satisfy the minimum system reliability. Kulturel-Konak et al. [30] proposed two integer programming (IP) models to address these alternative RAP objectives, and pointed out that these IP models can be converted into 0–1 IP with additional binary decision variables. Shao [31] introduced a non-linear 0–1 IP solution formulation for RAP and provided a specialized dynamic programming method for obtaining optimal solutions.
The RAP is typically framed as a highly nonlinear optimization problem, as discussed by Kulturel-Konak et al. [30] and Shao [31]. However, in the context of this paper, we leverage the property of logarithmic multiplication to reformulate the nonlinear problem as a linearly separable function and introduce a linear integer programming model in the next section. This transformation significantly simplifies RAP, making it more amenable to efficient solutions.
This paper presents a novel linear integer programming (LIP) approach to address RAP based on the generalized assignment problem (GAP). Over the past few decades, a variety of heuristic findings have emerged for GAP, which can be readily applied to smart grid redundancy allocation [32,33]. Devi et al. [34] conducted an extensive literature review and classified 280 papers on RAP according to the methods employed. Our model here is more general than GAP, with applications extending to various scenarios, including multi-skilled workforce assignment [35], the assignment of unmanned aerial vehicles (UAV) [36], optimal preventive maintenance scheduling for related applications and heuristics (see the recent paper by [37] and its references), and the development of the model regarding multi-skilled workforce applications with heuristics [38,39].
In the multi-skilled multi-period workforce assignment problem [35], all variables are binary, while the unmanned aerial vehicles model [36] presents an integer programming (IP) model for the facility location problem (FLP), which is a special case of RAP, and the equivalent quadratic model. The FLP model is different from the LIP model in this study. The task assignment problem [37] is a multi-resource generalized assignment problem (MRGAP) with binary variables, which is also totally different from the GRAP LIP model in this study, where y is an integer variable. Similar differences arose in other papers on GAP, which considered binary variables in the model. The GRAP LIP model with integer variable is a generalized model, since the number of resources (total contributions of resources) should be integer instead of binary, and this formulation can reduce the number of variables and constraints with a linearly separable function. Given that the conversion from integer variables to binary variables with binary expansion always increases the number of variables, the model proposed here significantly reduces the complexity of the problem, and thus the computational time.
The rest of the paper is organized as follows. In Section 2 a framework combining statistical simulation and optimization models to identify the critical nodes in the edge computing infrastructure using a power grid system is presented as an example, and then the redundancy resource allocation with a linear integer programming model is optimized. In Section 3, the computational results in critical nodes are reported. Section 4 provides a summary of conclusions drawn from this study.

2. Materials and Methods

2.1. Statistical Simulation and Optimization Framework

Statistical simulation for critical nodes is based on the random matrix theory that uses the probability distribution of eigenvalues, such as the Tracy–Widom (TW) distribution [29]. TW distribution describes the fluctuations of maximal eigenvalues of random large matrix models. Due to its universal character, it is one of the most popular laws in probability theory. Since the TW law holds only for random matrix, any significant deviation for a matrix would indicate that it is not a random matrix.
The critical nodes detection problem can be formulated as a special case of clustering, where critical nodes are assigned to a particular cluster, while the remaining nodes form some disconnected clusters. The number of singleton clusters increases as the number critical nodes increases.
The largest eigenvalues of the adjacency matrix associated with the critical nodes cluster has the TW distribution. Instead of using parametric bootstrap to estimate the TW distribution, it is computationally efficient to run a few simulations to compute the mean and the variance of the distribution. Figure 1 illustrates the statistical simulation–optimization framework used in this study.
A presentation of the framework in Figure 1 is provided in Algorithm 1 below:
Algorithm 1. Statistical simulation–optimization framewor
Compute   the   Laplacian   matrix   L n x n
2 Generate eigenvectors V
Form   E n x n matrix
4 Sort eigenvalues λ
Remove   eigenvalues   λ 0
6             Store   the   largest   k   eigenvalues   in   E n x n matrix
Normalize   E n x n matrix
I f   the   matrix   E n x n follows TW distribution
9            Apply clustering method
10                     IP optimization
11                 Form the clusters
12                 Apply CNP reduction model
13                     Identify the critical nodes
                                                                                     IP: Max x 0 = i = 1 n 1 j = i + 1 n w i j k = 1 c _ m a x x i k x j k
14                     Minimize total connectivity
                                                                                       CNP: Min F n 1 , , n L , L = 1 2 l = 1 L n l ( n l 1 )
15                            If (total connectivity is min.)
                                                                                Critical Nodes are found
16                              Allocate resources to improve resilience
To compute the eigenvalues of the graph network, a spectral clustering method is used. Initially, the Laplacian matrix is computed, followed by generating eigenvectors. The eigenvectors form an n by n matrix, where each row represents a node, and each column stores an eigenvalue. These eigenvalues are sorted incrementally with those close to zero being removed.
Once the eigenvalues are sorted, the largest k eigenvectors are chosen and stored in a new n by k matrix, which is subsequently normalized. TW distribution on the new matrix of eigenvalues can be assessed. If the matrix of eigenvalues follows the TW distribution, the clustering method described below is applied to the normalized matrix of eigenvalues to obtain the labels and scores.
The simulation yields a normalized matrix of eigenvalues that can be used to compute the value of signed weight w i j on each edge in the cluster; the critical nodes of that cluster can be computed with the following Integer Programming (IP) optimization model.
IP :   max x 0 = i = 1 n 1 j = i + 1 n w i j k = 1 c _ m a x x i k x j k  
s.t.
k = 1 c _ m a x x i k = 1 i = 1 , n   2
denoted by x i k , which is equal to 1 if node i is in cluster k, and c_max is the maximum number of clusters formed. After the clusters are formed, the critical nodes are identified using a connected node pairs (CNP) reduction model to minimize the total connectivity of the computer network.
Minimize   F n 1 , , n L , L = 1 2 l = 1 L n l ( n l 1 )
n l , l   = 1, …, L, is the number of nodes in each cluster. Once the critical nodes are identified, resources can be allocated to improve the resilience of the network.

2.2. Optimization Model for Redundancy Allocation

This section refers to the computer network for the GRAP model based on the relationship between the computer network and power system. The smart grid is the interface between computer network and power system. The computer network is used to control the operation of the power system, and the status of the power system is monitored by the computer system. Before presenting a general linear IP model for the general redundancy allocation problem (GRAP), the notations for the optimization model are given as follows.
Parameters and Variables:
D—number of potential disruption +1;
p d —probability of disruption d occurring, p d 0,1 and d = 1 D p d = 1 ;
M—number of components the smart grid needs to perform;
w m —importance weight of components (nodes) in smart grid m, w m 0,1 and m = 1 M w m = 1 ;
n m —number of solutions available for component (node) m to select from;
X m i —1 if solution i 1 , , n m is chosen for component (node) m, or 0 otherwise;
C m i —cost of choosing solution i for component (node) m;
S m i d —survivability of solution i for component (node) m against disruption d;
v m i d —probability of failure for solution i for component (node) m against disruption d (i.e., v m i d = 1 S m i d ).
f m d X m 1 , , X m n m is a function on vector X m 1 , , X m n m for m = 1 , , M and d = 1 , , D .
U m d Y m d is the utility function for vector Y m d = f m d X m 1 , , X m n m for m = 1 , , M and d = 1 , , D when Y m d is the total contribution of solutions X m i , i = 1 , , n m .
The redundancy allocation problem determines the redundancy level of components (nodes) in a system to maximize its reliability, subject to a set of constraints. Here, a general redundancy allocation problem (GRAP) is provided.
(GRAP)
max S = d = 1 D p d m = 1 M w m U m d Z m d
s.t.
i = 1 n m X m i 1 , ϕ ο ρ   m = 1 , , M ,
m = 1 M i = 1 n m C m i X m i B ,
X m i 0,1 ,   ϕ ο ρ   m = 1 , , M   α ν δ i = 1 , , n m
Y m d = f m d X m 1 , , X m n m ,   ϕ ο ρ   m = 1 , , M , α ν δ   d = 1 , , D ,
Y m i 0 ,   ϕ ο ρ   m = 1 , , M   α ν δ i = 1 , , n m
The objective function in this case aims to maximize the survivability of all components (nodes) against all potential disruptions. Also, a node m fails against disruption d only when all of its selected solutions fail at the same time. For a node m and a disruption d, Y m d is the total contribution of applying all or some of the available solutions X m i   i = 1 , , n m . The utility of such a solution is equal to U m d Y m d . It is worth mentioning that GRAP is written in a generic format. When estimating the functions and parameters, one possibility is to use game theory [40,41].
Moreover, it is important to note that GRAP is a non-linear integer program. However, if Y m d = i = 1 n m a m i X m i for m = 1 , , M and d = 1 , , D , and U m d Y m d = Y m d where a m i is a constant weight, then the objective function is a linear function. This is a special case of the generalized assignment problem (GAP) [37], which involves assigning a set of tasks to a set of agents when each agent is constrained by a single resource type that is limited in supply. A variety of exact and heuristic algorithms are available for GAP (see, for example [28,29] for a recent survey). Various exact and heuristic algorithms are available for GAP [32,33].
In the following section, the transformation of the GRAP into a mathematical model with separable objective function and linear constraints is demonstrated, converting it into a GAP. The logarithm of equality (8) results in the following.
l o g Y m d = l o g i = 1 n m v m i d X m i = i = 1 n m X m i l o g v m i d
and
l o g Y m d = i = 1 n m X m i l o g v m i d
Let Z m d = l o g Y m d and K m i d = l o g v m i d . Since 0 v m i d 1 , we have K m i d 0 , and thus, we have
Z m d = i = 1 n m K m i d X m i ,   ϕ ο ρ   m = 1 , , M , d = 1 , , D
Note that i = 1 n m v m i d X m i = 2 z m d . With this in mind, the GRAP transforms into the following:
(GRAP)
M a x i m i z e   S = d = 1 D P d m = 1 M w m ( 1 2 Z m d ) = d = 1 D P d m = 1 M w m 2 Z m d d = 1 D P d m = 1 M w m
s.t.
(5–7, 12)
Z m d 0 , ϕ ο ρ   m = 1 , K , M   α ν δ i = 1 , K , D
Since p d for d = 1, …, D is an array of constants in the objective function, it is not part of any constraint. In order to maximize S* for a given d, the following function needs to be optimized:
min m = 1 M w m 2 z m d
Since w m for m = 1, …, M, is also an array of constants and the decision variable is Z m d , for each m,  2 Z m d needs to be minimized subject to the constraints and Z m d must be as large as possible. This proves that the RAP is equivalent to the resulting linear integer program.
max S = d = 1 D p d m = 1 M w m Z m d
s.t. (5–7) and (9–10)
Since Z m d = i = 1 n m K m i d X m i , the RAP is restated as the following generalized assignment problem.
max S = d = 1 D p d m = 1 M w m i = 1 n m K m i d X m i
s.t.
i = 1 n m X m i 1 , ϕ ο ρ   m = 1 , , M ,
m = 1 M i = 1 n m C m i X m i B ,
X m i 0,1 ,   ϕ ο ρ   m = 1 , , M   α ν δ i = 1 , , n m
Constraints (19) are capacitated with the budget limit. Following our recently published method (the r-flip paper [42] and recent papers [35,43]), an r-flip local search heuristic is implemented to improve the assignment. In this r-flip heuristic, r = 2, 3, and 4 for the assignment of both components (nodes) and assets that components (nodes) choose from to improve the survivability. The improvement process based on the r-flip heuristic is implemented by the Tabu Search algorithm with an embedded strategic oscillation, which is a search strategy originally proposed as part of tabu search aiming to find solutions in a critical boundary of the search space [44].

3. Results

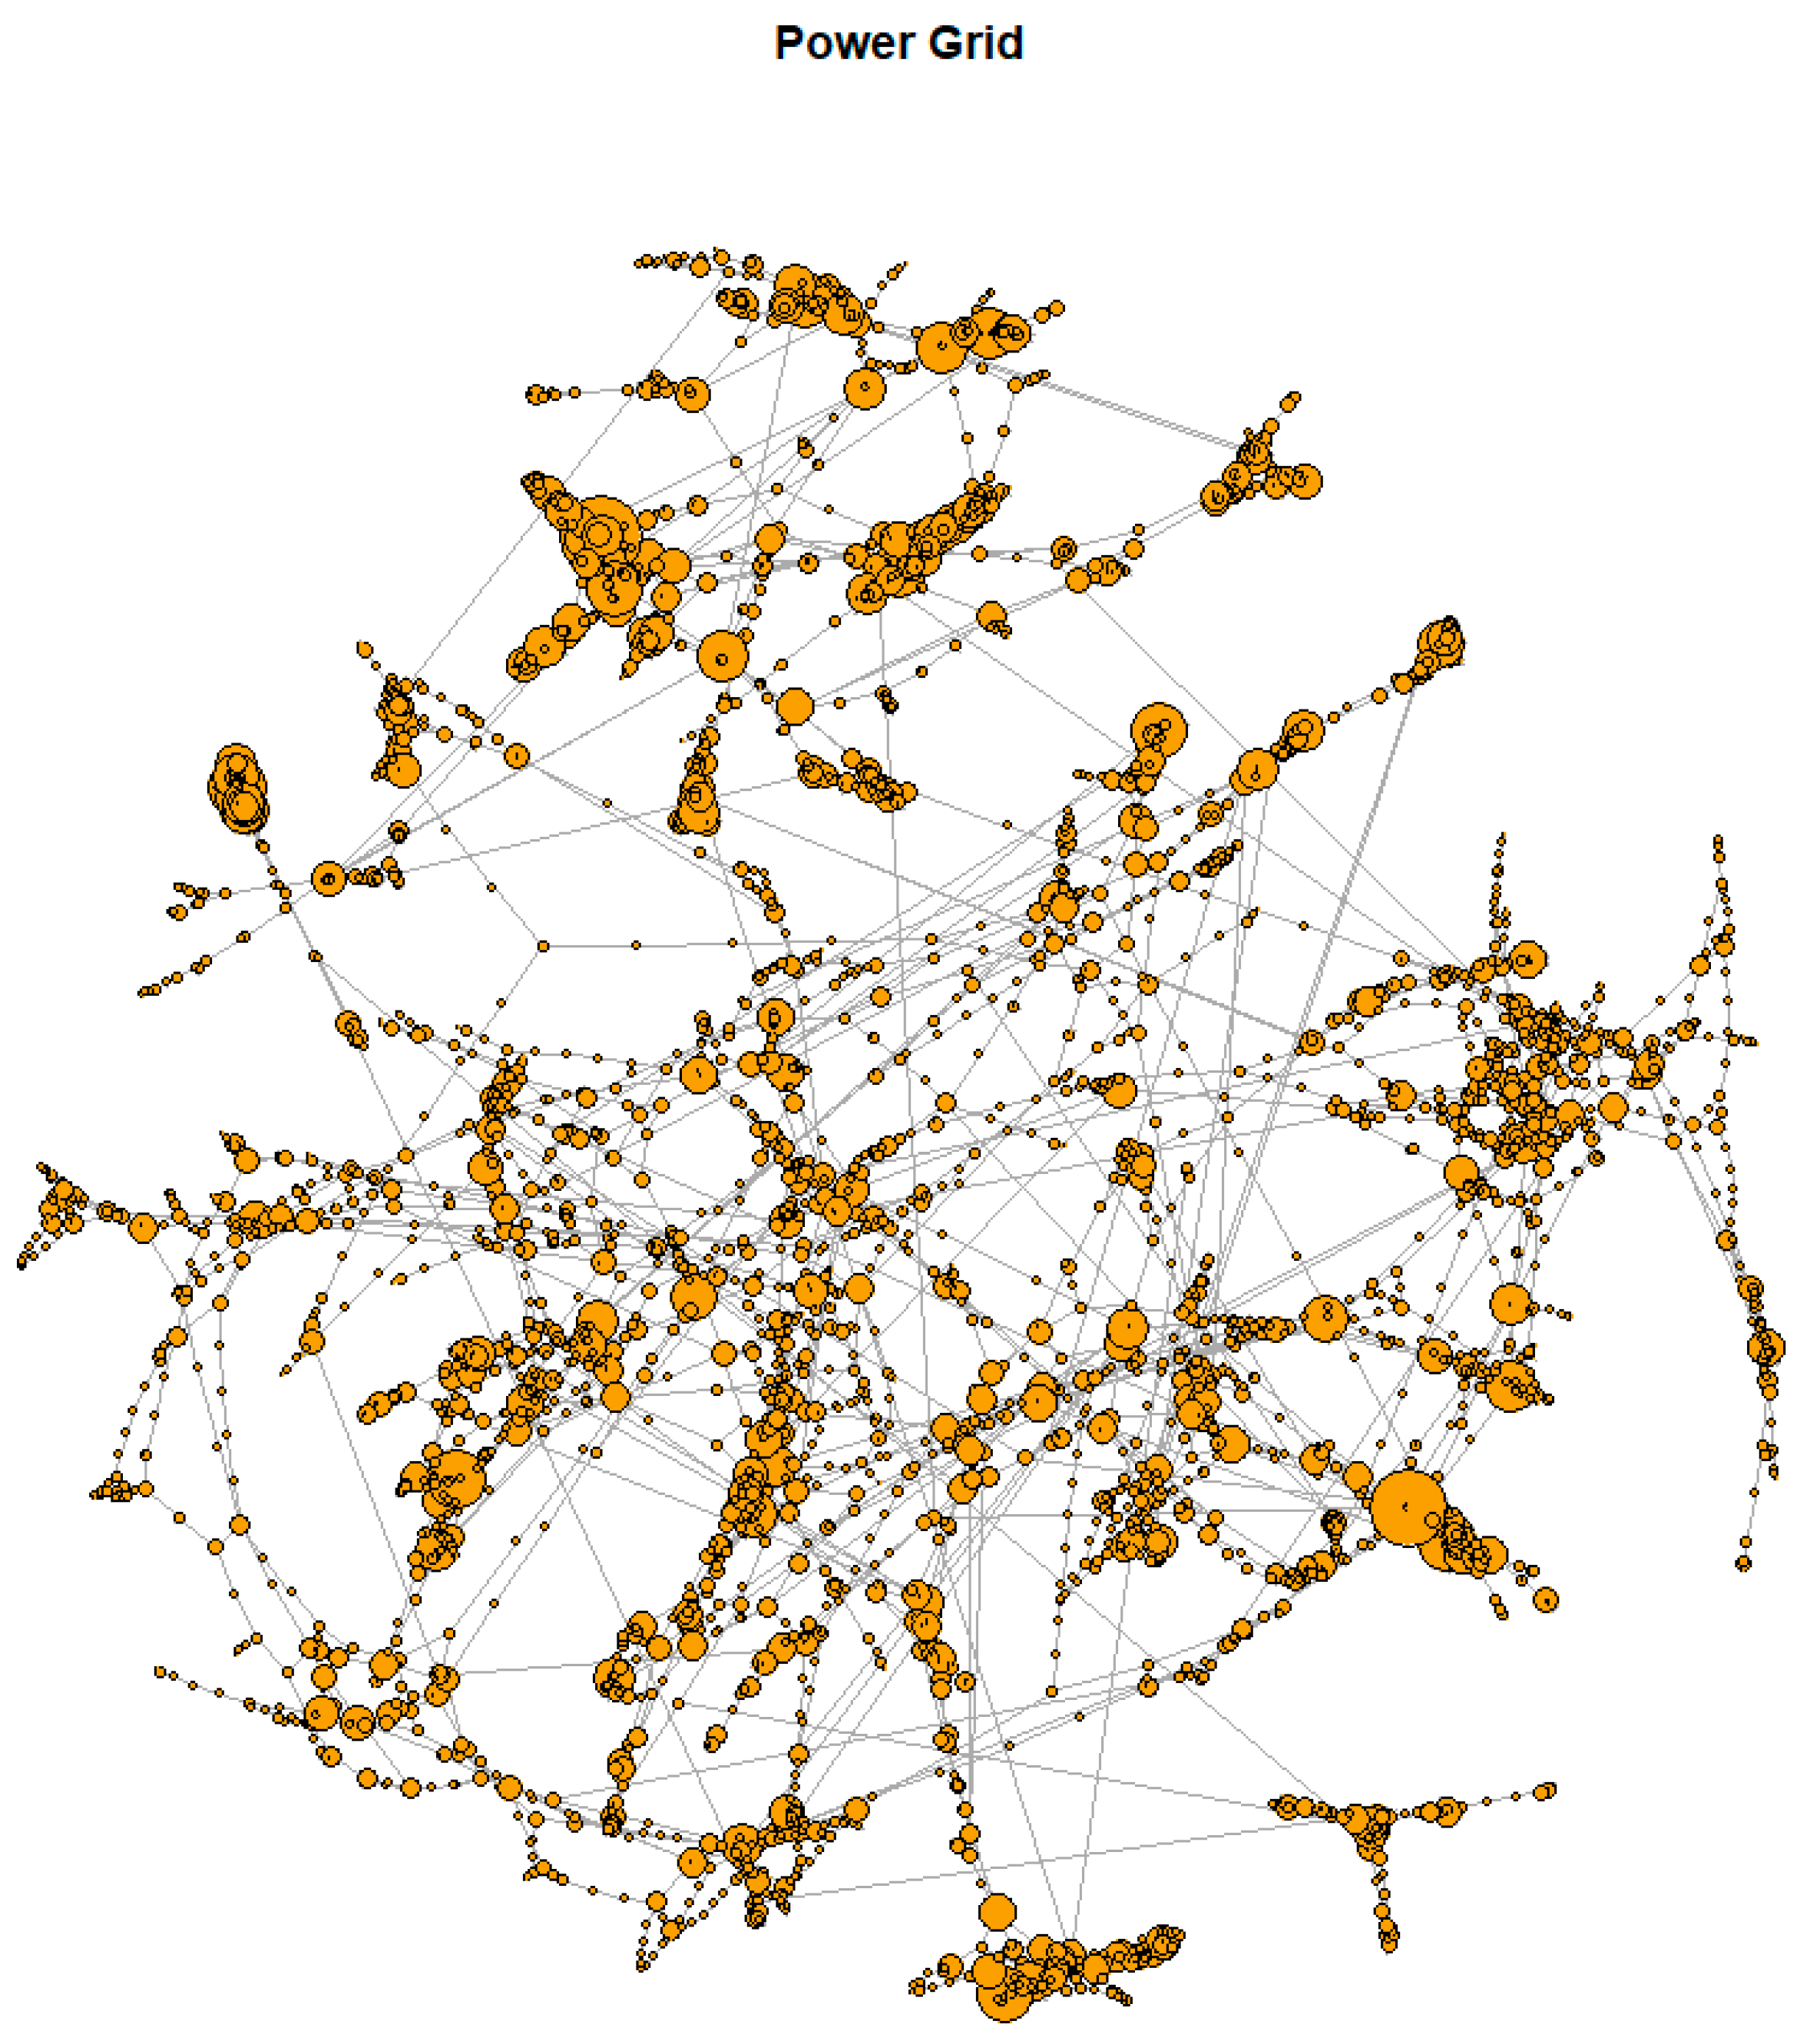
The statistical simulation and optimization experiments are coded in R. A power grid dataset is chosen to illustrate the proposed framework (Figure 2). The dataset has 4941 nodes and 6594 edges, with a maximum distance of 45 between the pair of nodes in the graph [45]. The distance between pairs of nodes in a network is the number of edges in a shortest path (also called a graph geodesic) connecting them, which is also known as the shortest-path distance (or geodesic distance). The minimal distance for 90% of node pairs is 26.
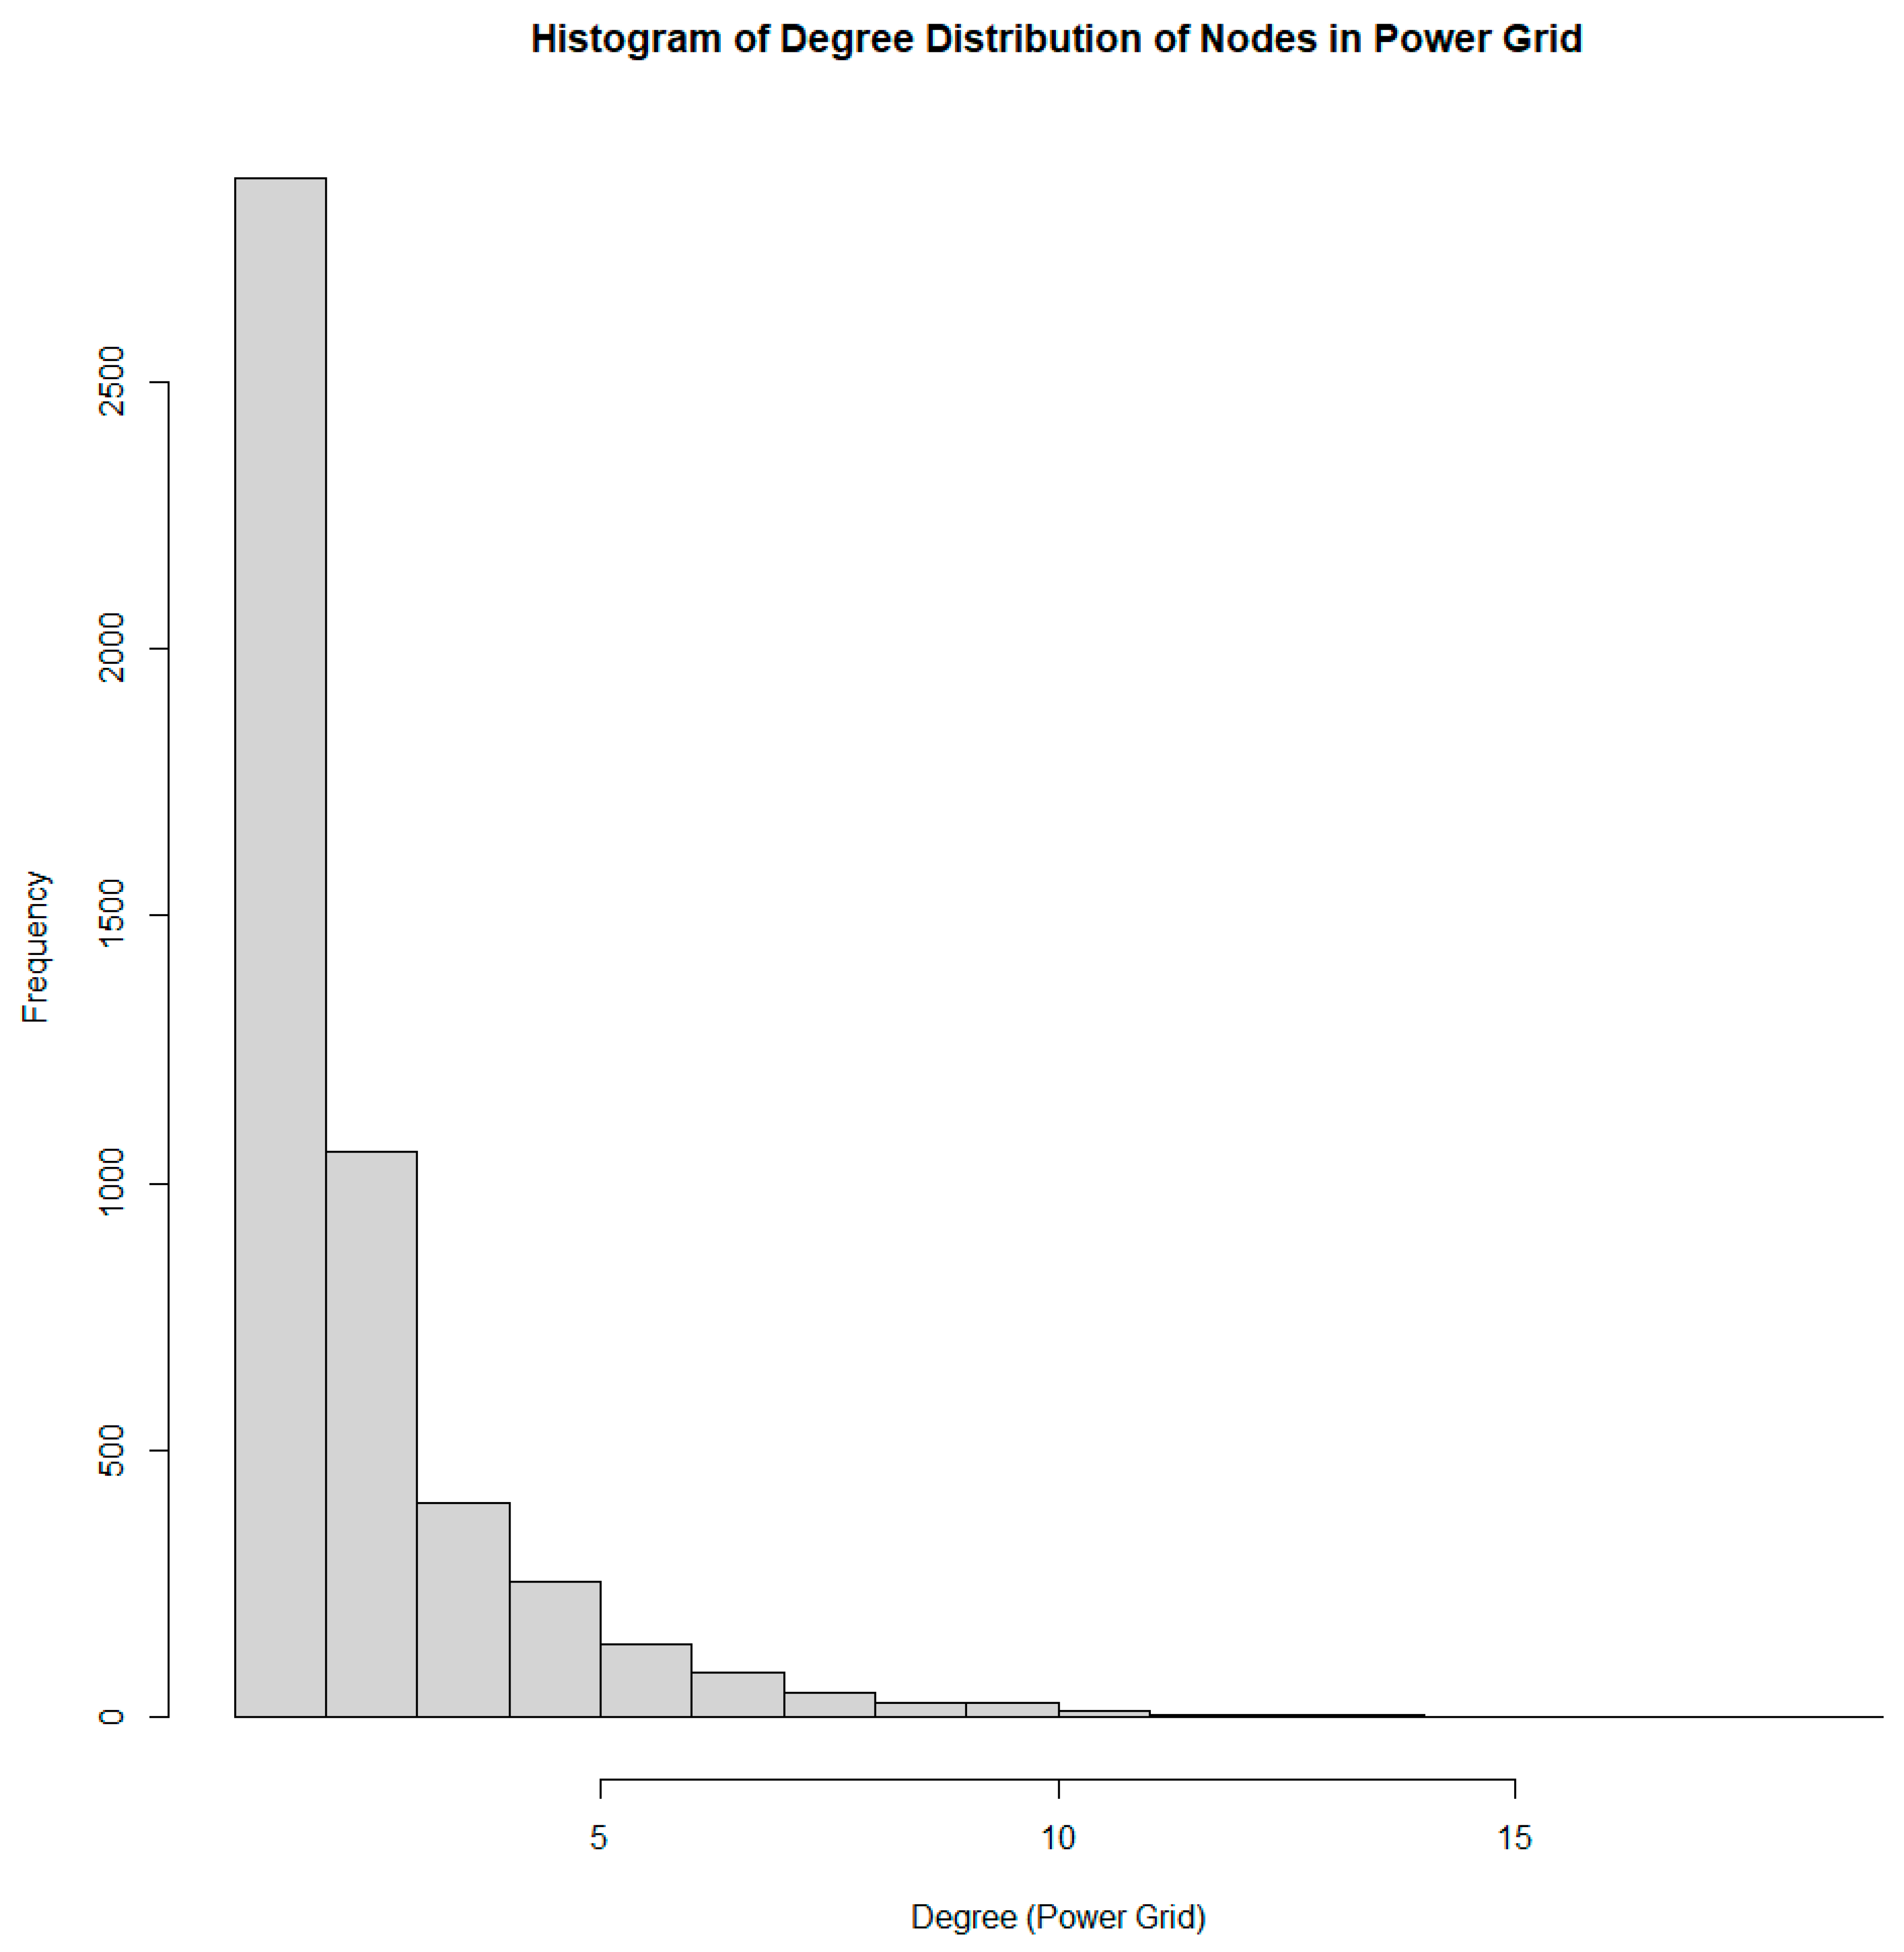
The distribution of degree nodes in the power grid follows the power law distribution with p value = 0.76, which is greater than 0.05, so the data follow the power law distribution [46]. Figure 3 shows the degree distribution of nodes in the power grid.
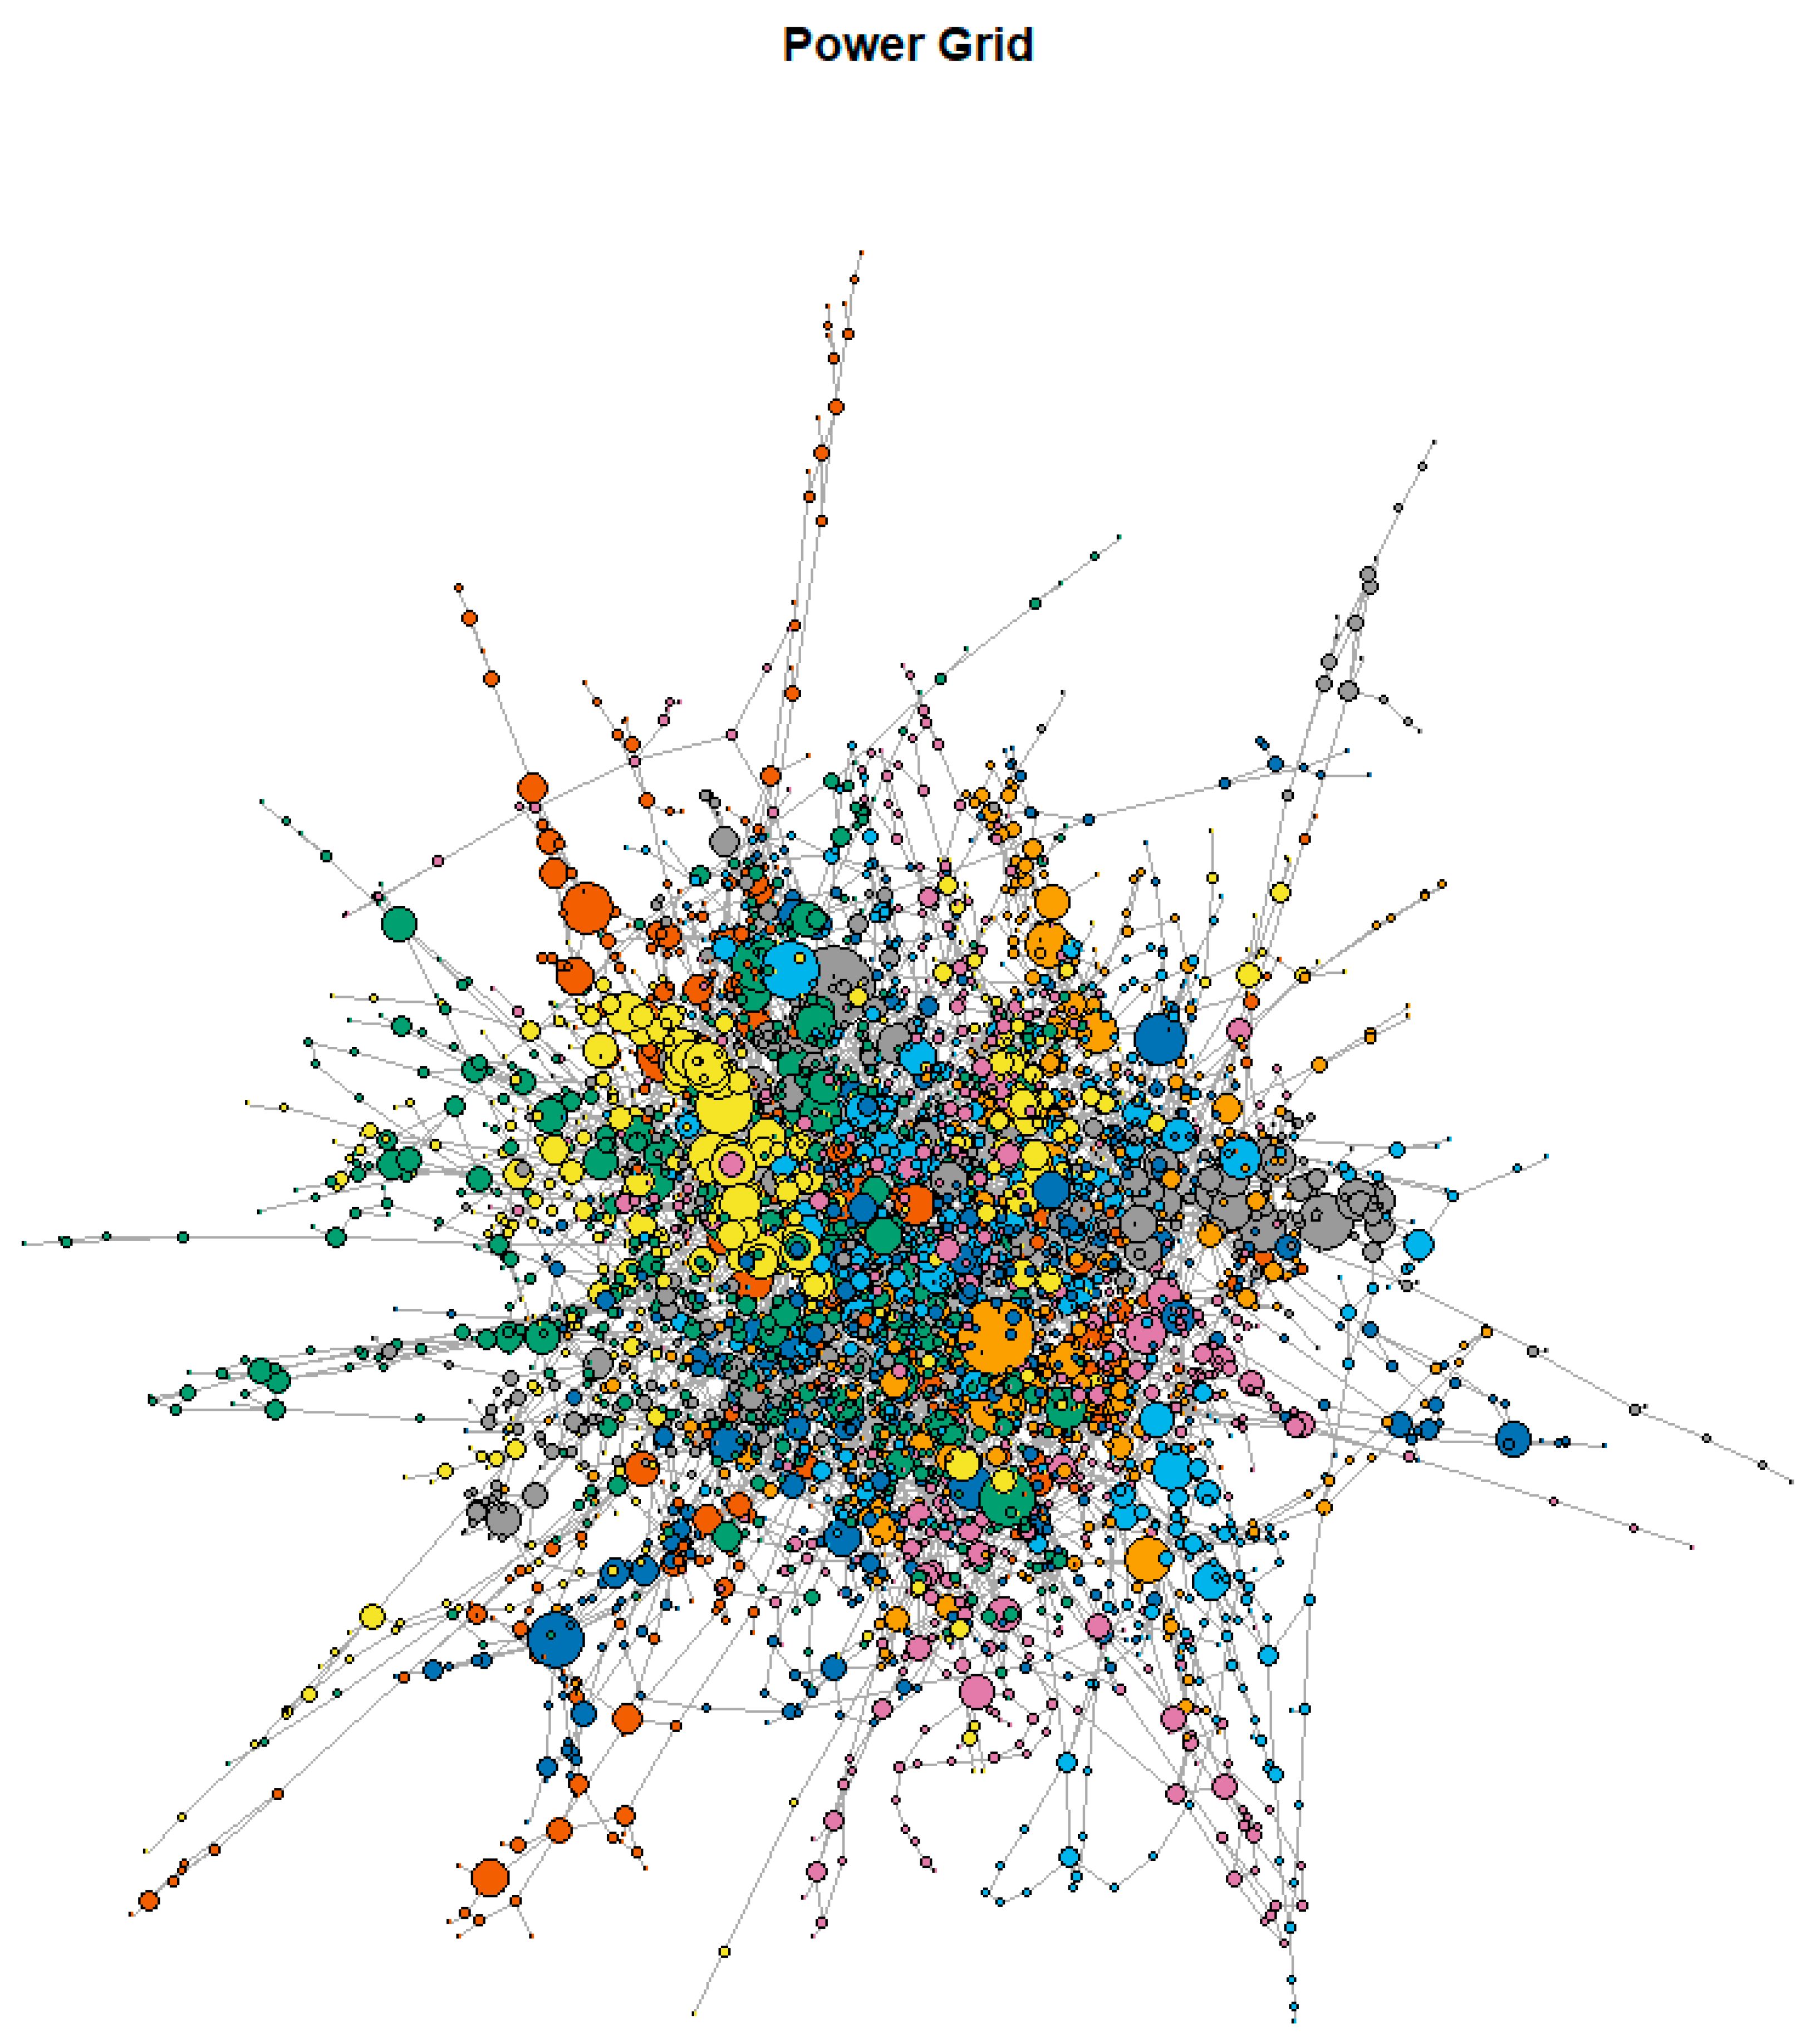
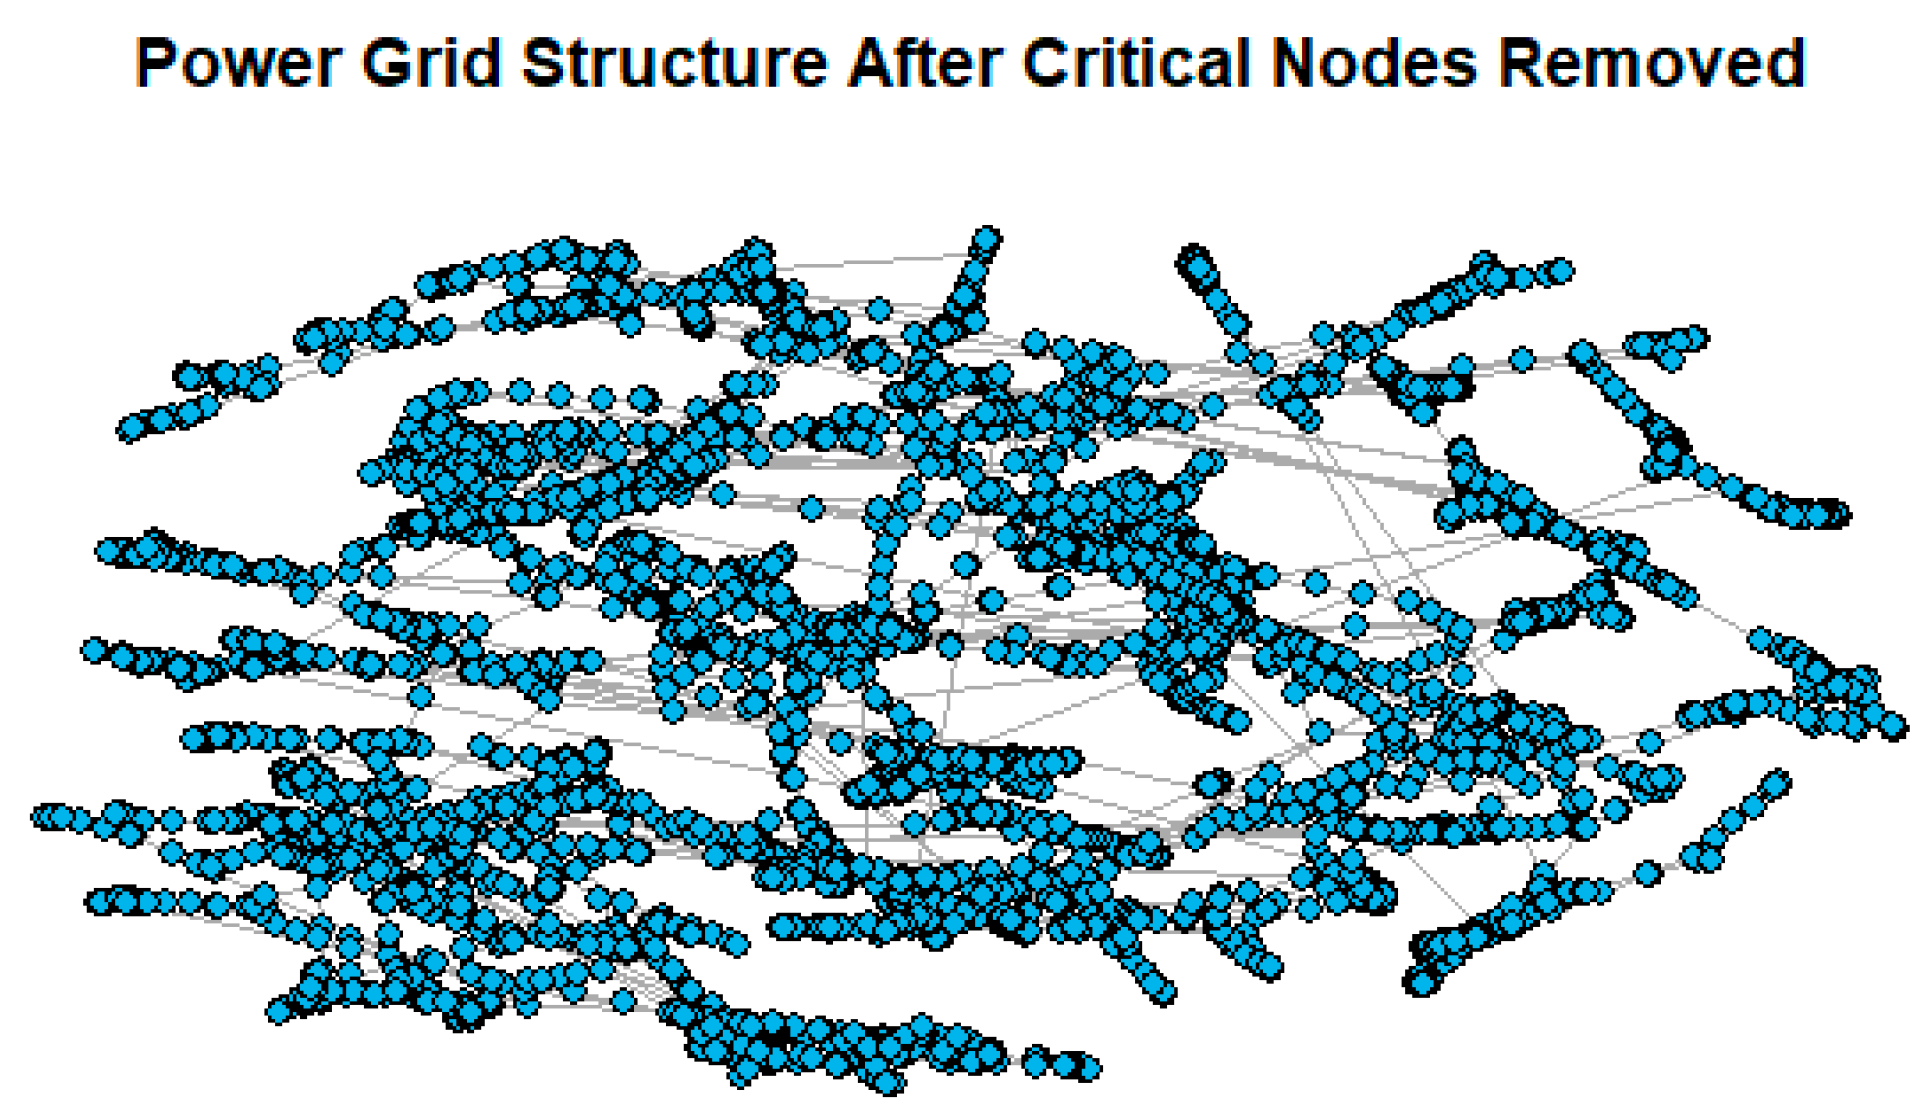
The eigenvector of nodes is obtained using the Spectrum function and the smallest eigenvalues are removed from the matrix. Following the TW distribution test, the critical nodes are identified by the optimization model (1)–(4). Figure 4 highlights the results of the spectral clustering of critical nodes with large vector sizes. Figure 5 shows the network structure after the critical nodes are removed from the graph. The cost of redundancy allocation is computed based on the critical nodes by a heuristic algorithm. Table 3 displays the network nodes’ connectivity after the critical nodes are removed and the average nodes’ connectivity values are measured by the complement of fragmentation score.
To evaluate the impact of resource allocation costs on the redundancy of critical nodes using benchmark datasets, critical nodes are identified based on a reliability threshold ranging from 98% to 99% for the power grid system. In this study, power transformers are examined as the primary components. The cost of a power transformer ranges from USD 600,000 to 4,000,000, with a 15-year life cycle [47]. A cost between USD 600,000 and USD 4,000,000 is assigned for the critical nodes. Table 4 presents the costs associated with redundancy on critical nodes to maintain 98.79-99.74% reliability (connectivity). The table also provides the range of values for nodes of the smart grid. A Congressional Research Service study in 2012 estimated the inflation-adjusted cost of weather-related outages at USD 25 to 70 billion annually [48]. Notably, the cost of redundancy is only a small fraction of the economic losses resulting from weather-related outages.

4. Discussion

The smart grid incorporates proven technologies to optimize its assets—from power plants to distribution substations and critical infrastructure. These advancements lead to increased power flow through existing assets and provide utility-providers with precise insights, enabling them to assess the necessity for additional power plants accurately. Operational enhancements span improved load factors to reduce system losses, resulting in a net reduction in utility costs and enhanced overall efficiency.
The incorporation of redundancy into critical nodes significantly mitigates the risk of system failure or disruption by establishing alternative pathways or resources in the event of a component failure. This design principle fortifies the system against vulnerabilities associated with single points of failure of critical nodes, whether stemming from a natural disaster or a targeted attack. Redundancy encompasses the integration of backup systems or critical nodes poised to seamlessly take over in case of a failure, ensuring uninterrupted operations even if a specific part of the infrastructure associated with critical nodes malfunctions. The effectiveness of redundancy in risk reduction is quantified through the measure of business continuity, as indicated in Table 4. However, it is imperative to strike a balance between the costs and benefits associated with redundancy, particularly in terms of availability.
The results of this study highlight the key strategies to improve the reliability of the smart grid:
  • Redundancy planning—Identify critical components in the smart grid infrastructure. Allocate redundancy by duplicating these components, ensuring backup systems are in place to seamlessly take over in case of failures;
  • Risk assessment—Conduct a thorough risk analysis to understand potential failure points. Allocate redundancies to the most vulnerable areas identified during this assessment;
  • Advanced monitoring—Implement real-time monitoring systems to detect anomalies and potential failures. Use data analytics to predict failure patterns and allocate redundancies accordingly.

5. Conclusions

In the face of unforeseen events or disruptions, redundant critical nodes facilitate swifter recovery, thereby minimizing the impact on essential services. By enhancing fault tolerance, redundancy enables the system to persist even when critical nodes experience faults or errors. This proves critical in maintaining the delivery of vital services and preventing cascading failures. Moreover, redundant critical nodes contribute to accelerated recovery times in the event of a failure. Failover mechanisms can autonomously switch to backup components, reducing downtime and ensuring continuous operation. This multifaceted approach to risk management highlights the pivotal role of redundancy in bolstering the resilience and reliability of critical nodes of the smart grid.
In this paper, a framework that combines statistical learning and optimization to identify critical nodes in the smart grid infrastructure is presented. To optimize the resource allocation for critical nodes, a general redundancy allocation model based on the generalized assignment problem (GAP) is proposed. It includes the generalized redundancy allocation problem (GRAP) as a special case. An equivalent linear GAP of GRAP is provided. The redundancy allocation problem can help determine the redundancy level of nodes in smart grids to maximize system reliability.
Power outages pose an extensive list of risks, including but not limited to economic, health, and public safety. Weather-related outages alone are estimated to cost between USD 25–70 billion in the US annually [49]. Thus, it is vital to develop risk assessment and quick-response plans. The combinatorial statistical simulation and integer programming-based optimization approach proposed in this study offers an efficient framework for managers and decision-makers in determining the critical components of smart grids and optimizing redundancy allocation for a well-planned, organized, and coordinated course of action to be followed in disaster recovery.
Another implication of this study for managers relates to improvements in the capability to the assess risks and vulnerabilities of the smart grid for redundancy allocation, while using limited resources in the most efficient way. The performance of smart grids is closely related to the reliability and uncertainties involved. Thus, risk assessment to systematically detect vulnerabilities with the potential to result in grid failures is an essential component of the future of smart grids.

Author Contributions

Conceptualization, H.W. and B.A.; methodology, H.W. and B.A.; software, J.H.; data curation, H.W. and J.H.; writing—original draft preparation, H.W., L.S.S. and J.H.; writing—review and editing, L.S.S.; supervision, B.A.; funding acquisition, B.A. All authors have read and agreed to the published version of the manuscript.

Funding

This research received no external funding.

Data Availability Statement

The data presented in this study are available on request from the corresponding author.

Conflicts of Interest

The authors declare no conflict of interest.

References

  1. Office of Nuclear Energy. Available online: https://www.energy.gov/ne/articles/department-energy-report-explores-us-advanced-small-modular-reactors-boost-grid (accessed on 1 July 2023).
  2. Department of Energy, Office of Electricity. Available online: https://www.smartgrid.gov/the_smart_grid/smart_grid.html (accessed on 1 July 2023).
  3. Saleem, M.U.; Shakir, M.; Usman, M.R.; Bajwa, M.H.T.; Shabbir, N.; Shams Ghahfarokhi, P.; Daniel, K. Integrating Smart Energy Management System with Internet of Things and Cloud Computing for Efficient Demand Side Management in Smart Grids. Energies 2023, 16, 4835. [Google Scholar] [CrossRef]
  4. Hannan, M.A.; Ker, P.J.; Mansor, M.; Lipu, M.S.H.; Al-Shetwi, A.Q.; Alghamdi, S.M.; Begum, R.A.; Tiong, S.K. Recent advancement of energy internet for emerging energy management technologies: Key features, potential applications, methods and open issues. Energy Rep. 2023, 10, 3970–3992. [Google Scholar] [CrossRef]
  5. Galindo, G.; Batta, R. Review of recent developments in OR/MS research in disaster operations management. Eur. J. Oper. Res. 2013, 230, 201–211. [Google Scholar] [CrossRef]
  6. Wang, J.; Sharman, R.; Zionts, S. Functionality defense through diversity a design framework to multitier systems. Ann. Oper. Res. 2012, 197, 25–45. [Google Scholar] [CrossRef]
  7. Priya, R.K.; Josephkutty, J. An IOT based efficient energy management in smart grid using DHOCSA technique. Sustain. Cities Soc. 2022, 79, 103727. [Google Scholar]
  8. Mishra, P.; Singh, G. Energy Management Systems in Sustainable Smart Cities Based on the Internet of Energy: A Technical Review. Energies 2023, 16, 6903. [Google Scholar] [CrossRef]
  9. Khan, W.Z.; Ahmed, E.; Hakak, S.; Yaqoob, I.; Ahmed, A. Edge computing A survey. Future Gener. Comput. Syst. 2019, 97, 219–235. [Google Scholar] [CrossRef]
  10. Mavromoustakis, C.X.; Batalla, J.M.; Mastorakis, G.; Markakis, E.; Pallis, E. Socially Oriented Edge Computing for Energy Awareness in IoT Architectures. IEEE Commun. Mag. 2018, 56, 139–145. [Google Scholar] [CrossRef]
  11. Perveen, A.; Abozariba, R.; Patwary, M.; Aneiba, A.; Jindal, A. Clustering-based Redundancy Minimization for Edge Computing in Future Core Networks. In Proceedings of the 2021 IEEE 4th 5G World Forum (5GWF), Montreal, QC, Canada, 13–15 October 2021; pp. 453–458. [Google Scholar] [CrossRef]
  12. Shakarami, A.; Ghobaei-Arani, M.; Shahidinejad, A. A survey on the computation offloading approaches in mobile edge computing A machine learning-based perspective. Comput. Netw. 2020, 182, 107496. [Google Scholar] [CrossRef]
  13. Huang, Y.; Ma, X.; Fan, X.; Liu, J.; Gong, W. When deep learning meets edge computing. In Proceedings of the 2017 IEEE 25th International Conference on Network Protocols (ICNP), Toronto, ON, Canada, 10–13 October 2017; pp. 1–2. [Google Scholar] [CrossRef]
  14. Sohn, I. Small-World and Scale-Free Network Models for IoT Systems. Mob. Inf. Syst. 2017, 2017, 6752048. [Google Scholar] [CrossRef]
  15. Faloutsos, M.; Faloutsos, P.; Faloutsos, C. On power-law relationships of the Internet topology. In Proceedings of the Conference on Applications, Technologies, Architectures, and Protocols for Computer Communication, Cambridge, MA, USA, 30 August–3 September 1999. [Google Scholar]
  16. Bebortta, S.; Senapati, D.; Rajput, N.K.; Singh, A.K.; Rathi, V.K.; Pandey, H.M.; Jaiswal, A.K.; Qian, J.; Tiwari, P. Evidence of power-law behavior in cognitive IoT applications. Neural Comput. Appl. 2020, 32, 16043–16055. [Google Scholar] [CrossRef]
  17. Zhang, D.-g.; Zhu, Y.-n.; Zhao, C.-p.; Dai, W.-b. A new constructing approach for a weighted topology of wireless sensor networks based on local-world theory for the Internet of Things (IOT). Comput. Math. Appl. 2012, 64, 1044–1055. [Google Scholar] [CrossRef]
  18. Patsidis, A.; Dyśko, A.; Booth, C.; Rousis, A.O.; Kalliga, P.; Tzelepis, D. Digital Architecture for Monitoring and Operational Analytics of Multi-Vector Microgrids Utilizing Cloud Computing, Advanced Virtualization Techniques, and Data Analytics Methods. Energies 2023, 16, 5908. [Google Scholar] [CrossRef]
  19. Gordon, L.A.; Loeb, M.P. The Economics of Information Security Investment. ACM Trans. Inf. Syst. Secur. 2002, 5, 438–457. [Google Scholar] [CrossRef]
  20. Hsu, C.; Lee, J.-N.; Straub, D.W. Institutional influences on information systems security innovations. Inf. Syst. Res. 2012, 23 Pt 2, 918–939. [Google Scholar] [CrossRef]
  21. Hua, J.; Bapna, S. The economic impact of cyber terrorism. J. Strateg. Inf. Syst. 2013, 22, 175–186. [Google Scholar] [CrossRef]
  22. Wang, J.; Chaudhury, A.; Rao, H.R. Research Note-A Value-at-Risk Approach to Information Security Investment. Inf. Syst. Res. 2008, 19, 106–120. [Google Scholar] [CrossRef]
  23. Kumar, S.; Singh, B.K. Entropy based spatial domain image watermarking and its performance analysis. Multimed. Tools Appl. 2021, 80, 9315–9331. [Google Scholar] [CrossRef]
  24. Veremyev, A.; Prokopyev, O.A.; Pasiliao, E.L. An integer programming framework for critical elements detection in graphs. J. Comb. Optim. 2014, 28, 233–273. [Google Scholar] [CrossRef]
  25. Pavlikov, K. Improved formulations for minimum connectivity network interdiction problems. Comput. Oper. Res. 2018, 97, 48–57. [Google Scholar] [CrossRef]
  26. Ventresca, M. Global search algorithms using a combinatorial unranking-based problem representation for the critical node detection problem. Comput. Oper. Res. 2012, 39, 2763–2775. [Google Scholar] [CrossRef]
  27. Zhang, M.; Wang, X.; Jin, L.; Song, M.; Li, Z. A new approach for evaluating node importance in complex networks via deep learning methods. Neurocomputing 2022, 497, 13–27. [Google Scholar] [CrossRef]
  28. Jin, X.; Chow, T.W.S.; Sun, Y.; Shan, J.; Lau, B.C.P. Kuiper test and autoregressive model-based approach for wireless sensor network fault diagnosis. Wirel. Netw. 2015, 21, 829–839. [Google Scholar] [CrossRef]
  29. Tracy, C.A.; Widom, H. On orthogonal and symplectic matrix ensembles. Commun. Math. Phys. 1996, 177, 727–754. [Google Scholar] [CrossRef]
  30. Kulturel-Konak, S.; Smith, A.E.; Coit, D.W. Efficiently Solving the Redundancy Allocation Problem Using Tabu Search. IIE Trans. 2003, 35, 515–526. [Google Scholar] [CrossRef]
  31. Shao, B.B.M. Optimal redundancy allocation for information technology disaster recovery in the network economy, Dependable and Secure Computing. IEEE Trans. Dependable Secur. Comput. 2005, 2, 262–267. [Google Scholar] [CrossRef]
  32. Cattrysse, D.G.; Wassenhove, L.N.V. A survey of algorithms for the generalized assignment problem. Eur. J. Oper. Res. 1992, 60, 260–272. [Google Scholar] [CrossRef]
  33. Öncan, T. A survey of the generalized assignment problem and its applications. INFOR Inf. Syst. Oper. Res. 2007, 45, 123–141. [Google Scholar] [CrossRef]
  34. Devi, S.; Garg, H.; Garg, D. A review of redundancy allocation problem for two decades bibliometrics and future directions. Artif. Intell. Rev. 2023, 56, 7457–7548. [Google Scholar] [CrossRef]
  35. Wang, H.; Alidaee, B.; Ortiz, J.; Wang, W. The multi-skilled multi-period workforce assignment problem. Int. J. Prod. Res. 2020, 59, 5477–5494. [Google Scholar] [CrossRef]
  36. Wang, H.; Huo, D.; Alidaee, B. Position Unmanned Aerial Vehicles in the Mobile Ad Hoc Network. J. Intell. Robot. Syst. 2014, 74, 455–464. [Google Scholar] [CrossRef]
  37. Alidaee, B.; Gao, H.; Wang, H. A note on task assignment of several problems. Comput. Ind. Eng. 2010, 59, 1015–1018. [Google Scholar] [CrossRef]
  38. Campbell, G. Cross-Utilization of Workers Whose Capabilities Differ. Manag. Sci. 1999, 45, 722–732. [Google Scholar] [CrossRef]
  39. Campbell, G.M.; Diaby, M. Developing and evaluation of an assignment heuristic for allocating cross-trained workers. Eur. J. Oper. Res. 2002, 138, 9–20. [Google Scholar] [CrossRef]
  40. Sadatdiynov, K.; Cui, L.; Zhang, L.; Huang, J.Z.; Salloum, S.; Mahmud, M.S. A review of optimization methods for computation offloading in edge computing networks. Digit. Commun. Netw. 2022, 9, 450–461. [Google Scholar] [CrossRef]
  41. Lin, H.; Zeadally, S.; Chen, Z.; Labiod, H.; Wang, L. A survey on computation offloading modeling for edge computing. J. Netw. Comput. Appl. 2020, 169, 102781. [Google Scholar] [CrossRef]
  42. Alidaee, B.; Kochenberger, G.; Wang, H. Theorems Supporting r-flip Search for Pseudo-Boolean Optimization. Int. J. Appl. Metaheuristic Comput. 2010, 1, 93–109. [Google Scholar] [CrossRef]
  43. Wang, H.; Alidaee, B. Unrelated Parallel Machine Selection and Job Scheduling with the Objective of Minimizing Total Workload and Machine Fixed Costs. IEEE Trans. Autom. Sci. Eng. 2018, 15, 1955–1963. [Google Scholar] [CrossRef]
  44. Cavero, S.; Pardo, E.G.; Glover, F.; Martí, R. Strategic oscillation tabu search for improved hierarchical graph drawing. Expert Syst. Appl. 2024, 243, 122668. [Google Scholar] [CrossRef]
  45. Watts, D.J.; Strogatz, S.H. Collective dynamics of “small-world” networks. Nature 1998, 393, 440–442. [Google Scholar] [CrossRef]
  46. Clauset, A.; Shalizi, C.R.; Newman, M.E.J. Power-Law Distributions in Empirical Data. SIAM Rev. 2009, 51, 661–670. [Google Scholar] [CrossRef]
  47. Copper Development Association. Available online: https://www.copper.org/environment/sustainable-energy/transformers/education/trans_life_cycle.html (accessed on 1 July 2023).
  48. U.S. Department of Energy’s Office of Electricity Delivery and Energy Reliability. Available online: https://www.energy.gov/articles/economic-benefits-increasing-electric-grid-resilience-weather-outages (accessed on 1 July 2023).
  49. Volodarsky, M. The Smart Grid, A Smart Investment. Available online: https://esg.wharton.upenn.edu/news/the-smart-grid-a-smart-investment/ (accessed on 1 July 2023).
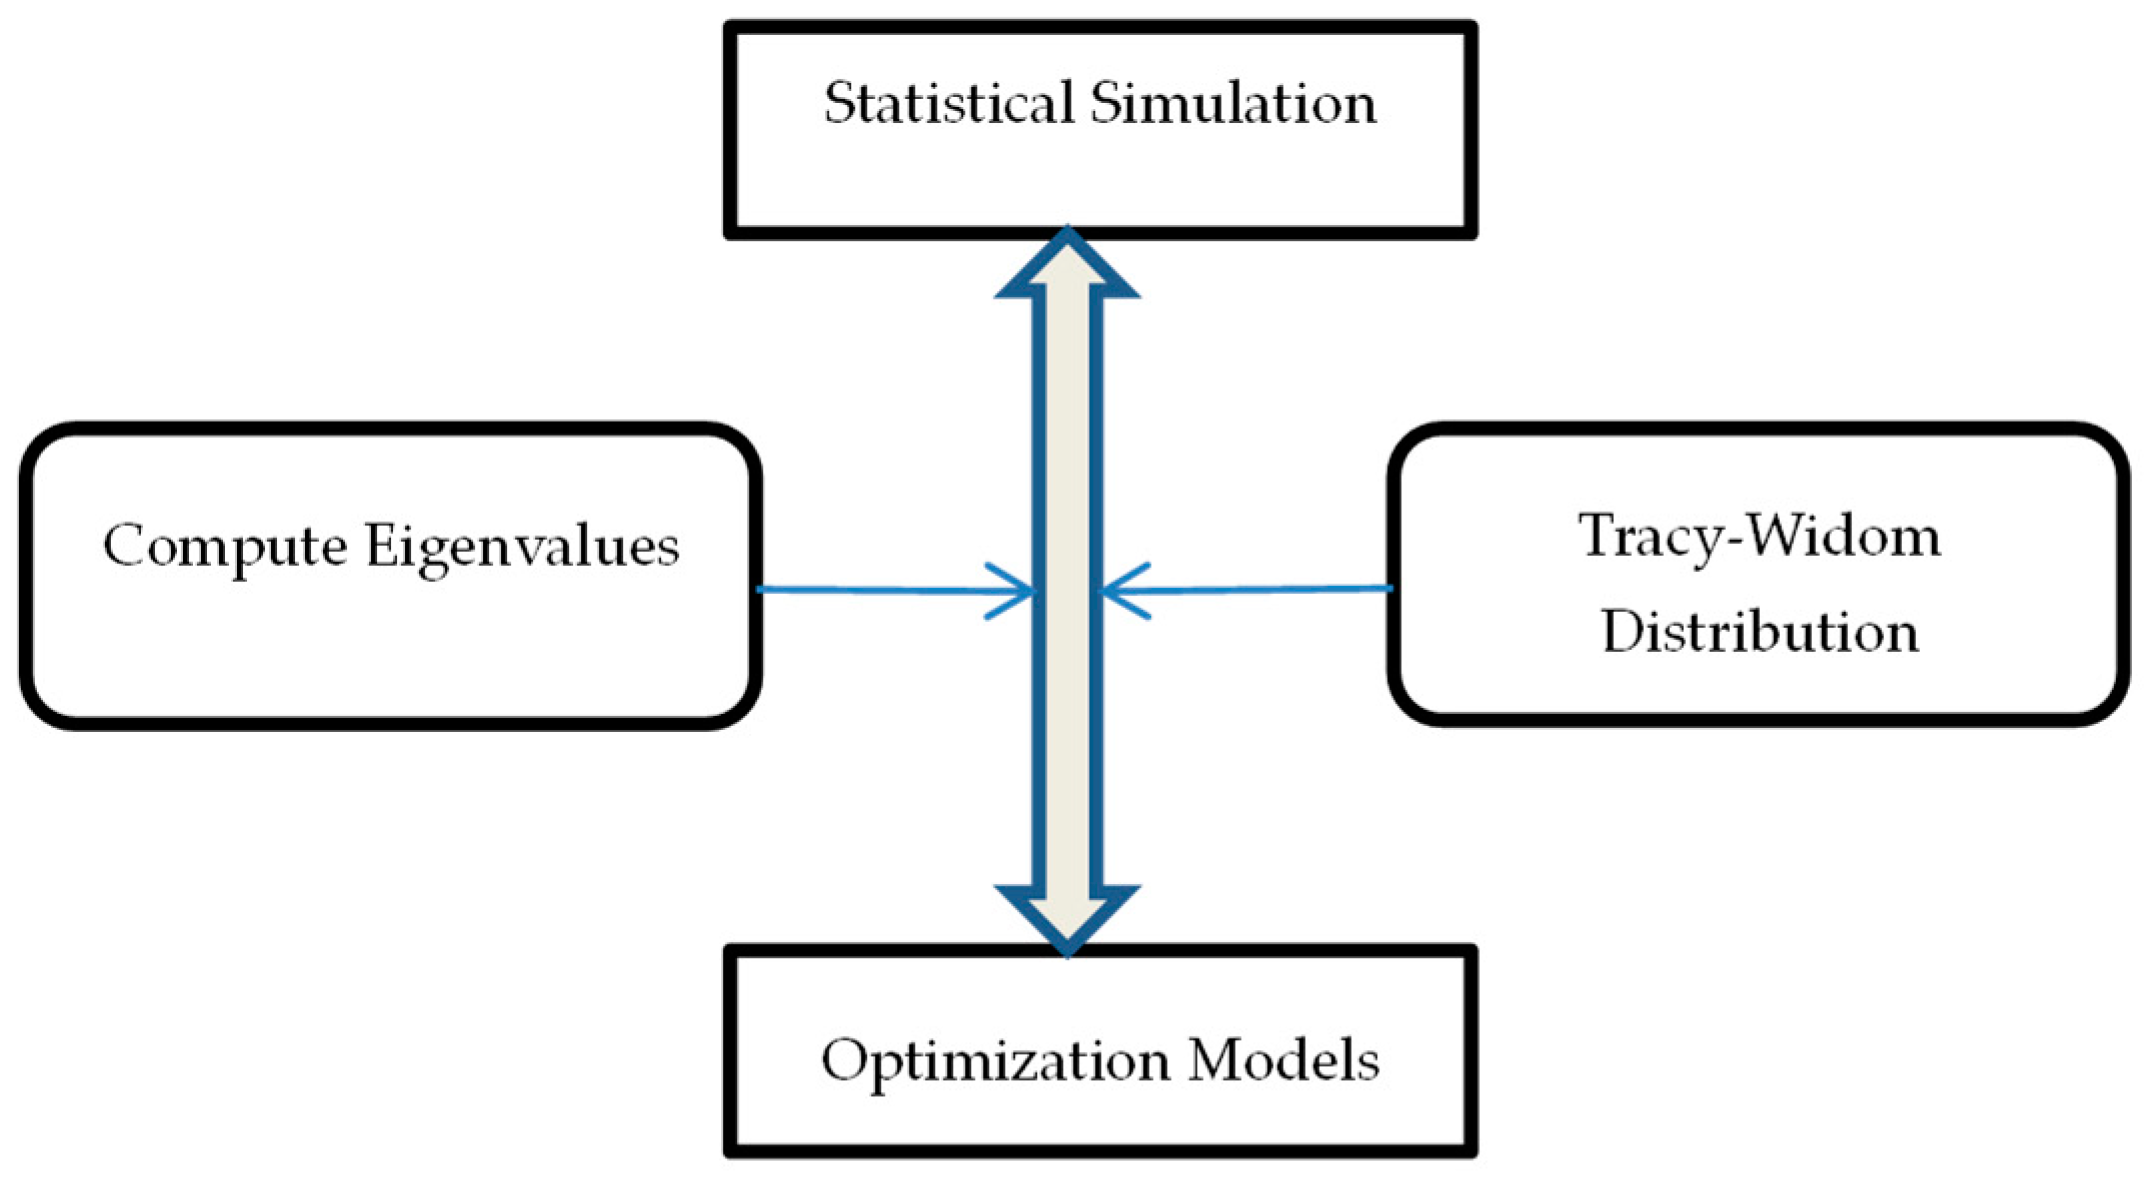
Figure 1. Statistical simulation–optimization framework.
Energies 17 00225 g001
Figure 2. Node connectivity of power grid.
Energies 17 00225 g002
Figure 3. Histogram for power grid nodes.
Energies 17 00225 g003
Figure 4. Results of spectral clustering of critical nodes.
Energies 17 00225 g004
Figure 5. Results of node connectivity after critical nodes are removed.
Energies 17 00225 g005
Table 1. Mathematical models for identifying critical nodes and links.
ClassMethodsReference
Entropy-basedGraph neural network[23]
NodedDeletionMixed integer programming[24]
Network interdictionMixed integer linear programming[25]
Maximum k-cut problemSimulated annealing [26]
Table 2. Mathematical models for identifying critical nodes and links.
ClassMethodsReference
Model-basedStructure–mechanics[28]
Distribution-basedTracy–Widom distribution[29]
Table 3. Statistical learning of embedding networks to identify critical nodes and links.
Number of Removed Critical NodesConnectivity
50.0615851
100.0605954
150.0592443
Table 4. Cost of redundancy on critical components in the power grid system.
PowerGridSizeCritical NodesCost of Redundancy (USD) Reliability
South Carolina cities5001313,744,37799.74%
Texas cities20001719,378,00299.66%
Texas state67173147,454,58099.63%
Midwest24,00059104,646,07199.61%
West-East US80,000156312,855,05998.79%
Disclaimer/Publisher’s Note: The statements, opinions and data contained in all publications are solely those of the individual author(s) and contributor(s) and not of MDPI and/or the editor(s). MDPI and/or the editor(s) disclaim responsibility for any injury to people or property resulting from any ideas, methods, instructions or products referred to in the content.