Review

Storage Sites for Carbon Dioxide in the North Sea and Their Particular Characteristics

1
Department of Chemical and Environmental Engineering, Faculty of Engineering, University of Nottingham, University Park, Nottingham NG7 2RD, UK
2
Geo-Energy Research Centre, University of Nottingham, University Park, Nottingham NG7 2RD, UK
*
Author to whom correspondence should be addressed.
Energies 2024, 17(1), 211; https://doi.org/10.3390/en17010211
Submission received: 5 December 2023 / Revised: 19 December 2023 / Accepted: 27 December 2023 / Published: 30 December 2023
(This article belongs to the Collection Feature Papers in Carbon Capture, Utilization, and Storage)

Abstract

:
This paper reviews and evaluates work on the structural complexity of the potential carbon dioxide storage sites in the North Sea, including the nature of the reservoir structures, the reservoir rocks, the presence of inter-layers, faults, and fractures, and how these factors influence carbon dioxide capacity. In particular, the review emphasises the significance of studying caprocks in detail, not just the reservoir rock’s carbon dioxide storage capacity. This work also particularly considers reservoir simulation work on North Sea sites and illustrates the importance of using fully coupled flow–geomechanical–geochemical modelling to ensure that complex feedback and synergistic effects are not missed. It includes comparisons with other sites where relevant. It also discusses recent challenges and controversies that have arisen from simulations of sequestration in North Sea reservoirs and the need for comprehensive field data to resolve these issues.

1. Introduction

The 2015 Paris Agreement aimed at the reduction of global anthropogenic carbon dioxide emissions to attempt to curtail the global temperature increase to just 1.5 °C [1], and, following on from the Paris Agreement, are national targets, such as the UK Climate Action 2050 net zero greenhouse gas emission goal [2]. Achieving these targets requires the capture and subsequent storage of carbon dioxide [3] from fossil fuel-fired power stations and petrochemical refineries [4]. A variety of potential geological storage sites are possible, as shown in Figure 1. This work will largely concentrate on deep saline aquifers. One of the key challenging elements in the carbon capture and storage (CCS) chain is to identify, characterise, and de-risk potential carbon dioxide storage sites [5].
In order to understand and potentially mitigate these risks, it is advantageous to conduct reservoir simulations of carbon dioxide injection beforehand. To be able to provide accurate predictions, it is necessary to have a full understanding of the particular geological features of the reservoir that will affect plume behaviour in order to incorporate them into the model. Fully exhaustive modelling of extensive reservoirs is often not possible due to computing limitations and/or a lack of full knowledge of the reservoir geology. Hence, a lot of reservoir simulation work has been conducted to assess the relative importance of different geological features to plume migration to see if they can be neglected or need to be detected for inclusion.
Despite its relatively small area, the North Sea region has many varied and interesting geological features [6,7], and their potential impacts on carbon storage have been explored extensively in previous studies using reservoir simulation. The objectives of this work are
(i)
To survey the general background of the North Sea region and issues with reservoir simulation.
(ii)
An in-depth consideration of the many simulations studying the various, particular geological features arising within the North Sea reservoirs. This survey will make evident that there are still several areas of contention and disagreement within this body of work.
(iii)
A particular examination of competing explanations and conflicting findings that exist in some areas of CCS, such as the reasons for the unexpected rapid rise in the carbon dioxide plume within the Sleipner reservoir.

2. General Background

The North Sea is considered the most promising potential site for a carbon dioxide storage hub due to its long history of hydrocarbon exploration and production, and, thence, has associated production records, relatively well-known geological structures, subsurface data available, and infrastructure already in place. Furthermore, around the periphery of the North Sea are several industrial centres that could be converted to employ carbon capture technology, and the North Sea region contains more than half of the carbon dioxide storage capacity in Europe [8,9]. An estimate of the potential storage capacity of saline aquifers under the North Sea, considering 441 sites in five countries and using a time-dependent pressure increase rather than a simple volume-based approach, has suggested it is sufficient to enable a significant contribution to keeping European net emissions below that which would possibly produce a 1.5 °C temperature rise [10]. The North Sea is already hosting the world’s first commercial CCS project, namely Sleipner [11], and there are also plans for other CCS initiatives, such as the Net Zero Teesside project in the UK and the Porthos CCUS (carbon capture, utilisation, and storage) project in the Netherlands, all of which are at advanced stages of development [5]. The Acorn project, located in the central North Sea basin, aims to design and implement a full-chain CCS system at minimum capital cost of capture, transportation, and storage [12]. Additionally, as part of Denmark’s global climate action strategy, there are plans to store carbon dioxide in Chalk reservoirs of depleted oil and gas fields in the Danish North Sea [13]. Several stratigraphic units have been investigated for their contribution to the energy transition in the southern North Sea, including the Triassic Bunter Sandstone Formation and the Lower Permian Leman Sandstone Formation [14,15,16].

2.1. Key Geological Structures in the North Sea

While there are several potential structures for carbon storage in the North Sea, two, in particular, namely the Bunter Sandstone and the Sleipner field, have received a lot of attention, and these are introduced in more detail in this section. The Bunter Sandstone lies off the east coast of England and is part of a major sandstone reservoir formation that outcrops onshore as the Sherwood Sandstone Group [17,18], as shown in Figure 2. The Bunter Sandstone is divided by the Dowsing Fault Zone and Central Fracture Zone into the shallower East England Shelf and a deeper basin to the east [19]. The development of salt pillows due to salt movement in the underlying Zechstein Group has meant that the local topography of the top of the overlying Bunter Sandstone is quite undulating, with a number of dome-like structures, as seen in Figure 3. Above the Bunter Sandstone is the Upper Triassic Haisborough Group, which consists of mudstones and evaporates. The Bunter shale lies underneath the Bunter Sandstone.
The Sleipner area is located within the Norwegian sector of the central North Sea (see Figure 4a). The geological structure has been described previously by Bøe and Zweigel [22]. The overall structure of the North Sea is a subsiding basin that has been filled by alternating layers of mudrocks/shales and sands and sporadically by evaporite layers. The Sleipner reservoir rock is the Utsira sand, and the upper Pliocene Nordland Shale provides the seal (see Figure 4b). In the Sleipner area, the caprock varies in thickness between approximately 200 m and 300 m [23], and its base is approximately 800 m below sea level. The sediments of the Nordland shale are typically clay silts or silty clays and comprise three units:
The Upper Seal has a thickness between 70 and 100 m. The Upper Seal sediments generally comprise marine and glacimarine muddy and clayey material, plus some sands, and have been repeatedly influenced by significant glacial episodes (e.g., Refs. [24,25,26]).
Sedimentary units within the Middle Seal are about 100 to 150 m thick and generally comprise fine-grained hemipelagic distal sediments sourced from the large river systems of northern Europe [27,28,29].
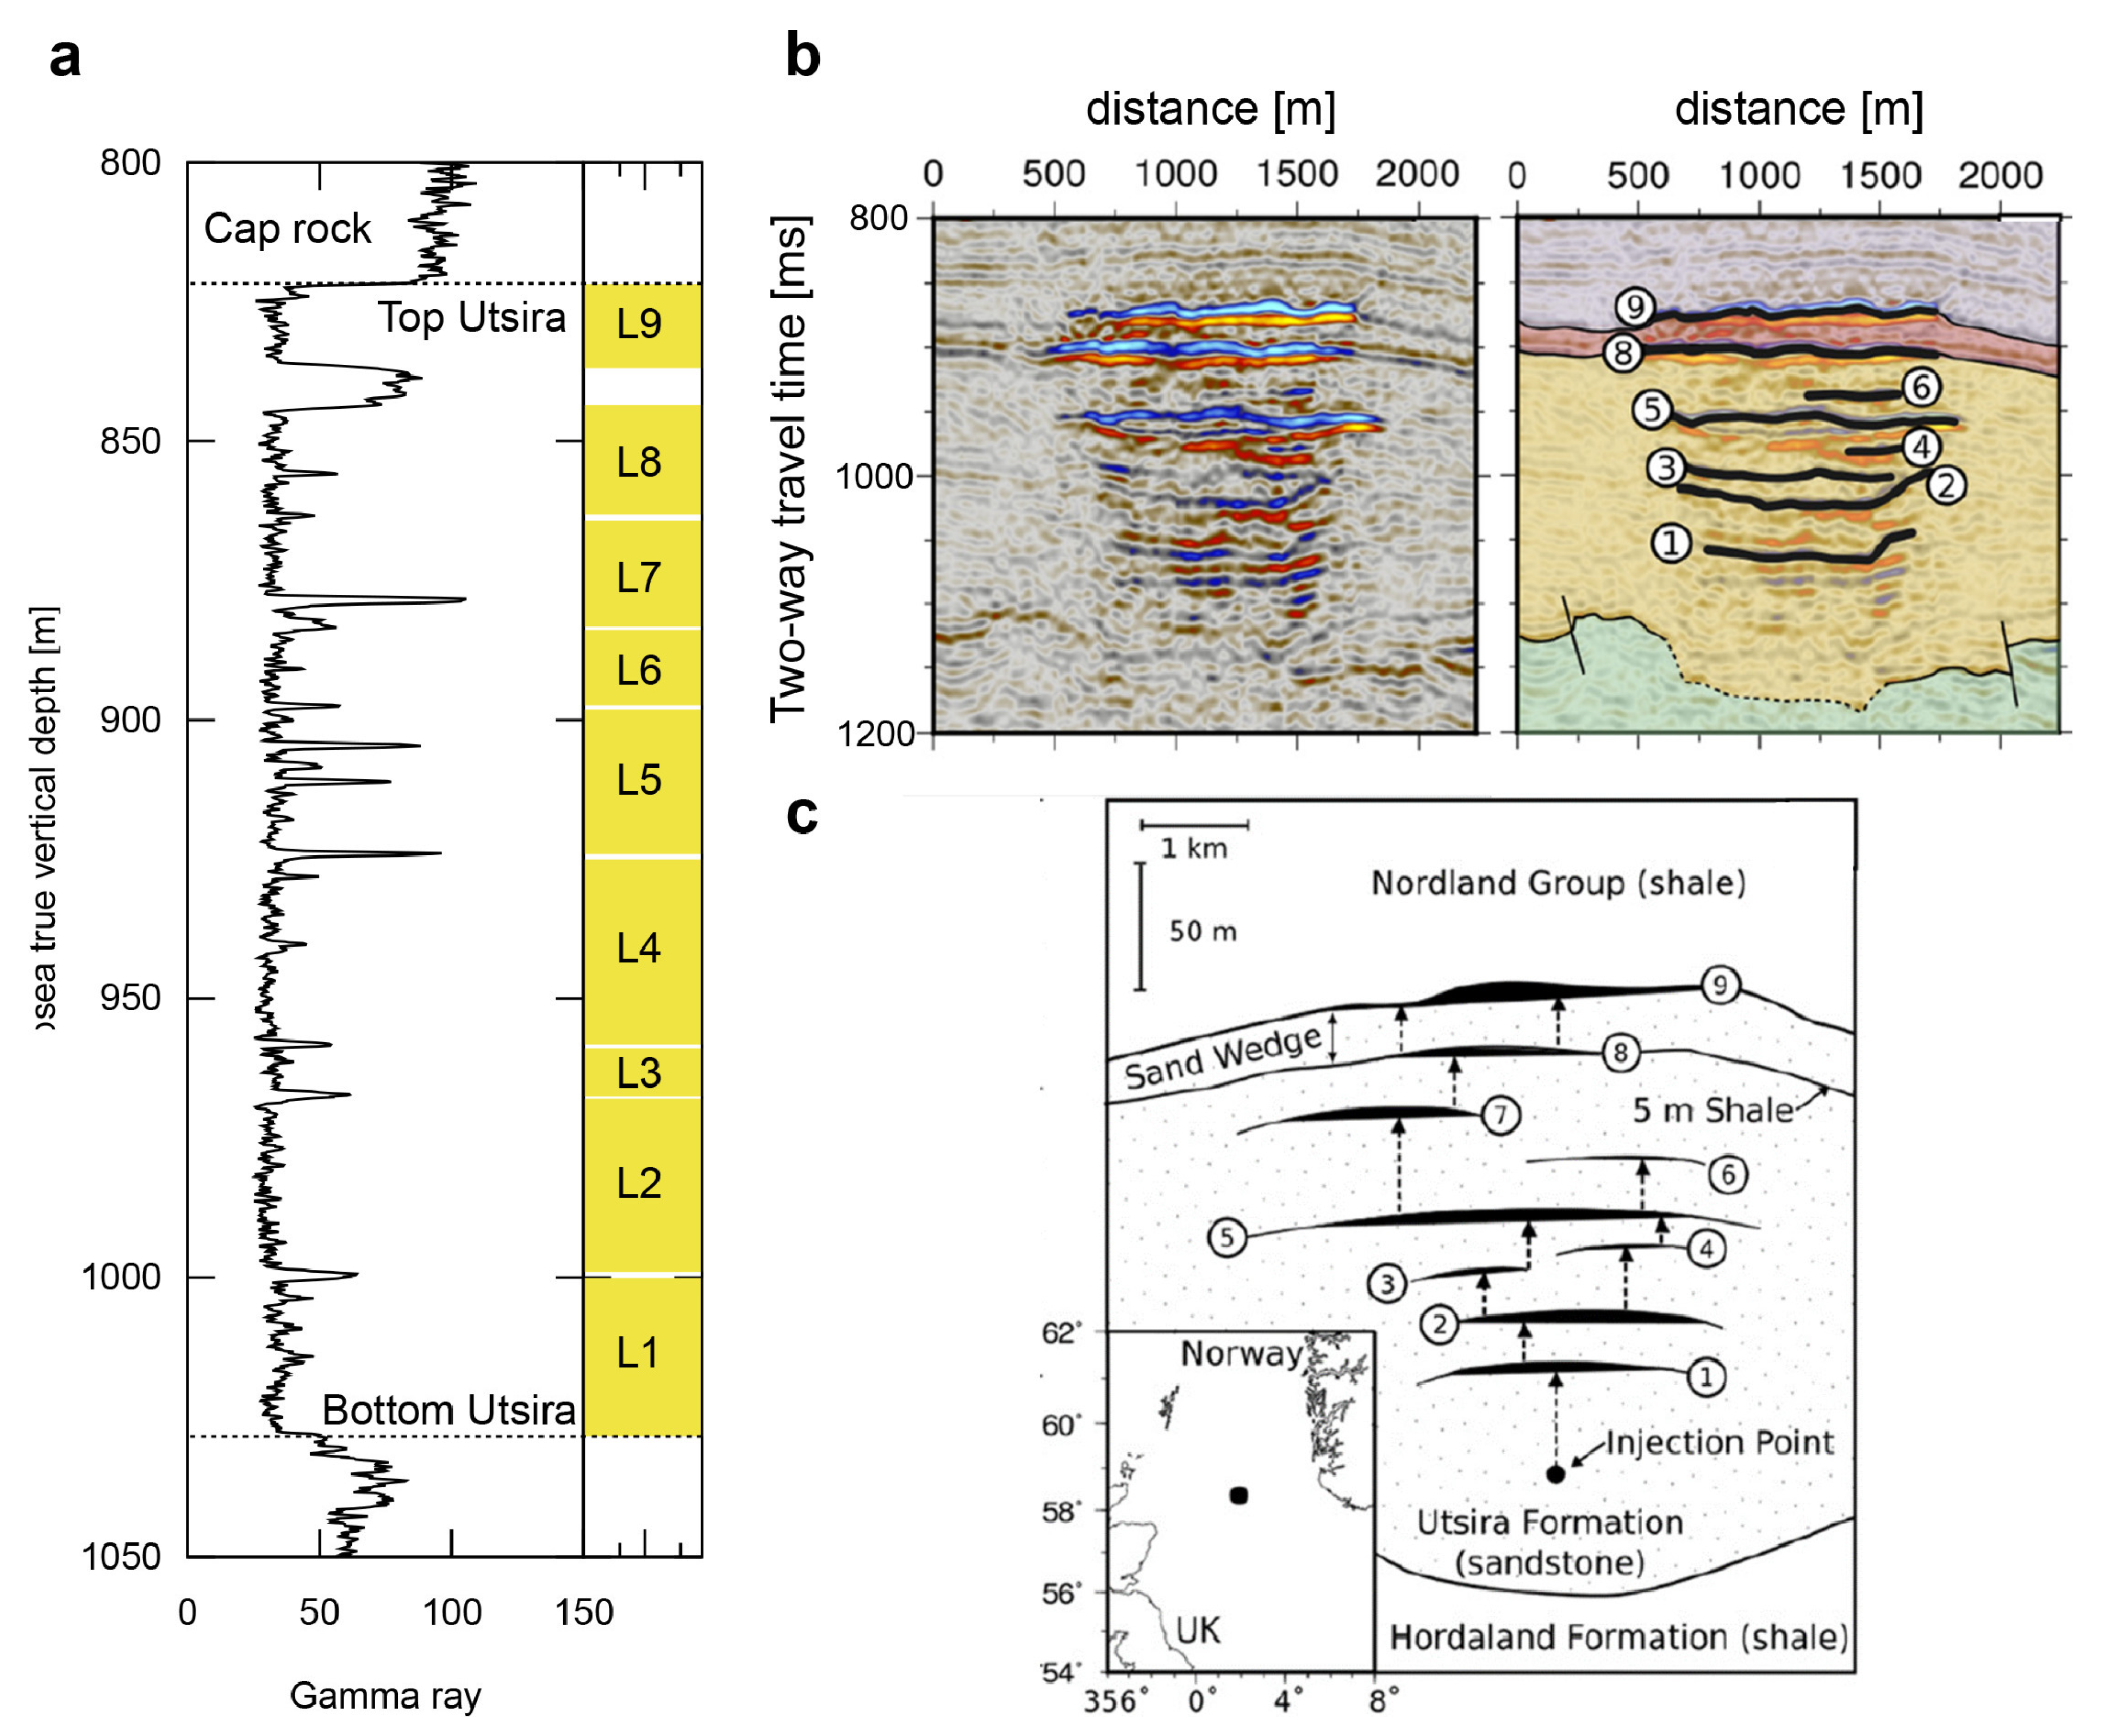
The Lower Seal, located immediately on top of the storage reservoir (and hence the most important), is about 50 to 100 m thick and generally comprises shaly, basin-dominated sediment. It also includes a sand wedge up to 25 m thick. The shale has a high clay content, and drilling logs suggest over 80% shale volume [30].
Figure 4. (a) Isopach map of the Utsira Sand and (inset) representative geophysical well logs showing reservoir heterogeneity (γ-ray logs on the left tracks and resistivity logs on the right tracks). The reservoir sand has characteristically low γ-ray and resistivity readings, so peaks within the sand denote thin mudstones. The topmost reservoir sand unit lies above the 5-metre mudstone. IP = injection point. (reproduced under the terms of the Creative Commons CC-BY license from Williams and Chadwick [31]); (b) Annotated seismic reflection section through the Sleipner area, with the key reservoir rock and caprock units highlighted (from the SACS2 project final report, Chadwick et al. [30]). ‘twtt’ = two-way travel time of the seismic signal, and here represents relative depth.
Energies 17 00211 g004

2.2. Key Issues in Geological Storage

A major complication arises in the storing aspect of carbon capture and storage (CCS). This is that, when injecting into a reservoir in which the temperature and pressure are higher than 7.2 MPa and 31 °C, the carbon dioxide is in the supercritical phase (scCO2). The buoyancy force (due to the difference in density of the carbon dioxide and that of the in situ pore fluid) potentially causes the rise in carbon dioxide molecules from the injection point and through the reservoir to form a plume at the reservoir–caprock interface. The increasing buoyancy force, as the thickness of the plume increases, leads to an increase in pressure at the base of the caprock. Thus, carbon dioxide leakage from the underground storage to the atmosphere via connected faults and fractures in the caprock is possible, as seen in Figure 1. Therefore, seal strength characterisation is necessary to prevent any carbon dioxide leakage [32].
The overburden seal usually consists of fine-grain rocks, which have a significantly small pore throat radius compared to the reservoir below and act as an impermeable layer. Watts [33] used the failure mechanism of caprocks to classify them into two categories, namely membrane and hydraulic seals, as seen in Figure 5. When caprock sealing is controlled by capillary entry pressure and fails due to capillary leakage, it is referred to as a membrane seal. In contrast, if the caprock exhibited high capillary pressure, such that the mechanical stability of the intact rock was exceeded before the fluid pressure reached the capillary displacement pressure, then it is referred to as a hydraulic seal.
The two largest industrial centres facing the southern North Sea are located on the north coast of England at Humberside and Teesside. The southern North Sea is geographically well-placed to accommodate carbon dioxide storage sites since it is a mature gas province that contains several fields that are either fully depleted or nearing their end of field life. However, several fields have issues relating to their subsurface geology. For example, these include structural compartmentalisation, low-permeability reservoirs, or thinning of the top seal [36], and will be discussed in more detail below. To categorise the parameters that influence the caprock, it is vital to test the full range of the caprock types in the North Sea. The variations in the depositional environment of the North Sea basin over time and its subsequent structural evolution have led to the presence of several different caprock types, including shales, chalks, and evaporites. Table 1 provides a summary of the various North Sea caprocks.
At present, restrictions, on the ability to provide a fully comprehensive model to enable the determination of potential risk at particular geological disposal sites, arise because of gaps in the fundamental understanding of the state of the relevant caprock. A major issue in caprock research is the lack of accurate information on key caprock parameters. While the lithology is generally known, the caprock properties, like thickness and lateral and regional continuity, can only be guessed. Accurate information for caprocks remains difficult to obtain. Thus, the impact of discontinuities within caprocks cannot be easily predicted and is very difficult to model realistically. Extensive research into the sealing properties of caprocks, the sealing behaviour of faults, and the causes of caprock failure have been conducted in the petroleum industry [35,37,38]. Conversely, the literature on caprocks related to carbon dioxide storage is more limited. The various types of caprocks have differences in wettability and chemical properties in the presence of either carbon dioxide or hydrocarbons, all of which are likely to impact the sealing capacity. Therefore, it is essential to investigate the sealing behaviour of caprock when carbon dioxide is present. Specific studies of the impact of caprocks on carbon storage will, thus, be discussed below.
Numerical simulation has been used in carbon dioxide storage since the concept was originally proposed. Lindeberg and Wessel-Berg [39] performed one of the earliest numerical simulations of carbon dioxide storage, where they performed a simulation of carbon dioxide escape in a saline aquifer, including dissolved carbon dioxide. Numerical models of carbon dioxide injection and the impact on reservoir and caprock properties can be divided into two categories, which balance computational cost with modelling accuracy versus fully coupled models. Coupled models involving geomechanical and geochemical solvers are linked to a flow simulator where mechanical, chemical, thermal, and hydraulic problems are solved simultaneously, feeding data into each other in a reciprocal two-way manner [40,41]. It is necessary to include geochemistry because the injected scCO2 dissolves into the resident brine, causing an acidic environment in the reservoir due to the release of H+ ions [42]. This results in the caprock minerals and brine losing their previous chemical equilibrium, causing the dissolution of rock-forming minerals and the precipitation of secondary minerals, which impact the caprock integrity on a geological time scale [43]. The aforementioned body of work has demonstrated the need for simulations to include fully coupled flow, geomechanical, and geochemical processes. Further, some authors also advocate the need to include thermal effects. The requirement to include all these different processes is because, in particular, in geological situations, such as in the North Sea, complex interactions and feedback arise between them, leading to unexpected outcomes and phenomena that are sometimes missed if some processes are omitted [44].

3. Key Features in the North Sea

3.1. Boundary Conditions

The long-term storage capacity of potential carbon dioxide reservoirs will depend upon the aquifer connectivity that allows the formation brine to be displaced as the carbon dioxide is injected. The injection of carbon dioxide will lead to a significant rise in pore fluid pressure and potential displacement of formation brines from the reservoir. This could result in migration of the brine, or even the carbon dioxide plume itself eventually, to the ground surface or seabed through onshore or seabed outcrops. In the case of the Bunter Sandstone in the UK southern North Sea off eastern England, there is some suggestion of an outcropping at the seabed in the area immediately around the well 43/28a-3, which was drilled on the top of a salt dome [19]. The first drill cuttings from this well emerging from a depth of 76 m below the seabed were of an orange-red sandstone, i.e., the Bunter Sandstone. Hence, there seems to be an outcrop beneath a veneer of drift deposits. Simulations suggest that this will permit the release of significant formation brine at the seabed. While this may allow some pressure relief, which will help to preserve the caprock elsewhere from fracturing, it raises concerns about potential environmental impacts [19]. As long as the outcrop is sufficiently distant from the spreading radius of the carbon dioxide plume, then the latter will not escape itself. However, simulations have suggested that only a very small fraction (~1%) of the pore volume of the reservoir is used for carbon dioxide storage before the leakage of brine begins at the outcrop [19]. The northwestern region of the Captain Sandstone, located off the east coast of Scotland, also has a likely seabed subcrop, which—along with several throughgoing faults—might result in leakage of carbon dioxide to the seabed [45].
Even without the outcropping of the reservoir, the boundary conditions assumed for a given reservoir are a key parameter affecting capacity estimation since they control how much pressure and fluids can be transferred to adjacent geological formations [46]; assuming a complete sealing boundary can reduce capacity predictions by more than 50%. Some reservoir rocks, such as the Bunter Sandstone in the Southern North Sea, are compartmentalised by faults, fracture zones, and penetrating salt walls [46]. In such a compartment, the amount of carbon dioxide that can be injected before a particular limiting pore fluid pressure is reached depends upon the effective pore volume within the compartment, the permeability of the compartment boundaries, and the rock/fluid compressibilities. The aforementioned structures may affect inter-regional pressure communication within the Bunter Sandstone, but the distribution of this is unknown. However, there is some evidence that pressure communication can take place across fault zones, such as across the North Hewett fault between the Hewett and Little Dotty gas fields in the Bunter Sandstone, even though the crests of these fields are 5 km apart [19]. This may be because the faulting then only juxtaposes sand against sand rather than an impermeable rock. In other cases, such as some larger faults of the Dowsing Fault Zone to the northern edges of the Bunter Sandstone, the faulting may, instead, juxtapose the Bunter Sandstone against underlying mudstone, or diagenesis around the faults might lead to impermeable boundaries. Fully impermeable boundaries are thought to arise for the Bunter Sandstone along the south and east due to discontinuous salt walls. However, there is thus some justification for distinguishing between reservoirs with open boundaries at their periphery, as well as ‘internal closures’. Smith et al. [46] found, for a case study of a region of the Bunter Sandstone, that assuming a closed system boundary was overly conservative as, at regional scales, heterogeneous caprocks and discontinuous boundaries allowed aquifers to behave more as if they were open systems. Heinemann et al. [47] even suggested that the Bunter Sandstone may not be compartmentalised.
One way to assess the reservoir connectivity of a former gas field is to monitor the pressure recovery in it following the halt in production [48]. This is because the use of reservoir formation pressure to drive the gas to the surface results in a reduction in the reservoir pressure. The reservoir formation pressure can be maintained to some extent by brine invasion from neighbouring connected aquifers encroaching into the gas reservoir, thereby improving production. This is the initial indication of hydraulic connectivity between reservoirs. Further, monitoring the re-pressurisation following the ceasing of production can reveal greater information on reservoir connectivity. For example, the Esmond field, in the southern North Sea Bunter Sandstone, produced gas between 1985 and 1996, which, by the time of field abandonment, had led to a significant reduction in reservoir pressure from ~157 to ~10 bar (~15.7 to ~1 MPa). The Esmond field consists of thin (~6 m) upper sand layers and a thicker (~90 m) lower sand, separated by a mudstone. However, when, in 2008, the field was considered for use for gas storage, and a new appraisal well was drilled, while the upper sand still had a depleted pressure of ~10 bar (~106 Pa), it was found that the lower sand in the field had largely re-pressurised to ~120 bar. This suggested that, while the lower sand is well-connected to surrounding aquifers, the upper sand is not. Seismic studies have shown that, while the Esmond field has been subject to gentle folding, it is not affected by major faulting, as might be expected anyway from its retention of gas. However, there is some localised, small-scale faulting on the flanks of the folds, which is likely to juxtapose sand on sand contacts and, thence, maintain permeability, although the formation of granulation seams by precipitation of minerals in the faults could not be ruled out [48]. In addition, minor igneous intrusions (dykes) could form flow baffles. Bentham et al. [48] conducted history matching of the observed pressure history using fluid-flow simulations to estimate the size of the hydraulically-connected aquifer surrounding Esmond and the aquifer permeability. The model for Esmond also included potential pressure communication effects from production in the neighbouring Forbes field. It was found that, if the influence of gas production at Forbes was included in the model, the connected aquifer radius needed to be increased from 17 to ~20 km to match the observed pressure recovery at Esmond. However, the Forbes field is separated from Esmond by two zones of igneous dykes that might form barriers to fluid flow, and these were not included in the modelling.

3.2. Reservoir Rocks
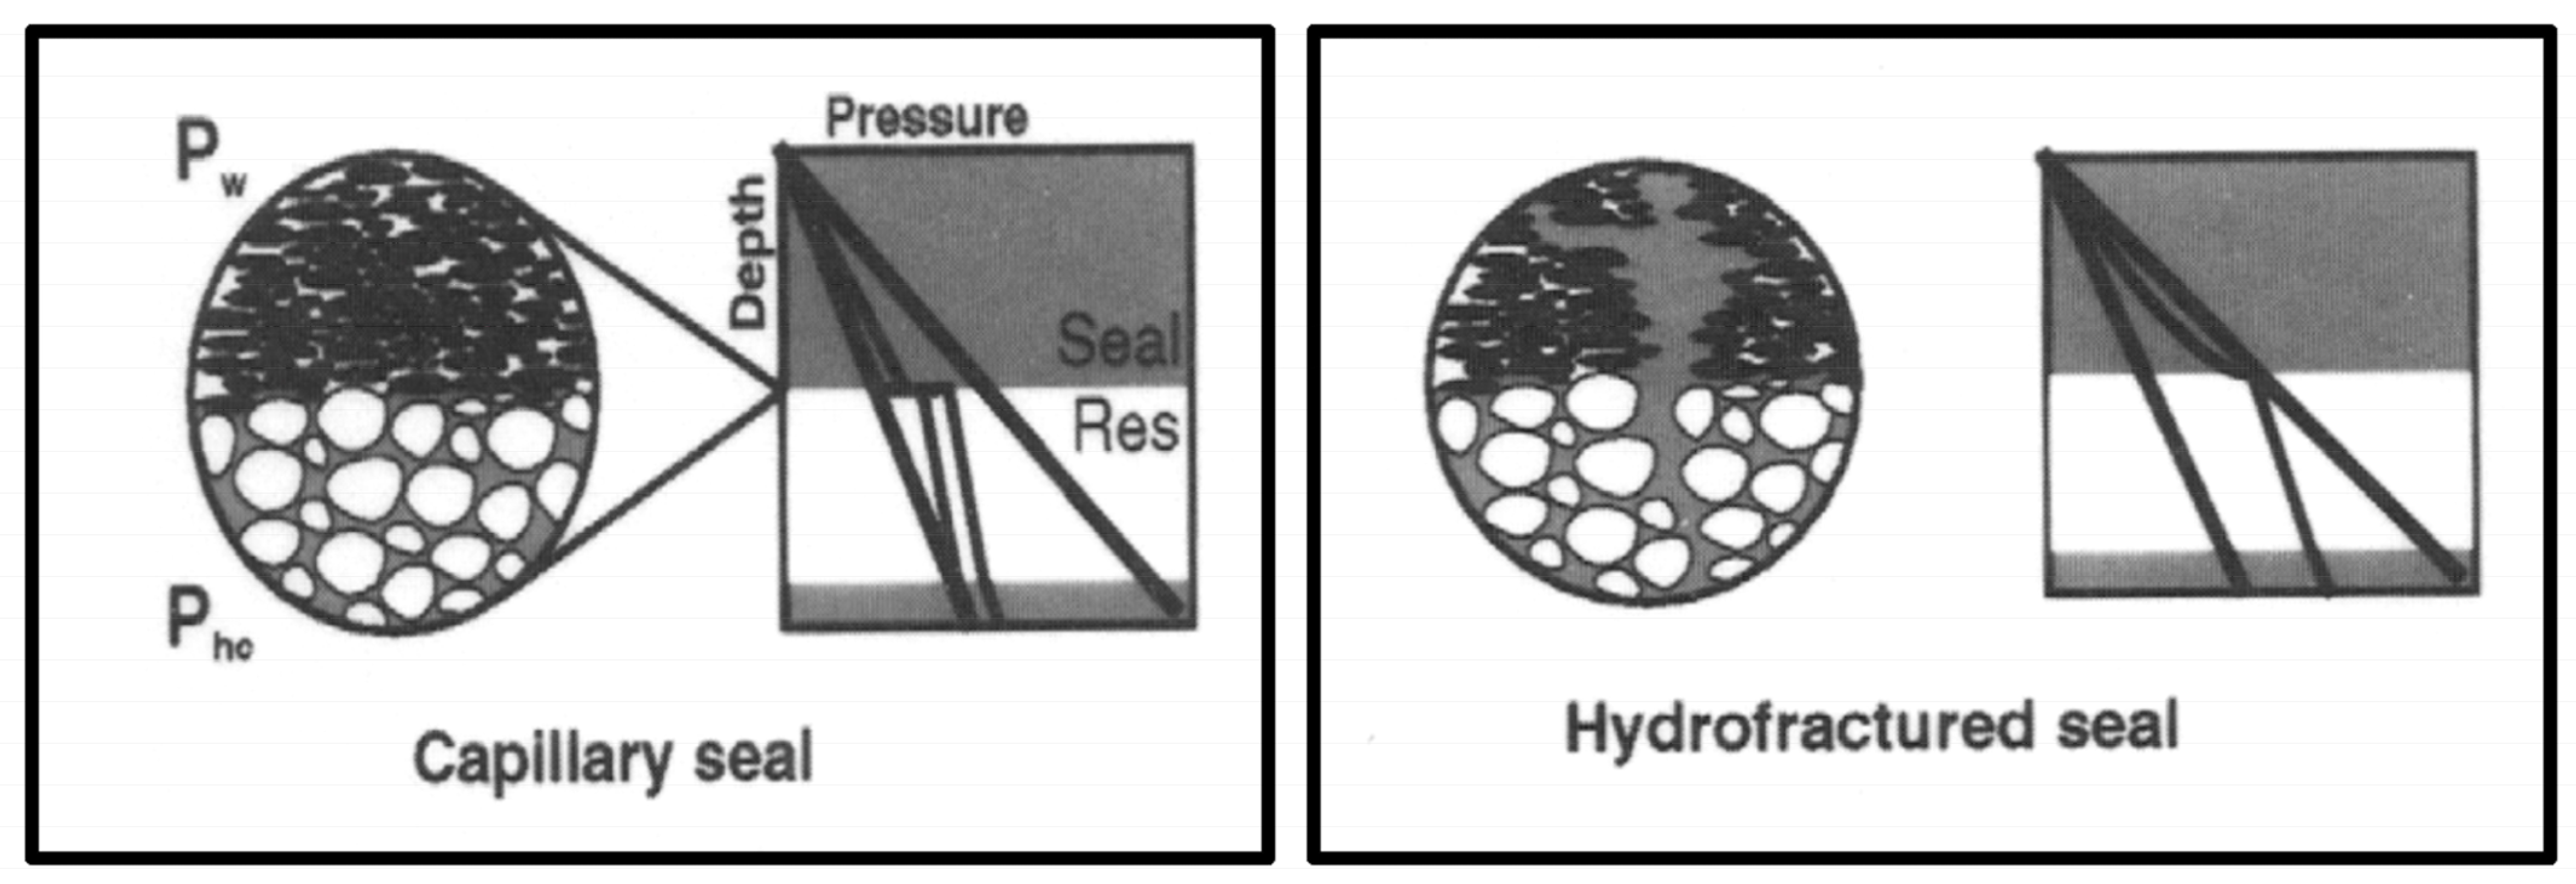
The reservoir rocks of the saline aquifers in and around the North Sea are largely sandstones, but there are also some chalks. Some of the reservoir rocks may be unstable because of susceptibility to damage and pore structure modification due to processes before and during use for carbon dioxide storage. The reservoir rocks are particularly susceptible to fracturing in the region around the injection well due to the localised higher pore pressures there.
Experiments have suggested that during carbon dioxide injection, sandstone rocks, such as Lower Triassic Sherwood Sandstone, which is an analogue of the Bunter Sandstones, experience mass loss and increased secondary porosity primarily due to the dissolution of intergranular cement (dolomite and calcite) and K-feldspar grains, with some associated loss of clay, carbonate and mudstone clasts [49]. This results in a rise in porosity and permeability, but this preferentially occurs along particular pathways through the rock due to positive feedback between the preferential flow through high permeability regions leading to increased erosion of rock along those paths, and, thereby, further increases in permeability especially there relative to other pores. Further, some rocks in the North Sea region are more susceptible to damage than others due to their nature. For example, the Acorn site, located off the east coast of Scotland, has a highly porous and permeable sandstone, where the bulk mineralogy has been shown to be likely to be geochemically stable over a millennium of storage, but the high porosity and low degree of cementation means it has a low yield strength, and is, thus, vulnerable to disaggregation and porosity reduction [12].
Chalk reservoirs present a number of particular potential issues during carbon dioxide injection. Several studies indicate that there would be an extensive dissolution of the carbonate phases, particularly near the injection well, resulting in a large increase in porosity and permeability [50]. Supercritical carbon dioxide injection can also result in desiccation of the aqueous phase, resulting in the precipitation of salts and causing a decrease in porosity and permeability, and, thence, injectivity. The effects of carbon dioxide injection into depleted hydrocarbon chalk reservoirs have also been considered. Hosseinzadehsadati et al. [51] examined injection into the Harald East field in the Danish sector of the North Sea. The overall structure of the field consists of an anticline induced by the halokinesis of the Zechstein salt. The reservoir rock is pelagic and reworked chalk with a claystone caprock. Their analysis suggested that the initial gas production may have resulted in compaction of the reservoir rock due to pore volume reduction and subsidence, which may have reduced the potential carbon dioxide storage capacity by 10%.

3.3. Seal Rocks

Normally, a highly efficient seal is desired to prevent leakage of carbon dioxide into the environment. However, a semi-open system, where the permeability of the seal is around 10−4 to 10−2 mD but the capillary entry pressure is high enough to prevent penetration of the supercritical carbon dioxide, can reduce pressure build-up during injection [48]. If brine is allowed to enter the caprock at very low rates obtained by dispersal of this flow over a large area, then some pressure relief can be obtained [19].
In the existing numerical simulation studies of carbon dioxide sequestration in the North Sea, much work has focused on measuring the reservoir storage capacity, and less work has been conducted on studying the caprock and interlayer integrity during carbon dioxide sequestration within detailed numerical models [10,52,53,54,55,56,57,58]. More simplified models do not combine all the different processes that occur during and after carbon dioxide injection. As a result, the outcomes are not reliable for risk analysis of carbon dioxide leakage via the caprock [3,59,60]. The interaction between carbon dioxide and sealing lithologies can be complex. Chaiwan et al. [61] investigated the caprock integrity in the Smeaheia site by implementing a coupled thermo-hydro-mechanical numerical 3D model to investigate the importance of non-isothermal effects when injecting cold carbon dioxide on caprock integrity. The results showed that, for areas around the injection point, there is the potential for the caprock to reach the failure envelope due to the reduction in effective stress. Additionally, the structural complexity of caprocks within the storage sites located in the North Sea is also evidenced by the study of Gabrielsen et al. [62]. They concluded that, for the Draupne Formation mudstone seal, the fluid pressure at the caprock–reservoir interface induced by carbon dioxide injection needed to be controlled to avoid re-activation of pre-existing fractures caused by deformation associated with deposition and burial. In addition, Xie and Cerasi [63] obtained results that have shown the possibility of leakage paths in depleted reservoirs located in the North Sea if yield has occurred in bounding faults.
While the caprock matrix may be relatively impermeable, faulting and fractures within the caprock can compromise its seal efficiency. In the North Sea, the Bunter Sandstone overlies the mostly evaporitic Zechstein Group, where post-depositional halokinesis in the latter, leading to the development of salt pillows and domes, has caused periclinal folding in the former. Faulting, due to extensional stresses, at the crest of the folding in the sandstone could have arisen during the underlying movement of the Zechstein Group salts [64]. Indeed, it is known that some non-gas-bearing periclines are cut by extensional faults that reach all the way from the seabed to the Bunter Sandstone reservoir itself, though other periclines do not seem to have seismically resolvable faults [19]. These long faults may slip, have their permeability increased, or even propagate further due to the higher reservoir pressures during carbon dioxide injection. However, the observed fault offsets do not exceed the thicknesses of both the Haisborough Group and the Speeton Clay seals. If faults were generated through the overlying Haisborough Group seal to the Bunter Sandstone, it is also possible that creep in the evaporitic formations within the Group will have re-sealed them. Where present, the halite beds of the thick Röt Halite Member in the overburden are likely to deform plastically under stress and only undergo brittle fracture at very shallow depths [65]. In addition, the mudstones and shales of the Haisborough Group may have also contributed to re-sealing any fault through the likely presence of a shale gouge on the fault plane formed during the movement of the fault [64]. Therefore, it is still conceivable that the Haisborough Group formation will act as a seal for the Bunter Sandstone even despite any previous faulting. This is because, while the Little Dotty gas field has a faulted anticline, the faults associated with this field have been sufficiently sealed that gas remained trapped there for millennia [64].
The boundary between the reservoir and caprock is not always a step change between distinct clastic lithologies like sandstone and shale. Instead, there can be a gradation change between the two, and the sediment graduation can continue into the reservoir. This means the sediment grain size changes gradually at the interface rather than abruptly. For example, the Sherwood Sandstone Group shows an upward grading of sediments from coarse sandstone to siltstones and then to the Mercia Mudstone Group. Simulations for such a situation leading to heterogeneity in the capillary pressure and relative permeability functions, using the Bunter Sandstone Formation as a case study, found that this led to changes in the plume migration and pressure diffusion within the formation [66]. The resultant was an increase in residual gas trapping in the reservoir and local pore pressure at the injection point. The latter could lead to hydraulic fracturing around the injection point and arise alongside partial brine migration into the caprock.
The topography of the underside of the caprock can affect the potential for storage. The relatively flat upper surface of the Utsira sand aquifer of the Sleipner site means that according to estimates by Smith et al. [46], only 3% of the porosity is available for physical trapping beneath the caprock.
In the North Sea, a style of trapping is observed due to the truncation of an inclined permeable bed by a low permeability region known as an unconformity surface. For example, the Viking Graben region is located in the northern North Sea, where the Brent Sand reservoirs are faulted deltaic sand truncated by the Cretaceous unconformity [67]. Shariatipour et al. [68] studied the migration of carbon dioxide in the presence of unconformity between the reservoir and the caprock. The results show that permeable pathways created by unconformity can negatively influence carbon dioxide storage by enhancing the carbon dioxide leakage risk.
Mud gas data has been used to test the seal integrity of mudrock caprocks of chalk reservoirs in the Danish Central Graben [69]. This data could be obtained because the formation gases released from the drilled rock sections were captured in the drilling mud returns, and their composition was analysed. The sealing capability of the corresponding rock sections was evaluated by determining the origin of hydrocarbon gas in the rock as either thermogenic or biogenic and then seeing how far the thermogenic gas front had migrated. Since the seal sections that were investigated were thermally immature and, thus, had not generated any thermogenic gas themselves, then the presence of such gas was indicative of migration into the seal, and, thence, the seal integrity was potentially challenged. This method detected that several fields in the region had compromised seal integrity. For several structures, the vertical thermogenic gas migration front had reached the overburden (the Nordland Group) above the main seals. In the Anne-3 and East Rosa-2 wells, thermogenic gas was found within the overburden, indicating that the Dagmar, Kraka and Rolf fields would likely be unsuitable for carbon dioxide storage due to the risk of leakage due to poor seal integrity. Further, in the Svend field, the thermogenic gas had also penetrated the whole primary seal. Seismic data suggested that this had occurred because salt diapirism had caused substantial deformation of both the Chalk Group reservoir, and also of the Horda and Lark Mudstone seals. Leakage occurred through faulted structures.

3.4. Faults

The estimation of leakage of carbon dioxide through faults/fractures is difficult because it is a complex coupled hydrodynamic, geophysical, and geochemical process. One of the main challenges is the uncertainty as to the nature and extent of fluid–rock interactions, which can affect the mechanical and physical properties such as porosity, permeability, and capillary entry pressure of the caprock. For example, the increase in pressure, due to the growing buoyancy force of the carbon dioxide collecting under the caprock, changes the stress field, affecting the rock matrix porosity and fracture aperture, and eventually influences the permeability of the caprock and flow-field within it [70,71,72]. Moreover, minor faults intersecting with caprocks would provide a more complex structure. For example, faults with offsets of the order of a few meters might have a low permeability fault core of a few centimetres and a high permeability damage zone that extends for several tens of centimetres on each side [73]. A fracture network within a damaged zone is initially filled by minerals and is, thus, tight and sealing. However, pressure induced by injection could possibility break the mineral seal and create a permeable path for the fluid along the fault-damaged zone, as was observed by the In Salah project, where InSAR monitoring gave an indication of fracture zone opening at the lower section of the caprock [74,75].
Pre-existing faults present a potential risk for the storage of carbon dioxide. The rise in pore pressure resulting from carbon dioxide injection risks fault re-activation. However, in most cases, there are many uncertainties in the in situ stress fields, as well as the particular fault properties. Indeed, the complexity of fault zones provides a key challenge for the prediction of fluid flow along and through faults. Determination of the regional in situ stresses enables mapping of the stress tensor affecting such faults [76]. Several studies have modelled the potential for fault re-activation and other geomechanical processes during carbon dioxide injection [77,78]. Both studies concluded that fault re-activation is possible and depends on induced injection pressure, but there are large uncertainties in the in situ stresses and strength fault propitiates. Furthermore, across the fault, the local stress field might be largely different to the average crustal stress field, and also there may be heterogeneity of the fault shear strength. Thus, it makes it difficult to predict the re-activation of the fault. Miocic et al. [79] made a geomechanical and fault seal analysis of the Fizzy Field in the southern North Sea. The Fizzy Field is located on the Fizzy Horst, which is separated from the Brown Graben by the Fizzy Fault. In their analysis, Miocic et al. [79] considered the fracture stability for two types of fault rock at either end of the strength spectrum. At the lower end of the strength range for possible fault rocks for the Fizzy Fault are clay smears with low coefficients of internal friction and low cohesive strengths, while at the strong end of the spectrum is cataclastic. The geomechanical analysis of the fault by Miocic et al. [79] showed that, while the fault is orientated in a way that favours re-activation relative to present-day stress, it is stable under the current stress regime. While reservoir-rock types are juxtaposed across the Fizzy Fault, shale-gouge ratio calculations suggested that there would be no leakage of carbon dioxide across the fault. Williams et al. [76] examined the geomechanical stability of faults in the Captain Sandstone, located in the eastern part of the Inner Moray Firth, off Scotland. They characterised the contemporary stress field affecting this basin in order to estimate the shear and normal stresses acting on mapped faults and to determine the susceptibility of these faults to re-activation. Their findings suggested that some parts of the regional faults are likely to be near-critically stressed under some of the possible stress conditions considered and, thence, would not need much rise in pore pressure to become re-activated. However, coupled fluid flow and geomechanics modelling would provide a reasonable indication of stress field changes due to carbon dioxide injection and identify the possible regions of fault re-activation that will increase or decrease within the injection.

3.5. Internal Barriers

In dome-like storage structures, like the Bunter Sandstone, the presence of impermeable horizontal barriers within a reservoir may facilitate the rapid migration of the carbon dioxide plume laterally towards structural spill points [20,21]. As mentioned above, the Bunter Sandstone consists of a number of domes, formed by the folding caused by halokinesis in the underlying Zechstein Group, and carbon dioxide injected under one dome might spread sideways to spill-over from the edge of the dome into a neighbouring one [20,21]. Anhydrite or halite cemented layers within the Bunter Sandstone have been detected via geophysical logs due to the simultaneous low gamma-ray response, rise in sonic velocity, and sharp increase in density expected of such features [20,21]. Further, in some cases, examples of these cemented layers have been correlated across many wells within the sandstone and, thence, must have substantial lateral extent. The Bunter Sandstone also contains some shale inter-layers arising from depositional environments consisting of a cyclic system of braided river channels with sheetflood deposits, sometimes with the latter dominating [20,21]. Simulations of carbon dioxide plume migration in reservoirs with such horizontal barriers with large spatial extent have shown that they encourage the plume movement towards structural spill-points, thereby preventing the plume from rising to the crest of the dome where it can become structurally trapped [20,21]. When the cement and shale layers are not laterally continuous, the actual values of their porosity and permeability have little effect. Multiple domed structures, as arise in the Bunter Sandstone, may have potential pressure interference effects between domes, which may limit storage capacity in individual domes [20,21].
Internal barriers may not be impermeable, but their presence still complicates the prediction of plume migration. The evolution in attempts to predict the behaviour of the injected carbon dioxide plume at Sleipner using reservoir simulation has shown how various competing hypotheses have been proposed and tested.
The basic structure of the Sleipner site consists of a reservoir sandstone, the Utsira Formation sandstone, topped with the Nordland Group, predominantly shale, caprock. A gamma ray log from a Sleipner well indicated that the reservoir Utsira sand contains seven thin shale layers, with thicknesses of ~1–3 m, and an uppermost shale layer that is ~6–7 m thick, that are all below the resolution possible with seismic reflection surveys at their depth [80]. A schematic of the basic structure is shown in Figure 6.
Following the beginning of the injection of scCO2 into Sleipner, the rise of the plume was monitored using 4D time-lapse seismic techniques, which gave rise to unexpected findings. The plume ascended by ~200 m to the top of the reservoir in less than three years, which was much sooner than expected, and the breadth of the lateral spread of the plume was also unexpected. If the shale inter-layers had acted as local seals, then they should have halted the vertical ascent of the plume until it spread laterally to the edges and circumnavigated them. This would have resulted in a much more zig-zagging route than was observed. The early modelling studies that attempted to predict the plume distribution were based on Darcy-based fluid flow only [82,83,84]. In the Darcy flow regime, the plume behaviour depends upon the interplay between fluid viscosity, pressure gradients and rock permeability. To obtain any agreement between these types of simulations and observation, it was necessary to hypothesise the existence of discrete vertical pathways, called ‘chimneys’, through the shale inter-layers with much higher permeability. However, at this stage in the work, an alternative hypothesis was proposed that resulted from ponding of the plume below the inter-layers and capillary penetration of the pore network in the shale [80,81]. The simulation thus utilised invasion percolation modelling rather than Darcy flow modelling. Cavanagh and Haszeldine [80] found that agreement between observations and simulations could be obtained for this approach if the capillary pressures were around a hundred-times lower than is normal for mudrock at the reservoir depth, thereby suggesting that the inter-layers must have multiple micro-fractures with widths of around 2 μm. Using a similar capillarity-based modelling approach, Akai et al. [81] obtained nine separate carbon dioxide plumes, as observed in the 4D-seismic monitoring data, but this was achieved by varying the vertical permeability of the shale inter-layers, as well as the capillary entry pressure. The predicted positions for the edges of the individual plumes did not match observations. However, Akai et al. [81] proposed that better agreement could be obtained if the individual shale inter-layer properties were allowed to vary between each other, which seems reasonable. In addition, Williams and Chadwick [85] have criticised invasion-percolation-based models for lacking time dependence, which would severely limit their utility for performance prediction.
More abstract modelling of the impact of heterogeneities in capillary entry pressure has also been performed [86], which is of less direct relevance to Sleipner, in particular, but shows similar effects to the more specific modelling. In contrast, this work is also aimed at understanding the more broadly observed discrepancies between measurements and predictions of plume behaviour seen in reservoirs other than Sleipner, including In Salah, Algeria [87], and Otway, Australia [88]. Jackson and Krevor [86] considered the impact of small-scale heterogeneities in capillary entry pressure consisting of lenses, laminae or bedding heterogeneities of size scales from ~0.1–10 metres, of the type they considered occurred in the Captain Sandstone in the Goldeneye Field in the North Sea. From simulations, they observed that there was a doubling of the lateral plume migration rate due to layered anisotropic heterogeneities in capillary pressure characteristics and preferentially occupied low capillary entry pressure regions. Jackson and Krevor [86] asserted that the observed plume behaviour was dominated by capillary entry pressure heterogeneities rather than those in porosity and permeability. In field-scale simulations, they found that the rise in the carbon dioxide plume was retarded by anisotropic capillary heterogeneities, and progress thus occurred in bursts once the plume height became high enough to overcome the capillary pressure.
Ahmadinia and Shariatipour [89,90] found that slight variation of the topography of the interface between the caprock and the upper reservoir, within the aforementioned limits on seismic resolution, led to substantial improvement in the agreement between Darcy flow simulations and the observations of plume distribution.
Zhu and co-workers [91,92] and Hodneland et al. [93] have both studied the effect of reservoir temperature variations and the presence of contaminants in the carbon dioxide upon the plume migration in the topmost layer of the Sleipner site. On the other hand, Zhu et al. [91,92] found that the plume spreading was dependent on the temperature and the presence of impurities. In order to match the observed brine-carbon dioxide contact line properly required assuming high reservoir temperature (> 35 °C) and/or high methane content (>4%) in order to reduce the viscosity of the plume sufficiently. However, Williams and Chadwick [31] suggested that such a high temperature is problematic since the temperature in the topmost reservoir layer is thought to be only 30.5 °C. Indeed, since the Sleipner Field is relatively shallow, at the prevailing pressure conditions, the supercritical plume is close to the critical point, and any transgression of the cutoff for criticality would result in substantial changes to density and viscosity. Further, Williams and Chadwick [85] asserted that their own modelling studies had shown that an estimated vertical variation in temperature of 7.5 °C across the reservoir did not significantly impact the positions of the carbon dioxide–water contacts.
While different plume intra-shale migration mechanisms have been proposed as the reasons for disagreement between observations and early simulations, more recently, the uncertainties in the levels of structural heterogeneity in the rocks have been explored. Chadwick and Noy [94] and Zhang et al. [92] considered general anisotropies in the reservoir permeability but not specific geological features. Zhang et al. [92] also combined permeability anisotropy with variations in reservoir temperature and the composition of the injected carbon dioxide. They found that the addition of methane impurities led to thicker carbon dioxide plumes in the vertical direction.
It has been proposed that the levels of heterogeneity in the Sleipner reservoir are much higher than previously supposed [31]. Spatial heterogeneities in both vertical and horizontal permeabilities in the rocks have only been incorporated into reservoir models recently [85]. For example, it is claimed the seismic evidence is consistent with the insertion of high permeability channels in the topmost sand layer (known as the ‘sand-wedge’) running in the north–south direction. The positions of these channels are controlled by the deeper-seated mud diapirs [85]. Incorporation of these features into reservoir models has been found to improve the history-matching of plume behaviour [85]. Indeed, recently, Williams and Chadwick [31] claimed that permeability heterogeneity (channelling) in the sand layers is more likely to control plume shape than the topography of the overlying shale inter-layer. However, there is still some uncertainty in the form and permeability distribution of these geological features, and some fine-tuning of the model using history-matching of the plume behaviour is still necessary [85]. Given the failure of previous modelling [85] to match the observed migration rate of the plume along the prominent north ridge of the uppermost sandstone layer (the sand-wedge), Onoja and Shariatipour [66] studied the effects of heterogeneities in relative permeability and capillary forces in the shale inter-layers and channels in the wedge to potentially explain this. They compared cases where the plume migration through the mudstones was viscosity-dominated Darcy-flow with that where it was controlled by capillary-dominated Darcy flow. Onoja and Shariatipour [66], based upon their own simulation results, agreed with Cavanagh and Haszeldine [80] that vertical migration of the plume was controlled by the atypically low capillary entry pressure in the shale inter-layers and also that the mass flow-rate through them was determined by the relative permeability. However, they found that the relative permeability had an insignificant effect of on the plume flow in channels in the sand-wedge.
Williams and Chadwick [31] have challenged the need for alternative physics to Darcy-flow, such as the capillary-penetration-based mechanism, to explain the rapid plume rise by asserting that certain geological heterogeneities, such as the high permeability gaps, known as chimneys, are visible in the seismic data and could deliver better history-matching of plume behaviour in the topmost reservoir layer, though they did not explicitly demonstrate this. Williams and Chadwick [31] asserted that the aforementioned chimneys correspond to ‘subtle discontinuities in the stratigraphy, at or close to the top of the reservoir’, and are visible in the baseline (pre-injection) seismic data (see Figure 7a). Williams and Chadwick [31] also proposed that these chimney features have been rendered more apparent in the seismic surveys subsequent to the start of carbon dioxide injection, as shown in Figure 7b, since the path of the carbon dioxide acts to highlight these features. However, the existence of other chimneys can still only be inferred indirectly from unexpected progress and deviations in the migration of the plume over time.

3.6. Reservoir Engineering

The sheer amount of carbon dioxide that may need to be sequestered from a major power station or cluster of industrial emission sources may require multiple injection wells to keep up with demand. In some regions of the world, like the North Sea, storage capacity may be a limited resource, given the high demand for carbon dioxide storage capacity from various states around the North Sea. Since some reservoirs have an extensive regional extent, such as the Captain Sandstone, it is likely that different operators may have multiple injection sites at different depths within the same continuous, inter-connected storage formation [95]. Hence, there could be competition for the storage capacity from different operators. This means there would need to be very effective pressure management to ensure efficient use of the reservoir capacity. McDermott et al. [95] developed a simulation methodology to cope with the overall size of the model needed to study the geomechanical stability of a large, multi-user field. They found that the pressure plume migration over time from deeper to shallower injection sites in dipping strata needs to be accounted for.
Many reservoir configurations are far from ideal. A reservoir may be bounded by sealing faults that can lead to overpressurisation and, thereby, potential failure of the seal. The shortcomings of the reservoir structure itself can be potentially overcome via engineering interventions. These interventions often take the form of multiple injection sites and the production of formation water away from the injection site. The increase in bottom hole pressure following the injection of carbon dioxide can lead to the fracturing of the reservoir rock. Besides the use of multiple wells, this can be avoided by building up the injection rate slowly [19]. Simulations involving varying the injection rates across multiple wells can be used to optimise the campaign, such that the utilisation of potential storage capacity is maximised while still keeping the reservoir pressure below the threshold to avoid fracturing.
Typically, it is suggested that the larger the well spacing, then the smaller the pressure build-up [47]. Simulations by Agada et al. [96] have suggested that the particular area location of injection sites would make little difference to local pressure build-up in the Bunter Sandstone because it has good regional connectivity. However, these workers also found that flow simulators differed from simplified analytical models in the prediction of pressure build-up at individual sites due to the incorporation of interactions between multiple injection sites and heterogeneous permeability in numerical simulations. It is suggested that using horizontal wells for injection allows lower injection pressures [97].
In reservoirs, such as the multi-domed Bunter Sandstone, the selection of well-depths must be made carefully. This is because simulations have shown that the location of the injection at too great a depth can increase the likelihood that the migrating plume will escape the overlying dome via a structural spill-point [20,21].
The increase in pore pressure following the injection of carbon dioxide will reduce potential storage efficiency. Normally, the injection of carbon dioxide would have to be terminated when the reservoir pressure approaches the caprock fracture pressure. Water production may be a way to increase the capacity and lifetime of a storage reservoir [98]. However, the water production period needs to be tightly managed to avoid carbon dioxide re-production. Water production can be by passive production, due to the increase in formation pressure, or by active pumping [98]. For the same number of wells, passive production should be cheaper and will lead to increased water production when the formation pressure increases, but there will be a decrease in production with distance from the injection well. Hence, such production wells need to be close to injector wells, and so should be sited well down dipped, and perforated in the lower part of the formation since carbon dioxide tends to override water due to buoyancy forces [98]. However, the weak topography of the Utsira sand makes the siting of passive wells in Sleipner problematic [98]. Bergmo et al. [98] found that if a single injection/production well pair was used, the production well had to be placed over 13 km from the injection well to avoid re-production of the carbon dioxide. Given the aforementioned decline in production with distance, this meant that passive production was too ineffective. However, they also showed that the use of multiple injection/production sites meant that passive production could be closer to injection and thus made slightly more effective. In contrast, from simulations for the same Sleipner aquifer, Zhang et al. [99] found that producing water at the lowest structure far away from the carbon dioxide–water contact in the vertical direction enabled an additional 73% of carbon dioxide to be stored compared to the case without water production. However, Zhang et al. are not clear on whether water production is active or passive in their simulations [99].

4. Conclusions

The survey of studies above has demonstrated the importance of the consideration of boundary conditions, the nature of the reservoir and caprocks, and the presence of internal barriers and heterogeneities for a reliable and accurate assessment of carbon dioxide storage capacity and the risks of leaks for fields in the North Sea. It has been seen that the degree of communication between parts of compartmentalised reservoirs and adjoining reservoirs is critical for determining the maximum possible injection rate and ultimate storage capacity. The potential storage reservoirs in the North Sea contain a wide range of geological heterogeneities of various origins, including sand wedges, shale interlayers, salt walls, igneous dykes, and granulation seams/cemented faults. These heterogeneities can act to compartmentalise reservoirs or aid and channel the displacement of the carbon dioxide plume, depending upon location and orientation. Their correct presence in reservoir models is thus essential. Further, the implementation of several different reservoir engineering solutions to resolve particular challenges presented by the geological features of North Sea reservoirs has been considered, and some potential hopeful strategies have been found. It has been seen that the particular form of the potential reservoirs in the North Sea, as detailed in the Introduction, leads to their own particular challenges, as is emerging from the reservoir simulations.
It has been seen that many of the challenging issues for some North Sea carbon dioxide storage sites remain unresolved. For example, the continued but steadily shrinking discrepancies between the observed plume migration at Sleipner and predictions from simulations still leave room for varied proposals of different mechanisms to explain these discrepancies. However, the empirically observed trend of ever-refined simulations providing better agreement suggests that an ultimate consensual answer will be reached shortly.

Funding

This research was funded by the GeoNetZero CDT and the University of Nottingham.

Data Availability Statement

Not applicable.

Acknowledgments

The work of AA was supported by the GeoNetZero CDT and the University of Nottingham.

Conflicts of Interest

The authors declare no conflicts of interest.

References

  1. IPCC. Summary for Policymakers. In Global Warming of 1.5 °C. An IPCC Special Report on the Impacts of Global Warming of 1.5 °C above Pre-Industrial Levels and Related Global Greenhouse Gas Emission Pathways, in the Context of Strengthening the Global Response to the Threat of Climate Change, Sustainable Development, and Efforts to Eradicate Poverty; World Meteorological Organization: Geneva, Switzerland, 2018; Volume 32. [Google Scholar]
  2. Stark, C.; Thompson, M.; Andrew, T.; Beasley, G.; Bellamy, O.; Budden, P.; Cole, C.; Darke, J.; Davies, E.; Feliciano, D. Net Zero: The UK’s Contribution to Stopping Global Warming. Available online: https://www.theccc.org.uk/wp-content/uploads/2019/05/Net-Zero-The-UKs-contribution-to-stopping-global-warming.pdf (accessed on 22 November 2023).
  3. Ketzer, J.; Carpentier, B.; Le Gallo, Y.; Le Thiez, P. Geological sequestration of CO2 in mature hydrocarbon fields. Basin and reservoir numerical modelling of the Forties Field, North Sea. Oil Gas Sci. Technol. 2005, 60, 259–273. [Google Scholar] [CrossRef]
  4. Haszeldine, R.S.; Flude, S.; Johnson, G.; Scott, V. Negative emissions technologies and carbon capture and storage to achieve the Paris Agreement commitments. Philos. Trans. R. Soc. A Math. Phys. Eng. Sci. 2018, 376, 20160447. [Google Scholar] [CrossRef] [PubMed]
  5. Global CCS Institute. Global CCS Institute Welcomes the 20th and 21st Large-Scale CCS Facilities into Operation. Available online: https://www.globalccsinstitute.com (accessed on 1 May 2023).
  6. Stucky de Quay, G.; Roberts, G.G. Geodynamic generation of a Paleocene–Eocene landscape buried beneath North Bressay, North Sea. J. Geol. Soc. 2023, 180, jgs2022-063. [Google Scholar] [CrossRef]
  7. Ziegler, P.A. Geologic evolution of North Sea and its tectonic framework. AAPG Bull. 1975, 59, 1073–1097. [Google Scholar]
  8. OGA Field Data. Available online: https://www.nstauthority.co.uk/data-centre/data-downloads-and-publications/field-data/ (accessed on 1 May 2023).
  9. Halland, E.; Johansen, W.; Riis, F. CO2 Storage Atlas, Norwegian North Sea; Norwegian Petroleum Directorate: Stavanger, Norway, 2011. [Google Scholar]
  10. Karvounis, P.; Blunt, M.J. Assessment of CO2 geological storage capacity of saline aquifers under the North Sea. Int. J. Greenh. Gas Control 2021, 111, 103463. [Google Scholar] [CrossRef]
  11. Williams, G.; Chadwick, R.; Vosper, H. Some thoughts on Darcy-type flow simulation for modelling underground CO2 storage, based on the Sleipner CO2 storage operation. Int. J. Greenh. Gas Control 2018, 68, 164–175. [Google Scholar] [CrossRef]
  12. Allen, M.J.; Faulkner, D.R.; Worden, R.H.; Rice-Birchall, E.; Katirtsidis, N.; Utley, J.E.P. Geomechanical and petrographic assessment of a CO2 storage site: Application to the Acorn CO2 Storage Site, offshore United Kingdom. Int. J. Greenh. Gas Control 2020, 94, 102923. [Google Scholar] [CrossRef]
  13. Petersen, H.I.; Springer, N.; Weibel, R.; Schovsbo, N.H. Sealing capability of the Eocene–Miocene Horda and Lark formations of the Nini West depleted oil field—Implications for safe CO2 storage in the North Sea. Int. J. Greenh. Gas Control 2022, 118, 103675. [Google Scholar] [CrossRef]
  14. Underhill, J.R.; de Jonge-Anderson, I.; Hollinsworth, A.D.; Fyfe, L.C. Use of exploration methods to repurpose and extend the life of a super basin as a carbon storage hub for the energy transition. AAPG Bull. 2023, 107, 1419–1474. [Google Scholar] [CrossRef]
  15. Hollinsworth, A.D.; de Jonge-Anderson, I.; Underhill, J.R.; Jamieson, R.J. Geological evaluation of suprasalt carbon storage opportunities in the Silverpit Basin, United Kingdom Southern North Sea. AAPG Bull. 2022, 106, 1791–1825. [Google Scholar] [CrossRef]
  16. de Jonge-Anderson, I.; Hollinsworth, A.D.; Underhill, J.R.; Jamieson, R.J. A geological assessment of the carbon storage potential of structural closures in the East Midlands shelf, United Kingdom Southern North Sea. AAPG Bull. 2022, 106, 1827–1853. [Google Scholar] [CrossRef]
  17. Medici, G.; West, L.J. Review of groundwater flow and contaminant transport modelling approaches for the Sherwood Sandstone aquifer, UK; insights from analogous successions worldwide. Q. J. Eng. Geol. Hydrogeol. 2022, 55, qjegh2021-176. [Google Scholar] [CrossRef]
  18. Medici, G.; West, L.J. Reply to discussion on ‘Review of groundwater flow and contaminant transport modelling approaches for the Sherwood Sandstone aquifer, UK; insights from analogous successions worldwide’ by Medici and West (QJEGH, 55, qjegh2021-176). Q. J. Eng. Geol. Hydrogeol. 2023, 56, qjegh2022-097. [Google Scholar] [CrossRef]
  19. Noy, D.J.; Holloway, S.; Chadwick, R.A.; Williams, J.D.O.; Hannis, S.A.; Lahann, R.W. Modelling large-scale carbon dioxide injection into the Bunter Sandstone in the UK Southern North Sea. Int. J. Greenh. Gas Control 2012, 9, 220–233. [Google Scholar] [CrossRef]
  20. Williams, J.D.O.; Bentham, M.; Jin, M.; Pickup, G.; Mackay, E.; Gammer, D.; Green, A. The effect of geological structure and heterogeneity on CO2 storage in simple 4-way dip structures; a modeling study from the UK Southern North Sea. Energy Procedia 2013, 37, 3980–3988. [Google Scholar] [CrossRef]
  21. Williams, J.D.O.; Jin, M.; Bentham, M.; Pickup, G.; Hannis, S.D.; Mackay, E. Modelling carbon dioxide storage within closed structures in the UK Bunter Sandstone Formation. Int. J. Greenh. Gas Control 2013, 18, 38–50. [Google Scholar] [CrossRef]
  22. Bøe, R.; Zweigel, P. Characterisation of the Nordland Shale in the Sleipner Area by XRD Analysis—A Contribution to the Saline Aquifer CO2 Storage (SACS) Project; SINTEF Petroleum Research Report No. 33.0764.00/01/01; SINTEF: Trondheim, Norway, 2001. [Google Scholar]
  23. Lothe, A.E.; Zweigel, P. Saline Aquifer CO2 Storage (SACS). Informal Annual Report 1999 of SINTEF Petroleum Research’s Results in Work Area 1 ‘Reservoir Geology’; SINTEF Petroleum Research Report No. 23.4300.00/03/99; SINTEF: Trondheim, Norway, 1999. [Google Scholar]
  24. Graham, A.; Lonergan, L.; Stoker, M. Evidence for Late Pleistocene ice stream activity in the Witch Ground Basin, central North Sea, from 3D seismic reflection data. Quat. Sci. Rev. 2007, 26, 627–643. [Google Scholar] [CrossRef]
  25. Stoker, M.S.; Bent, A.J.A. Lower Pleistocene deltaic and marine sediments in boreholes from the central North Sea. J. Quat. Sci. 1987, 2, 87–96. [Google Scholar] [CrossRef]
  26. Sejrup, H.P.; Aarseth, I.; Haflidason, H. The Quaternary succession in the northern North Sea. Mar. Geol. 1991, 101, 103–111. [Google Scholar] [CrossRef]
  27. Gibbard, P.L. The history of the great northwest European rivers during the past three million years. Philos. Trans. R. Soc. Lond. Ser. B 1988, 318, 559–602. [Google Scholar]
  28. Eidvin, T.; Jansen, E.; Rundberg, Y.; Brekke, H.; Grogan, P. The upper Cainozoic of the Norwegian continental shelf correlated with the deep-sea record of the Norwegian Sea and the North Atlantic. Mar. Pet. Geol. 2000, 17, 579–600. [Google Scholar] [CrossRef]
  29. Moreau, J.; Huuse, M. Infill of tunnel valleys associated with landward-flowing ice sheets: The missing Middle Pleistocene record of the NW European rivers? Geochem. Geophys. Geosyst. 2014, 15, 1–9. [Google Scholar] [CrossRef]
  30. Chadwick, R.A.; Kirby, G.A.; Holloway, S.; Gregersen, U.; Johannessen, P.N.; Zweigel, P.; Arts, R. Saline Aquifer CO2 Storage (SACS2). Final Report: Geological Characterisation (Work Area 1); British Geological Survey Commissioned Report, CR/02/153C; British Geological Survey: Keyworth, UK, 2002. [Google Scholar]
  31. Williams, G.A.; Chadwick, R.A. Influence of reservoir-scale heterogeneities on the growth, evolution and migration of a CO2 plume at the Sleipner Field, Norwegian North Sea. Int. J. Greenh. Gas Control 2021, 106, 103260. [Google Scholar] [CrossRef]
  32. Harvey, O.R.; Qafoku, N.P.; Cantrell, K.J.; Lee, G.; Amonette, J.E.; Brown, C.F. Geochemical implications of gas leakage associated with geologic CO2 storage—A qualitative review. Environ. Sci. Technol. 2013, 47, 23. [Google Scholar] [CrossRef] [PubMed]
  33. Watts, N. Theoretical aspects of cap-rock and fault seals for single-and two-phase hydrocarbon columns. Mar. Pet. Geol. 1987, 4, 274–307. [Google Scholar] [CrossRef]
  34. Mathieson, A.; Wright, I.; Roberts, D.; Ringrose, P. Satellite imaging to monitor CO2 movement at Krechba, Algeria. Energy Procedia 2009, 1, 2201–2209. [Google Scholar] [CrossRef]
  35. Ingram, G.M.; Urai, J.L.; Naylor, M.A. Sealing processes and top seal assessment. In Norwegian Petroleum Society Special Publications; Møller-Pedersen, P., Koestler, A.G., Eds.; Elsevier: Amsterdam, The Netherlands, 1997; Volume 7, pp. 165–174. [Google Scholar]
  36. Bentham, M.; Pearce, J.; Kirk, K.; Hovorka, S.; van Gessel, S.; Pegler, B.; Neades, S.; Dixon, T. Managing CO2 Storage Resources in a Mature CCS Future. Energy Procedia 2014, 63, 5310–5324. [Google Scholar] [CrossRef]
  37. Couples, G.D.; Boult, P.; Kaldi, J. Seals: The Role of Geomechanics. In Evaluating Fault and Cap Rock Seals; American Association of Petroleum Geologists: Tulsa, OK, USA, 2005; Volume 2. [Google Scholar]
  38. Lowry, D.C.; Boult, P.; Kaldi, J. Economic Evaluation of Prospects with a Top Seal Risk. In Evaluating Fault and Cap Rock Seals; American Association of Petroleum Geologists: Tulsa, OK, USA, 2005; Volume 2. [Google Scholar]
  39. Lindeberg, E.; Wessel-Berg, D. Vertical convection in an aquifer column under a gas cap of CO2. Energy Convers. Manag. 1997, 38, S229–S234. [Google Scholar] [CrossRef]
  40. Pan, P.-Z.; Rutqvist, J.; Feng, X.-T.; Yan, F. An Approach for Modeling Rock Discontinuous Mechanical Behavior Under Multiphase Fluid Flow Conditions. Rock Mech. Rock Eng. 2014, 47, 589–603. [Google Scholar] [CrossRef]
  41. Alsayah, A.; Rigby, S.P.; Seely, R. Impact of exposure to supercritical carbon dioxide on reservoir caprocks and inter-layers during sequestration. Energy 2022, 15, 7538. [Google Scholar]
  42. Bickle, M.; Kampman, N.; Wigley, M. Natural analogues. Rev. Mineral. Geochem. 2013, 77, 15–71. [Google Scholar] [CrossRef]
  43. Shao, H.; Ray, J.R.; Jun, Y.-S. Dissolution and precipitation of clay minerals under geologic CO2 sequestration conditions: CO2−brine−phlogopite interactions. Environ. Sci. Technol. 2010, 44, 5999–6005. [Google Scholar] [CrossRef] [PubMed]
  44. Alsayah, A.; Rigby, S.P. Coupled multiphase flow, geochemical, and geomechanical modelling of the impact of shale interlayers on CO2 migration. Geoenergy Sci. Eng. 2023, 229, 212101. [Google Scholar] [CrossRef]
  45. Guariguata-Rojas, G.J.; Underhill, J.H. Implications of Early Cenozoic uplift and fault reactivation for carbon storage in the Moray Firth Basin. Interpretation 2017, 5, SS1–SS21. [Google Scholar] [CrossRef]
  46. Smith, D.J.; Noy, D.J.; Holloway, S.; Chadwick, R.A. The impact of boundary conditions on CO2 storage capacity estimation in aquifers. Energy Procedia 2011, 4, 4828–4834. [Google Scholar] [CrossRef]
  47. Heinemann, N.; Wilkinson, M.; Pickup, G.E.; Haszeldine, R.S.; Cutler, N.A. CO2 storage in the offshore UK Bunter Sandstone Formation. Int. J. Greenh. Gas Control 2012, 6, 210–219. [Google Scholar] [CrossRef]
  48. Bentham, M.; Williams, G.; Vosper, H.; Chadwick, A.; Williams, J.; Kirk, K. Using pressure recovery at a depleted gas field to understand saline aquifer connectivity. Energy Procedia 2017, 114, 2906–2920. [Google Scholar] [CrossRef]
  49. Hall, M.R.; Rigby, S.P.; Dim, P.; Bateman, K.; Mackintos, H.S.J.; Rochelle, C.A. Post-CO2 injection alteration of the pore network and intrinsic permeability tensor for a Permo-Triassic sandstone. Geofluids 2016, 16, 249–263. [Google Scholar] [CrossRef]
  50. Siqueira, T.A.; Iglesias, R.S.; Ketzer, J.M. Carbon dioxide injection in carbonate reservoirs—A review of CO2-water-rock interaction studies. Greenh. Gas Sci. Technol. 2017, 7, 802–816. [Google Scholar] [CrossRef]
  51. Hosseinzadehsadati, S.; Amour, F.; Hajiabadi, M.R.; Hamid, M.N. Hydro-Mechanical-Chemical Modelling of CO2 storage in a North Sea hydrocarbon chalk reservoir. In Proceedings of the 16th Greenhouse Gas Control Technologies Conference (GHGT-16), Lyon, France, 23–24 October 2022. [Google Scholar] [CrossRef]
  52. Khudaida, K.J.; Das, D.B. A numerical analysis of the effects of supercritical CO2 injection on CO2 storage capacities of geological formations. Clean Technol. 2020, 2, 21. [Google Scholar] [CrossRef]
  53. Obi, E.O.I.; Blunt, M.J. Streamline-based simulation of carbon dioxide storage in a north sea aquifer. Water Resour. Res. 2006, 42. [Google Scholar] [CrossRef]
  54. Torsen, A.; Smistad, H.; Tveit, H.; Hansen, O.; Bjørtuft, V.; Furuvik, N.; Moldestad, B. Simulation of CO2 Storage in the North Sea. In Proceedings of the 59th Conference on Simulation and Modelling (SIMS 59), Oslo, Norway, 26–28 September 2018; Oslo Metropolitan University: Oslo, Norway, 2018; pp. 255–262. [Google Scholar]
  55. De Simone, S.; Krevor, S. A tool for first order estimates and optimisation of dynamic storage resource capacity in saline aquifers. Int. J. Greenh. Gas Control 2021, 106, 103258. [Google Scholar] [CrossRef]
  56. Agada, S.; Kolster, C.; Williams, G.; Vosper, H.; MacDowell, N.; Krevor, S. Sensitivity Analysis of the Dynamic CO2 Storage Capacity Estimate for the Bunter Sandstone of the UK Southern North Sea. Energy Procedia 2017, 114, 4564–4570. [Google Scholar] [CrossRef]
  57. Watson, F.E.; Mathias, S.A.; Daniels, S.E.; Jones, R.R.; Davies, R.J.; Hedley, B.J.; Hunen, J.V. Dynamic modelling of a UK North Sea saline formation for CO<sub>2</sub> sequestration. Pet. Geosci. 2014, 20, 169–185. [Google Scholar]
  58. Elenius, M.; Skurtveit, E.; Yarushina, V.; Baig, I.; Sundal, A.; Wangen, M.; Landschulze, K.; Kaufmann, R.; Choi, J.C.; Hellevang, H.; et al. Assessment of CO2 storage capacity based on sparse data: Skade Formation. Int. J. Greenh. Gas Control 2018, 79, 252–271. [Google Scholar] [CrossRef]
  59. Räss, L.; Yarushina, V.M.; Simon, N.S.; Podladchikov, Y.Y. Chimneys, channels, pathway flow or water conducting features-an explanation from numerical modelling and implications for CO2 storage. Energy Procedia 2014, 63, 3761–3774. [Google Scholar] [CrossRef]
  60. Gaus, I.; Azaroual, M.; Czernichowski-Lauriol, I. Reactive transport modelling of the impact of CO2 injection on the clayey cap rock at Sleipner (North Sea). Chem. Geol. 2005, 217, 319–337. [Google Scholar] [CrossRef]
  61. Chaiwan, P.; Burtonshaw, J.; Thomas, R.; Paluszny, A.; Zimmerman, R. A three-dimensional, finite element-based study of the effect of heterogeneities on thermo-hydro-mechanical deformation during cold fluid injection. In Proceedings of the 57th U.S. Rock Mechanics/Geomechanics Symposium, Atlanta, GA, USA, 25–28 June 2023. [Google Scholar]
  62. Gabrielsen, R.; Skurtveit, E.; Faleide, J.I. Caprock integrity of the Draupne Formation, Ling Depression, North Sea, Norway. Nor. J. Geol. 2020, 100, 202019. [Google Scholar]
  63. Xie, X.; Cerasi, P. Impact of a Fault on CO2 Reservoir Integrity Under Depletion. In Proceedings of the 55th U.S. Rock Mechanics/Geomechanics Symposium, Virtual, 18–25 June 2021. [Google Scholar]
  64. Bentham, M.S.; Green, A.; Gammer, D. The occurrence of faults in the Bunter Sandstone Formation of the UK sector of the Southern North Sea and the potential impact on storage capacity. Energy Procedia 2013, 37, 5101–5109. [Google Scholar] [CrossRef]
  65. Williams, J.D.O.; Holloway, S.; Williams, G.A. Pressure constraints on the CO2 storage capacity of the saline water-bearing parts of the Bunter Sandstone Formation in the UK Southern North Sea. Pet. Geosci. 2014, 20, 155–167. [Google Scholar] [CrossRef]
  66. Onoja, M.; Shariatipour, S.M. The impact of gradational contact at the reservoir-seal interface on geological CO2 storage capacity and security. Int. J. Greenh. Gas Control 2018, 72, 1–13. [Google Scholar] [CrossRef]
  67. Archer, J.S.; Wall, C.G. Petroleum Engineering: Principles and Practice; Springer: Dordrecht, The Netherlands, 2012. [Google Scholar]
  68. Shariatipour, S.M.; Pickup, G.E.; Mackay, E.J. Investigation of CO2 storage in a saline formation with an angular unconformity at the caprock interface. Pet. Geosci. 2016, 22, 203–210. [Google Scholar] [CrossRef]
  69. Petersen, H.I.; Smit, F.W.H. Application of mud gas data and leakage phenomena to evaluate seal integrity of potential CO2 storage sites: A study of chalk structures in the Danish Central Graben, North Sea. J. Pet. Geol. 2023, 46, 47–76. [Google Scholar] [CrossRef]
  70. Gor, G.Y.; Stone, H.A.; Prévost, J.H. Fracture propagation driven by fluid outflow from a low-permeability aquifer. Transp. Porous Media 2013, 100, 69–82. [Google Scholar] [CrossRef]
  71. Kampman, N.; Busch, A.; Bertier, P.; Snippe, J.; Hangx, S.; Pipich, V.; Di, Z.; Rother, G.; Harrington, J.; Evans, J.P. Observational evidence confirms modelling of the long-term integrity of CO2-reservoir caprocks. Nat. Commun. 2016, 7, 12268. [Google Scholar] [CrossRef] [PubMed]
  72. Shukla, R.; Ranjith, P.; Choi, S.; Haque, A. Study of caprock integrity in geosequestration of carbon dioxide. Int. J. Geomech. 2011, 11, 294–301. [Google Scholar] [CrossRef]
  73. Constantin, J.; Peyaud, J.B.; Vergély, P.; Pagel, M.; Cabrera, J. Evolution of the structural fault permeability in argillaceous rocks in a polyphased tectonic context. Phys. Chem. Earth Parts A/B/C 2004, 29, 25–41. [Google Scholar] [CrossRef]
  74. Mathieson, A.; Midgely, J.; Wright, I.; Saoula, N.; Ringrose, P. In Salah CO2 Storage JIP: CO2 sequestration monitoring and verification technologies applied at Krechba, Algeria. Energy Procedia 2011, 4, 3596–3603. [Google Scholar] [CrossRef]
  75. Bissell, R.C.; Vasco, D.W.; Atbi, M.; Hamdani, M.; Okwelegbe, M.; Goldwater, M.H. A full field simulation of the in Salah gas production and CO2 storage project using a coupled geo-mechanical and thermal fluid flow simulator. Energy Procedia 2011, 4, 3290–3297. [Google Scholar] [CrossRef]
  76. Williams, J.D.O.; Fellgett, M.W.; Quinn, M.F. Carbon dioxide storage in the Captain Sandstone aquifer: Determination of in situ stresses and fault-stability analysis. Pet. Geosci. 2016, 22, 211–222. [Google Scholar] [CrossRef]
  77. Orlic, B.; ter Heege, J.; Wassing, B.B.T. Assessing the Short-term And Long-term Integrity of Top Seals In Feasibility Studies of Geological CO2 storage. In Proceedings of the 45th U.S. Rock Mechanics/Geomechanics Symposium, San Francisco, CA, USA, 26–29 June 2011. [Google Scholar]
  78. Chiaramonte, L.; Johnson, S.; White, J.A. Preliminary Geomechanical Analysis of CO2 Injection at Snøhvit, Norway. In Proceedings of the 45th U.S. Rock Mechanics/Geomechanics Symposium, San Francisco, CA, USA, 26–29 June 2011. [Google Scholar]
  79. Miocic, J.M.; Johnson, G.; Gilfillan, S.M.V. Fault seal analysis of a natural CO2 reservoir in the southern North Sea. Energy Procedia 2014, 63, 3364–3370. [Google Scholar] [CrossRef]
  80. Cavanagh, A.J.; Haszeldine, R.S. The Sleipner storage site: Capillary flow modeling of a layered CO2 plume requires fractured shale barrier. Int. J. Greenh. Gas Control 2014, 21, 101–112. [Google Scholar] [CrossRef]
  81. Akai, T.; Kuriyama, T.; Kato, S.; Okabe, H. Numerical modelling of long-term CO2 storage mechanisms in saline aquifers using the Sleipner benchmark dataset. Int. J. Greenh. Gas Control 2021, 110, 103405. [Google Scholar] [CrossRef]
  82. Chadwick, A.; Noy, D.; Lindeberg, E.; Arts, R.; Eiken, O.; Williams, G. Calibrating reservoir performance with time-lapse seismic monitoring and flow simulations of the Sleipner CO2 plume. In Proceedings of the GHGT-8: 8th International Conference on Greenhouse Gas Control Technologies, Trondheim, Norway, 19–22 June 2006; Elsevier: Oxford, UK, 2006; pp. 1–6. [Google Scholar]
  83. Hermanrud, C.; Andresen, T.; Eiken, O.; Hansen, H.; Janbu, A.; Lippard, J.; Bolås, H.N.; Simmenes, T.H.; Teige, G.M.G.; Østmo, S. Storage of CO2 in saline aquifers-Lessons learned from 10 years of injection into the Utsira Formation in the Sleipner area. Energy Procedia 2009, 1, 1997–2204. [Google Scholar] [CrossRef]
  84. Hermanrud, C.; Teige, G.M.G.; Iding, M.; Eiken, O.; Rennan, L.; Østmo, S. Differences between flow of injected CO2 and hydrocarbon migration. Pet. Geol. Conf. Ser. 2010, 7, 183–1188. [Google Scholar]
  85. Williams, G.A.; Chadwick, R.A. An improved history-match for layer spreading within the Sleipner plume including thermal propagation effects. Energy Procedia 2017, 114, 2856–2870. [Google Scholar] [CrossRef]
  86. Jackson, S.J.; Krevor, S. Small-scale capillary heterogeneity linked to rapid plume migration during CO2 storage. Geophys. Res. Lett. 2020, 47, e2020GL088616. [Google Scholar] [CrossRef]
  87. Ringrose, P.S.; Mathieson, A.S.; Wright, I.W.; Selma, F.; Hansen, O.; Bissell, R. The In-Salah CO2 storage project: Lessons learned and knowledge transfer. Energy Procedia 2013, 37, 6226–6236. [Google Scholar] [CrossRef]
  88. Dance, T.; LaForce, T.; Glubokovskikh, S.; Ennis-King, J.; Pevzner, R. Illuminating the geology: Post-injection reservoir chararcterization of the CO2CRC Otway site. Int. J. Greenh. Gas Control 2019, 86, 146–157. [Google Scholar] [CrossRef]
  89. Ahmadinia, M.; Shariatipour, S.M. Analysing the role of caprock morphology on history matching of Sleipner CO2 plume using an optimisation method. Greenh. Gases-Sci. Technol. 2020, 10, 1077–1097. [Google Scholar] [CrossRef]
  90. Ahmadinia, M.; Shariatipour, S.M. A study on the impact of storage boundary and caprock morphology on carbon sequestration in saline aquifers. Greenh. Gases-Sci. Technol. 2020, 11, 183–205. [Google Scholar] [CrossRef]
  91. Zhu, C.; Zhang, G.; Lu, P.; Meng, I.; Ji, X. Benchmark modelling of the Sleipner CO2 plume: Calibration to seismic data for the uppermost layer and model sensitivity analysis. Int. J. Greenh. Gas Control 2015, 43, 233–246. [Google Scholar] [CrossRef]
  92. Zhang, G.; Lu, P.; Ji, X.; Zhu, C. CO2 Plume Migration and Fate at Sleipner, Norway: Calibration of Numerical Models, Uncertainty Analysis, and Reactive Transport Modelling of CO2 Trapping to 10,000 Years. Energy Procedia 2017, 114, 2880–2895. [Google Scholar] [CrossRef]
  93. Hodneland, E.; Gasda, S.; Kaufmann, R.; Bekkvik, T.C.; Hermanrud, C.; Midttomme, K. Effect of temperature and concentration of impurities in the fluid stream on CO2 migration in the Utsira formation. Int. J. Greenh. Gas Control 2019, 83, 20–28. [Google Scholar] [CrossRef]
  94. Chadwick, R.A.; Noy, D.J. History-matching flow simulations and time-lapse seismic data from the Sleipner CO2 plume. In Petroleum Geology: From Mature Basins to New Frontiers—Proceedings of the 7th Petroleum Geology Conference; Geological Society of London: London, UK, 2010; Volumes 7, pp. 1171–1182. [Google Scholar]
  95. McDermott, C.; Williams, J.; Tucker, O.; Jin, M.; Mackay, E.; Edlmann, K.; Haszeldine, R.S.; Wang, W.; Kolditz, O.; Akhurst, M. Screening the geomechanical stability (thermal and mechanical) of shared multi-user CO2 storage assets: A simple effective tool applied to the Captain Sandstone Aquifer. Int. J. Greenh. Gas Control 2016, 45, 43–61. [Google Scholar] [CrossRef]
  96. Agada, S.; Jackson, S.; Kolster, C.; MacDowell, N.; Williams, G.; Vosper, H.; Williams, J.; Krevor, S. The impact of energy systems demands on pressure limited CO2 storage in the Bunter Sandstone of the UK Southern North Sea. Int. J. Greenh. Gas Control 2017, 65, 128–136. [Google Scholar] [CrossRef]
  97. Newell, P.; Martinez, M.J. Numerical assessment of fault impact on caprock seals during CO2 sequestration. Int. J. Greenh. Gas Control 2020, 94, 102890. [Google Scholar] [CrossRef]
  98. Bergmo, P.E.S.; Grimstad, A.-A.; Lindeberg, E. Simultaneous CO2 injection and water production to optimize aquifer storage capacity. Int. J. Greenh. Gas Control 2011, 5, 555–564. [Google Scholar] [CrossRef]
  99. Zhang, K.; Lau, H.C.; Chen, Z. Extension of CO2 storage life in the Sleipner CCS project by reservoir pressure management. J. Nat. Gas Sci. Eng. 2022, 108, 104814. [Google Scholar] [CrossRef]
Figure 1. Schematic diagram showing potential geological carbon storage sites and potential leakage pathways.
Energies 17 00211 g001
Figure 2. Distribution of the Bunter Sandstone Formation (offshore) and Sherwood Sandstone Group (onshore) in Eastern England and the UK sector of the Southern North Sea. The Central Fracture Zone/Dowsing Fault Zone is shown schematically and consists of a number of individual faults. Reprinted with permission from Ref. [19]. 2012, Elsevier.
Energies 17 00211 g002
Figure 3. (a) Perspective view of the Bunter Sandstone model. Individual domes are labelled with letters A, B, and C. While the underburden is shown (Bunter Shale Formation), the Haisborough Group caprocks are hidden for clarity. Model dimensions are approximately 25 × 44 km. Location of the model area and extent of the Bunter Sandstone are shown on the inset map. Reprinted with permission from Ref. [20]. 2013, Elsevier. (b) Seismic reflection section across Dome A. Location of section is marked in Figure 2. Interpreted reflections are noted on right-hand side of image: (1) top Chalk Group, (2) Base Cretaceous Unconformity, (3) top Bunter Sandstone Formation, (4) near top Bunter Shale Formation, and (5) top Zechstein Group. SNS MegaSurvey data courtesy of PGS. Reprinted with permission from Ref. [21]. 2013, Elsevier.
Energies 17 00211 g003aEnergies 17 00211 g003b
Figure 5. Membrane capillary seals (left) fail due to capillary leakage, while hydraulic seals (Mathieson et al. [34]) exhibit higher capillary entry pressures and fail due to hydrofracturing (Ingram et al. [35]). Adapted with permission from Ref. [35]. 1997, Elsevier.
Energies 17 00211 g005
Figure 6. The Sleipner CCS project. (a) Gamma ray response obtained at vertical exploration well 15/9–13, with the nine layers sandwiched between mudrocks (labelled L1–L9). (b) 4D seismic data acquired in 2010, at which time approximately 12 Mt CO2 had been injected. The left figure shows the seismic data and the right figure shows the nine CO2 plume layers separated by thin intraformational mudrock layers. (c) Schematic showing seismically observed CO2 plumes based on the seismic data shown in (b). Reprinted with permission from Ref. [81]. 2021, Elsevier.
Energies 17 00211 g006
Figure 7. Time-lapse seismic inline through the Sleipner CO2 injection site showing the three reputed ‘chimneys’ (arrowed and numbered). (a) 1994 baseline data prior to the injection of CO2. (b) 2010 after fourteen years of injection. Reproduced from Ref. [31] under the terms of the Creative Commons CC-BY license.
Energies 17 00211 g007
Table 1. A summary of the primary North Sea caprock types.
LocationReservoirCaprock Type
Central and Northern North SeaFriggMiddle Eocene marine mudstones
Southern and Central North SeaBunter, CormorantKeuper halite and Bunter shale
Outer Moray FirthNorthern Claymore fieldAptain marls, Cromer knoll marls, Campanian marls
Viking Graben, East Shetland BasinBrent, Magnus, BraeKimmeridge clay
Southern Permian BasinRotliegendsZechstein halite/anhydrite and Rotliegend shale
Disclaimer/Publisher’s Note: The statements, opinions and data contained in all publications are solely those of the individual author(s) and contributor(s) and not of MDPI and/or the editor(s). MDPI and/or the editor(s) disclaim responsibility for any injury to people or property resulting from any ideas, methods, instructions or products referred to in the content.

