Review

Emissions from Light-Duty Vehicles—From Statistics to Emission Regulations and Vehicle Testing in the European Union

by
Wiktor Pacura
*,
Katarzyna Szramowiat-Sala
* and
Janusz Gołaś
Faculty of Energy and Fuels, AGH University of Krakow, Al. Mickiewicza 30, 30-059 Krakow, Poland
*
Authors to whom correspondence should be addressed.
Energies 2024, 17(1), 209; https://doi.org/10.3390/en17010209
Submission received: 24 November 2023 / Revised: 27 December 2023 / Accepted: 28 December 2023 / Published: 30 December 2023

Abstract

:
The article offers a comprehensive examination of vehicle emissions, with a specific focus on the European Union’s automotive industry. Its main goal is to provide an in-depth analysis of the factors influencing the emission of microcontaminants from light-duty vehicles and the challenges associated with their removal via exhaust aftertreatment systems. It presents statistical insights into the automotive sector and explores the relationships between vehicle categories, fuel types, and the emission of regulated and nonregulated pollutants, as well as relevant legal regulations such as the European Emission Standard. The article delves into the characteristics of vehicle exhaust, compares exhaust-gas aftertreatment systems, and introduces factors affecting emissions from gasoline engines, including downsizing, fuel composition, and engine operating parameters. It also considers the impact of driving style, start–stop systems, and related factors. Concluding, the article offers an overview of vehicle-testing procedures, including emission tests on dynamometer chassis and real driving emissions. With the growing global vehicle population and international environmental regulations, a focus on solid particles containing microcontaminants is paramount, as they pose significant risks to health and the environment. In summary, this article provides valuable insights into vehicle emissions, significantly contributing to our understanding of this crucial environmental issue.

1. Vehicles around the World

1.1. Statistical Information on the Automotive Industry

In the 15th century, Leonardo da Vinci presented a plan for a vehicle moving by the force of the wind, while, in the following centuries, the idea was developed, among others, by JH Genevois, who proposed the use of small windmills and springs as energy storage. The first steam vehicle was created in 1769, constructed by Nicolas-Joseph Cugnot, while Karl Benz in 1886 patented a machine that is considered the first internal combustion car. The Model T produced in 1908 by the Henrys’ Ford Company became the first inexpensive vehicle available to a wide audience, marking the beginning of the dynamic development of the automobile industry [1]. Currently, it is one of the most important businesses—vehicles are responsible for the transport of goods, people, and services around the world.
The automotive branch includes all activities in the design, production, servicing, marketing, and sale of cars. One third of all research and development expenditure in the European Union is spent on the development of the automotive industry. This makes the automotive business the most dynamically developing branch of business, with expenditures on research and development reaching EUR 60 billion in 2020. This amount is higher than the four next most cost-intensive sectors (drugs and biotechnology EUR 31.4 billion; technological equipment EUR 15.9 billion; software and computer services EUR 10.3 billion) [2].
In 2019, 12.7 million people were employed in the automotive industry, which is approximately 7% of total employment in the EU and more than 11.5% of employment in the industry sector. Related to the production of vehicles, parts and accessories are 3.5 million positions, while the rest are related to the sale and maintenance of vehicles, transport services, and the construction of road infrastructure [2].
There are approximately 1.3 billion vehicles on the world’s roads and more than 246 million passenger cars on EU roads [2,3]. In 2021, 79 million new vehicles were produced, and every fifth vehicle was produced in Europe. Over 12 million vehicles were produced in the European Union alone, of which almost 10 million were passenger and service vehicles up to 3.5 tonnes. There were 66 million vehicle registrations worldwide, of which 9.7 million were in the European Union itself. The largest number of new vehicles appeared in Germany, France, and Italy (respectively, 2.6, 1.7, and 1.4 million) [2].
Figure 1 illustrates the average annual vehicle mileage for selected European Union countries, revealing a general downward trend. This decline can be attributed to various factors, including the emergence of alternative transportation modes such as railways and air travel, urban migration patterns, and economic growth that has resulted in shorter distances to essential amenities like workplaces, shopping centres, and service outlets. In the EU-27, the average mileage decreased from 13,000 km annually to 11,300 km. In particular, Finland experienced the most significant reduction, with a decrease of approximately 30% from around 19,000 km to 14,000 km over a 20-year period. Italy also demonstrated a comparable percentage decrease, as the average mileage dropped from 12,500 km to 8500 km.
In contrast to other EU countries, in Poland in the years 2002–2010, there was an increase in the average annual mileage, at its peak reaching approximately 8500 km. The downward trend continued until 2014 when vehicles travelled 1.5 thousand km less. In 2017–2019, the average distance was about 8.6 thousand km.
Based on the number of motor vehicles and the average mileage, it can be assumed that almost 2.8 trillion km (2.8 × 10¹²) were driven in the EU in 2019. This means that seemingly small amounts of pollutants introduced into the environment, often counted in micrograms per kilometre driven, add up to significant amounts over the course of a year.
When analysing emissions, the type of vehicle and the fuel on which it is driven should be taken into account. These factors determine not only the emission tests used and the limits that the vehicles must meet but also the scale of the tests.

1.2. Vehicle Categories

Vehicles differ in performance, appearance, weight, purpose, and price. The division of vehicles into appropriate categories is used, e.g., while conducting emission tests and limiting individual exhaust-gas components. In addition, assigning a vehicle to a given group defines which requirements it is subject to, e.g., tax, and the scope of permissions necessary for its use. In Poland, vehicle division is defined by the Road Traffic Law [5], which is based on the Directive of the European Parliament and of the Council [6]. Table 1 presents the individual categories with a simplified description.
Categories M, N, and O have additional subgroups depending on the number of seats for passengers or the permissible total weight.
The laws in force in the European Union regulating i.a. the regulations on approval and emission tests divide vehicles into two categories: light duty and heavy duty. In simple terms, light-duty vehicles (LDV) have a reference mass of up to 2610 kg (or in some cases 2840 kg) [7]. LDVs are further divided into two groups, depending on the purpose of the vehicle: light-commercial vehicles (LCV), designed mostly to transport goods, and passenger cars, for driving people. According to the 2017/1151 Regulation of the EU Commission, the reference mass is the total mass of the vehicle ready to drive, including with the fuel tank filled to at least 90%, including the mass of the driver, fuel, operating fluids, and standard equipment according to the manufacturer’s specification [8,9].
Reports and statistical studies are divided into vehicle market segments. Here, the division criteria often focus on one feature that connects the vehicles, e.g., size, body type, and price [10]. Due to the size, vehicles are divided into small, city, compact, family, luxury, sports, and vans. The most popular body types include hatchback, crossover, and fastback, while due to the price, vehicles are divided into cheap, popular, luxury, and sports. Due to similar parameters, such as the weight and size of the vehicle in individual segments, an additional division is applied due to specific engine power, torque, acceleration, and maximum speed. In the context of emission measurements in selected groups of vehicles (e.g., M1 and N1), vehicles are classified according to their power-to-weight ratio (PWR).
Depending on engine displacement and size, vehicles may be subject to additional tax relief. An example is the vehicle ownership fee applicable in some EU countries. Vehicles with higher unit power or engine displacement and meeting older emission standards are subject to higher tax rates [11], for example, in Japan, the so-called kei car, where the maximum dimensions and engine power of the vehicle were imposed. Belonging to this segment was associated with lower tax rates, for example, in purchase and insurance [12]. Vehicles classified as movable historical monuments benefit from exemptions, including those pertaining to emission requirements and restrictions on entering low-emission zones [5].
Furthermore, all self-propelled machines [6], including vehicles not designed for passenger and goods transport, along with mobile machines and transportable devices installed on the vehicle chassis for passenger or goods transport, fall under the category of nonroad mobile machines [13]. This category encompasses a diverse range of equipment, including small gardening equipment, construction machinery, agricultural machinery, locomotives, and inland waterway vessels [14].

1.3. Types of Fuel Used

Depending on the internal combustion engine (ICE) in vehicles, the kinetic energy to drive the wheels is obtained from various energy sources. For example, vehicles powered by refined petroleum products, such as diesel, gasoline, and liquid petroleum gas (LPG), convert chemical energy. Hybrid and electric vehicles (EVs) can also draw electricity from the conversion of chemical energy, i.e., burning hard coal and lignite in conventional power plants, but also from renewable sources, such as solar and wind power plants.
The type of fuel that the vehicle is powered by is important not only in terms of legal emission limits but above all in terms of the exhaust-gas treatment systems used. The most popular fuels, classified as conventional fuels, include gasoline and diesel. An increasing number of alternatively powered vehicles are appearing on European roads. Alternative fuels include compressed natural gas (CNG), LPG, and hydrogen.
Bioadditives are added to conventional fuels to effectively mitigate total CO2 emissions [15]. In the European Union, fuels are designated with specific codes that indicate the maximum addition of biocomponent (% vol). For instance, gasoline variants like E0, E5, E85 and E100 contain a maximum volume of 0, 5, 85, and 100% vol. bioethanol, respectively. Similarly, diesel fuels such as B7 and B10 consist of up to 7% vol. and 10% vol. fatty acid methyl esters (FAME), respectively.
Some vehicles are equipped with hybrid systems with two different energy converters (and energy storage systems). Hybrid vehicles are divided into light (mild) hybrids, full hybrids, and plug-in hybrids. In light hybrids, the electric motor supports the internal combustion engine and cannot drive the vehicle on its own. The electric unit functions as a starter and alternator, is able to power onboard electrical devices, and supports the start–stop system. An additional advantage of hybrids is the ability to recover energy during braking, which reduces the need for fuel. Full hybrids can run on electric power for short distances. The electric motor supports the internal combustion engine, providing, among other things, additional torque and draws energy from the combustion engine and when recovering it from braking. The plug-in hybrid has an electric drive capable of independently propelling the vehicle on routes reaching several dozen kilometres. The battery is charged both from the grid and by the engine under specific conditions. Once the energy from the grid is fully consumed, this approach can substantially minimize CO2 emissions [16].
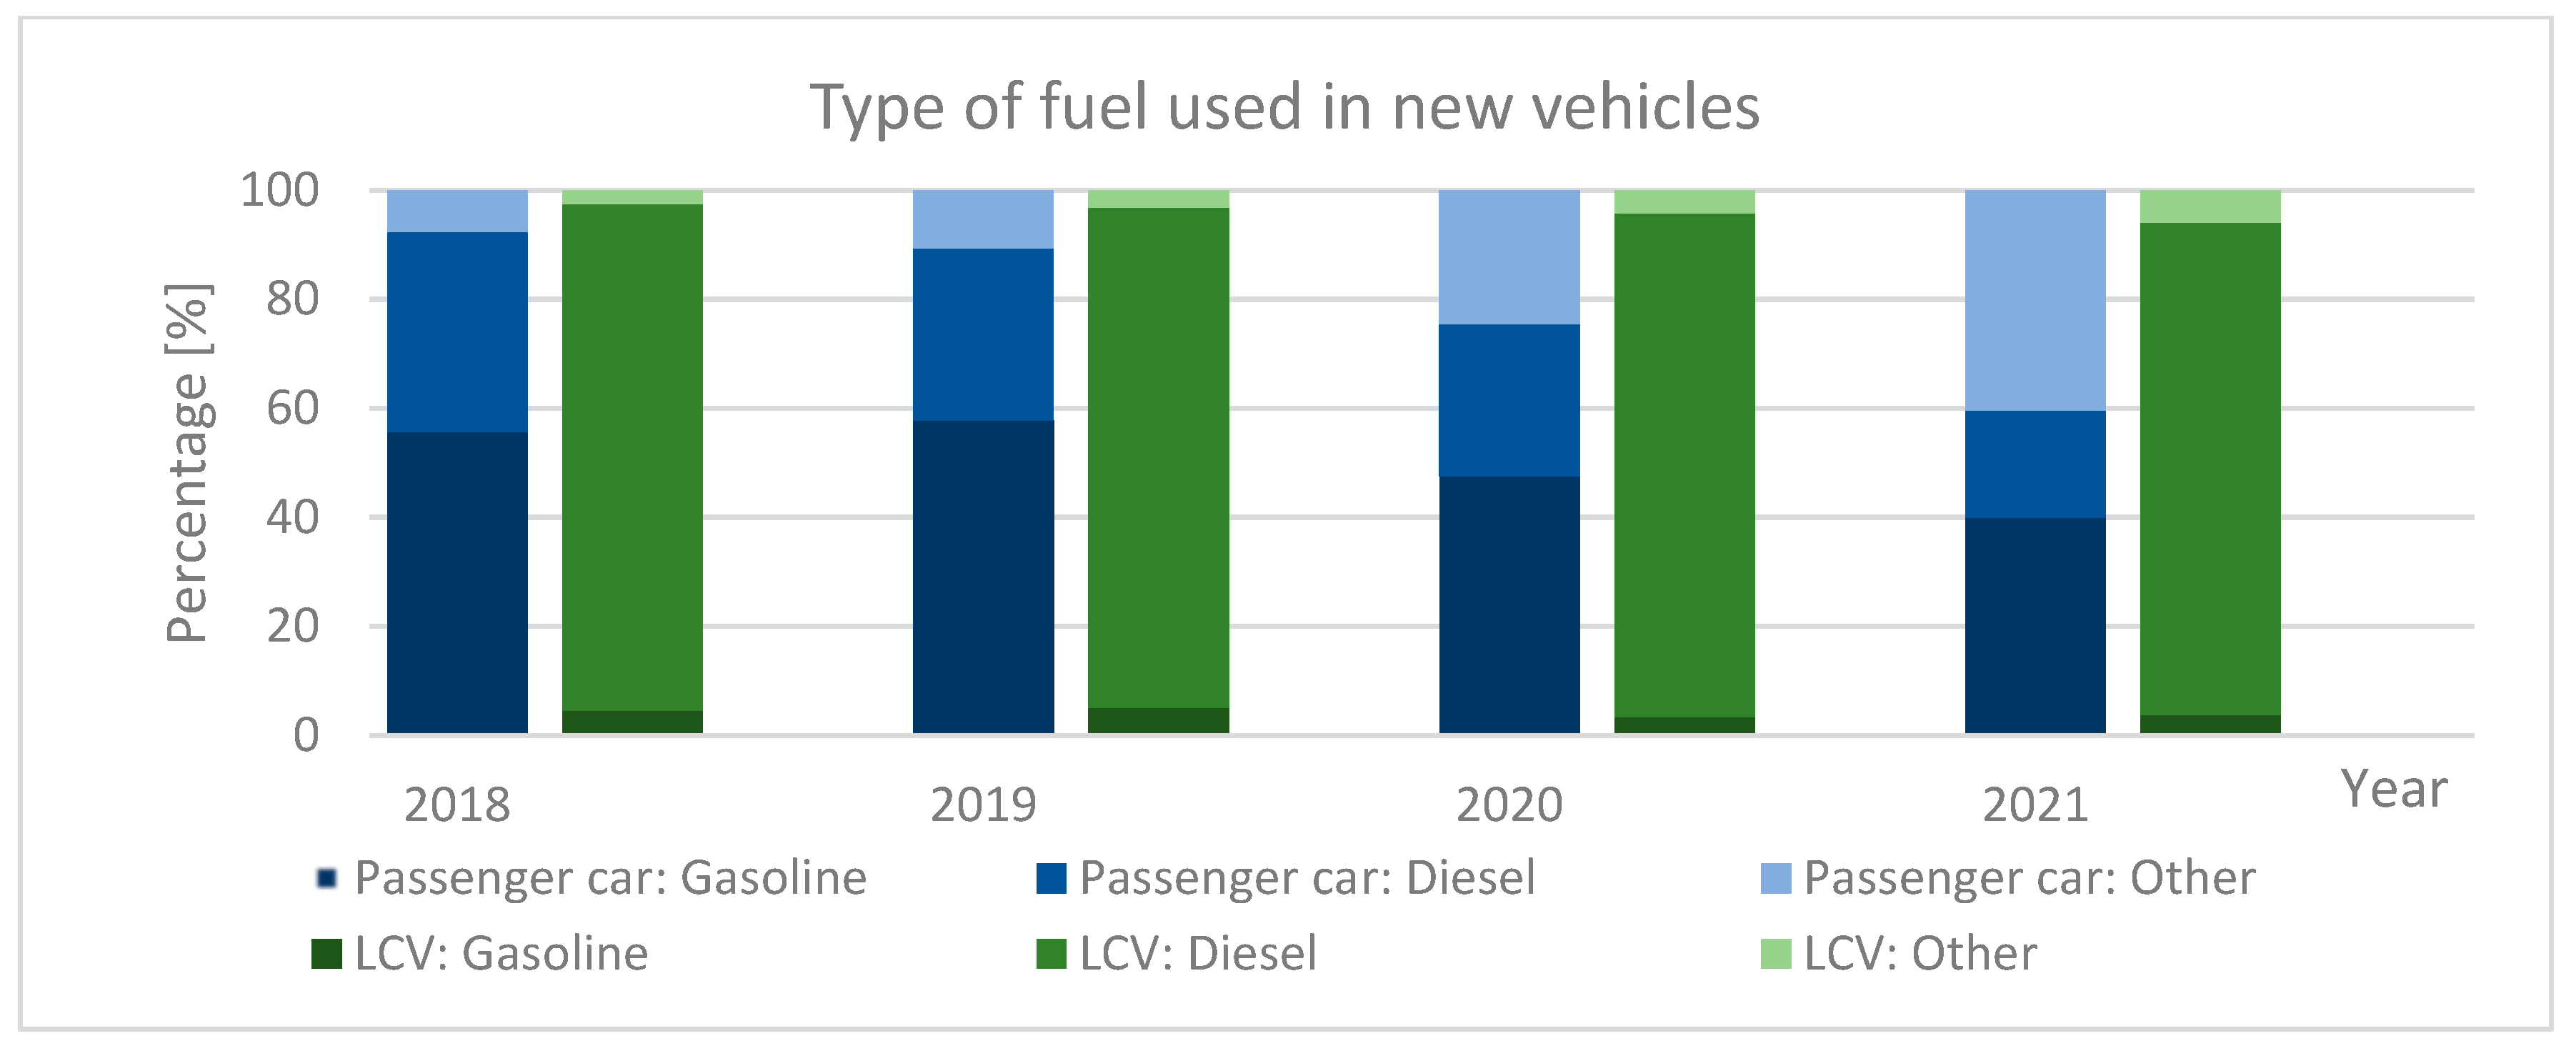
Electric vehicles have batteries that can cover up to 800 km on a single charge [17]. Due to the lack of a combustion engine, they do not emit exhaust gases and engine particulates. Figure 2 shows the fuels used in new vehicles.
In 2018, gasoline-powered spark-ignition (SI) passenger vehicles accounted for over 55% of all units sold, around 37% had compression ignition (CI) engines, and the share of vehicles with other engines was less than 8%. In 2021, the share of vehicles with SI and CI engines dropped to 40% and less than 20%, respectively. Other vehicles accounted for more than 40% of all passenger vehicles sold, of which approximately 20% were hybrid vehicles (light and full), and electric and plug-in hybrids accounted for 9%. In the case of light-duty vehicles, the share of units with a diesel engine decreased slightly from 93% to 90%, the share of diesel-engine-equipped vehicles was approximately 4–5%, and the share of alternative fuels increased from 2.5% to 6%.
In Poland in 2018, of 23.4 million registered passenger vehicles, almost 53% were with a spark-ignition engine, 31% with a compression-ignition engine, and 14% with an LPG installation. Vehicles with an alternative drive accounted for 2% of the entire fleet [4].
Motor vehicles can run on two types of fuel. Depending on the adaptation of the engine, two-fuel vehicles and flex-fuel vehicles are distinguished [9]. Bifuel vehicles have two separate fuel delivery systems; the internal combustion engine uses one type of fuel at a time. An example is vehicles with a gasoline engine powered by a gasoline engine equipped with an installation designed to supply LPG. Flex-fuel vehicles have one fuel tank, and the engine is designed to burn a mixture of different proportions. A flex-fuel ethanol vehicle can run on petrol or a mixture of petrol and ethanol of up to 85% (E85), and a flex-fuel biodiesel vehicle can run on mineral diesel or a mixture of mineral diesel and biodiesel. In 2019, the average fuel consumption in light passenger and commercial vehicles was 6.0 litres of gasoline equivalent per 100 km [18].
In addition to exhaust-gas treatment systems and emission limits, fuel selection is also influenced by economic and technological considerations. In the European Union, starting from 2035, manufacturers will be restricted to exclusively selling zero CO2 emission vehicles. This transition requires the expansion of the electric vehicle charging infrastructure and network, as well as the establishment of an extensive hydrogen refuelling-station network to support vehicles powered by alternative fuels. Furthermore, the market will require a sufficient supply of synthetic gasoline. Additionally, producers will face the challenge of meeting the increased demand for raw materials and components required for battery production and electricity generation. Transport poverty, which pertains to the limitations imposed on transportation and mobility, is also a significant factor influencing fuel restrictions set by the legislative body.

2. Vehicle Emissions

2.1. Emission and Low-Stack Emission

Within the European Union, several impactful acts are currently in effect to safeguard or uphold air quality. Examples include the implementation of Best Available Techniques (BAT) [19] and the Fit for 55 initiative [20]. BAT requires the use of the most effective practical methods. Fit for 55 is an integral part of the 2030 Climate Target Plan and the Green Deal, which aims to achieve a 55% reduction in CO2 emissions by 2030. Furthermore, from 2035, only vehicles with zero CO2 emissions should be produced.
According to the Polish Environmental Protection Law, emission is the direct or indirect introduction, as a result of human activity, of substances or energy (heat, noise, vibration, or electromagnetic field) into the environment [21]. One type of emission is the so-called low emission or low-stack emission. That is, the emission of dust and harmful gases is the result of inefficient and incomplete fuel burning during residential heating, industrial energy and heat production, and automotive emission [22] which, according to source classification by the Environmental Protection Agency U.S., refer to nonpoint emission sources, point emission sources, and on-road emission sources, respectively [23]. Substances are introduced into the environment at a height of up to 40 metres above ground level [24,25].

2.2. Selected Legal Regulations

Low-stack emission is particularly dangerous in urban agglomerations with dense high buildings or in places where air circulation is hindered by the terrain. An example of such a place is the city of Krakow, where dense historical buildings and location in a valley make the removal (dilution) of air pollution by air movement particularly difficult. To improve air quality, numerous solutions are used, such as creating zones free of tall buildings, the so-called air corridors, which are used to ensure the free flow of wind. Another solution is to limit the sources of low emission through local regulations, e.g., limiting the use of solid fuels [25] and limiting the traffic of motor vehicles, e.g., clean transport zones, zones of limited transport emissions [26,27] and local air protection programs [28]. There are over 220 restricted emission zones in 15 countries across the European Union [29].

2.3. Regulated Emission—European Emission Standard

The literature widely describes the significant risks that regulated emissions pose both to human health and the environment [30,31]. This underscores the importance of considering the complete life cycle of vehicle emissions, including fuel extraction and transportation, in order to comprehensively address the environmental impact.
Vehicle emissions are calculated only on the so-called way from the tank to the wheel (TTW), i.e., without taking into account the pollution caused during the extraction and transport of fuel, i.e., on the way from the well to the tank (WTT; well to tank). Emissions from the production of the vehicle are also not taken into account. The diagram of the path from the well to the wheels is shown in Figure 3. This is important, for example, when comparing the CO2 emissions of electric vehicles—while the TTW emissions will rather be constant, the WTT will be higher for energy from nonrenewable sources [32].
In Poland and the European Union, vehicle emissions are regulated by the European Emission Standards [9] and CO2 emission limits [33]. The regulated emissions are carbon dioxide, carbon monoxide, nitrogen oxides, hydrocarbons (HC), nonmethane hydrocarbons (NMHC), and particulate matter. In the case of solid particles, there is a division into their mass (PM) and number (PN). Depending on the fuel used, the limits set for individual components differ. Table 2 compares the value of the current Euro 6d-ISC-FCM standard (in-service conformity, fuel-consumption measurement) [34]. All regulated pollutants have their source in the engine, i.e., they are created as a result of fuel combustion and small amounts of engine-oil combustion.
Vehicles with a spark-ignition engine can emit 1 g of carbon monoxide for every kilometre driven, while vehicles with a compression ignition engine can emit half as much, 0.5 g/km. In vehicles with a gasoline engine, hydrocarbons and nonmethane hydrocarbons are limited, while in vehicles powered by a diesel engine, the sum of hydrocarbons and nitrogen oxides is specified. In addition, in both cases, there is an individual NOx limit of 0.060 and 0.080 g/km, respectively. The mass of particulate matter emitted by both types of vehicles is identical. For vehicles with a gasoline engine, the particle-number limit only applies to vehicles with direct fuel injection (DI). It is worth noting that only particles with an electrical mobility diameter of 23 nm or larger are limited. Vehicle CO2 emissions are calculated according to specific tests, such as the Worldwide Harmonised Light Vehicle Test Procedure (WLTP), while manufacturers’ fleet CO2 emissions are determined by averaging the specific CO2 emissions of all new passenger vehicles produced by a given manufacturer. [33]. According to applicable regulations, all passenger and light-duty vehicles that emit less than 50 gCO2/km are classified as low-emission vehicles (LEV) [33]. This parameter refers mainly to vehicles powered by conventional fuels. For example, vehicles with a hydrogen-powered drive unit emit insignificant amounts of CO2 resulting from engine oil, while emitting relatively large amounts of nitrogen oxides [35].
The emission of sulphur oxides is not directly limited by the emission standards; however, in this case, the upper limit of the sulphur content in diesel oil and gasoline is applicable, which is 10 mg/kg in both cases [36].
According to the European Union regulations, motor vehicles’ exhaust-gas treatment systems must effectively reduce harmful exhaust components for 5 years or over a distance of at least 160,000 km, whichever comes first [7].
Since 2018, work has been underway on the next Euro 7 emission standard [37], which, in addition to tightening the existing emission limits for components such as NOx, aims to reduce the diameter of regulated particulate matter from 23 nm to 10 nm and introduce a NH3 limit of 20 mg/km [38,39,40,41]. Motor vehicles must meet emission standards for 10 years or 200,000 km [42,43].

2.4. Nonexhaust and Unregulated Emissions

In addition to the regulated pollutants, vehicle exhaust contains a number of elements and compounds that are not limited. In the exhaust stream, there are numerous particles and particulates formed by the incomplete combustion of fuel and co-combustion of engine oil [44,45,46,47]. Nonregulated gaseous emissions from internal combustion-powered engines encompass a range of pollutants beyond those subject to specific regulatory frameworks, such as methane, nitrous oxide, benzene, formaldehyde, acetaldehyde, acrolein, toluene, and xylene. They contribute to air pollution and environmental concerns. While solid particle mass and number are limited, currently there are no regulations regarding their chemical composition. The literature describes a possible way of solid particle formation starting from fuel pyrolysis through nucleation, coalescence, and agglomeration [45,48,49,50]. In addition, the extreme conditions in the engine, e.g., high fuel-combustion temperature, locally reaching 2000 °C, and the high speed of the engine pistons [51], lead to abrasion of the elements and emission of metal particles. Unregulated emissions also include pollution from road traffic [52,53], mainly the abrasion of wheels and roads. During vehicle use, tires and components of the braking system, such as brake discs and pads, are subject to abrasion. Roads on which vehicles move are subject to gradual degradation and abrasion, which also affects the emission of particles into the atmosphere. Moving vehicles on the road can also dislodge and release particulate matter that has accumulated on the road surface, contributing to airborne solid particles. This effect is particularly noticeable when driving on unpaved roads.
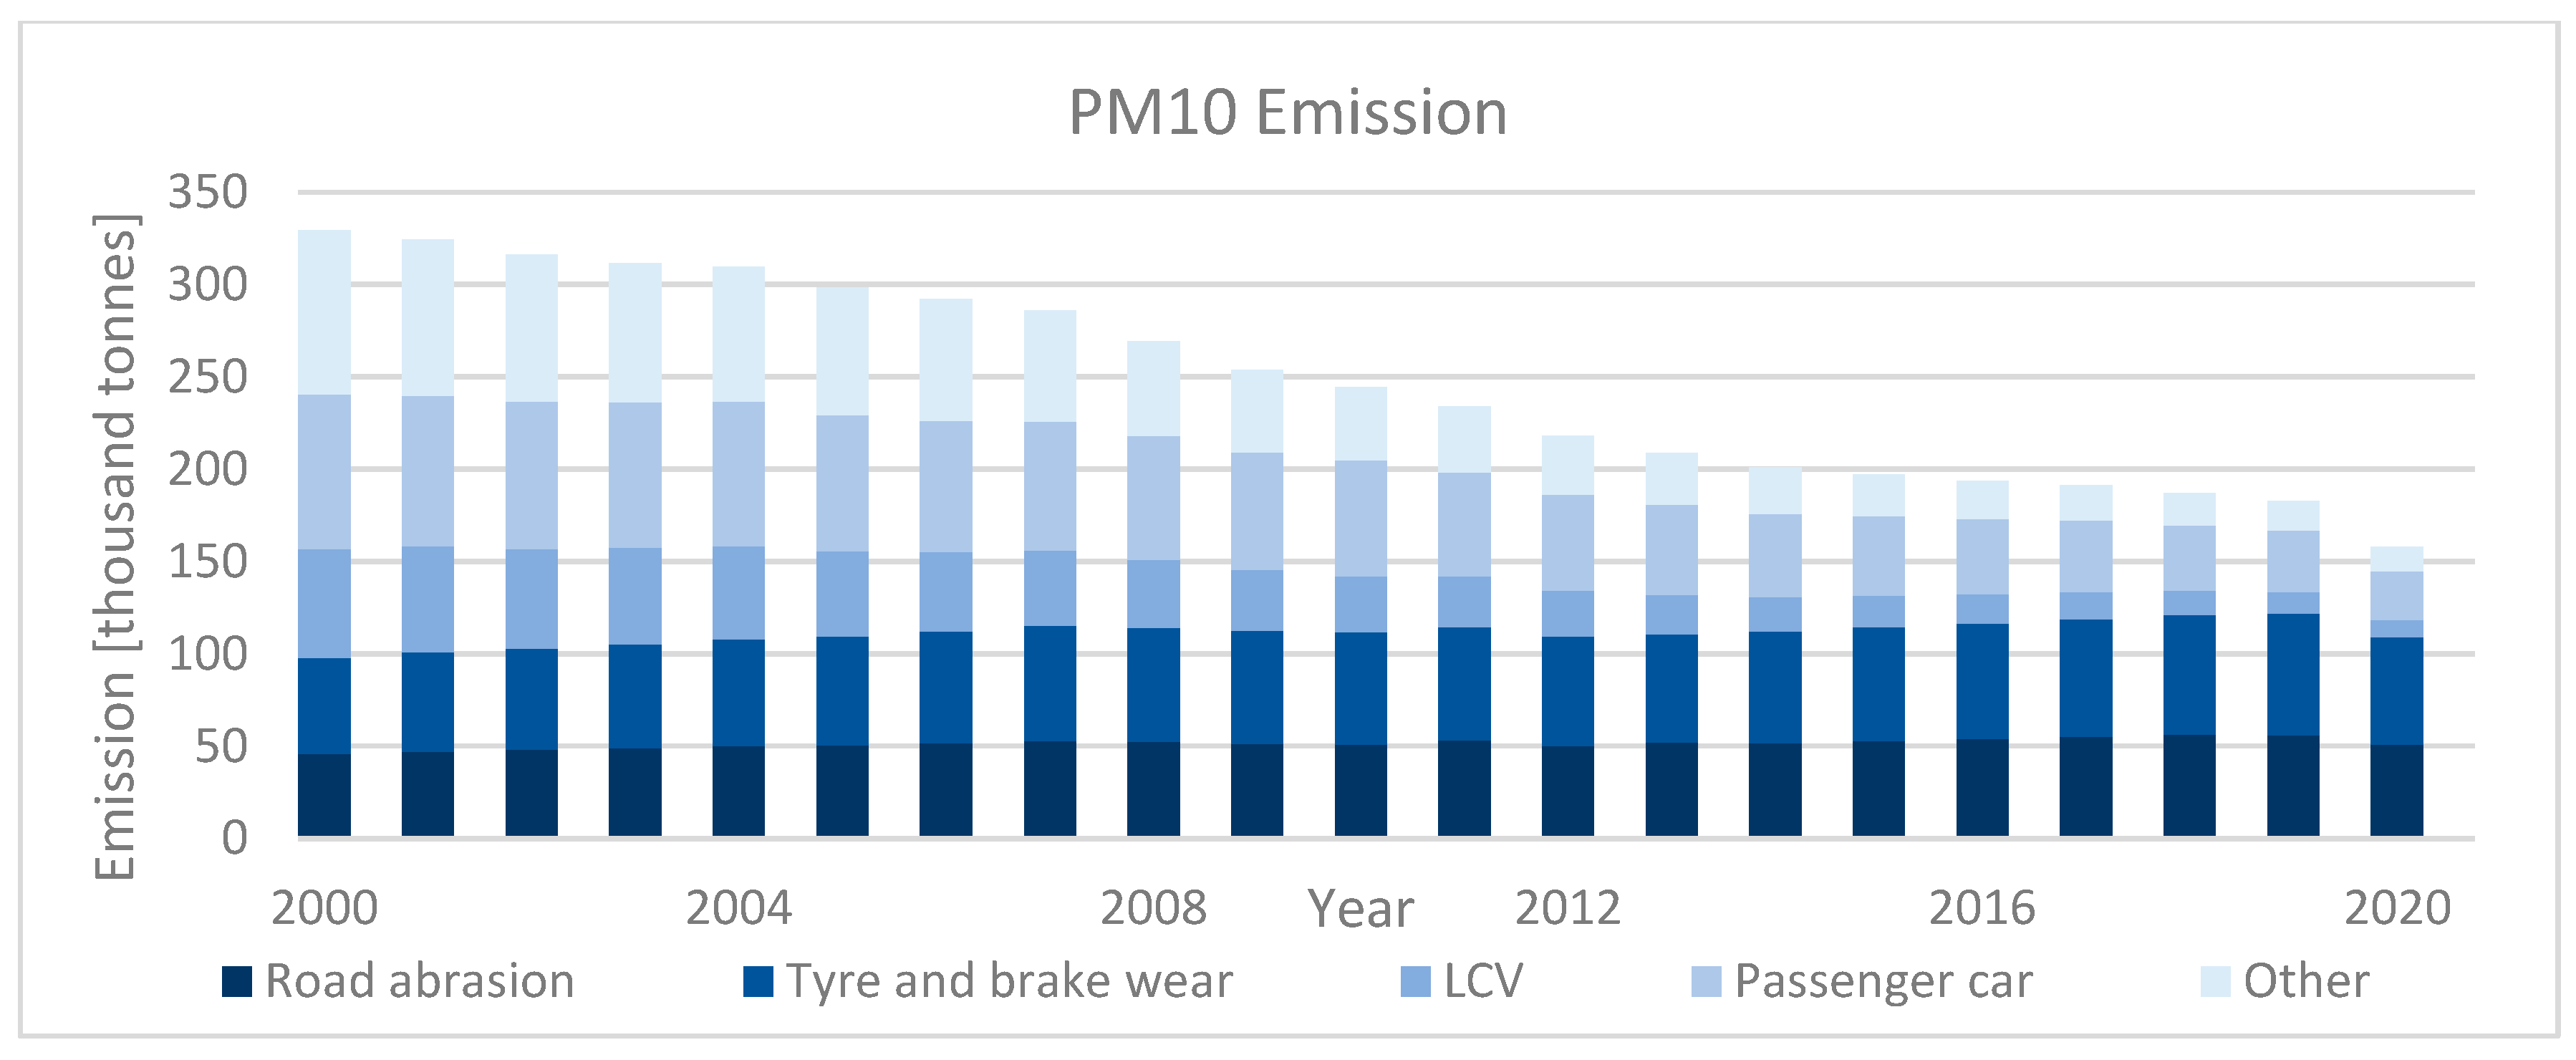
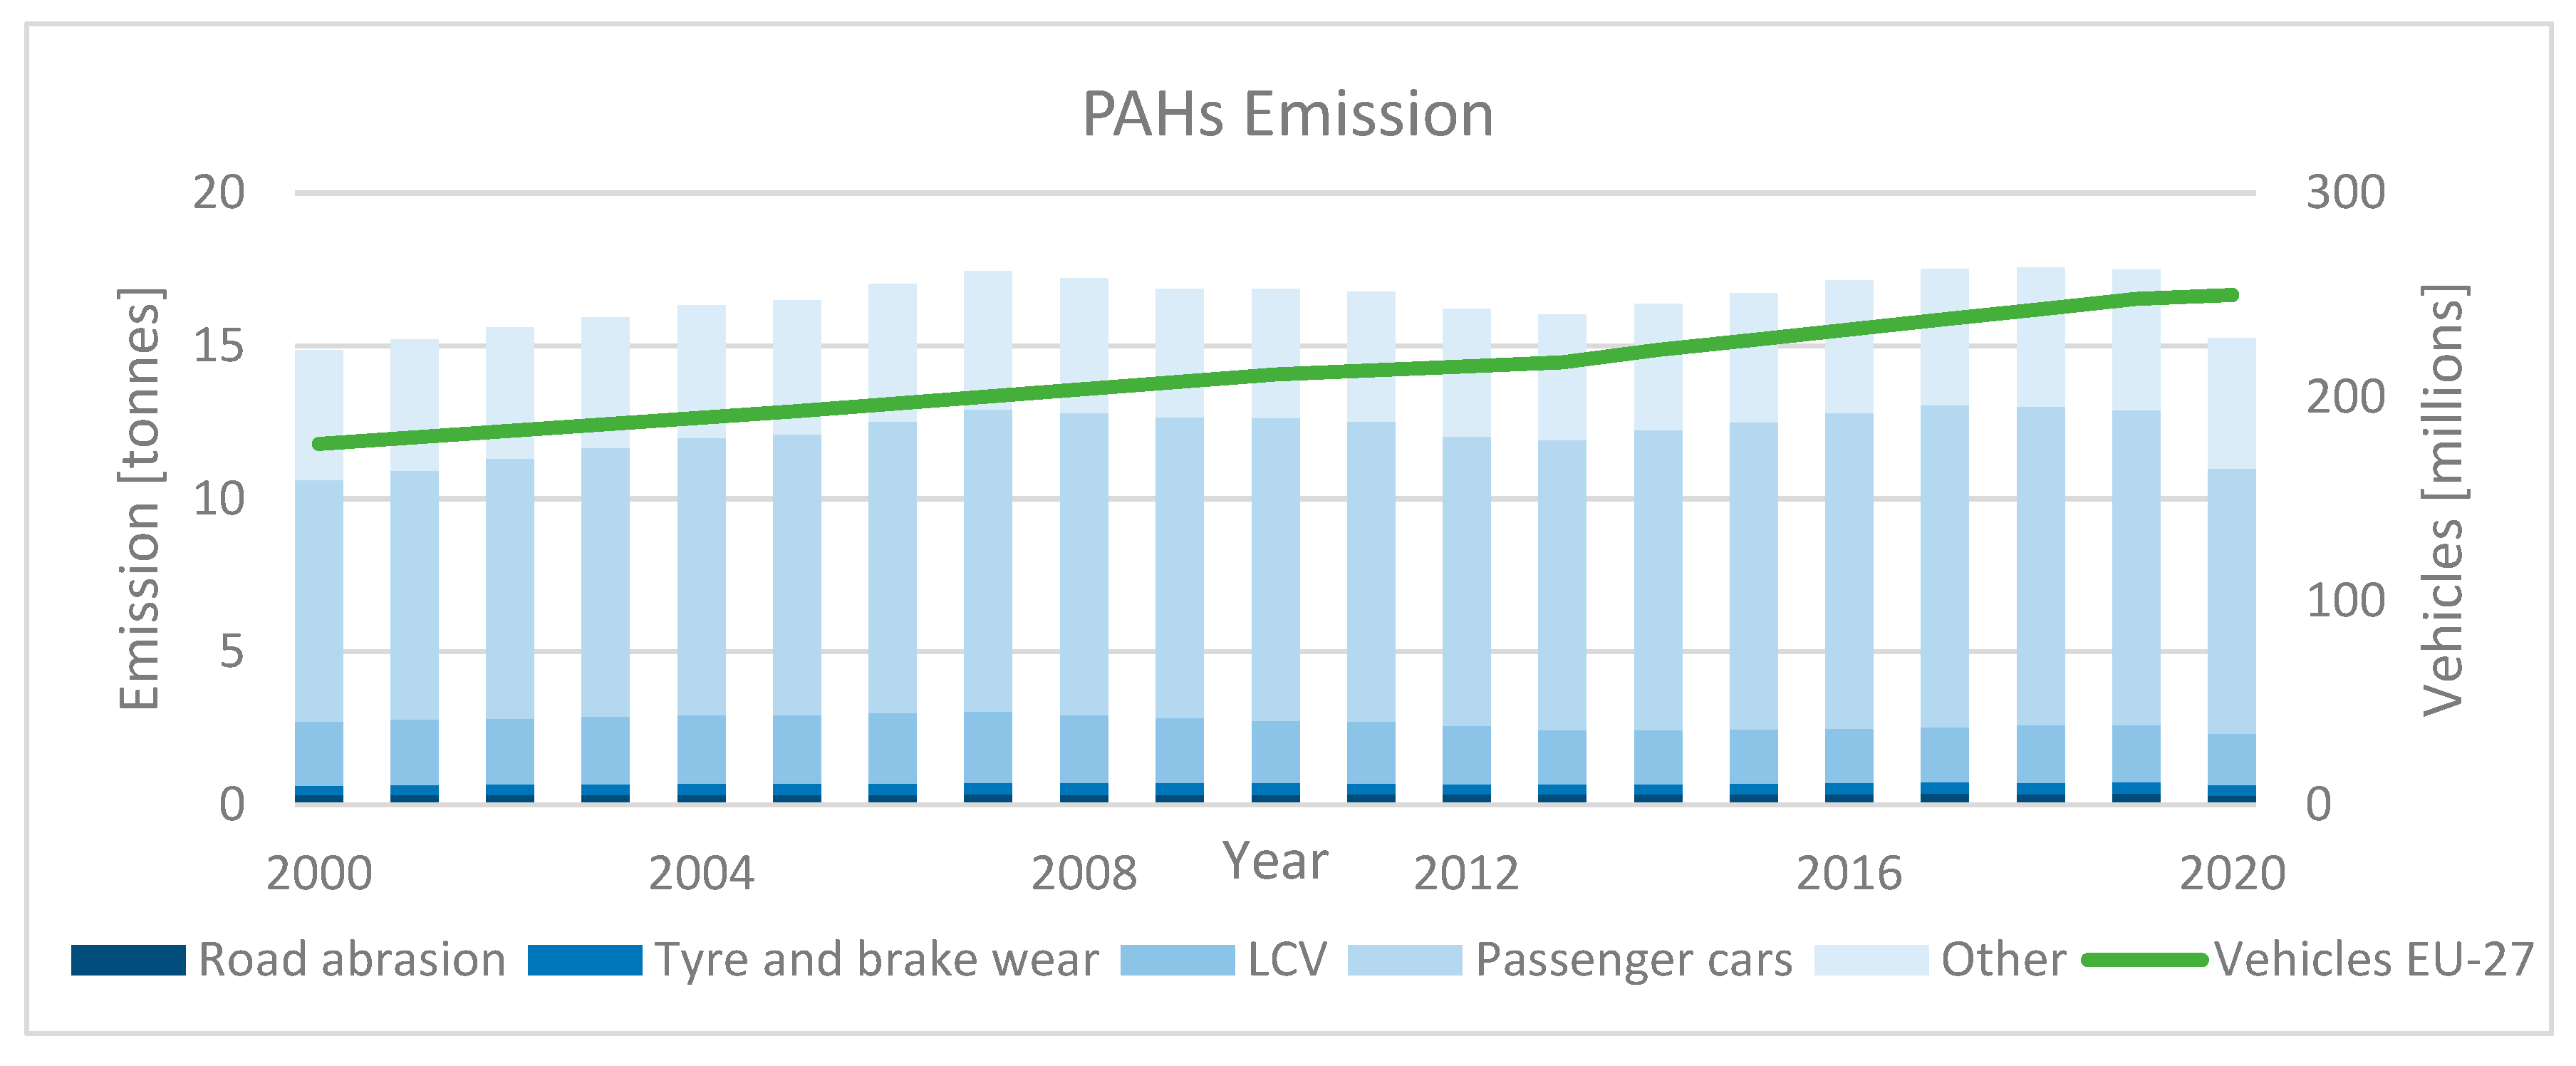
The Geneva Convention on Long-Range Transboundary Air Pollution obliges Member States to annually report the level of emissions of selected pollutants. For road transport, the following categories are distinguished: road abrasion, tire and brake wear, light-commercial vehicles, and passenger cars. Mopeds, motorcycles, heavy-duty vehicles and busses are also included. However, for clarity of data presentation, they were merged into the “other” category. Figure 4, Figure 5, Figure 6 and Figure 7 show the emission levels of selected pollutants since 2000. It should be noted that, due to restrictions on movement during the COVID-19 pandemic, particulate-matter emissions in 2020 have drastically decreased. Figure 4 shows PM10 emissions from road traffic. In general terms, PM emissions in the years 2000–2020 are decreasing every year. This is the effect of tightening emission limits by introducing successive versions of the European Emission Standard. PM10 emissions in light commercial and passenger vehicles have been reduced from 142,000 tonnes per year to about 36,000 tonnes. In the same period, the mass of PM10 particles emitted from road abrasion, tires, and brakes increased from approximately 98,000 tonnes to 109,000 tonnes. The increase in emissions is mainly related to the increase in the number of vehicles on the road and the increase in the average weight of the vehicle. The share of particulate matter from light-commercial vehicles and passenger cars fell from 60% to less than 25% over the period under review. The emission from the other sources also decreased from 88,700 tonnes to 13,200 tonnes.
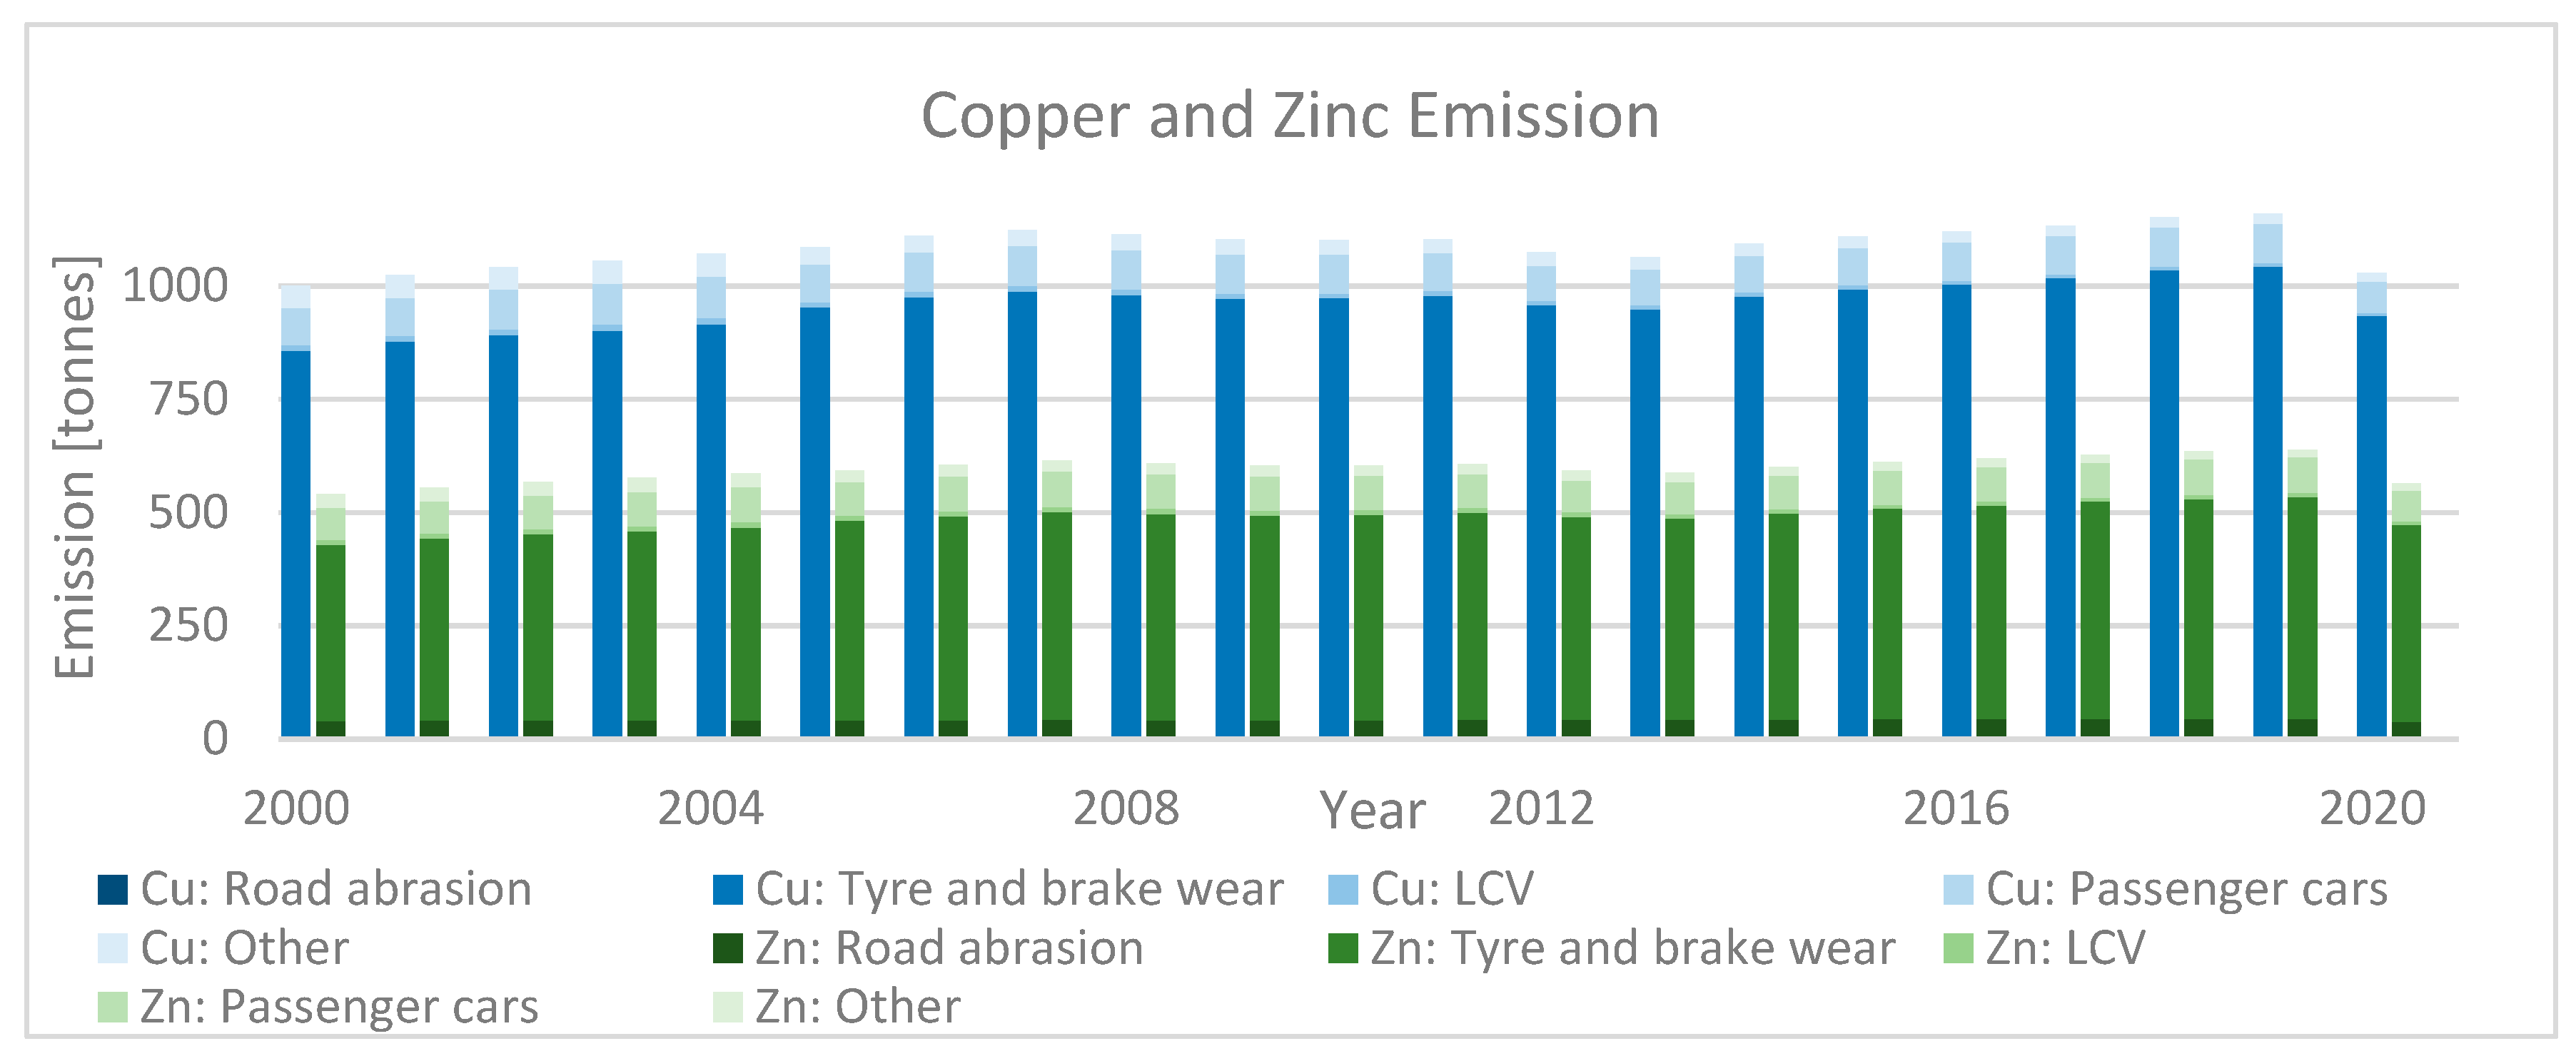
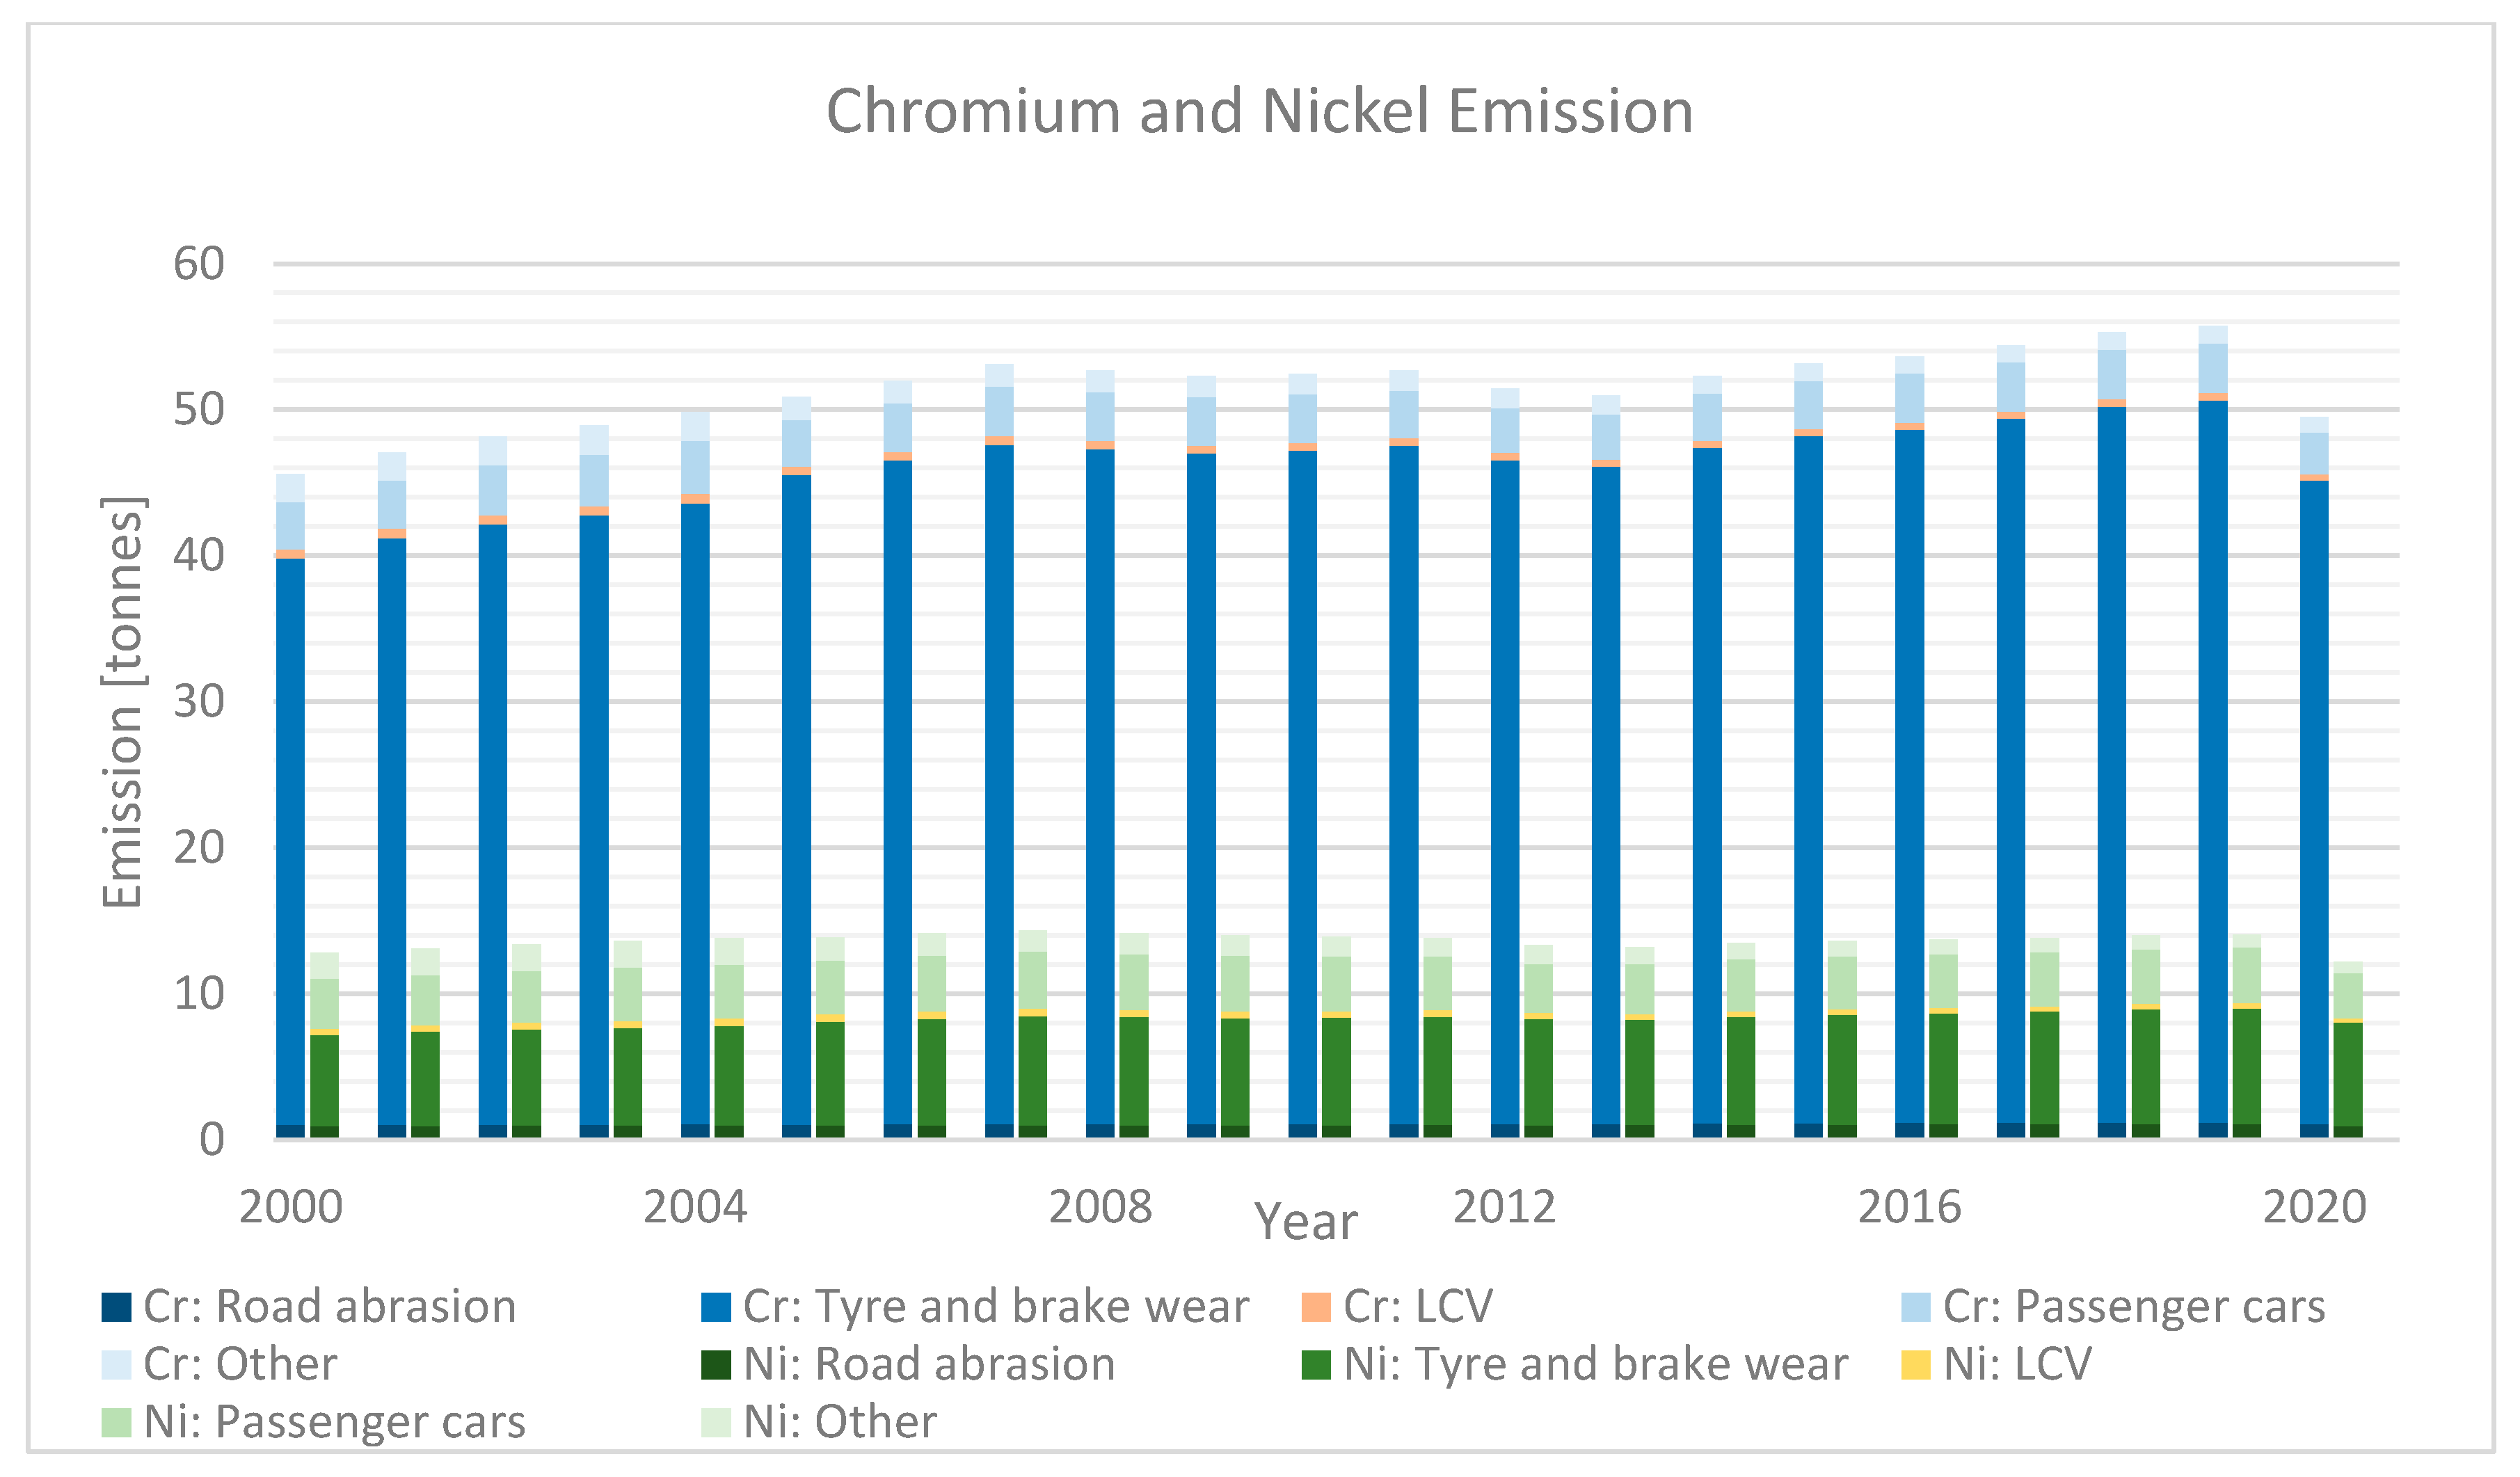
Tire and brake abrasion is also a major source of emissions of metals such as copper, zinc, chromium, and nickel, as shown in Figure 5 and Figure 6.
At its peak, in 2019, copper emissions from tires and brakes amounted to over 1040 tonnes, passenger vehicles emitted over 86 tonnes of this metal and light-commercial vehicles over 8.5 tonnes. The copper emissions from road abrasion amounted to just over 2 tonnes and other groups contributed 21 tonnes, bringing the total emissions to 1159 tonnes. For comparison, in 2000, 1000 tonnes were released into the atmosphere. Zinc emission in this period is lower, but, like Cu, it maintains an upward trend. In 2000, road traffic was responsible for the emission of 510 tonnes, while 20 years later, the weight of metal introduced increased by 112 tonnes. In 2020, compared to the previous year during the COVID-19 pandemic, vehicles emitted 130 tonnes of Cu and 75 tonnes of Zn less.
Chromium and nickel emissions follow a similar trend to the previously discussed metals, with tires and brakes being the main sources. However, due to the lower degree of use of these metals, the scale of emissions is definitely smaller. In 2000, less than 46 tonnes of chromium and 13 tonnes of nickel were emitted, while in the peak period, in 2019, the emissions reached 56 tonnes of Cr and 14 tonnes of Ni, respectively. The year 2020 brought a total decrease in the emission of these metals by eight tonnes.
In contrast to the metals discussed above, i.e., copper, zinc, chromium, and nickel, combustion engines from passenger cars, LDVs, and other vehicles are the dominant sources of polycyclic aromatic hydrocarbon (PAHs) emissions. This is the result of incomplete combustion of fuel and engine oil. Figure 7 also shows that the cumulative change in PAH emissions is not linear. This is caused by several factors affecting the level of emissions. The introduction of subsequent versions of the European Emission Standard affects the reduction of PAHs by individual vehicles. The increase in the number of vehicles on the road itself is a phenomenon that intensifies emissions. In 2000, about 177 million passenger vehicles travelled on the roads of the EU-27 countries; two decades later this number increased to 250 million [3].
In the case of PAHs, from tires, brakes, and abrasion of the road, over the last 20 years, emissions have oscillated between 630–727 kg per year. Light-commercial vehicle emissions at their peak in 2007 were 2.3 tonnes. At the beginning of the period in question, PAH emissions from passenger cars amounted to approximately 7.9 tonnes per year, to reach the highest value in 2017, 10.5 tonnes per year. In 2020, passenger vehicles emitted 8.7 tonnes of PAHs, which is a decrease of 1.6 tonnes compared to the previous year. Other vehicles emitted from 4.2 to 4.5 tonnes of PAHs.
The European Commission’s proposed Euro 7 vehicle emissions standard, expected to gain approval in 2025, introduces significant regulations, notably including initial limitations on brake-generated particulate matter. It is geared toward a 27% reduction in brake emissions, with a maximum of 7 mg/km until 2035, subsequently reduced to 3 mg/km. The emission of microplastics from tires is also a target of the Euro 7 standard, which aims to control the loss of mass of tires during exploitation [41].

2.5. Impact of Nonregulated Emission on Health

As mentioned above, the particulate matter from vehicles with a gasoline engine contains a number of harmful elements and compounds. The literature focus is on the danger of compounds and elements that are part of PM [45,55,56]. For example, Pacura et al. [45] studied the microcontaminants concentration in particulate matter from gasoline light-duty vehicles. Table 3 summarises the analysed groups of pollutants, i.e., organic polycyclic aromatic hydrocarbons and their derivatives, and inorganic impurities, i.e., selected metals and anions. The most common negative effects are shown next to each element. It should be noted that, for many of the ingredients listed in Table 3, in small concentrations, they are neutral for the body (zirconium, bismuth) or even necessary for the functioning of the body. Macroelements such as sodium, calcium, potassium, phosphorus, and chlorine should be consumed in a min. 100 mg per day, while micronutrients such as chromium, cobalt (vitamin B12), manganese, and copper should be consumed in an amount not exceeding 100 mg [57]. Halogens, including chlorine, fluorine, bromine, and iodine, are found primarily in bound forms [58], often manifesting as potent acids or their corresponding salts. This characteristic has significant implications from an environmental protection perspective, posing risks to ecosystems and human health.
In addition to the evident environmental and health advantages, emissions reduction initiatives also exert a substantial influence on the economy. For instance, a study conducted by Levin et al. [73] evaluated the effects of the U.S. Environmental Protection Agency’s revision of the lead and copper limit in drinking water on Americans’ medical expenses. Originally projected as a $335 million investment that resulted in annual savings of $645 million in medical costs, Levin et al. [73] calculated that stricter limits would prevent $9 billion in healthcare spending and an additional $2 billion in water infrastructure-related expenses.

2.6. Micro-Contaminants and Their Classification

Microcontaminants (MCs) are components introduced into the environment as a result of human activity in small, often trace amounts [74]. In the case of vehicle emissions, microcontaminants are present in a much lower concentration (often by several orders of magnitude) compared to regulated components, e.g., hydrocarbons. Despite their low concentrations, MCs pose a serious health risk due to their mutagenic and carcinogenic properties. Therefore, in-depth studies on MCs are necessary. In the literature, microcontaminants present in particulate matter from vehicles with a direct-injection gasoline engine are divided into organic and inorganic groups. The differences in analytical treatment between these groups are presented in Table 4. The main motivation for applying the division presented in Table 4 is the difference in analytical techniques and methods of removing selected pollutants. In the flue-gas system, organic pollutants can be removed using materials with catalytic properties, while in the case of inorganic compounds, they are emitted to the atmosphere or deposited on elements (e.g., GPF) in the form of ash deposits, some of which may subsequently be emitted into the environment [75]. During the literature analysis, it was also recognised that organic pollutants have a greater impact on health and the research environment, so the conduct focused on their removal [45,49,76,77].

3. Vehicle Exhaust

3.1. General Characteristics of Vehicle Exhaust

As previously indicated the vast majority of motor vehicles are powered by CI and SI engines. The most important differences between these engines are the method of combustion of the fuel and the composition of exhaust gases.
In compression-ignition engines powered by diesel, the ignition is triggered automatically. During the movement of the piston in the compression stroke, there is a rapid increase in the temperature of the gas, which is combusted after reaching the autoignition temperature. The process is carried out with an excess of air, which translates into a high oxygen content in the flue gases, ranging from 8 to 15% vol. [78].
In vehicles with a SI engine, the ignition of the air–fuel mixture is forced by a spark from the spark plug. Under stoichiometric conditions (λ = 1), one kilogramme of fuel needs 14.7 kg of air for combustion (approximately 12 m3 of air for 1.3 dm3 of gasoline under standard conditions) [79]. The exhaust gases leaving the drive unit contain a small volume of oxygen, approx. 0.5–1.5% vol. [78].
Table 5 features the literature references selected based on the similarity of compared vehicle groups, including factors such as weight, mileage, and engine power. Notably, Hesterberg et al., 2008 [80] present emission factors derived from a comprehensive review of 25 reports. Park et al., 2019 [81], Ntziachristos and Samaras 2019 [82], Aosaf et al., 2022 [83], and Zhang et al., 2023 [84] compare vehicles meeting the same emission standard. Hakkarainen et al., 2020 [85] compare vehicles tested on a chassis dynamometer, while Šarkan et al., 2022 [86] present a comparison of emissions in real conditions for a vehicle that has been adapted to run on LPG in accordance with applicable regulations.
Owczuk et al., 2018 [87] compared the emissions of carbon monoxide, hydrocarbons, and nitrogen oxides from a vehicle with an SI engine powered by gasoline and CNG. The use of gasoline is associated with a much higher amount of CO in the exhaust gas, reaching 0.12%; in the case of CNG, this value reaches about 0.01%. Hydrocarbon and nitrogen oxides were higher for vehicles powered by compressed natural gas. It was 19 ppm and 1580 ppm, respectively, compared to 6 ppm and 1150 ppm for gasoline-combustion exhaust gases. However, the study conducted by [87] could not be included in Table 5 due to incomparable units of measurement.
Table 5. Exemplary composition of exhaust gases from light passenger vehicles based on selected scientific publications from 2008–2023. The values presented in the table are given with the same accuracy as the source. The lack of a value in the table means that the given component was not analysed. Own elaboration based on the listed sources.
Fuel aCOCO2HCNOx _PM
[g/km][g/km][g/km][g/km][mg/km]
Zhang et al., 2023 [84]
Gasoline0.84270.280.240.04
Gasoline (Hybrid)0.2898.720.0040.0009
Šarkan et al., 2022 [86]
LPG1.90213.970.00430.0513
Gasoline1.93217.690.00400.0311
Asoaf et al., 2022 [83] b,c
Gasoline0.81 0.190.01
CNG0.76 1.790.01
Diesel3.58 0.270.80
Hakkarainen et al., 2020 [85]
CNG 0.2010.48
Gasoline (E10) 0.0311.35
Diesel (B7) 0.4630.64
Ntziachristos and Samaras 2019 [82] d,e
LPG0.62173.88 0.0561.1
CNG0.616171.71 0.0561.1
Gasoline0.62221.83 0.0611.6
Park et al., 2019 [81]
LPG0.82270.5 0.001
Gasoline0.42265.0 0.007
Diesel0.03273.0 0.657
Hesteberg et al., 2008 [80]
CNG0.42 0.590.1810
Diesel0.70 0.120.8180
a The fuel was given according to the source. b The values have been converted assuming a density of gasoline 0.750 kg/L; CNG 0.592 kg/L; diesel 0.84 kg/L. Fuel consumption: for gasoline/diesel: 6.06 L/100 km; CNG 3.64 based on [88]. c NOx values are shown for NO. d Values given for Tier 2 Gasoline Medium Euro 6d; LPG Euro 6 and CNG Euro 4 and later based on tables 3–17 and 3–18 (1.A.3.bi) of the EMEP/EEA report [82]. e CO2 values were estimated from tables 3–12 and 3–15 (1.A.3.bi) of the EPA/EMEP report [82].
Hesterberg et al., 2008 [80] conducted a comparison study of various reports from the USA revealing that CNG-fuelled vehicles emit approximately 40% less carbon monoxide, nearly 78% less NOx, and eight times less particulate matter (PM) than their diesel counterparts. However, they also emit nearly five times more hydrocarbons. Park et al. [81] studied Euro 6-compliant vehicles under the National Institute of Environmental Research (NIER) cycle tests. The study indicates that vehicles with a gasoline engine emit half as much carbon monoxide as their counterparts powered by LPG. Diesel vehicles emit 0.03 gCO/km, which is the lowest value among the analysed vehicles. At the same time, diesel vehicles emit more than 0.65 gNOx/km, which is a higher value compared to LPG/gasoline. The CO2 emissions for all vehicle groups are similar, amounting to about 270 gCO2/km. In the Ntziachristos and Samaras 2019 [82] report for the European Environment Agency, Euro 6 vehicles were tested under the Worldwide Harmonised Light Vehicle Test Procedure. The values of CO and NOx emissions from vehicles powered by LPG, CNG, and gasoline are similar. Vehicles with an SI engine emit about 30% more CO2 and 45% more PM. Hakkarainen et al., 2020 [85] compared the NOx and PM emissions of Euro 6-compliant vehicles powered by CNG and gasoline, tested according to the New European Driving Cycle (NEDC) test procedure. Compressed natural gas vehicles emitted more than six times more nitrogen oxides while emitting almost three times less mass of particulate matter. Aosaf et al., 2022 [83] studied idle emissions from representative vehicles from 2015–2020 in a Bangladesh fleet. This publication shows that diesel-powered vehicles emit the most CO and NOx, respectively 3.58 and 0.80 g/km, while CNG-powered vehicles emit the most hydrocarbons, 1.79 g/km. Vehicles with a gasoline engine emit the least hydrocarbons and NOx. In the study conducted by Šarkan et al., 2022 [86], a Euro 4-compliant spark-ignition (SI) Subaru Impreza was modified to operate on LPG. Emission tests in real driving conditions demonstrated comparable emission levels of carbon monoxide, carbon dioxide, and hydrocarbons when compared to its gasoline counterpart. However, a notable disparity was observed in the emissions of nitrogen oxides (NOx), with the utilization of LPG resulting in an approximate 65% increase in NOx emissions. As for the emissions from China IV-compliant gasoline and hybrid vehicles described in Zhang et al., 2023 [84], there are clear differences in the emission of individual components. The hybrid vehicle emits three times less carbon oxides, while the emission of hydrocarbons is sixty times lower. Vehicles with a gasoline engine emit more than forty times more nitrogen oxides than their hybrid counterparts.
The values presented In Table 5 exhibit notable variations across publications, which can be attributed to various factors, including the distinct fuel compositions employed, diverse emission measurement methodologies, and the inclusion of vehicles with varying weights and performance characteristics. These discrepancies underscore the importance of standardized vehicle-testing procedures in order to ensure the obtainment of comparable and reliable results for accurate emissions evaluation and analysis.

3.2. Microcontaminants Emission from Vehicles

As previously mentioned, the lack of stringent guidelines, such as comprehensive emission standards, results in less uniformity regarding the analysis of compounds and testing methods for nonregulated exhaust substances. Table 6 shows the exemplary literature that studied various microcontaminants that were present in the solid particles from gasoline LDVs.
For example, Oda et al., 1998 [93] conducted a study where they sampled particulate matter scraped from the exhaust pipes of pre-1998 gasoline LDVs. The analysis revealed varying concentrations of analysed polycyclic aromatic hydrocarbons (PAHs), with benzo(ghi)perylene reaching a concentration of 540 µg/gPM. Other abundant PAHs included benzofluoroanthene isomers (b and j), indeno(1,2,3-cd)pyrene, and benzo(e)pyrene, with concentrations of 300, 250, and 210 µg/gPM, respectively.
Riddle et al., 2007 [92] and Jakober et al., 2008 [91] investigated solid particles collected during the Federal Test Procedure (FTP) from 16 gasoline LDVs, including 10 low-emission vehicles (LEV) and 6 cars equipped with three-way catalytic converters (TWC). In Riddle et al.’s study, the highest concentrations were found for phenanthrene, benzo[a]pyrene, and pyrene, reaching 320, 300, and 230 µg/gPM, respectively, for LEVs. For vehicles with TWC, overall emissions were significantly increased. The most abundant groups were isomers of 302 molecular weight, benzofluoroanthene b and k isomers, and benzo[a]pyrene, with concentrations of 1100, 700, and 600 µg/gPM, respectively. Jakober’s study expanded the analysis of these vehicles to include other microcontaminants in both the particle and gas phases, with a specific focus on carbonyls. Comparing LEVs and vehicles with TWC, the latter exhibited higher emissions. Moreover, there were significant differences in the concentration and composition between the gas-phase and solid-phase compounds. Generally, the gas phase had higher concentrations compared to the solid phase. For example, butanal exhibited a concentration of 2000 µg/L in the gas phase compared to 92 µg/L in the solid phase, while acetophenone showed concentrations of 28 µg/L and 13 µg/L in the gas phase and solid phase, respectively. This trend was not linear, and certain compounds were exclusively present in either the gas phase or solid phase, such as propanal (630 µg/L) and 2-butanone (45 µg/L) in the solid phase, and 4-Et-benzaldehyde (190 µg/L) and undecanal (20 µg/L) in the gas phase.
Muñoz et al., 2018 [90] conducted a thorough analysis of seven gasoline LDVs’ emissions according to WLTP, focusing on PAHs and alkyl-PAHs, among other compounds. The expectation was that, with each successive and more stringent emission standard, the emissions of all hydrocarbons, including PAHs and their derivatives, would decrease. However, when comparing vehicles compliant with Euro 3 to Euro 6 Emission Standards, no significant decrease in microcontaminant concentrations was observed. When comparing Euro 3 and Euro 4 vehicles to Euro 6 vehicles, a noticeable decrease was observed across all studied compounds. In contrast, when comparing the most recent standards of Euro 5 and Euro 6, no clear trend emerged, which can be attributed to the absence of significant changes in the regulations governing emissions from gasoline vehicles. For instance, the emissions of phenanthrene and pyrene were lower in Euro 5 vehicles compared to Euro 6 vehicles, while chrysene and fluoranthene emissions were lower in Euro 6 vehicles. In a separate study conducted by Lin et al. [89], examining PAHs concentration from Euro 3 to Euro 6 vehicles tested under the NEDC procedure, a consistent decrease in PAHs concentration was observed with each successive emission standard. This decrease was attributed to stricter regulations on PM and PN. It is important to note that the differences in testing procedures between these two studies could have a significant impact on the final results. The variations in testing procedures are further discussed later in this article.
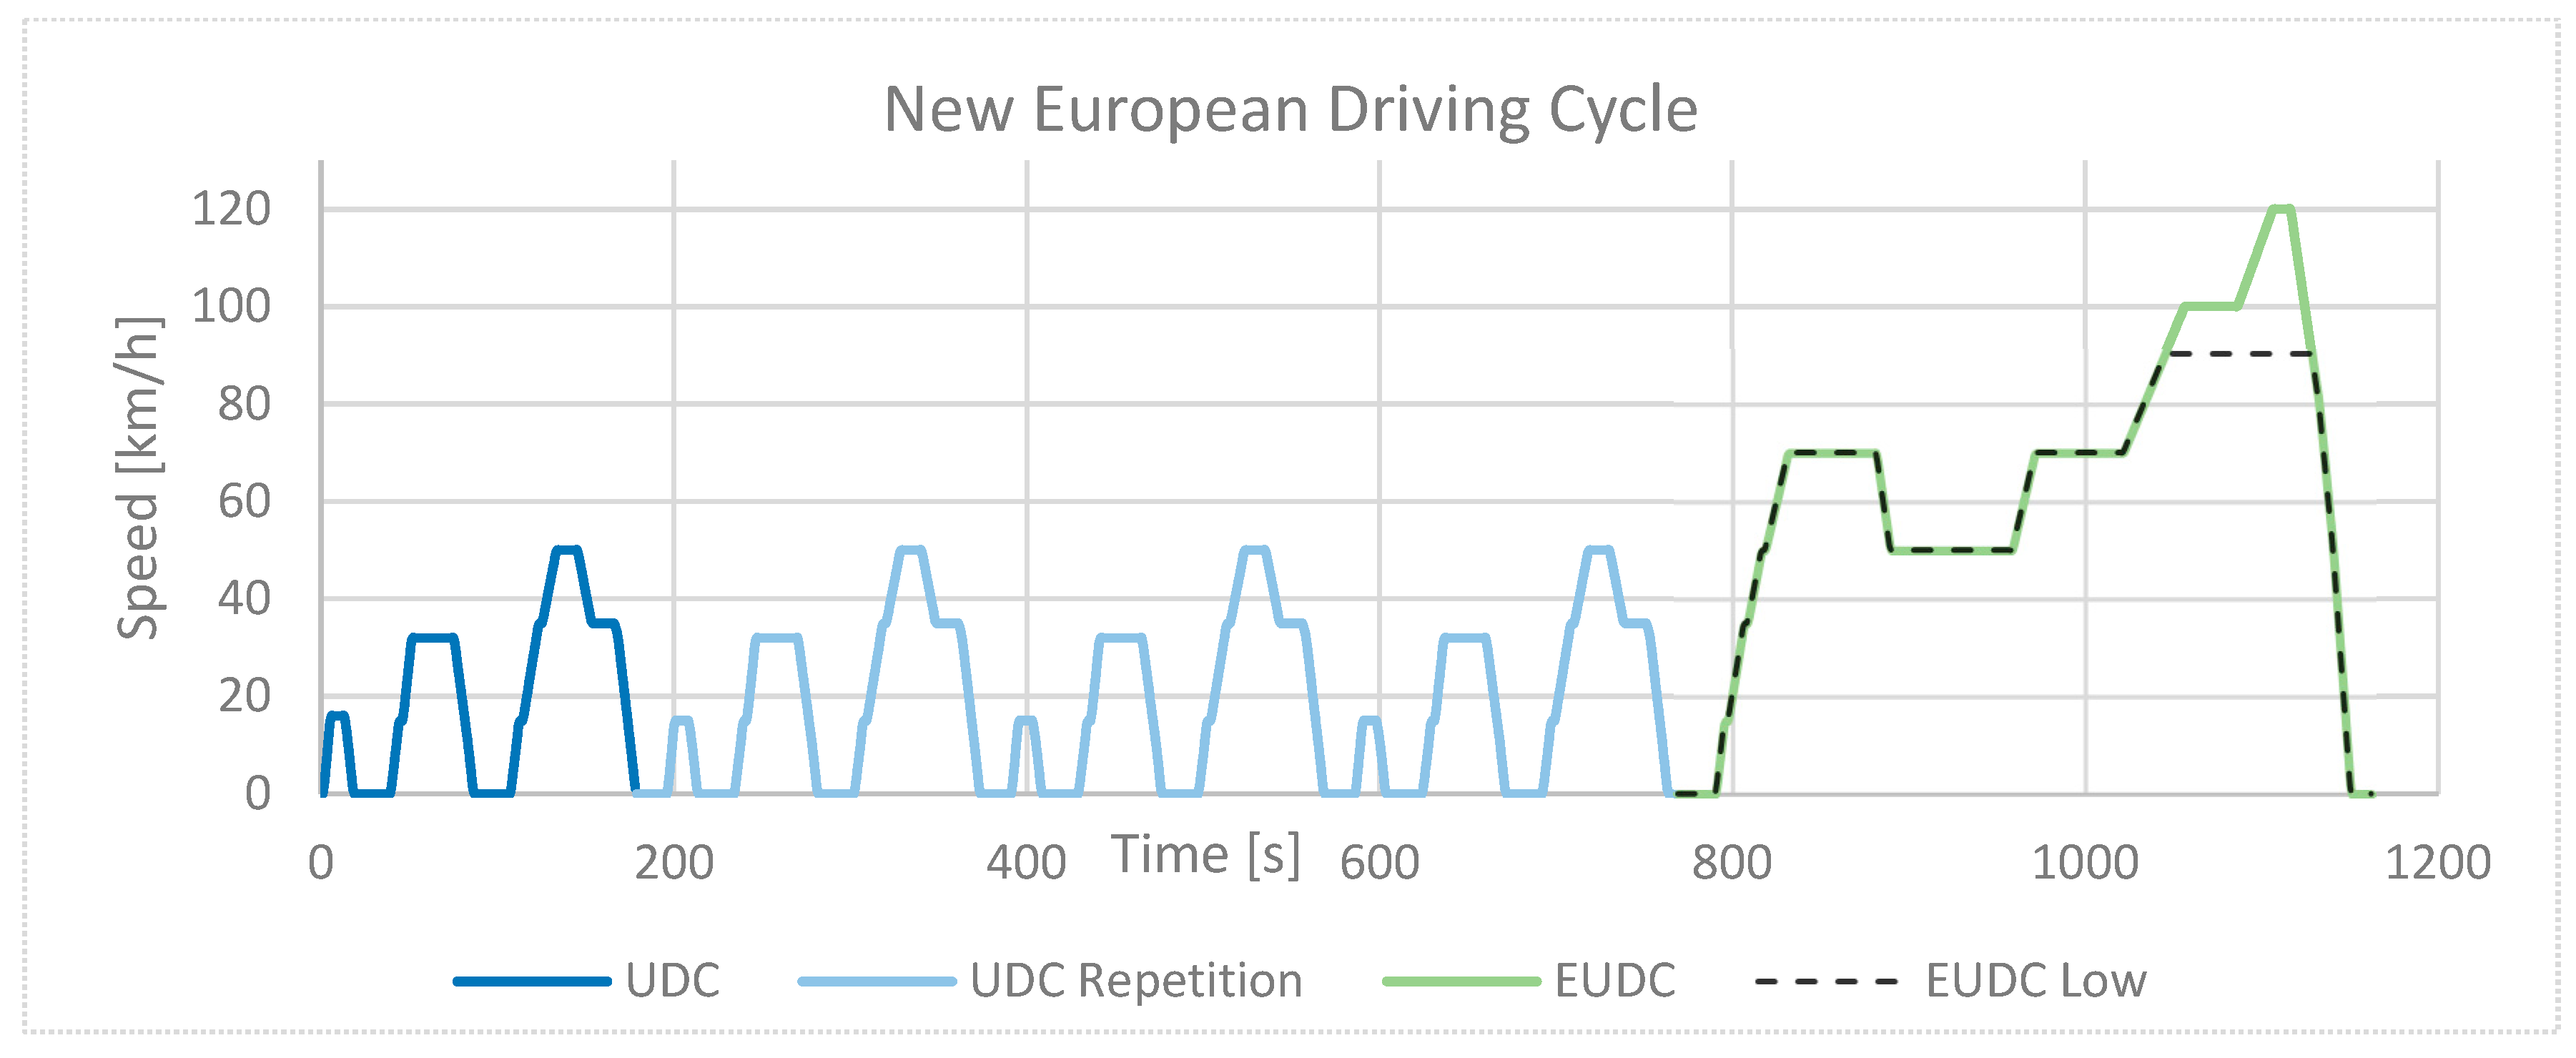
Zhao et al., 2020 [47] conducted a comparison of emissions of PAHs and nitro-PAHs from vehicles complying with China 1 to China 5 emission standards, tested using the urban driving cycle (UDC). The vehicles were further categorized based on mileage, with separate groups for vehicles under and over 100,000 km. Overall, it was observed that emissions of microcontaminants decreased with each successive emission standard. On average, China 1-compliant vehicles emitted 4500 µg/km of PAHs and 13 µg/km of nitro-PAHs, while vehicles meeting the China 5 emission standard emitted 3000 µg/km and 8 µg/km of PAHs and nitro-PAHs, respectively. Vehicles with higher mileage exhibited higher microcontaminant emissions due to the deterioration of exhaust aftertreatment systems. For instance, in the case of China 5 vehicles, the average PAH emission increased by 500 µg/km between vehicles with mileage under and over 100,000 km. It is noteworthy that the China 6a Emission Standard was introduced in 2021, representing a substantial advancement from its predecessor. This standard has significantly tightened restrictions on pollutant levels, specifically targeting reductions in emissions of NOx and PM emitted by vehicles. Building upon this progress, China 6b was implemented in 2023, further elevating the benchmarks by imposing even more stringent limits. China 6b sets ambitious targets, including a 50% reduction for hydrocarbons, a 40% reduction for NOx, and a 33% reduction for PM compared to Euro 6 levels [94].
Pacura et al., 2022a [45] studied various microcontaminants emissions from Euro 6b and 6d-TEMP compliant vehicles under WLTP. The overall PAH emission varies from 4.0–12.8 µg/km; the highest emissions were from Euro 6b vehicles. The overall emissions of PAHs ranged from 4.0 to 12.8 µg/km, with the highest emissions observed in Euro 6b vehicles. Interestingly, there were no significant impacts of engine displacement, vehicle mass, PM emissions, and type of gearbox on PAH emissions.
In three sources mentioned above [45,47,90] an additional parameter, PAHs–toxic equivalency factor (TEQ), was investigated. TEQ serves as an indicator of the overall toxicity of a mixture of various compounds [95,96]. It was observed that, with each successive emission standard, the TEQ values decreased. However, it is important to note that the toxicity of particulate matter (PM) is not solely determined by the emitted particulate mass. Vehicles with low PM emissions may still exhibit high TEQ values due to the presence of highly toxic compounds on their surfaces.
The literature clearly demonstrates that microcontaminants are present in the exhaust emissions of vehicles, posing significant negative impacts on human health and the environment. However, due to the lack of standardized worldwide procedures, it is challenging to directly compare research findings on microcontaminants as accurately as in the case of regulated emissions. Differences in sampling and extraction procedures, as well as variations in the range of tested compounds, contribute to this challenge.
It is worth noting that while efforts to reduce regulated emissions have been successful, there is a possibility of an unintended consequence: an increase in microcontaminants in the exhaust stream. This phenomenon is further discussed in detail in this article.

3.3. Comparison of Exhaust-Gas Treatment Systems

Depending on the fuel used and the construction of the engine, combustion products may have different compositions and physicochemical properties. These features can be controlled at every stage of the combustion process, i.e., before, during, and after combustion [97].
Precombustion activities focus on improving the physicochemical properties of the given components, i.e., fuel and engine oil, in order to adapt them to applicable legal regulations and to improve engine operation. Examples include the removal and limited use of additives [98,99]. At the same time, the composition of gasoline and diesel fuel can be modified based on the emission indices described in the Section 4.3 to reduce PM emissions.
Phenomena occurring during combustion affecting the emission of, e.g., hydrocarbons and the possibility of their control are described in the Section 4.
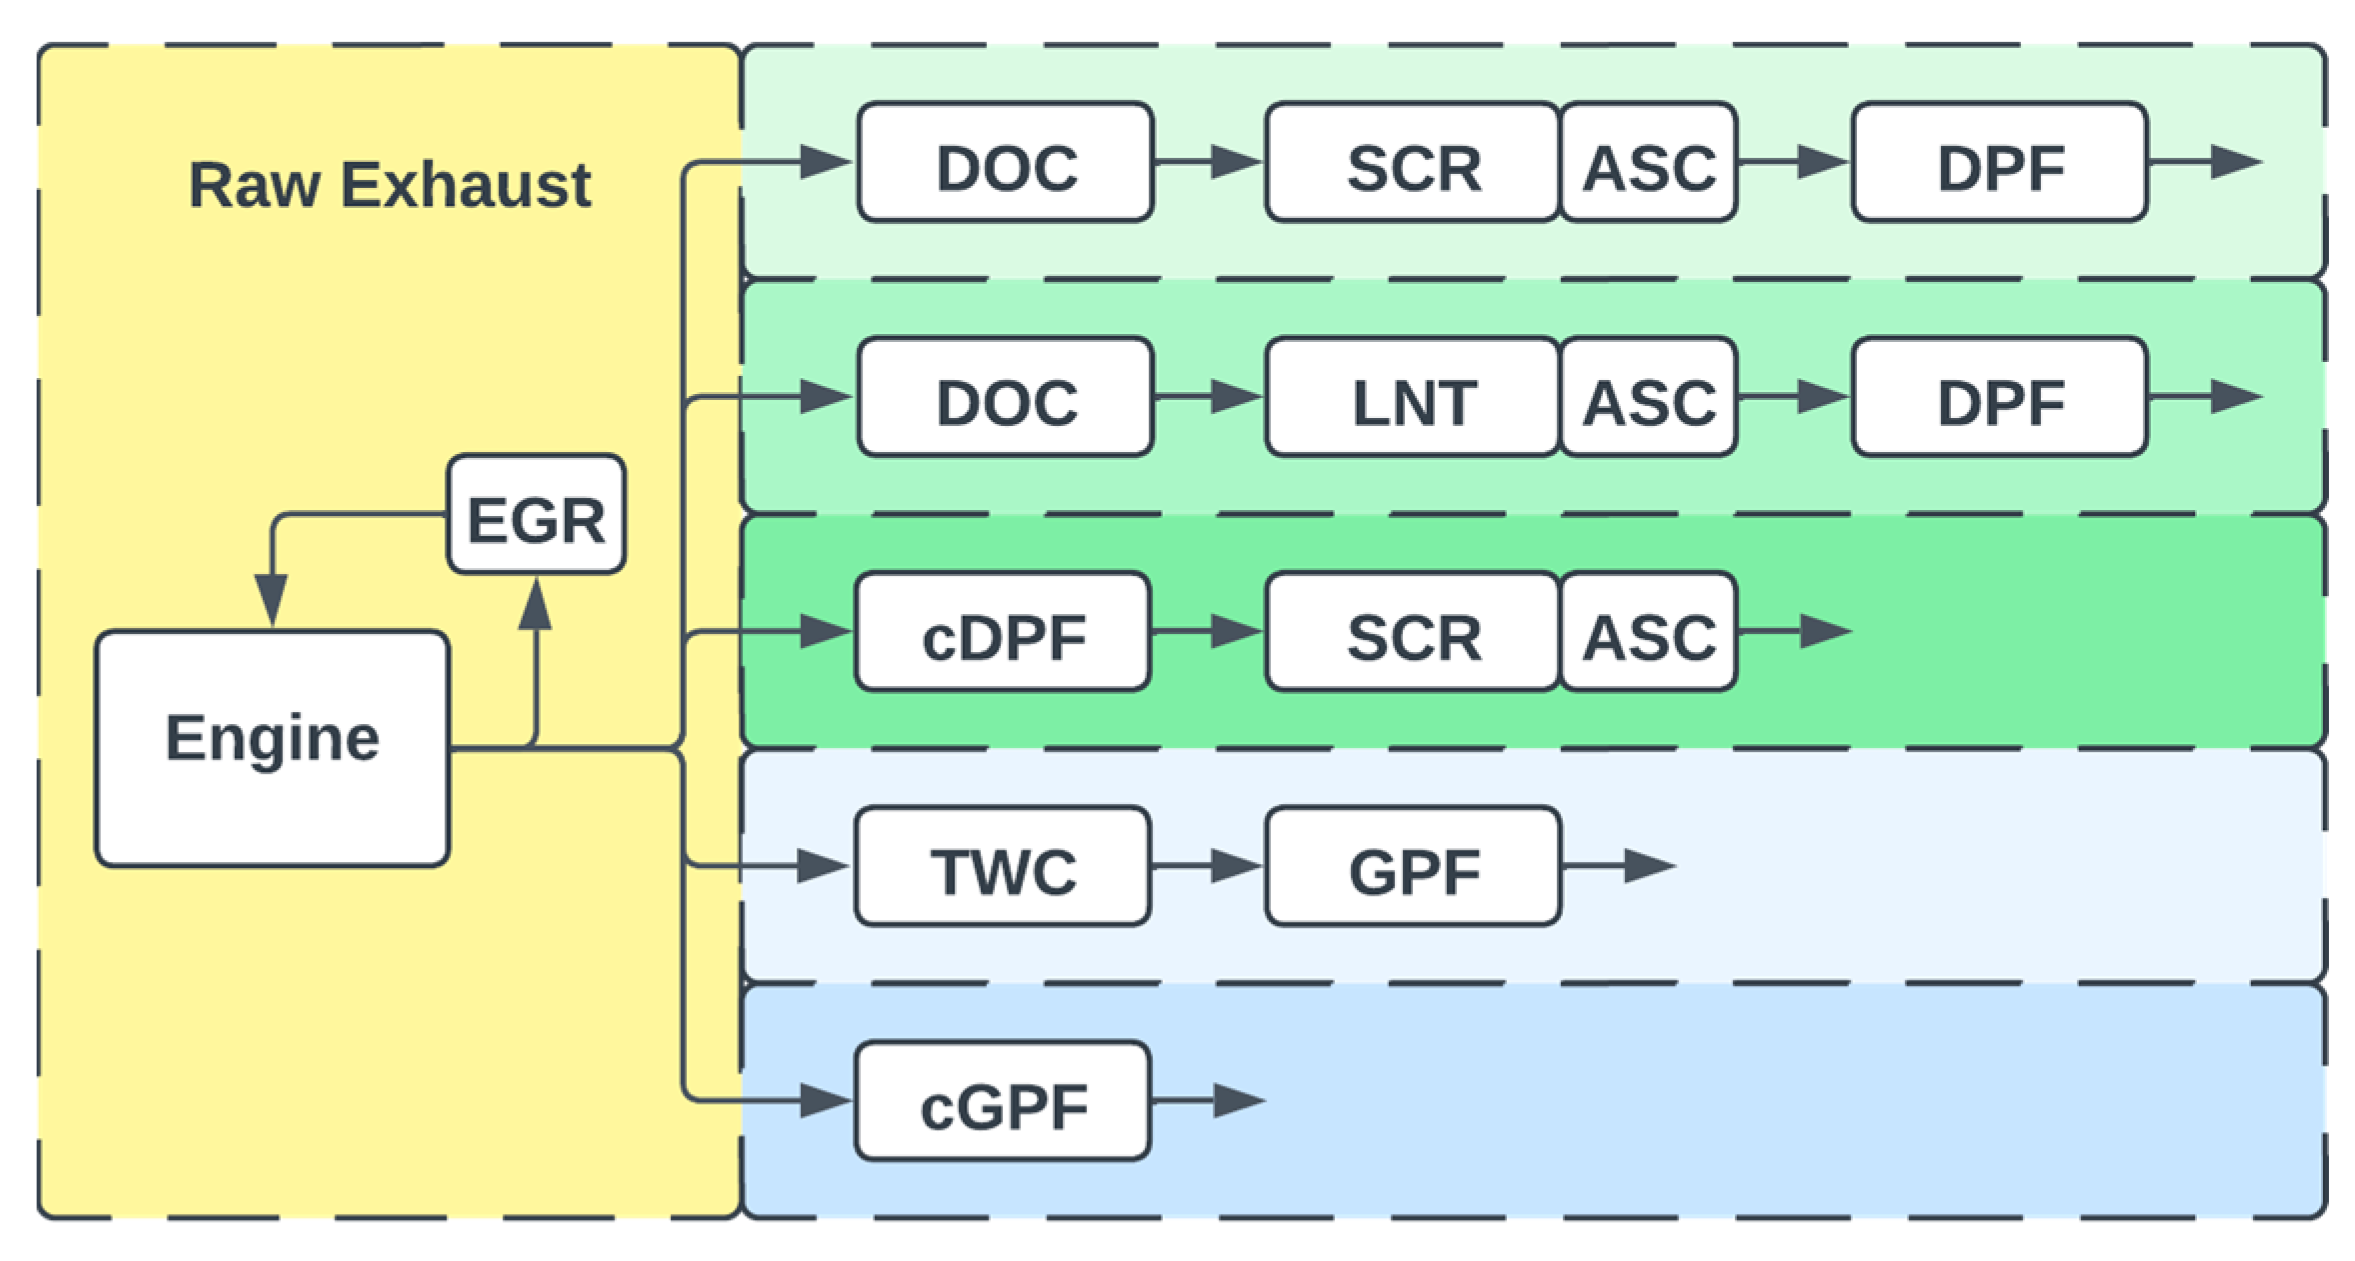
Raw exhaust gases, i.e., leaving the engine exhaust manifold, are subjected to further treatment before leaving the exhaust system. Postcombustion solutions vary depending on the fuel used. In general terms, exhaust aftertreatment systems remove carbon monoxide, hydrocarbons, nitrogen oxides, and particulate matter. Example solutions are shown in Figure 8.
Exhaust-gas recirculation (EGR) used in SI and CI engines redirects part of the exhaust-gas stream back to the combustion chamber [78]. The literature indicates that recirculation leads to a reduction in exhaust-gas temperature and a lowering the oxygen concentration. This phenomenon is beneficial for NOx control, and to some degree leads to the reduction of solid particles in the exhaust stream. However, a high EGR rate can lead to forming a rich mixture in the cylinders, leading to the intensification of PM and PN emissions [100].
For diesel engines, a diesel oxidation catalytic converter (DOC) is used after the EGR system. The role of DOC is to oxidise carbon monoxide, hydrocarbons, and burn soot [78]. Relatively high oxygen content in flue gases facilitates these processes and, at the same time, requires the use of different nitrogen oxide reduction systems. The most popular solutions are selective catalytic reduction (SCR) and a lean nitrogen trap (LNT).
In the SCR process, an aqueous solution of urea is injected into the flue-gas stream, which is decomposed into carbon dioxide and ammonia. Ammonia reacts with nitrogen oxides to form molecular nitrogen and water vapour [101]. The use of catalytic reduction may be associated with the emission of ammonia into the atmosphere, which is why LNT is often used after SCR to selectively remove ammonia from exhaust gas [102].
The trap (adsorber) consists of metals responsible for the reduction of nitrogen oxides (Pt, Pd, Rh), a compound responsible for storing NOx (e.g., barium oxide) and a carrier with a large specific surface [103]. During the combustion of the lean mixture, nitrogen oxide is oxidized in the flue-gas stream to NO2, which is adsorbed on the surface of the trap. The regeneration process consists of the combustion of a rich mixture in the engine, which leads to the formation of reducing compounds, i.e., carbon monoxide and hydrocarbons, which allow the reduction of NOx with the use of platinum-group metals into molecular nitrogen, carbon dioxide, and water vapour [104,105]. The advantage of traps is the possibility of using them in small vehicles; they do not require an additional urea tank, as is the case with SCR. In general, these traps show a lower degree of NOx reduction and are susceptible to sulphur poisoning.
In vehicles with an SI engine, raw exhaust gases contain much less oxygen, which makes it possible to use a three-way catalytic converter (TWC). The TWC is made of a ceramic or metal body with alternately closed channels through which the flue gases flow. The surface is covered with metals with catalytic properties, i.e., palladium, platinum, and rhodium. Pd and Pt are responsible for the oxidation of carbon monoxide and hydrocarbons to water vapour and carbon dioxide, and Rh is responsible for the reduction of nitrogen oxides [106,107]. The typical TWC contains 1.9 g of platinum-group metals (PGMs), such as platinum, palladium, and rhodium [108]. Considering the number of vehicles equipped with oxidation catalysts, this mass translates to the demand for tons of PGMs each year to support the ongoing production of vehicles that comply with existing emission standards.
All the systems listed above have an optimal operating temperature, after which the removal of harmful exhaust-gas components proceeds with a sufficiently high efficiency. Exhaust-gas treatment systems are heated by the exhaust-gas stream, which, depending on the engine load, has an operating temperature of 180–500 °C [101,109]. Oxidation of carbon monoxide and hydrocarbons in the DOC catalytic reactor proceeds effectively at a temperature of 250–300 °C [110]. In the case of nitrogen oxides, the literature indicates the optimal operating temperature of SCR and LNT in the range from 250–300 °C to 450–500 °C [101,111]. However, a 90% reduction of NOx can already occur at 200 °C [112]. Three-way catalytic reactors achieve the desired degree of conversion at about 300 °C [113]. In order to avoid or shorten the cold-start effect, the above-mentioned systems can be equipped with additional heating systems.
Solid particles are reduced by using metal or ceramic filters. DPF and GPF, similarly to the previously described TWC, have alternately closed channels, forcing the flow of exhaust gases through a porous structure, e.g., cordierite, or channels through which exhaust gases can flow without additional resistance [101,114,115]. The main mechanisms for the removal are diffusion and interception [116,117]. In the first one, which removes the smallest particles, Brownian motion causes the particles to move towards the walls of the filter. Interception occurs when the particle comes into contact with the filter wall. The other mechanisms are the sieve effect and the inertial impact of the particles on the filter surface. As the filter operates, the degree of particle removal increases. This is due to the deposition of particles and the narrowing of the channels, which intensifies the sieve effect. Blockage of the channels by particles causes an increase in back pressure in the exhaust system [118,119,120]. In order to reduce the pressure, the filters are regenerated in a passive and active way [101,121].
Passive DPF regeneration does not require additional energy sources. It consists of the fact that the accumulated particles, mainly soot, are oxidized in the presence of NO2 at a temperature of 250–400 °C. Active regeneration consists of increasing the temperature of the filter to about 550–600 °C. This is achieved, e.g., by enriching the fuel mixture, which leads to less oxygen, longer combustion times, and higher temperatures. Alternatively, the filter can be equipped with an electric or microwave heating system [101,105].
Passive regeneration of filters in vehicles with an SI engine takes place at a higher temperature, around 600 °C, due to the lower concentration of NOx in exhaust gases [122,123]. The oxygen required for the removal of organic compounds is supplied during fuel-supply cutoff, leading to an oxygen concentration of up to 20% vol. [124]. The course of active regeneration of the filter depends, among others, on its construction. In the case of cerium-coated filters that can store oxygen on their surface, complete removal of organic material is achieved at a temperature of 550–570 °C [125,126]. Uncoated filters require a higher temperature, up to 650 °C. The increase in temperature is achieved, as in the case of DPF, by controlling the combustion process. Delaying the ignition timing and enriching the fuel–air mixture can increase the exhaust-gas temperature from 50 to 200 °C [122,123].
Solid particles, in addition to the organic fraction, also contain a number of compounds and elements such as potassium, zinc, iron, CaSO4, and MgSO4. Their removal is impossible with thermal methods during the use of the vehicle. After each stage of burning, a thin layer of ash is deposited on the surface of the filter, which increases the back pressure and clogs the porous structure [119,122,127].
DOC + DPF and TWC + GPF can be replaced by a single catalytic diesel particulate filter. The surface of the DPF or GPF is covered with platinum-group metals, which perform the same function as in catalytic systems. In the literature, such filters are called three-way and four-way filters, respectively [128,129].
As mentioned before, exhaust aftertreatment systems have to work effectively for at least 5 years or 160,000 km. This means that each system has to be designed in a way, to prevent early deterioration by means of thermal and chemical deactivation and mechanical degradation [97,130].

4. Factors Affecting Emissions from Vehicles with Gasoline Engines

4.1. Downsizing and Rightsizing

The selection of an SI engine is a critical consideration during the vehicle design phase to ensure compliance with existing or upcoming emission standards. As the power required from the engine is influenced by factors such as the vehicle’s gross weight, acceleration capabilities, and maximum performance. Furthermore, the design of the exhaust-gas treatment system, including the utilization of specific platinum-group metals, the size of TWC, and the size of GPF, is contingent upon the volume and composition of the exhaust gases emitted by the engine. These design decisions directly impact the overall effectiveness of emission control measures.
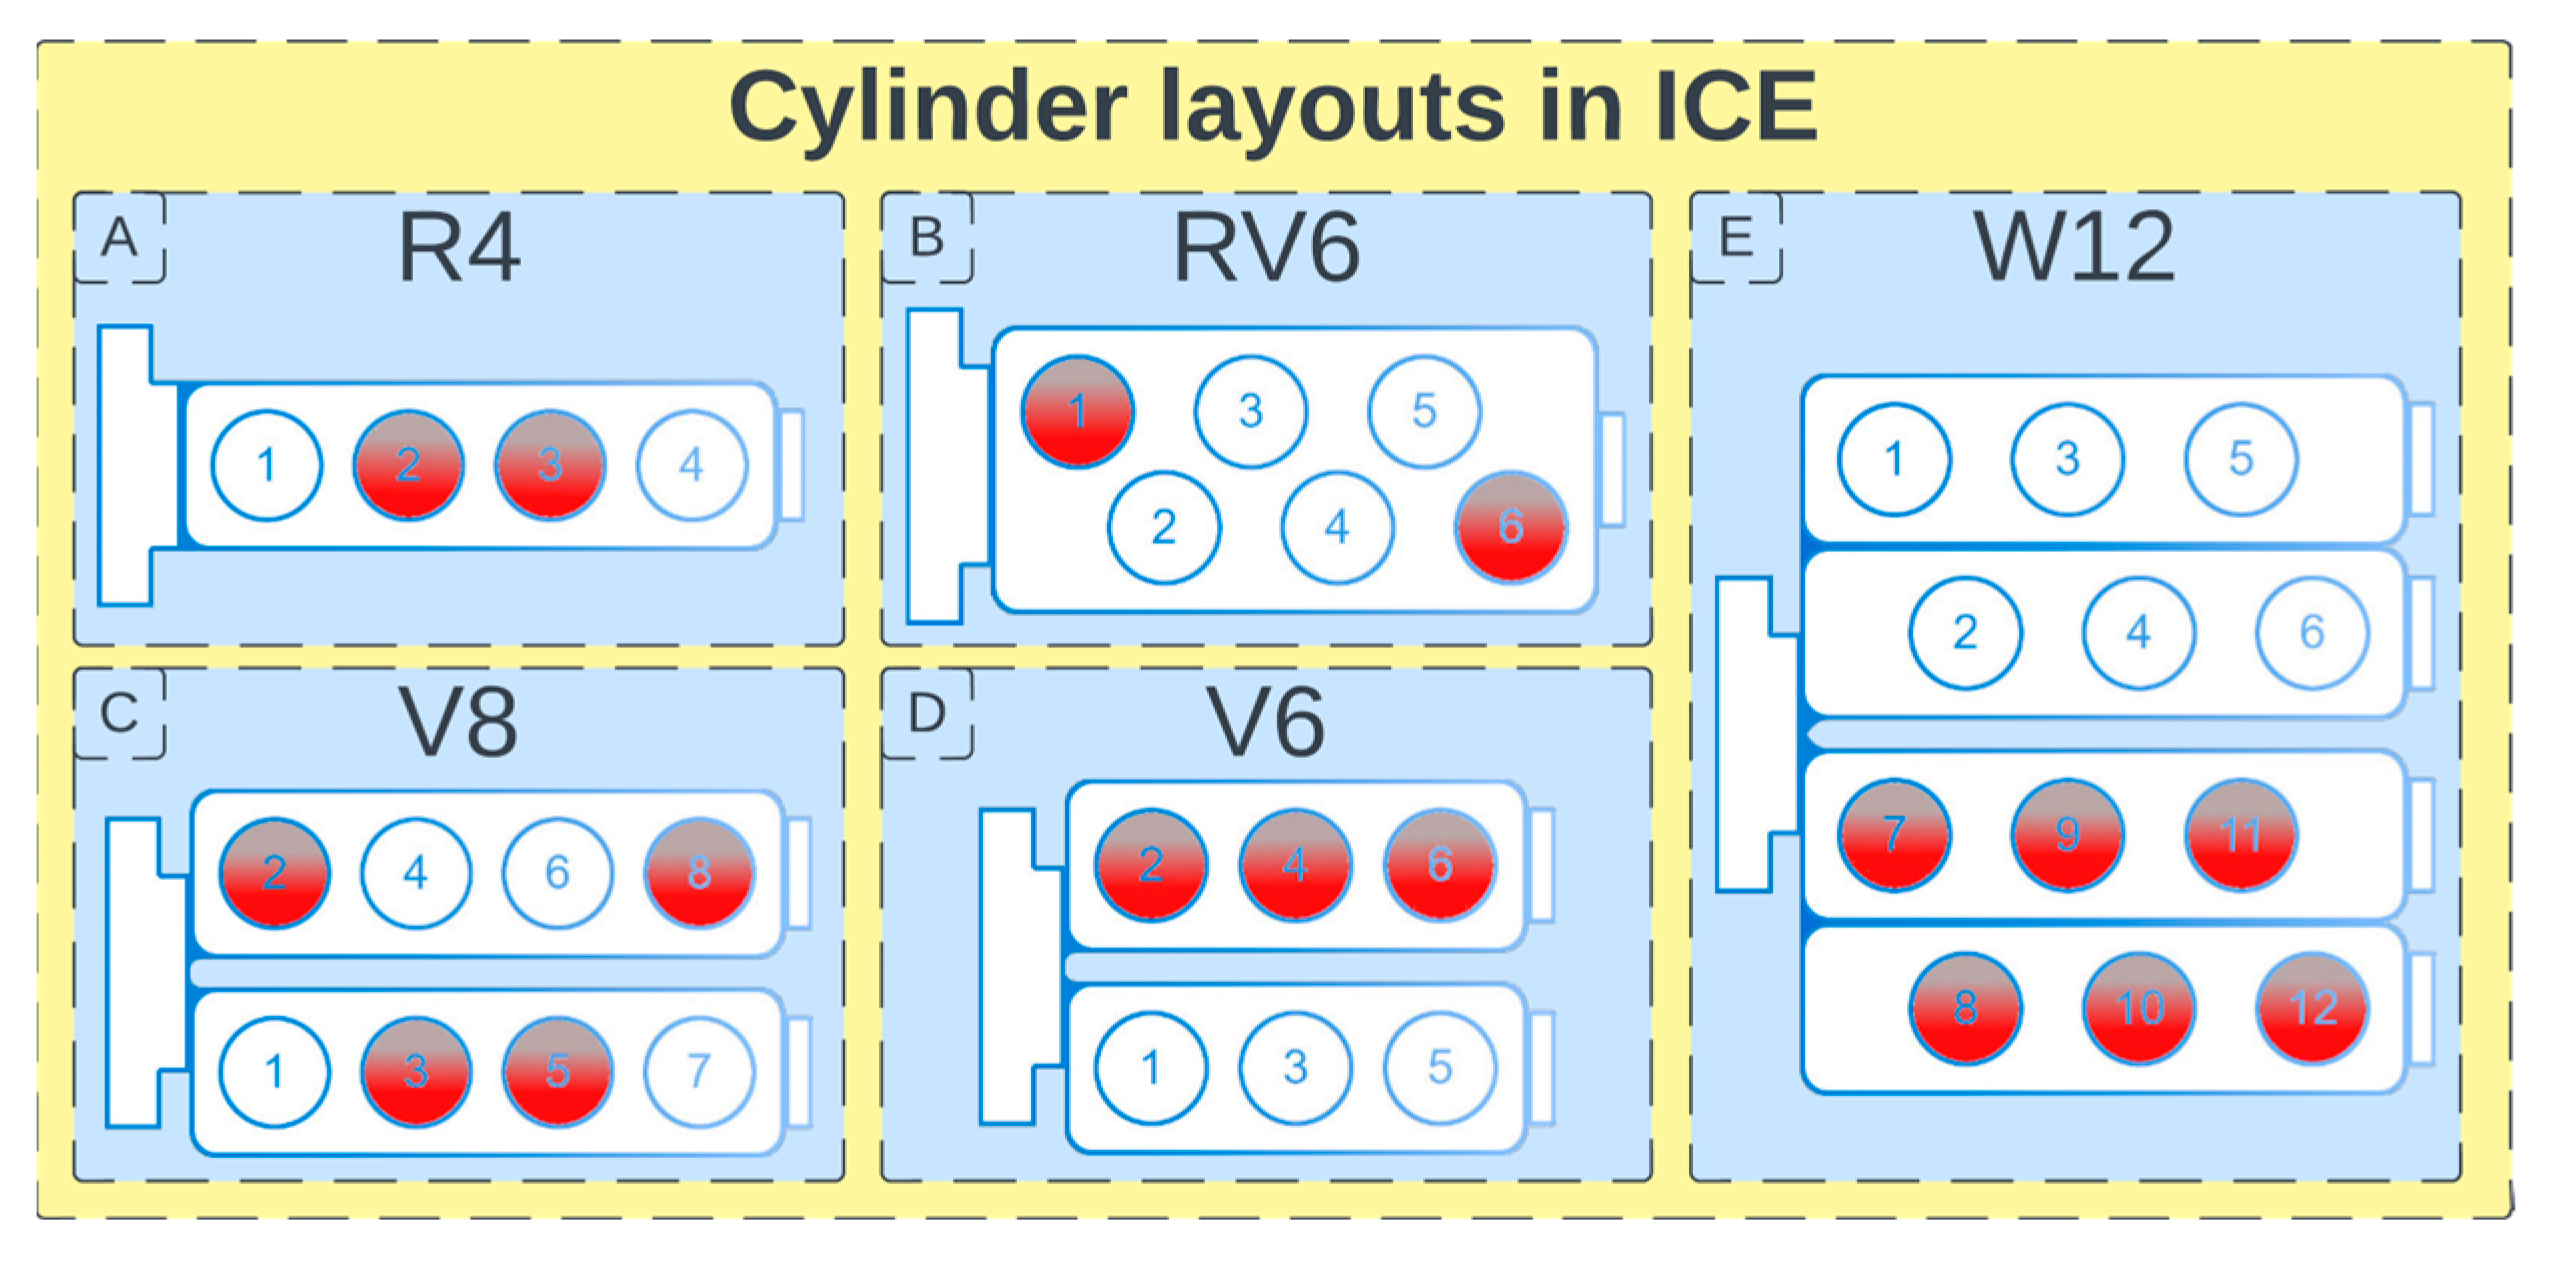
In engine design, there are two main trends in research and development: downsizing and rightsizing [131,132]. Downsizing is a process of reducing engine displacement while maintaining its parameters, i.e., specific power and torque [133,134]. There are two types of this technique, i.e., dynamic and static. The first consists of deactivating individual cylinders by turning off fuel injection and ignition and closing the intake and exhaust valves. Switching off is carried out in a way that ensures the balance of forces related to the movement of the piston and the combustion process itself. In Figure 9, a graphical diagram is provided, showing the cylinders that are shut down during dynamic downsizing. Another type of dynamic downsizing is the so-called dynamic skip fire, consisting of actively reducing the load or completely skipping the cylinders [135]. This allows the engine to work not only under stoichiometric conditions (λ = 1) but also with the use of a lean fuel–air mixture. In direct-injection SI engines, variable valve timing is also used, which affects the valve opening and closing times depending on the power demand. This allows for reducing the demand for fuel, reducing NOx emissions, and improving engine performance [136]. The static effect is achieved in the engine design stage by reducing the number of cylinders. The loss of power associated with this solution is compensated for, among others, by applying supercharging and changing the geometry (increasing the diameter and length) of the other cylinders. The use of air compressors provides more air for combustion, which translates into the possibility of obtaining more power [137]. Increasing the stroke or bore of the cylinder translates into an increase in the displacement of the engine.
Downsizing allows for the reduction of fuel consumption, carbon dioxide, and NOx emissions. In addition, it reduces the weight and dimensions of the engine itself and can lower the total friction inside the cylinders compared to the original, unmodified units [136].
Rightsizing involves adapting the engine to a specific vehicle to achieve the desired performance and dynamics, while simultaneously preserving the number of cylinders. A drive unit optimized in this way should be characterized by low fuel consumption and low emissions [138,139]. This goal is achieved by increasing the compression ratio or by using direct fuel injection. In simplified terms, the engine’s energy efficiency increases with the increasing compression ratio; however, this requires the use of high-octane fuel. Using a direct fuel-injection system allows cooling of the cylinder walls and piston, which allows for a higher compression ratio; too high of a temperature in the cylinder can lead to knocking combustion.

4.2. Octane Number

The octane number (ON) determines the fuel’s resistance to uncontrolled ignition and knocking combustion. The higher the ON value, the greater the knock resistance.
There are several standardized methods for determining octane number, the most popular being research octane number (RON), motor octane number (MON) and antiknock index (AKI). RON and MON are determined using a standardised single-cylinder engine. Selected process parameters are presented in Table 7. The RON value more accurately reflects the characteristics of engines subjected to light and medium loads, while the MON value, due to the higher engine speed, better describes conditions during high load. For commercial gasolines, the MON value is lower than the RON value. The antiknock index is the arithmetic mean of the research and motor octane numbers.
In many countries, including EU member states, the research octane number is provided. This parameter is used in gasoline stations, fuel certificates, and various legal acts. In North America (Mexico, the USA, and Canada), the antiknock index is used.
Components like methanol, ethanol, and alcohol esters offer the dual benefit of reducing CO2 emissions throughout the fuel’s lifecycle while also serving to enhance the octane number. These additives play a crucial role in improving the performance characteristics of gasoline. Table 8 depicts a range of additives utilized in vehicle gasoline. However, it is important to acknowledge that the impact on octane number is not linear due to the complex interaction between the additive and the base fuel [142].
The use of gasoline with a higher ON is desirable for vehicles powered by high-compression engines. The use of gasoline with a higher octane than recommended by the engine manufacturer recommends can lead to increased emissions. In the study of Sayin et al. [143], for an engine adapted to gasoline with an octane number of 91, the use of ON95 gasoline increases fuel consumption by about 6%. In addition, the higher octane number has the effect of increasing carbon monoxide emissions by 6% and hydrocarbon emissions by 3.5%.

4.3. Physicochemical Composition of Fuel

As mentioned previously, motor vehicles can be powered by converting the chemical energy from gasoline into mechanical energy. The implementation of this process, i.e., the type and method of fuel combustion, should be carried out in the most effective and economical way. For decades, the development of the powertrain, especially SI engines, has been one of the key issues of research and development.
In gasoline, apart from combustible hydrocarbons, there are a number of various compounds and additives aimed at improving the properties of the fuel. They can be grouped according to their role in the fuel: combustion-improving agents, protective agents (anticorrosion agents), agents improving the lubricating properties, and increasing the oxidation stability of the fuel, as well as lubricants and detergents [98]. These additives might be the source of various microcontaminants.
The physical and chemical properties of the fuel, such as the content of aromatic compounds, olefins, and compounds containing oxygen and sulphur, as well as the volatility and boiling point of individual components, affect the emission of particulate matter and other pollutants [48]. The content of aromatic compounds in the fuel may have an impact on the emission of carbon monoxide, NMHC, PM, and PN, as well as soot [77,144]. However, using modern exhaust aftertreatment systems the variation of fuel composition might have a limited significance. Depending on the engine and exhaust aftertreatment, the number and mass emissions can increase with the presence of olefins and sulphur. The low volatility of gasoline increases the emission of particulate matter [48,145]; however, in the case of using bioethanol, this relationship is not linear [146].
One of the intentions of adding biocomponents to fuels, like bioethanol, is to reduce greenhouse gas emissions. It is assumed that the growth of plants used for the production of bioethanol absorbs as much carbon dioxide as is emitted during the combustion of this type of fuel in the engine. In practice, the type of these fuels is still associated with CO2 emissions; for example, bioethanol obtained from corn reduces the total greenhouse gas emissions by about 40% and from lignocellulose by over 60% [147].
The use of oxygen-containing compounds, such as bioethanol, in the fuel, in addition to having a positive impact on the balance of greenhouse gas emissions, may result in a number of side reactions [148]. In general terms, the addition of biofuels reduces the emission of soot, hydrocarbons, and carbon monoxide, but may intensify the emission of nanoparticles and oxidised derivatives of PAHs [149]. In research on bioadditives present in gasolines, it was found that MTBE and ETBE slightly increase NOx emissions [142], while the addition of bioethanol may lead to a decrease in NOx concentration [150]. The literature also indicates the formation of combustion byproducts [151] such as formaldehyde and acetaldehyde [142,152,153], acetone, propanal, benzaldehyde and tolualdehyde [154], and mono- and dicarboxylic acids [155,156].
Individual gasoline components, due to their physical and chemical properties, have a specific impact on PM and PN emissions. Emission indices are the result of work on linking the composition of gasoline with emissions [157]. One of the first such indices is the Honda index, currently considered the best and used as a benchmark when developing similar indices. Based on a detailed analysis of hydrocarbons contained in gasoline, it allows for a precise determination of their impact on PM emissions. It is also used in the creation of synthetic gasolines used during research and development, e.g., in adapting the engine to future standards. In the case of fuels with bioadditives, the Honda index shows large deviations from the true value; hence, work is underway to develop more accurate indexes [50,158].
According to Leach et al. [68], the disadvantage of this solution is the need to use advanced equipment (GC), which is not available in typical fuel laboratories, and the long time of the analysis itself. It should be noted that a detailed analysis of hydrocarbons can contribute to the prediction of regulated emissions but also of numerous unregulated exhaust components.

4.4. Engine Oil

The main role of engine oil in the engine is to reduce the internal resistance between the piston and the cylinder. In addition, due to a number of different additives, the lubricant may also have other characteristics; they are achieved by additives containing, among others, calcium, magnesium, phosphorus, sulphur, and zinc [159]. For example, magnesium sulfonates act as a detergent; zinc dialkyldithiophosphate is used as an antioxidant and antiwear compound; and compounds containing sulphur and phosphorus serve as an antiseize additive [160].
During the operation of the drive unit, 0.12 to 2.13 g of engine oil are burned for each litre of gasoline [82,161], which is responsible for the emission of organic compounds such as PAHs. In addition, sulphur compounds are responsible for corrosion and SOx emissions and inorganic solid particles in the form of ash [99,162]. Metals derived from engine-oil additives, such as zinc and potassium, can be responsible for poisoning the three-way catalytic converter, affecting the emission of HC, CO, and NOx [99].

4.5. Wet Piston Effect

One of the negative effects occurring in the SI engine is the wetting of the walls and pistons by a thin layer of gasoline. In the case of engines with indirect fuel injection, fuel and water vapour may condense in the intake manifold. Direct injection of fuel may cause the formation of small areas of liquid gasoline, which results in prolonged combustion of the fuel–air mixture and incomplete combustion, intensifying the emission of particulate matter [163]. The degree of wetting can be controlled by injection time and pressure, cylinder pressure, system temperatures, and the number and shape of the fuel injectors. The path taken by the fuel from the injector in the cylinder, i.e., control of the injection timing, has the greatest impact on PM emissions [99].

4.6. Fuel-to-Air Ratio

The absence of fuel-to-air ratio control, such as electronic injection control, may have an impact on PM emissions. Early research on this ratio was conducted by Wu et al. [164]. In the tested case, a λ below one allowed for the achievement of the maximum torque. The increase in CO emissions was compensated for by supplying the oxygen contained in the ethanol. The highest CO2 emission was present at λ ~ 1. In the case of hydrocarbon emission, it was strongly dependent on the excess air factor. At values deviating from λ = 1, the HC emission was the highest. In the case of excess fuel, it was impossible to completely burn it, while excess air leads to incomplete combustion. At the same time, it was possible to reduce hydrocarbon emissions by using ethanol. The emission of particulate matter also undergoes similar changes; that is, an increase in PM is observed at λ < 1 [165].

4.7. Engine Operating Parameters

During the combustion of the fuel–air mixture in the engine cylinders, a number of parameters can be controlled that affect the quality and efficiency of the combustion process. The most important parameters are ignition timing, fuel-injection timing and pressure, and how the gasoline is delivered to the cylinder volume. Currently, these parameters are dynamically controlled by the engine control unit [48,166].
At a given moment of engine operation, there is an optimal moment of ignition of the fuel–air mixture, often characterised by the parameter of maximum braking torque, i.e., the torque at maximum load. Initiation of the combustion process before this moment allows the combustion process to be extended, reducing PM and CO emissions. Delaying the ignition timing increases the temperature, leading to a prolongation of the oxidation process [165,167].
The early timing of fuel injection increases the cooling effect of the cylinder, which has a positive effect on the combustion process and its energy efficiency, reducing the risk of knocking and fuel consumption. Delaying the fuel-injection moment allows for obtaining a stratified fuel–air mixture.
An increase in fuel-injection pressure has a positive effect on the homogenisation of the fuel–air mixture and the reduction of the size of the fuel droplets.
The study of the impact of engine parameters on emissions was carried out by, among others, Liu et al. [168] analysing a three-cylinder engine operating in the Atkinson cycle. The increase in fuel-injection pressure in the range of 5 to 30 MPa with the ignition in the 340 °CA (crank angle) position increases the emission of NOx and hydrocarbons and at the same time reduces the emission of carbon monoxide. The emission of mass and the number of particles increases at a pressure of 10 MPa and remains constant up to 35 MPa. Changing the ignition angle also has a significant effect on emissions. For example, ignition at 320 °CA is associated with the emission of about 1 × 106 cm−3 of particulate matter. Delaying the ignition by 20 °CA intensifies the emission by an order of magnitude, while advancing the ignition by 20 °CA and 40 °CA results in a 20-fold reduction of the PN emission, to the level of about 5 × 104 cm−3.
Too high of injection pressure can lead to wetting of the piston and cylinder, which is indirectly seen in the studies of Liu et al. [168], where the CO emission increases by about 10% when the pressure increases from 30 MPa to 35 MPa. The opposite phenomenon applies to NOx emissions, where the highest emission occurs in the range of 20–30 MPa, while, at the pressure of 35 MPa, the emission is much lower. The lowest emission of CO at a pressure of 5 MPa occurs during ignition at 320 °CA, while at 280 °CA and 340 °CA, it is about 30% higher. This means that the correction of the parameters for the maximum braking torque must be within the appropriate range, while taking into account all regulated exhaust components.

4.8. Exhaust-Gas Recirculation and Combustion Air

The exhaust-gas recirculation system is used in internal combustion engines to reduce the emission of harmful exhaust components, mainly NOx [78,168,169]. It works by re-introducing part of the exhaust gas into the engine’s intake system via an exhaust-gas recirculation valve. Recirculation helps to lower combustion temperatures by diluting the air–fuel mixture with the exhaust gas, which reduces the amount of nitrogen oxides in the exhaust gas. At the same time, the lower amount of oxygen present in the cylinder can lead to increased emissions of carbon monoxide, hydrocarbons, and particulates.
For vehicles powered by a spark-ignition engine, 5% to 20% of the exhaust gases are recirculated. Above this value, exhaust gases contain significant amounts of carbon monoxide and hydrocarbons, and the leaning of the fuel–air mixture leads to misfires. Table 9 presents an example of the effect of recirculation on selected exhaust-gas components emitted by a prototype engine with a displacement of 1.8 L [170]. Exhaust-gas recirculation at the level of 20% reduces nitrogen oxide emissions by more than three times, which has a slight impact on the emission of carbon monoxide and hydrocarbons. With 40% recirculation, NOx emissions are reduced by almost 95%, while CO and HC emissions increase by 570% and 360%, respectively, compared to engine operation without recirculation.
Vehicles with a CI engine have a recirculation valve that returns up to 50% of the exhaust gases. A higher level of recirculation compared to vehicles equipped with an SI engine is possible due to the significant excess of air. Despite the leaning of the air–fuel mixture, there is still enough oxygen in the cylinder to achieve the desired degree of oxidation of carbon monoxide and hydrocarbons.
Exhaust-gas recirculation can also be carried out internally, without the need for an EGR valve. Internal recirculation involves controlling the valve timing or intake and exhaust valves to partially trap the exhaust gases in the cylinder. This solution is used at relatively low engine loads [171].
Thanks to the use of exhaust-gas recirculation technology, combustion vehicles can achieve better environmental parameters and meet stringent emission standards while maintaining engine efficiency and performance.

4.9. Cold Start and Weather Conditions

In the initial phase of the operation of a motor vehicle, there is a period when the engine, operating fluids, fuel, exhaust-gas treatment systems, and other structural elements have an ambient temperature much lower than the optimal operating temperature. This period is called the cold start or low-temperature period [172].
During the heating of individual components and fluids, significant amounts of pollutants, such as nitrogen oxides, carbon monoxide, solid particles, and hydrocarbons, are emitted [173,174]. For example, in the study of Giechaskiel et al. [175], CO, HC, and NOx emissions are higher for temperatures below 5 °C compared to tests conducted at 23 °C according to the WLTP. Similar conclusions were reached by Engelmann et al. [176] when comparing vehicle emissions in summer and winter.
This is due to a number of factors, the most important of which include the difficult evaporation of fuel in the cylinder, the phenomenon of vapour condensation, and too low of a temperature of the catalytic reactor. When fuel is injected while the temperature is low, the fuel droplets have a large diameter, which makes their evaporation difficult. At the same time, contact with the cold walls of the piston and cylinder further reduces the possibility of evaporation.
Vapour condensation can occur before the cylinders, in the intake manifolds, and during the exhaust stroke stage and the movement of exhaust gases in the cold exhaust system. Moisture present in atmospheric air, fuel (especially in SI engines equipped with indirect fuel injection), and products of incomplete combustion, such as hydrocarbons, condense [177]. The presence of fuel condensation has a negative impact on the combustion process by uncontrolled enrichment of the fuel–air mixture, and it creates deposits on engine components. Water-vapour condensation leads to moisture in the mixture being present in the cylinder, causing a reduction in the effective unit power of the engine and may intensify corrosion of the engine and the exhaust system. The presence of condensed compounds, such as hydrocarbons, in the engine’s exhaust system results in their accumulation within the system, which subsequently leads to their emission into the environment upon the next start up.
Exhaust-gas treatment systems, in particular catalytic reactors, have an optimal operating temperature, at which the process of removing harmful pollutants is carried out most effectively. These temperatures are described in more detail in the Section 3.3. In addition, in order to avoid misfire and increased internal resistance of a cold engine, in the initial stage, the engine operates with an excess of air from λ = 0.2 − 0.5, gradually reaching the value of λ = 1 [172]. The heating period of individual vehicle systems depends on weather conditions. Low temperatures extend and intensify the cold-start effect [173].

4.10. Start–Stop Systems

The electronic start–stop system enables automatic switching off and on of the combustion engine when the vehicle is stationary, effectively reducing fuel consumption. This system is used primarily during urban driving, where there are frequent stops, e.g., at traffic lights, which ensures a reduction in fuel consumption by 10% to 20% [142,178,179] and CO2 emissions by 20% [178]. At the same time, electronic control allows for intelligent use of this function. As an example, the system detects manoeuvring, e.g., in a parking lot, turning the vehicle, or using additional vehicle functions that require continuous engine operation, such as air conditioning, defrosting windows or driving in sport mode. The start–stop system is also inactive during a cold start of the vehicle, when the exhaust-gas treatment systems are heating up or operating close to the minimal operating temperature, and when driving on roads with a sufficiently high gradient [179].
The use of a start–stop system also affects other components of automotive emissions. In model studies, da Silva et al. [180] checked the impact of two start–stop systems—with and without engine temperature control. In the first case, the simulated vehicle showed lower emissions of carbon monoxide, hydrocarbons, and NOx. Fuel consumption was noticeably lower, while the engine’s warm-up time remained the same. In the case of a system without engine temperature control, i.e., activated independently of the temperature, the warm-up period was extended. This was associated with an increase in carbon monoxide and NOx emissions.
Storey et al. [181] analysed the emission of selected regulated pollutants from a 2014 Chevrolet Malibu vehicle with a 2.5-litre engine with direct fuel injection. The use of the start–stop system in a vehicle powered by E0, E21 and iBu12 fuels (gasoline with the addition of ethanol up to 21% vol. or 12% vol. isobutanol) reduced the emission of carbon oxides, nitrogen oxides, and hydrocarbons. For E0 gasoline, the mass of emitted particulate matter was higher when the start–stop system was used, while the number of particles was lower. In the case of E21 gasoline, the use of the start–stop system reduced the mass emitted from particulate matter but did not significantly change the PN. In both cases, the soot emission was at a similar level. When using iBu12 fuel, the active start–stop system intensified PM, PN, and soot emissions.

4.11. Other Systems

In modern cars, there are many other systems and solutions that affect emissions. The development of materials from which the vehicle is made improves driving comfort by stiffening the structure, lowering its weight, and reducing fuel consumption. The Tesla Company produces electric vehicles using aluminium and high-strength stainless steel alloys to reduce the weights of vehicles, which increases their battery range. Metals are often replaced with composite materials based on glass or carbon fibre. Titanium and magnesium are also materials that can significantly reduce the weight of the vehicle while maintaining appropriate physical and chemical parameters (e.g., strength and thermal resistance). However, due to the much higher price compared to the typically used steel, they are not used in large quantities [182].
Regenerative braking allows for the conversion of kinetic energy during the process of braking or driving downhill and using it to power other vehicle components or storing it in batteries [183]. In electric vehicles, the use of this system allows for an increase in the range by 10%.
Many vehicles are equipped with an active aerodynamic control system that controls the air intake ducts, chassis, and spoilers to change aerodynamic drag while driving. Reducing the aerodynamic drag while driving allows for reduced fuel consumption [184].
These systems reduce fuel consumption or energy losses, which translates into lower emissions. At the same time, these are examples of activities in the automotive industry aimed at promoting sustainable development and reducing environmental impact.

4.12. Driving Style

Driving style has a significant impact on vehicle emissions, in particular fuel consumption. Eco-driving (energy-efficient driving) is a set of principles and techniques of economic driving that assume the most ecological driving possible. The main factors include gradually accelerating and decelerating the vehicle (engine braking); maintaining a constant speed (using cruise control); observing the road (anticipating stop, observing traffic, and observing the speed limit); trip planning (routing and removing unnecessary payload); lowering air resistance (closed windows and no roof rack); maintaining proper tire pressure; and limiting the use of additional systems (air conditioning and heating) [185].
The literature indicates that the driver has the greatest impact on CO2 emissions and fuel consumption below 70 km/h during city driving [186]. This is due to frequent speed changes (braking and accelerating) and frequent gear changes. Under urban conditions, compliance with the principles of eco-driving can reduce CO2 emissions by 22–30%. The impact of the driver on emissions when moving at higher speeds is lower. This is due to the fact that, most often, driving in these conditions takes place at a constant speed in the highest gear, e.g., on motorways.
Huang et al. [187] analysed the influence of eco-driving training on drivers comparing CO2 emissions. Depending on the intensity of the reduction training, the achieved carbon dioxide emissions ranged from 0 (no effect) to 15%. The largest decrease was recorded immediately after training sessions, while the training effects decreased over time. Simultaneously, Huang et al. highlight the necessity of aligning road infrastructure with eco-driving principles to ensure that economic driving is not hindered or restricted. Examples of infrastructure-improvement solutions include synchronising traffic lights and reducing the number of intersections or replacing them with turbine roundabouts.

5. Vehicle-Testing Procedure

5.1. First Emission Tests

In the USA in the 1940s and 1950s, there was a dynamic development of cities, which resulted in the appearance of a large number of motor vehicles on the roads. In Los Angeles County, California, the population increased from 2.8 million to over 4.1 million during this period, while the number of vehicles in motion increased from 2.5 to 4 million, half of which were on Los Angeles City roads [188]. Simultaneously, during this period, the observation of photochemical smog as a phenomenon commenced. Los Angeles-type smog is formed in the presence of pollutants from vehicles, i.e., carbon monoxide, hydrocarbons, and nitrogen oxides, which, when exposed to UV rays, lead to the formation of high concentrations of ozone.
The presence of photochemical smog initiated the dynamic development of research and legislative work on air pollution. As a result, the first studies of the physicochemical composition of exhaust gases appeared. The first work on emission measurement was carried out in 1951 by Magill et al. [189]. The exhaust gases were analysed in the sampling trailer while driving in three modes: acceleration from 16 to 48 km/h; driving at a constant speed of 48 km/h; and braking up to 16 km/h.
The dynamic development of the automotive industry and the science of environmental pollution caused the need for developing a repeatable and reproducible method of emission measurement in order to control and limit harmful components of vehicle exhaust gases.

5.2. Coastdown

Before the tests, the vehicles are subjected to a coastdown test, which consists of accelerating the vehicle to a certain speed and then, at idle gear, braking it using the internal resistance of the drive system and the aerodynamic resistance of the vehicle. Internal drag results from the friction force between the road surface and the tires and internal parts of the vehicle, such as bearings and the gearbox. Prior to undergoing emission tests, vehicles entering the coastdown test are required to fulfil several criteria, including maintaining appropriate tire pressure and tread depth, ensuring a stable starting temperature for the coastdown, and having all operational components and fluids properly equipped. The coastdown must be run on a test track that meets the relevant requirements and under appropriate weather conditions. For instance, when performing the coastdown test as part of the WLTP procedure, it is necessary to conduct the test on a track with a maximum gradient of ±1%, ensuring that wind speed does not exceed 7 m/s and that the air temperature ranges from 5 to 40 °C. The vehicle undergoing the coastdown test, along with its tires, must undergo a minimum break-in process of 3000 km and 200 km, respectively [190,191].
The results obtained from the coastdown test are utilized to calibrate the chassis dynamometer, ensuring optimal representation of the actual test conditions.

5.3. Chassis Dynamometer Test

The unification of tests is carried out by testing vehicles in strictly defined laboratory conditions in test chambers equipped with a chassis dynamometer, on which the vehicle can perform a specific driving scenario without the need to move. The chassis dynamometer is a device that simulates the forces that act on the vehicle while driving, including the speed and slope of the road by means of one or two sets of rollers. This device is located in an air-conditioned laboratory, ensuring a constant measurement temperature. The air supplied to the room is filtered from any gaseous pollutants and dust to avoid any influence on the emission test’s result.
Before starting the tests, operating fluids and gasoline are replenished in the vehicles to the required values, the battery is charged, and the tires are inflated to the appropriate pressure. Vehicles prepared in this way are subjected to the conditioning process, during which they reach the temperature appropriate for the test.
A properly prepared vehicle is placed on rollers and immobilised with belts or rigid connections (e.g., Bleyer anchors), and the engine control unit is connected to the computer that operates the dynamometer through the engine onboard diagnostic type II socket (EOBD II), which also provides access to a number of vehicle operating parameters (speed, engine RPM, pressure, and temperature readings, etc.). There is a fan in the front to cool the engine during the test. Within the dynamometer, specific parameters are configured, including the wheelbase and weight of the vehicle under testing, as well as coastdown parameters acquired from real-world conditions. Subsequently, additional coastdown tests are conducted to verify or refine the calibration of the dyno chassis.
The test room, depending on the parameters to be analysed, may be equipped with additional devices for analysing the physical and chemical parameters of vehicles. For example, the exhaust system can be connected to various pressure and temperature sensors, as well as analysers examining the exhaust-gas parameters before and after individual exhaust-gas treatment systems.
During emission tests, such as the NEDC or Worldwide Harmonised Light Duty Vehicle Test Cycle (WLTC), the physicochemical composition of exhaust gases is analysed in terms of regulated pollutants described in the Section 2.3. Exhaust gases leaving the exhaust system go to the appropriate analysers through a heating line that prevents vapour condensation. Techniques such as FT-IR (CO2 analysis), GC-FID (HC and CO), and QCL (NOx) are used for the analyses.

5.4. European Driving Cycles

In Europe, the first emission tests carried out using a chassis dynamometer appeared in 1970. Along with the development of the automotive industry, the tightening of emission limits, and the need to more accurately adapt the test to obtain real-world results, emission tests were developed.
Initially, the test consisted of four replicas of the UDC, as shown in the blue part of the graph in Figure 10. In subsequent years, various additional measurements were introduced in order to test emissions more precisely, e.g., carbon monoxide emissions during engine idling immediately after the end of the test. Two types of extraurban driving cycles (EUDC) were also introduced, differing in maximum speed. In the EUDC Low, for relatively low-performance vehicles, the maximum speed was 90 km/h, while, for the other EUDC, it was 120 km/h. Both steps are illustrated in Figure 10.
In the course of work on the cycle, the procedure was extended to include other types of tests [192,193].
  • Type I: a cold-start emission test;
  • Type II: emissions at idle; the test is carried out immediately after the end of the EUDC;
  • Type III: checks crankcase emissions when idling and at 50 km/h;
  • Type IV: test for the loss of hydrocarbons as a result of their evaporation from the fuel system for SI vehicles;
  • Type V: test to verify the durability of pollution-control devices;
  • Type VI: carbon monoxide and hydrocarbon emissions test at −7 °C;
  • Type VII: fuel consumption and range test;
  • Type VIII: environmental tests;
  • Type IX: noise-level test.
Figure 10. Speed graph during the NEDC test. Own elaboration based on [194].
Energies 17 00209 g010
The general advancement in the field of emission testing led to the development of NEDC, depicted in Figure 10. NEDC comprises four UDC stages and an EUDC stage. Unlike previous iterations, the test now initiates at engine start without a 40 s idling period, to account for cold-start emissions in the test [195].
Work on a new light-vehicle testing cycle was initiated in 2007 by the United Nations. The outcome of extensive research was a WLTP, which was introduced in the European Union in September 2017 [196]. The WLTP procedure divides vehicles according to their power-to-weight ratio into four classes. Class 1 includes vehicles with a PWR below 22 W/km inclusive, and Class 2 includes vehicles from 22 to 34 W/kg. Class 3 includes other vehicles above 34 W/kg, with a note that vehicles with a maximum speed of up to 120 km/h belong to class 3a, and the rest with the best performance belong to class 3b [9].
Figure 11 shows the speed graph for vehicles meeting the requirements of class 3b. The test is divided into four stages, differing in engine load, maximum speed, and standstill time. The first phase simulates city driving with long stops to simulate stopping at traffic lights and relatively low speeds associated with driving on heavily trafficked roads. The second stage corresponds to dynamic urban driving, where average speeds are higher. In the first two stages, there are relatively frequent gear changes, which affect, among others, CO2 emissions, as explained in the section about driving style. The medium speed phase, during the peak period, requires driving at 90 km/h, which is intended to simulate the conditions of rural driving. The last stage, at a speed exceeding 130 km/h, corresponds to driving on the highway, where the vehicle is moving in the highest available gear most of the time.

5.5. Comparison of Dyno Chassis Tests

Already in 2001, studies showed that the test of light motor vehicles conducted in accordance with the NEDC procedure underestimates the value of CO2 emissions by 8% in relation to real conditions. In 2015, the difference was approximately 39% [196,197,198,199]. This resulted in the need to create a test that more accurately reflects real driving conditions; as a result, tests in accordance with the WLTP procedure were introduced. Table 10 shows the parameters of the NEDC cycle and the four WLTC cycles.
Tests conducted in accordance with the new procedure are longer and show greater driving dynamics. The biggest differences can be seen between the WLTC class 3b and the NEDC tests. The WLTP-compliant test lasts half as long, covers 12 km more distance, and the average speed is 13 km/h faster with stops, or 18 km/h faster if only driving is included. Also, the maximum acceleration w is greater by 0.5 m × s−2 The total length of stops is similar in both cases, while the percentage of stops during the NEDC test is nine percentage points longer than in the case of the WLTC class 3. It is worth pointing out that, during WLTP tests, the influence of cold start on emissions might be undervalued. The issue will be significant in places where vehicles are used mostly for short trips, such as for inner-city travelling.
The use of the driving cycle and the tightening of the requirements for the measurement of automotive emission components allow for a more accurate mapping of driving in real conditions.

5.6. Real Driving Emissions

Conducting emission tests in laboratory conditions ensures their reproducibility worldwide. As mentioned above, laboratory tests did not reflect the actual CO2 emissions, which were related to the additional influence of factors such as weather conditions, driver’s behaviour, road traffic and its intensity, technical condition of the vehicle, and factors listed in Section 4. The literature also states that, due to the use of measurements in accordance with the NEDC test guidelines, the emission of nitrogen oxides was underestimated compared to real conditions. The literature indicates that, in the period 1990–2006, NOx emission was not effectively reduced [200]. At the same time, emission results were manipulated during laboratory tests, consisting of modifying engine settings and parameters, leading to lower emissions compared to real conditions.
Since 2017, in addition to the WLTP tests, real driving emissions (RDE) tests have been introduced to provide realistic emission values. The introduction of the tests in accordance with the RDE took place in four stages. The first, published in March 2016, introduced the basic parameters of the ride, test requirements, and requirements for measuring equipment. The second package, from April 2016, introduced nonexceedable limits for NOx emissions and additional test requirements such as the total increase in altitude during the journey. The third package, from June 2017, introduced the requirement to measure the number of particles with a maximum limit. The fourth package from, November 2018, simplified the measurement procedure and introduced in-service compliance tests, tightened the requirements for NOx emissions, and simplified CO2 measurements [34].
The test in real conditions is carried out on roads in accordance with the guidelines presented in Table 11. The measurement in real conditions is divided into three stages, urban, rural, and motorway, lasting up to two hours in total. The vehicle in each stage must cover a minimum distance with a certain average speed. Road and weather conditions are taken into account during the test.
The limitation of the test is the measurement accuracy of the devices used, PEMS compared to the WLTP-complied analysers, and the inability to control the test environment conditions. With RDE, two correction factors are introduced. During the test, when selected values, such as height above sea level or ambient temperature, are exceeded, the determined emission is divided by a correction factor of 1.6 [201].
During the life of a motor vehicle and during tests in real conditions, the value of its emissions is limited by not-to-exceed (NTE) limits. These limits are related to the uncertainty of the PEMS measurement and are tightened along with technical progress or improvement of the measurement procedure. Currently, the conformity factors that are applied to nitrogen oxides and PN are 1.43 and 1.5, respectively [202].
Figure 12 shows the speed graph of an example test performed in accordance with the guidelines in Table 11. The urban stage lasts from 0 to about 2500 s, the rural stage to about 4700 s, and the motorway stage takes up to 6000 s. The decrease in speed at the end of the graph, in the range of 5800–6000 s, is related to the motorway exit and is included in this stage due to maintaining the required average speed, above 90 km/h.
The RDE and WLTC tests were compared by, among others, Andrych-Zalewska et al. [203]. A gasoline vehicle meeting the requirements of the WLTC class 3b and Euro 6d-Temp emission standards was used for the tests. The emissions in real conditions were higher for carbon monoxide and dioxide, nitrogen oxides, and PN. Compared to the WLTC test, the CO emissions were higher by more than 1500 mg/km, in the RDE test reaching a value of about 2300 mg/km. NOx, CO2, and PN emissions were also higher for the test in real conditions, by about 20%, 12%, and 100%, respectively.
The total hydrocarbon emissions during the test in real conditions was approximately 0.17 mg/km, while on the chassis dynamometer, the value was three hundred times higher, reaching the value of 51.68 mg/km. This is the result of a relatively small share of the cold start in the entire cycle. This may translate into an underestimation of hydrocarbon emissions, especially in urban conditions where, during a single journey, a cold start has a relatively large share of the total trip [204].
Currently, in the European Union, motor vehicles undergo tests on a chassis dynamometer as well as in accordance with real driving emissions, with the requirement that the emission values in both cases remain below the set limits of the emission standards.

6. Current Challenges in Vehicle Emission

The ongoing transformation to zero-emission vehicles will be greatly accelerated in 2035, when in the European Union manufacturers will be forced to sell only LEVs powered by sustainable fuels. In the following years, after 2035, the vehicles powered by gasoline or diesel will be replaced by more environmentally friendly alternatives.
Despite these advancements, there are still several challenges pertaining to vehicle emissions. Current legislation within the European Union primarily focuses on limiting the PM and PN, without considering their composition. However, as discussed in this article, microcontaminants present in PM pose significant risks to both health and the environment. Concentrations of these microcontaminants are not solely dependent on particle mass, and efforts to reduce regulated pollutants may inadvertently lead to the emergence or increase of microcontaminant concentrations, thereby elevating the overall toxicity of vehicle exhaust. Therefore, it is imperative to prioritize the reduction of microcontaminants by improving existing exhaust aftertreatment systems, such as GPFs.
Given the growing number of vehicles on the road, it is essential to conduct research on alternative materials for the removal of hydrocarbons, as an alternative to the current use of Pt, Pd, and Rh. The utilization of such metals is progressively increasing with each passing year. Additionally, it is important to prioritize research on the optimization of existing systems to prevent the excessive expansion of exhaust aftertreatment systems, thereby avoiding unnecessary manpower requirements and cost implications associated with improvement efforts.
Moreover, given the emergence of microcontaminants, it is essential to conduct in-depth investigations into the impact of bioadditives on nonregulated emissions. This research is crucial in order to avoid the utilization of compounds that exhibit a wide-ranging adverse effect rather than providing beneficial outcomes.
The development of a worldwide testing procedure for MCs and exhaust toxicity indicators (such as TEQ) is necessary to ensure standardized and comparable measurements of emissions across different regions and countries. Such a procedure would allow for a more accurate assessment of the health and environmental impacts of vehicle emissions on a global scale, facilitating the identification and mitigation of potential risks. It would also enable the evaluation and comparison of different exhaust aftertreatment technologies and strategies, aiding in the development of more effective and efficient solutions to reduce harmful emissions.

7. Future Trends

Stringent emission standards for fossil-fuel-powered vehicles are crucial for achieving the goal of near-zero-CO2-emission vehicles by 2035. By implementing more rigorous regulations, older cars, which are likely to remain on the roads for an extended period, would contribute significantly less to environmental impact. This proactive approach aligns with the imperative to reduce overall emissions and pave the way for a more sustainable and environmentally conscious transportation landscape.
Looking ahead, several key future trends are expected to shape the landscape of emissions from light-duty vehicles. One prominent trend is the increasing adoption of electric vehicles as a viable alternative to traditional internal combustion engine vehicles. With advancements in battery technology and an expanding charging infrastructure, EVs are poised to play a significant role in reducing emissions. Governments and industry stakeholders are actively promoting the electrification of vehicles through incentives, regulations, and investments in research and development.
Another emerging trend is the integration of connected and autonomous vehicle (CAV) technologies. CAVs have the potential to optimize driving patterns, reduce congestion, and enhance fuel efficiency, thereby minimizing emissions. Additionally, the application of advanced sensors and artificial intelligence in CAVs can enable real-time monitoring and control of vehicle emissions, allowing proactive emission management and compliance.
Furthermore, the development of sustainable alternative fuels, such as biofuels, hydrogen, and synthetic fuels, holds promise for reducing the carbon footprint of transportation. These fuels offer the potential for lower emissions and improved air quality without requiring significant modifications to existing vehicle fleets. Additionally, the use of renewable energy sources in fuel production can further enhance the environmental benefits of these alternative fuels.
In summary, the future of emissions from light-duty vehicles is expected to witness a shift towards greater electrification, the integration of connected and autonomous technologies, and the exploration of sustainable alternative fuels. By embracing these trends and fostering innovation, stakeholders can collectively work towards achieving cleaner and more sustainable transportation systems, effectively mitigating the environmental impact of vehicles, and contributing to a greener future.

8. Conclusions

In conclusion, this article has provided a comprehensive exploration of emissions from light-duty vehicles, focusing on the statistical trends, regulatory framework, and testing procedures within the European Union. By examining statistical information about the automotive industry and vehicle categories, valuable insights are gained into the magnitude and impact of emissions on a global scale.
The discussion of emission regulations, particularly the European Emission Standard, highlighted the efforts made to mitigate the environmental impact of vehicles. In addition, the complexities of both regulated and unregulated emissions were delved into, emphasizing the significance of addressing the health implications associated with unregulated microcontaminants.
Examination of vehicle exhaust and the comparison of exhaust-gas treatment systems revealed the significance of technological advancements in reducing emissions. The concept of eco-driving showcased the potential for further emission reduction.
Factors affecting emissions from gasoline engines were thoroughly analysed, covering aspects such as downsizing, fuel composition, and engine operating parameters. Additionally, the influence of driving style, start–stop systems, and other relevant factors emphasised the role of individual behaviour in emissions.
Lastly, various testing procedures were explored, including emission tests and real-world testing, which are crucial for evaluating and ensuring compliance with emission standards.
In general, this article underscores the need for continued research, innovation, and collaboration to address the challenges posed by vehicle emissions. By understanding the complexities surrounding emissions and implementing effective regulations and testing procedures, we can strive towards a cleaner and more sustainable future for the automotive industry and the environment as a whole.

Author Contributions

W.P. (idea, literature search, and data analysis, original draft preparation); K.S.-S. (idea, critical revision of the work, supervision); J.G. (idea, critical revision of the work, supervision). All authors have read and agreed to the published version of the manuscript.

Funding

The authors gratefully acknowledge the funding support given by AGH University of Krakow within the subvention project No. 16.16.210.476.

Data Availability Statement

All sources of data are provided where necessary. Any other information is duly available from the first author upon reasonable request.

Conflicts of Interest

The authors declare no conflict of interest.

Abbreviations

AKIAntiknock IndexGCGas ChromatographyPWRPower-to-weight ratio
ASCAmmonia Slip CatalystGPFGasoline Particulate FilterQCLQuantum Cascade Laser
BATBest Available TechniquesHCHydrocarbonsRDEReal Driving Emissions
CACrank AngleICIon ChromatographyRONResearch Octane Number
CAVConnected and Autonomous VehiclesICEInternal combustion engineRPMRevolutions Per Minute
CICompressed IgnitionISC-FCMIn-service Conformity–Fuel- Consumption MeasurementPGMsPlatinum group metals
CNGCompressed Natural GasLDVLight-duty vehiclesPMParticulate Matter
DIDirect InjectionLEVLow-emission vehicleSCRSelective Catalytic Reduction
DIPEDiisopropyl EtherLNTLean Nitrogen TrapSISpark Ignition
DOCDiesel Oxidation Catalytic ConverterLPGLiquid Petroleum GasTAEEEthyl Tert-Amyl Ether
DPFDiesel Particulate FilterMCsMicrocontaminantsTAMEMethyl Tert-Amyl Ether
EGRExhaust-Gas RecirculationMeOHMethanolTEQToxic Equivalency Factor
EOBD IIEngine Onboard Diagnostic type IIMONMotor Octane NumberTTWTank to wheel
ETBEEthyl Tert-Butyl EtherMP-AESMicrowave Plasma–Atomic Emission SpectroscopyTWCThree-way catalytic converter
EtOHEthanolMSMass SpectrometryUDCUrban Driving Cycle
EUEuropean UnionMTBEMethyl Tert-Butyl EtherUVUltraviolet
EUDCExtraurban Driving CycleNEDCNew European Driving CycleWLTCWorldwide Harmonised Light-Duty Vehicle Test Cycle
EVsElectric vehicleNMHCNonmethane HydrocarbonsWLTPWorldwide Harmonised Light-Duty Vehicle Test Procedure
FIDFlame Ionization DetectorNTENot to exceedWTTWell to tank
FT-IRFourier Transform Infrared SpectroscopyONOctane NumberWTWWell to wheel
FTPFederal Test ProcedurePAHsPolycyclic Aromatic HydrocarbonsλAir–fuel ratio
LCVLight commercial vehiclesPNParticle Number

References

  1. Rae, J.B.; Binder, A.K. Automotive industry—Przemysł samochodowy. Encycl. Br. 2023. Available online: https://www.britannica.com/technology/automotive-industry (accessed on 1 March 2023).
  2. ACEA. The Automobile Industry—Pocket Guide 2022/2023; ACEA: Belgium, Brussels, 2022; Volume 23, pp. 1–106. [Google Scholar]
  3. European Comission’s Directorate-General for Mobility and Transport. EU Transport in Figures—Statistical Pocketbook 2022; European Union: Belgium, Brussels, 2022; ISBN 9789276536994. [Google Scholar]
  4. Odyssee-Mure. Sectoral Profile—Transport. 2021. Available online: https://www.odyssee-mure.eu/publications/efficiency-by-sector/transport/transport-eu.pdf (accessed on 1 April 2023).
  5. Ministry of Interior and Administration. Ustawa z Dnia 20 Czerwca 1993 r—Prawo o Ruchu Drogowym; Ministry of Interior and Administration: Warsaw, Poland, 1993.
  6. Parlament Europejski i Rada. Dyrektywa 2007/46/WE z Dnia 5 Września 2007r—Ustanawiająca Ramy dla Homologacji Pojazdów Silnikowych i ich Przyczep Oraz Układów, Części i Oddzielnych Zespołów Technicznych Przeznaczonych do Tych Pojazdów. 2007. Available online: https://eur-lex.europa.eu/legal-content/PL/TXT/PDF/?uri=CELEX:02007L0046-20180331 (accessed on 1 March 2023).
  7. EU; European Parliament. Council of the European Union Regulation (EC) No 715/2007 of the European Parliament and of the Council. Off. J. Eur. Communities 2006, 2006, 1–54. [Google Scholar]
  8. Merkisz, J.; Pielecha, J.; Radzimirski, S. Emisja Zanieczyszczeń Motoryzacyjnych w Swietle Nowych Przepisów Unii Europejskiej; Wydawnictwa Komunikacji i Łączności Sp. z o.o.: Warszawa, Poland, 2012; ISBN 978-83-206-1831-0. [Google Scholar]
  9. European Commission; Council of the European Union. COMMISSION REGULATION (EU) 2017/1151; European Union: Belgium, Brussels, 2017; Volume 10, pp. 1–21. [Google Scholar]
  10. ICCT Europe, European Vehicle Market Statistics. Pocketb; International Council on Clean Transportation: Berlin, Germany, 2019; Volume 23, pp. 1–105.
  11. Kowalczyk, G. Tak może wyglądać podatek od spalinówe wynikający z KPO. Sprawdzamy, jak wylicza się go w innych państwach. Bus. Insid. 2022, VII, 1–2. Available online: https://businessinsider.com.pl/technologie/motoryzacja/jak-moze-wygladac-polski-podatek-od-samochodow-spalinowych-sprawdzamy-jak-wyliczaja/1c5lvdd (accessed on 7 March 2023).
  12. Daniel, A. Your Guide to Owning a Car in Japan. Available online: https://www.borderlink.co.jp/magazine/1938/ (accessed on 7 March 2023).
  13. European Comission. ROZPORZĄDZENIE PARLAMENTU EUROPEJSKIEGO I RADY (UE) 2016/1628 z dnia 14 września 2016 r. 2016. Available online: https://eur-lex.europa.eu/legal-content/PL/TXT/?uri=CELEX%3A32016R1628 (accessed on 7 March 2023).
  14. Merkisz, J.; Pielecha, J.; Radzimirski, S. New Trends in Emission Control in the European Union. Springer Int. Publ. 2014, 4, 175. [Google Scholar] [CrossRef]
  15. Ho, C.S.; Peng, J.; Yun, U.; Zhang, Q.; Mao, H. Impacts of methanol fuel on vehicular emissions: A review. Front. Environ. Sci. Eng. 2022, 16, 121. [Google Scholar] [CrossRef]
  16. Skoda Co to są Samochody Hybrydowe? 2021. Available online: www.skoda-auto.pl (accessed on 7 March 2023).
  17. Environmental Protection Agency Fuel Economy. 2023. Available online: https://www.fueleconomy.gov/ (accessed on 14 March 2023).
  18. International Energy Agency. Fuel economy in the European Union. In Global Fuel Economy Initiative 2021; IEA: Paris, France, 2022. [Google Scholar]
  19. European Commission. DIRECTIVE 2010/75/EU OF THE EUROPEAN PARLIAMENT AND OF THE COUNCIL of 24 November 2010 on Industrial Emissions (Integrated Pollution Prevention and Control; European Union: Belgium, Brussels, 2010. [Google Scholar]
  20. European Commission. Stepping up Europe’s 2030 Climate Ambition; European Union: Belgium, Brussels, 2020; pp. 1–26. [Google Scholar]
  21. Ministry of Environment. Ustawa z Dnia 27 Kwietnia 2001 r. Prawo Ochrony środowiska; Ministry of Environmet: Warsaw, Poland, 2001. [Google Scholar]
  22. Merkisz, J.; Pielecha, J. Emisja cząstek stałych ze źródeł motoryzacyjnych. In Wydaw. Politech. Poznańskiej; 2014; Volume 1, pp. 1–20. ISBN 978-83-7775-325-5. [Google Scholar]
  23. Environmental Protection Agency Introduction to Source Classification Codes and their Use for EIS Submissions. Available online: https://sor-scc-api.epa.gov/sccwebservices/sccsearch/docs/SCC-IntroToSCCs_2021.pdf (accessed on 14 March 2023).
  24. Pełka, G.; Ciapała, B.; Kaczmarczyk, M.; Będkowska, A.; Malik, D.; Luboń, W.; Podlweska, E.; Kaczmarczyk, M. Niska Emisja—Efektywność Energetyczna w Gminach i Samorządach—Monografia; Globenergia sp. z o.o.: Kraków, Poland, 2017. [Google Scholar]
  25. Sejmik Województwa Małopolskiego. Uchwała Nr XXXIX/612/09 z Dnia 21 Grudnia 2009 r; Sejmik Województwa Małopolskiego: Krakow, Poland, 2009. [Google Scholar]
  26. Rada Miasta Krakowa. Uchwała nr C/2707/22 z dnia 23 Listopada 2022; Rada Miasta Krakowa: Kraków, Poland, 2022. [Google Scholar]
  27. Najwyższa Izba Kontroli. Informacja o wynikach kontroli: OCHRONA POWIETRZA PRZED ZANIECZYSZCZENIAMI; Supreme Audit Office: Warsaw, Poland, 2014; pp. 1–280. Available online: https://www.nik.gov.pl/kontrole/wyniki-kontroli-nik/pobierz,lkr~p_17_078_201709271210561506514256~02,typ,kk.pdf (accessed on 21 March 2023).
  28. Sejmik Województwa Małopolskiego. Uchwała Nr XXV/373/20 z dnia 28 września 2020 r. w sprawie Programu ochrony powietrza dla województwa małopolskiego; Regional Council of Małopolska: Krakow, Poland, 2020; pp. 1–393. Available online: http://edziennik.malopolska.uw.gov.pl/WDU_K/2020/6337/akt.pdf (accessed on 21 March 2023).
  29. CLARS. Urban Access Regulations in Europe. Available online: https://urbanaccessregulations.eu/ (accessed on 21 March 2023).
  30. Giechaskiel, B.; Riccobono, F.; Vlachos, T.; Mendoza-Villafuerte, P.; Suarez-Bertoa, R.; Fontaras, G.; Bonnel, P.; Weiss, M. Vehicle Emission Factors of Solid Nanoparticles in the Laboratory and on the Road Using Portable Emission Measurement Systems (PEMS). Front. Environ. Sci. 2015, 3, 82. [Google Scholar] [CrossRef]
  31. Tomašek, I.; Horwell, C.J.; Bisig, C.; Damby, D.E.; Comte, P.; Czerwinski, J.; Petri-Fink, A.; Clift, M.J.D.; Drasler, B.; Rothen-Rutishauser, B. Respiratory hazard assessment of combined exposure to complete gasoline exhaust and respirable volcanic ash in a multicellular human lung model at the air-liquid interface. Environ. Pollut. 2018, 238, 977–987. [Google Scholar] [CrossRef]
  32. European Commission. Well-to-Wheels Analyses. EU Science Hub, 2016. Available online: https://joint-research-centre.ec.europa.eu/welcome-jec-website/jec-activities/well-wheels-analyses_en (accessed on 1 March 2023).
  33. European Comission. REGULATION (EU) 2019/631 OF THE EUROPEAN PARLIAMENT AND OF THE COUNCIL of 17 April 2019; European Union: Belgium, Brussels, 2019; pp. 1–41. Available online: https://eur-lex.europa.eu/legal-content/EN/TXT/PDF/?uri=CELEX:32019R0631 (accessed on 28 March 2023).
  34. European Commission. COMMISSION REGULATION (EU) 2018/1832 of 5 November 2018; European Union: Belgium, Brussels, 2018. [Google Scholar]
  35. Brzeżański, M.; Rodak, Ł. Influence of the method of creating a hydrogen-air mixture on the emission of nitrogen oxides in a spark-ignition engine. Combust. Engines 2019, 178, 224–227. [Google Scholar] [CrossRef]
  36. Ministry of Environment. ROZPORZĄDZENIE MINISTRA GOSPODARKI 1 z dnia 9 października 2015 r. w sprawie wymagań jakościowych dla paliw ciekłych; Ministry of Environment: Warsaw, Poland, 2015. Available online: https://isap.sejm.gov.pl/isap.nsf/download.xsp/WDU20150001680/O/D20151680.pdf (accessed on 28 March 2023).
  37. Giechaskiel, B.; Lähde, T.; Clairotte, M.; Valverde, V.; Pavlovic, J.; Suarez-Bertoa, R.; Grigoratos, T.; Zardini, A.A.; Perujo, A.; Marotta, A.; et al. Post Euro 6/VI activities focusing on particle number. SAE World Congr. Exp. 2019. [Google Scholar] [CrossRef]
  38. Di Iorio, S.; Catapano, F.; Sementa, P.; Vaglieco, B.M.; Nicol, G.; Sgroi, M.F. Sub-23 nm Particle Emissions from Gasoline Direct Injection Vehicles and Engines: Sampling and Measure. SAE Tech. Pap. 2020, 0396, 1–9. [Google Scholar] [CrossRef]
  39. Giechaskiel, B.; Mamakos, A.; Woodburn, J.; Szczotka, A.; Bielaczyc, P. Evaluation of a 10 nm Particle Number Portable Emissions Measurement System (PEMS). Sensors 2019, 19, 5531. [Google Scholar] [CrossRef] [PubMed]
  40. Lähde, T.; Giechaskiel, B.; Martini, G.; Woodburn, J.; Bielaczyc, P.; Schreiber, D.; Huber, M.; Dimopoulos Eggenschwiler, P.; Fittavolini, C.; Florio, S.; et al. Reproducibility of the 10-nm Solid Particle Number Methodology for Light-Duty Vehicles Exhaust Measurements. Atmosphere 2022, 13, 872. [Google Scholar] [CrossRef]
  41. European Commission Council Regulation of the European parliament and of the council emissions and Battery durability (euro 7). Off. J. Eur. Union 2022, 0365, 1–66.
  42. Giechaskiel, B.; Melas, A.; Martini, G.; Dilara, P. Overview of vehicle exhaust particle number regulations. Processes 2021, 9, 2216. [Google Scholar] [CrossRef]
  43. European Comission Commission proposes new Euro 7 standards to reduce pollutant emissions from vehicles and improve air quality. Press Corner 2022, 6495, 10–12.
  44. Michalik, M.; Brzezański, M.; Wilczyńska-Michalik, W.; Fisior, K.; Klimas, B.; Samek, L.; Pietras, B. Characterisation of solid particles emitted from diesel and petrol engines as a contribution to the determination of the origin of carbonaceous particles in urban aerosol. IOP Conf. Ser. Mater. Sci. Eng. 2016, 148, 012079. [Google Scholar] [CrossRef]
  45. Pacura, W.; Szramowiat-Sala, K.; Macherzyński, M.; Gołaś, J.; Bielaczyc, P. Analysis of Micro-Contaminants in Solid Particles from Direct Injection Gasoline Vehicles. Energies 2022, 15, 5732. [Google Scholar] [CrossRef]
  46. Keyte, I.J.; Harrison, R.M.; Lammel, G. Chemical reactivity and long-range transport potential of polycyclic aromatic hydrocarbons—A review. Chem. Soc. Rev. 2013, 42, 9333. [Google Scholar] [CrossRef]
  47. Zhao, T.; Yang, L.; Huang, Q.; Zhang, W.; Duan, S.; Gao, H.; Wang, W. PM2.5-bound polycyclic aromatic hydrocarbons (PAHs) and nitrated-PAHs (NPAHs) emitted by gasoline vehicles: Characterization and health risk assessment. Sci. Total Environ. 2020, 727, 138631. [Google Scholar] [CrossRef]
  48. Raza, M.; Chen, L.; Leach, F.; Ding, S. A Review of particulate number (PN) emissions from gasoline direct injection (gdi) engines and their control techniques. Energies 2018, 11, 1417. [Google Scholar] [CrossRef]
  49. Szramowiat, K.; Woodburn, J.; Pacura, W.; Berent, K.; Bielaczyc, P.; Gołaś, J. Engine-generated solid particles—A case study. Combust. Engines 2018, 174, 33–39. [Google Scholar] [CrossRef]
  50. Zinsmeister, J.; Storch, M.; Melder, J.; Richter, S.; Gaiser, N.; Schlichting, S.; Naumann, C.; Schünemann, E.; Aigner, M.; Patrick, O.; et al. Soot formation of renewable gasoline: From fuel chemistry to particulate emissions from engines. Fuel 2023, 348, 128109. [Google Scholar] [CrossRef]
  51. Idzior, M. Aging of engine oils and their influence on the wear of an internal combustion engine. Combust. Engines 2021, 185, 15–20. [Google Scholar] [CrossRef]
  52. Harrison, R.M.; Allan, J.; Carruthers, D.; Heal, M.R.; Lewis, A.C.; Marner, B.; Murrells, T.; Williams, A. Non-exhaust vehicle emissions of particulate matter and VOC from road traffic: A review. Atmos. Environ. 2021, 262, 118592. [Google Scholar] [CrossRef]
  53. Air Quality Expert Group. Non-exhaust emissions from road traffic; Department for Environment Food & Rural Affairs: London, UK, 2019; pp. 1–93. Available online: https://uk-air.defra.gov.uk/assets/documents/reports/cat09/1907101151_20190709_Non_Exhaust_Emissions_typeset_Final.pdf (accessed on 4 April 2023).
  54. European Environment Agency. National Emissions Reported to the Convention on Long-Range Transboundary Air Pollution (LRTAP Convention). 2022. Available online: https://www.eea.europa.eu/data-and-maps/data/national-emissions-reported-to-the-convention-on-long-range-transboundary-air-pollution-lrtap-convention-16/folder_contents (accessed on 1 March 2023).
  55. Bandowe, B.A.M.; Meusel, H. Nitrated polycyclic aromatic hydrocarbons (nitro-PAHs) in the environment—A review. Sci. Total Environ. 2017, 581–582, 237–257. [Google Scholar] [CrossRef] [PubMed]
  56. Cochran, R.E.; Dongari, N.; Jeong, H.; Beránek, J.; Haddadi, S.; Shipp, J.; Kubátová, A. Determination of polycyclic aromatic hydrocarbons and their oxy-, nitro-, and hydroxy-oxidation products. Anal. Chim. Acta 2012, 740, 93–103. [Google Scholar] [CrossRef] [PubMed]
  57. Murray, R.; Granner, D.; Mayes, B.; Rodwell, V. Biologia Harpera, 7th ed.; PZWL: Warsaw, Poland, 2018; ISBN 978-83-200-5410-1. [Google Scholar]
  58. Bielański, A. Podstawy Chemii Nieorganicznej. Wydaw. Nauk. PWN 2010, 1, 1–546. [Google Scholar]
  59. Agency for Toxic Substances and Disease Registry (ATSDR). ToxFAQs; Centers for Disease Control and Prevention: Atlanta, GA, USA, 2023. Available online: https://www.atsdr.cdc.gov/az/a.html (accessed on 4 April 2023).
  60. Hao, X.; Zhang, X.; Cao, X.; Shen, X.; Shi, J.; Yao, Z. Characterization and carcinogenic risk assessment of polycyclic aromatic and nitro-polycyclic aromatic hydrocarbons in exhaust emission from gasoline passenger cars using on-road measurements in Beijing, China. Sci. Total Environ. 2018, 645, 347–355. [Google Scholar] [CrossRef]
  61. Borillo, G.C.; Tadano, Y.S.; Godoi, A.F.L.; Pauliquevis, T.; Sarmiento, H.; Rempel, D.; Yamamoto, C.I.; Marchi, M.R.R.; Potgieter-Vermaak, S.; Godoi, R.H.M. Polycyclic Aromatic Hydrocarbons (PAHs) and nitrated analogs associated to particulate matter emission from a Euro V-SCR engine fuelled with diesel/biodiesel blends. Sci. Total Environ. 2018, 644, 675–682. [Google Scholar] [CrossRef]
  62. Santa Cruz Biotechnology Inc. 1,4-naphthoquinone toxicity—Safety datasheet; SCBT: Santa Cruz, CA, USA, 2023; pp. 1–13. Available online: https://datasheets.scbt.com/sc-237768.pdf (accessed on 4 April 2023).
  63. Li, X.; Zheng, Y.; Guan, C.; Cheung, C.S.; Huang, Z. Effect of biodiesel on PAH, OPAH, and NPAH emissions from a direct injection diesel engine. Environ. Sci. Pollut. Res. 2018, 25, 34131–34138. [Google Scholar] [CrossRef]
  64. Hamra, G.B.; Laden, F.; Cohen, A.J.; Raaschou-Nielsen, O.; Brauer, M.; Loomis, D. Lung Cancer and Exposure to Nitrogen Dioxide and Traffic: A Systematic Review and Meta-Analysis. Environ. Health Perspect. 2015, 123, 1107–1112. [Google Scholar] [CrossRef] [PubMed]
  65. Makhniashvili, I. Nitrowe Pochodne Wielopierœcieniowych Wêglowodorów Aromatycznych w Œrodowisku. 2003; pp. 17–20. Available online: http://yadda.icm.edu.pl/baztech/element/bwmeta1.element.baztech-d695c81d-dc3d-4200-bc24-8a91b8ab1244 (accessed on 4 April 2023).
  66. Tokar, E.J.; Boyd, W.A.; Freedman, J.H.; Waalkes, M.P. Toxic Effects of Metals. In Casarett and Doull’s Toxicology: The Basic Science of Poisons, 8th ed.; McGraw-Hill Education: New York, NY, USA, 2012. [Google Scholar]
  67. Treichel, J.L.; Henry, M.M.; Skumatz, C.M.B.; Eells, J.T.; Burke, J.M. Formate, the toxic metabolite of methanol, in cultured ocular cells. Neurotoxicology 2003, 24, 825–834. [Google Scholar] [CrossRef] [PubMed]
  68. Razzaque, M.S. Phosphate toxicity: New insights into an old problem. Clin. Sci. 2011, 120, 91–97. [Google Scholar] [CrossRef] [PubMed]
  69. California Air Resource Board. Sulphates and Health; California Air Resource Board: Sacramento, CA, USA, 2023. Available online: https://ww2.arb.ca.gov/resources/sulfate-and-health (accessed on 4 April 2023).
  70. Pauling, L.; Pauling, P. Chemia; Wydawnictwo Naukowe PWN: Warsaw, Poland, 1998; Volume 5, pp. 20–370. ISBN 9788301122676. [Google Scholar]
  71. Lenntech Periodic Table—Health Effect of Elements. Available online: https://www.lenntech.com/periodic/elements/zr.htm (accessed on 4 April 2023).
  72. New Jersey Department of Health. Zirconium. In Hazardous Substance Fact Sheet; New Jersey Department of Health: Trenton, NJ, USA, 2008. Available online: https://nj.gov/health/eoh/rtkweb/documents/fs/2047.pdf (accessed on 4 April 2023).
  73. Levin, R.; Schwartz, J. A better cost:benefit analysis yields better and fairer results: EPA’s lead and copper rule revision. Environ. Res. 2023, 229, 115738. [Google Scholar] [CrossRef] [PubMed]
  74. New York State Water Resources Institute. Micropollutants & Emerging Contaminants; Cornell College of Agricultrue and Life Sciences: Ithaca, NY, USA, 2023; Available online: https://cals.cornell.edu/water-resources-institute/research-themes/legacy-emerging-contaminants (accessed on 11 April 2023).
  75. Bisig, C.; Comte, P.; Güdel, M.; Czerwinski, J.; Mayer, A.; Müller, L.; Petri-Fink, A.; Rothen-Rutishauser, B. Assessment of lung cell toxicity of various gasoline engine exhausts using a versatile in vitro exposure system. Environ. Pollut. 2018, 235, 263–271. [Google Scholar] [CrossRef] [PubMed]
  76. Überall, A.; Otte, R.; Eilts, P.; Krahl, J. A literature research about particle emissions from engines with direct gasoline injection and the potential to reduce these emissions. Fuel 2015, 147, 203–207. [Google Scholar] [CrossRef]
  77. Wang, Y.; Rong, Z.; Qin, Y.; Peng, J.; Li, M.; Lei, J.; Wu, Y.; Min, H.; Shijin, S. The impact of fuel compositions on the particulate emissions of direct injection gasoline engine. Fuel 2016, 166, 543–552. [Google Scholar] [CrossRef]
  78. Zając, P. Silniki pojazdów samochodowych. In Technik pojazdów samochodowych; Wydawnictwa Komunikacji i Łączności WKŁ: Sulejówek, Poland, 2011; Volume 1, pp. 1–399. ISBN 978-83-206-1783-2. [Google Scholar]
  79. Al-Arkawazi, S.A.F. Analyzing and predicting the relation between air–fuel ratio (AFR), lambda (λ) and the exhaust emissions percentages and values of gasoline-fueled vehicles using versatile and portable emissions measurement system tool. SN Appl. Sci. 2019, 1, 1370. [Google Scholar] [CrossRef]
  80. Hesterberg, T.W.; Lapin, C.A.; Bunn, W.B. A Comparison of Emissions from Vehicles Fueled with Diesel or Compressed Natural Gas. Environ. Sci. Technol. 2008, 42, 6437–6445. [Google Scholar] [CrossRef]
  81. Park, G.; Mun, S.; Hong, H.; Chung, T.; Jung, S.; Kim, S.; Seo, S.; Kim, J.; Lee, J.; Kim, K.; et al. Characterization of emission factors concerning gasoline, LPG, and diesel vehicles via transient chassis-dynamometer tests. Appl. Sci. 2019, 9, 1573. [Google Scholar] [CrossRef]
  82. Ntziachristos, L.; Samaras, Z. Exhaust emissions from road transport. In EMEP/EEA air pollutant emission inventory guidebook 2019; Publications Office of the European Union Location: Luxembourg, Luxembourg, 2019. [Google Scholar] [CrossRef]
  83. Aosaf, M.R.; Wang, Y.; Du, K. Comparison of the emission factors of air pollutants from gasoline, CNG, LPG and diesel fueled vehicles at idle speed. Environ. Pollut. 2022, 305, 119296. [Google Scholar] [CrossRef] [PubMed]
  84. Zhang, Y.; Song, Y.; Feng, T.; Chen, Y. Comparative Analysis of Emission Characteristics of In-Use China II-V Gasoline, Hybrid, Diesel-Fueled Vehicles. Atmosphere 2023, 14, 272. [Google Scholar] [CrossRef]
  85. Hakkarainen, H.; Aakko-Saksa, P.; Sainio, M.; Ihantola, T.; Rönkkö, T.J.; Koponen, P.; Rönkkö, T.; Jalava, P.I. Toxicological evaluation of exhaust emissions from light-duty vehicles using different fuel alternatives in sub-freezing conditions. Part. Fibre Toxicol. 2020, 17, 17. [Google Scholar] [CrossRef]
  86. Šarkan, B.; Jaśkiewicz, M.; Kubiak, P.; Tarnapowicz, D.; Loman, M. Exhaust Emissions Measurement of a Vehicle with Retrofitted LPG System. Energies 2022, 15, 1184. [Google Scholar] [CrossRef]
  87. Owczuk, M.; Matuszewska, A.; Wojs, M.K.; Orliński, P. Wpływ rodzaju paliwa stosowanego w silniku o zapłonie iskrowym na skład spalin. Przem. Chem. 2018, 1, 124–129. [Google Scholar] [CrossRef]
  88. HT Auto Desk Is CNG the right fuel for your car? Hindustan Times 2021, X, 1.
  89. Lin, Y.-C.; Li, Y.-C.; Shangdiar, S.; Chou, F.-C.; Sheu, Y.-T.; Cheng, P.-C. Assessment of PM2.5 and PAH content in PM2.5 emitted from mobile source gasoline-fueled vehicles in concomitant with the vehicle model and mileages. Chemosphere 2019, 226, 502–508. [Google Scholar] [CrossRef]
  90. Muñoz, M.; Haag, R.; Honegger, P.; Zeyer, K.; Mohn, J.; Comte, P.; Czerwinski, J.; Heeb, N.V. Co-formation and co-release of genotoxic PAHs, alkyl-PAHs and soot nanoparticles from gasoline direct injection vehicles. Atmos. Environ. 2018, 178, 242–254. [Google Scholar] [CrossRef]
  91. Jakober, C.A.; Robert, M.A.; Riddle, S.G.; Destaillats, H.; Charles, M.J.; Green, P.G.; Kleeman, M.J. Carbonyl Emissions from Gasoline and Diesel Motor Vehicles. Environ. Sci. Technol. 2008, 42, 4697–4703. [Google Scholar] [CrossRef]
  92. Riddle, S.G.; Jakober, C.A.; Robert, M.A.; Cahill, T.M.; Charles, M.J.; Kleeman, M.J. Large PAHs detected in fine particulate matter emitted from light-duty gasoline vehicles. Atmos. Environ. 2007, 41, 8658–8668. [Google Scholar] [CrossRef]
  93. Oda, J.; Maeda, I.; Mori, T.; Yasuhara, A.; Saito, Y. The Relative Proportions of Polycyclic Aromatic Hydrocarbons and Oxygenated Derivatives in Accumulated Organic Particulates as Affected by Air Pollution Sources. Environ. Technol. 1998, 19, 961–976. [Google Scholar] [CrossRef]
  94. ECOpoint Inc. Emission Standards: China. DieselNet Technol. Guid. 2023, 5, 1–4. Available online: https://dieselnet.com/standards/cn/ld.php (accessed on 1 March 2023).
  95. Kumar, V.; Kothiyal, N.C.; Saruchi; Mehra, R.; Parkash, A.; Sinha, R.R.; Tayagi, S.K.; Gaba, R. Determination of some carcinogenic PAHs with toxic equivalency factor along roadside soil within a fast developing northern city of India. J. Earth Syst. Sci. 2014, 123, 479–489. [Google Scholar] [CrossRef]
  96. World Health Organisation. Health Effects of Particulate Matter; World Health Organisation: Geneva, Switzerland, 2013. [Google Scholar]
  97. Pacura, W.; Szramowiat, K.; Berent, K.; Sławek, A.; Gołaś, J. The possibilities of GPF Surface modification in the aspect of micro-contaminants removal. Energy Rep. 2022, 8, 9261–9269. [Google Scholar] [CrossRef]
  98. Zvirin, Y.; Gutman, M.; Tartakovsky, L. Fuel Effects on Emissions. Handb. Air Pollut. Intern. Combust. Engines 1998, 16, 547–651. [Google Scholar] [CrossRef]
  99. Maricq, M.M. Engine, aftertreatment, fuel quality and non-tailpipe achievements to lower gasoline vehicle PM emissions: Literature review and future prospects. Sci. Total Environ. 2023, 866, 161225. [Google Scholar] [CrossRef] [PubMed]
  100. Lattimore, T.; Herreros, J.M.; Xu, H.; Shuai, S. Investigation of compression ratio and fuel effect on combustion and PM emissions in a DISI engine. Fuel 2016, 169, 68–78. [Google Scholar] [CrossRef]
  101. Majewski, W.A.; Khair, M.K. Diesel Emissions and Their Control; SAE International: Warrendale, PA, USA, 2006. [Google Scholar]
  102. Kamela, W.; Wojs, M.K.; Orliński, P. Calculation Method for Assessing the Storage Capacity of Nitrogen Compounds in LNT Reactors. Energies 2022, 15, 7819. [Google Scholar] [CrossRef]
  103. Vrabie, V.; Scarpete, D.; Zbarcea, O. The new exhaust aftertreatment system for reducing nox emissions OF diesel engines: Lean nox trap (LNT). A study. Trans Motauto World 2016, 1, 35–38. [Google Scholar]
  104. Wang, Y.; Raman, S.; Grizzle, J.W. Dynamic modeling of a lean NOx trap for lean burn engine control. In Proceedings of the 1999 American Control Conference (Cat. No. 99CH36251), San Diego, CA, USA, 2–4 June 1999; IEEE: New York, NY, USA, 1999; Volume 2, pp. 1208–1212. [Google Scholar]
  105. Körfer, T.; Schnorbus, T.; Holderbaum, B.; Wittka, T. Advanced, combined exhaust aftertreatment systems for light-duty diesel engines to meet next emission regulations. Intern. Combust. Engines Performance Fuel Econ. Emiss. 2013, 205–217. [Google Scholar] [CrossRef]
  106. Ren, Y.; Lou, D.; Tan, P.; Zhang, Y.; Sun, X. Emission reduction characteristics of after-treatment system on natural gas engine: Effects of platinum group metal loadings and ratios. J. Clean. Prod. 2021, 298, 126833. [Google Scholar] [CrossRef]
  107. Cooper, J.; Beecham, J. A study of platinum group metals in three-way autocatalysts. Platin. Met. Rev. 2013, 57, 281–288. [Google Scholar] [CrossRef]
  108. Yakoumis, I.; Moschovi, A.M.; Giannopoulou, I.; Panias, D. Real life experimental determination of platinum group metals content in automotive catalytic converters. IOP Conf. Ser. Mater. Sci. Eng. 2018, 329, 1–13. [Google Scholar] [CrossRef]
  109. Kim, B.S.; Jeong, H.; Bae, J.; Kim, P.S.; Kim, C.H.; Lee, H. Lean NOx trap catalysts with high low-temperature activity and hydrothermal stability. Appl. Catal. B Environ. 2020, 270, 118871. [Google Scholar] [CrossRef]
  110. Clairotte, M.; Adam, T.W.; Zardini, A.A.; Manfredi, U.; Martini, G.; Krasenbrink, A.; Vicet, A.; Tournié, E.; Astorga, C. Effects of low temperature on the cold start gaseous emissions from light duty vehicles fuelled by ethanol-blended gasoline. Appl. Energy 2013, 102, 44–54. [Google Scholar] [CrossRef]
  111. Barreau, M.; Courtois, X.; Can, F. Selective catalytic reduction of NO at low temperature using a (ethanol+ammonia) mixture over a Ag/Al2O3 + WO3/Cex-ZryO2 dual-bed catalytic system: Reactivity insight of WO3/Cex-ZryO2. Catal. Today 2020, 355, 375–384. [Google Scholar] [CrossRef]
  112. Lee, Y.; Lee, S.; Lee, S.; Choi, H.; Min, K. Characteristics of NOx emission of light-duty diesel vehicle with LNT and SCR system by season and RDE phase. Sci. Total Environ. 2021, 782, 146750. [Google Scholar] [CrossRef]
  113. Shelef, M.; McCabe, R. Twenty-five years after introduction of automotive catalysts: What next? Catal. Today 2000, 62, 35–50. [Google Scholar] [CrossRef]
  114. Czerwinski, J.; Comte, P.; Heeb, N.; Mayer, A.; Hensel, V. Nanoparticle Emissions of DI Gasoline Cars with/without GPF. SAE Tech. Pap. 2017, 1004, 1–12. [Google Scholar] [CrossRef]
  115. Van Nieuwstadt, M.; Ulrey, J. Control Strategies for Gasoline Particulate Filters. SAE Tech. Pap. Ser. 2017, 1, 1–5. [Google Scholar] [CrossRef]
  116. Hinds, W.C. Aerosol Technology, Properties Behavior and Measurement of Airborne Particles; John Wiley & Sons, Inc: Hoboken, NJ, USA, 1999; pp. 1–448. ISBN 978-1-119-49404-1. [Google Scholar]
  117. AVL. AVL Powertrain Engineering Techday # 4. Gasoline Particle Filter Development and Calibration. AVL Experience on GPF System. 2017. Available online: https://www.avl.com/documents/5490654/6605734/AVL+PTE+Techday+%234_02_GPF+Development+and+Calibration_GWolbank.pdf (accessed on 1 March 2023).
  118. Coulet, B.; Rose, D.; Boger, T.; Glasson, T. Gasoline Engines with Particulate Filters Experiences with Accumulation of Ash and Impact on Filter Performance. MTZ Worldw. 2019, 80, 42–47. [Google Scholar] [CrossRef]
  119. Rubino, L.; Piotr Oles, J.; La Rocca, A. Evaluating Performance of Uncoated GPF in Real World Driving Using Experimental Results and CFD modelling. SAE Tech. Pap. Ser. 2017, 1, 1–8. [Google Scholar] [CrossRef]
  120. Rubino, L.; Thier, D.; Schumann, T.; Guettler, S.; Russ, G. Fundamental Study of GPF Performance on Soot and Ash Accumulation over Artemis Urban and Motorway Cycles—Comparison of Engine Bench Results with GPF Durability Study on Road. SAE Tech. Pap. Ser. 2017, 1, 1–10. [Google Scholar] [CrossRef]
  121. Joshi, A.; Johnson, T.V. Gasoline Particulate Filters—A Review. Emiss. Control Sci. Technol. 2018, 4, 219–239. [Google Scholar] [CrossRef]
  122. Majewski, W.A. Gasoline particulate filters. Ecopoint Inc. Revis. 2019, 5, 1–23. [Google Scholar]
  123. Van Nieuwstadt, M.; Shah, A.; Serban, E.; Martin, D. Regeneration Strategies for Gasoline Particulate Filters; SAE International: Warrendale, PA, USA, 2019. [Google Scholar] [CrossRef]
  124. Chan, T.W.; Saffaripour, M.; Liu, F.; Hendren, J.; Thomson, K.A.; Kubsh, J.; Brezny, R.; Rideout, G. Characterization of Real-Time Particle Emissions from a Gasoline Direct Injection Vehicle Equipped with a Catalyzed Gasoline Particulate Filter During Filter Regeneration. Emiss. Control Sci. Technol. 2016, 2, 75–88. [Google Scholar] [CrossRef]
  125. Morgan, C. Platinum Group Metal and Washcoat Chemistry Effects on Coated Gasoline Particulate Filter Design. Johns. Matthey Technol. Rev. 2015, 59, 188–192. [Google Scholar] [CrossRef]
  126. Arunachalam, H.; Pozzato, G.; Hoffman, M.A.; Onori, S. Modeling the thermal and soot oxidation dynamics inside a ceria-coated gasoline particulate filter. Control Eng. Pract. 2020, 94, 104199. [Google Scholar] [CrossRef]
  127. Caillaud, S.; Courtois, O.; Delvigne, T.; Hennebert, B. Contribution of Lubricant Additives to Ash Generation on a Close-Coupled GPF. SAE Int. J. Adv. Curr. Pract. Mobil. 2020, 3, 477–484. [Google Scholar] [CrossRef]
  128. Zuo, Q.; Xie, Y.; Zhu, G.; Wei, K.; Zhang, B.; Chen, W.; Tang, Y.; Wang, Z. Investigations on a new C-GPFs with electric heating for enhancing the integrated regeneration performance under critical parameters. Energy 2021, 225, 120265. [Google Scholar] [CrossRef]
  129. Jo, S.; Cha, J.; Park, S. Exhaust emission characteristics of stoichiometric combustion applying to diesel particulate filter(DPF) and three-way catalytic converter(TWC). Energy 2022, 254, 124196. [Google Scholar] [CrossRef]
  130. Galassi, M.C.; Martini, G. Durability Demonstration Procedures of Emission Control Devices for Euro 6 Vehicles. JRC Sci. Policy Rep. 2014, 1, 1–64. [Google Scholar] [CrossRef]
  131. Pielecha, I.; Cieślik, W.; Borowski, P.; Czajka, J.; Bueschke, W. Reduction of the number of cylinders in internal combustion engines—Contemporary trends in downsizing. Combust. Engines 2014, 159, 12–25. [Google Scholar] [CrossRef]
  132. Sroka, Z.J. Work Cycle of Internal Combustion Engine Due to Rightsizing. IntechOpen 2021, 1, 1–21. [Google Scholar] [CrossRef]
  133. Society of Automotive Engineers of Japan Inc. Gasoline engines—2017 Yearbook. J. Soc. Automot. Eng. Jpn. 2017, 71, 1–11. [Google Scholar]
  134. Brzeżański, M.; Śliwiński, K. Downsizing—A new direction of automobile engine development. Combust. Engines 2004, 119, 3–11. [Google Scholar] [CrossRef]
  135. Ortiz-Soto, E.; Younkins, M. Advanced Cylinder Deactivation with Miller Cycle. MTZ Worldw. 2019, 80, 58–63. [Google Scholar] [CrossRef]
  136. Patil, C.; Varade, S.; Wadkar, S. A Review of Engine Downsizing and its Effects. Int. J. Curr. Eng. Technol. 2017, 7, 319–324. [Google Scholar]
  137. Bueschke, W.; Czajka, J.; Pielecha, I.; Cieślik, W.; Borowski, P.; Wisłocki, K. Doładowanie zakresowe nowoczesnych silników spalinowych. Logistyka 2014, 3, 849–857. [Google Scholar]
  138. Bor, M.; Idzior, M.; Karpiuk, W.; Smolec, R. Possibilities of development of internal combustion engines, including downsizing and rightsizing strategy. AUTOBUSY—Tech. Eksploat. Syst. Transp. 2019, 24, 155–160. [Google Scholar] [CrossRef]
  139. SROKA, Z.; DWORACZYŃSKI, M. Assessment of thermodynamic cycle of internal combustion engine in terms of rightsizing. Combust. Engines 2019, 178, 182–186. [Google Scholar] [CrossRef]
  140. ASTM D2699-23; American Society for Testing and Materials ASTM D2699-23 Standard Test Method for Research Octane Number of Spark-Ignition Engine Fuel. ASTM: West Conshohocken, PA, USA, 2023; pp. 1–48. [CrossRef]
  141. ASTM D2700-23; Standard Test Method for Motor Octane Number of Spark-Ignition Engine Fuel. American Society for Testing and Materials: West Conshohocken, PA, USA, 2023; Volume 05.05, pp. 1–59. [CrossRef]
  142. Rosenblatt, D.; Karman, D. GDI Engines and Alcohol Fuels. IEA-AMF Reports. 2020; pp. 1–38. Available online: https://www.iea-amf.org/app/webroot/files/file/Annex%20Reports/AMF_Annex_54.pdf (accessed on 25 April 2023).
  143. Sayin, C.; Kilicaslan, I.; Canakci, M.; Ozsezen, N. An experimental study of the effect of octane number higher than engine requirement on the engine performance and emissions. Appl. Therm. Eng. 2005, 25, 1315–1324. [Google Scholar] [CrossRef]
  144. Karavalakis, G.; Short, D.; Vu, D.; Russell, R.; Hajbabaei, M.; Asa-Awuku, A.; Durbin, T.D. Evaluating the effects of aromatics content in gasoline on gaseous and particulate matter emissions from SI-PFI and SIDI vehicles. Environ. Sci. Technol. 2015, 49, 7021–7031. [Google Scholar] [CrossRef] [PubMed]
  145. Aikawa, K.; Jetter, J.J. Impact of gasoline composition on particulate matter emissions from a direct-injection gasoline engine: Applicability of the particulate matter index. Int. J. Engine Res. 2014, 15, 298–306. [Google Scholar] [CrossRef]
  146. Hutchison, B.R.M.; Wallace, J.S. Influence of fuel volatility on particulate matter emissions from a production DISI engine. Fuel 2021, 303, 121206. [Google Scholar] [CrossRef]
  147. Therasme, O.; Volk, T.A.; Eisenbies, M.H.; Amidon, T.E.; Fortier, M.O. Life cycle greenhouse gas emissions of ethanol produced via fermentation of sugars derived from shrub willow (Salix ssp.) hot water extraction in the Northeast United States. Biotechnol. Biofuels 2021, 14, 52. [Google Scholar] [CrossRef] [PubMed]
  148. McCaffery, C.; Durbin, T.D.; Johnson, K.C.; Karavalakis, G. The effect of ethanol and iso-butanol blends on polycyclic aromatic hydrocarbon (PAH) emissions from PFI and GDI vehicles. Atmos. Pollut. Res. 2020, 11, 2056–2067. [Google Scholar] [CrossRef]
  149. Xu, L.; Wang, Y.; Liu, D. Effects of oxygenated biofuel additives on soot formation: A comprehensive review of laboratory-scale studies. Fuel 2022, 313, 122635. [Google Scholar] [CrossRef]
  150. Kruczyński, S.; Gis, W.; Orliński, P.; Sikora, M. Influence of the use of ethanol fuel on selected parameters of the gasoline engine. IOP Conf. Ser. Mater. Sci. Eng. 2018, 421, 042041. [Google Scholar] [CrossRef]
  151. Singh, P.; Sharma, S.; Undavalli, V.K.; Khandelwal, B.; Kumar, S. Unregulated emissions from oxygenated fuels. In Advancement in Oxygenated Fuels for Sustainable Development; Elsevier: Amsterdam, The Netherlands, 2023; pp. 221–240. [Google Scholar] [CrossRef]
  152. Singh, P.; Sharma, S.; Awadh, B.; Khandelwal, B. Applicability of aromatic selection towards newer formulated fuels for regulated and unregulated emissions reduction in CI engine. Fuel Process. Technol. 2020, 209, 106548. [Google Scholar] [CrossRef]
  153. Rodriguez, F.; Dornoff, J. Beyond NOx: Emission of unregulated pollutants from a modern gasoline car. Int. Counc. Clean Transp. 2019, 1–37. Available online: https://theicct.org/wp-content/uploads/2021/06/NOx_Pollutants_LDV_FV_20190503_0.pdf (accessed on 2 May 2023).
  154. Magnusson, R.; Nilsson, C.; Andersson, B. Emissions of Aldehydes and Ketones from a Two-Stroke Engine Using Ethanol and Ethanol-Blended Gasoline as Fuel. Environ. Sci. Technol. 2002, 36, 1656–1664. [Google Scholar] [CrossRef]
  155. Zervas, E.; Montagne, X.; Lahaye, J. C1—C5 organic acid emissions from an SI engine: Influence of fuel and air/fuel equivalence ratio. Environ. Sci. Technol. 2001, 35, 2746–2751. [Google Scholar] [CrossRef] [PubMed]
  156. Bock, N.R.H.; Baum, M.M.; Moss, J.A.; Castonguay, A.E.; Jocic, S.; Northrop, W.F. Dicarboxylic acid emissions from a GDI engine equipped with a catalytic gasoline particulate filter. Fuel 2020, 275, 117940. [Google Scholar] [CrossRef]
  157. Leach, F.; Chapman, E.; Jetter, J.J.; Rubino, L.; Christensen, E.D.; St. John, P.C.; Fioroni, G.M.; McCormick, R.L. A Review and Perspective on Particulate Matter Indices Linking Fuel Composition to Particulate Emissions from Gasoline Engines. SAE Int. J. Fuels Lubr. 2021, 15, 4–15. [Google Scholar] [CrossRef]
  158. Crawford, R.; Lyons, J. An Improved Index for Particulate Matter Emissions (PME) CRC Report No. RW-107-2. Coordinating Research Council. 2021; pp. 1–122. Available online: https://crcao.org/wp-content/uploads/2021/03/CRC_RW107-2_2021.03.26.pdf (accessed on 2 May 2023).
  159. Pirjola, L.; Karjalainen, P.; Heikkilä, J.; Saari, S.; Tzamkiozis, T.; Ntziachristos, L.; Kulmala, K.; Keskinen, J.; Rönkkö, T. Effects of fresh lubricant oils on particle emissions emitted by a modern gasoline direct injection passenger car. Environ. Sci. Technol. 2015, 49, 3644–3652. [Google Scholar] [CrossRef] [PubMed]
  160. Piekoszewski, W.; Tuszyński, W. Właściwości przeciwzużyciowe, przeciwzatarciowe i trwałość zmęczeniowa węzła tarcia jako efekt rodzaju i stężenia dodatków smarnościowych w oleju. Tribologia 2003, 187, 203–220. [Google Scholar]
  161. West, B.; Sluder, C.S. Lubricating Oil Consumption on the Standard Road Cycle. SAE Tech. Pap. 2013, 0884, 1–8. [Google Scholar] [CrossRef]
  162. Young, J. Chapter 8 Corrosion by Sulfur. In Corrosion Series; Elsevier: Amsterdam, The Netherlands, 2008; pp. 361–396. [Google Scholar] [CrossRef]
  163. He, X.; Li, Y.; Sjöberg, M.; Vuilleumier, D.; Ding, C.; Liu, F.; Li, X. Impact of coolant temperature on piston wall-wetting and smoke generation in a stratified-charge DISI engine operated on E30 fuel. Proc. Combust. Inst. 2019, 37, 4955–4963. [Google Scholar] [CrossRef]
  164. Wu, C.; Chen, R.; Pu, J.; Lin, T. The influence of air—Fuel ratio on engine performance and pollutant emission of an SI engine using ethanol—Gasoline-blended fuels. Atmos. Environ. 2004, 38, 7093–7100. [Google Scholar] [CrossRef]
  165. Price, P.; Twiney, B.; Stone, R.; Kar, K.; Walmsley, H. Particulate and Hydrocarbon Emissions from a Spray Guided Direct Injection Spark Ignition Engine with Oxygenate Fuel Blends. SAE Int. 2007, 0472, 776–790. [Google Scholar] [CrossRef]
  166. Sharma, N.; Agarwal, A.K. Gasoline Direct Injection Engines and Particulate Emissions. In Air Pollution and Control; Springer: Singapore, 2018; pp. 87–105. [Google Scholar] [CrossRef]
  167. Qin, J.; Li, X.; Pei, Y. Effects of Combustion Parameters and Lubricating Oil on Particulate Matter Emissions from a Turbo-Charged GDI Engine Fueled with Methanol/Gasoline Blends. SAE Tech. Pap. 2014, 2841, 1–12. [Google Scholar] [CrossRef]
  168. Liu, Q.; Guo, T.; Fu, J.; Dai, H.; Liu, J. Experimental study on the effects of injection parameters and exhaust gas recirculation on combustion, emission and performance of Atkinson cycle gasoline direct-injection engine. Energy 2022, 238, 121784. [Google Scholar] [CrossRef]
  169. Merkisz, J.; Pielecha, J. Nanoparticle Emissions from Combustion Engines; Springer: Cham, Switzerland, 2015. [Google Scholar] [CrossRef]
  170. Sher, E. Handbook of Air Pollution From Internal Combustion Engines; Elsevier: Amsterdam, The Netherlands, 1998; ISBN 9780126398557. [Google Scholar]
  171. Cieslik, W.; Borowski, P.; Pielecha, I.; Bueschke, W.; Czajka, J.; Wisłocki, K. Systemy recyrkulacji spalin we wspó ł czesnych konstrukcjach silnikowych. Logistyka 2014, 3, 1118–1127. [Google Scholar]
  172. Brzeżański, M. Emisja Toksycznych Składników Spalin w Fazie Nagrzewania Sie Silnika o Zapłonie Iskrowym z Zastosowaniem Akumulatora Ciepła; Seria Mechanika – Wydawnictwo Politechniki Poznańskiej: Krakow, Poland, 2006; Volume 1, pp. 1–150. ISBN 0860-097X. [Google Scholar]
  173. Pielecha, J.; Skobiej, K.; Gis, M.; Gis, W. Particle Number Emission from Vehicles of Various Drives in the RDE Tests. Energies 2022, 15, 6471. [Google Scholar] [CrossRef]
  174. Laskowski, P.; Zasina, D.; Zimakowska-Laskowska, M.; Orliński, P. Modelling Hydrocarbons Cold-Start Emission from Passenger Cars. Adv. Sci. Technol. Res. J. 2021, 15, 117–125. [Google Scholar] [CrossRef]
  175. Giechaskiel, B.; Valverde, V.; Kontses, A.; Suarez-Bertoa, R.; Selleri, T.; Melas, A.; Otura, M.; Ferrarese, C.; Martini, G.; Balazs, A.; et al. Effect of extreme temperatures and driving conditions on gaseous pollutants of a euro 6d-temp gasoline vehicle. Atmosphere 2021, 12, 1011. [Google Scholar] [CrossRef]
  176. Engelmann, D.; Zimmerli, Y.; Czerwinski, J.; Bonsack, P. Real driving emissions in extended driving conditions. Energies 2021, 14, 7310. [Google Scholar] [CrossRef]
  177. Brzeżański, M.; Rybarz, M. ZAGADNIENIA TWORZENIA SIĘ KONDENSATU W UKŁADZIE WYLOTOWYM SILNIKA SPALINOWEGO. Czas. Tech. Mech.—Wydaw. Politech. Krak. 2008, 8-M, 209–218. [Google Scholar]
  178. Fonseca, N.; Casanova, J.; Valdés, M. Influence of the stop/start system on CO2 emissions of a diesel vehicle in urban traffic. Transp. Res. Part D Transp. Environ. 2011, 16, 194–200. [Google Scholar] [CrossRef]
  179. Hoffman, J.; Neumann, T.; Jeworutzken, K.; Schutz, M. Electrification Start/Stop System in the Porsche Panamera Development Objectives. Electrification 2010, 112, 4–11. [Google Scholar]
  180. Silva, S.F.; Eckert, J.J.; Silva, F.L.; de Alkmin Silva, L.C.; Dedini, F.G. Modelagem e simulação de um sistema start/stop para redução de consumo de combustível e emissões de gases poluentes. Bulcher Eng. Proc. 2021, 8, 486–498. [Google Scholar] [CrossRef]
  181. Storey, J.M.; Moses-DeBusk, M.; Huff, S.; Thomas, J.; Eibl, M.; Li, F. Characterization of GDI PM during Vehicle Start-Stop Operation. SAE Int. Powertrains Fuels Lubr. Meet. 2019, 50, 1–9. [Google Scholar] [CrossRef]
  182. Lutwyche, G. Material Innovations That Are Making Vehicles Lighter; Grainger & Worrall: Bridgnorth, UK, 2021; Volume XI, pp. 1–3. [Google Scholar]
  183. Chau, K.T. Pure electric vehicles. In Alternative Fuels and Advanced Vehicle Technologies for Improved Environmental Performance; Elsevier: Amsterdam, The Netherlands, 2014; pp. 655–684. [Google Scholar] [CrossRef]
  184. Piechna, J. A Review of Active Aerodynamic Systems for Road Vehicles. Energies 2021, 14, 7887. [Google Scholar] [CrossRef]
  185. Sivak, M.; Schoettle, B. Eco-driving: Strategic, tactical, and operational decisions of the driver that influence vehicle fuel economy. Transp. Policy 2012, 22, 96–99. [Google Scholar] [CrossRef]
  186. Alessandrini, A.; Cattivera, A.; Filippi, F.; Ortenzi, F. Driving Style Influence on Car CO2 Emissions; U.S. Environmental Protection Agency: Washington, DC, USA, 2012; Volume 8, pp. 1–6. Available online: https://www3.epa.gov/ttn/chief/conference/ei20/session8/acattivera.pdf (accessed on 16 May 2023).
  187. Huang, Y.; Ng, E.C.Y.; Zhou, J.L.; Surawski, N.C.; Chan, E.F.C.; Hong, G. Eco-driving technology for sustainable road transport: A review. Renew. Sustain. Energy Rev. 2018, 93, 596–609. [Google Scholar] [CrossRef]
  188. Hoekman, S.K.; Welstand, J.S. Vehicle emissions and air quality: The early years (1940s–1950s). Atmosphere 2021, 12, 1354. [Google Scholar] [CrossRef]
  189. Magill, P.; Hutchinson, D.; Stormes, J. Hydrocarbon Constituents of Automobile Exhaust Gases. In Proceedings of the Second National Air Pollution Symposium, Menlo Park, CA, USA, 5–6 May 1952. [Google Scholar]
  190. Ligterink, N.; Mensch, P.; Cuelenaere, R.; Hausberger, S.; Leitner, D.; Silberholz, G. Correction algorithms for WLTP chassis dynamometer and coast-down testing. Earth Life Soc. Sci. 2015, R10955, 1–73. [Google Scholar]
  191. Šarkan, B.; Skrúcaný, T.; Semanová, Š.; Madleňák, R.; Kuranc, A.; Sejkorová, M.; Caban, J. Vehicle Coast-Down Method As a Tool for Calculating Total Resistance for the Purposes of Type-Approval Fuel Consumption. Sci. J. Silesian Univ. Technol. Ser. Transp. 2018, 98, 161–172. [Google Scholar] [CrossRef]
  192. European Comission. DYREKTYWA 98/69/WE PARLAMENTU EUROPEJSKIEGO I RADY z dnia 13 października 1998 r. odnosząca się do środków mających zapobiegać zanieczyszczeniu powietrza przez emisje z pojazdów silnikowych i zmieniająca dyrektywę Rady 70/220/EWG. Dz. URZĘDOWY WSPÓLNOT Eur. Eur. Union Belg. Bruss. 1999, L350/1, 1–56. Available online: https://sip.lex.pl/akty-prawne/dzienniki-UE/dyrektywa-98-69-we-odnoszaca-sie-do-srodkow-majacych-zapobiegac-67455602 (accessed on 23 May 2023).
  193. European Comission. Regulation (EU) No 168/2013 of The European Parliament and of the Council of 15 January 2013 on the approval and market surveillance of two- or three-wheel vehicles and quadricycles. Off. J. Eur. Union 2013, 60/52, 1–77. [Google Scholar]
  194. UNECE. Concerning the Adoption of Uniform Technical Prescriptions for Wheeled Vehicles, Equipment and Parts which can be fitted and/or be used on Wheeled Vehicles and the Conditions for Reciprocal Recognition of Approvals Granted on the Basis of these Prescriptions; UN Digital Library: New York, NY, USA, 2013; Volume 101, pp. 1–100. Available online: https://unece.org/fileadmin/DAM/trans/main/wp29/wp29regs/2015/R101r3e.pdf (accessed on 23 May 2023).
  195. Barlow, T.; Latham, S.; Mccrae, I.; Boulter, P. A Reference Book of Driving Cycles for Use in the Measurement of Road Vehicle Emissions; TRL: Wokingham, UK, 2009; Volume 4, pp. 1–280. [Google Scholar]
  196. Dornoff, J.; Tietge, U.; Mock, P. ON THE WAY TO “REAL-WORLD” CO2 VALUES: THE EUROPEAN PASSENGER CAR MARKET IN ITS FIRST YEAR AFTER INTRODUCING THE WLTP. ICCT White Paper. 2020. Available online: https://theicct.org/publication/on-the-way-to-real-world-co2-values-the-european-passenger-car-market-in-its-first-year-after-introducing-the-wltp/ (accessed on 23 May 2023).
  197. Tsiakmakis, S.; Fontaras, G.; Cubito, C.; Pavlovic, J.; Anagnostopoulos, K.; Ciuffo, B. From NEDC to WLTP: Effect on the Type-approval CO2 Emissions of Light-Duty Vehicles; Publications Office of the European Union: Belgium, Brussels, 2017; 50p. [Google Scholar] [CrossRef]
  198. Fontaras, G.; Zacharof, N.G.; Ciuffo, B. Fuel consumption and CO2 emissions from passenger cars in Europe—Laboratory versus real-world emissions. Prog. Energy Combust. Sci. 2017, 60, 97–131. [Google Scholar] [CrossRef]
  199. Galindo, E.; Blanco, D.; Brace, C.J.; CHappell, E.; Burke, R. Chassis Dynamometer Testing: Addressing the Challenges of New Global Legislation; SAE International: Warrendale, PA, USA, 2017; ISBN 978-0768082784. [Google Scholar]
  200. European Federation for Transport and Environment. WHO Adds Pressure for Stricter Euro-5 Standards. 2006. Available online: https://www.transportenvironment.org/discover/who-adds-pressure-stricter-euro-5-standards/ (accessed on 30 May 2023).
  201. European Commission and Council of the European Union Commission Regulation (EU) 2016/427 amending Regulation (EC) No 692/2008 as regards emissions from light passenger and commercial vehicles (Euro 6) (Text with EEA relevance). Off. J. Eur. Union 2016, 82, 1–98.
  202. European Comission Commission Regulation (EU) 2016/646 of 20 April 2016 amending Regulation (EC) No 692/2008 as regards emissions from light passenger and commercial vehicles (Euro 6). Off. J. Eur. Union 2016, 109, 1–22.
  203. Andrych-Zalewska, M.; Chlopek, Z.; Merkisz, J.; Pielecha, J. Comparison of Gasoline Engine Exhaust Emissions of a Passenger Car through the WLTC and RDE Type Approval Tests. Energies 2022, 15, 8157. [Google Scholar] [CrossRef]
  204. Weiss, M.; Paffumi, E.; Clairotte, M.; Drossinos, Y.; Vlachos, T.; Joint Research Centre (European Commission). Including Cold-Start Emissions in the Real-Driving Emissions (RDE) Test Procedure Effects; Publications Office of the European Union: Belgium, Brussels, 2017. [Google Scholar] [CrossRef]
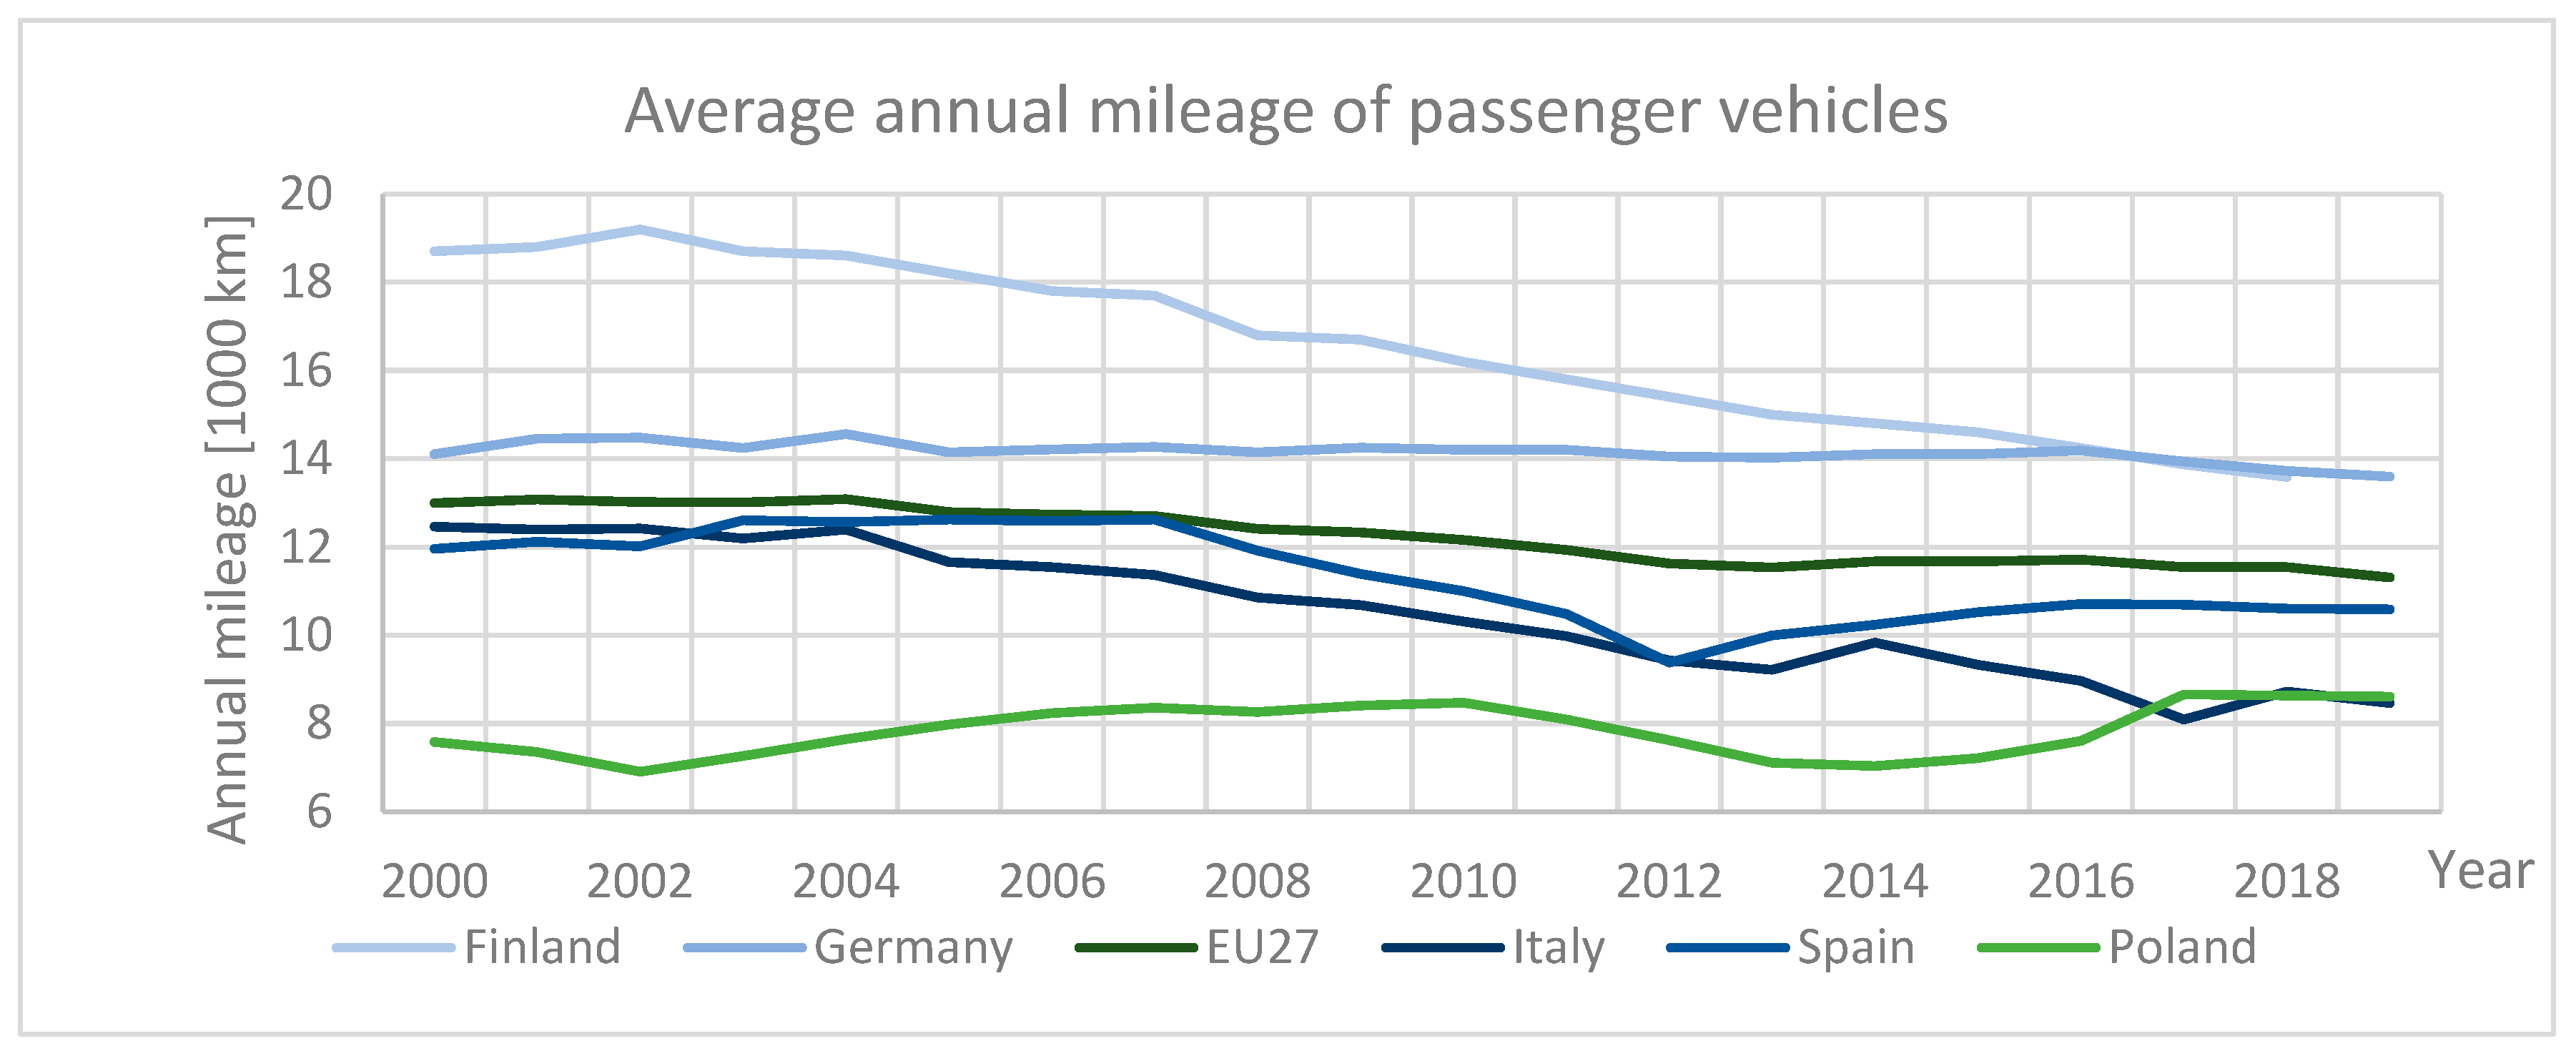
Figure 1. Average annual mileage of passenger vehicles for selected countries in 2000–2019. Reproduced data from Odysse-Mure [4].
Energies 17 00209 g001
Figure 2. Type of fuel used in vehicles sold in Europe. The other category includes natural gas, LPG, ethanol, hybrid, electric, plug-in hybrid, and BEVs. Reproduced data from ACEA [2].
Energies 17 00209 g002
Figure 3. Emission from well to wheels. Own reproduction based on [32].
Energies 17 00209 g003
Figure 4. PM10 emissions from road traffic in the years 2000–2020 in the EU-27 countries. Reproduced data from EEA [54].
Energies 17 00209 g004
Figure 5. Copper and zinc emissions from road traffic in the years 2000–2020 in EU-27 countries. Reproduced data from EEA [54].
Energies 17 00209 g005
Figure 6. Chromium and nickel emissions from road traffic in the years 2000–2020 in EU-27 countries. Reproduced data from EEA [54].
Energies 17 00209 g006
Figure 7. PAHs emissions from road traffic and the number of vehicles in the years 2000–2020 in the EU-27 countries. Reproduced data from EEA and EC [3,54].
Energies 17 00209 g007
Figure 8. Exemplary diagrams of vehicle exhaust-gas treatment systems. Green shows the systems for CI vehicles, and blue shows the systems for SI vehicles (source: own preparation).
Energies 17 00209 g008
Figure 9. Examples of cylinder layouts used in vehicles with SI engines. Engine cylinders that can be deactivated are marked in red. A inline-four engine. B RV6 (staggered six) engine. C 8 cylinder V engine. D 6 cylinder V engine. E 12 cylinder W engine. Own elaboration based on [131].
Energies 17 00209 g009
Figure 11. Speed graph during the WLTC class 3b test. Own elaboration based on [9].
Energies 17 00209 g011
Figure 12. Sample speed graph during the test in real conditions. Own study.
Energies 17 00209 g012
Table 1. Vehicle categories. Own elaboration based on [5,6].
CategoryDescription
MMotor vehicles intended for the transport of persons and luggage with at least four wheels.
M1With up to 8 seats in addition to the driver’s seat
M2With more than 8 seats, weighing less than 5 tonnes
M3With more than 8 seats, weighing more than 5 tonnes
NMotor vehicles designed to transport cargo
N1Weighing less than 3.5 tonnes
N2Over 3.5 tonnes and under 12 tonnes
N3Weighing more than 12 tonnes
OTrailers designed to transport cargo, people, or residential purposes
O1Weighing less than 750 kg
O2Weighing more than 750 kg, less than 3.5 tonnes
O3Weighing more than 3.5 tonnes, less than 10 tonnes
O4Weighing more than 10 tonnes
LTwo- or three-wheeled vehicles and some four-wheeled vehicles
TAgricultural tractors
GOff-road vehicles
RAgricultural trailers
Table 2. Comparison of Euro 6d-ISC-FCM (in-service conformity, fuel-consumption measurement) and CO2 limits for gasoline (SI) and diesel (CI) vehicles. Own reproduction based on [33].
COHCNMHCNOxHC+
NOx
PMPNCO2 (a)
[g/km][g/km][g/km][g/km][g/km][g/km][#/km][g/km]
SI1.00.100.0680.060-0.00456 × 10¹¹ (b)95
CI0.5--0.0800.1700.00456 × 101195
(a) Manufacturer’s fleet limit [33]. (b) Only for vehicles with direct fuel injection.
Table 3. Selected pollutants from vehicle traffic and their possible harmfulness. Compounds selected according to the study [45].
NamePossible Harmful EffectsSource
PAHsPAHs affect the reproductive system and make it difficult to maintain a pregnancy. The offspring can also experience the same effects while showing much more frequent defects at birth and lower body weight. These compounds are carcinogenic.[59,60,61]
Oxidized PAHs
1,4-NaphthoquinoneToxic by inhalation, irritating the eyes, respiratory system, and skin. Toxic to aquatic organisms.[62,63]
Nitro-PAH
6-Nitro
chrysene
It has a hundred times greater carcinogenic potential than chrysene. The presence of the NO2 group destroys and hinders DNA repair.[59,63,64,65]
Anions
[F ] FluoridesFluoride may cause irritation to the respiratory system, skin, and eyes.[66]
[Cl] ChloridesThe presence of chlorides may lead to irritation of the eyes and respiratory system.[59]
[Br] BromidesBromine compounds can cause restlessness, confusion, stupor, nausea, vomiting, and skin conditions such as angiomas and rashes (bromism).[59]
[HCOO] FormateFormates can cause hypoxia at the cellular level and metabolic acidosis.[67]
[NO2]
Nitrites
Excess can cause low blood pressure, accelerated pulse, headaches, stomach cramps, vomiting, and thyroid damage.[59]
[NO3]
Nitrates
Excess can cause low blood pressure, accelerated pulse, headaches, stomach cramps, vomiting, and thyroid damage.[59]
[PO4 3−]
Phosphates
Due to the high retention in the body, phosphates can lead to cell and tissue damage and negatively affect the kidneys, and circulatory and reproductive systems.[68]
[SO4 2−]
Sulphur
Sulphates can aggravate asthma by limiting lung function and have a negative effect on the heart.[69]
Metals
[Al] AluminiumExcess can lead to respiratory problems and neurological diseases.[59,66]
[Ba] BarConsuming barium-contaminated water can cause digestive problems, muscle weakness, and kidney damage.[59]
[Bi] BismuthExcess bismuth can cause damage to the kidneys, brain, and bone tissue.[59]
[Ca] CalciumResponsible for the carbonate hardness of water; in combination with sulphate, it forms gypsum.[70]
[Co] CobaltIn high concentrations, it is harmful to the respiratory and haematological systems. It exhibits carcinogenic properties.[59,66]
[Cr] ChromiumMay be carcinogenic and cause ulceration of the respiratory tract and skin.[66]
[Cu] CopperIt can be accumulated by plants. In high doses, it can cause vomiting, diarrhoea, and abdominal pain. Continued exposure may cause kidney and liver damage.[59,66]
[Fe] IronExcess iron can cause abdominal pain, diarrhoea, vomiting, metabolic acidosis, liver damage, and cardiac collapse. Iron poisoning can be fatal in children.[66]
[K] PotassiumForms strongly basic potassium hydroxide[70]
[Mg] MagnesiumResponsible for the carbonate hardness of water; magnesium oxide and sulphate have laxative properties[66,70]
[Mn] ManganeseExcess manganese negatively affects the nervous system, can cause personality changes, movement and reproductive system disorders, and is irritating to the lungs.[59,66]
[Na] SodiumForms strongly alkaline sodium hydroxide, excess leads to hypernatremia.[70]
[Nb] NiobiumAs dust can irritate the eyes and skin, niobium nitrate can cause permanent lung damage.[71]
[Ni] NickelIt causes an allergic skin reaction in 10–20% of the population. Inhalation of nickel may cause reduced lung capacity and bronchitis.[59,66]
[P] PhosphorusPhosphorus compounds can cause nausea, abdominal pain and drowsiness, and long exposure can cause osteoporosis and kidney damage.[59,71]
[S] SulphurSulphur compounds can damage the circulatory and immune systems, cause skin and eye irritation, and have a negative effect on the lungs[71]
[Sb] AntimonyInhalation of antimony-containing dust can cause abdominal pain, vomiting, diarrhoea, lung irritation, and stomach ulcers.[59]
[Si] SiliconInhalation of silicon-containing dust may cause respiratory irritation.[59]
[Ti] TitanTitanium can accumulate in the lungs, reducing their capacity; titanium dioxide can cause oxidative DNA damage.[59]
[Zn] ZincExcess can cause stomach cramps, nausea, and vomiting. Long exposure can cause anaemia.[59,66]
[Zr] ZirconMay be irritating to eyes, skin, and lungs. Prolonged exposure may cause allergic reactions and cocci.[72]
Table 4. Differences between organic and inorganic microcontaminants are listed in the literature [45,49,76,77].
MicrocontaminantsOrganicInorganic
ExamplePolycyclic aromatic hydrocarbons and their derivatives.Elements, metals, and salts.
RemovalOxidation—also catalyticNone a
creation of ash deposits
Extraction methodIn organic solvents, e.g., cyclohexaneIn acid solutions, e.g., methylsulphonic acid, HNO3
Analytical techniquesGC-MSIC, MP-AES
a—No method initiated automatically or by the user during vehicle operation.
Table 6. Studies of microcontaminants present in particulate matter from gasoline LDVs. The literature examples are based on scientific papers from 1998–2022. Own elaboration based on the listed sources.
Test ObjectEmission Standard of the Test ObjectSample SourceIdentified Microcontaminants
Pacura et al., 2022 [45]
DISI vehicles from 2017 and 2019Euro 6b–Euro 6d-TEMPPM from WLTC testsPAHs, PAHs derivatives, metals, anions +TEQ
Zhao et al., 2020 [47]
PFI and DISI vehicles from 2000–2018China 1–China 5PM from UDC testsPAHs, PAHs derivatives +TEQ
Lin et al., 2019 [89]
Gasoline LDV
from 2004–2015
Euro 3–Euro 6PM from NEDC testsPAHs
Muñoz et al., 2018 [90]
DISI vehiclesEuro 3–Euro 6PM from WLTC testsPAHs, alkyl-PAHs, soot +TEQ
Jakober et al., 2008 [91]
Gasoline LDV
from 1991–2002
PM and gas-phase carbonyls from FTP testsAldehydes, ketones, dicarbonyls
Riddle et al., 2007 [92]
Gasoline LDV
from 1991–2002
PM from FTP testsPAHs
Oda et al., 1998 [93]
Gasoline LDV
(pre–1998)
PM scrapped from exhaust pipePAHs, PAHs derivatives
Table 7. Selected parameters of the engine used to determine the octane number. Reproduced data from ASTM [140,141].
UnitRONMON
StandardASTM D2699ASTM D 2700
Engine rotationrpm600 ± 6900 ± 9
Opening the intake valve°CA10
Closing the intake valve214 ± 2.5
Ignition angle347334
Opening the outlet valve500
Closing the discharge valve735 ± 2.5
oil temperature°C57 ± 8
Air temperature52 ± 138 ± 2.8
Air humiditygH2O/kg air3.56–7.12
Table 8. Research value and motor octane number for selected antiknock additives (alcohols and ethers) used in automotive gasoline. Own elaboration based on [142].
AdditiveMeOHEtOHMTBEETBETAMETAEEDIPE
RON131128119114113112105
MON102103101991009398
Table 9. The influence of the degree of exhaust-gas recirculation on the emission of nitrogen oxides, carbon monoxide, and hydrocarbons. Own elaboration based on [170].
EGR [%]NOx [g/h]CO [g/h]HC [g/h]
0115215
1080215
2035256
40612018
Table 10. Comparison of the selected parameters of NEDC and WLTC tests of different classes. Own elaboration based on [9,194].
Selected Parameters of Driving Cycles
TestNEDCWLTC 3bWLTC 3aWLTC 2WTLC 1
Parameters of the Tested Vehicle
Power to weight (W/kg)>34>3422–34≤22
Max. speed of vehicle (km/h)≥120<120
Test Parameters
Time (s)11801800180018001611
Distance (km)10.9323.2723.1922.6511.43
Average speed with stops (km/h)33.3546.5346.4045.3125.56
Average speed without stops (km/h)43.1051.3551.1750.0032.17
Maximum speed (km/h)120.0131.3131.3123.164.4
Maximum acceleration (m × s−2)1.041.581.580.960.76
Stop duration (%)22.613.413.413.322.1
Total stop time (s)267242242240356
“–” means that there are no defined requirements.
Table 11. Real driving emission test guidelines. Own elaboration based on [34].
Road Requirements
Duration 90–120 min
DistanceUrban>16 km each
Rural
Motorway
Trip compositionUrban29–44% of the total distance
Rural23–43% of the total distance
Motorway
Average speedUrban15–40 km/h
Rural60–90 km/h
Motorway>90 km/h
>100 km/h for min. 5 min
Boundary Conditions of A Correct Test
Payload ≤90% max. weight
AltitudeModerate a0–700 m above sea level
Extended b700–1300 m above sea level
Altitude difference <100 m (start–finish)
Cumulative altitude gain 1200 m/100 km
Ambient temperatureModerate a0–30 °C
Extended b−7–0 °C; 30–35 °C
Use of auxiliary systems Used as in real life
a The vehicle must meet emission limits. b The vehicle must meet the emission limits divided by a factor of 1.6. The rule does not apply to CO2 emissions [9].
Disclaimer/Publisher’s Note: The statements, opinions and data contained in all publications are solely those of the individual author(s) and contributor(s) and not of MDPI and/or the editor(s). MDPI and/or the editor(s) disclaim responsibility for any injury to people or property resulting from any ideas, methods, instructions or products referred to in the content.