Abstract
The efficiency of supersonic combustion is largely dependent on inlet and injection parameters. Additional energy input is required in some off-design conditions, and nanosecond discharge actuation can be a solution. In the present study, a phenomenological model of a nanosecond-pulsed surface dielectric barrier discharge (NS-SDBD) actuator was developed to analyze the combustion enhancement effect for a supersonic combustor with transverse H2 injection. A seven-reaction H2–air combustion model was adopted for the numerical simulation. Dynamic mode decomposition (DMD) was employed to acquire temperature perturbation in spatial and temporal domains. The results show that the actuator provides additional temperature-increment and species transportation through compression waves. The combustion enhancement effect is mainly attributed to the flow perturbation in the shear layer, which promotes the turbulent diffusion of fuel. Given the same power input, the combustion efficiency at the shockwave reflection point is increased by 17.5%, and the flame height is increased by 15.4% at its maximum.
1. Introduction
A supersonic combustor is a vital component of scramjet engines, one which directly determines the propulsion performance of hypersonic flight. Supersonic mixing and combustion take place within only a few milliseconds [1], making it difficult to control the flow field under off-design conditions. Some measures have been taken to enhance supersonic mixing/combustion, such as the use of a vortex generator [2], pulsed injection [3], etc. In recent years, plasma techniques have shown great potential in scramjet active flow control, since it is more effective and controllable by directly inputting electric power. Compared with DC or AC input [4], the nanosecond-pulsed discharge waveform is considered to be more efficient in controlling supersonic flow structure because it provides stronger pressure and temperature perturbations. Two types of nanosecond-pulsed actuators are commonly adopted in experimental research, namely, the nanosecond spark discharge actuator and the nanosecond-pulsed surface dielectric barrier discharge (NS-SDBD) actuator [5,6], which show similar effects for supersonic flow control. Studies have shown that nanosecond discharge is able to control detached shockwaves [7] and increase the instability of the cavity shear layer in supersonic flow [8], proving the feasibility of this actuation method.
Various numerical models have been proposed to depict the near-wall energy distribution and flow perturbation caused by a nanosecond-length discharge. In terms of NS-SDBD actuators, the modelling strategy mainly includes the coupling method [9,10] and the phenomenological method [11]. The coupling method focuses on the effects of electric field and plasma chemical reactions within the extremely small scales of space and time, and then considers the thermal effect on the flow field within a larger scale. Contrastingly, the phenomenological method mainly considers flow perturbations caused by the actuator. The distribution of thermal energy is usually derived from experimental data, which means that the computational cost is greatly reduced. Hence, it is much more practicable to analyze engineering flow problems at a larger spatial and temporal scale. Kinefuchi [12] simplified the plasma region, making it a Gaussian distribution of temperature. Numerical simulation results illustrated that an NS-SDBD actuator is able to shorten the separation zone triggered by a shockwave–boundary layer interaction. Zheng [13] proposed an 1D self-similar DBD model and conducted numerical simulations of supersonic flow control. The distortions of background shockwaves were observed, and attributed to the compression waves generated by the actuator.
Except for flow control, nanosecond-discharge actuators are also widely used in the field of plasma-assisted combustion, which is a promising technology used for stabilizing the flame propagation and increasing the combustion efficiency [14]. Compared with plasma jets [15], nanosecond-discharge actuators input less power and show stronger unsteadying effects. Shcherbanev [16] carried out experiments on H2–air ignition by nanosecond discharge. They mainly focused on the minimum ignition energy and ignition delay time in quiescent conditions. Sharma [17] performed a fully coupled modelling of nanosecond-pulsed ignition of a lean H2–air mixture. The fractions of active species are calculated precisely, neglecting the influence of convection transport. As for supersonic combustion, the interaction between nanosecond discharge and air flow should be addressed. Meng [18] conducted an experimental study of plasma-assisted supersonic combustion using gliding arc discharge. The results show that plasma free-radical mechanisms cause changes to combustion modes. Aiming at improving the performance of the scramjet engine, Zhou [19] conducted a numerical study through a quasi-steady plasma model, pointing out that the additional mass transportation is due to the thermal blocking effect of the plasma region. While, in other experimental studies, supersonic combustion has been enhanced by repetitive pulses [20,21]. Under repetitive-pulsed control, the question of mass transportation of fuel requires further investigation. This research aims to explain the combustion enhancement process of repetitive actuation in view of plasma heating and diffusion enhancement. An NS-SDBD phenomenological model is introduced in order to simulate the process of flow perturbation. A typical H2–air combustion flow by transverse injection is simulated. Furthermore, the spatial and temporal features of flow perturbation are discussed in detail. In the end, the combustion enhancement effects are assessed under different actuating conditions.
2. Models and Methods
2.1. Governing Equations
Based on the studies of dimensionally-reduced models of DBD actuators [22] and supersonic combustors [23], the flow-control process in a supersonic combustor can be depicted by two-dimensional unsteady Navier–Stokes equations. For a control volume element in the computational domain, the N-S equations can be expressed in integral form:
where ρi represents the density of the ith species; u and v stand for velocity along the x and y axis, respectively; un is the velocity normal to the surface of the control volume; nx and ny are the components of the unit normal vector in the x and y directions, respectively; E and H represent the total energy and total enthalpy, respectively; p is the static pressure of the mixture, obeying perfect gas assumptions; Φ stands for diffusion terms, obeying Fick’s law; τxx, τxy, τyx, and τyy are shear stresses; Θx and Θy are heat transfer terms, which are calculated by Fourier’s law; represents the mass production rate of the ith species; Sh represents the energy source term of the nanosecond discharge region, which will be given in Section 2.2.
The diffusion terms and heat transfer terms are expressed as follows:
where , represent mass fraction and enthalpy of the ith species, respectively. represents the heat conductivity coefficient. stands for the diffusion coefficient of the ith species, which is the sum of laminar diffusion and turbulent diffusion:
where is laminar diffusion coefficient, computed by kinetic theory. Sct is the turbulent Schmidt number. represents the turbulent viscosity coefficient, which is calculated by the SST k-ω model. The SST k-ω model has been proved feasible for simulating supersonic air flow with transverse injection [16,24].
In this paper, supersonic H2–air combustion is simulated by a 7 species–7 reactions model proposed by Shang [25]. Compared with detailed reaction models, this reduced model mainly neglects the influence of HO2, which becomes dominant in the thermally choked state [26]. After comprehensive consideration, the reduced chemistry is proved acceptable for the test conditions in this paper. The forward chemical reaction rate of the present model is expressed by Arrhenius’s formula, i.e., kf = Af−Ea/RT (unit: cm3/(mol·s). The constant terms are listed in Table 1.

Table 1.
H2 combustion model.
In our present code, convective flux was discretized in a second-order AUSM+ scheme. Viscous flux was calculated by a central difference scheme. The second-order dual-time method was applied, with a physical time-step size of 5 × 10⁻⁹ s.
2.2. Nanosecond Discharge Model
Previous studies of NS-SDBD actuators have demonstrated that the fast-heating effect [27,28] is the main source of flow perturbation. Based on this finding, the plasma layer generated by a nanosecond discharge can be regarded as a thermal power source in numerical simulations. The source term Sh can be modeled by the phenomenological method as follows:
where EI(x,y) represents the spatial energy distribution function. The integral of the spatial distribution function is denoted by EIt. Ein represents spanwise energy input per unit length (unit: mJ/cm). f(x), g(y) represents horizontal and vertical distribution functions fitted from the experimental data [29], which are shown in Figure 1. td stands for pulse duration. η represents the proportion of injected electrical energy used for gas heating, which is around 30% [30]. The length and thickness of the plasma layer are denoted by l and h, respectively, which are inversely proportional to the square root of local pressure [31]. Under 1 atmospheric pressure, l = 5 × 10⁻³ m, h = 1 × 10⁻³ m.

Figure 1.
Spatial distribution functions: (a) horizontal distribution function; (b) vertical distribution function.
The nanosecond-pulse perturbation in quiescent atmospheric air was calculated by the above method and was compared with the results from [32,33]. The electrode is located at x = 9 mm, as shown in Figure 2. The pulse energy is 0.1955 mJ/cm, and the pulse duration is 50 ns. The power density at the electrode reaches 1.173 × 10¹³ W/m3, which agrees well with the results from [33]. In this case, the initial static temperature was set to 300 K.
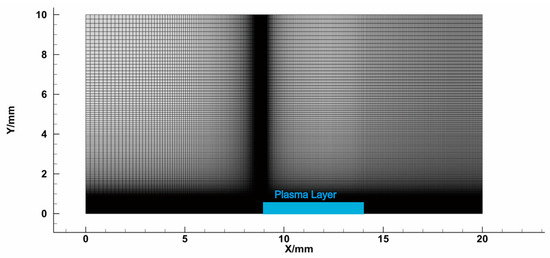
Figure 2.
Computational domain of the NS-SDBD validation case.
The comparison of density gradient between the numerical simulation and the experiment is given in Figure 3. The present method captured hemispherical compression wave structure as well as the near-wall heating area. Figure 4 shows the vertical position of the compression wave at different instants of time. It can be inferred that the calculated wave speed matches well with the experimental results. Furthermore, the distribution of static pressure calculated by the phenomenological method is illustrated in Figure 5, with less than 10.5% difference as compared to the results of the reduced chemical model [33]. The present model demonstrated a similar strength of the compression wave, and the discrepancy in the expansion zone can be attributed to the differences within the spatial energy distribution patterns. It can be determined that the present method is acceptable for analyzing the flow-perturbation effects of compression waves.

Figure 3.
Comparison of density gradients [32].
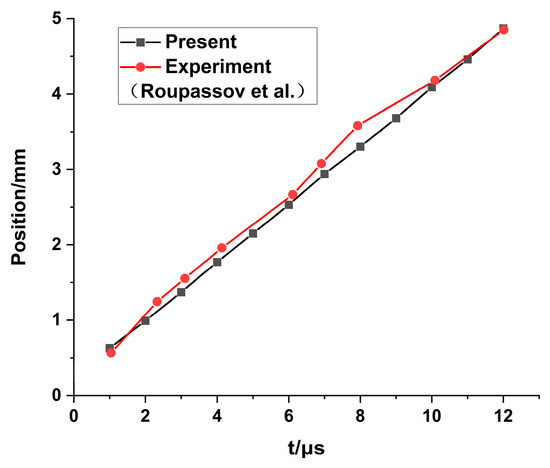
Figure 4.
Vertical position of compression wave at different instants of flow time [32].

Figure 5.
Horizontal pressure distribution at Y = 0.07 mm, t = 1 μs [33].
2.3. Geometry and Boundary Conditions
In this paper, a supersonic combustor with symmetric transverse-injection is investigated. The model’s dimensions, as well as the boundary conditions, are illustrated in Figure 6. The computational domain is 55 mm in length, and the half-height is 10 mm. The injector nozzle is located at the origin, which is 0.25 mm in width. Pure hydrogen gas is vertically injected into the main flow. The inlet and jet conditions are given in Table 2.
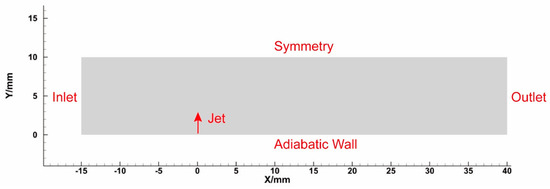
Figure 6.
Computational domain of the supersonic combustor.
Table 2.
Inlet and jet conditions.
Three sets of structural grids are generated in order to guarantee the precision of the numerical simulation. The total cell numbers are 300,000, 600,000, and 1,200,000, respectively, corresponding to M1 (coarse grid), M2 (medium grid), and M3 (fine grid). It can be seen from Figure 7 that the discrepancy of wall pressure is negligible between case M2 and case M3, ultimately reaching a grid-independent condition. To balance accuracy and computational efficiency, case M2 is selected for further discussions of the simulation’s results.
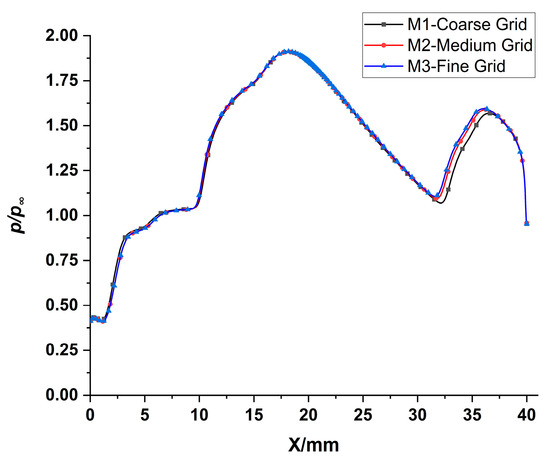
Figure 7.
Grid convergence of wall pressure (coarse grid, medium grid, and fine grid).
3. Results and Discussion
3.1. Baseline Combustion Flow
The supersonic H2–air combustion flow was calculated based on the flow parameters given in Section 2.3, and the baseline flow structure is illustrated in Figure 8. The first separation shock (S1) appears at a point about 5 mm upstream of the nozzle, due to the strong inverse pressure gradient induced by the transverse jet. The reflected shockwave (R1) interacts with the boundary layer at x = 15 mm, resulting in a separation zone and a separation shock (S2), as is shown in Figure 8a. The second reflected shockwave (R2) shows a stronger boundary-layer interaction (at x = 34 mm) than R1, which leads to a higher temperature rise and a more efficient combustion zone, illustrated in Figure 8b,c respectively. It is notable that a low-temperature shear layer is formed due to cold H2 injection, and becomes thickest at the horizontal section 15 mm downstream from the injector.
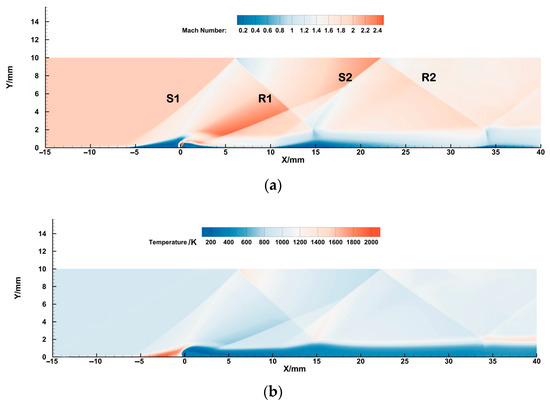

Figure 8.
Flow parameters of baseline conditions: (a) Mach number (S1, S2 are separation shockwaves. R1, R2 are reflection shockwaves); (b) static temperature; (c) mass fraction of H2O.
3.2. Perturbation Characteristics of Nanosecond-Pulsed Control
In order to enhance the shock-induced combustion in the reflection region (induced by R1), an NS-SDBD actuator is placed at x = 15 mm, as is shown in Figure 9. The spanwise energy input is 0.6 mJ/cm per pulse. The actuator works at a frequency of 50 kHz, with a pulse duration of 50 ns. Two monitor points are located in the shockwave reflection area, at points marked as Point 1 (x = 15 mm, y = 2 mm), and Point 2 (x = 34 mm, y = 2 mm), respectively. A monitor line is located at x = 15 mm.
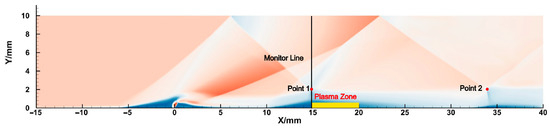
Figure 9.
Schematic of actuating location.
3.2.1. Temporal Variations of the Combustion Flow Field
After exerting NS-SDBD actuation to the baseline flow field, temporal changes of local temperature were monitored, as is shown in Figure 10. At shock-reflection Point 1, local temperature gradually increases in the first cycle, and then enters a periodic perturbating state, with a maximum rise of 27 K. The temperature increment amplitude is about 17 K at the downstream monitor point, showing a weaker compression effect. Since the compression and expansion waves propagate downstream at different wave speeds, the perturbation frequency becomes higher in the downstream area. It can be determined that the flow perturbations turn into a state of equal-amplitude oscillation within the flow time period of 100–200 μs. To study the spatial distribution features of the periodic state, the tenth actuation cycle (180–200 μs after the first discharge) is selected for further analysis, and the time of the tenth discharge is defined as the t = 0 moment.
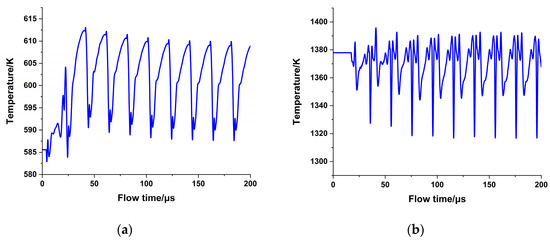
Figure 10.
Temperature response of NS-SDBD actuation: (a) Point 1; (b) Point 2.
Compression waves are induced by nanosecond-pulsed actuation and interact with the flow field, a sequence which can be clearly observed in Figure 11. In the upstream region, the compression wave interacts with the shear layer at t = 1–2 μs, exerting an additional density gradient. Then, it propagates into the main flow and exerts perturbation upon the reflected shockwave. As is shown in the dashed region of Figure 11a, the shape of the compression wave changes through time, gradually extending the length of the trailing edge. The forward compression wave is finally merged with the background shock wave, while the backward part penetrates the shear layer. Another branch of density perturbation is triggered by additional turbulence energy in the shear layer, which is illustrated in the dashed region of Figure 11b. The actuator exerts weaker perturbation upon the downstream shear layer, while the former compression wave propagates in the main flow but adds little disturbance to the shockwave structure. In the downstream region, the compression wave no longer interacts with the shear layer, as pointed out by the red arrows in Figure 11b. Note that the compression disturbance mainly occurs in the first half of the cycle, while the local flow parameter gradually recovers to its original state in the second half of the cycle.
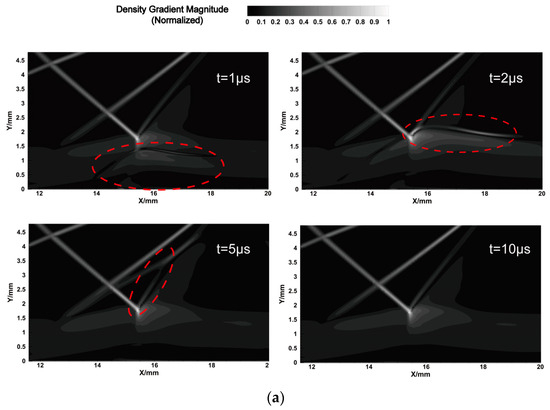

Figure 11.
The variation of the density gradient magnitude (red circles stand for the affected zone of present compression wave): (a) upstream reflection region; (b) downstream reflection region.
In a single actuation cycle, the vertical temperature distribution around the actuator is monitored, as is shown in Figure 12. It can be seen that the near-wall heating effect results in a strong temperature rise in the plasma region (y = 0~1 mm). The zoomed-in region shows the temperature distribution in the outer edge of the shear layer. The local temperature rises within 1 μs, and then recovers to background temperature. According to the analysis in Figure 11a, it can be seen that the compression wave increases the temperature at the outer edge of the shear layer, bringing an additional heating effect. Such a slight increment might be more conducive to combustion, compared with the direct near-wall heating effect, since the combustion performance depends on local temperature to a greater extent near the stoichiometrically mixed area, a topic which will be discussed in the next section. Figure 13 compares the distribution of combustion products between the baseline flow and a nanosecond-pulse-controlled status. The temperature increments result in a higher rate of production of H2O, promoting combustion in the area of interest. The additional generation of H2O happens to a greater degree in the middle and upper sides of the shear layer.
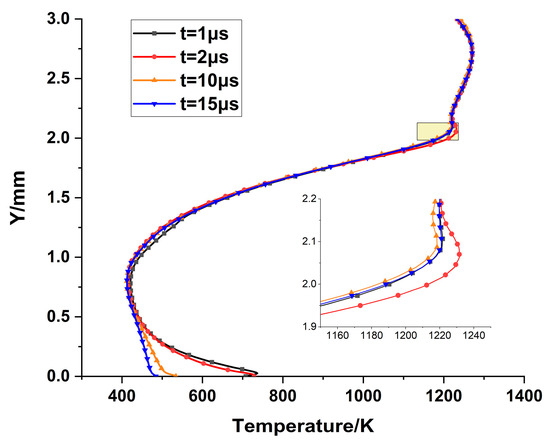
Figure 12.
Static temperature at the x = 15 mm section.
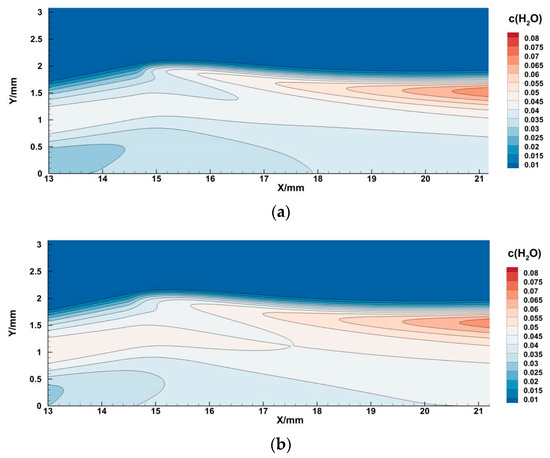
Figure 13.
Local mass fraction of H2O: (a) baseline (uncontrolled) flow; (b) flow with NS-SDBD control.
3.2.2. Mass-Transportation Enhancement Effects
To further investigate the mass-transportation effects of NS-SDBD actuations (especially the transportation process of fuel), a cold flow case (without the reaction source terms) was conducted. The distribution of the turbulent viscosity ratio (i.e., ) at the y = 1.5 mm section is shown in Figure 14, where and represent turbulent viscosity and laminar viscosity, respectively. Compared with the baseline status, there is an increase in the turbulent viscosity ratio downstream of the actuator (x = 15–40 mm), which can be attributed to the perturbation of repetitive compression waves. In other words, the nanosecond-pulsed actuations inject energy into turbulent shear layer, increasing turbulent viscosity and promoting the resultant turbulent transportation. Note that the turbulence viscosity in the shear layer changes drastically due to the shockwaves in the main flow. Under the effects of repetitive compressions, the shockwave interaction zones move upstream, in contrast to the non-controlled case.
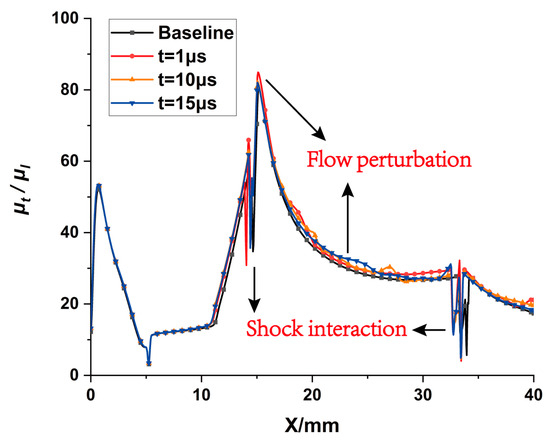
Figure 14.
Turbulent viscosity ratio at the Y = 2 mm section (non-reacting case).
The spatial distribution characteristics of fuel (cold flow) are plotted in Figure 15. From Figure 15a, one can determine that the mass fraction of H2 increases at 1 μs after actuation because of the mass-transportation effect, then recovers to baseline status in the second half of the cycle. Figure 15b shows the stoichiometric lines of the flow field (contour line, c(H2) = 0.029), where the complete combustion condition is achieved, in the case of hydrogen fuel. In Figure 15b, the diffusion height of hydrogen is increased in the downstream region (x = 30–40 mm), as indicated by a few subsequent peaks of the stoichiometric line. Comparing with the figure above, it can be found out that the variations of stoichiometric lines correspond to the changing patterns of the turbulent viscosity ratio, which indicates that the extra diffusion of hydrogen fuel is the result of enhanced turbulent transportation. Under the condition of repetitive NS-SDBD actuations, hydrogen fuel diffuses into the main flow to a greater extent.
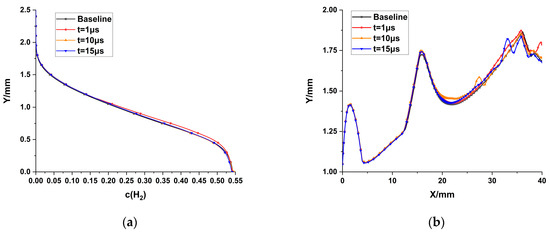
Figure 15.
Distribution characteristics of hydrogen fuel in the non-reacting case: (a) mass fraction of H2 at x = 18 mm section; (b) stoichiometric line.
3.3. The Influences of Actuating Conditions
In this section, the various influences of the controlled conditions on the combustion-enhancement effect are discussed. All of the actuating conditions are listed in Table 3. Compared to Case 1, the input power is doubled in Case 2.1, Case 2.2, and Case 2.3, corresponding to increased input energy, increased actuating frequency, and an increased number of actuators, respectively. The upstream actuator is located at x = 15 mm, and the downstream actuator is placed at x = 20 mm.
Table 3.
Actuating conditions.
The spatial distribution characteristics of the actuation schemes differ from each other. Figure 16 depicts the temperature increment of the flow field by performing dynamic mode decomposition (DMD) [34]; the basic wave modes are displayed. In the vicinity of the actuator, the temperature perturbations penetrate the shear layer and propagate into the main flow. In the downstream region, however, the rises in temperature mainly take place in the outer edge of the shear layer, where the hydrogen fuel is well-mixed with air. Compared to Case 1, Case 2.1 inputs more energy per pulse, inducing stronger compression waves and leading to a higher temperature rise in the shear layer. Case 2.2 shows a more continuous spatial distribution pattern because of the increase in the actuating frequency. As for Case 2.3, the temperature perturbations tend to accumulate at the near-wall region rather than at the outer edge of the shear layer, meaning that less energy is injected into the combustion region.
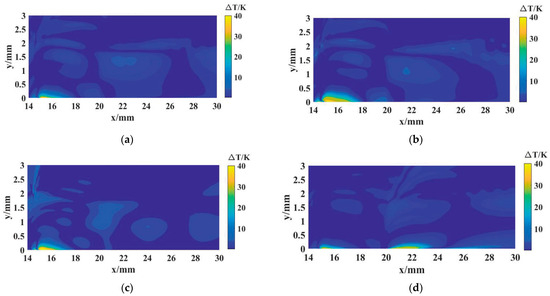
Figure 16.
Spatial distribution of temperature increments: (a) Case 1; (b) Case 2.1; (c) Case 2.2; (d) Case 2.3.
In order to assess the combusted amount of H2, here we define Qc as the combustion flow rate of a certain cross section:
Figure 17 compares the combustion flow rate of time-averaged flow field for each case. With the heating effect of the actuators, local temperature is increased, resulting in a higher production rate of gaseous H2O. Compared with baseline case, the combustion flow rate is increased by 17.5% at its maximum with nanosecond-pulsed actuation, corresponding to Case 2.2. It can be inferred that the actuating frequency contributes most to combustion enhancement, given equivalent power inputs. In terms of a certain actuation case, the maximum combustion enhancement occurs at the shockwave reflection region (near Line 1). The increments of the change in the combustion flow rate gradually decrease in the downstream sections due to the attenuation of the compression waves.
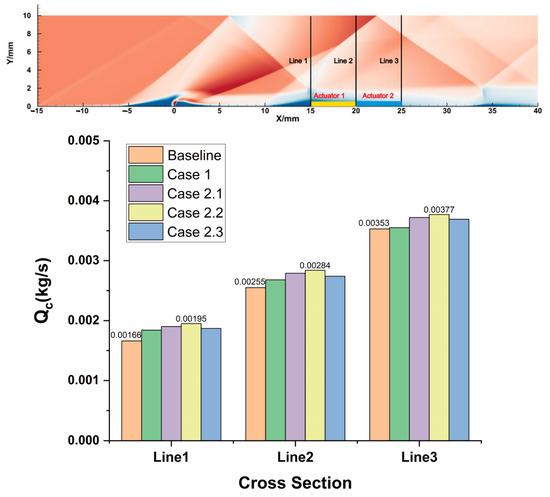
Figure 17.
Comparison of combustion flow rate.
To quantify the combustion region of the flow field, the contour points of c(OH) = 0.1% define the boundary of the flame region. Figure 18 shows the flame boundary of the time-averaged flow field. It can be seen that the combustion range is enlarged, as compared with the non-controlled case. This phenomenon can be attributed to mass-transportation enhancement, as well as local temperature increments. Compared with the other cases, Case 2.1 and Case 2.3 inject more energy into the turbulent shear layer in each pulse, giving rise to a stronger turbulent diffusion. Consequently, the peaks appear to be higher than the other cases in the figure, and the flame height is raised up by about 15.4% at its maximum.
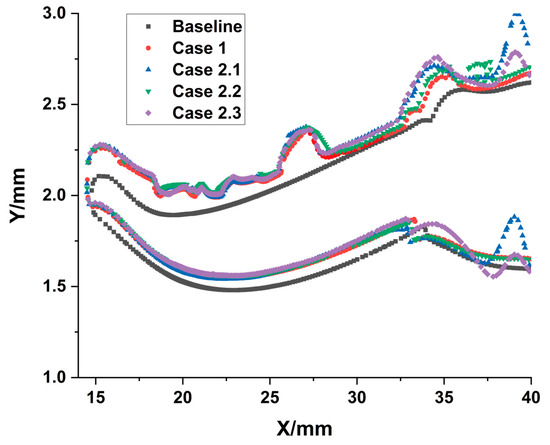
Figure 18.
Comparison of the combustion region (contour points of c(OH) = 0.1%).
4. Conclusions
In this paper, the performance of supersonic H2 combustion is improved by applying repetitive NS-SDBD actuations. A phenomenological model was proposed to simulate the flow perturbation induced by repetitive nanosecond-pulse discharge. The supersonic H2–air combustion flow was calculated using a seven-reaction model. The spatial and temporal features of the combustion enhancement process were analyzed. Some main conclusions can be drawn as follows:
- The NS-SDBD actuator injects thermal power into the shear layer through direct near-wall heating and exerts flow perturbation through compression waves. By inputting repetitive pulses, flow temperature is increased, and the production of H2O is promoted;
- NS-SDBD actuation is able to increase the turbulent viscosity ratio, enhancing the turbulent diffusion of fuel. Such mass-transportation-enhancing effects result in the changed increments of flame height. The increase of energy input is conducive to the enlargement of the flame’s region;
- The combustion enhancement effect turns out to be most significant around the actuator, and gradually attenuates in the downstream region. Given the same power input, the actuation frequency has the greatest impact on combustion flow rate.
Author Contributions
Conceptualization, Y.Y. and J.W.; methodology, Y.Y.; software, Y.Y.; validation, Y.Y., K.L. and J.L.; formal analysis, Y.Y.; investigation, Y.Y., K.L. and J.L.; resources, J.W.; data curation, Y.Y. and K.L.; writing—original draft preparation, Y.Y.; writing—review and editing, J.W.; visualization, Y.Y. and J.L.; supervision, J.W.; project administration, J.W.; funding acquisition, J.W. All authors have read and agreed to the published version of the manuscript.
Funding
This research received no external funding.
Data Availability Statement
The data presented in this study are available on request from the corresponding author.
Conflicts of Interest
The authors declare no conflicts of interest.
References
- Huang, W.; Du, Z.; Yan, L.; Xia, Z. Supersonic mixing in airbreathing propulsion systems for hypersonic flights. Prog. Aerosp. Sci. 2019, 109, 100545. [Google Scholar] [CrossRef]
- Li, L.; Huang, W.; Yan, L. Mixing augmentation induced by a vortex generator located upstream of the transverse gaseous jet in supersonic flows. Aerosp. Sci. Technol. 2017, 68, 77–89. [Google Scholar] [CrossRef]
- Shi, H.; Wang, G.; Luo, X.; Yang, J.; Lu, X.-Y. Large-eddy simulation of a pulsed jet into a supersonic crossflow. Comput. Fluids 2016, 140, 320–333. [Google Scholar] [CrossRef]
- Durasiewicz, C.; Singh, A.; Little, J.C. A Comparative Flow Physics Study of Ns-DBD vs Ac-DBD Plasma Actuators for Transient Separation Control on a NACA 0012 Airfoil. In Proceedings of the 2018 AIAA Aerospace Sciences Meeting, American Institute of Aeronautics and Astronautics, Kissimmee, FL, USA, 8–12 January 2018. [Google Scholar] [CrossRef]
- Chen, Z.; Wong, C.C.; Wen, C.-Y. Thermal effects on the performance of a nanosecond dielectric barrier discharge plasma actuator at low air pressure. Phys. Fluids 2023, 35, 017110. [Google Scholar] [CrossRef]
- Wang, J.-J.; Choi, K.-S.; Feng, L.-H.; Jukes, T.N.; Whalley, R.D. Recent developments in DBD plasma flow control. Prog. Aerosp. Sci. 2013, 62, 52–78. [Google Scholar] [CrossRef]
- Nishihara, M.; Takashima, K.; Rich, J.W.; Adamovich, I.V. Mach 5 bow shock control by a nanosecond pulse surface dielectric barrier discharge. Phys. Fluids 2011, 23, 066101. [Google Scholar] [CrossRef]
- Kong, Y.; Wu, Y.; Zong, H.; Guo, S. Supersonic cavity shear layer control using spanwise pulsed spark discharge array. Phys. Fluids 2022, 34, 054113. [Google Scholar] [CrossRef]
- Ahn, S.; Chae, J.; Kim, H.-J.; Kim, K.H. Numerical Simulation of Streamer Physics in Nanosecond Pulsed Surface Discharges. Int. J. Aeronaut. Space Sci. 2021, 22, 547–559. [Google Scholar] [CrossRef]
- Zhu, Y.; Wu, Y.; Cui, W.; Li, Y.; Jia, M. Modelling of plasma aerodynamic actuation driven by nanosecond SDBD discharge. J. Phys. D Appl. Phys. 2013, 46, 355205. [Google Scholar] [CrossRef]
- Chen, Z.; Hao, L.; Zhang, B. A model for Nanosecond Pulsed Dielectric Barrier Discharge (NSDBD) actuator and its investigation on the mechanisms of separation control over an airfoil. Sci. China Technol. Sci. 2013, 56, 1055–1065. [Google Scholar] [CrossRef]
- Kinefuchi, K.; Starikovskiy, A.Y.; Miles, R.B. Numerical investigation of nanosecond pulsed plasma actuators for control of shock-wave/boundary-layer separation. Phys. Fluids 2018, 30, 106105. [Google Scholar] [CrossRef]
- Zheng, J.G.; Cui, Y.D.; Li, J.; Khoo, B.C. A note on supersonic flow control with nanosecond plasma actuator. Phys. Fluids 2018, 30, 040907. [Google Scholar] [CrossRef]
- Nagaraju, A.S.; Verma, K.A.; Pandey, K.M.; Das, D. Numerical analysis of plasma combustion in scramjet engine-A review. Mater. Today Proc. 2021, 45, 6838–6851. [Google Scholar] [CrossRef]
- Zhang, Z.; Jin, X.; Xi, W. Numerical Simulation of Plasma Jet Assisted Combustion Based on the Strut Combustor. IOP Conf. Ser. Earth Environ. Sci. 2019, 252, 3. [Google Scholar] [CrossRef]
- Shcherbanev, S.A.; Popov, N.A.; Starikovskaia, S.M. Ignition of high pressure lean H2:air mixtures along the multiple channels of nanosecond surface discharge. Combust. Flame 2017, 176, 272–284. [Google Scholar] [CrossRef]
- Sharma, A.; Subramaniam, V.; Solmaz, E.; Raja, L.L. Fully coupled modeling of nanosecond pulsed plasma assisted combustion ignition. J. Phys. D Appl. Phys. 2019, 52, 095204. [Google Scholar] [CrossRef]
- Yu, M.; Gu, H.; Chen, F. Influence of Plasma on the Combustion Mode in a Scramjet. Aerospace 2022, 9, 73. [Google Scholar]
- Zhou, S.; Nie, W.; Che, X. Numerical Modeling of Quasi-DC Plasma-Assisted Combustion for Flame Holding Cavity. Combust. Sci. Technol. 2016, 188, 1640–1654. [Google Scholar] [CrossRef]
- Dunn, I.; Ahmed, K.A.; Leiweke, R.J.; Ombrello, T.M. Optimization of flame kernel ignition and evolution induced by modulated nanosecond-pulsed high-frequency discharge. Proc. Combust. Inst. 2021, 38, 6541–6550. [Google Scholar] [CrossRef]
- Do, H.; Im, S.; Cappelli, M.A.; Mungal, M.G. Plasma assisted flame ignition of supersonic flows over a flat wall. Combust. Flame 2010, 157, 2298–2305. [Google Scholar] [CrossRef]
- Yadala, S.; Benard, N.; Kotsonis, M.; Moreau, E. Effect of dielectric barrier discharge plasma actuators on vortical structures in a mixing layer. Phys. Fluids 2020, 32, 124111. [Google Scholar] [CrossRef]
- Ali, M.; Fujiwara, T.; Leblanc, J.E. Influence of main flow inlet configuration on mixing and flameholding in transverse injection into supersonic airstream. Int. J. Eng. Sci. 2020, 38, 1161–1180. [Google Scholar] [CrossRef]
- Fan, X.; Wang, J.; Zhao, F.; Li, J.; Yang, T. Eulerian–Lagrangian method for liquid jet atomization in supersonic crossflow using statistical injection model. Adv. Mech. Eng. 2018, 10, 1–13. [Google Scholar] [CrossRef]
- Shang, H.; Chen, Y.; Liaw, P.; Chen, C.; Wang, T. Investigation of chemical kinetics integration algorithms for reacting flows, in: 33rd Aerospace Sciences Meeting and Exhibit. In Proceedings of the 33rd Aerospace Sciences Meeting and Exhibit, American Institute of Aeronautics and Astronautics, Reno, NV, USA, 9–12 January 1995. [Google Scholar] [CrossRef]
- Segal, C.; Haj-Hariri, H.; McDaniel, J.C. Effects of chemical reaction model on calculations of supersonic combustion flows. J. Propuls. Power 1995, 11, 565–568. [Google Scholar] [CrossRef]
- Wei, B.; Wu, Y.; Liang, H.; Chen, J.; Zhao, G.; Tian, M.; Xu, H. Performance and mechanism analysis of nanosecond pulsed surface dielectric barrier discharge based plasma deicer. Phys. Fluids 2019, 31, 091701. [Google Scholar] [CrossRef]
- Ukai, T.; Russell, A.; Zare-Behtash, H.; Kontis, K. Temporal variation of the spatial density distribution above a nanosecond pulsed dielectric barrier discharge plasma actuator in quiescent air. Phys. Fluids 2018, 30, 116106. [Google Scholar] [CrossRef]
- Starikovskii, A.; Nudnova, M.; Kindusheva, S.; Aleksahdrov, N. Rate of Plasma Thermalization of Pulsed Nanosecond Surface Dielectric Barrier Discharge. In Proceedings of the 48th AIAA Aerospace Sciences Meeting Including the New Horizons Forum and Aerospace Exposition, American Institute of Aeronautics and Astronautics, Orlando, FL, USA, 4–7 January 2010. [Google Scholar] [CrossRef]
- Popov, N.A. Fast gas heating in a nitrogen–oxygen discharge plasma: I. Kinetic mechanism. J. Phys. D Appl. Phys. 2011, 44, 285201. [Google Scholar] [CrossRef]
- Starikovskiy, A.; Pancheshnyi, S. Dielectric Barrier Discharge Development at Low and Moderate Pressure Conditions. In Proceedings of the 51st AIAA Aerospace Sciences Meeting including the New Horizons Forum and Aerospace Exposition, American Institute of Aeronautics and Astronautics, Grapevine, TX, USA, 7–10 January 2013. [Google Scholar] [CrossRef]
- Roupassov, D.V.; Nikipelov, A.A.; Nudnova, M.M.; Starikovskii, A.Y. Flow Separation Control by Plasma Actuator with Nanosecond Pulsed-Periodic Discharge. AIAA J. 2009, 47, 168–185. [Google Scholar] [CrossRef]
- Xu, S.Y.; Cai, J.S.; Li, J. Modeling and simulation of plasma gas flow driven by a single nanosecond-pulsed dielectric barrier discharge. Phys. Plasmas 2016, 23, 103510. [Google Scholar] [CrossRef]
- Taira, K.; Brunton, S.L.; Dawson, S.T.M.; Rowley, C.W.; Colonius, T.; McKeon, B.J.; Schmidt, O.T.; Gordeyev, S.; Theofilis, V.; Ukeiley, L.S. Modal Analysis of Fluid Flows: An Overview. AIAA J. 2017, 55, 4013–4041. [Google Scholar] [CrossRef]
Disclaimer/Publisher’s Note: The statements, opinions and data contained in all publications are solely those of the individual author(s) and contributor(s) and not of MDPI and/or the editor(s). MDPI and/or the editor(s) disclaim responsibility for any injury to people or property resulting from any ideas, methods, instructions or products referred to in the content. |
© 2023 by the authors. Licensee MDPI, Basel, Switzerland. This article is an open access article distributed under the terms and conditions of the Creative Commons Attribution (CC BY) license (https://creativecommons.org/licenses/by/4.0/).