Article

Design and Analysis of a Hybrid Stand-Alone Microgrid

by
Muhammad Zubair Asif Bhatti
1,
Abubakar Siddique
1,
Waseem Aslam
2,* and
Shahid Atiq
1
1
Department of Electrical & Biomedical Engineering, Khwaja Fareed University of Engineering and Information Technology (KFUEIT), Rahim Yar Khan 64200, Pakistan
2
Department of Electrical, Electronics and Computer Systems, University of Sargodha (UOS), Sargodha 40100, Pakistan
*
Author to whom correspondence should be addressed.
Energies 2024, 17(1), 200; https://doi.org/10.3390/en17010200
Submission received: 9 November 2023 / Revised: 24 November 2023 / Accepted: 22 December 2023 / Published: 29 December 2023

Abstract

:
This research article presents a comprehensive investigation into the design, optimization, and performance analysis of a hybrid stand-alone microgrid for an industrial facility in Iraq at coordinates 36.51 and 43.99. The system consists of photovoltaic (PV) modules, inverters, a battery energy storage system (BESS), a generator, and AC loads. Leveraging the capabilities of PVsyst version 7.3.1, HOMER Pro version 3.14.2 and SAM version 2022.11.21 software tools, this study assesses the feasibility and functionality of the hybrid stand-alone microgrid. In this study, PVsyst software is used for detailed designing and analysis of a PV plant, and the PVsyst design file is then used in HOMER Pro software to optimize and design the proposed hybrid stand-alone microgrid, and for detailed performance analysis SAM software is employed. This paper also investigates the impact of ground clearance and ground albedo on the annual generation of bifacial PV modules at various tilt angles. Key findings include a promising normalized production rate of 4.53 kWh/kWp/day with a performance ratio of 0.815 and annual energy production estimates of 84.31 MWh (P50), 79.57 MWh (P90), and 78.24 MWh (P95) for monofacial PV modules, highlighting the system’s potential for renewable energy generation. Notably, this research demonstrates the hybrid stand-alone microgrid’s capacity to significantly reduce CO2 emissions, saving approximately 1811.6 tons over a 30-year period, thus contributing to sustainability and environmental conservation goals. Additionally, this study reveals operational challenges during the winter months, necessitating generator support to meet load demands. The successful installation and experimental validation of the hybrid stand-alone microgrid underscore its practical viability and its role in advancing clean energy solutions. This research provides valuable insights into hybrid stand-alone microgrid design, emphasizing its importance in ensuring reliable power supply and environmental stewardship.

1. Introduction

The conventional means of electrical energy generation, primarily relying on fossil fuel power plants, have long been associated with significant environmental and economic challenges. These drawbacks include detrimental contributions to air pollution and greenhouse gas emissions, leading to climate change and adverse effects on human health. Moreover, such energy production methods are fundamentally unsustainable as they rely on finite resources like coal, oil, and gas, which are inexorably depleting [1,2]. Additionally, these conventional power plants often impose severe consequences on local ecosystems and wildlife through habitat destruction and water pollution. The economic burden of electricity generation through these means is equally substantial, encompassing both financial and environmental costs [3].
Conversely, renewable energy generation has emerged as a promising alternative [4]. However, it is not without limitations. Renewable sources, such as solar and wind power, can be intermittent and subject to the unpredictability of weather conditions [5,6]. This intermittency necessitates the development of backup systems and energy storage solutions [7]. Furthermore, while renewable energy infrastructure costs have decreased over time, the initial investment remains relatively high. Additionally, not all geographical locations are conducive to certain types of renewable energy generation, limiting their widespread adoption [8].
In response to these challenges, microgrids (MGs) have emerged as a viable solution for localized energy generation [9]. These MGs typically comprise components such as low-voltage (LV) distribution systems, distributed energy resources (DERs) (e.g., photovoltaics, fuel cells, micro-turbines), energy storage components (batteries, energy capacitors, and flywheels), and flexible loads [10]. MGs can operate in both non-autonomous (grid-tied) and autonomous (grid-independent) modes, offering flexibility and resilience [11,12].
The HOMER Pro microgrid software from HOMER Energy stands out as the industry standard for microgrid design optimization. It leverages the Hybrid Optimization Model for Multiple Energy Resources (HOMER) to simulate and analyze various equipment configurations to find optimal system designs. HOMER simulates the operation of hybrid microgrids over the course of a year, providing insights at varying time steps, from one minute to one hour [13]. In [14], the focus is on the design, performance analysis, and optimization of a grid-connected hybrid microgrid for hospital applications employing HOMER software. Ref. [15] explores the design of an off-grid (stand-alone) hybrid (AC/DC) microgrid intended for a community system using HOMER software. Ref. [16] presents the optimization of a grid-connected microgrid for three different cities in Pakistan employing HOMER software. In [17], researchers present the modeling and optimization of a community microgrid situated in a housing estate in Cape Town, South Africa, employing HOMER software. Ref. [18] addresses the design considerations for a microgrid in Rwanda, specifically engineered to provide low-cost electricity employing HOMER software. PVsyst software is the best approach for analyzing PV generation, as solar design depends on various factors, including its longitude, range, climatic conditions like temperature, wind speed, and sun-oriented irradiance. By evaluating these factors, it will be possible to increase the efficiency of a sunlight-based PV module and predict the cost of the system [19,20,21,22,23]. Ref. [19] conducts a performance analysis on a grid-connected PV plant generating 4908 MWh annually for a university in Bahawalpur, Pakistan, employing PVsyst software. Ref. [20] focuses on the design and installation of a stand-alone solar PV system, utilizing PVsyst software to meet the annual energy requirement of 1086.24 kWh for a college in India. Ref. [21] details the design of a 100 MW grid-connected PV plant for a university in Saudi Arabia, employing PVsyst software. Ref. [22] delves into the analysis and design of a 700 KWp grid-connected solar power plant in the Daikundi province of Afghanistan using PVsyst software. Ref. [23] presents the modeling and simulation of a 1 MW PV plant in the north of Morocco, employing PVsyst software. SAM software can be used for performance analysis of hybrid microgrids by monitoring and analyzing the software components that contribute to the overall performance of the system [24,25,26,27,28,29,30]. Ref. [24] introduces Cascade Extended Analysis as a methodology to ascertain the optimal capacities and sizes of diverse power generation and energy storage systems (ESSs) with a renewable energy plant, applicable to both grid-connected and stand-alone setups, facilitated by SAM software. Ref. [25] conducts an analysis of energy generation from on-grid PV plants across all regions of Brazil. Ref. [29] details the design and performance analysis of an 8 kW PV grid-connected system incorporating an ESS, employing SAM software. Ref. [30] presents an analysis of a PV system and BESS for the community using SAM software.
This research paper is dedicated to the optimization, simulation, performance analysis, and design of hybrid stand-alone microgrids tailored to meet the energy needs of facilities. It aims to validate the proposed designs through empirical test results and experiment reports. To achieve this, a combination of various software tools will be utilized, each offering distinct advantages and limitations. For instance, PVsyst is particularly valuable for PV plant design and conducting detailed analysis with real-time parameters. HOMER Pro excels in optimization and analysis, while SAM software proves advantageous for studying the performance analysis of hybrid stand-alone microgrids with battery energy storage systems. Including test findings and experiment reports will provide robust validation for the proposed hybrid stand-alone microgrid designs, advancing the field of sustainable energy solutions.
The following is how this paper is structured: In Section 2, a comprehensive overview of the proposed hybrid stand-alone microgrid is presented. It begins with an exploration of the microgrid’s structural design, followed by an in-depth analysis of the electrical load schedule and system sizing calculations. The modeling of the photovoltaic (PV) system is then elucidated, covering the design parameters and calculations that are discretized for utilization in PVsyst software, employed in the subsequent PV plant designing phase. Subsequently, the microgrid’s design is explicated using HOMER Pro software, incorporating data files from PVsyst software. The section culminates with the performance analysis methodology for the proposed microgrid, employing the System Advisor Model (SAM) software. In the subsequent 
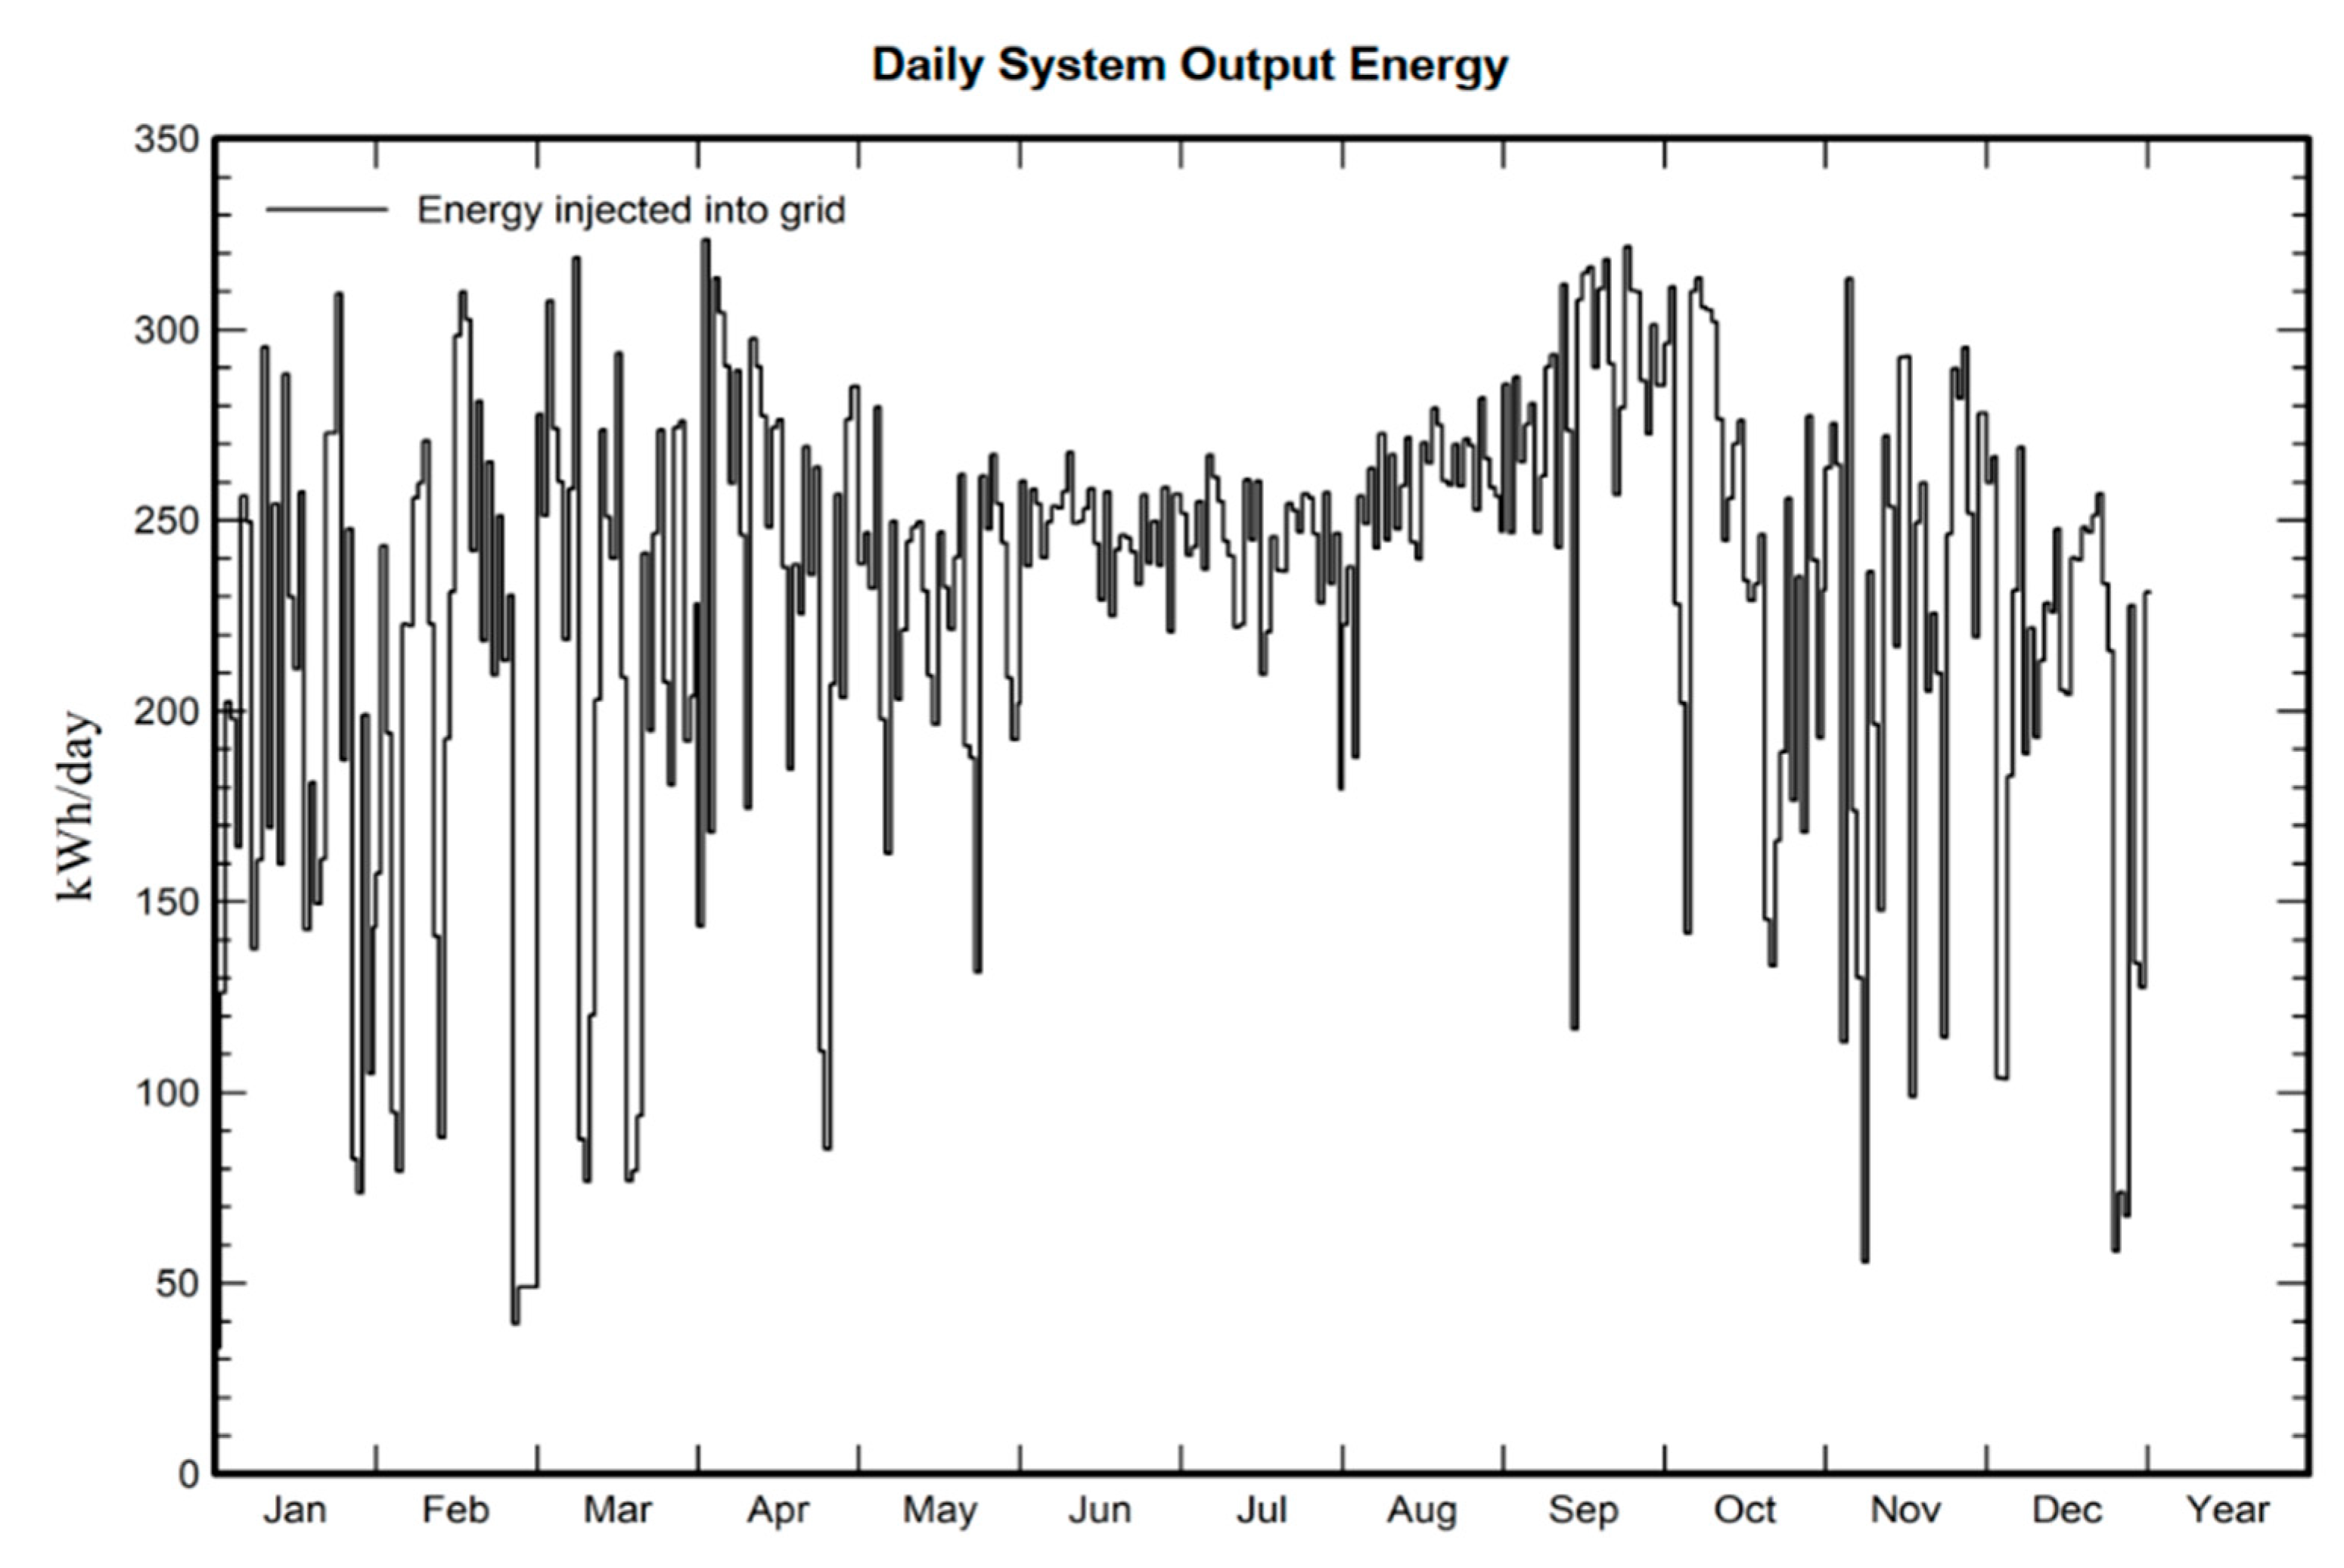
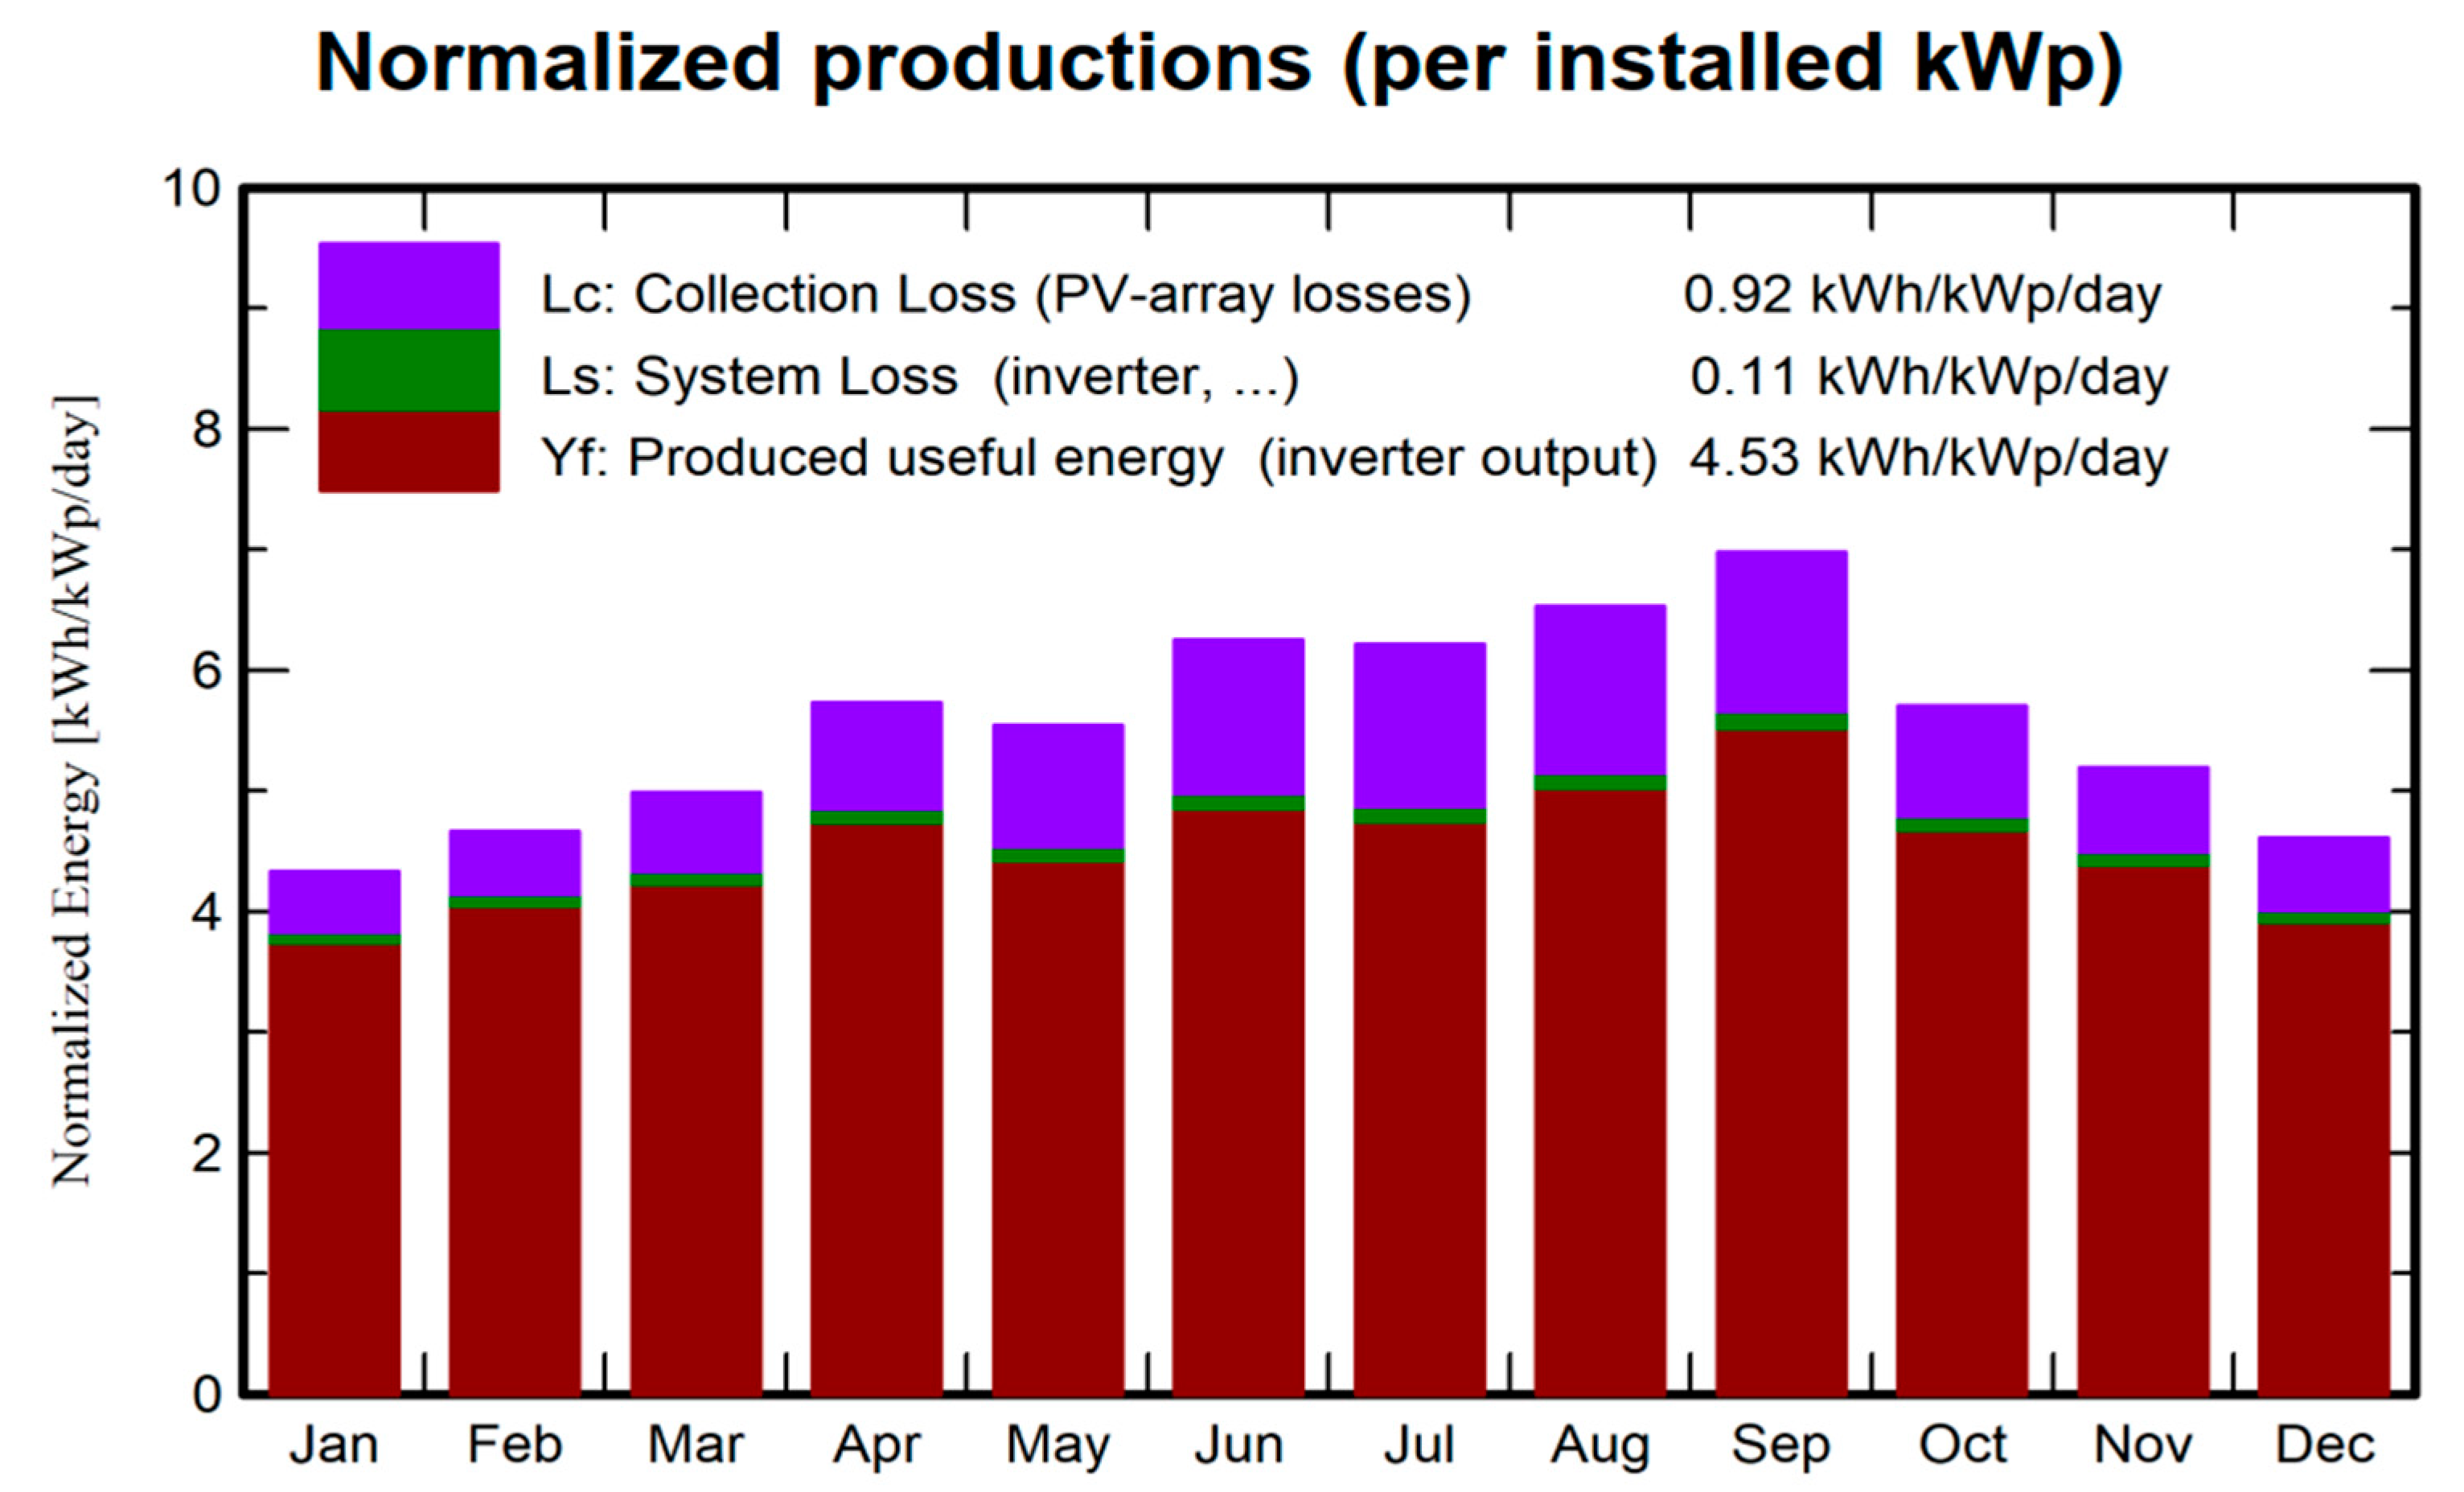
Section 3, the focus is on the outcomes derived from PVsyst software. This includes an exploration of the impact of ground clearance and ground albedo on the annual generation, considering various tilt angles of bifacial PV modules. For monofacial PV modules integrated into the proposed microgrid, the discussion encompasses daily output energy, normalized production per installed kWp, loss analysis, probability distribution, performance ratio, capacity factor, and saved CO2 emissions projected over the next 30 years. The results obtained from HOMER Pro software, detailing power injection from the PV system and an emergency diesel generator (EDG) into the microgrid, as well as the expected PV and EDG output power for the entire year, are thoroughly examined. The performance analysis of the microgrid, using SAM software, is then discussed. Finally, the section concludes with an analysis of practical results. This paper concludes with a final section summarizing the key findings and insights gained from this research.

2. Materials and Methods

This section aims to provide a comprehensive understanding of the proposed hybrid stand-alone microgrid. Firstly, it will delve into the structure of the microgrid, highlighting its various components and their interconnections. Following this, the electrical load schedule and system sizing calculation will be discussed, providing insights into the planning and optimization of the microgrid’s energy usage. Subsequently, the modeling of the photovoltaic (PV) system will be explained, shedding light on the technical aspects of integrating renewable energy sources into the microgrid. Moving forward, the design of the hybrid stand-alone microgrid will be elaborated upon, emphasizing the considerations and strategies employed. Lastly, the performance analysis of the microgrid will be presented.

2.1. Structure of the Proposed Hybrid Stand-Alone Microgrid

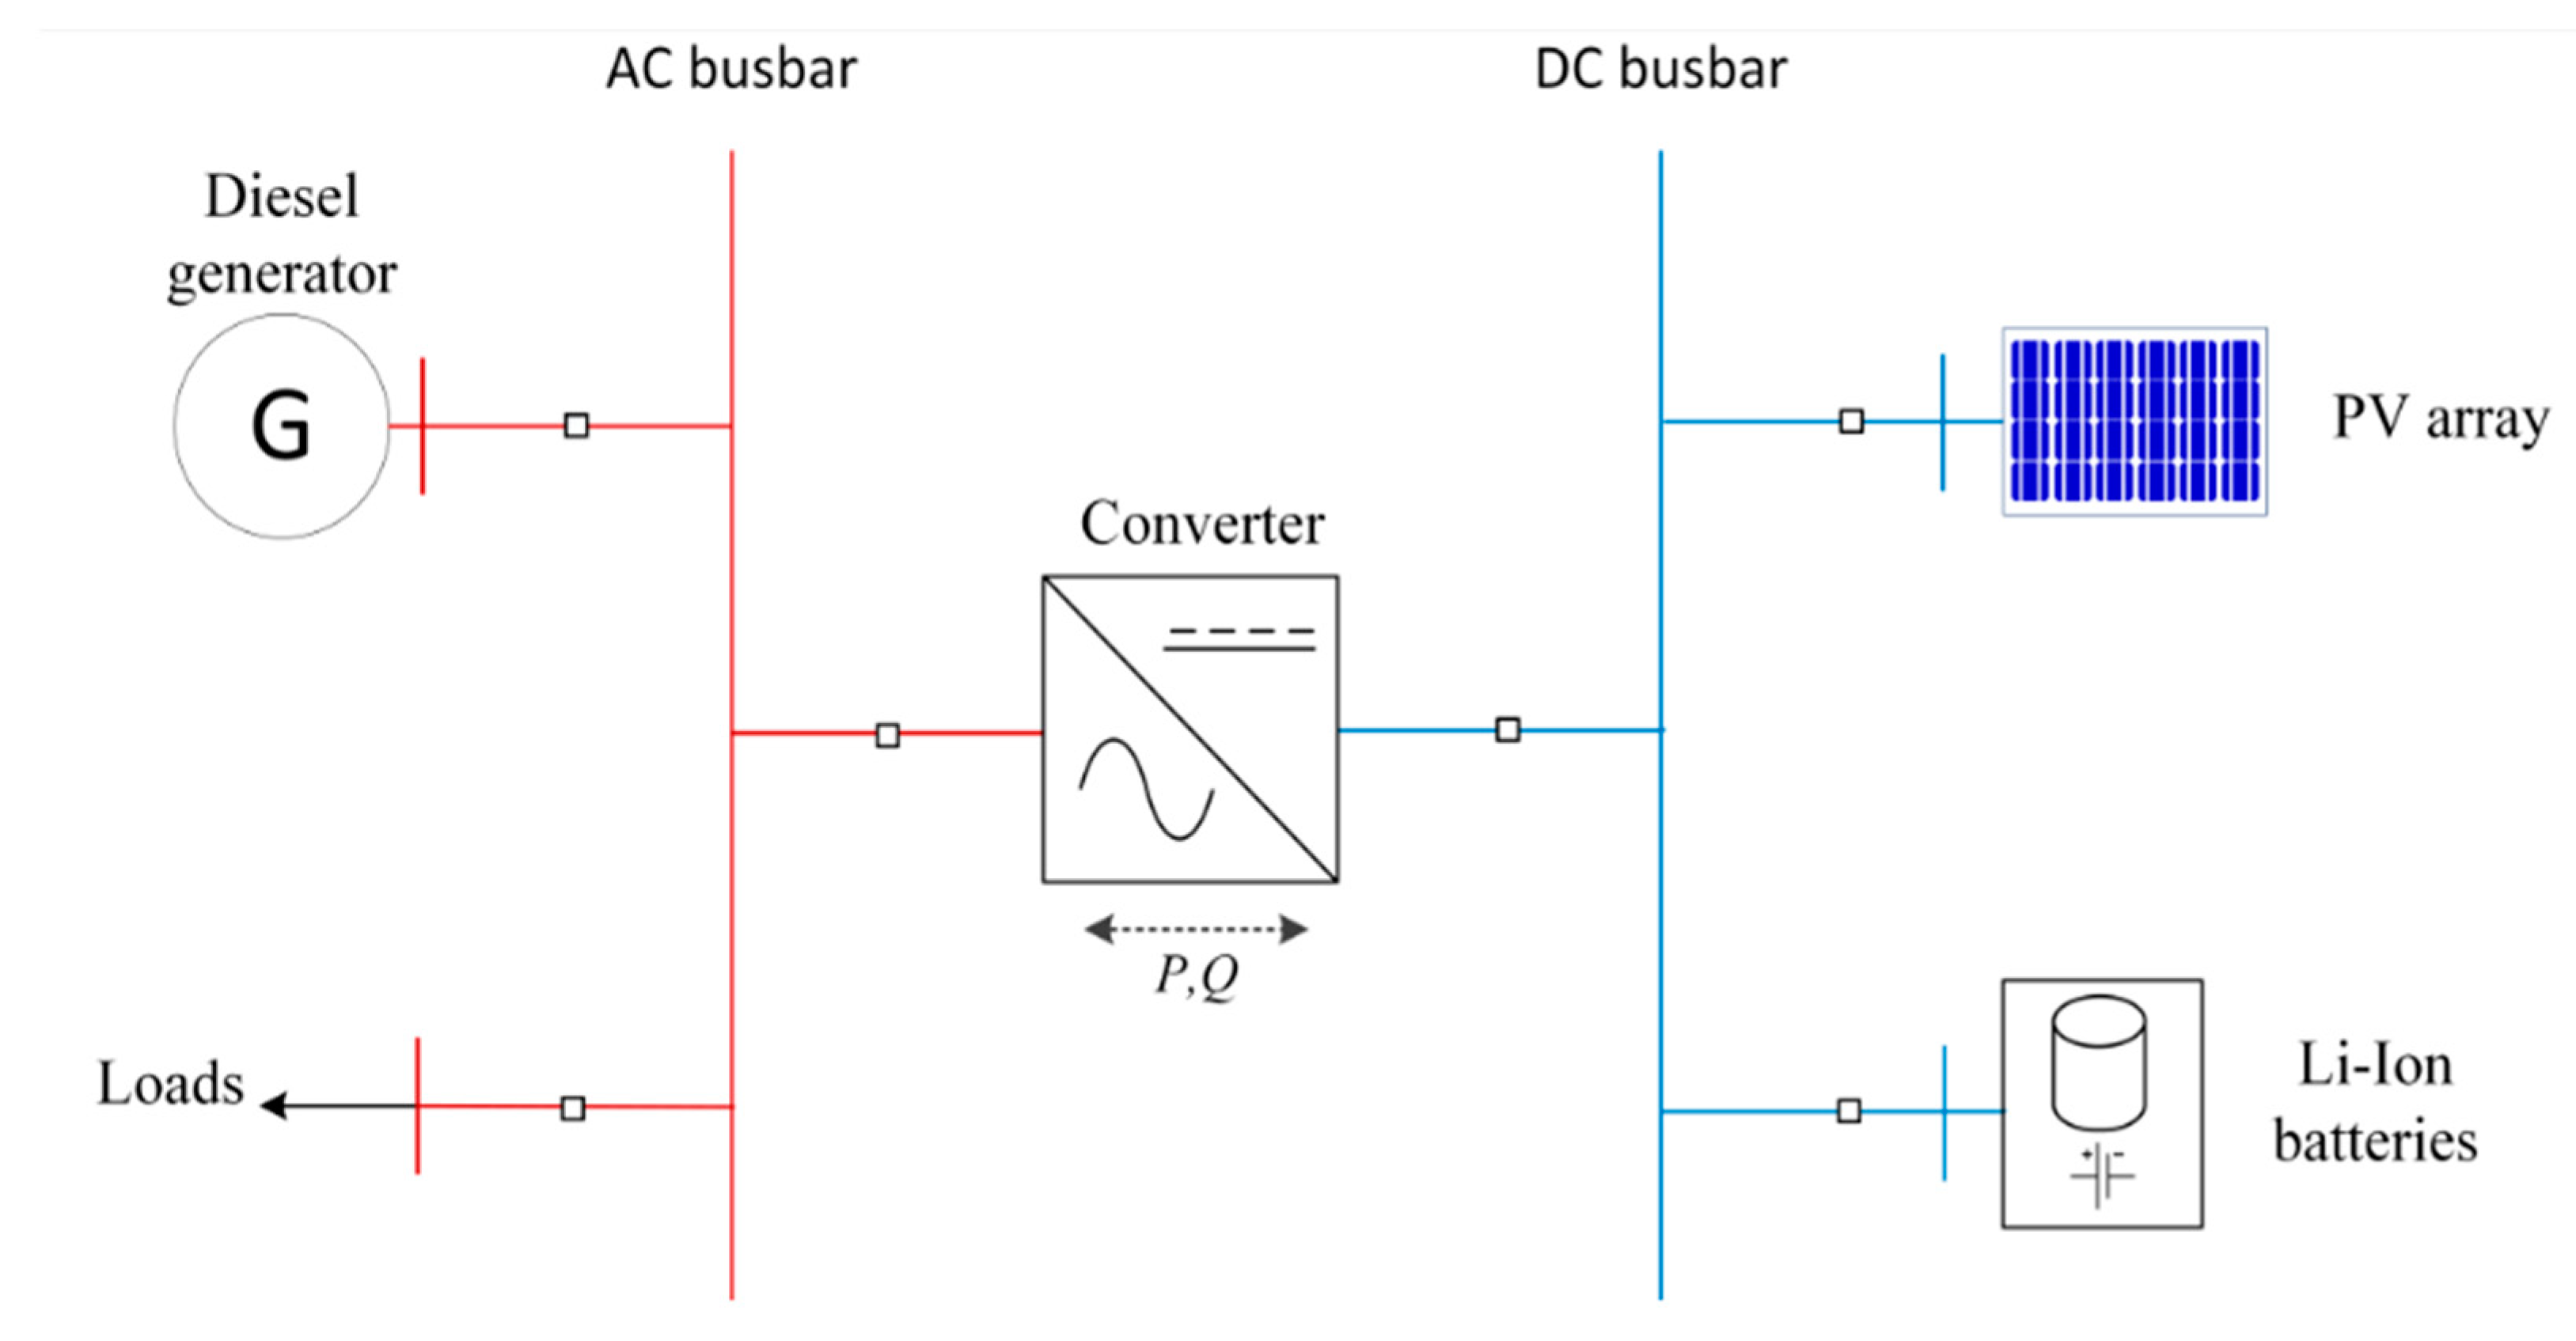
The hybrid stand-alone microgrid taken into consideration in this study will be used to meet the demand requirements of a facility in Iraq. Since there is currently no distribution network in the area where the facility is located, building a dedicated line to the site would need a substantial capital investment. This is the rationale for choosing to build a microgrid. Therefore, an autonomous microgrid would be better from that point of view because energy consumption would then be provided for free during the project’s lifespan. Additionally, a microgrid that mainly uses renewable energy sources would make it easier to reduce CO2 emissions, which would improve the environment and play a significant role in the transition to a carbon-free world.
Photovoltaic (PV) panels, a battery energy storage system (BESS), and a diesel generator form the autonomous system under consideration, which is designed to handle extended periods of darkness, illustrated in Figure 1.

2.2. Electrical Load Schedule and System Sizing Calculation

The site consists of industrial loads. Therefore, the site’s peak load will not differ considerably neither during summer and winter nor during weekends and weekdays. The detailed electrical load schedule of an existing facility is presented in Table 1. Note that Table 1 lists the current facility’s detailed electrical load schedule, Table 2 lists the input data, and Table 3 lists the sizing calculation of the diesel generator. However, a 50 kVA generator is selected considering the load of the facility as well as the charging load of BESS during an emergency condition. Moreover, Table 4 lists the sizing calculation of BESS.
System sizing is modeled considering the industrial load as essential load. For reliability of power supply, all system components are designed with the torque load of the facility taken into account. Furthermore, the system is designed in such a way that during the sun hours, the PV plant will supply electricity to the load and the BESS, while during off sun hours, the BESS will supply electricity to the load, and a backup diesel generator will supply electricity to the load in an emergency.

2.3. Modeling of PV System

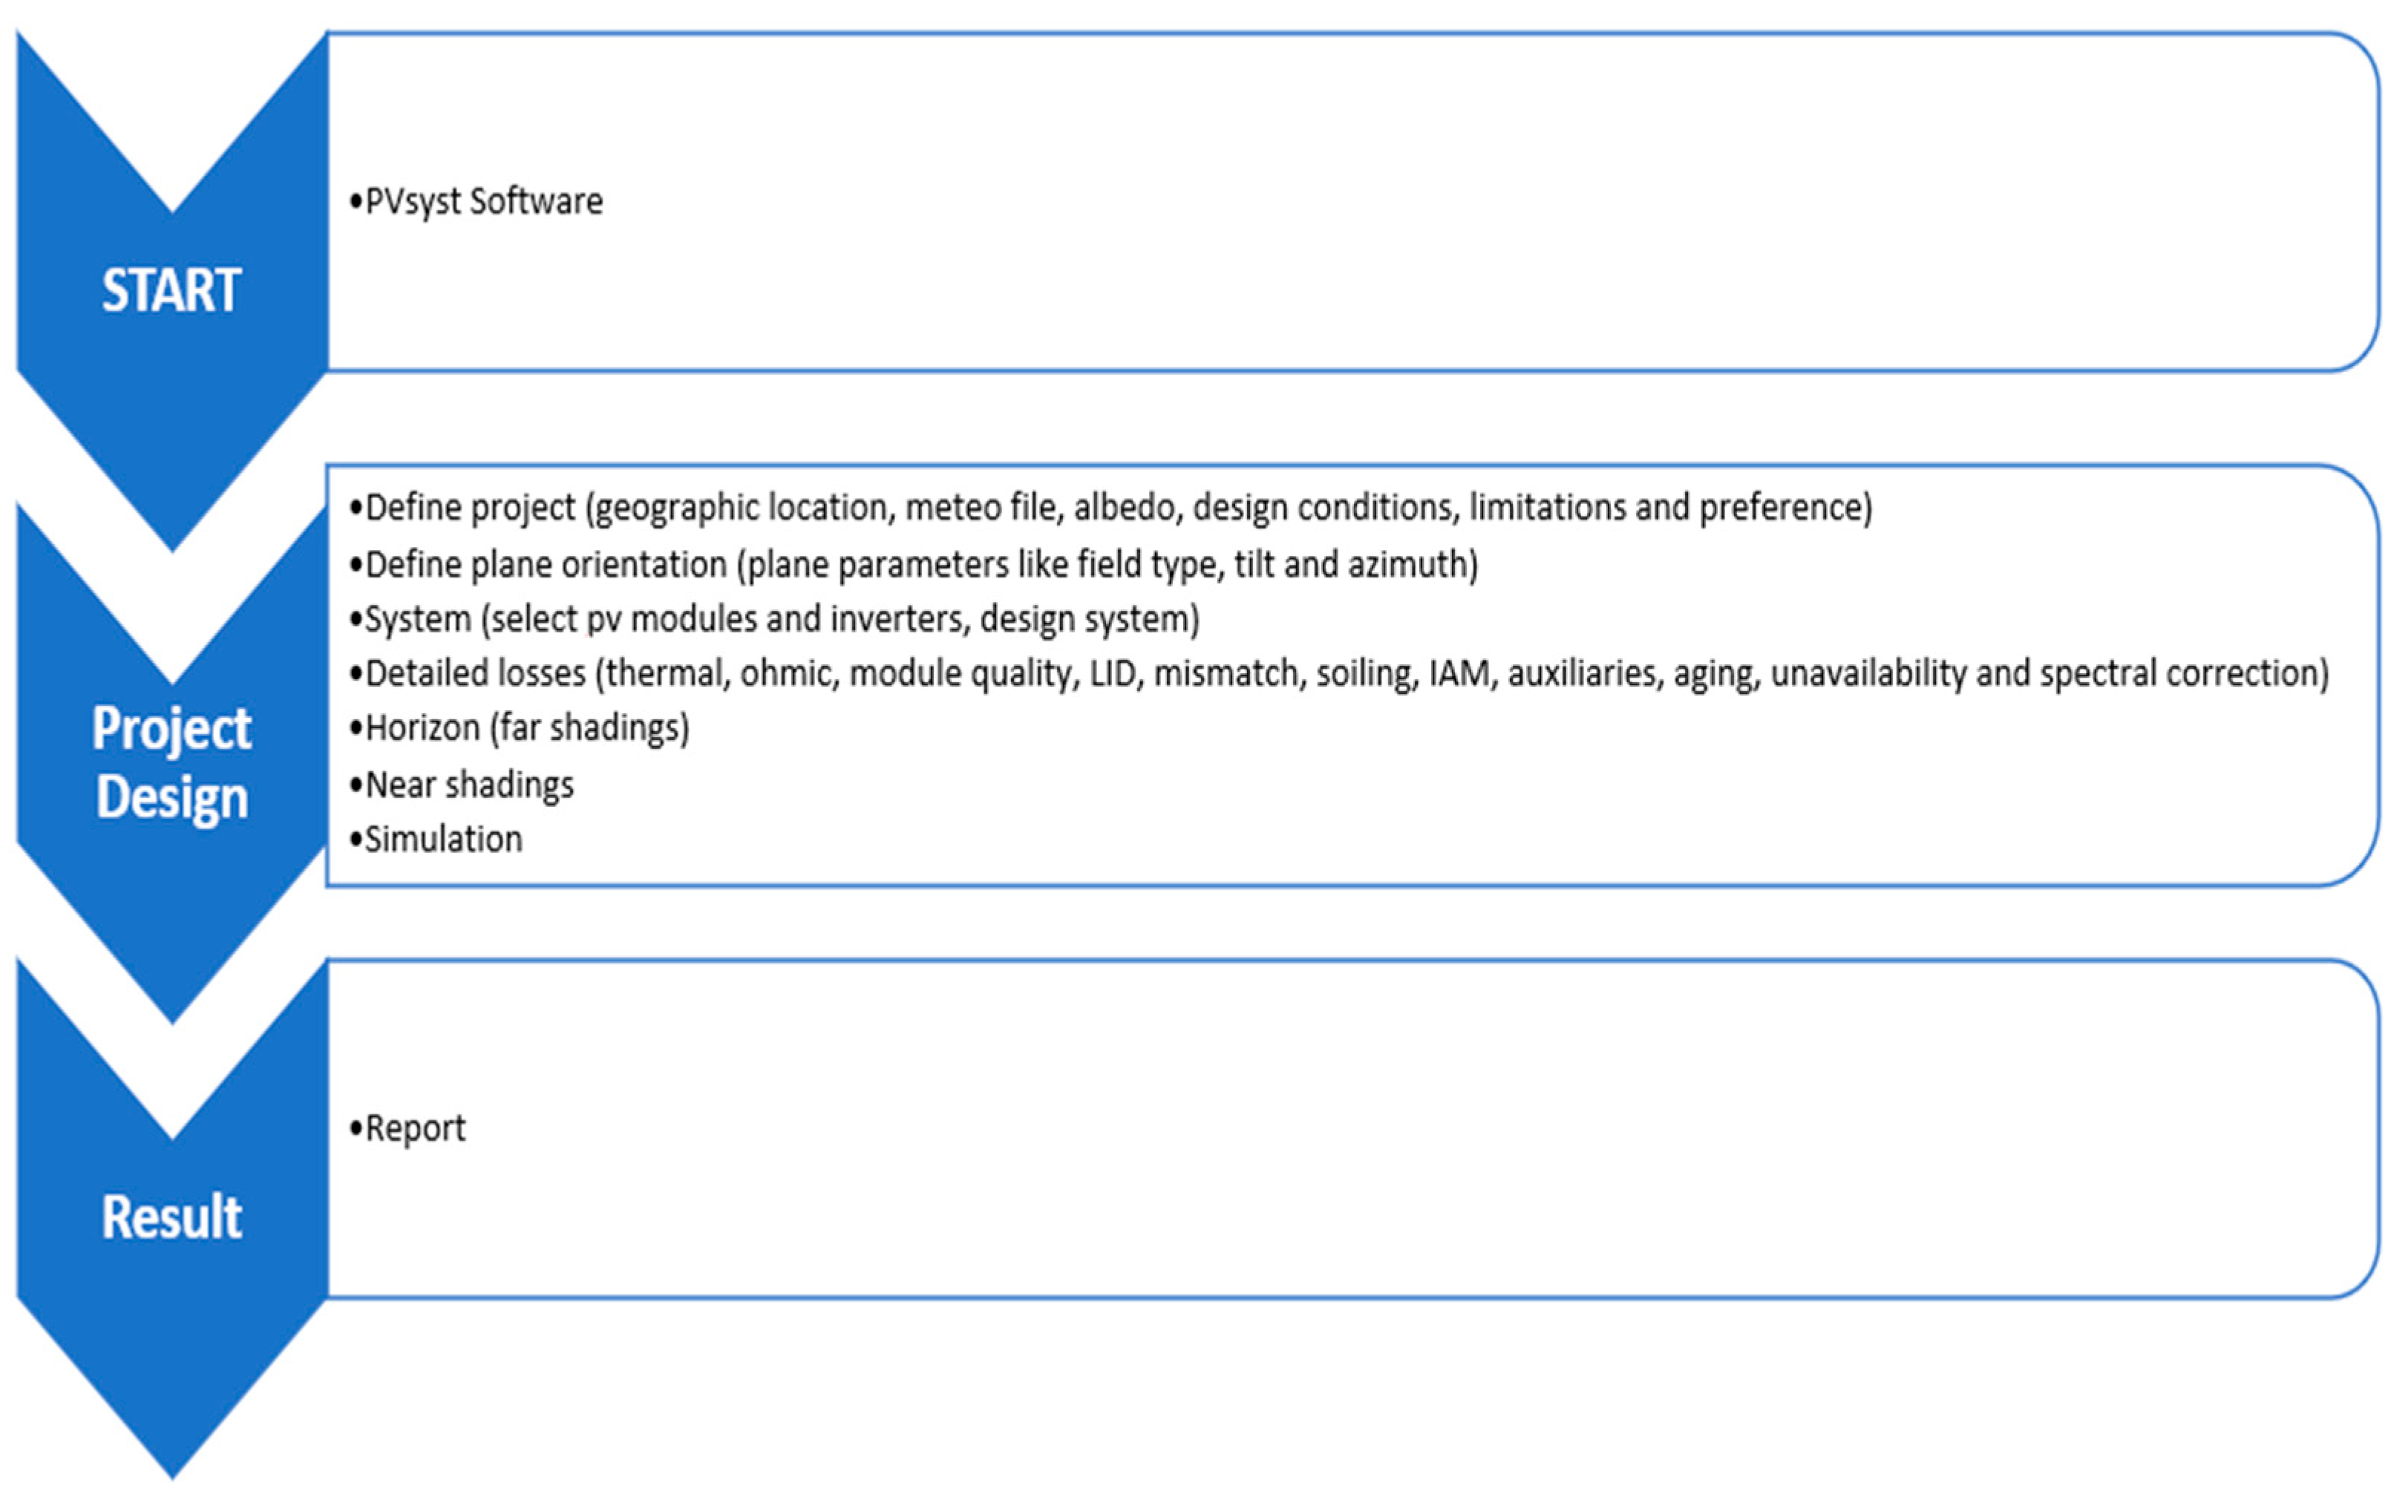
PVsyst version 7.3.1 software is used to model PV systems. PVsyst software is a powerful tool for solar energy system design, simulation, and performance analysis. It allows us to accurately assess the energy production potential of a photovoltaic system by considering factors such as location, shading, module characteristics, and system configuration. With PVsyst, one can optimize system sizing, evaluate different design scenarios, and estimate the financial viability of solar projects. It is a valuable software in the renewable energy industry. Figure 2 illustrates the flowchart for PVsyst software.
Results are presented by PVsyst software as a comprehensive report with relevant graphs and tables. The information may be exported for use in other applications.
PVsyst software is a comprehensive tool used for designing PV arrays with three different methods: grid-connected, stand-alone, and pumping. In this research, the grid-connected method has been selected to design the PV arrays. There are a total of four PV arrays in this design. Three of these arrays consist of one string inverter per PV array and two strings of 13 PV modules per PV array, each module with a power output of 500 Wp. The remaining PV array consists of one string inverter and two strings of 12 PV modules, each with a power output of 500 Wp. These PV arrays are designed for a fixed tilted plane field type arrangement, ensuring optimal sunlight exposure and energy generation during winter.

2.3.1. Define Project

The geographical coordinates of the facility are 36.5144907 and 43.9887378, respectively. The facility is situated in a region of dry mountains. Hence, 0.2 is chosen as the albedo value. Based on data gathered from the site, the following design parameters were taken into consideration for the project: −1 °C for lower temperature for absolute voltage limit, 20 °C for winter operating temperature for VmppMax design, 45 °C for usual operating temperature under 1000 W/m2, and 50 °C for summer operating temperature for VmppMax design.
I r r a d i a n c e   o f   l o c a t i o n = A v e r a g e   I n s . A v e r a g e   S u n
Here, Average Sun is the average number of hours per day with bright sunshine, and Average Ins. is the average insolation of the location. The area unit is kWh/m2.
S o l a r   I r r a d i a n c e   W m 2   = i r r a d i a n c e k W h × 1000 h o u r s  
The solar radiation data were obtained from Meteonorm version 8.1 and the global solar radiation on horizontal surfaces in the project site, and it was observed that it varies from 234.3 kWh/m2/month to 77.4 kWh/m2/month during the complete year. The relatively low observed solar radiation from November to February is due to the prevailing high moisture content and heavy clouds during the rainy season in this area. The meteorological data of the site are given in 
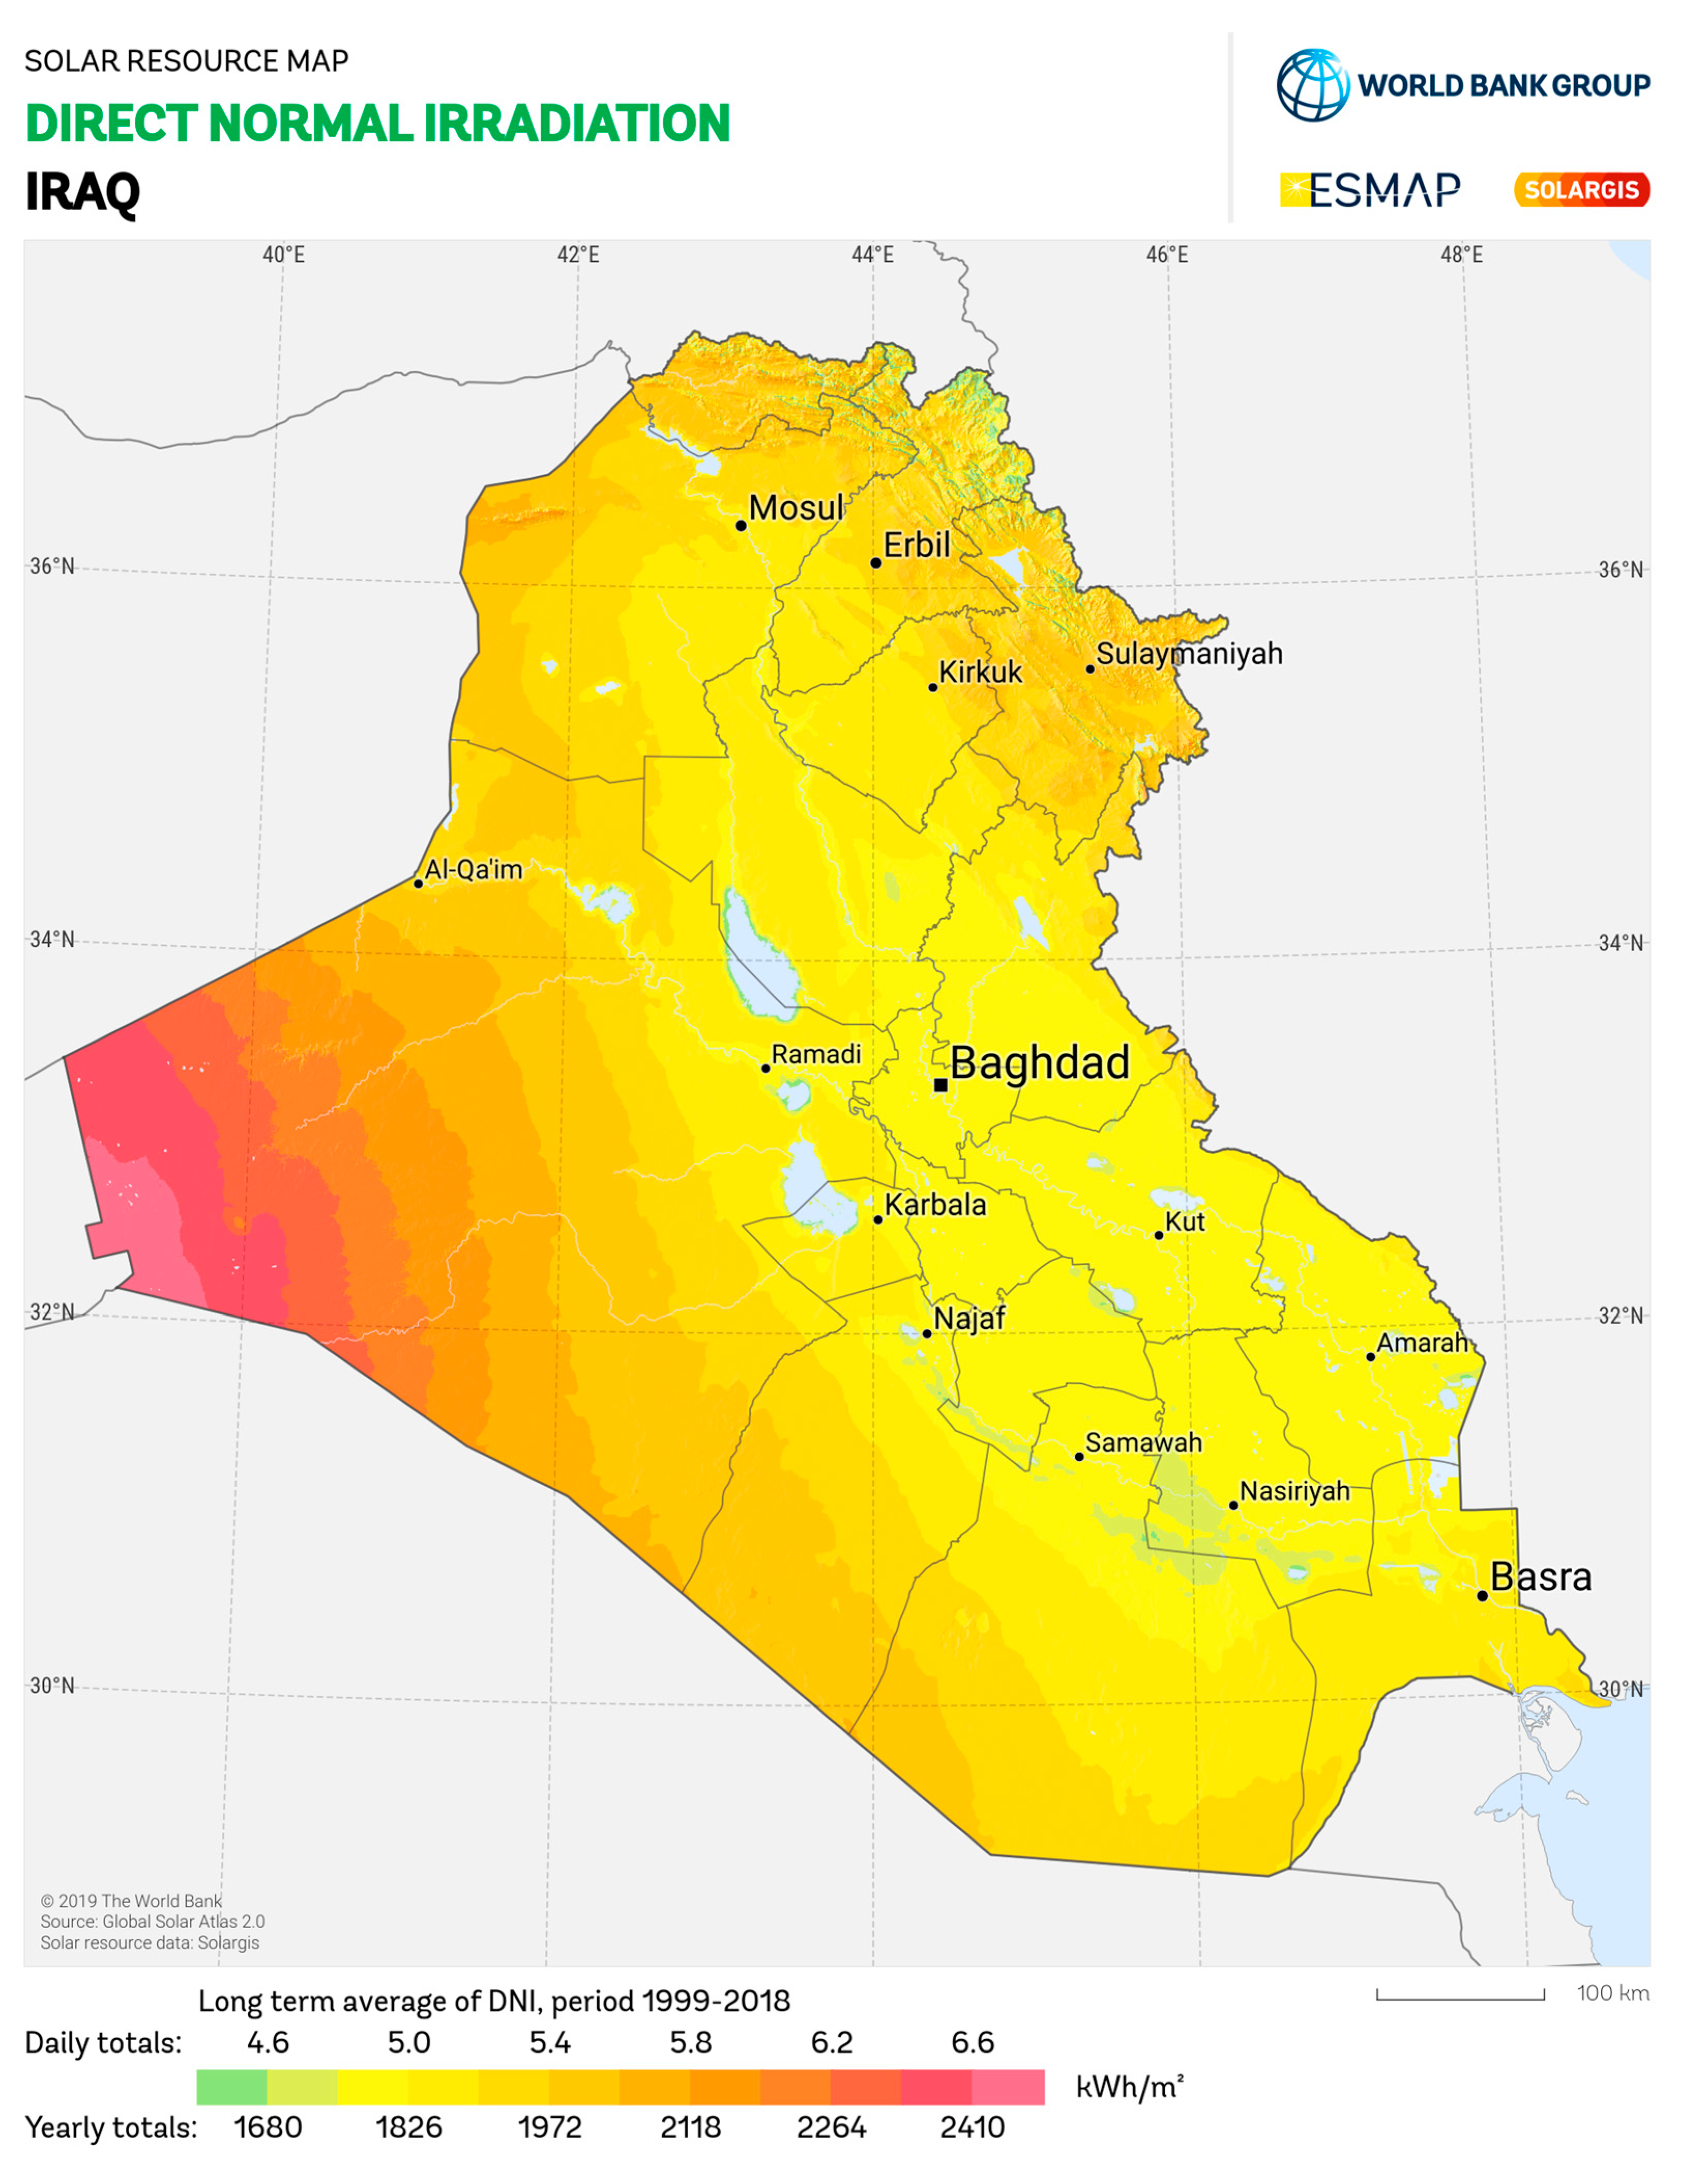
Table 5. Additionally, the SOLARGIS in Figure 3 provides a location map of the solar resources.

2.3.2. Define Plane Orientation

A fixed tilted plane is considered in this study. The filed parameters are azimuth of 0° and tilt of 45° to obtain maximum yield in winter; global irradiance calculated at this angle is 928 kWh/m2.

2.3.3. PV Power Plant Design

In total, 102 TSM-DE18M(II) PV modules form the PV power plant, which has a total installed capacity of 51 kW. The specifications for PV module are represented in Table 6. The 102 modules are assembled into four units, and each unit is connected to a three-phase SUN-12K-SG04LP3 inverter having a rated output power of 15.6 kW. The specifications for the inverter are represented in Table 7. Each unit has two strings; three units have thirteen modules each, for a total of 26 modules per inverter, and one unit has twelve, for a total of 24 modules per inverter. The inverter’s maximum power tracking voltage range is 800 V, and the Voc computed per string is 715.79 V for three units and 660.73 V for one unit. The combined Isc for each string is 12.28 A, which is less than the inverter’s maximum PV short-circuit current range of 17 A.

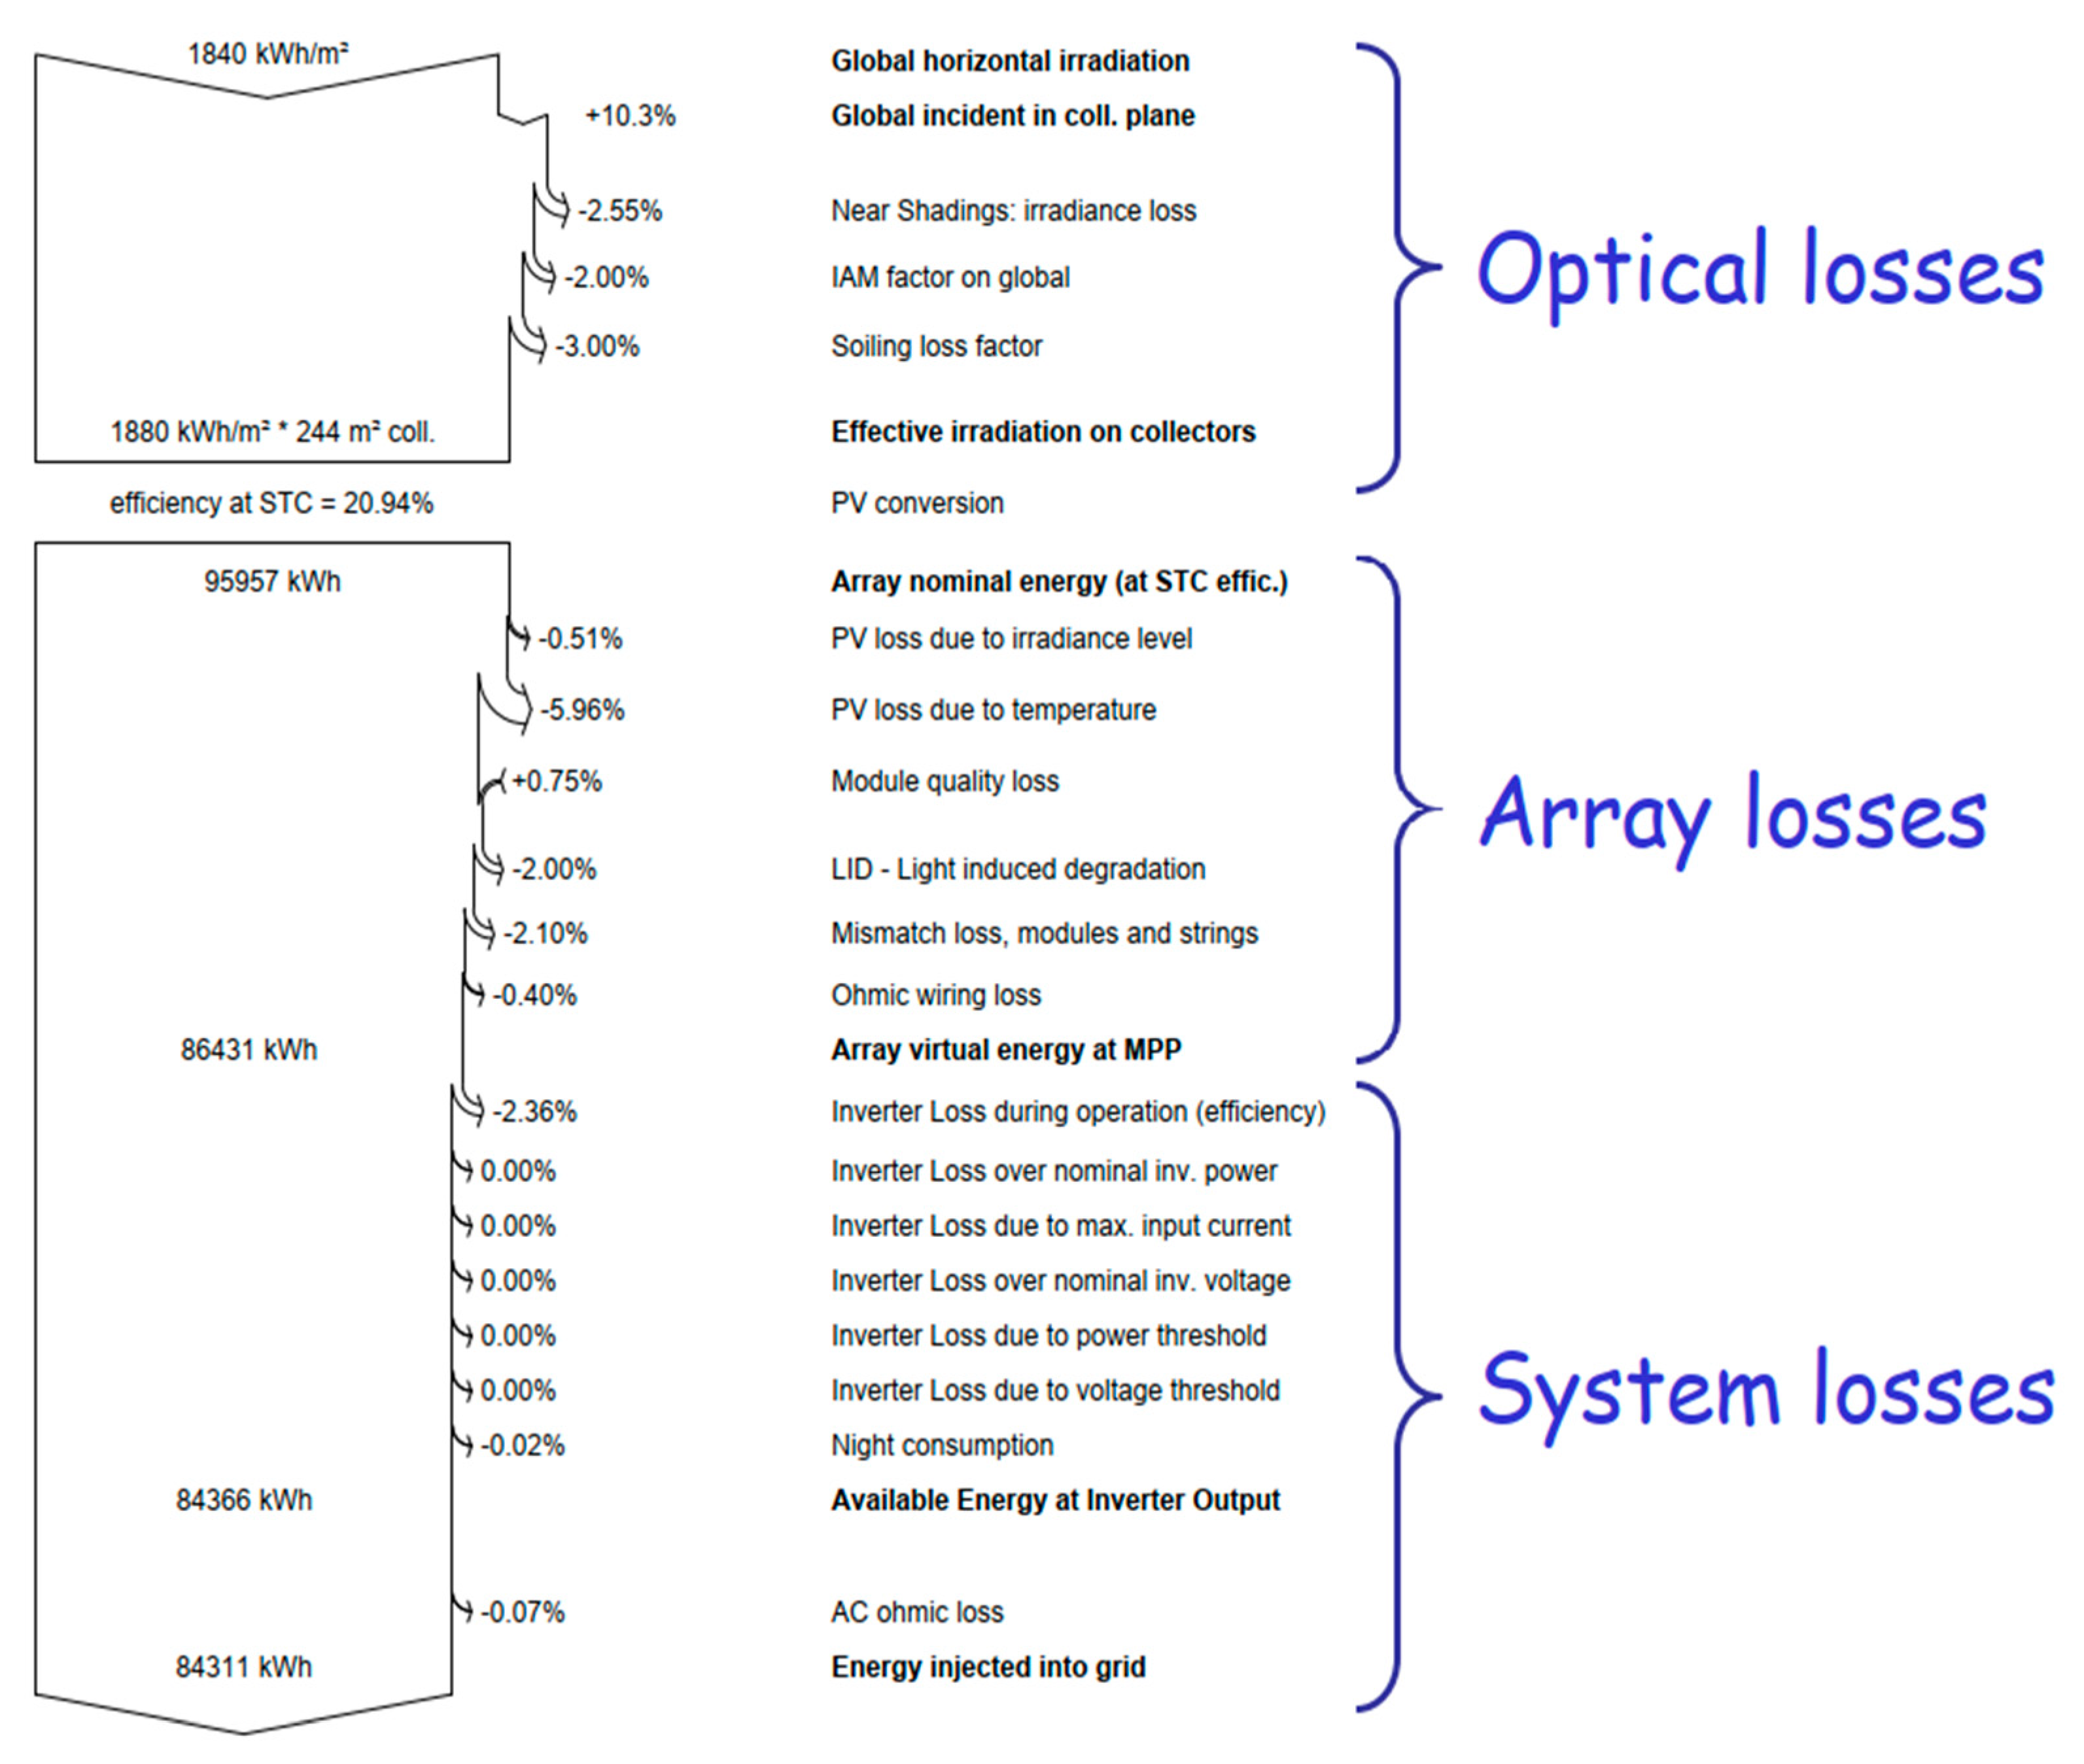
2.3.4. Detailed Losses

In this design, thermal parameter is selected for modules with air circulation, ohmic losses for 2 × 16 m of 2× single-core 6 mm2 DC cable per string and 10 m of four-core 10 mm2, module quality is selected from specifications, LID loss factor as 2%, module mismatch losses as 2%, string voltage mismatch as 0.1%, and soiling losses as 3%.

2.3.5. Shading Analysis

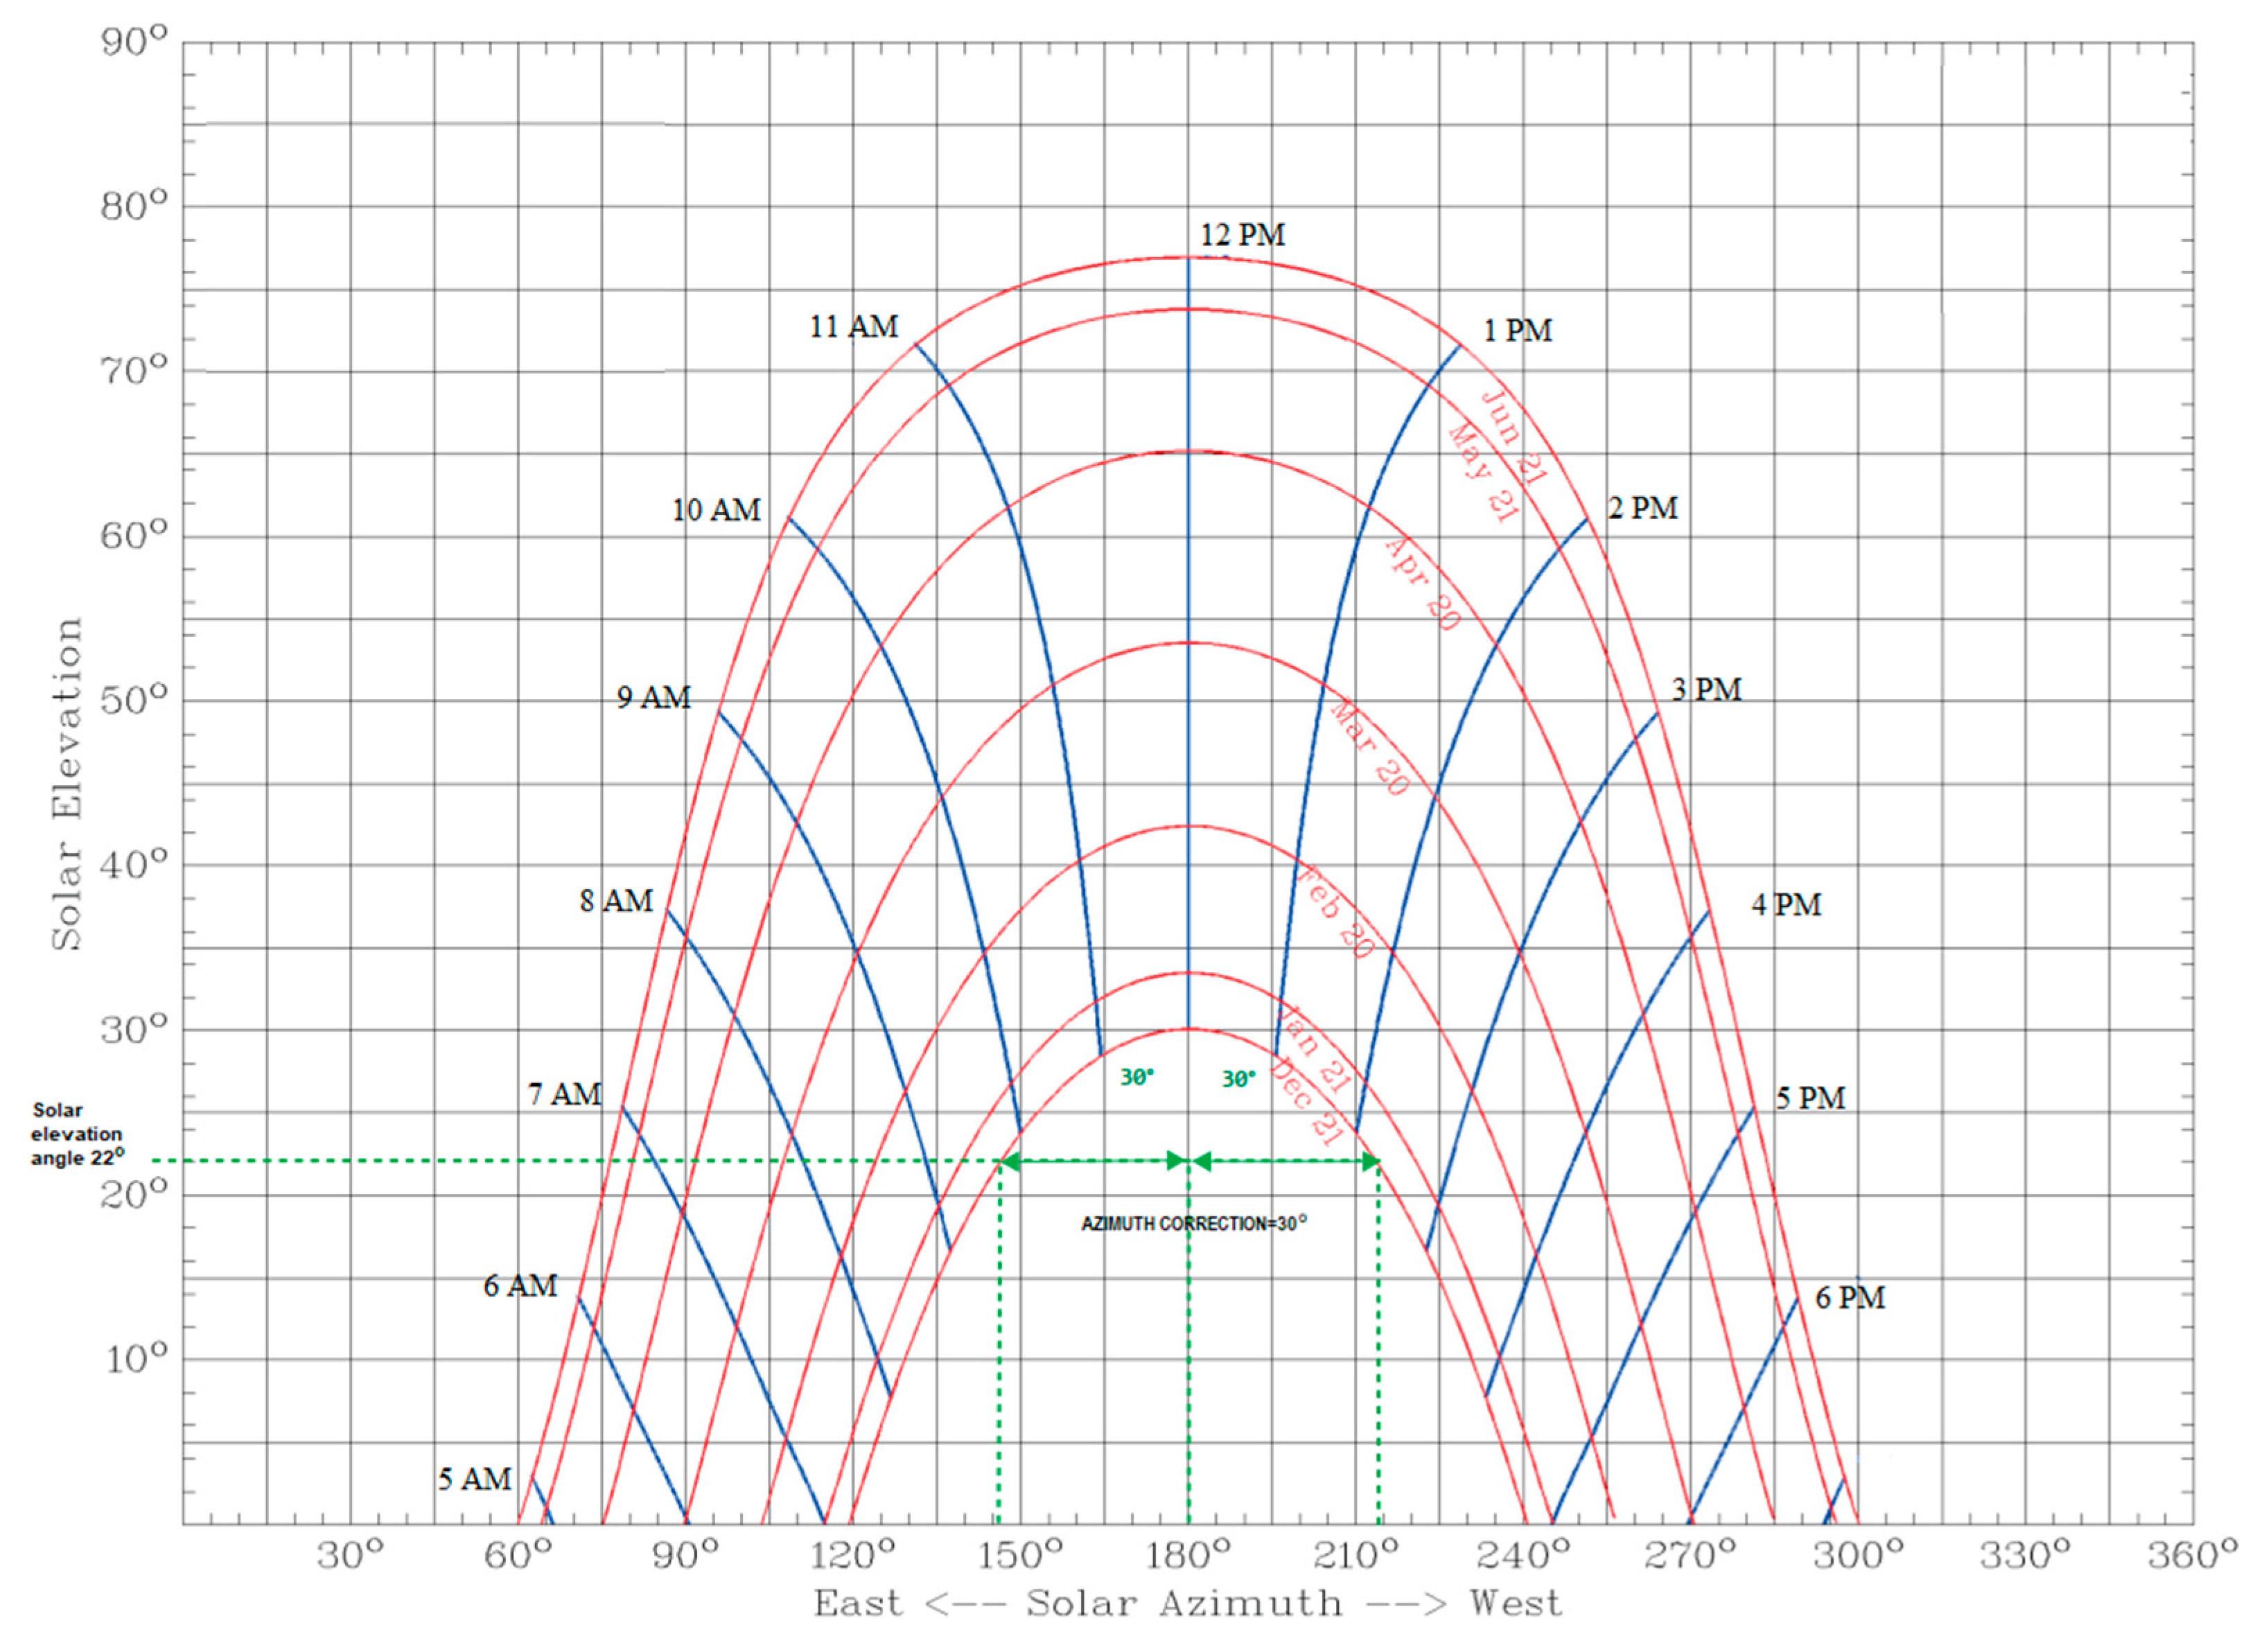
The effect of far shading is neglected because no adjacent object is casting a shadow on the modules. For the geographic location, the height of the sun’s elevation above the sky is essential, as it is understood that the lowest is on the winter solstice, i.e., in December. 
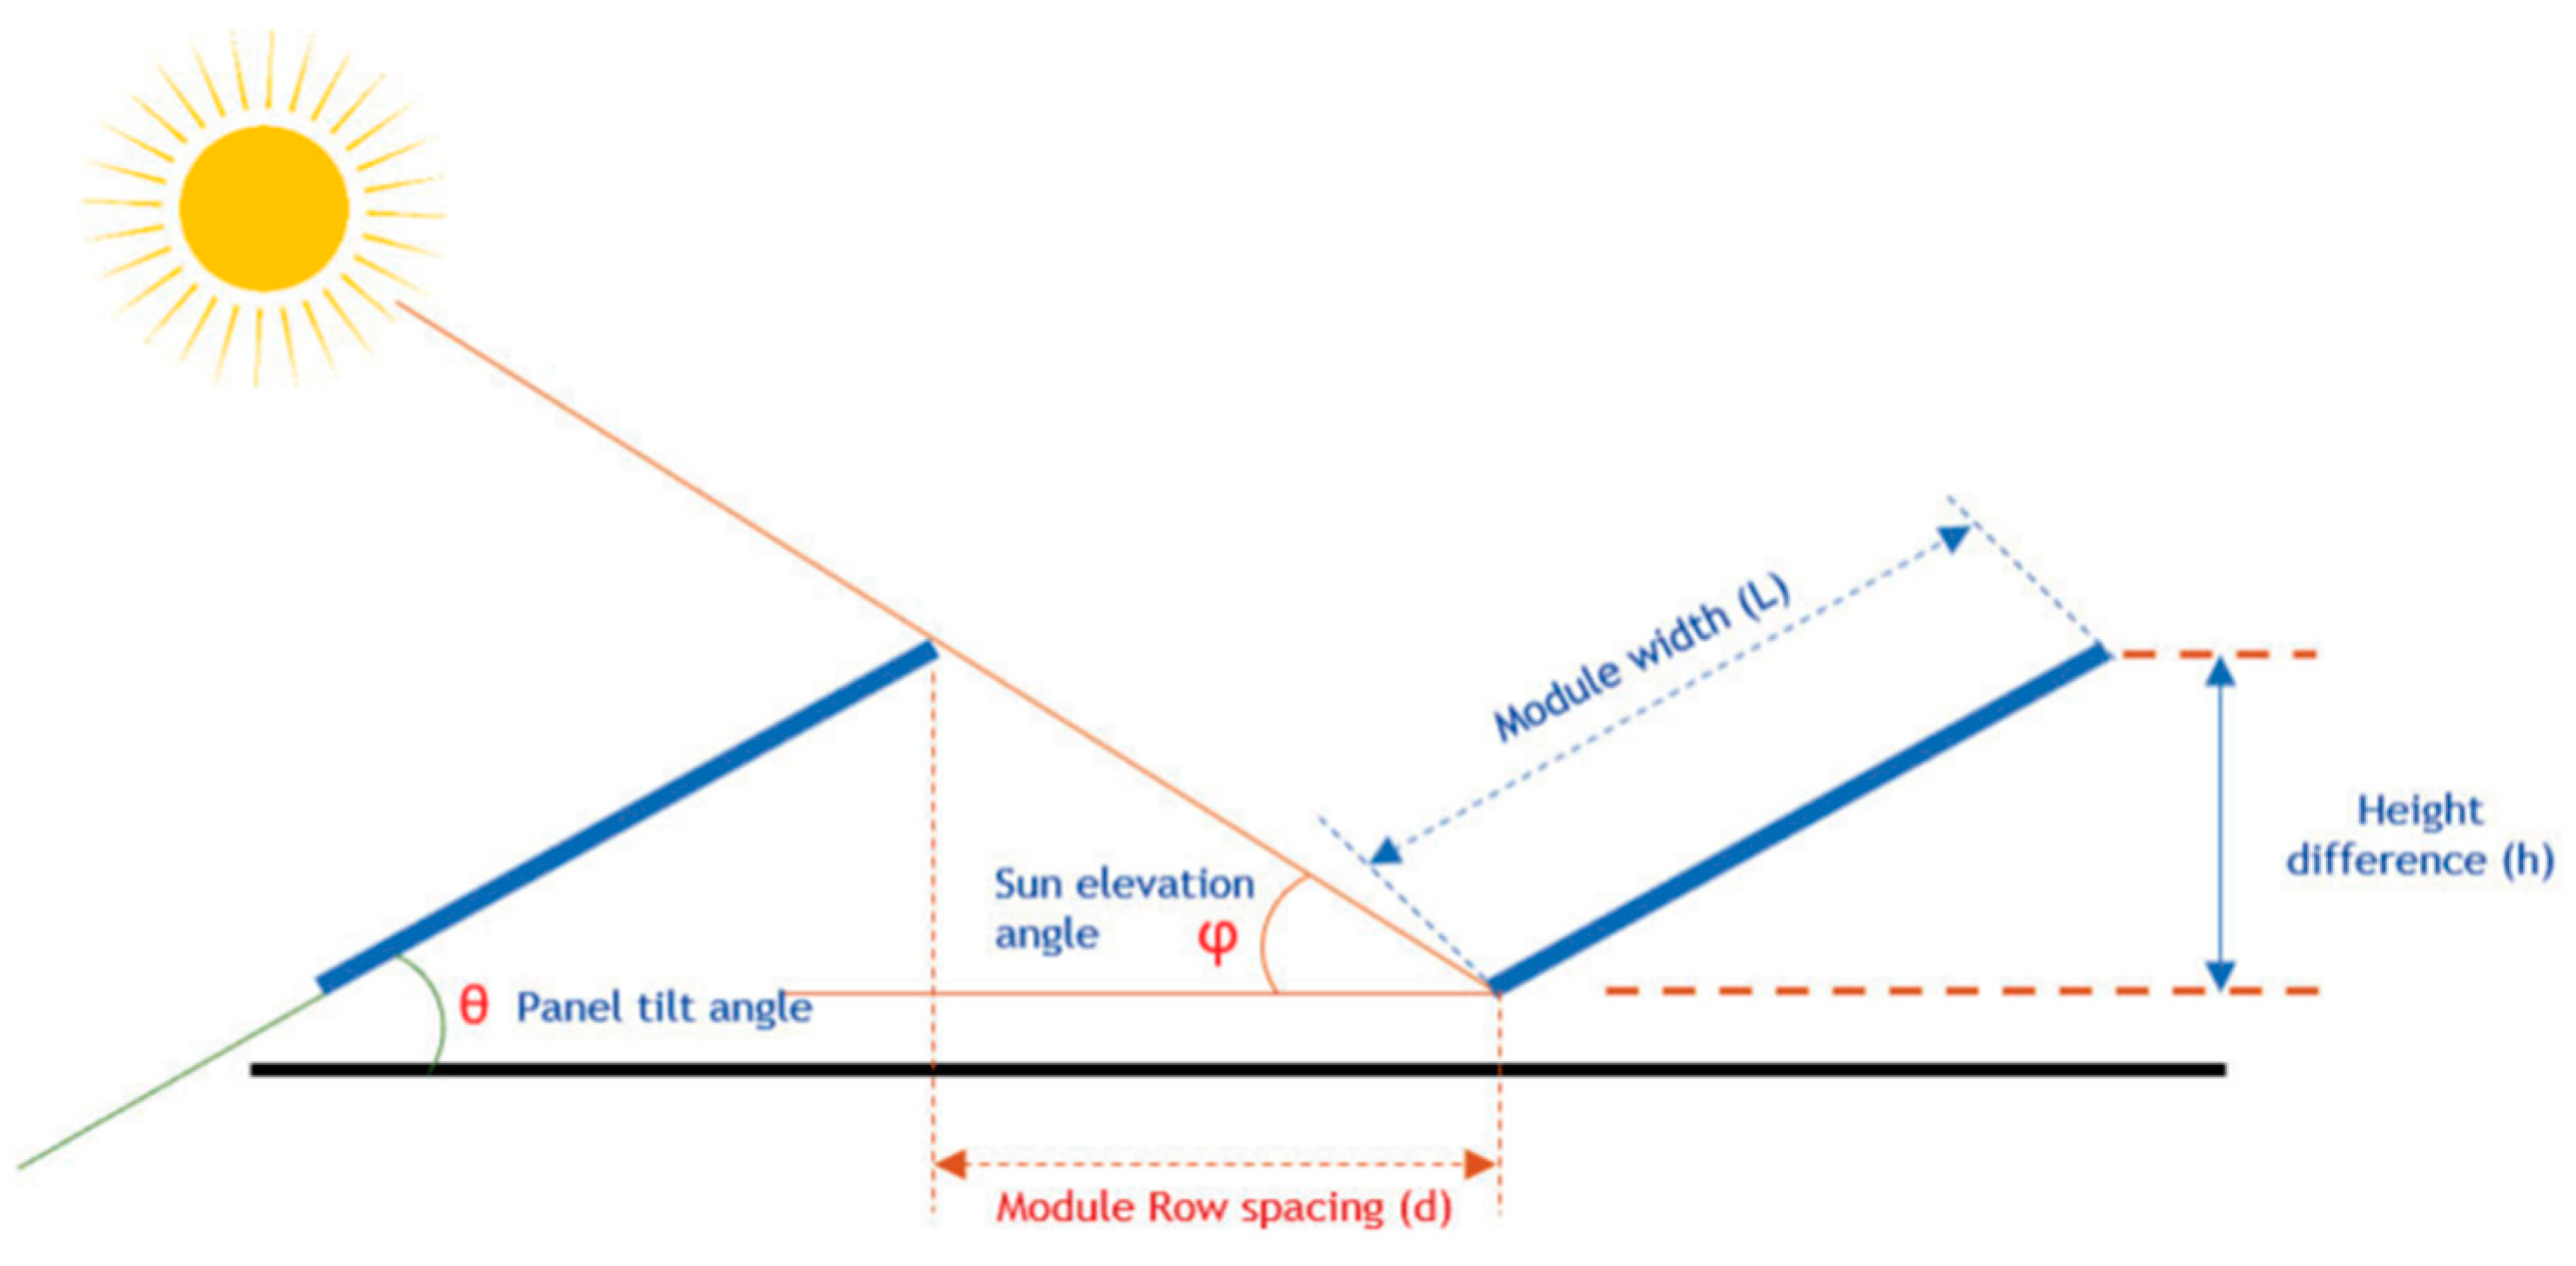
Figure 4 represents the solar elevation angle corresponding to the field coordinates. Depending on the geographic location—the hemisphere, zone, and the exact location expressed in degrees—the sun’s height can be calculated as shown in Figure 5.
H e i g h t   d i f f e r e n c e h = s i n   θ × L
Here, θ is tilt angle (°) and L is module width (m). The selected solar panel width is 2.176 m. There are two panels in a module width; hence, the module width is 2 × 2.176 = 4.352 m.
M o d u l e   s h a d i n g   l e n g t h = h A t a n   φ
Here, h is the height difference (m) and φ is the sun elevation angle (°) from the plot, the sun elevation angle for December 21st, and the picked-up time frame for 10 a.m. to 2 p.m. is 24°.
Further, the azimuth angle correction shall be considered to calculate the minimum row spacing (d). For this location, the calculated azimuth angle for December 21 is 30°.
d = M o d u l e   s h a d i n g   l e n g t h × c o s   ( α )
Here, d is the minimum module shading length and α is the azimuth correction angle (reference from the sun elevation angle plot, Figure 4). Results of shading calculations are shown in Table 8. Moreover, 
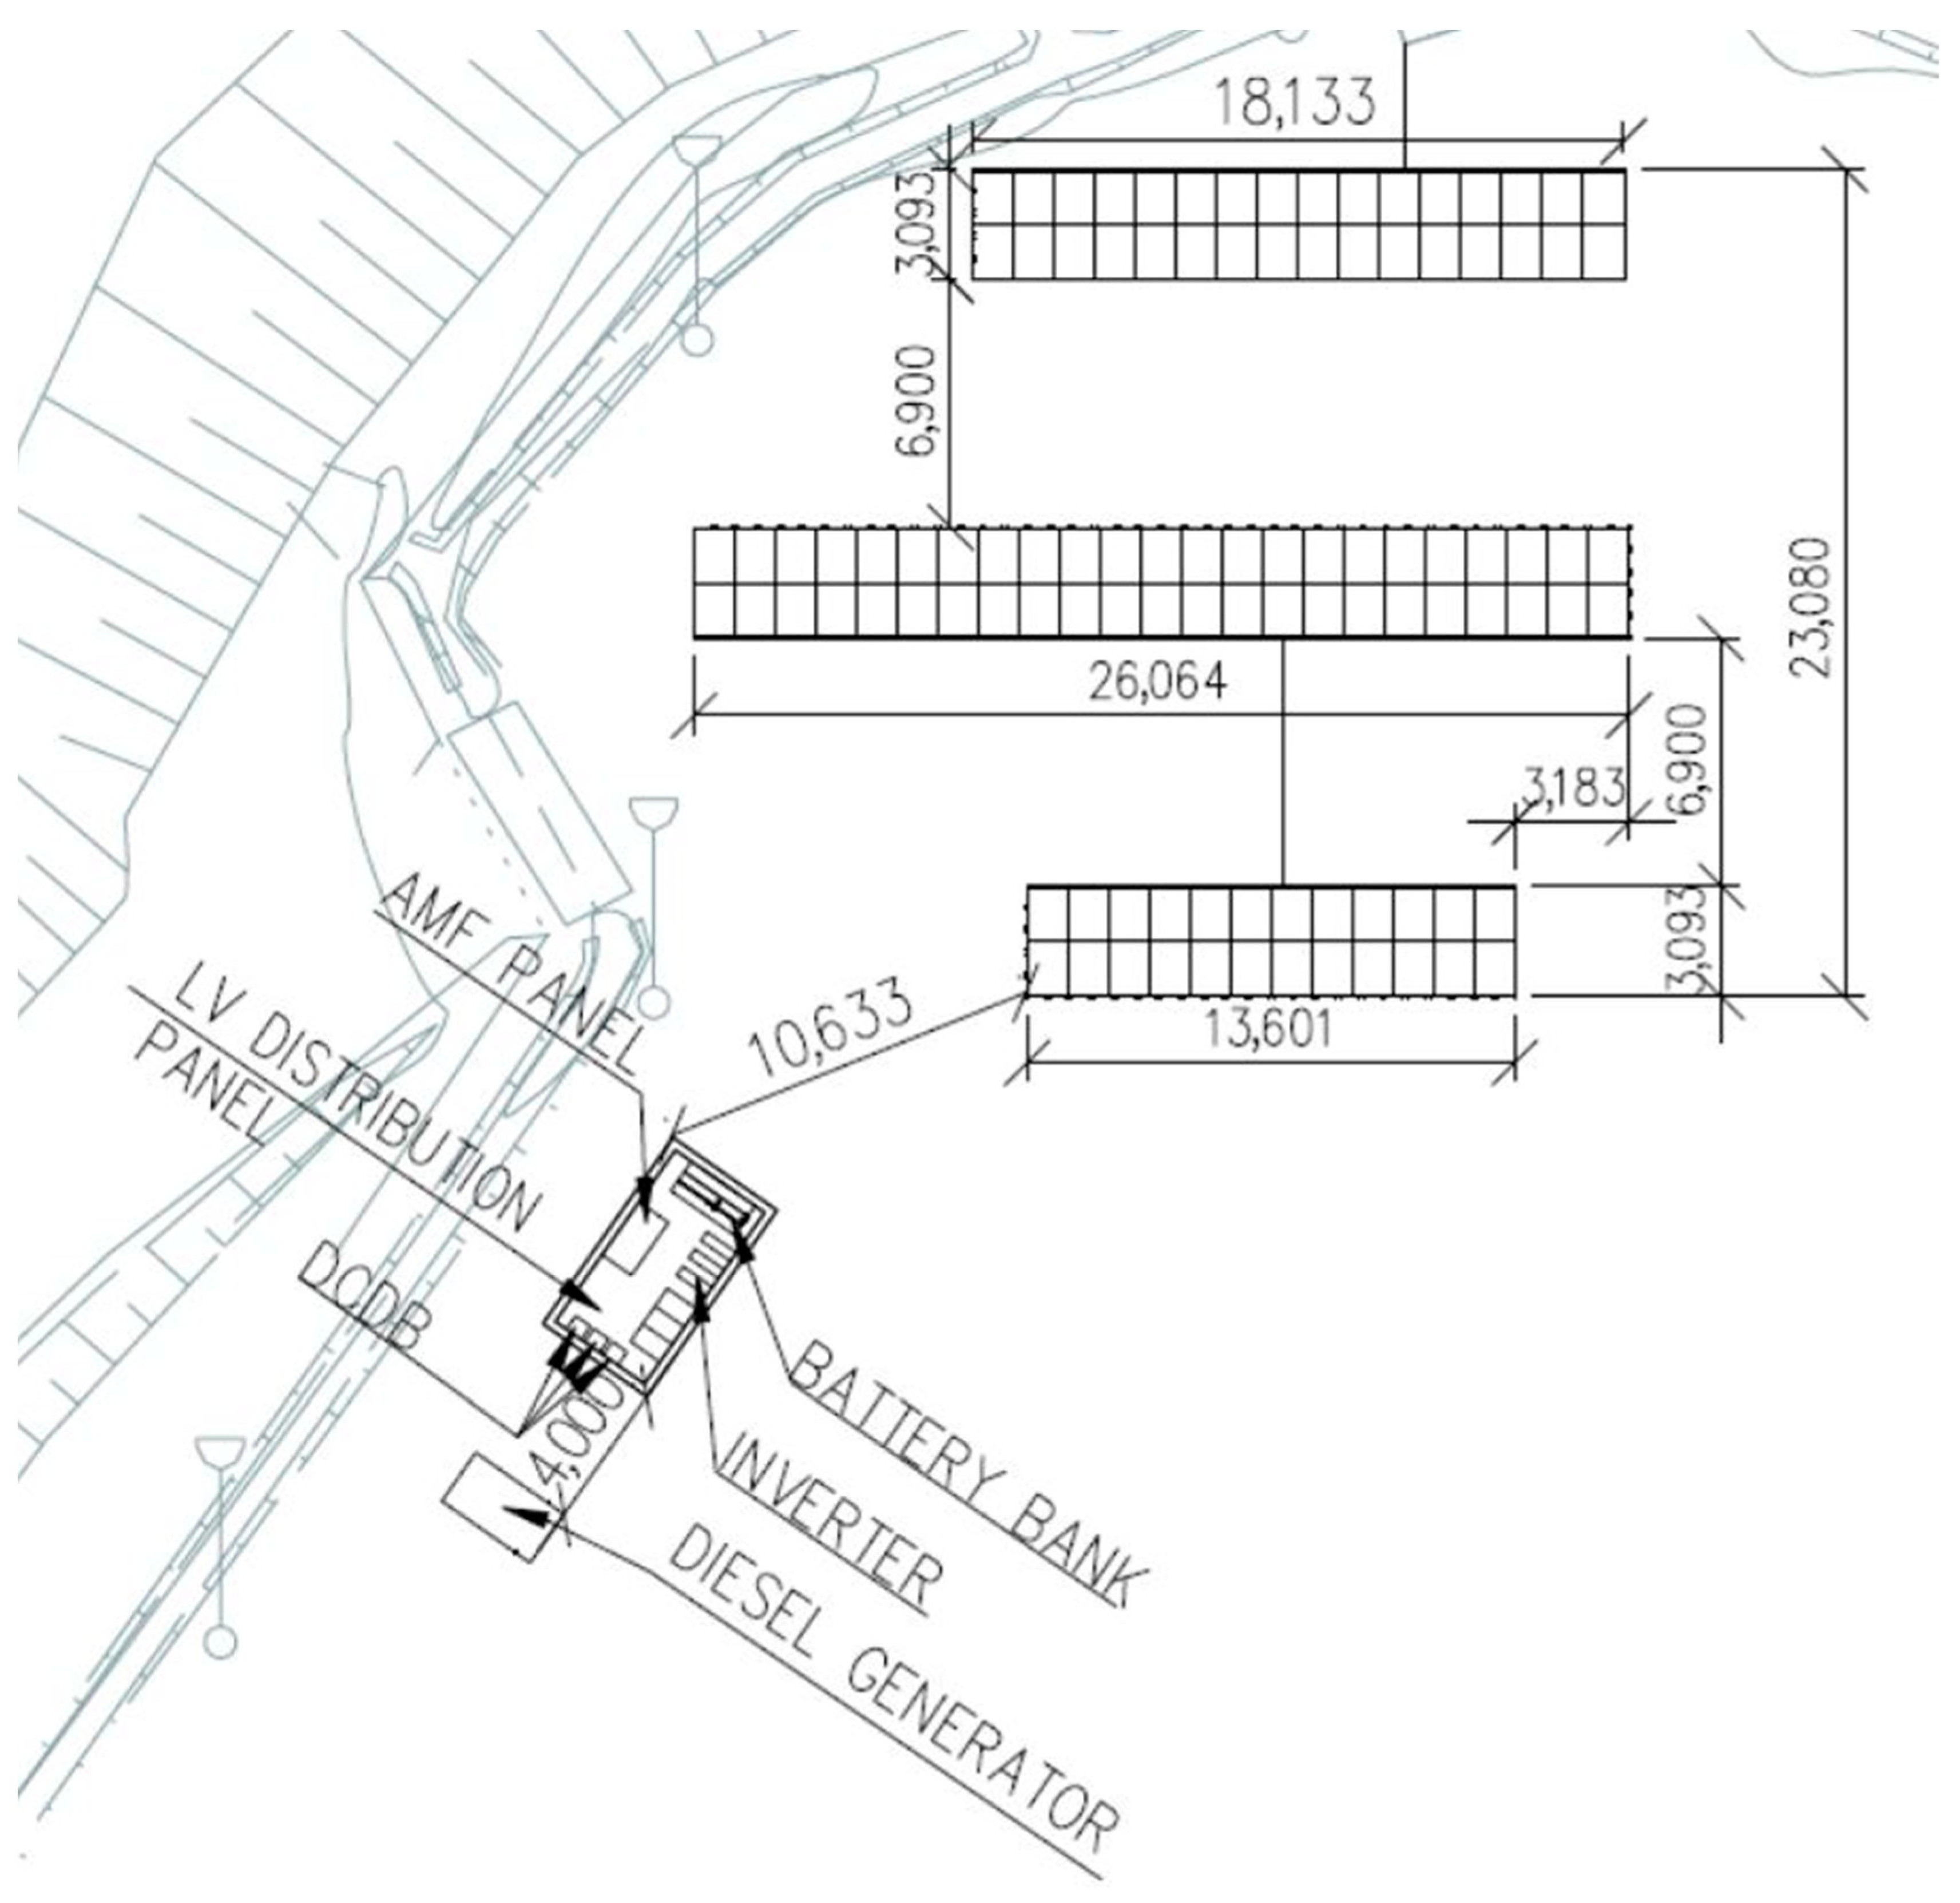
Figure 6 shows the architectural layout for the PV power plant at the site.

2.4. Designing the Hybrid Stand-Alone Microgrid

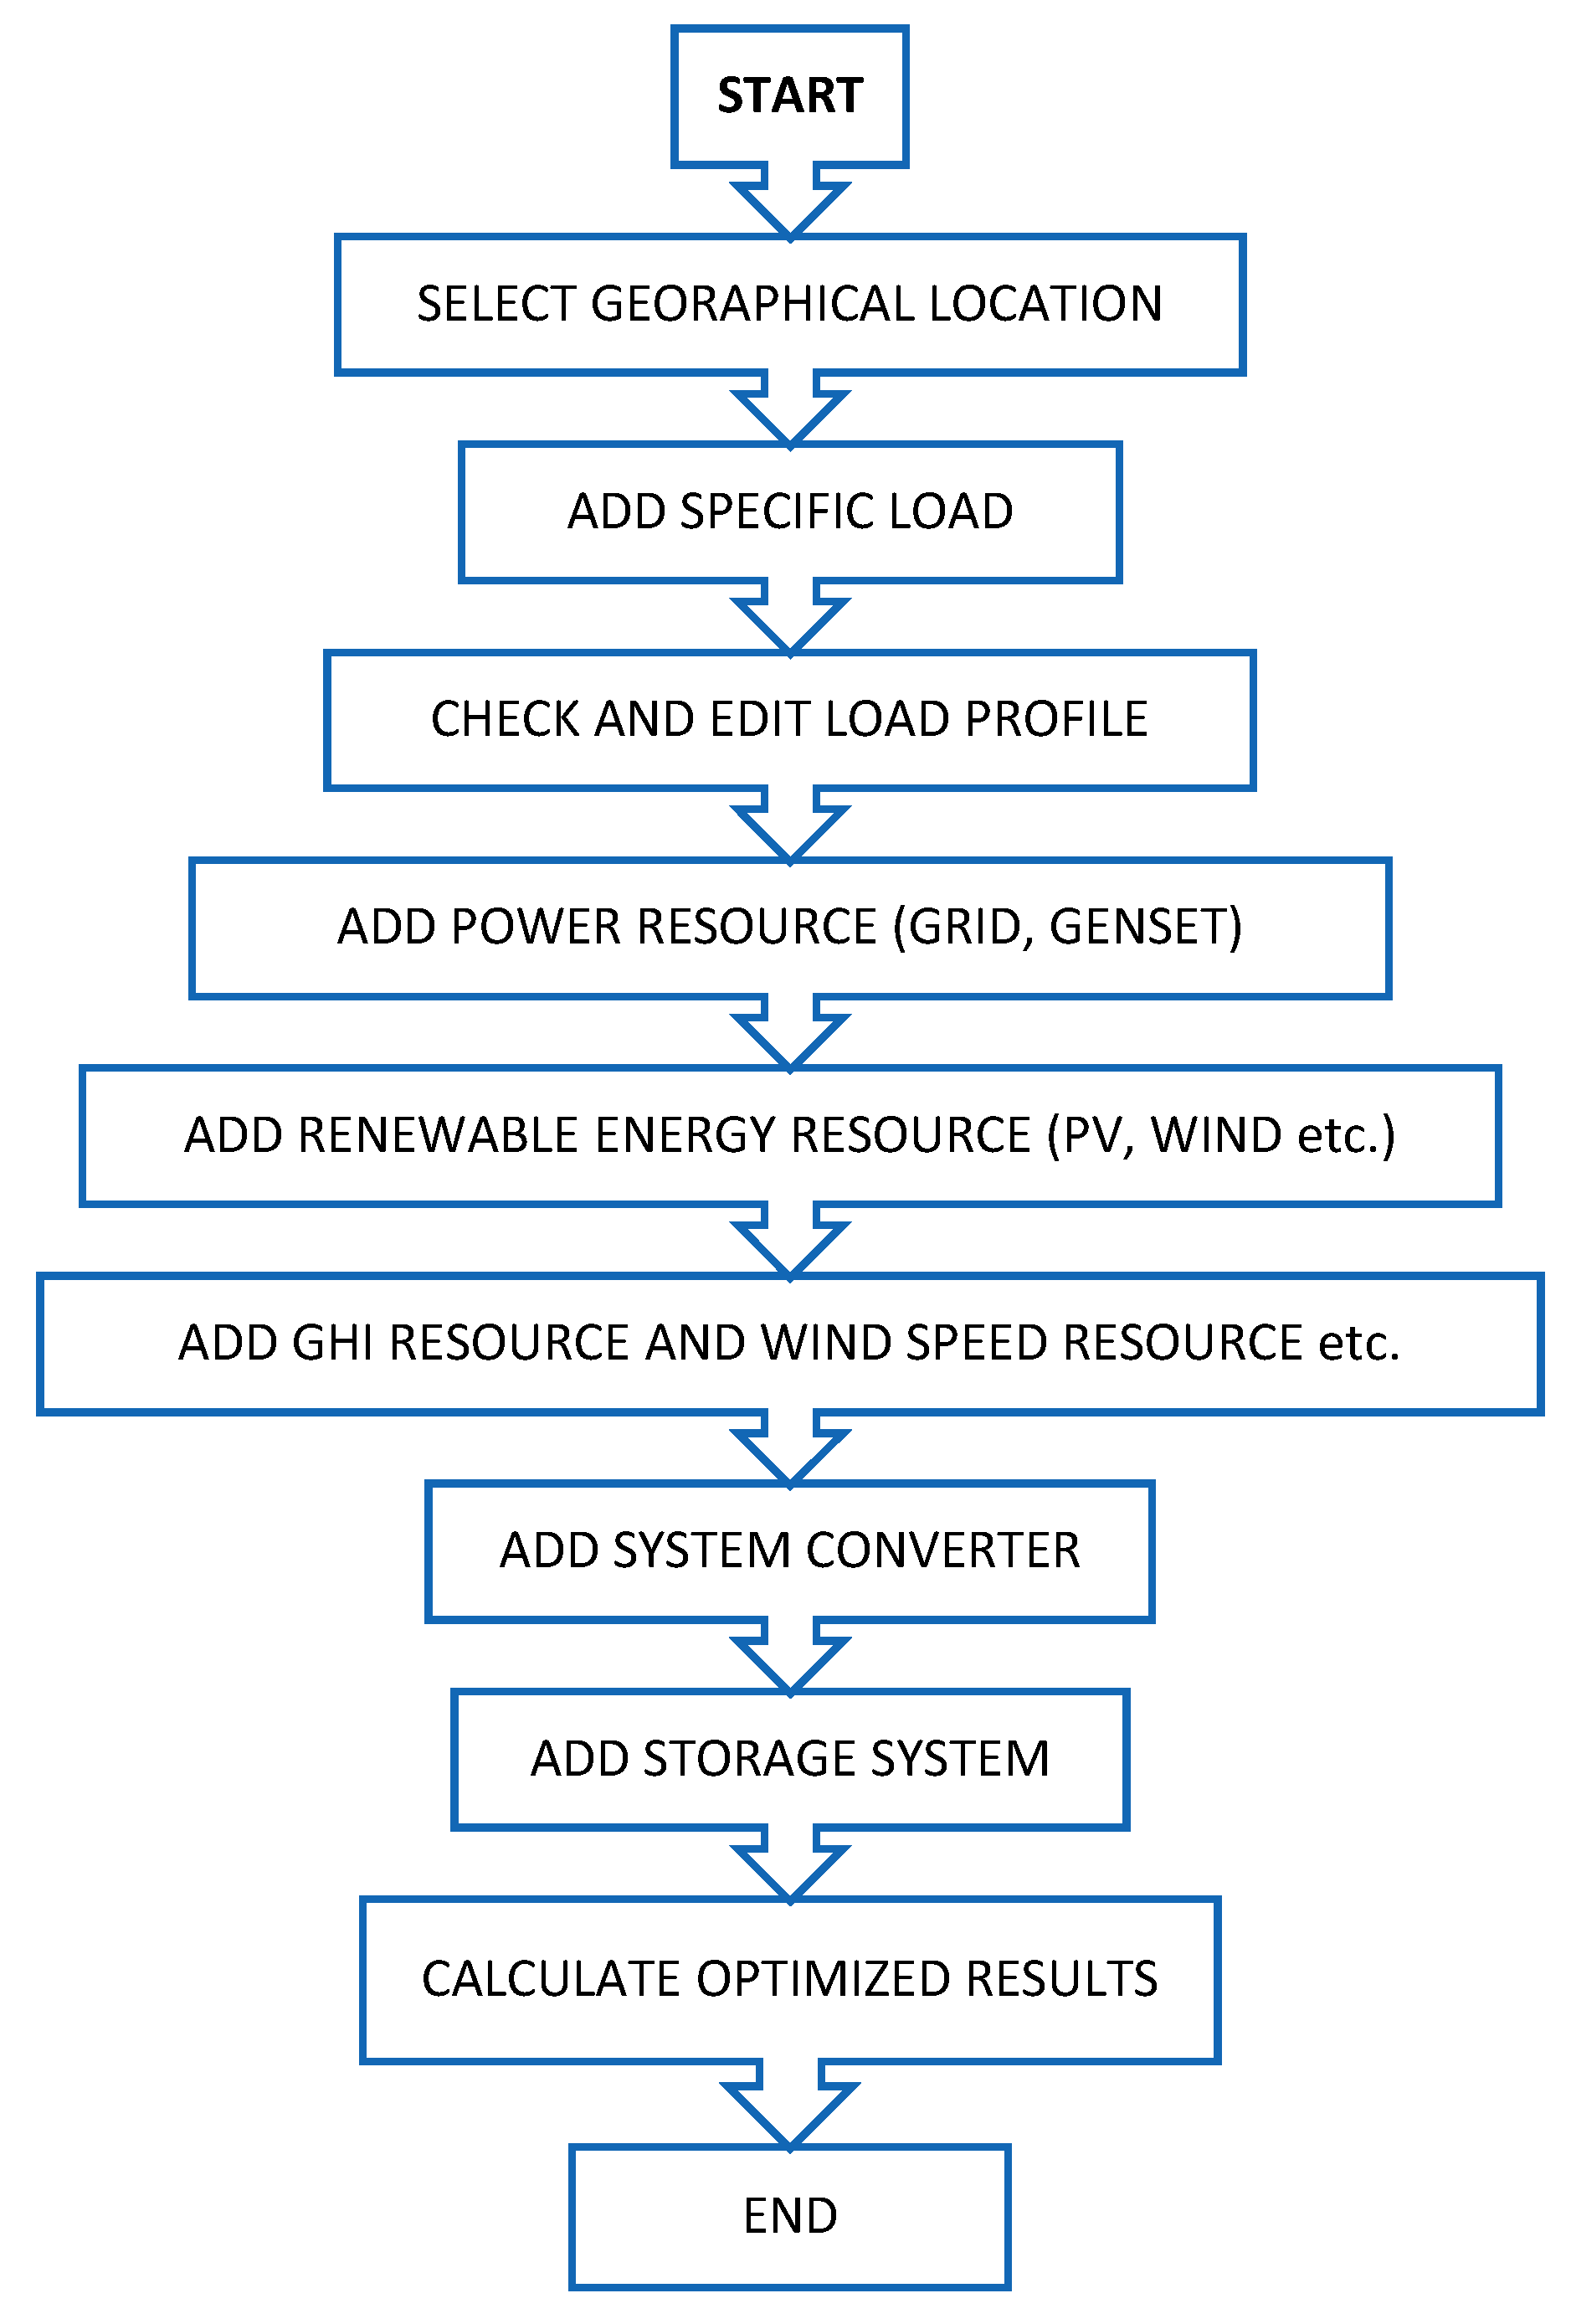
The HOMER Pro version 3.14.2 software has many advantages and is utilized for the hybrid stand-alone microgrid model’s planning, design, and optimization. These advantages include its capacity to accommodate various renewable energy resources and several other elements needed for the reliable hybrid stand-alone microgrid model. The software is quite competent in determining the model’s economic and technological viability. The flowchart for designing the hybrid stand-alone microgrid using HOMER Pro software is shown in 
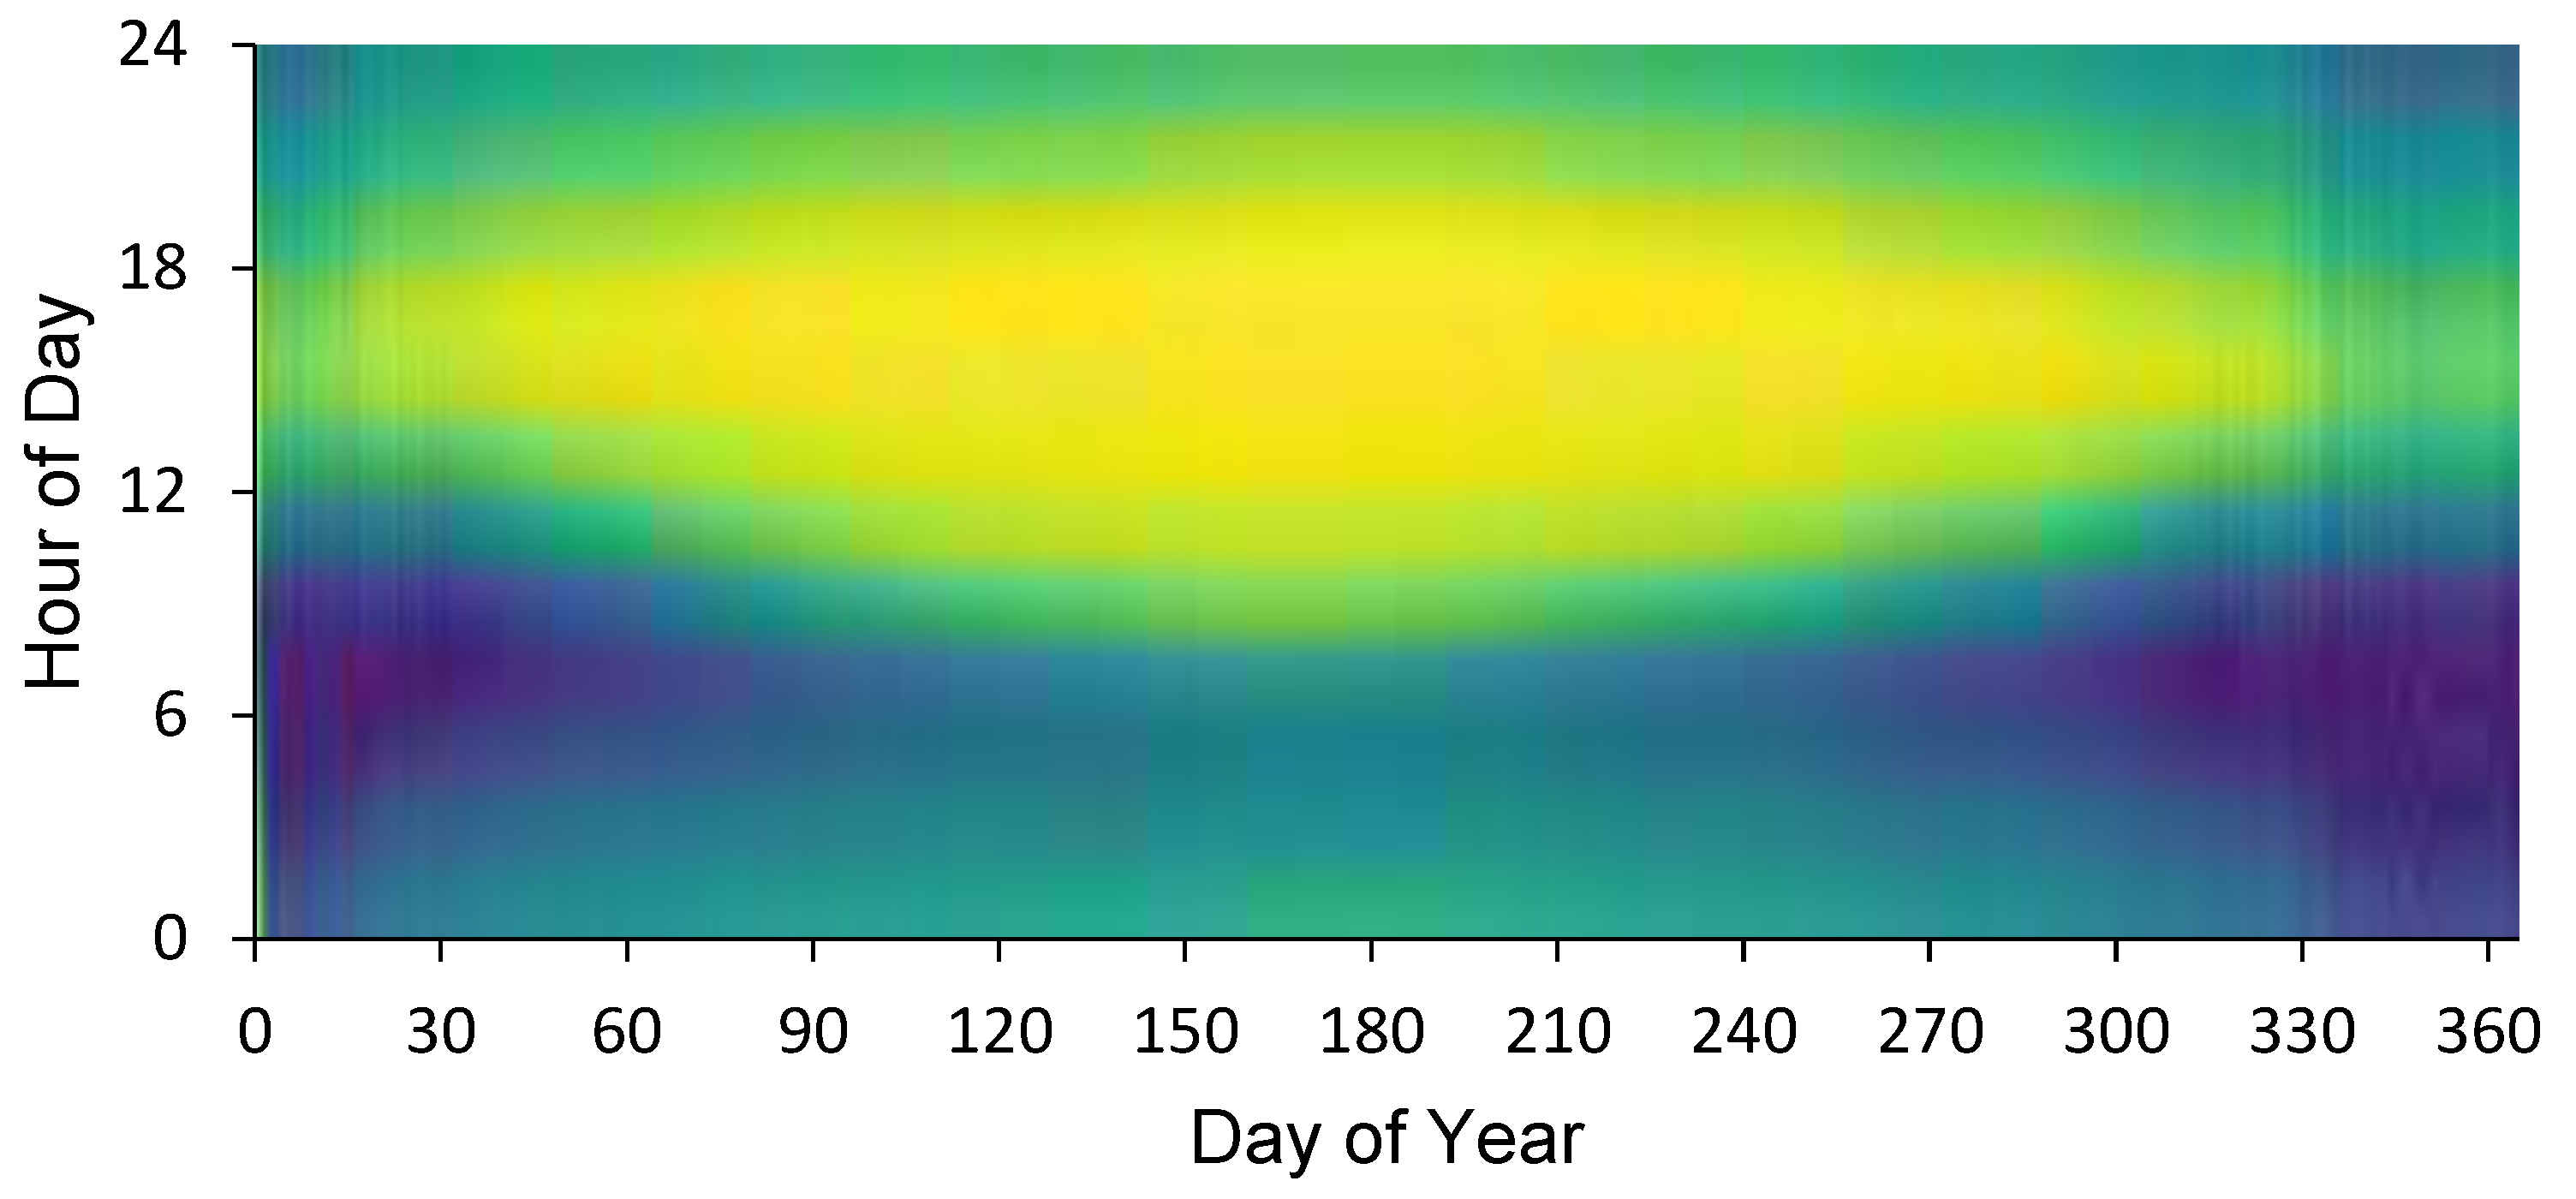
Figure 7. The HOMER Pro software imports the PV plant’s CSV file from the PVsyst software for better results.
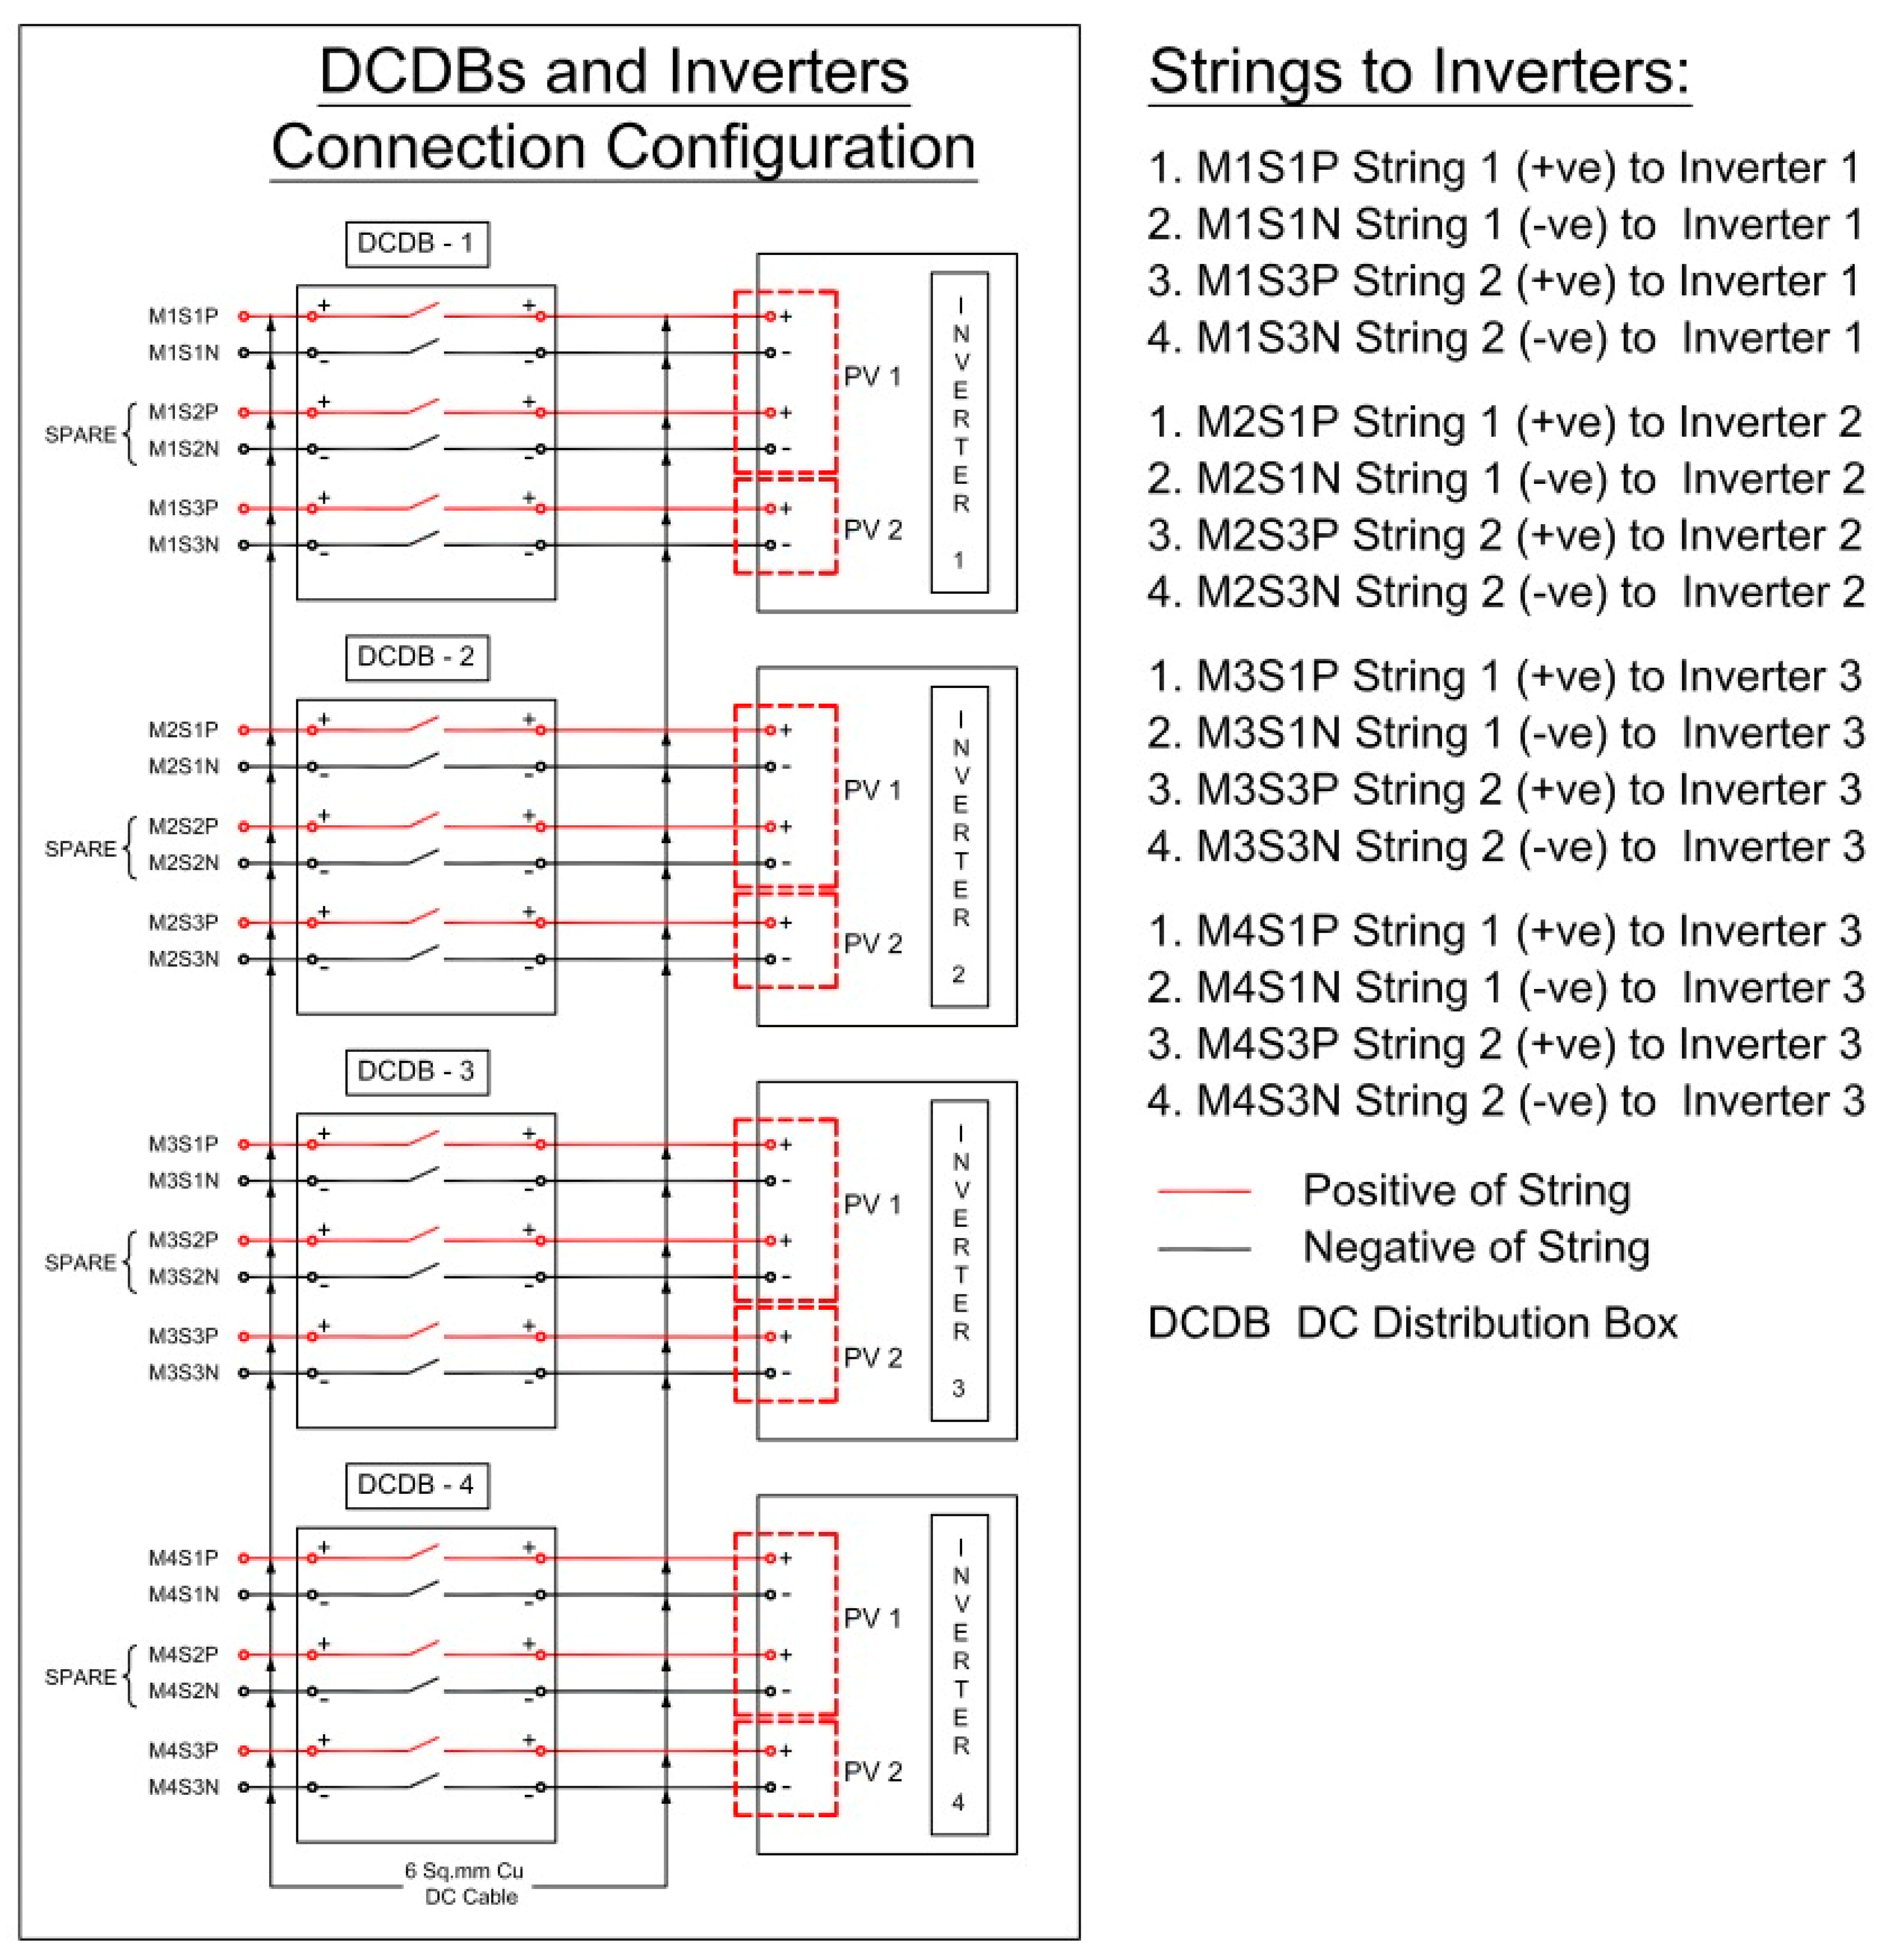
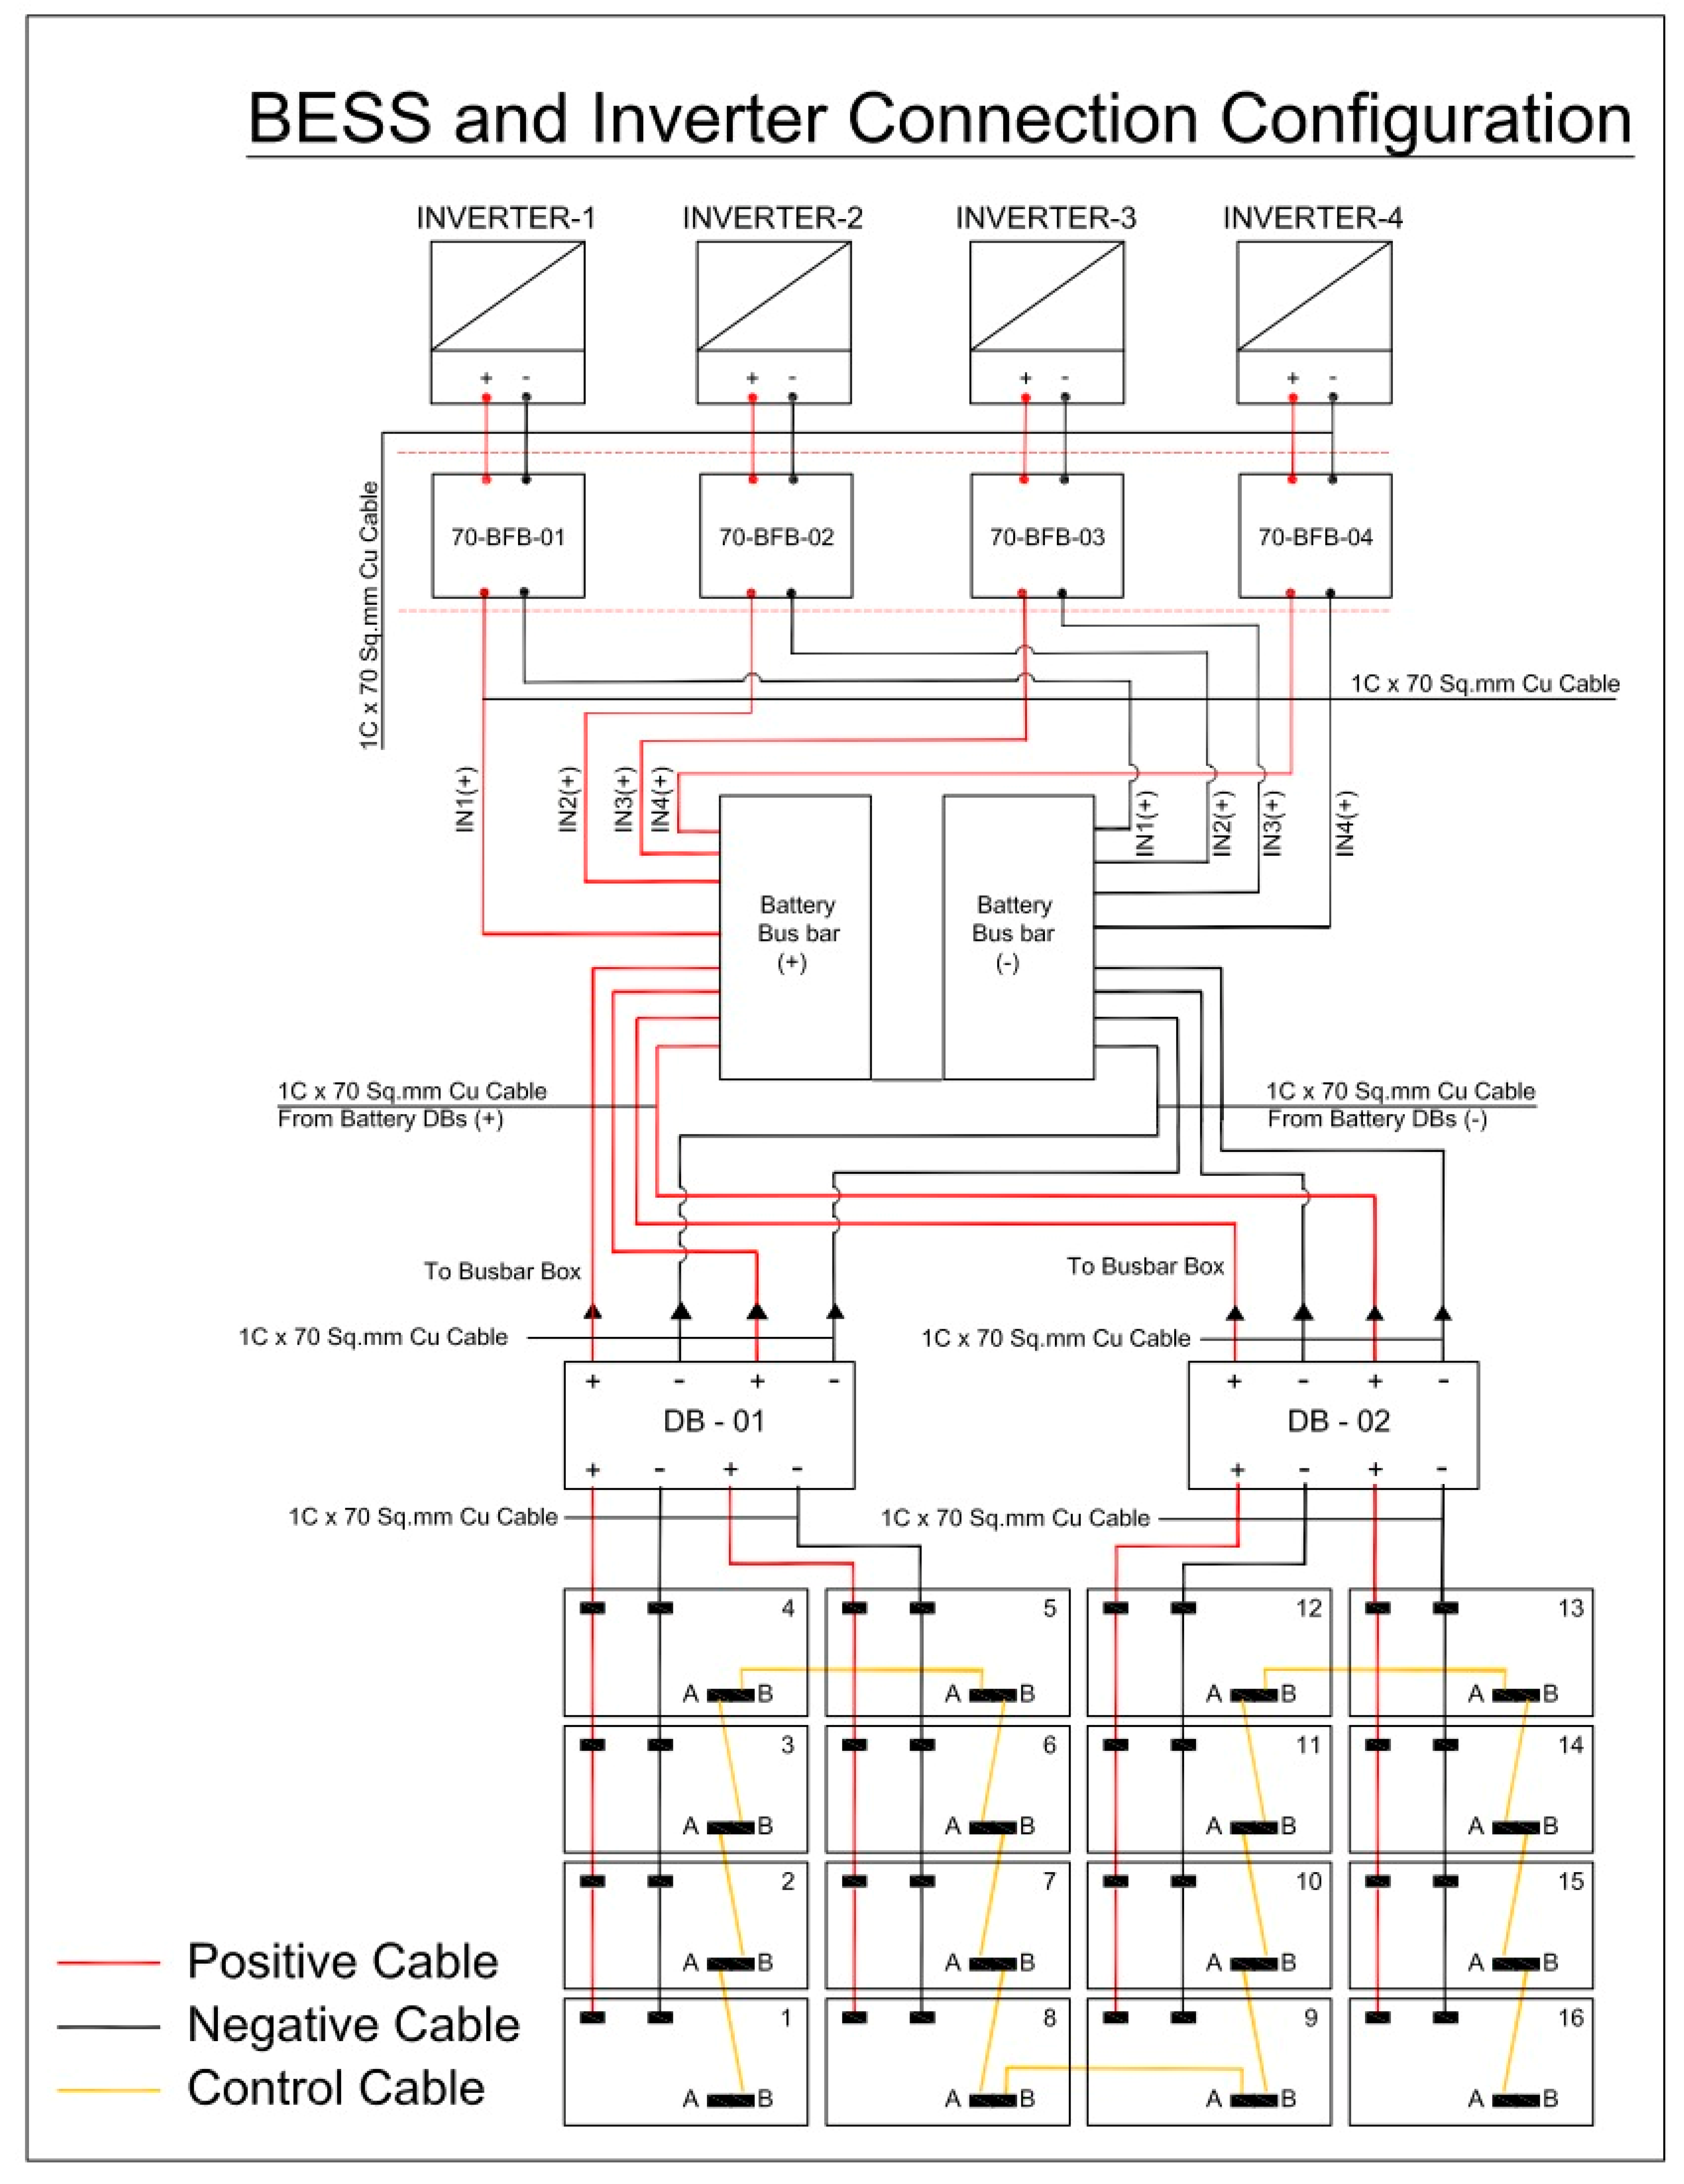
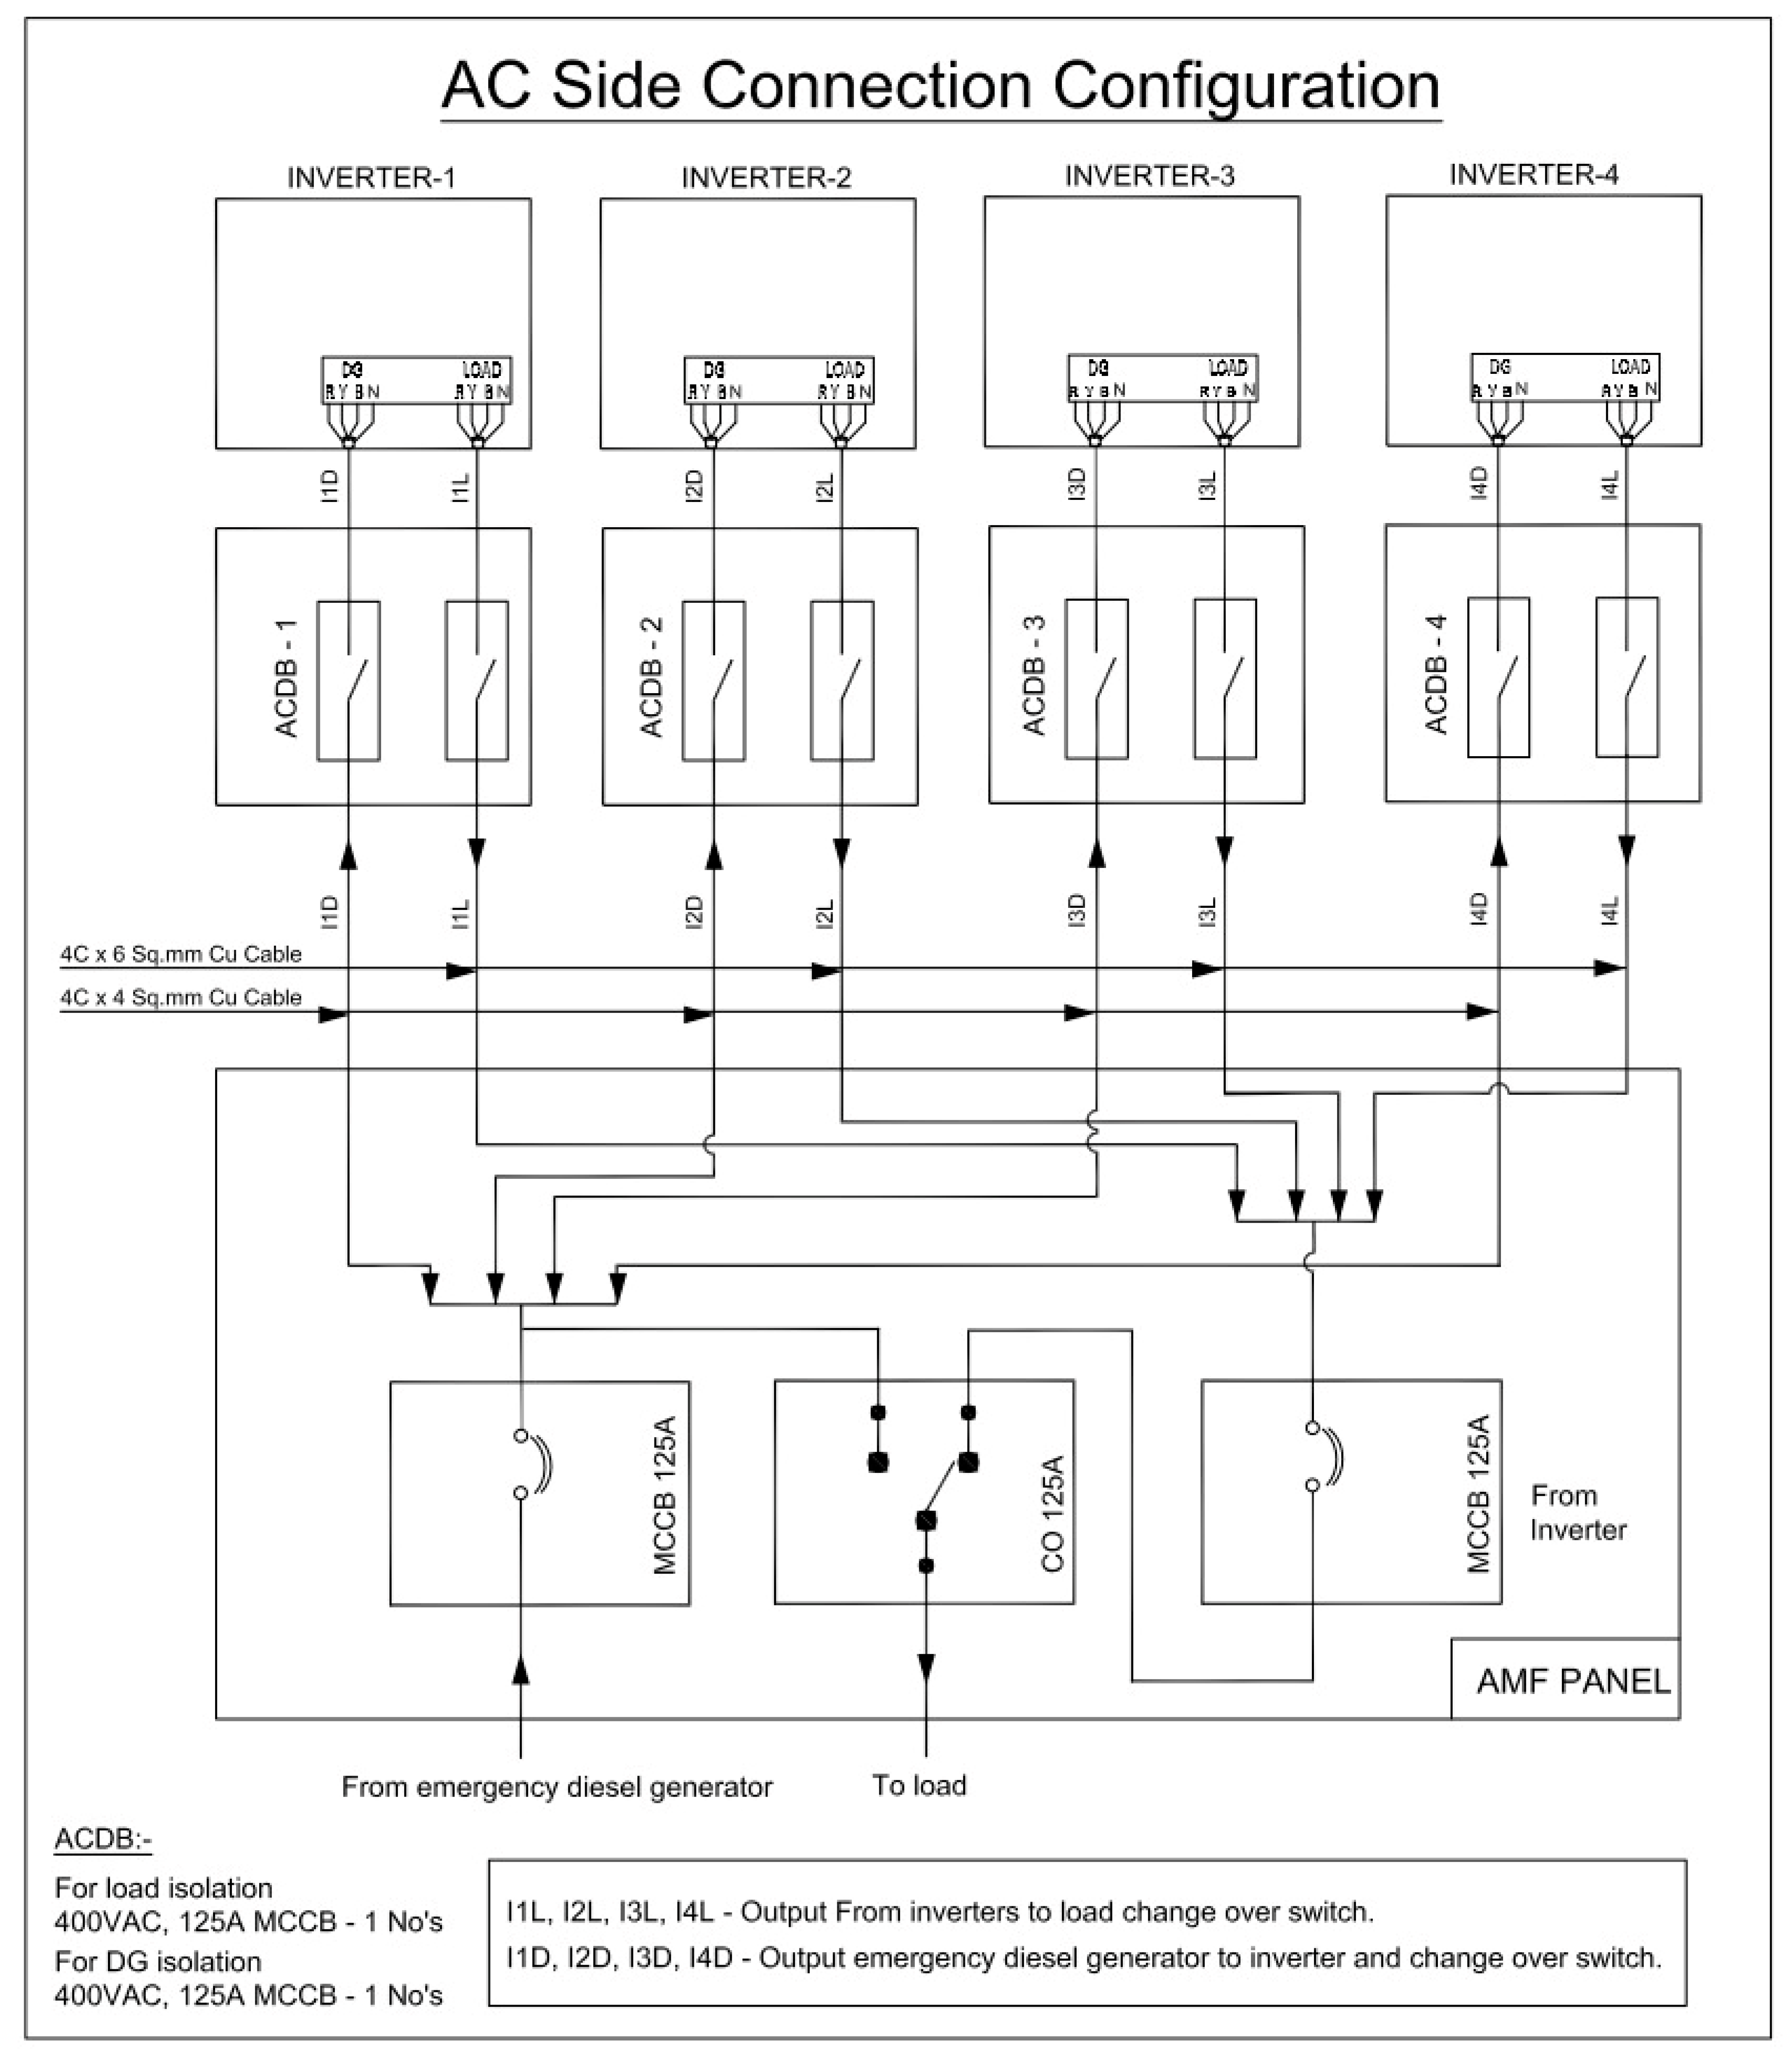
Moreover, Figure 8, Figure 9 and Figure 10 shows schematics of the connection diagram for several hybrid stand-alone microgrid components, including the configurations for the DC distribution box, inverter, AC distribution box, BESS, load, and EDG of the proposed hybrid stand-alone microgrid network. Figure 8 represents the schematics of DCDBs and inverters’ connection configuration, Figure 9 represents the schematics of BESS and inverters’ connection configuration, and Figure 10 represents the schematics of AC side connection configuration.

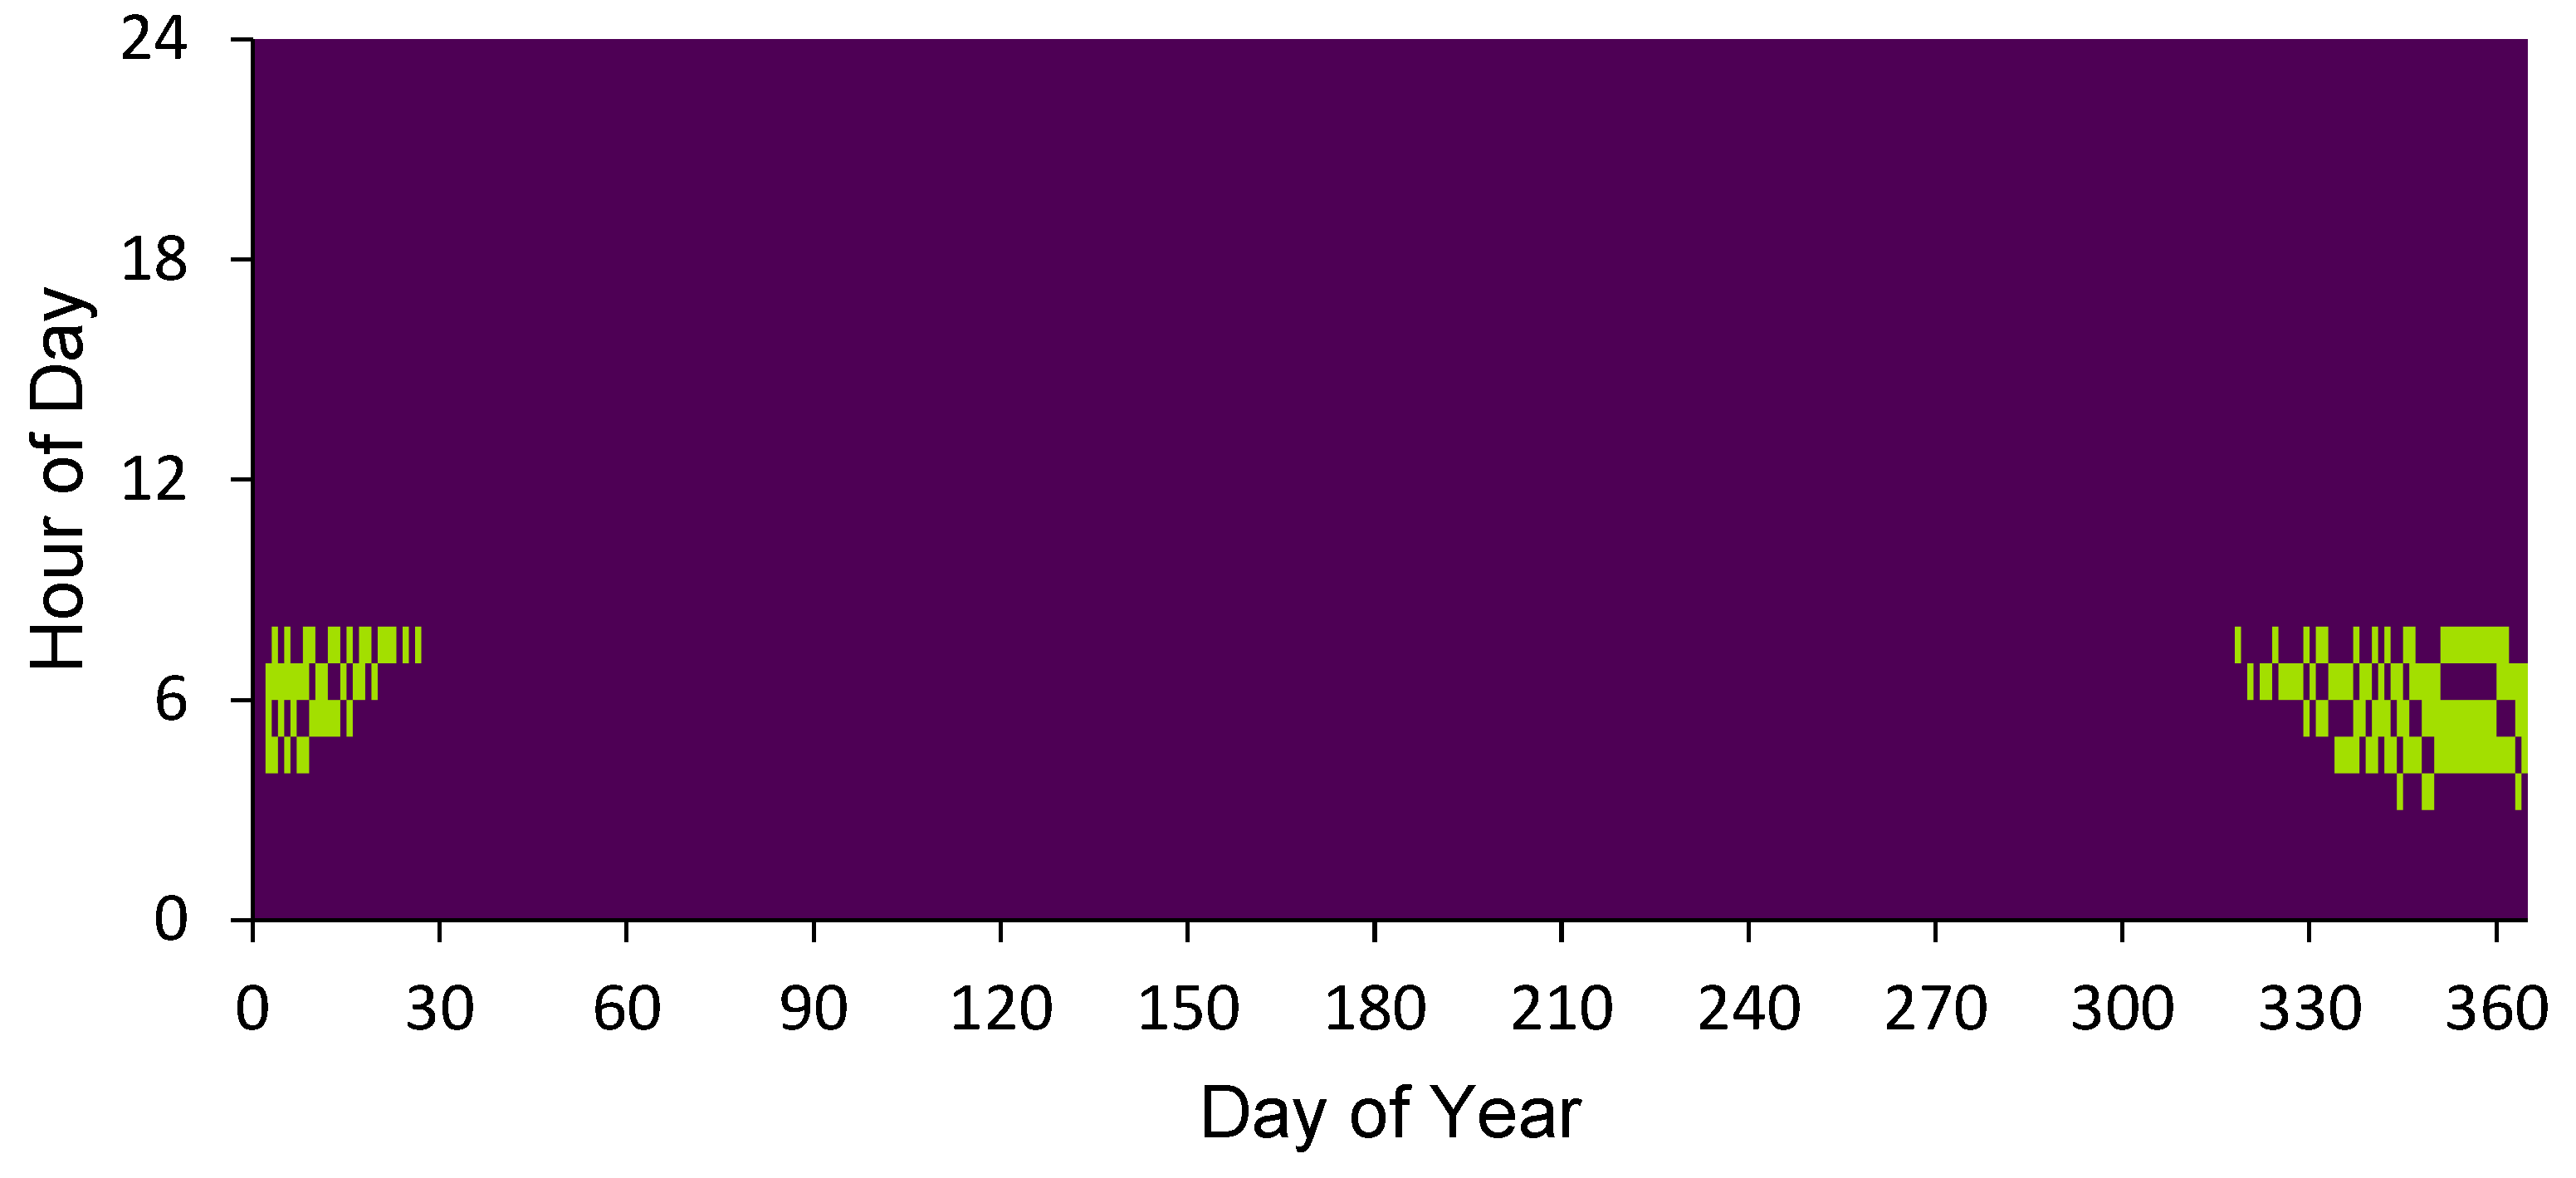
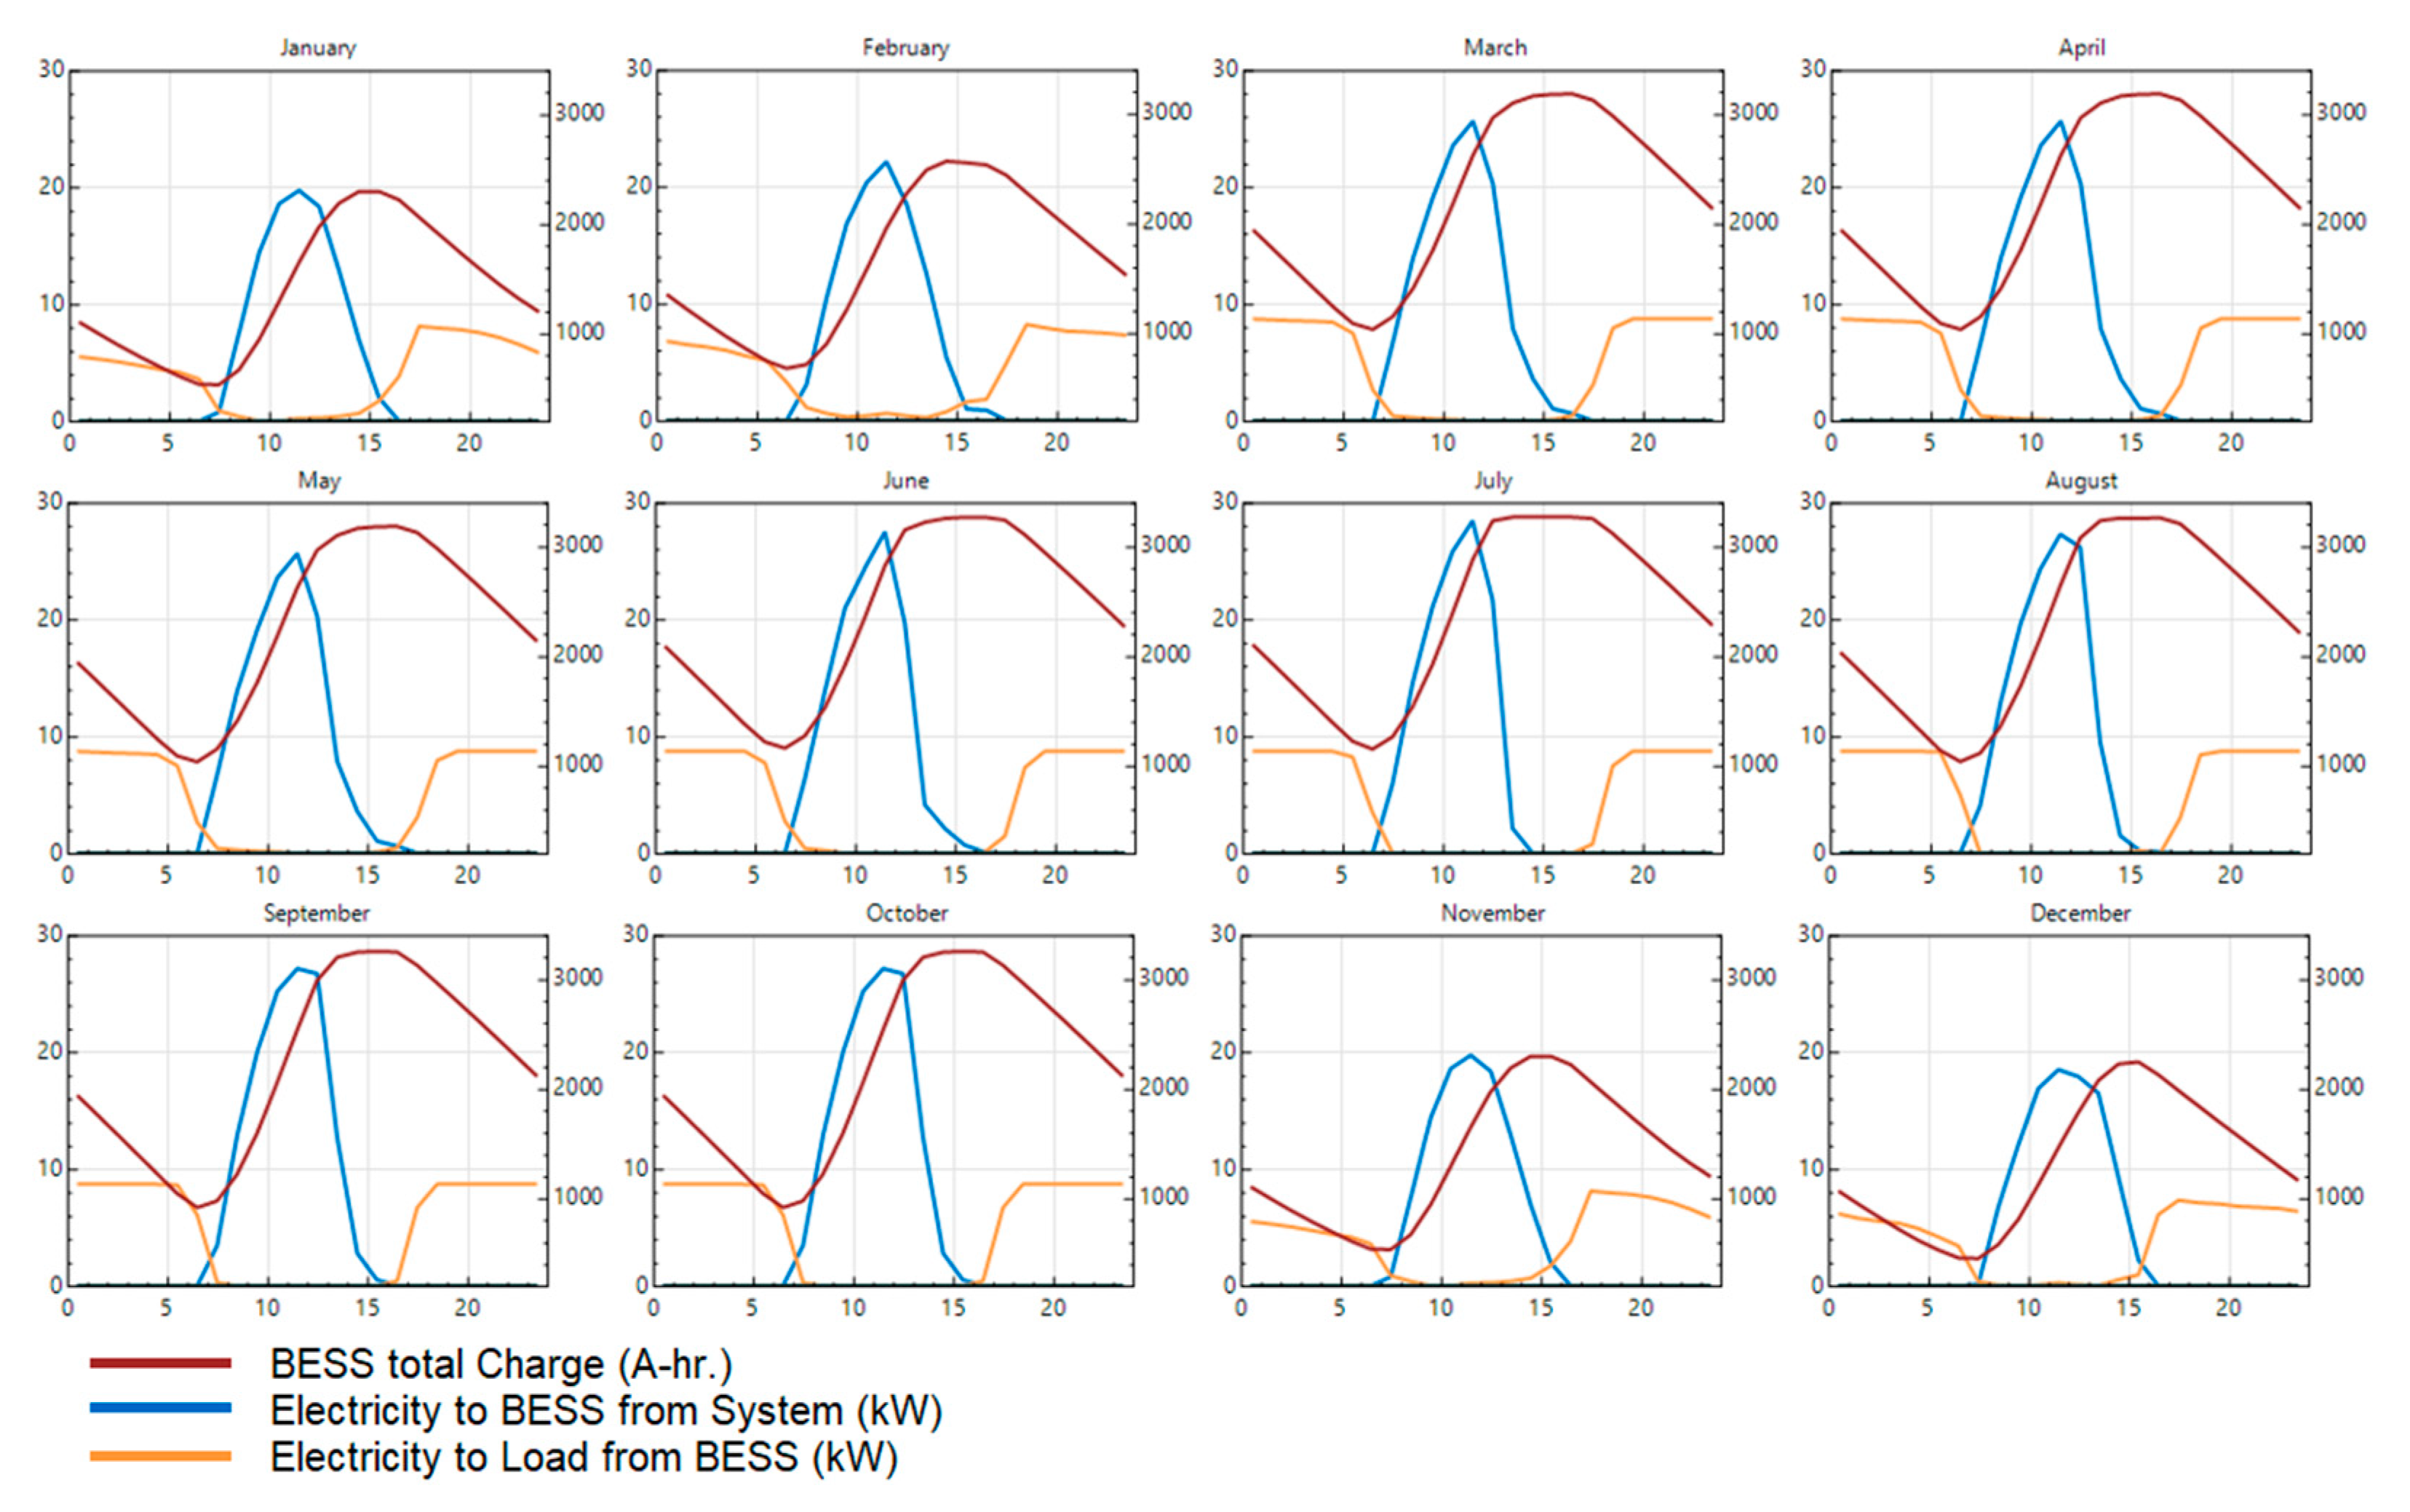
2.5. Performance Analysis of Hybrid Stand-Alone Microgrid

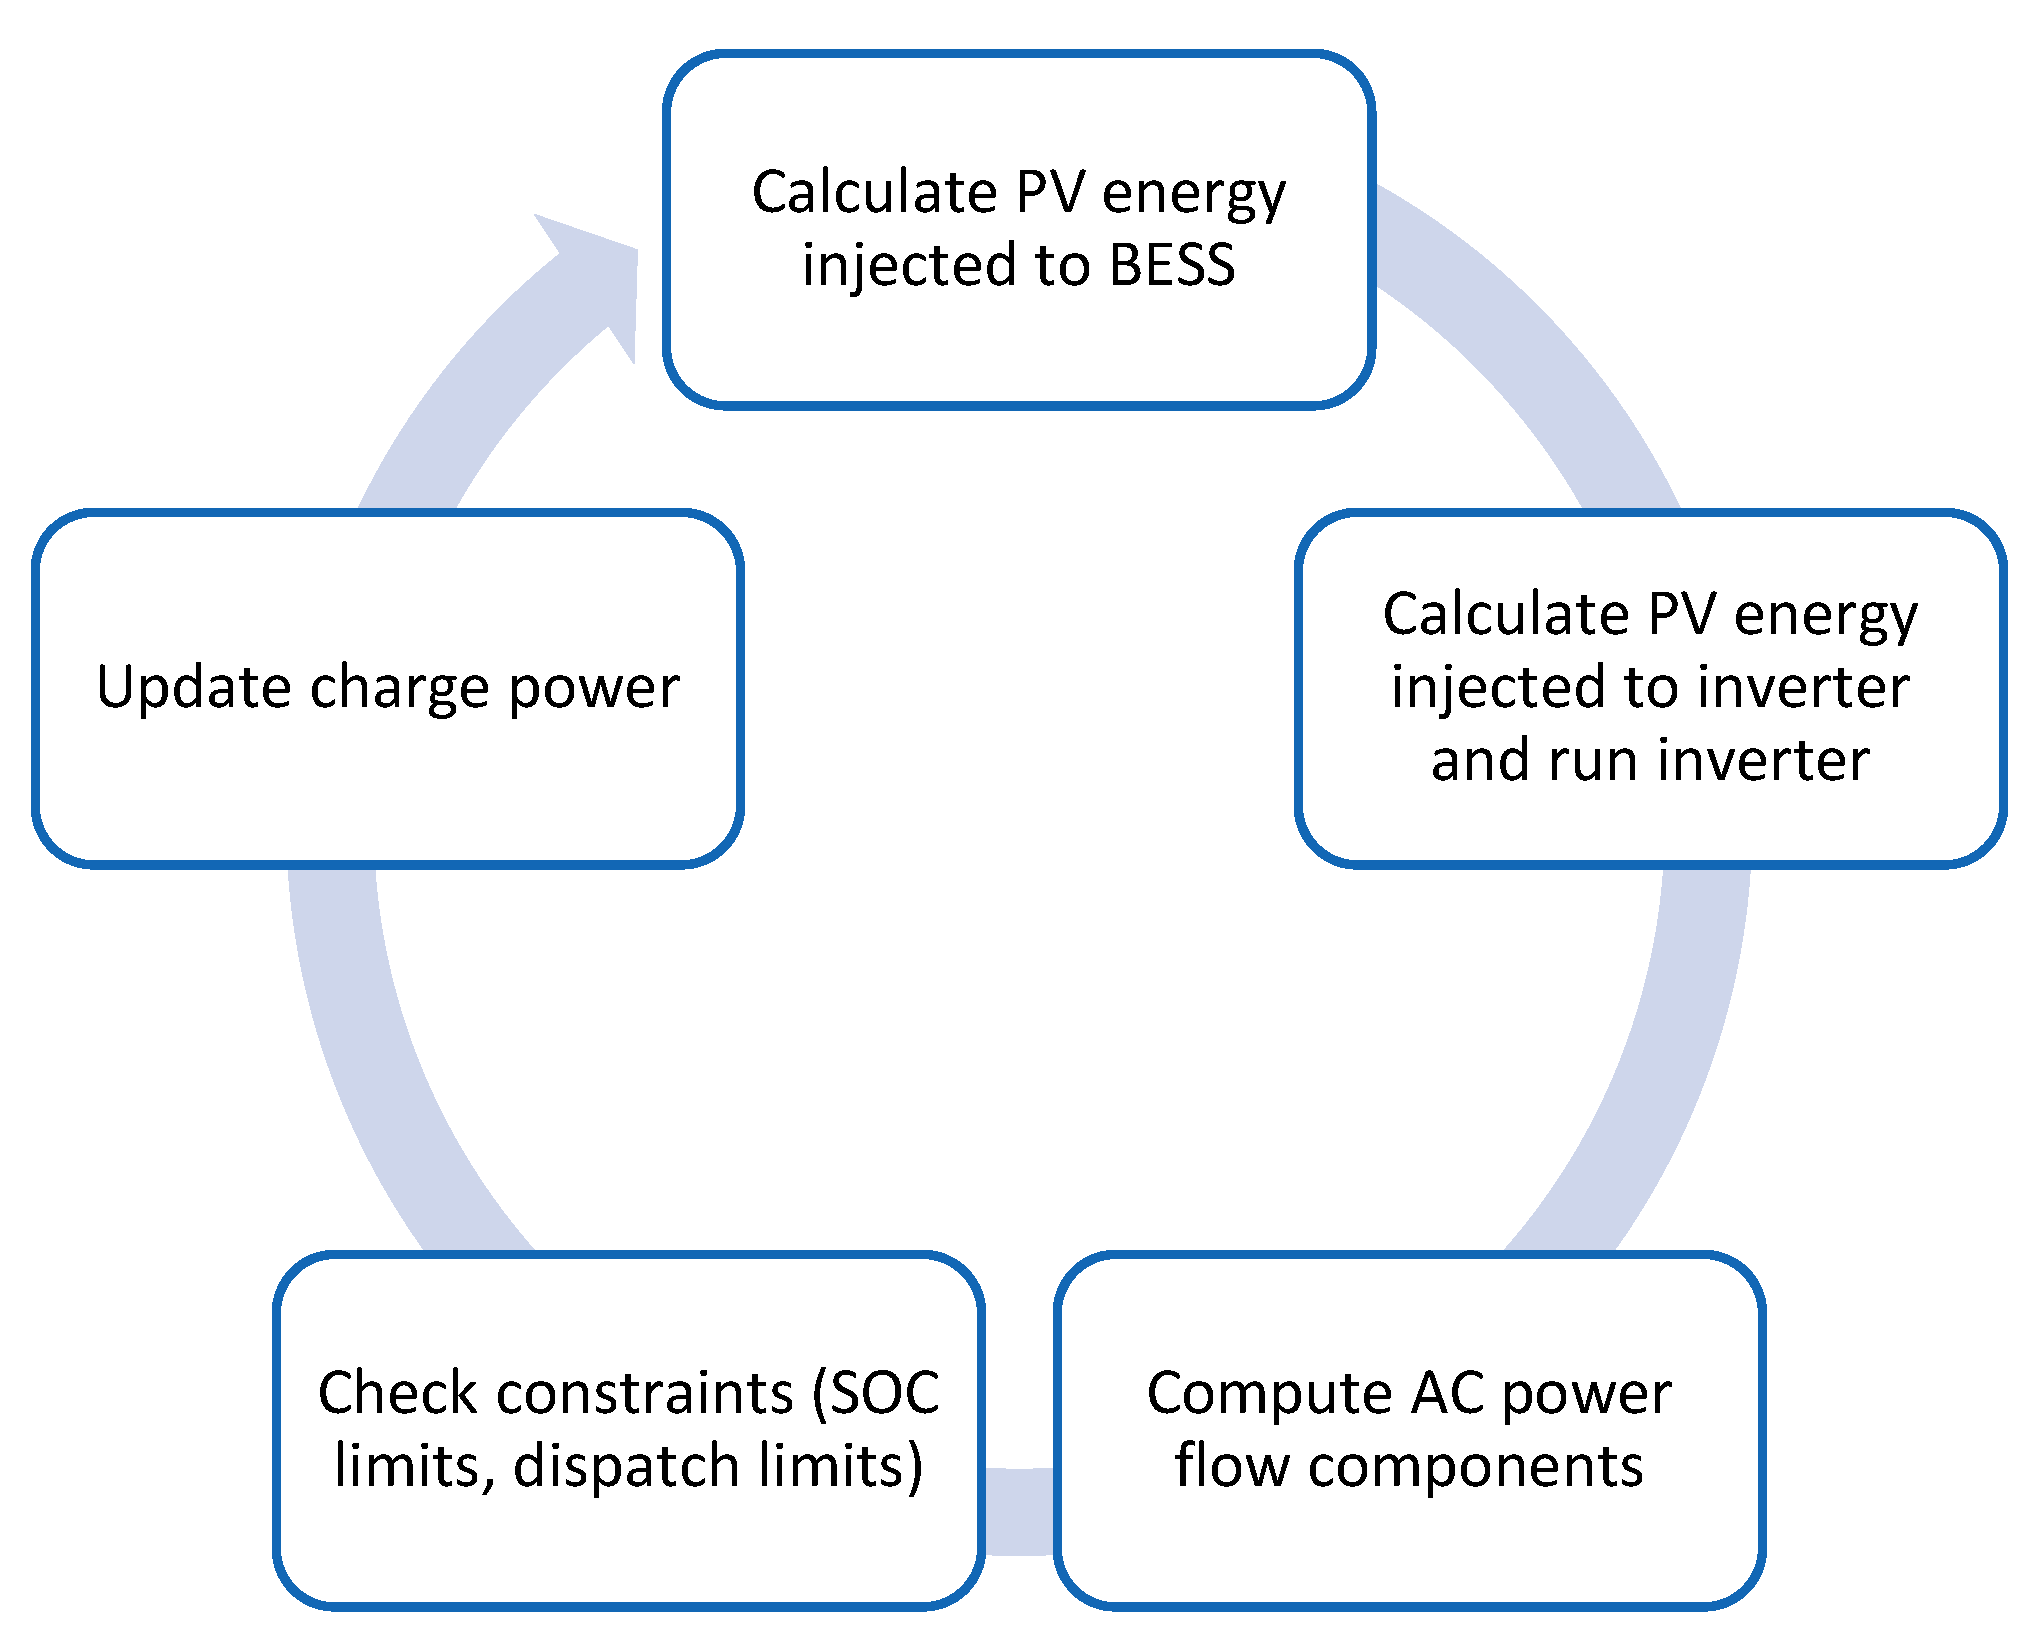
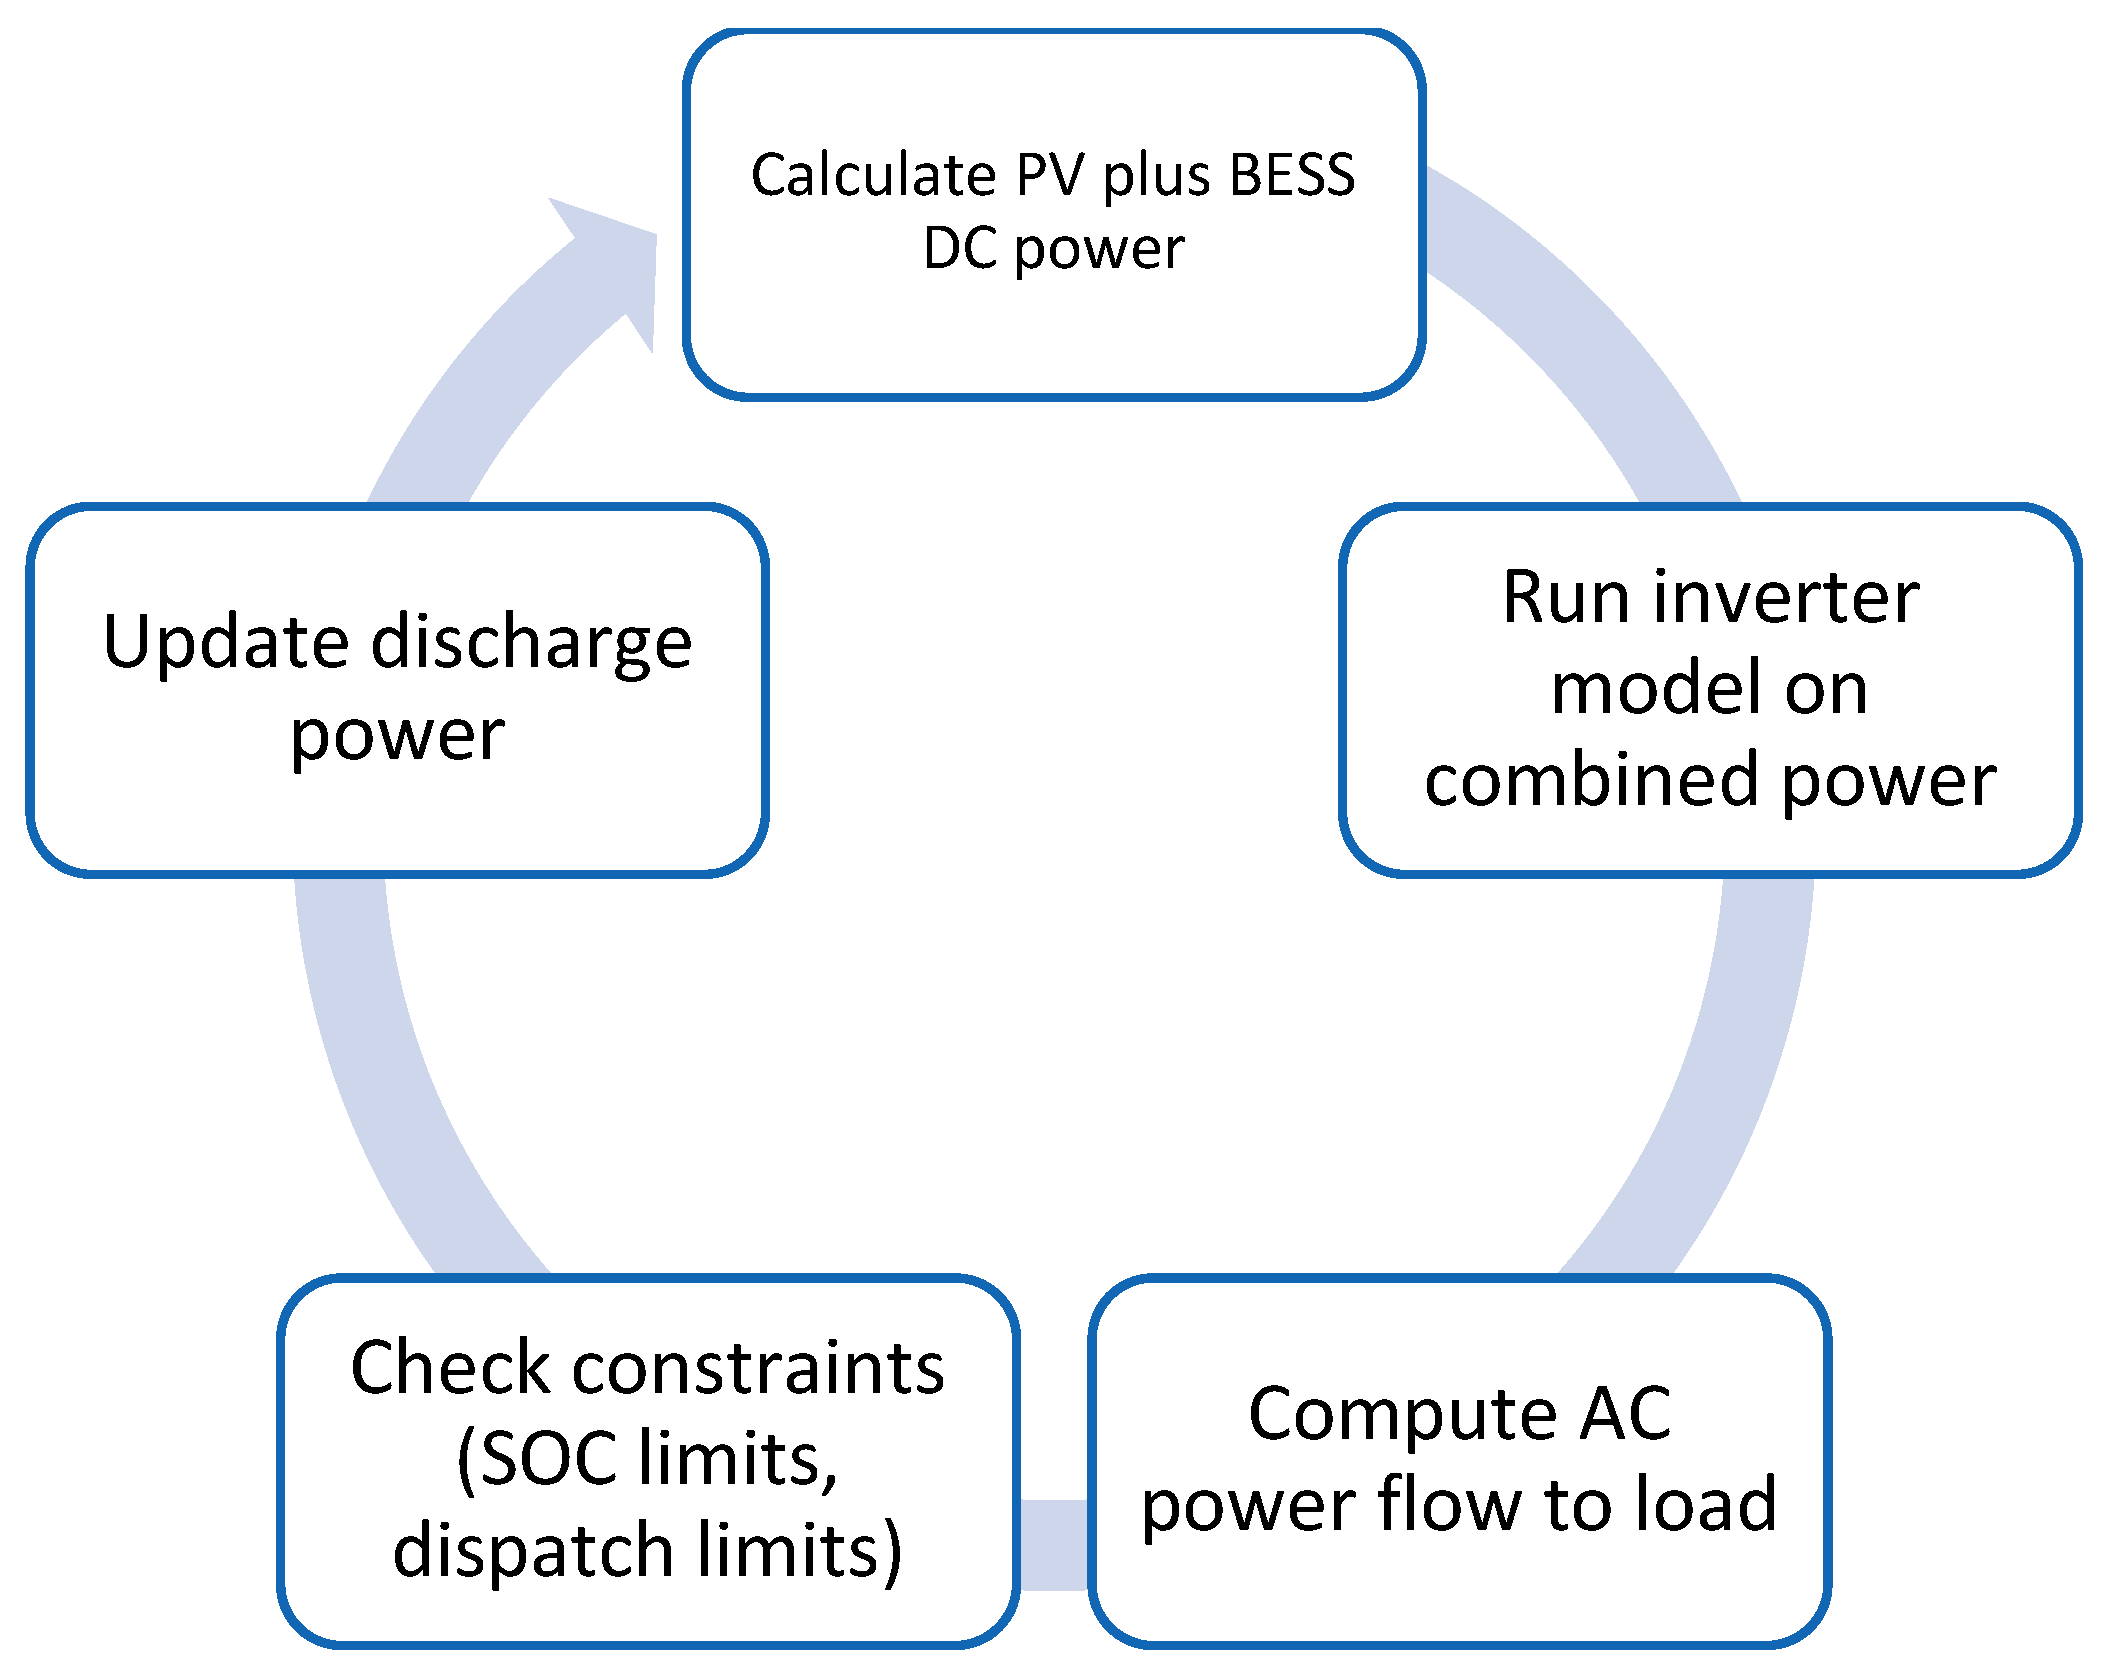
SAM (System Advisor Model) version 2020.11.21 software is used to analyze proposed hybrid stand-alone microgrid’s performance. SAM software offers detailed insights into the energy production, consumption, and storage within the microgrid system. SAM is used to assess the proposed hybrid stand-alone microgrid system’s overall effectiveness, viability, and reliability. For the performance analysis of the microgrid in this study, SAM (System Advisor Model) software is used. 
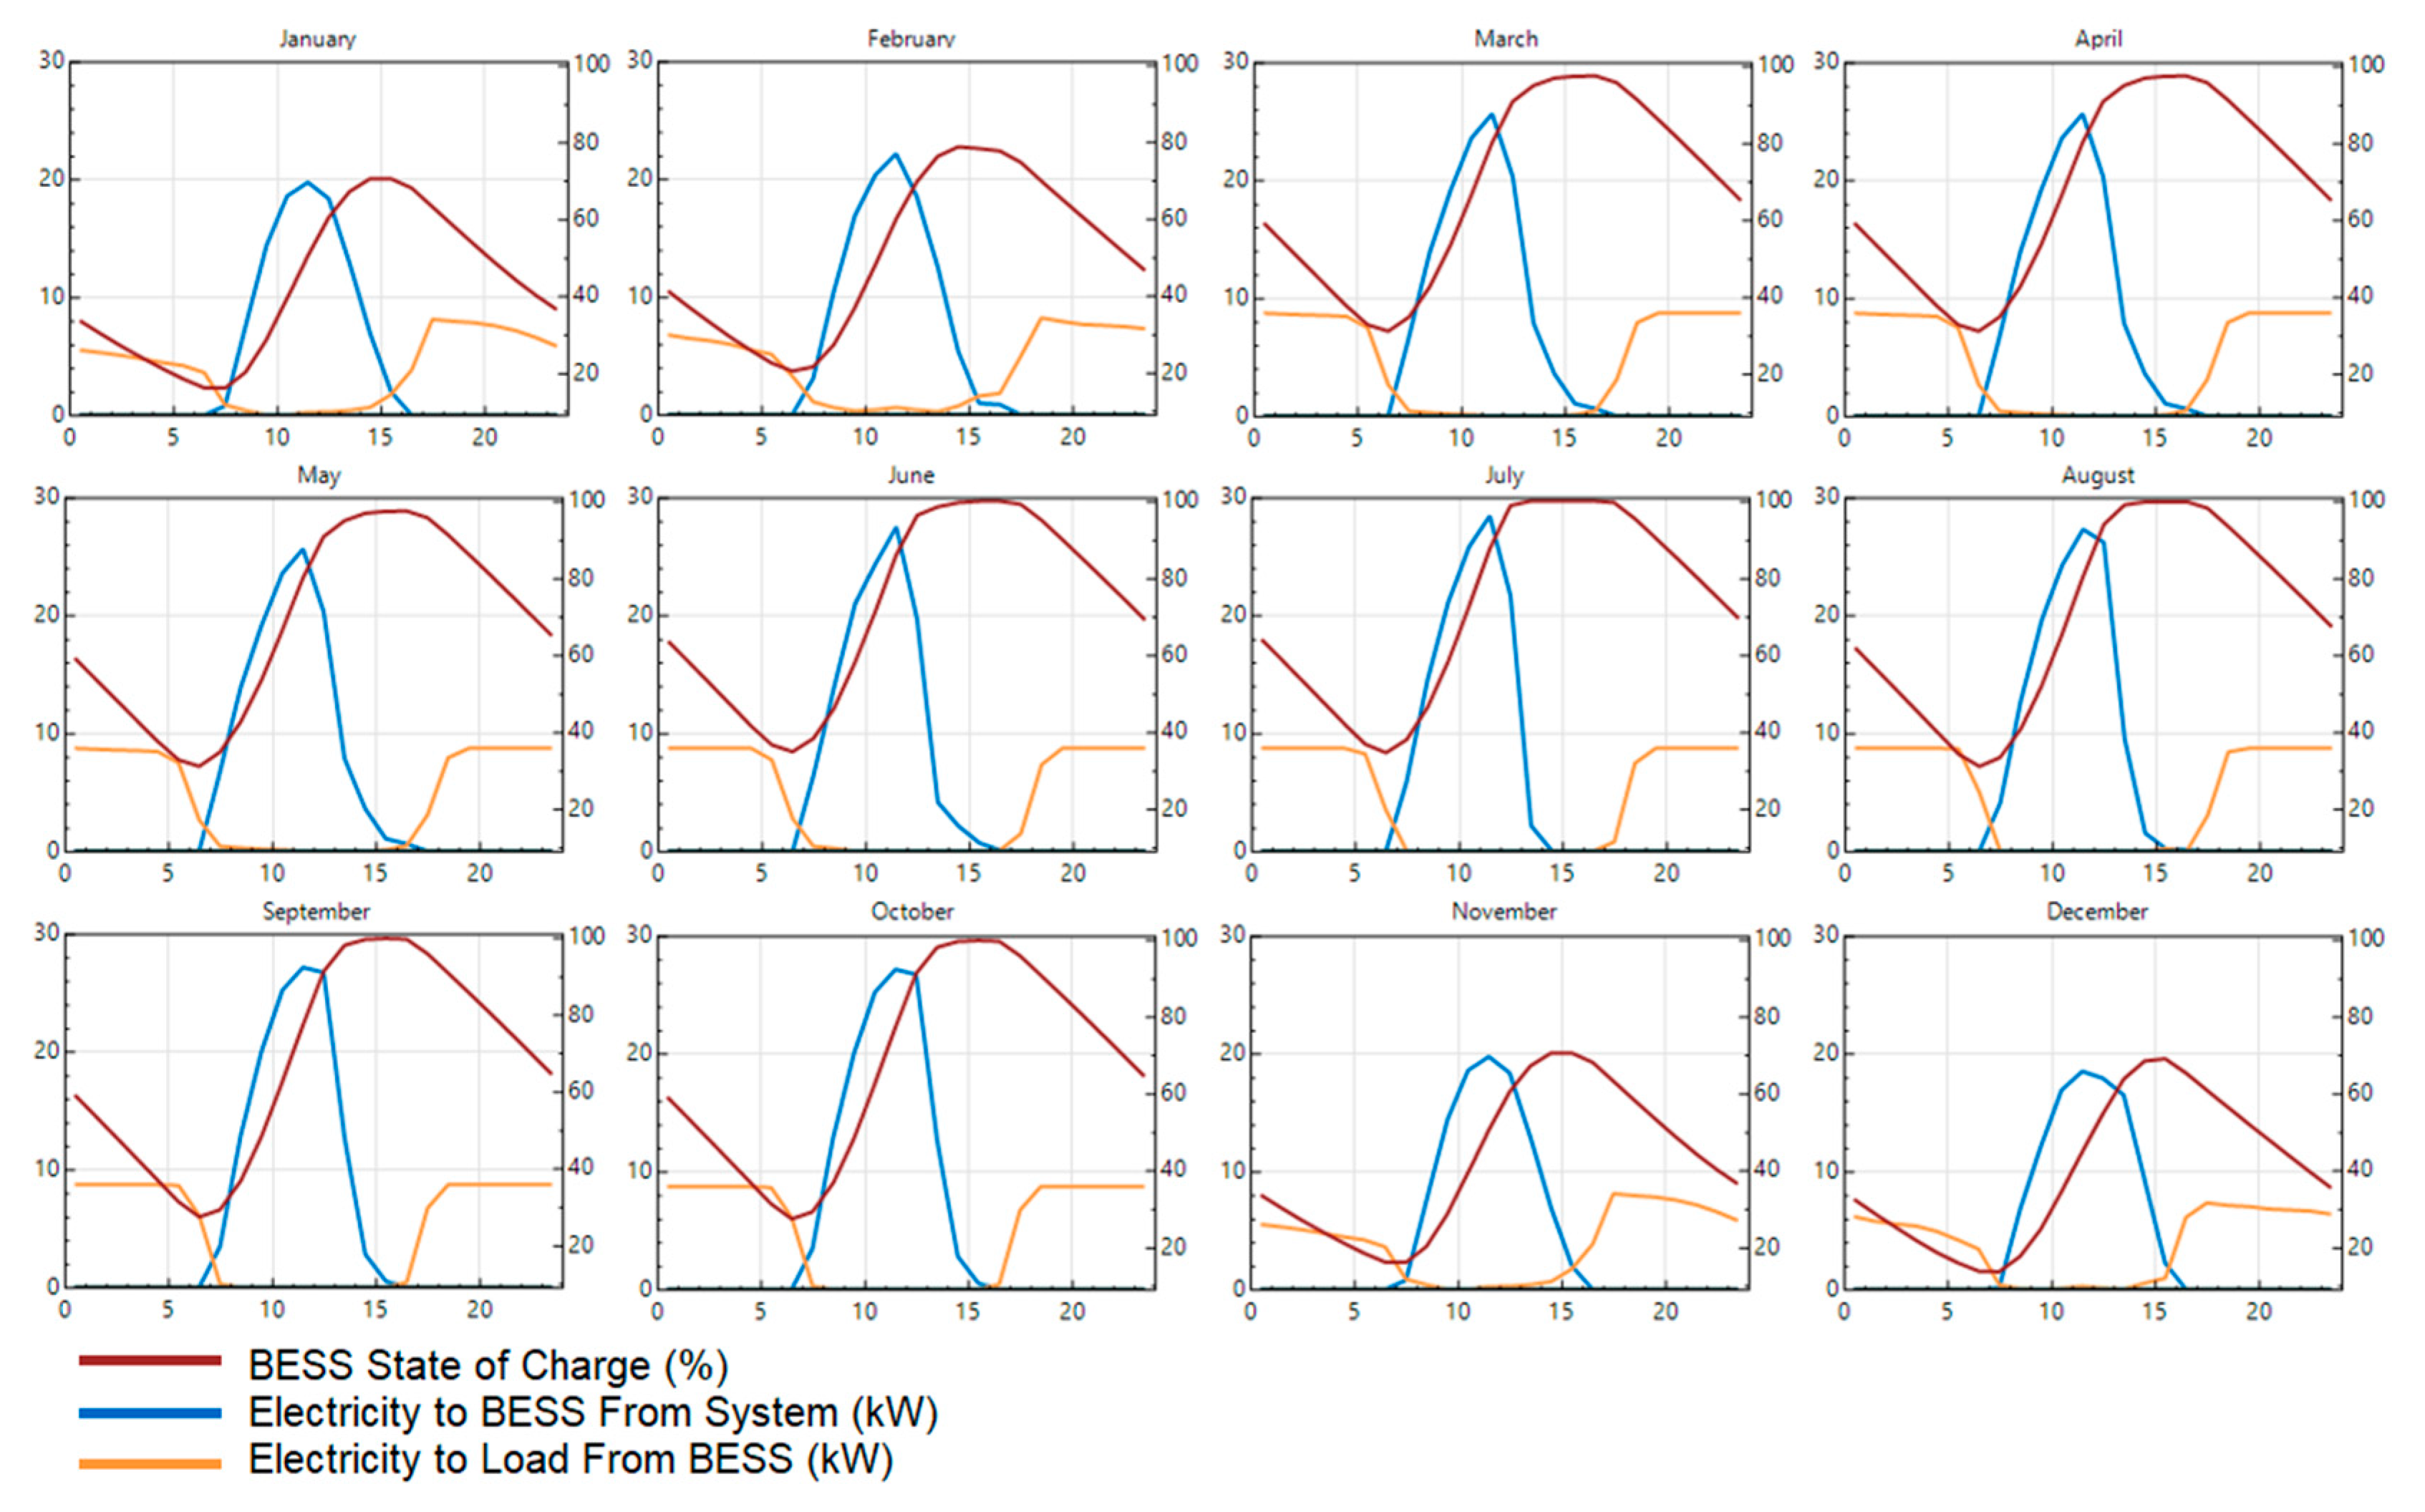
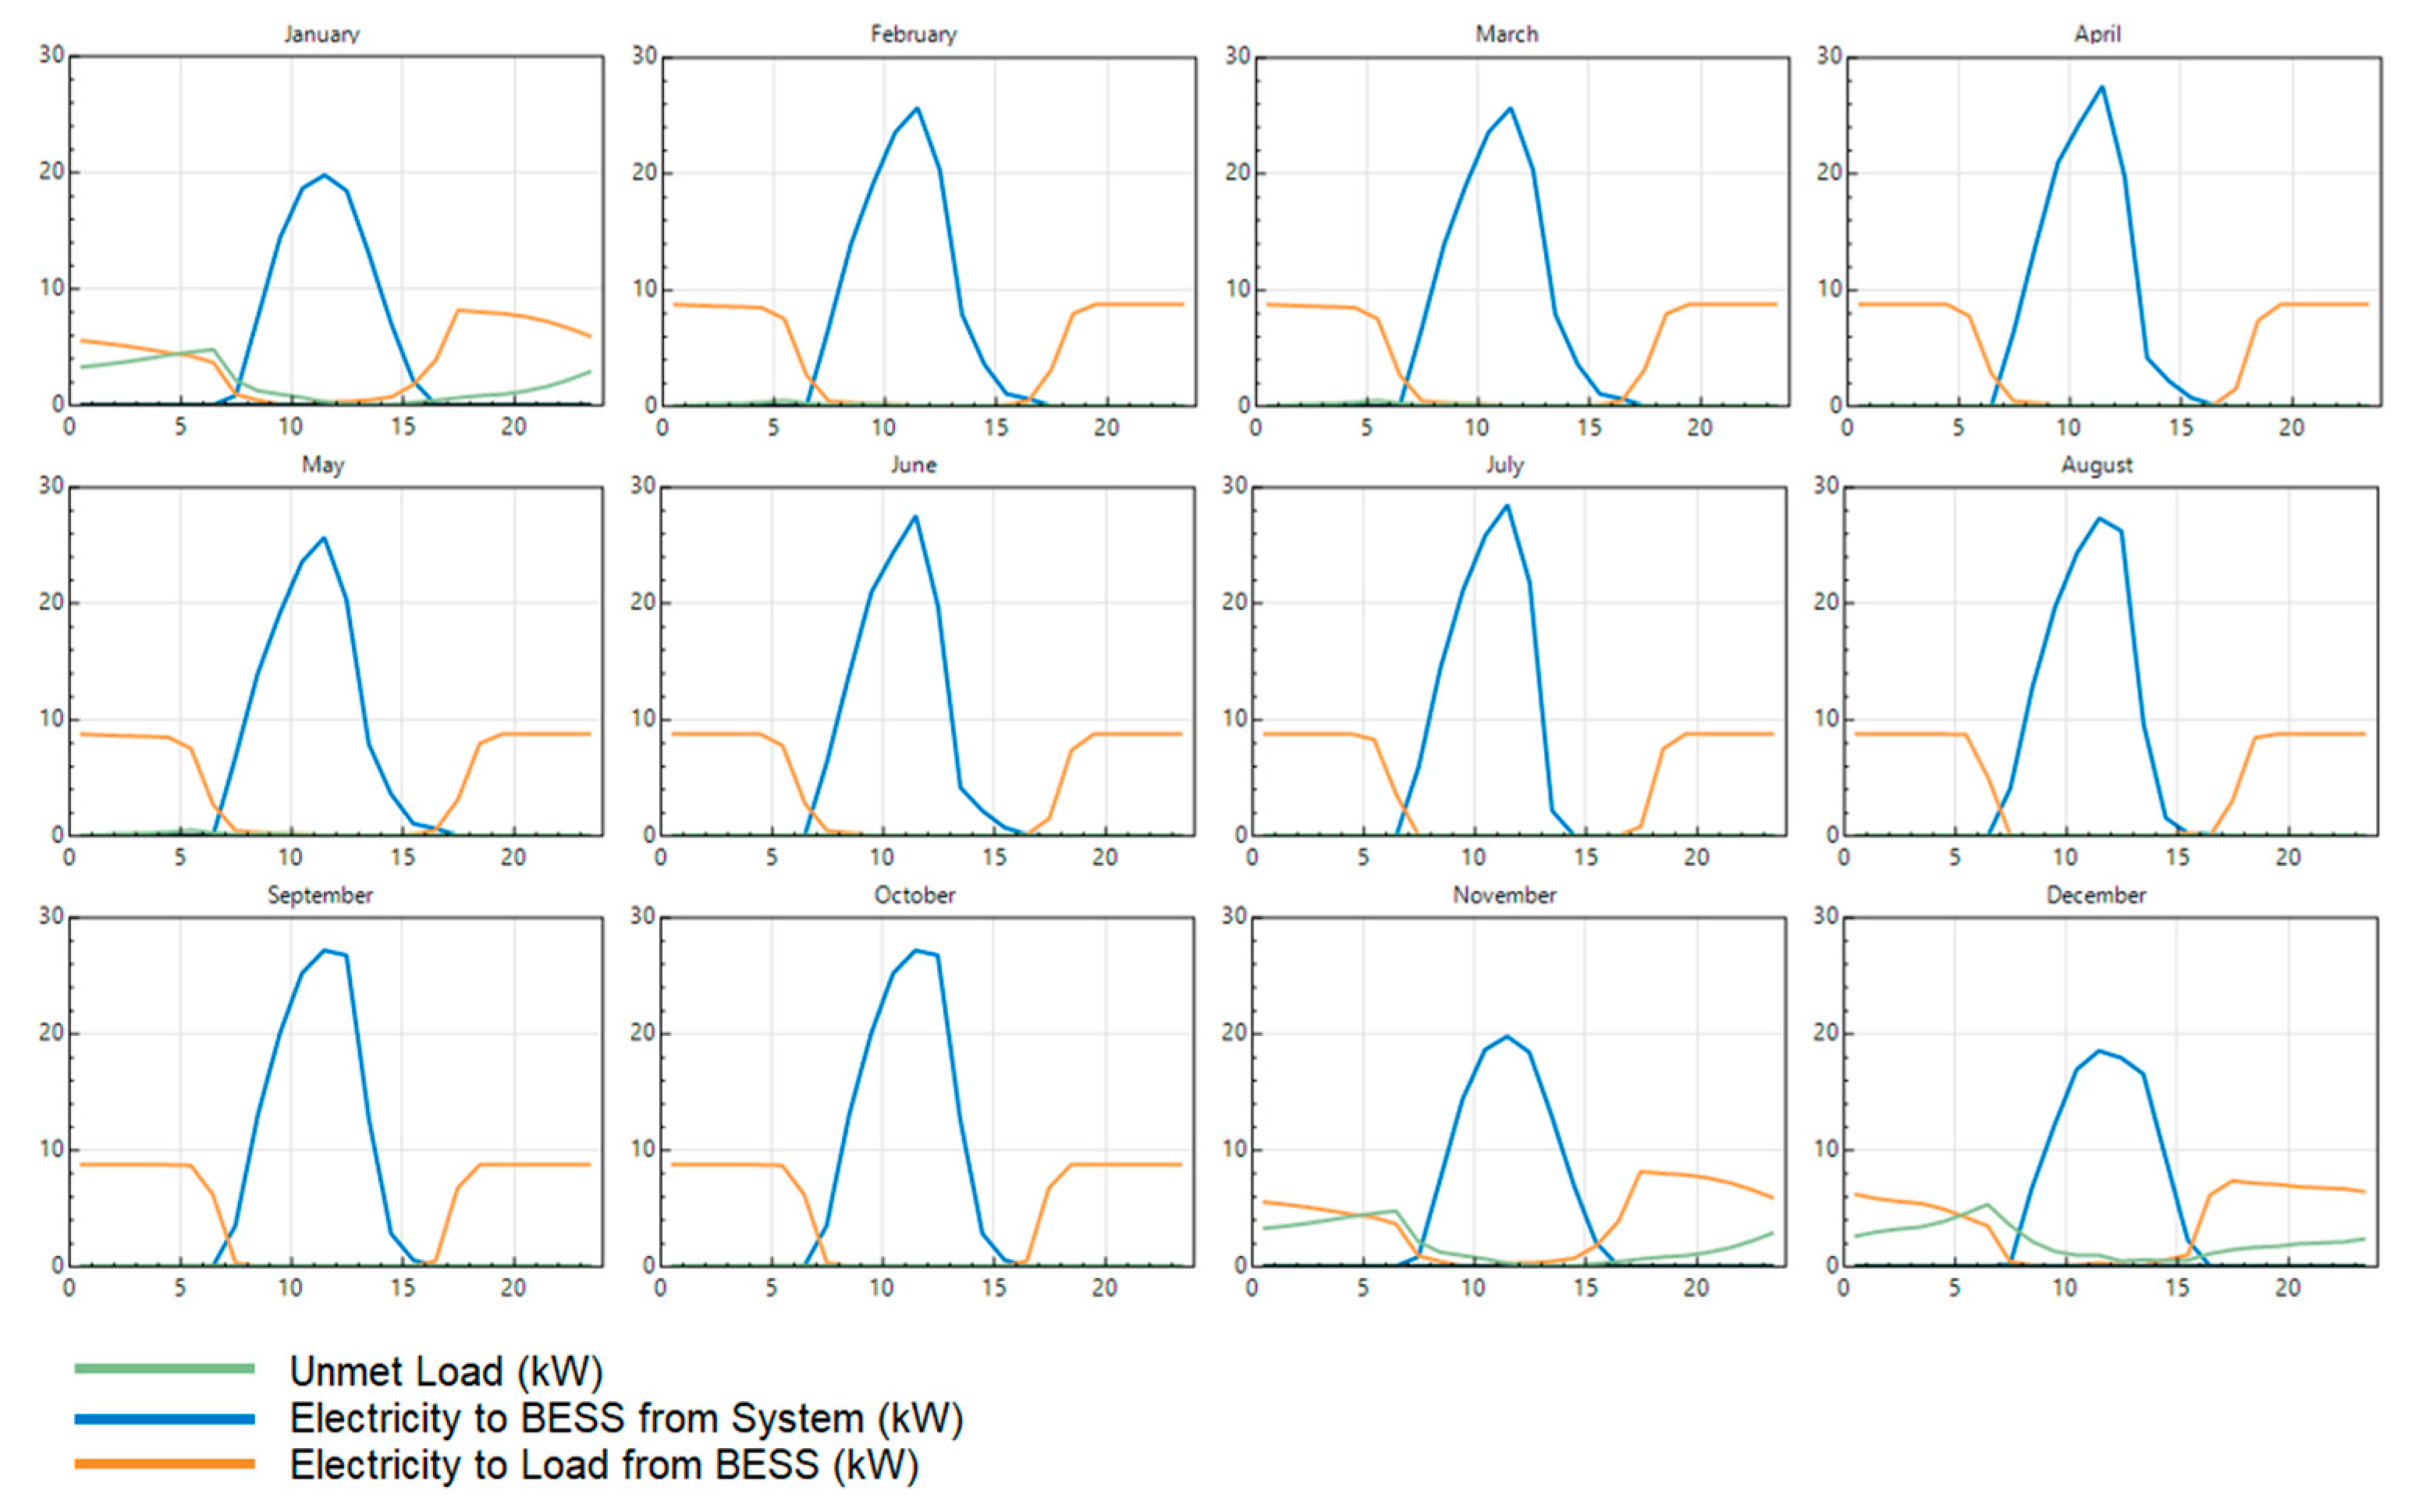
Figure 11 depicts a flowchart for BESS charging, and Figure 12 depicts a flowchart for BESS charging using SAM software.

3. Results and Discussions

The first part of this section discusses the projected PV power plant’s results as determined by the PVsyst software. The second part of this section discusses the results of the proposed hybrid stand-alone microgrid that was produced using the HOMER Pro software. The performance analysis findings from the SAM (System Advisor Model) software for the proposed hybrid stand-alone microgrid are covered in the third part. The final part of this section discusses the findings of the installed hybrid stand-alone microgrid’s site testing.
The purpose of this study is to determine the best solution to design and implement a hybrid stand-alone microgrid; therefore, different software is used in combination as each software has its own benefits and limitations.

3.1. PV Power Plant’s Results

A PV power plant’s performance is typically analyzed using a set of performance characteristics defined by IEC Standard 61724 [31,32,33]; nevertheless, the most important parameters include final energy output, performance ratio, and capacity factor. These parameters provide information about the system’s energy production, the utilization of available solar resources, and the overall effect of system losses.
The quantity of AC power produced by the system over a certain period is defined as the final energy output of a PV power plant. The total energy produced can be calculated using IEC Standard 61724:
E A C = t = 1 N E A C ( t )
where EAC (kWh) is the final energy output at time t, and N represents the number of data sets. In the context of bifacial photovoltaic (PV) modules, the elevation of the module holds significant implications for their performance. Elevating the modules heightens backside irradiance uniformity, thereby amplifying bifacial power gain. This enhancement is attributed to an augmented perception of ground-reflected light on the rear side of the PV modules. Moreover, by manipulating ground albedo, the reflective nature of the surface, an additional avenue for optimizing bifacial power gain is unveiled. A heightened ground albedo intensifies the perception of ground-reflected light on the backside of the PV modules, further contributing to increased energy generation. To illustrate these phenomena, Figure 13 delineates the impact of ground clearance on annual generation across various tilt angles of PV modules, while Figure 14 illustrates the influence of ground albedo on annual generation, considering a scenario of zero ground clearance. These figures serve as visual representations of the intricate interplay between module height, ground clearance, albedo, and the ensuing impact on bifacial PV module performance.
For monofacial PV modules, which are used in the proposed microgrid, Figure 15 depicts the PVsyst-software-determined daily system output energy of the proposed PV plant. Figure 16 shows the normalized productions per installed kWp of PV plant, with a collecting loss of 0.92 kWh/kWp/day, a system loss of 0.11 kWh/kWp/day, and a usable energy output of 4.53 kWh/kWp/day.
Figure 17 presents the loss analysis of the PV plant for a year. Furthermore, Figure 18 depicts the probability distribution for the PV plant, with the 50th percentile value (P50) indicating that the probability of annual energy production is 84.31 MWh, the 90th percentile value (P90) indicating that the probability of energy production is 79.57 MWh, and the 95th percentile value (P95) indicating that the probability of energy production is 78.24 MWh.
The performance ratio (PR) of a PV power plant assesses the overall impact of losses on the system’s rated output and shows how closely its performance adheres to ideal performance under actual operating conditions. The reference is IEC Standard 61724:
P R = E A C P P V r a t e d × G S T C H P O A  
where P P V r a t e d is the installed capacity (in kW) of the PV system, H P O A is the in-plane array radiation (in kWh/m2/day), and G S T C is the reference irradiance (in kW/m2). Figure 19 shows the projected PV plant’s performance ratio (PR), which was calculated using the PVsyst software and is 81.5%.
A solar PV installation’s capacity factor is calculated as the difference between the total energy it produces over a certain period and the amount of energy it would have produced if it had been operating at full capacity throughout the period. For instance, the annual capacity factor is stated as follows:
C f = E A C ( a ) P P V r a t e d   × A h
where E A C ( a ) is the total yearly final energy generated, and A h is the total predicted number of operating hours in a particular period, usually taken to be a year.
C f = 84311   k W h 51   k W × 365 × 5.5   h = 0.82
A solar PV panel installation will decrease CO2 emissions, which will contribute to a pollution-free environment. In Figure 20, the green line represents the amount of carbon emissions saved, which is 1811.6 tons of carbon emissions expected by the simulation over the next 30 years are saved.

3.2. Proposed Hybrid Stand-Alone Microgrid’s Results

This section discusses the results of the HOMER Pro software simulation for the proposed hybrid stand-alone microgrid. Figure 21 shows the predicted power injection from the PV plant to the hybrid stand-alone microgrid, with vertical blurred blue lines at the beginning and conclusion of the picture indicating a lack of power supply to meet the load, dark blue area indicates 0% injection, light blue area indicates 25–50% injection, green area indicates 50–75% injection, and yellow area indicates 100% power injection, while Figure 22 shows the predicted power injection from the EDG to the hybrid stand-alone microgrid for the entire year, with yellow areas indicating power injection from the EDG to the microgrid and dark blue area indicates 0% injection from the EDG to microgrid. Additionally, Figure 23 depicts the expected PV plant and EDG output for the entire year to meet load demand. It may appear that in the months of November, December, and January, PV generation is insufficient to meet load needs; hence, EDG is used to meet load demand.

3.3. Performance Analysis Results of Proposed Hybrid Stand-Alone Microgrid

This section discusses the SAM software simulation’s performance analysis results for the proposed hybrid stand-alone microgrid. The hybrid stand-alone microgrid’s performance analysis results are pretty excellent. Figure 24 depicts the simulated BESS charge (Ah) level, energy injected from the microgrid to charge the BESS, and discharging of the BESS to fulfill load demand for each month of the year. Figure 25 depicts the simulation results of the BESS’s state of charge (SOC), energy injected from the microgrid to charge the BESS, and discharging of the BESS to fulfill load demand for each month of the year. Figure 26 shows the simulation results of unmet critical load, energy injected from the microgrid to charge the BESS, and discharging of the BESS to fulfill load demand for each month of the year. These comprehensive analyses shed light on the hybrid microgrid system’s performance and efficiency.
The results obtained from the software analysis have yielded satisfactory outcomes, thus validating the feasibility of implementing the same design in experiment.

3.4. Experimental Results

This section covers the site testing’s findings and an overview of hybrid stand-alone microgrid generation and consumption for August. Table 9 provides the results for DC string voltage, showcasing the voltage levels across the strings. Table 10 shows the battery bank results, which reveal important information about the battery’s performance. Moving on to Table 11 and Table 12, they present the load test results for both the inverters and the battery, specifically at a 10.5 kW load. Lastly, Appendix A presents the testing results of the hybrid stand-alone microgrid on an hourly basis, providing valuable insights into its performance throughout the day. Moreover, Figure 27 presents the summary of hybrid stand-alone microgrid generation and consumption for the month of August. Analyzing these results will help us evaluate the efficiency and effectiveness of the system.

4. Conclusions

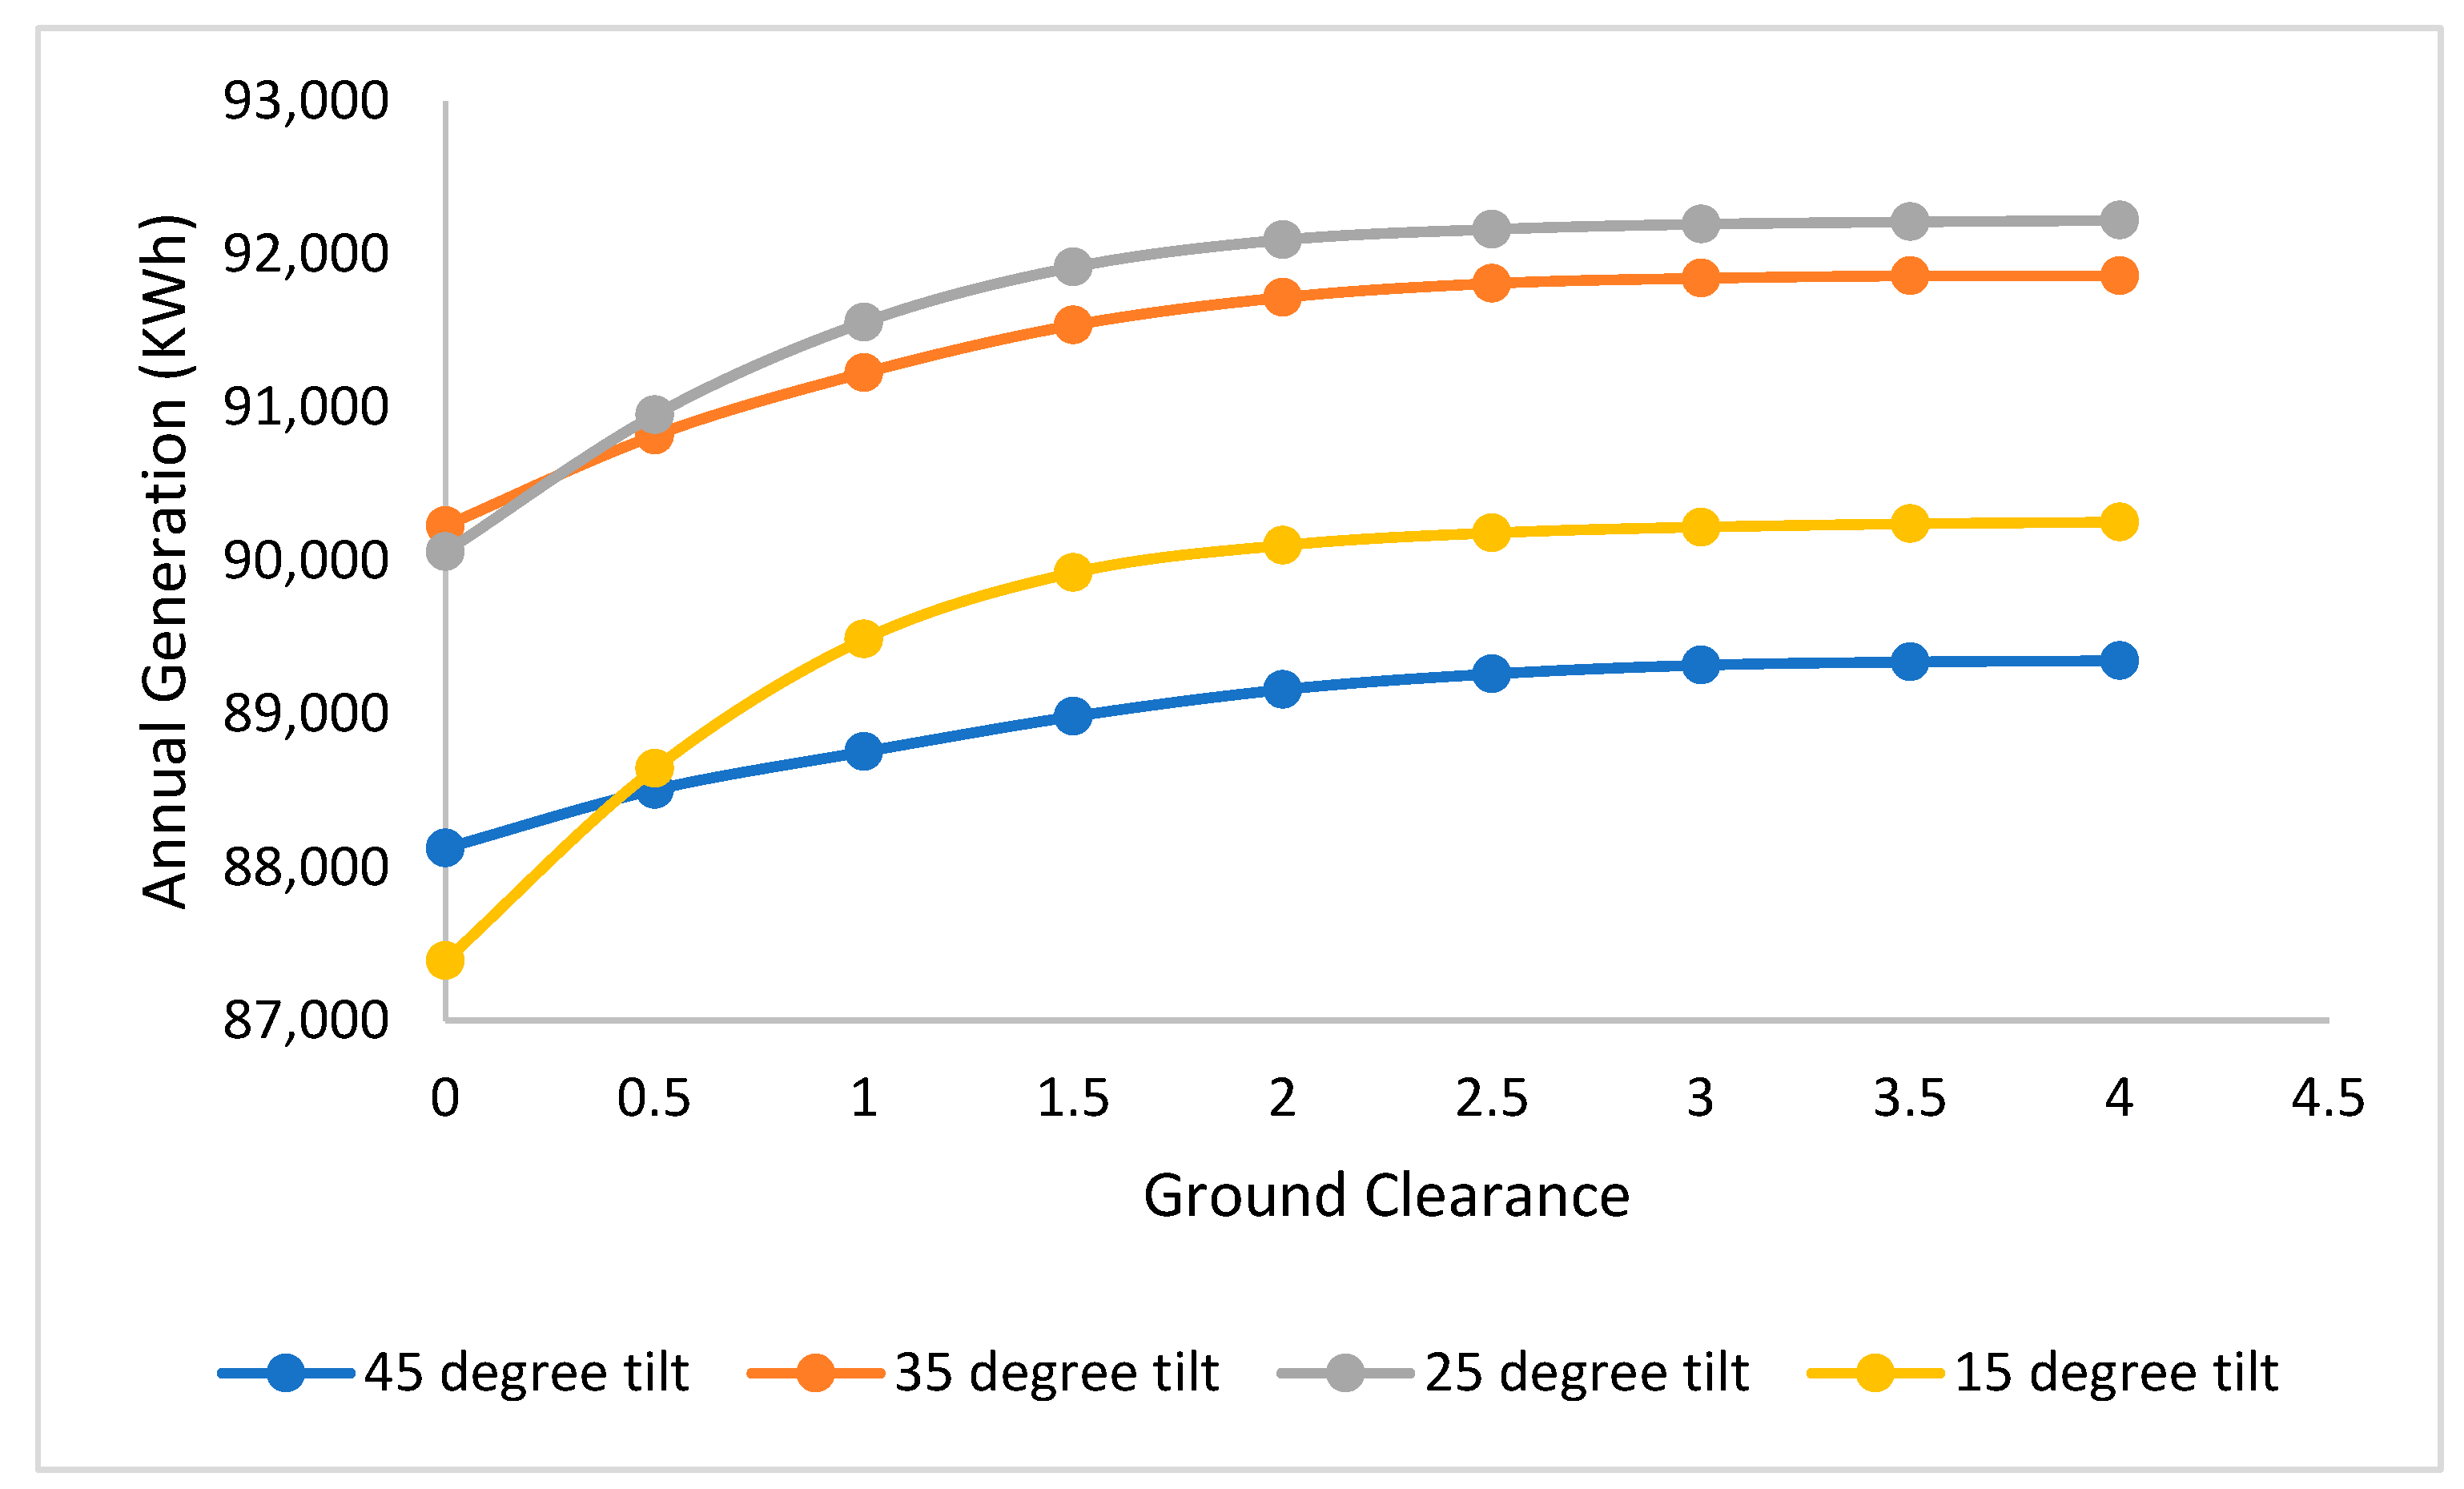
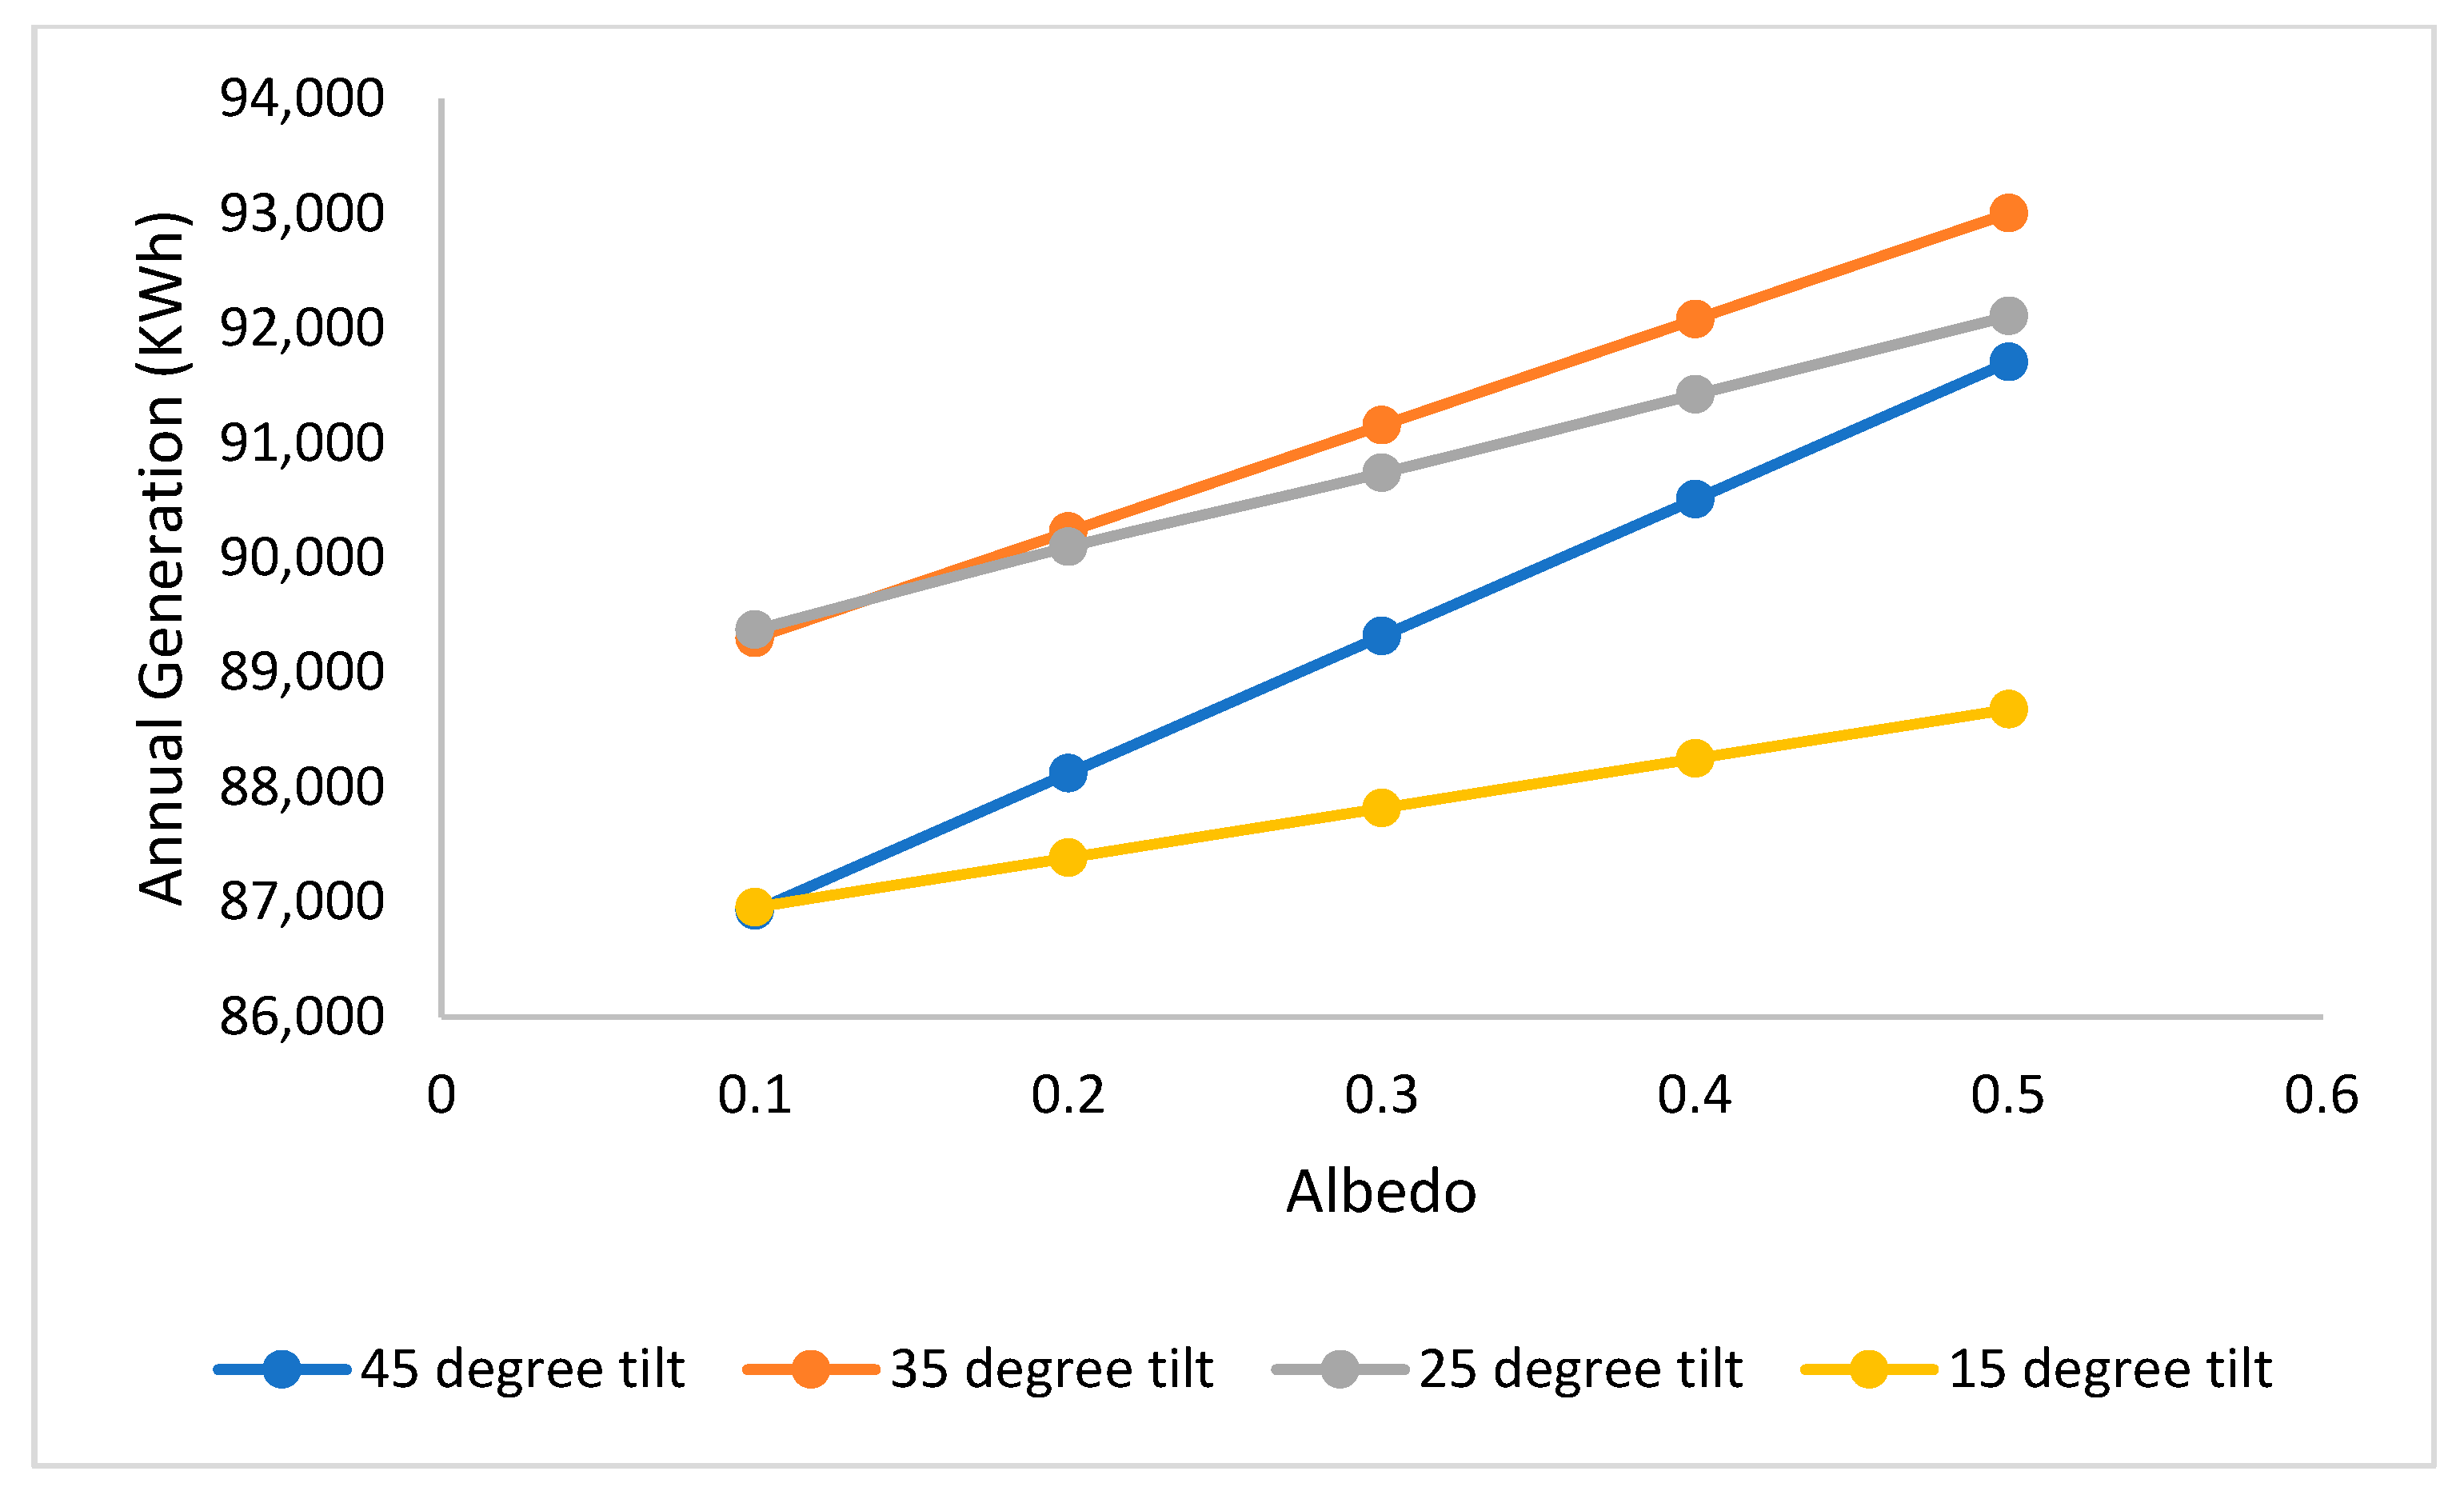
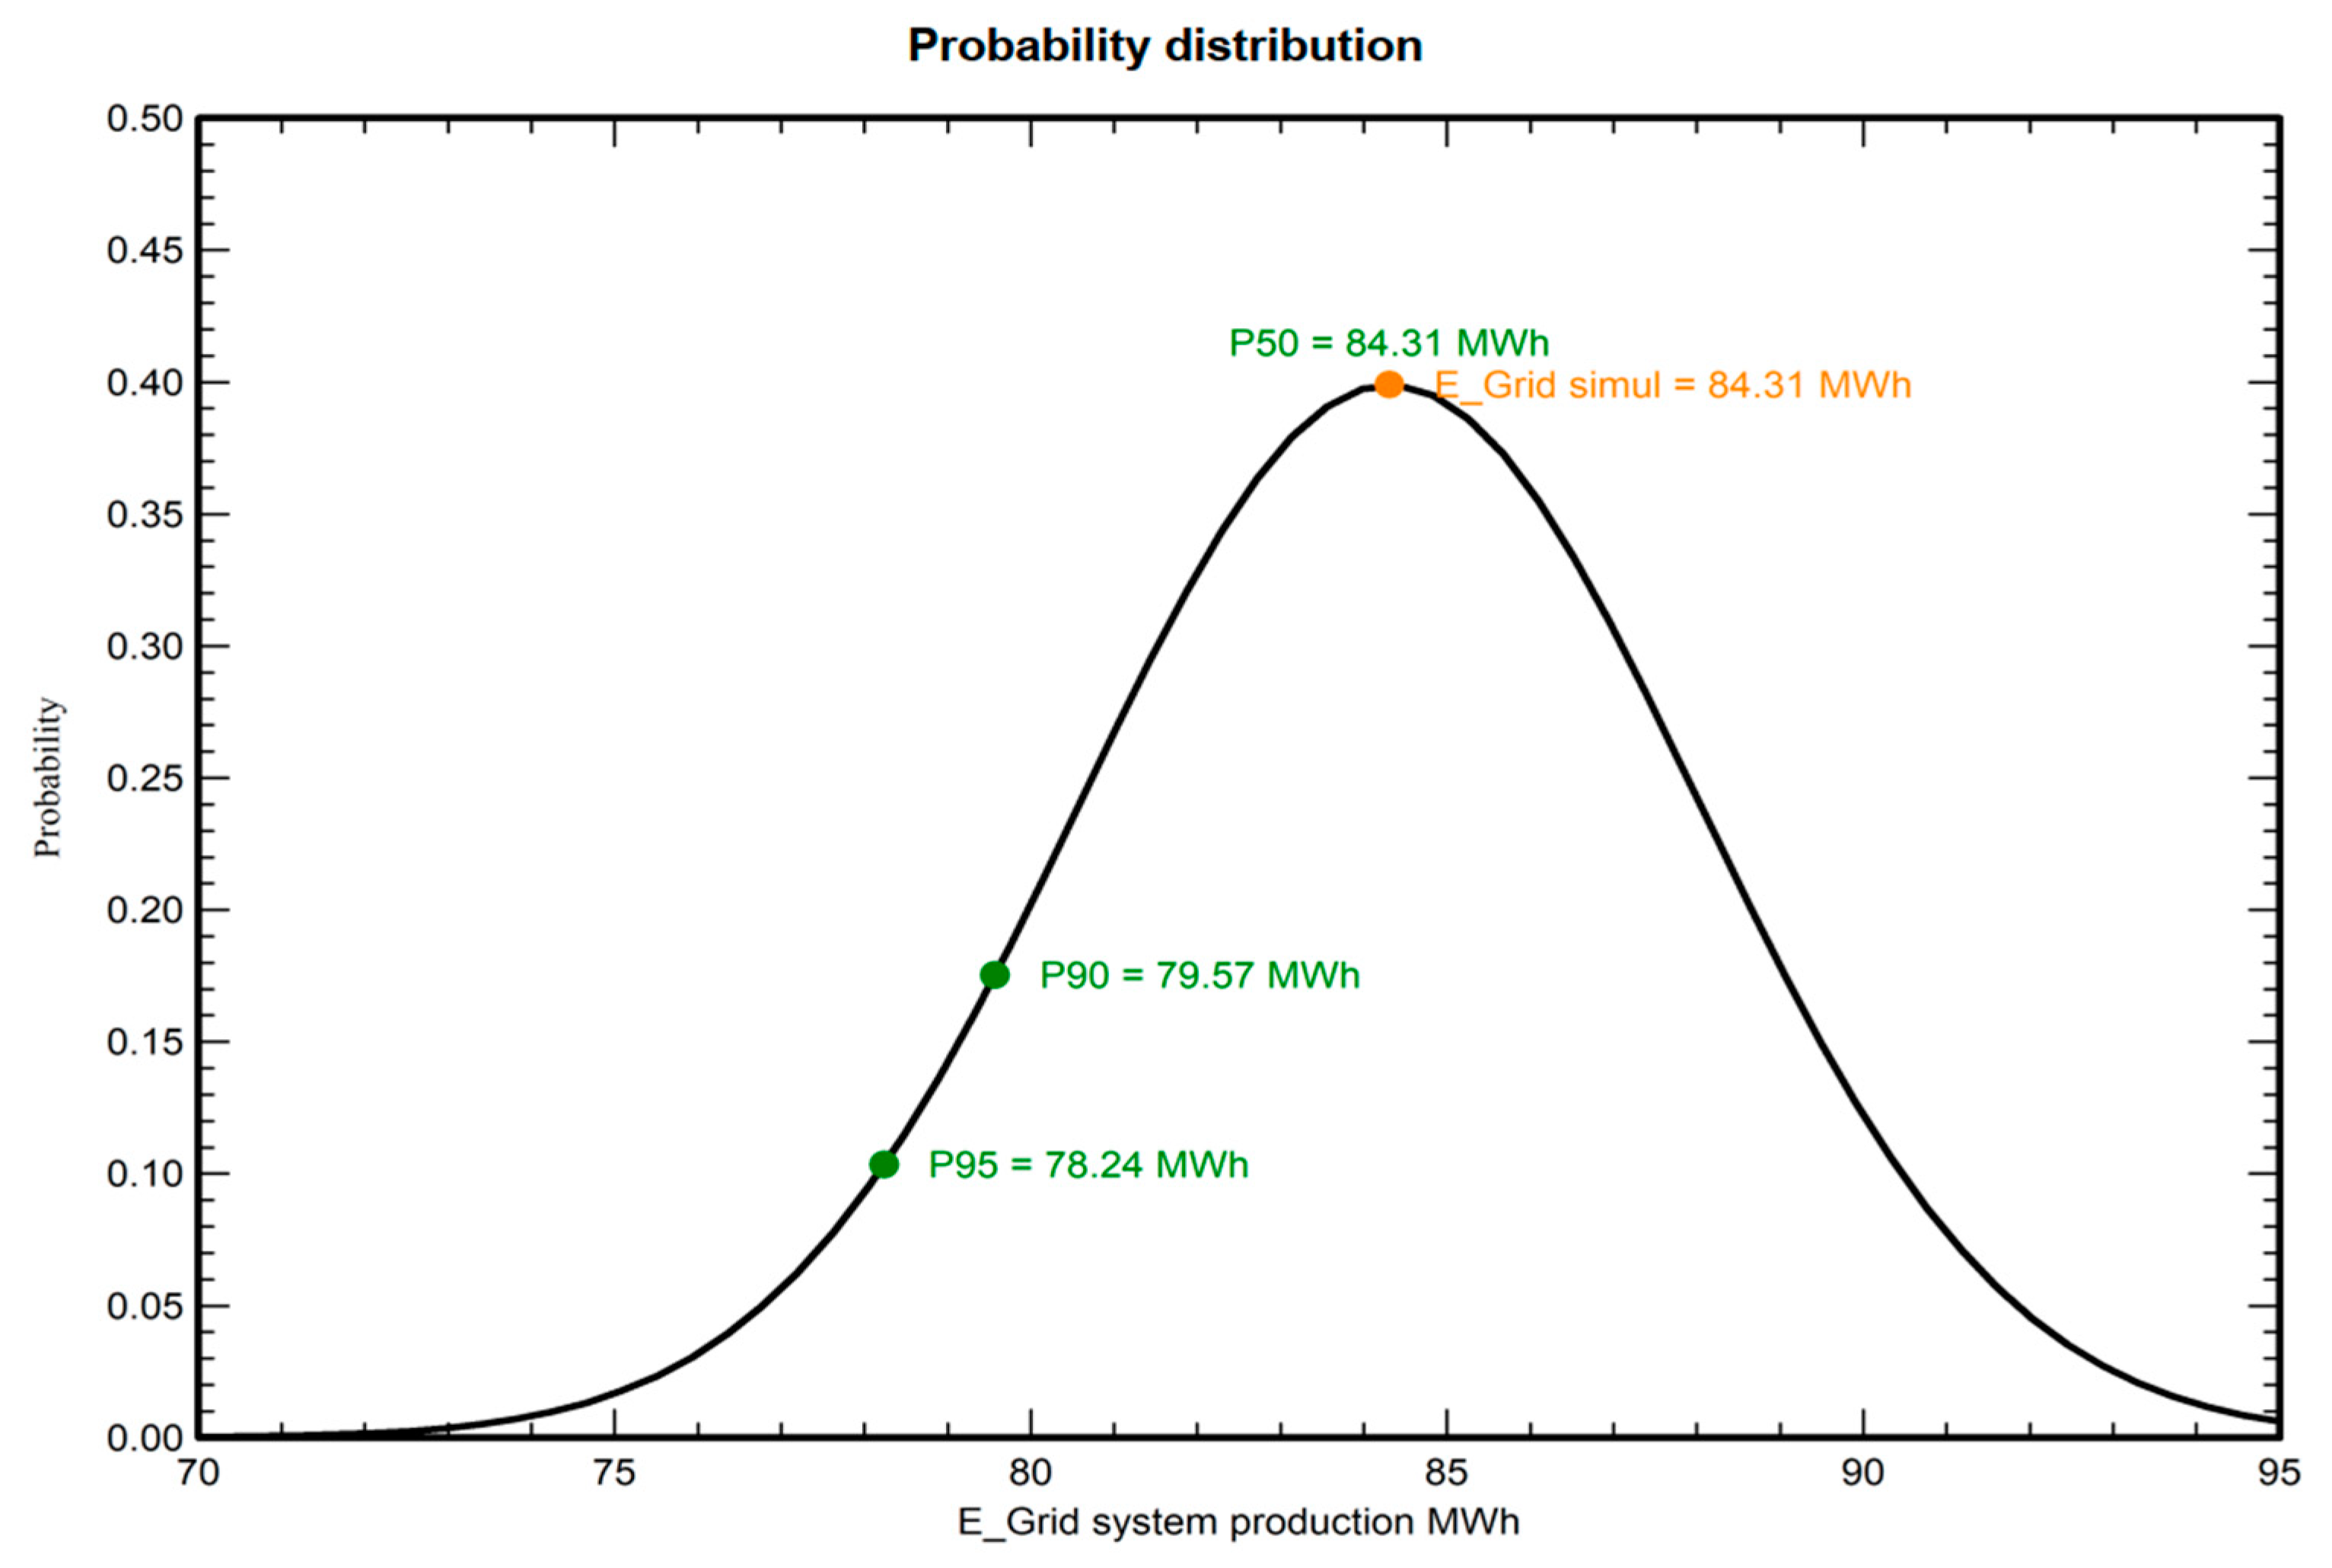
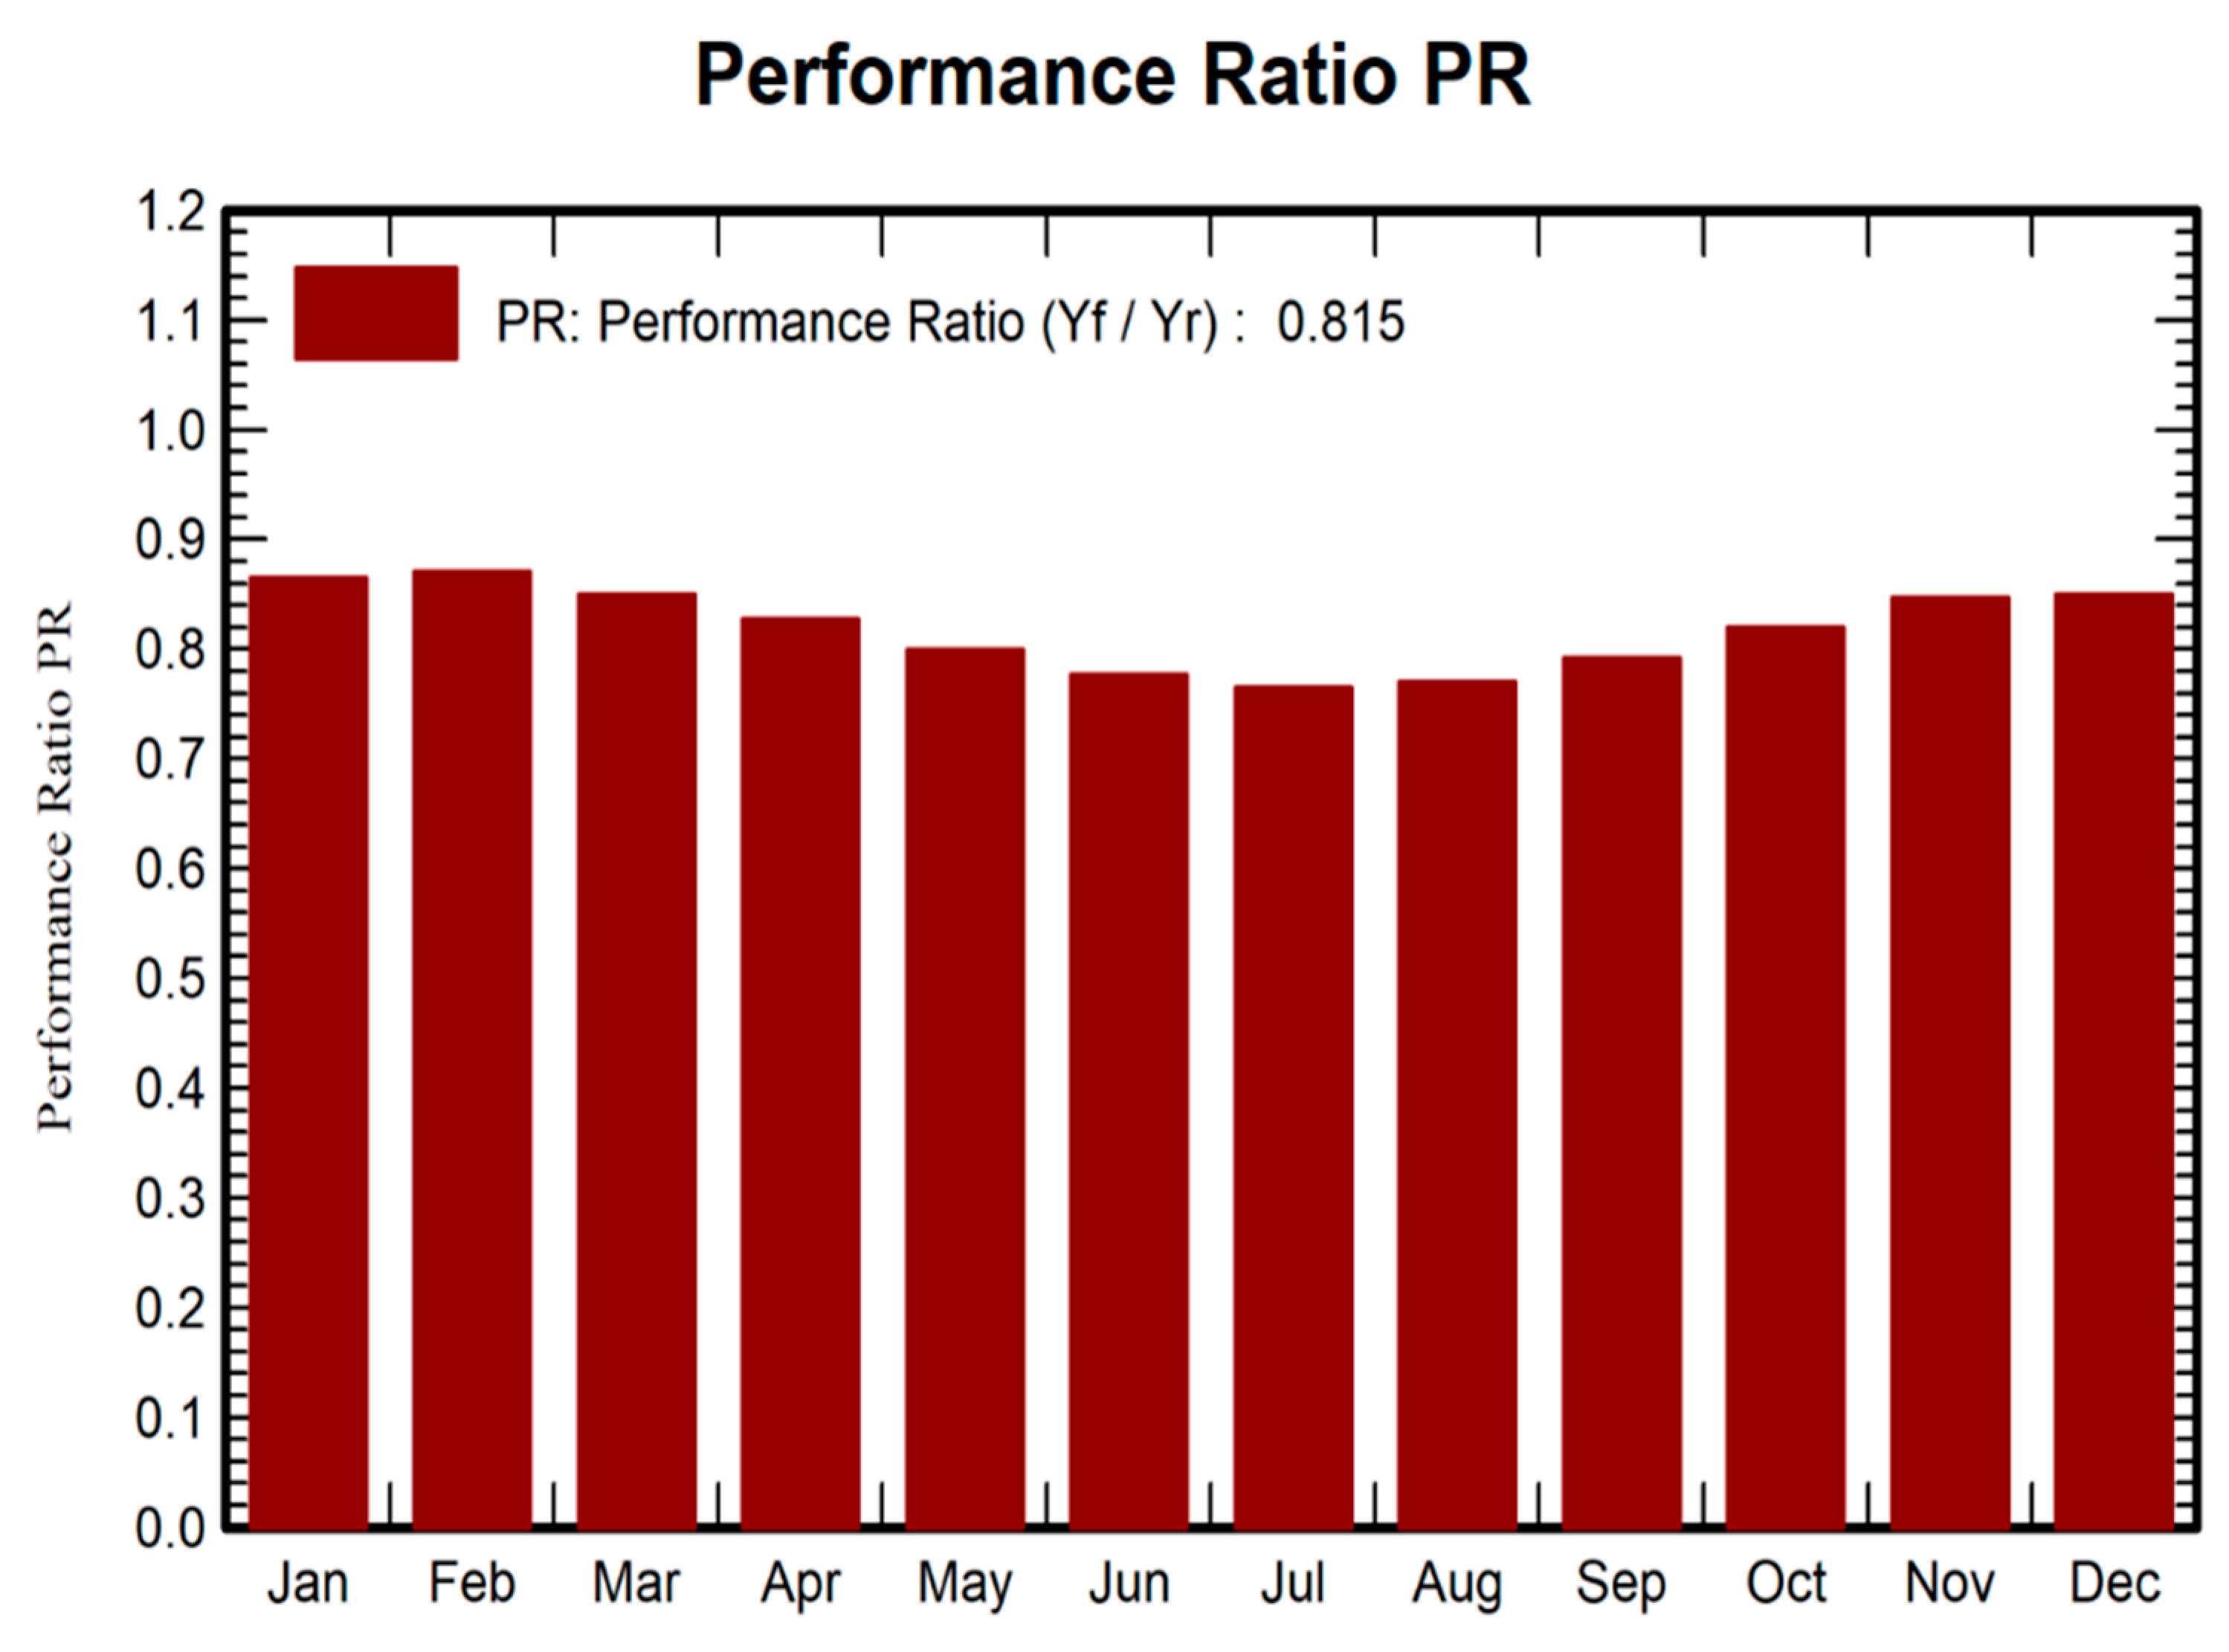
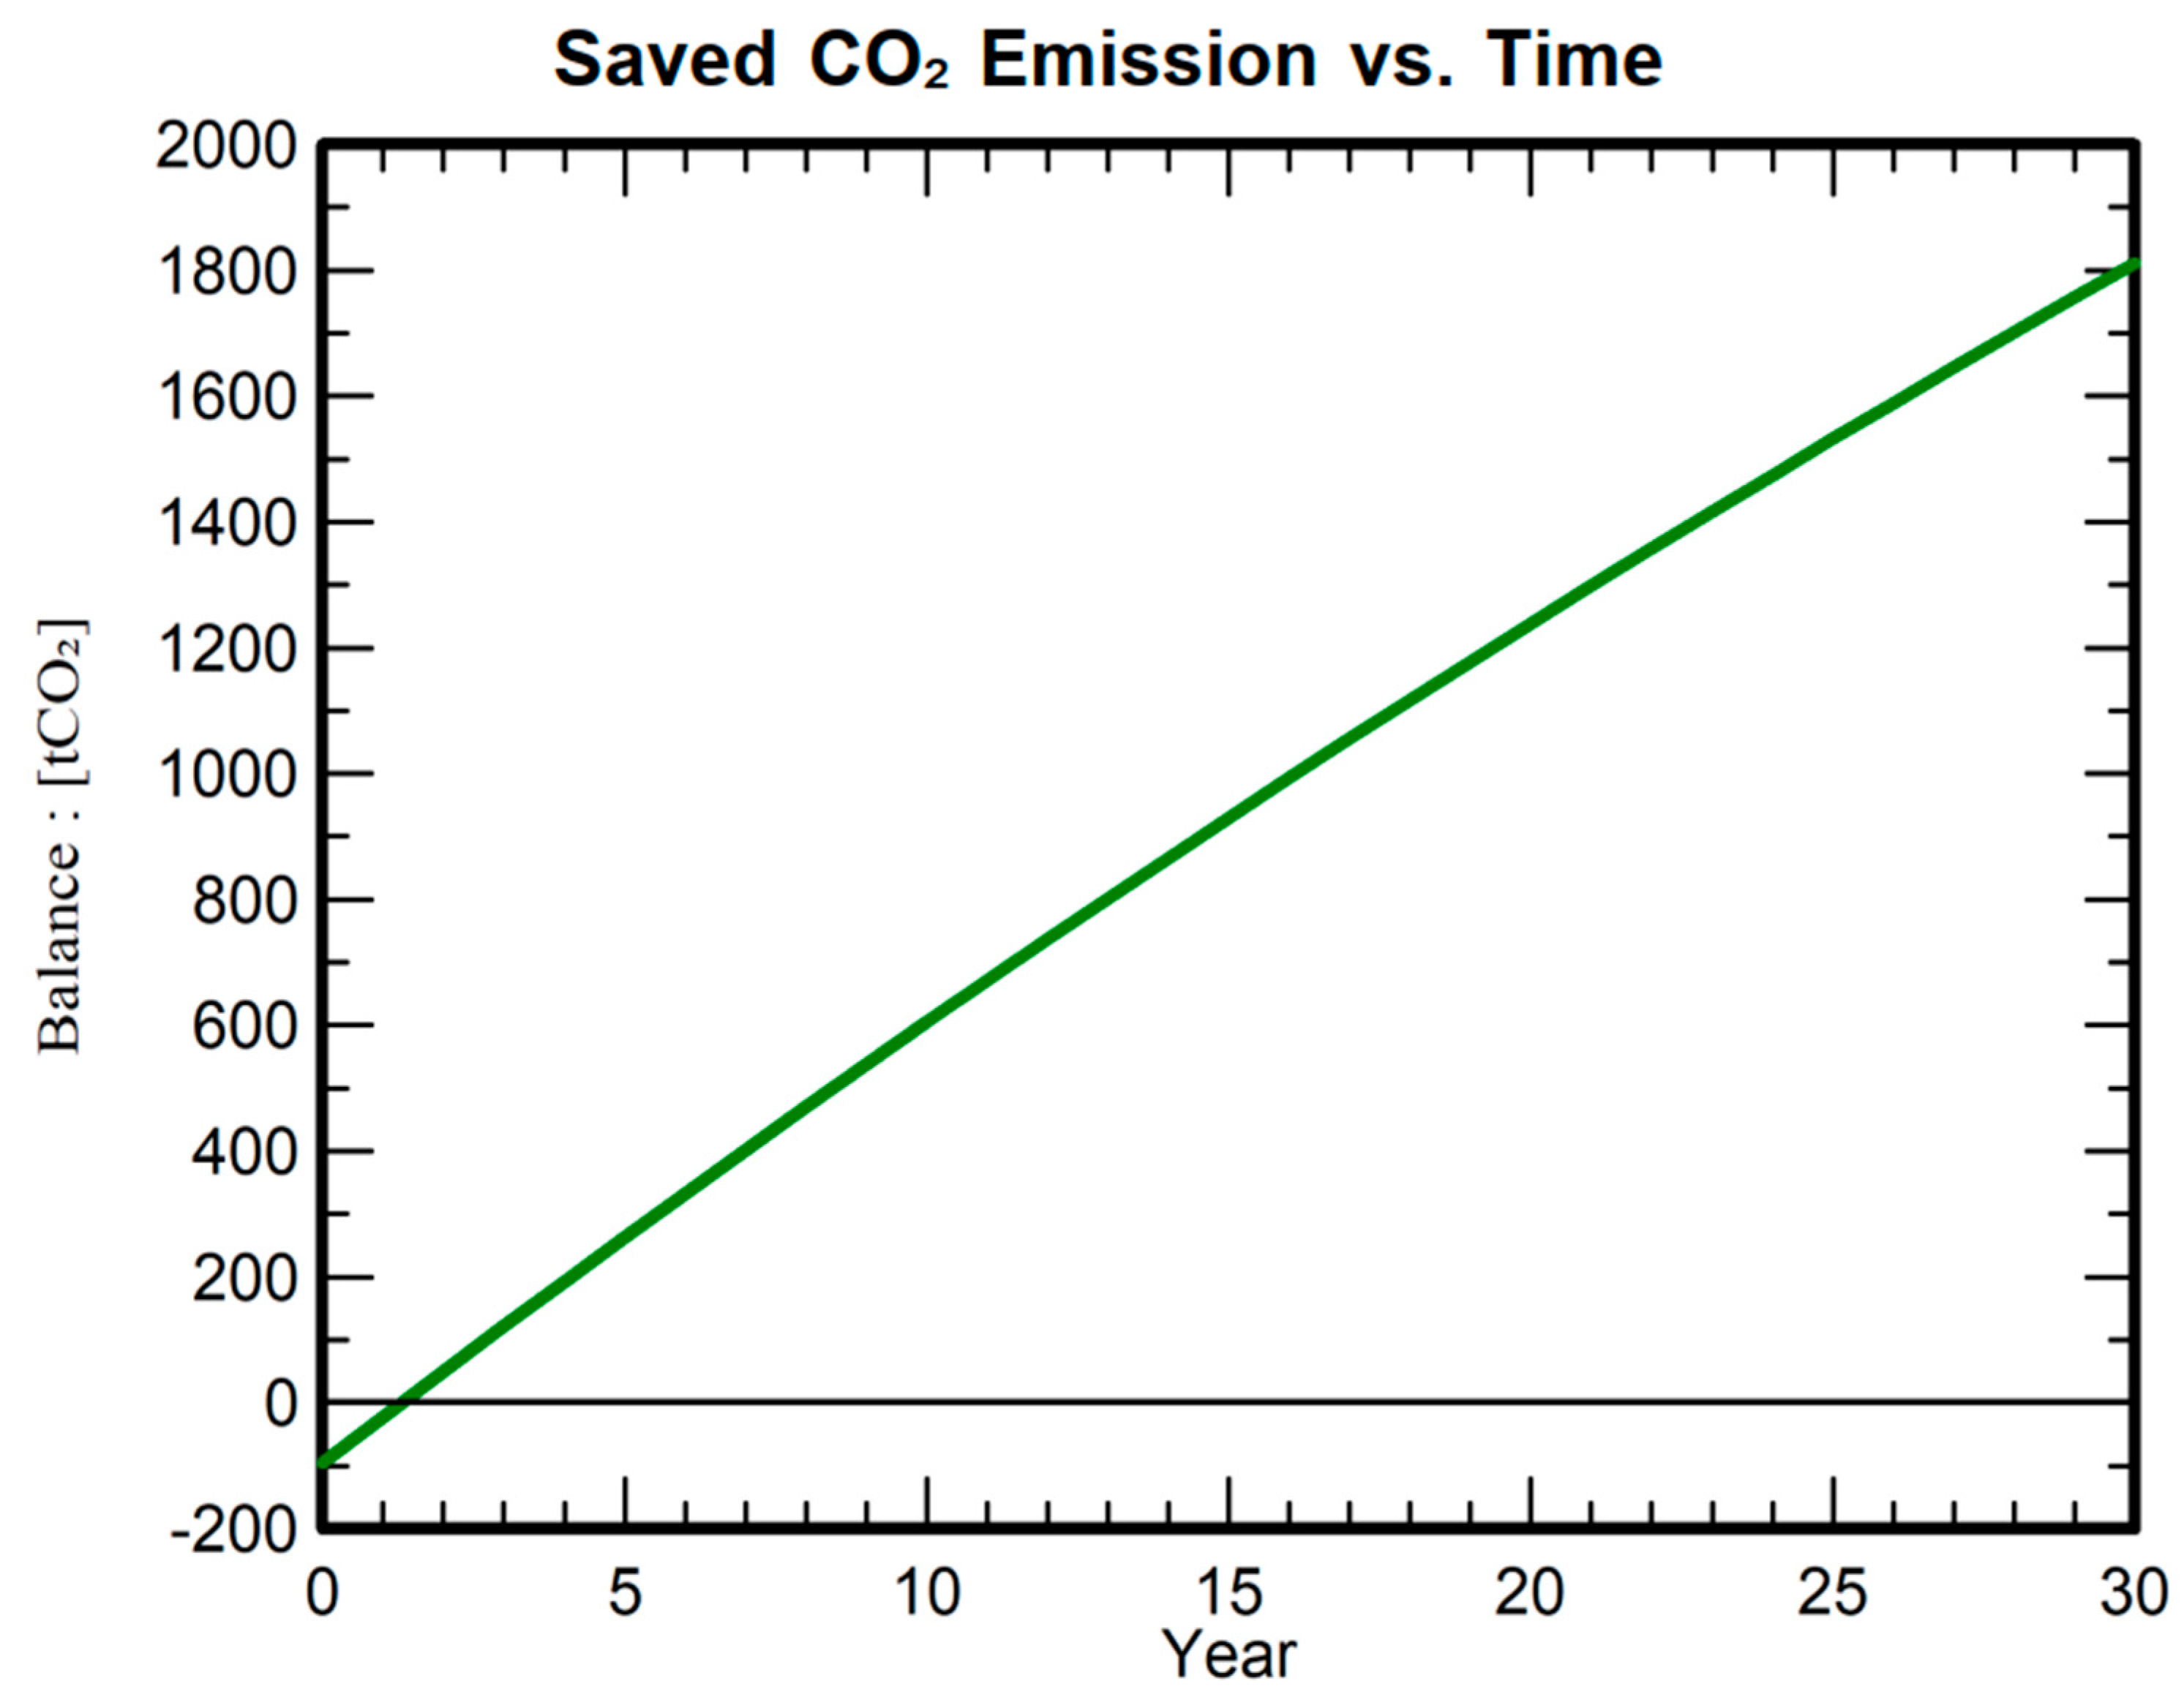
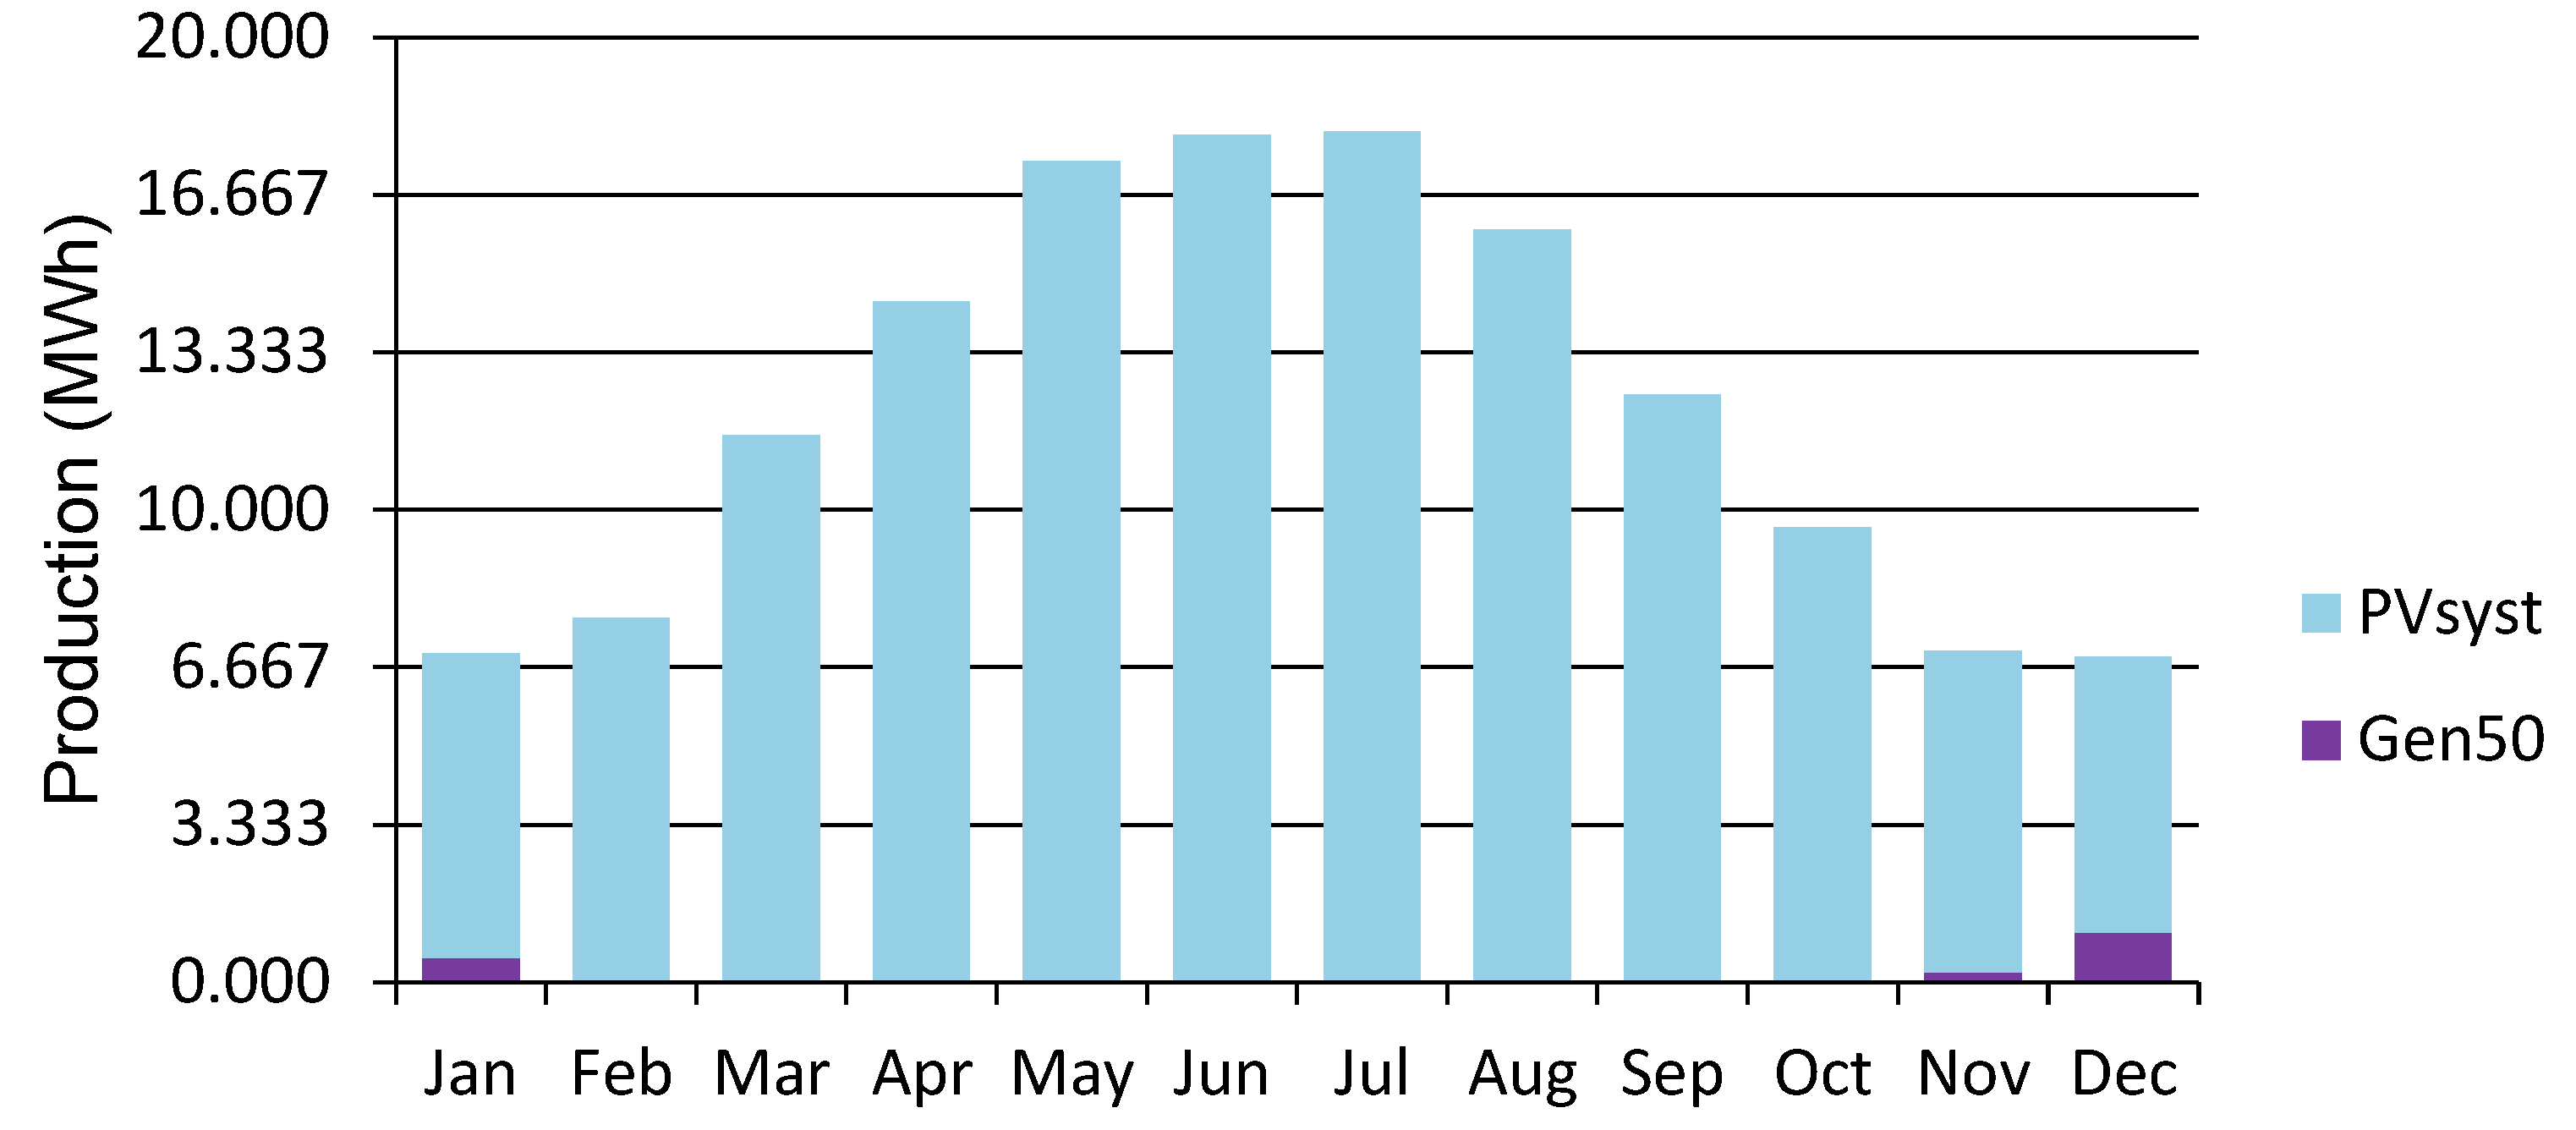
This research article comprehensively analyzes a hybrid stand-alone microgrid system comprising PV modules, inverters, a battery storage system, a generator, and an AC load. Integrating PVsyst, HOMER Pro, and SAM software tools allowed for a thorough design, optimization, and performance evaluation of the hybrid stand-alone microgrid. The findings reveal increasing ground clearance results in uniform backside irradiance, which amplifies bifacial power gain to an optimal level, and increasing ground albedo also results in bifacial power gain. For monofacial power generation there was a promising normalized production of 4.53 kWh/kWp/day with a performance ratio of 0.815 and annual energy production estimates of 84.31 MWh (P50), 79.57 MWh (P90), and 78.24 MWh (P95). Notably, this study highlights the operational challenges faced during the winter months, necessitating generator support for load fulfillment. Moreover, the hybrid stand-alone microgrid is shown to be environmentally beneficial, saving approximately 1811.6 tons of CO2 emissions over a 30-year period, emphasizing its positive impact on sustainability and clean energy initiatives. Furthermore, the successful installation and validation of the hybrid stand-alone microgrid through experimental testing underscore its practical applicability. This research contributes valuable insights to the field of hybrid stand-alone microgrid design and underscores the importance of hybrid energy solutions to ensure a reliable power supply under varying conditions while simultaneously mitigating greenhouse gas emissions. This research will assist researchers/engineers/designers in optimizing, modeling, performance evaluating, designing, and implementing microgrid components while taking into account various parameters.

Author Contributions

Conceptualization, A.S. and M.Z.A.B.; methodology, M.Z.A.B.; software, M.Z.A.B.; validation, A.S., S.A. and W.A.; formal analysis, W.A.; investigation, A.S.; writing—original draft preparation, M.Z.A.B.; writing—review and editing, W.A.; supervision, A.S.; project administration, S.A. All authors have read and agreed to the published version of the manuscript.

Funding

This research received no external funding.

Data Availability Statement

Data are contained within the article.

Acknowledgments

The authors of the article appreciate the referees for their valuable suggestions, which contributed to improving the paper.

Conflicts of Interest

The authors declare no conflicts of interest.

Appendix A. Hourly Basis Testing Results of the Hybrid Stand-Alone Microgrid

Time:7:008:009:0010:0011:0012:0013:0014:0015:0016:0017:0018:0019:0020:0021:0022:0023:000:001:002:003:004:005:006:00
Irradiance (W/m2):8239052580287091291081562049010250000000000000
INV-1PV P(W):91238726208250724582582244524562405253920202342192100311000648204
Load P(W):203923262398264425562775270426362728249424522426233323282448195122622822256228272310248325442505
EDG P(W):------------------------
INV-2PV P(W):85338756184269326722681262427142721426019543692900000000076228
Load P(W):23182151253026582658265027812617266923292591246325562182300255325342822233123751883217623082370
EDG P(W):------------------------
INV-3PV P(W):10703607575127392773268828112776287031141949451300000000026409
Load P(W):280427412701264826062709269026182668270827252814277626072677262624462824248724532473268626552530
EDG P(W):------------------------
INV-4PV P(W):1220375458942500258325552618261025892113172036132000000000318516
Load P(W):278327782765254625442570263425792579273528142806272026662699260327542448234521862691272422902449
EDG P(W):------------------------
B-1S.O.C (%):87.3789.0193.6310010010010010010010010098.2583.5676.169.8864.661.9461.961.459.148.240.2430.228.5
B-2S.O.C (%):87.4788.5193.4710010010010010010010010098.2485.979.7273.4468.265.3164.3960.460.152.945.8836.634.6
B-3S.O.C (%):89.0390.8494.3910010010010010010010010098.7987.898276.4370.166.6566.3365.159.154.548.2539.437.6
B-4S.O.C (%):88.4690.3993.881001001001001001001001009989.6181.3275.6669.466.867.6464.660.753.647.4337.636.8
B-5S.O.C (%):89.2591.894.2599.9999.9999.9910099.9999.9910010094.2385.8183.4478.4272.168.5769.3765.761.855.750.2250.240.4
B-6S.O.C (%):89.1491.894.410010010010010010010010095.1287.0384.0779.372.969.4170.5766.760.556.751.055041.1
B-7S.O.C (%):89.0291.2194.6510010010010010010010010094.3584.2282.4677.470.967.3469.0364.859.554.348.2748.337.7
B-8S.O.C (%):88.3590.5894.9410010010010010010010010093.882.976.7876.0175.964.9468.8863.357.95241.7941.734.3
B-9S.O.C (%):87.8690.3895.4410010010010010010010092.1892.1884.9679.5273.3466.562.8667.1861.855.949.245.345.330.5
B-10S.O.C (%):87.790.295.0610010010010010010010092.5290.5284.1978.5470.5767.764.0363.3762.55750.843.642.532.2
B-11S.O.C (%):88.0488.6995.1910010010010010010010093.191.1285.5580.3470.5669.165.4567.8163.558.55346.0445.535.6
B-12S.O.C (%):87.7888.89949810010010010010010010090.1691.185.2179.973.8768.364.576762.657.451.845.0440.233.7
B-13S.O.C (%):88.4489.3694.9210010010010010010010091.2191.2386.6182.0576.4570.666.6769.564.659.454.148.124037.5
B-14S.O.C (%):89.2891.496.2410010010010010010010091.191.186.5981.776.0170.469.1769.76459.25444.5944.637
B-15S.O.C (%):88.2890.7396.210010010010010010010089.8689.8584.8179.7873.368.164.268.3162.25751.247.6947.523.2
B-16S.O.C (%):88.2390.7195.9910010010010010010010087.9586.9582.4476.7870.4468.462.2566.9360.655.148.841.6941.530.6

References

  1. Shaqsi, A.Z.; Sopian, K.; Al-Hinai, A. Review of energy storage services, applications, limitations, and benefits. Energy Rep. 2020, 6, 288–306. [Google Scholar] [CrossRef]
  2. Opeyemi, B.M. Path to sustainable energy consumption: The possibility of substituting renewable energy for non-renewable energy. Energy 2021, 228, 120519. [Google Scholar] [CrossRef]
  3. Solaun, K.; Cerdá, E. Climate change impacts on renewable energy generation. A review of quantitative projections. Renew. Sustain. Energy Rev. 2019, 116, 109415. [Google Scholar] [CrossRef]
  4. Halkos, G.E.; Gkampoura, E.C. Reviewing usage, potentials, and limitations of renewable energy sources. Energies 2020, 13, 2906. [Google Scholar] [CrossRef]
  5. Basit, M.A.; Dilshad, S.; Badar, R.; Sami ur Rehman, S.M. Limitations, challenges, and solution approaches in grid-connected renewable energy systems. Int. J. Energy Res. 2020, 44, 4132–4162. [Google Scholar] [CrossRef]
  6. Moriarty, P.; Honnery, D. The limits of renewable energy. In Switching Off: Meeting Our Energy Needs in a Constrained Future; Springer: Singapore, 2022; pp. 35–54. [Google Scholar]
  7. Ahmed, A.; Ge, T.; Peng, J.; Yan, W.C.; Tee, B.T.; You, S. Assessment of the renewable energy generation towards net-zero energy buildings: A review. Energy Build. 2022, 256, 111755. [Google Scholar] [CrossRef]
  8. Fatima, N.; Li, Y.; Ahmad, M.; Jabeen, G.; Li, X. Factors influencing renewable energy generation development: A way to environmental sustainability. Environ. Sci. Pollut. Res. 2021, 28, 51714–51732. [Google Scholar] [CrossRef]
  9. Bhatti, M.Z.; Siddique, A.; Aslam, W.; Atiq, S.; Khan, H.S. Improved model predictive direct power control for parallel distributed generation in grid-tied microgrids. Energies 2023, 16, 1441. [Google Scholar] [CrossRef]
  10. Khan, H.S.; Aamir, M.; Ali, M.; Waqar, A.; Ali, S.U.; Imtiaz, J. Finite control set model predictive control for parallel connected online ups system under unbalanced and nonlinear loads. Energies 2019, 12, 581. [Google Scholar] [CrossRef]
  11. Khan, H.S.; Aamir, M.; Kauhaniemi, K.; Mumtaz, M.; Hassan, M.W.; Ali, M. Improved finite control set model predictive control for distributed energy resource in islanded microgrid with fault-tolerance capability. Eng. Sci. Technol. Int. J. 2021, 24, 694–705. [Google Scholar] [CrossRef]
  12. Abbasi, M.; Abbasi, E.; Li, L.; Aguilera, R.P.; Lu, D.; Wang, F. Review on the microgrid concept, structures, components, communication systems, and control methods. Energies 2023, 16, 484. [Google Scholar] [CrossRef]
  13. Khalil, L.; Bhatti, K.L.; Awan, M.A.; Riaz, M.; Khalil, K.; Alwaz, N. Optimization and designing of hybrid power system using HOMER pro. Mater. Today Proc. 2021, 47, S110–S115. [Google Scholar] [CrossRef]
  14. Çetinbaş, İ.; Tamyurek, B.Ü.; Demirtaş, M. Design, analysis and optimization of a hybrid microgrid system using HOMER software: Eskisehir osmangazi university example. Int. J. Renew. Energy Dev. 2019, 8, 65–79. [Google Scholar] [CrossRef]
  15. Oulis Rousis, A.; Tzelepis, D.; Konstantelos, I.; Booth, C.; Strbac, G. Design of a hybrid AC/DC microgrid using Homer Pro: Case study on an islanded residential application. Inventions 2018, 3, 55. [Google Scholar] [CrossRef]
  16. Ur Rashid, M.; Ullah, I.; Mehran, M.; Baharom, M.N.; Khan, F. Techno-economic analysis of grid-connected hybrid renewable energy system for remote areas electrification using homer pro. J. Electr. Eng. Technol. 2022, 17, 981–997. [Google Scholar] [CrossRef]
  17. Raji, A.K.; Luta, D.N. Modeling and optimization of a community microgrid components. Energy Procedia 2019, 156, 406–411. [Google Scholar] [CrossRef]
  18. Nsengimana, C.; Han, X.T.; Li, L.L. Comparative analysis of reliable, feasible, and low-cost photovoltaic microgrid for a residential load in Rwanda. Int. J. Photoenergy 2020, 2020, 1–4. [Google Scholar] [CrossRef]
  19. Faiz, F.U.; Shakoor, R.; Raheem, A.; Umer, F.; Rasheed, N.; Farhan, M. Modeling and analysis of 3 MW solar photovoltaic plant using PVSyst at Islamia University of Bahawalpur, Pakistan. Int. J. Photoenergy 2021, 2021, 6673448. [Google Scholar] [CrossRef]
  20. Kumar, R.; Rajoria, C.S.; Sharma, A.; Suhag, S. Design and simulation of standalone solar PV system using PVsyst Software: A case study. Mater. Today Proc. 2021, 46, 5322–5328. [Google Scholar] [CrossRef]
  21. Alnoosani, A.; Oreijah, M.; Alhazmi, M.; Samkari, Y.; Faqeha, H. Design of 100mw solar pv on-grid connected power plant using (pvsyst) in umm al-qura university. Int. J. Sci. Res. 2019, 8, 356–363. [Google Scholar]
  22. Baqir, M.; Channi, H.K. Analysis and design of solar PV system using Pvsyst software. Mater. Today Proc. 2022, 48, 1332–1338. [Google Scholar] [CrossRef]
  23. Belmahdi, B.; El Bouardi, A. Solar potential assessment using PVsyst software in the northern zone of Morocco. Procedia Manuf. 2020, 46, 738–745. [Google Scholar] [CrossRef]
  24. Chennaif, M.; Maaouane, M.; Zahboune, H.; Elhafyani, M.; Zouggar, S. Tri-objective techno-economic sizing optimization of Off-grid and On-grid renewable energy systems using Electric system Cascade Extended analysis and system Advisor Model. Appl. Energy 2022, 305, 117844. [Google Scholar] [CrossRef]
  25. Da Silva, G.D. Utilisation of the System Advisor Model to estimate electricity generation by grid-connected photovoltaic projects in all regions of Brazil. Int. J. Softw. Eng. Appl. 2017, 11, 1–2. [Google Scholar] [CrossRef]
  26. Karimi, M.; Farshad, M.; Hong, Q.; Laaksonen, H.; Kauhaniemi, K. An Islanding Detection Technique for Inverter-Based Distributed Generation in Microgrids. Energies 2021, 14, 130. [Google Scholar] [CrossRef]
  27. Kumar, J.; Parthasarathy, C.; Västi, M.; Laaksonen, H.; Shafie-Khah, M.; Kauhaniemi, K. Sizing and Allocation of Battery Energy Storage Systems in Åland Islands for Large-Scale Integration of Renewables and Electric Ferry Charging Stations. Energies 2020, 13, 317. [Google Scholar] [CrossRef]
  28. Debdouche, N.; Deffaf, B.; Benbouhenni, H.; Laid, Z.; Mosaad, M.I. Direct Power Control for Three-Level Multifunctional Voltage Source Inverter of PV Systems Using a Simplified Super-Twisting Algorithm. Energies 2023, 16, 4103. [Google Scholar] [CrossRef]
  29. Kumar, J.; Parhyar, N.R.; Panjwani, M.K.; Khan, D. Design and performance analysis of PV grid-tied system with energy storage system. Int. J. Electr. Comput. Eng. 2021, 11, 1077. [Google Scholar] [CrossRef]
  30. Gul, E.; Baldinelli, G.; Bartocci, P.; Bianchi, F.; Piergiovanni, D.; Cotana, F.; Wang, J. A techno-economic analysis of a solar PV and DC battery storage system for a community energy sharing. Energy 2022, 244, 123191. [Google Scholar] [CrossRef]
  31. IEC 61724-1; Photovoltaic System Performance—Part 1: Monitoring; Edition 2.0. IEC: Geneva, Switzerland, 2021.
  32. IEC TS 61724-2; Photovoltaic System Performance—Part 2: Capacity Evaluation Method; Edition 1.0. IEC: Geneva, Switzerland, 2016.
  33. IEC TS 61724-3; Photovoltaic System Performance—Part 3: Energy Evaluation Method; Edition 1.0. IEC: Geneva, Switzerland, 2016.
Figure 1. Schematic of hybrid microgrid.
Energies 17 00200 g001
Figure 2. Flowchart for PVsyst software.
Energies 17 00200 g002
Figure 3. SOLARGIS global horizontal irradiation of location.
Energies 17 00200 g003
Figure 4. The solar elevation angle corresponds to the field coordinates.
Energies 17 00200 g004
Figure 5. Shading calculation.
Energies 17 00200 g005
Figure 6. Architectural layout for the PV power plant.
Energies 17 00200 g006
Figure 7. Flowchart for designing the hybrid stand-alone microgrid using HOMER Pro software.
Energies 17 00200 g007
Figure 8. Schematics of DCDBs and inverters’ connection configuration.
Energies 17 00200 g008
Figure 9. Schematics of BESS and inverters’ connection configuration.
Energies 17 00200 g009
Figure 10. Schematics of AC side connection configuration.
Energies 17 00200 g010
Figure 11. Flowchart for BESS charging.
Energies 17 00200 g011
Figure 12. Flowchart for BESS discharging.
Energies 17 00200 g012
Figure 13. Impact of ground clearance on annual generation across various tilt angles of PV modules.
Energies 17 00200 g013
Figure 14. Impact of ground albedo on annual generation across various tilt angles of PV modules considering zero ground clearance.
Energies 17 00200 g014
Figure 15. Daily system output energy of PV plant.
Energies 17 00200 g015
Figure 16. Normalized productions per installed kWp of PV plant.
Energies 17 00200 g016
Figure 17. Loss analysis of PV plant.
Energies 17 00200 g017
Figure 18. Evaluation of probability distribution.
Energies 17 00200 g018
Figure 19. Performance ratio (PR) of PV plant.
Energies 17 00200 g019
Figure 20. Saved CO2 emissions for the next 30 years.
Energies 17 00200 g020
Figure 21. Power injection from the PV plant.
Energies 17 00200 g021
Figure 22. Power injection from the EDG.
Energies 17 00200 g022
Figure 23. Expected PV plant and EDG output for the entire year.
Energies 17 00200 g023
Figure 24. BESS charge (Ah) and discharge level.
Energies 17 00200 g024
Figure 25. BESS state of charge (%), charging, and discharge.
Energies 17 00200 g025
Figure 26. Unmet load, BESS charging, and discharge.
Energies 17 00200 g026
Figure 27. Summary of hybrid stand-alone microgrid generation and consumption.
Energies 17 00200 g027
Table 1. Detailed electrical load schedule.
S.noLoad DescriptionTotal Wattage (W)hr./dayAmp. hr./dayWatt hr./day
1Pump Motors1000246024,000
2Control Panel Loads1040.382410924,969.12
3Heat Tracing500245212,000
4Access Control Cabin Loads3305.52434579,332
5Elec. Equipment Room Loads17002418140,800
Total Load in Watts7546Watts
Total Load in Watts with 15% Margin8678Watts
Total Load in Watt hr./day181,101W-hr./day
Total Load in Watt hr./day with 15% Margin208,266W-hr./day
Table 2. Input data.
S.noDescriptionValueUnit
1Three-Phase Voltage400V
2Single-Phase Voltage220V
3Power Factor0.8
4Efficiency0.9
5Largest Motor0.55kW
Table 3. Diesel generator sizing.
Calculation of Required Generator Rating under Running Condition
Total running load in kW7.5kW
Total running load in kVAR = kW × Tan(cos−1(θ))5.7kVAR
Total running load in kVA = Sqrt((kW)2 + (KVAR)2)9.43kVA
Total running load in KVA with 15% margin10.85kVA
Calculation based on largest motor load
Largest motor load0.55kW
Starting current6Times
Full load current for largest motor3.32Amp
Motor rating (kW/power factor)0.69kVA
Motor rating considering the starting current (6 × 0.69)4.13kVA
Total running load of the site with largest motor starting current
Total running load of the plant with 15% margin10.85kVA
Largest motor kVA considering the starting current4.13kVA
Total kVA required for generator14.97kVA
Table 4. BESS sizing.
BESS Sizing Calculation Basis
Total load (during power supply from battery)7546W-hr.
Total load in VA (with the power factor of 0.8)9432VA
Battery aging factor (Ag)0.2
Battery depth of discharge (DOD)0.8
Battery efficiency (η)0.95
Total load of BESS in AH
Backup capacity16hr.
BESS voltage48V
Total load of BESS = (total load in kW x backup capacity)/battery bank volt2457A-hr.
Size of the BESS
Size of the BESS = [(load in A-hr.) × (1 + Ag)]/[η × DOD]3200A-hr.
Number of batteries required
Selected battery A-hr.200A-hr.
Selected battery V48V
Total Number of batteries required16No.
Table 5. Meteorological data of the site.
MonthGlobal Horizontal Irradiation kWhr./m2/mthHorizontal Diffuse Irradiation kWhr./m2/mthTemperature
°C
Wind
Velocity m/s
Relative
Humidity
%
January79.534.77.33.3964.5
February 92.639.58.93.4062.9
March 133.062.913.13.6056.0
April 173.172.817.23.4053.8
May198.290.324.03.4037.4
June 234.371.230.63.8022.9
July 233.371.634.73.4920.1
August 214.062.633.83.2021.8
September 181.239.328.63.1925.1
October 130.844.922.73.0135.0
November 92.229.514.03.0048.7
December 77.426.09.23.3060.8
Table 6. Specifications for PV module.
S.noParameterValueUnit
1Maximum power (P max)500Watt
2Maximum power voltage Vmpp42.8V
3Open circuit voltage (Voc)51.7V
4Short-circuit current (Isc)12.28A
5Max power point11.69A
6Total efficiency20.9%
7Power warranty of 84.8% output power 25Year
Table 7. Specifications for inverter.
S.noParameterValueUnit
1Rating power of the inverter13.2kVA
2DC voltage input150–8000V
3Efficiency97.6%
Table 8. Shading calculation results.
Tilt Angle (θ)Module Width (L), mHeight Difference (h), mModule Shading Length, mAzimuth Correction Angle (a), oMinimum Module Shading Length (d), m
Equation 34 5
454.3523.0916.942306.0
Table 9. DC string voltage.
String No.Panels/StringIrradiance (W/m2)Rated Voltage (Vmpp)Recorded Voltage (Vmpp)
113775672608.6
213775672610.6
313763672607.1
413763672606.8
513766672604.9
613765672605.2
712760620557.6
812765620556.8
Table 10. Battery bank results.
Battery No.Rated Voltage (V)Capacity (Ah)Recorded Voltage (V)
14820049.69
24820049.79
34820049.82
44820049.86
54820049.85
64820049.87
74820049.86
84820049.9
94820049.88
104820049.89
114820049.9
124820049.93
134820049.92
144820049.91
154820049.93
164820049.91
Table 11. Load test for the inverters.
Load Test with Solar Production 9 a.m.
Connected Load (kW)10.5Irradiance (W/m2)802
Inverter No.PV Power (W)Battery SOC (%)Load
Vac (V)Iac (A)P (kW)
Master-016208764105.62398
Slave-026184764106.12530
Slave-035751764106.32701
Slave-046208774106.32765
Load test with solar production 9 p.m.
Connected Load (kW)10.5Irradiance (W/m2)0
Inverter No.PV Power (W)Battery SOC (%)Load
Vac (V)Iac (A)P (kW)
Master-010254106.32704
Slave-020254106.12522
Slave-030254106.32401
Slave-040244106.32763
Table 12. Load test for the batteries.
B-1S.O.C (%):83.56B-5S.O.C (%):85.81B-9S.O.C (%):84.96B-13S.O.C (%):86.61
Pack V:49.55Pack V:49.56Pack V (V):49.56Pack V:49.61
Im (A):−9.1Im (A):−14.9Im (A):−14.82Im (A):−12.32
Temp (C):24.1Temp (C):24.5Temp (C):24.5Temp (C):24.6
B-2S.O.C (%):85.9B-6S.O.C (%):87.03B-10S.O.C (%):84.19B-14S.O.C (%):86.59
Pack V:49.6Pack V:49.85Pack V:49.56Pack V:49.58
Im (A):−15.1Im (A):−12.8Im (A):−14.67Im (A):−13.29
Temp (C):24.3Temp (C):23.1Temp (C):22.6Temp (C):23.8
B-3S.O.C (%):87.8B-7S.O.C (%):86.51B-11S.O.C (%):85.55B-15S.O.C (%):84.81
Pack V:49.6Pack V:49.65Pack V (V):49.6Pack V:49.57
Im (A):−13.7Im (A):−11.1Im (A):−13.73Im (A):−18.97
Temp (C):24.2Temp (C):24Temp (C):23.2Temp (C):23.1
B-4S.O.C (%):89.61B-8S.O.C (%):82.9B-12S.O.C (%):85.21B-16S.O.C (%):82.44
Pack V:48.05Pack V:49.51Pack V:49.56Pack V:49.56
Im (A):−14.9Im (A):−15.9Im (A):−13.69Im (A):−15.58
Temp (C):24.9Temp (C):23.9Temp (C):24.2Temp (C):24.2
Disclaimer/Publisher’s Note: The statements, opinions and data contained in all publications are solely those of the individual author(s) and contributor(s) and not of MDPI and/or the editor(s). MDPI and/or the editor(s) disclaim responsibility for any injury to people or property resulting from any ideas, methods, instructions or products referred to in the content.

