1. Introduction
The magnetization processes of soft magnetic materials are typically characterized by axial or rotational magnetization. In the first type of magnetization process, the magnetic field strength changes along a specified direction. This type of magnetization occurs primarily in the sheets of transformer cores and chokes; however, in the connection areas of yokes and the internal columns of the cores, the magnetization process cannot be regarded as axial magnetization. During rotational magnetization, both the field strength and flux density vectors change their directions. This typically occurs in the magnetic circuits of electric machines.
In the magnetization processes of transformer steel sheets, two phenomena occur: the domain wall displacements and the rotation of the flux density vectors toward the direction of the magnetic field strength vector [
1,
2,
3,
4]. Both phenomena occur simultaneously; however, in the range of low to medium field strength values, irreversible displacements of the domain walls are dominant; for high field strength values, this process ends, and rotations of the flux density vectors toward the direction of the field strength vector dominate the magnetization process. If the field strength increases, then domains whose flux density vectors are closest to the direction of the field strength increase in volume at the expense of the other domains. At high field strengths, the domain walls disappear and individual crystals become single domains, and then changes in the resultant flux density in the transformer sheets are mainly caused by the rotations of the flux density vectors of individual crystals toward the direction of the field strength. The characteristics of the magnetization process depend not only on the nature of the changes in the magnetic field strength, but also on the parameters of the ferromagnetic material. This process in isotropic materials (non-oriented sheets) does not depend on the field strength direction. In practice, ideal isotropic materials do not exist. Generator sheets, which are referred to as sheets with non-oriented grains, typically exhibit significantly different magnetic properties for field strength changes in different directions [
5].
The next section contains a brief description of the magnetization of the transformer sheets for two directions differing from the rolling direction and the transverse direction. This section also describes the method of preparing strips of the tested transformer sheet to measure hysteresis loops for several magnetization directions.
Section 3 presents various proposals for modeling the magnetization process in electrical sheets, paying attention to the shortcomings of these proposals.
Section 4 contains the determination of the limiting hysteresis loops depending on the magnetization direction on the transformer sheet plane.
Section 5 concerns the comparison of changes in the measured and calculated flux density for four magnetization directions using the proposed method of determining the limiting hysteresis loops. This section shows the changes in the resultant flux densities relative to the flux densities measured along the magnetization directions.
2. Description of Magnetization Process in Transformer Steel Sheets
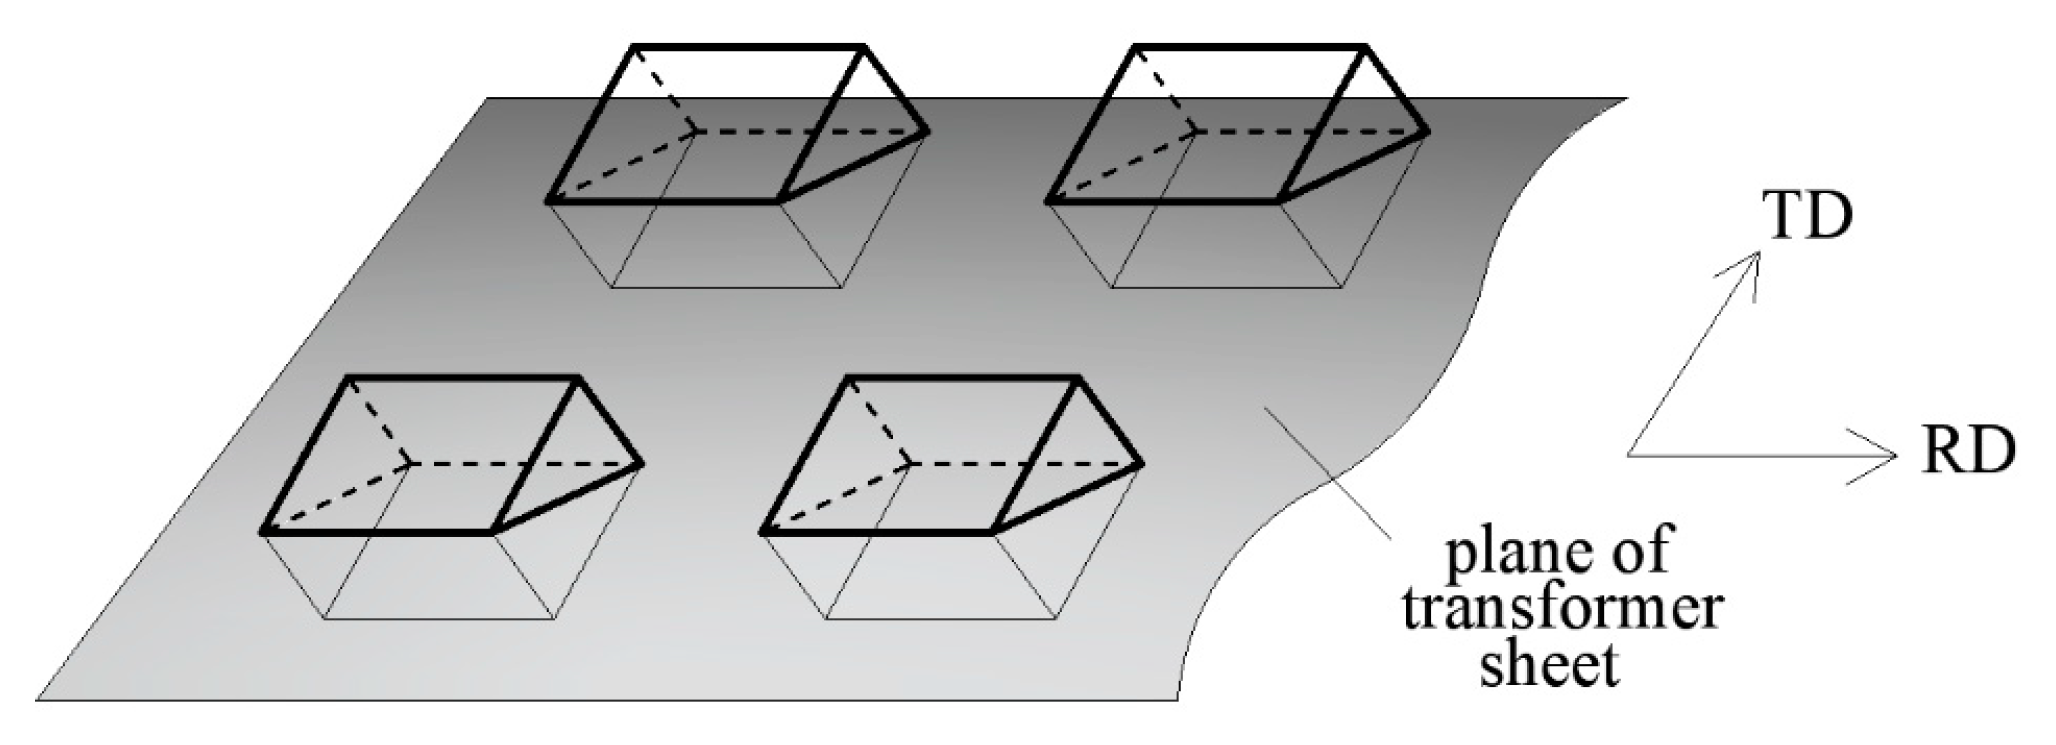
The magnetization process in anisotropic materials, which mainly includes transformer steel sheets (grain-oriented sheets), differs significantly from that in isotropic materials. Owing to various technological treatments, the grains in these sheets are arranged such that the axes of easy magnetization of most grains are parallel to the selected direction, which is typically the rolling direction (RD). The most typical type of grain arrangement is the Goss texture (
Figure 1) [
6].
In these materials, magnetization depends significantly on the field strength. If the magnetization direction is the same as or perpendicular to the RD, then the flux density vector is in the same direction as the magnetic field strength. Otherwise, the field strength and flux density vectors are not collinear.
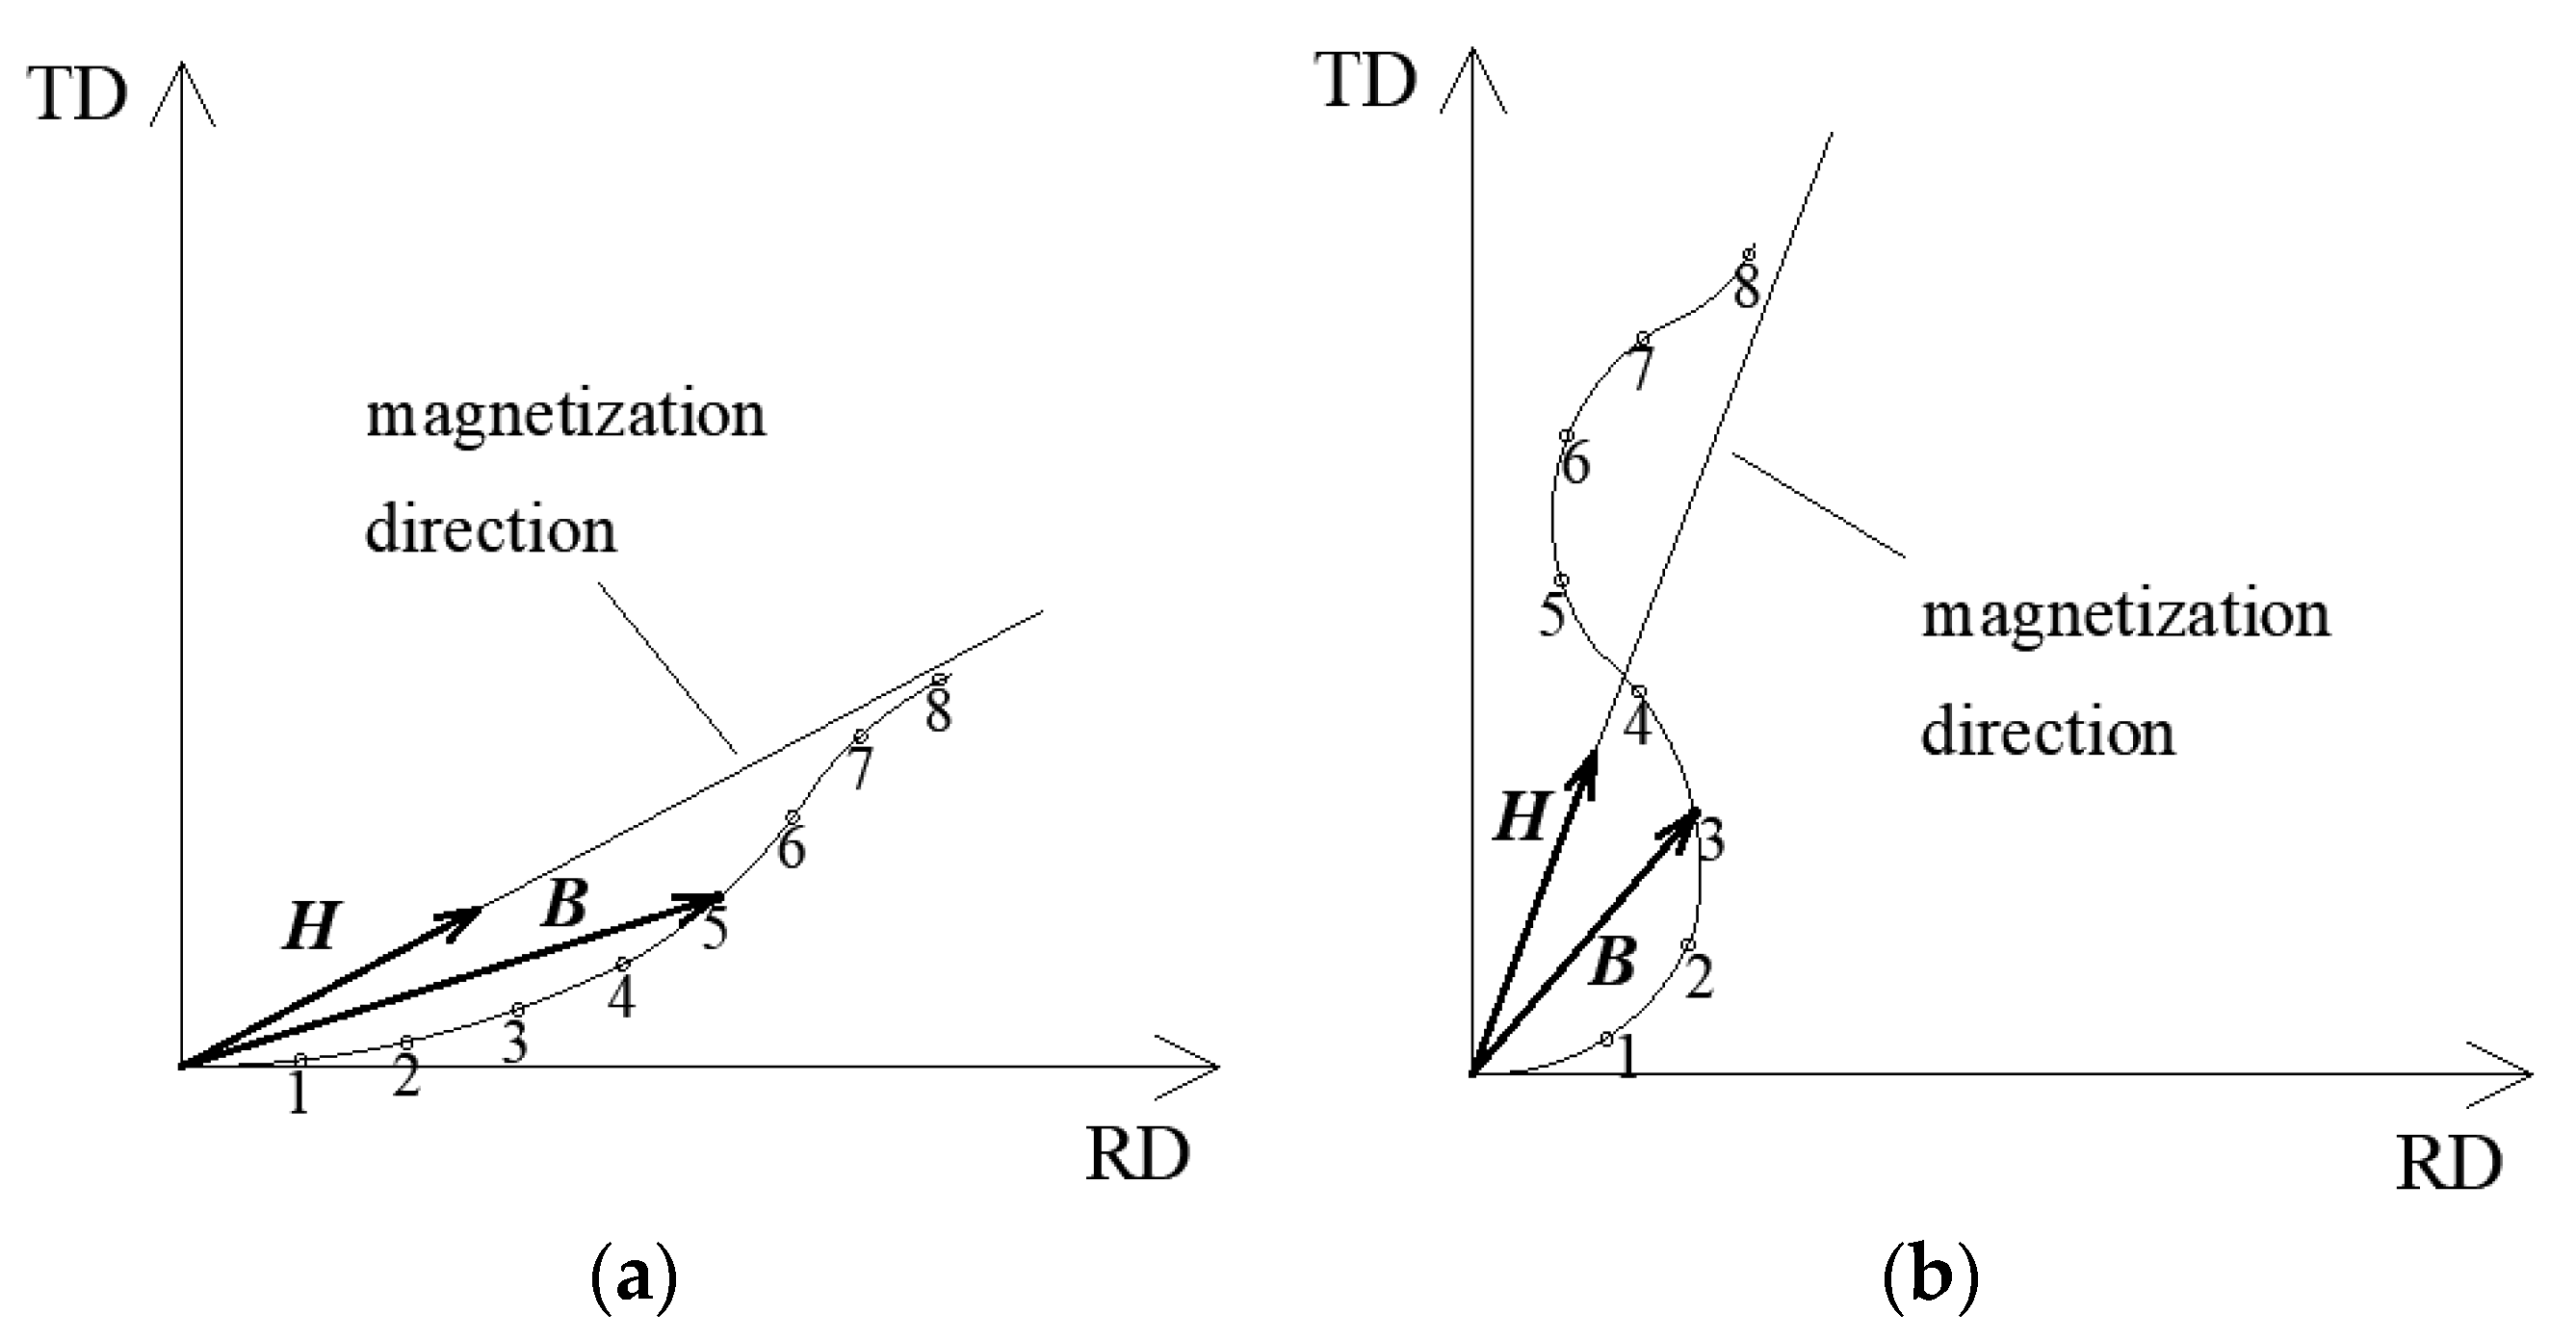
Figure 2 shows examples of changes in the resultant flux density vector for two directions where changes occur in the magnetic field strength. If the field strength direction is close to the RD, then the direction of the resultant flux density vector is close to the RD (
Figure 2a). Notably, the flux density measured along the field strength direction is the projection of the resultant flux density vector in this direction, which is crucial because in calculations of the magnetic field distribution, the resultant flux density at a specified point on the transformer sheet should be considered instead of its projection in the magnetization direction. The magnetization process is more complex when the field strength direction is close to the transverse direction (TD). In the initial phase where the field strength increases, the flux density component increases along the RD, whereas the flux density component increases slightly along the TD. When the field strength is further increased, the flux density component along the RD reaches a certain maximum value and then begins to decrease. Simultaneously, the flux density component increases along the TD (
Figure 2b). In fact, such tendencies of the flux density have been described by H. Pfützner [
7], who reported that such a magnetization process was due to the “disintegration” of domains whose flux density vectors were close to the RD and the growth of domains whose flux density vectors were parallel to the TD. In iron crystals, the most difficult magnetization occurs when the magnetization direction creates an angle of 54.7° with respect to the RD. If magnetization occurs at an angle smaller than 54.7°, then 180° domain walls are reconstructed. Otherwise, the 180° walls are rebuilt as 90° walls. Similar conclusions were presented by Mao and Atherton [
8]. In this magnetization process, the flux density vector can be located on one side or on the other in the field strength direction.
The dependence of the magnetization process on the field strength direction causes the hysteresis loops to differ significantly.
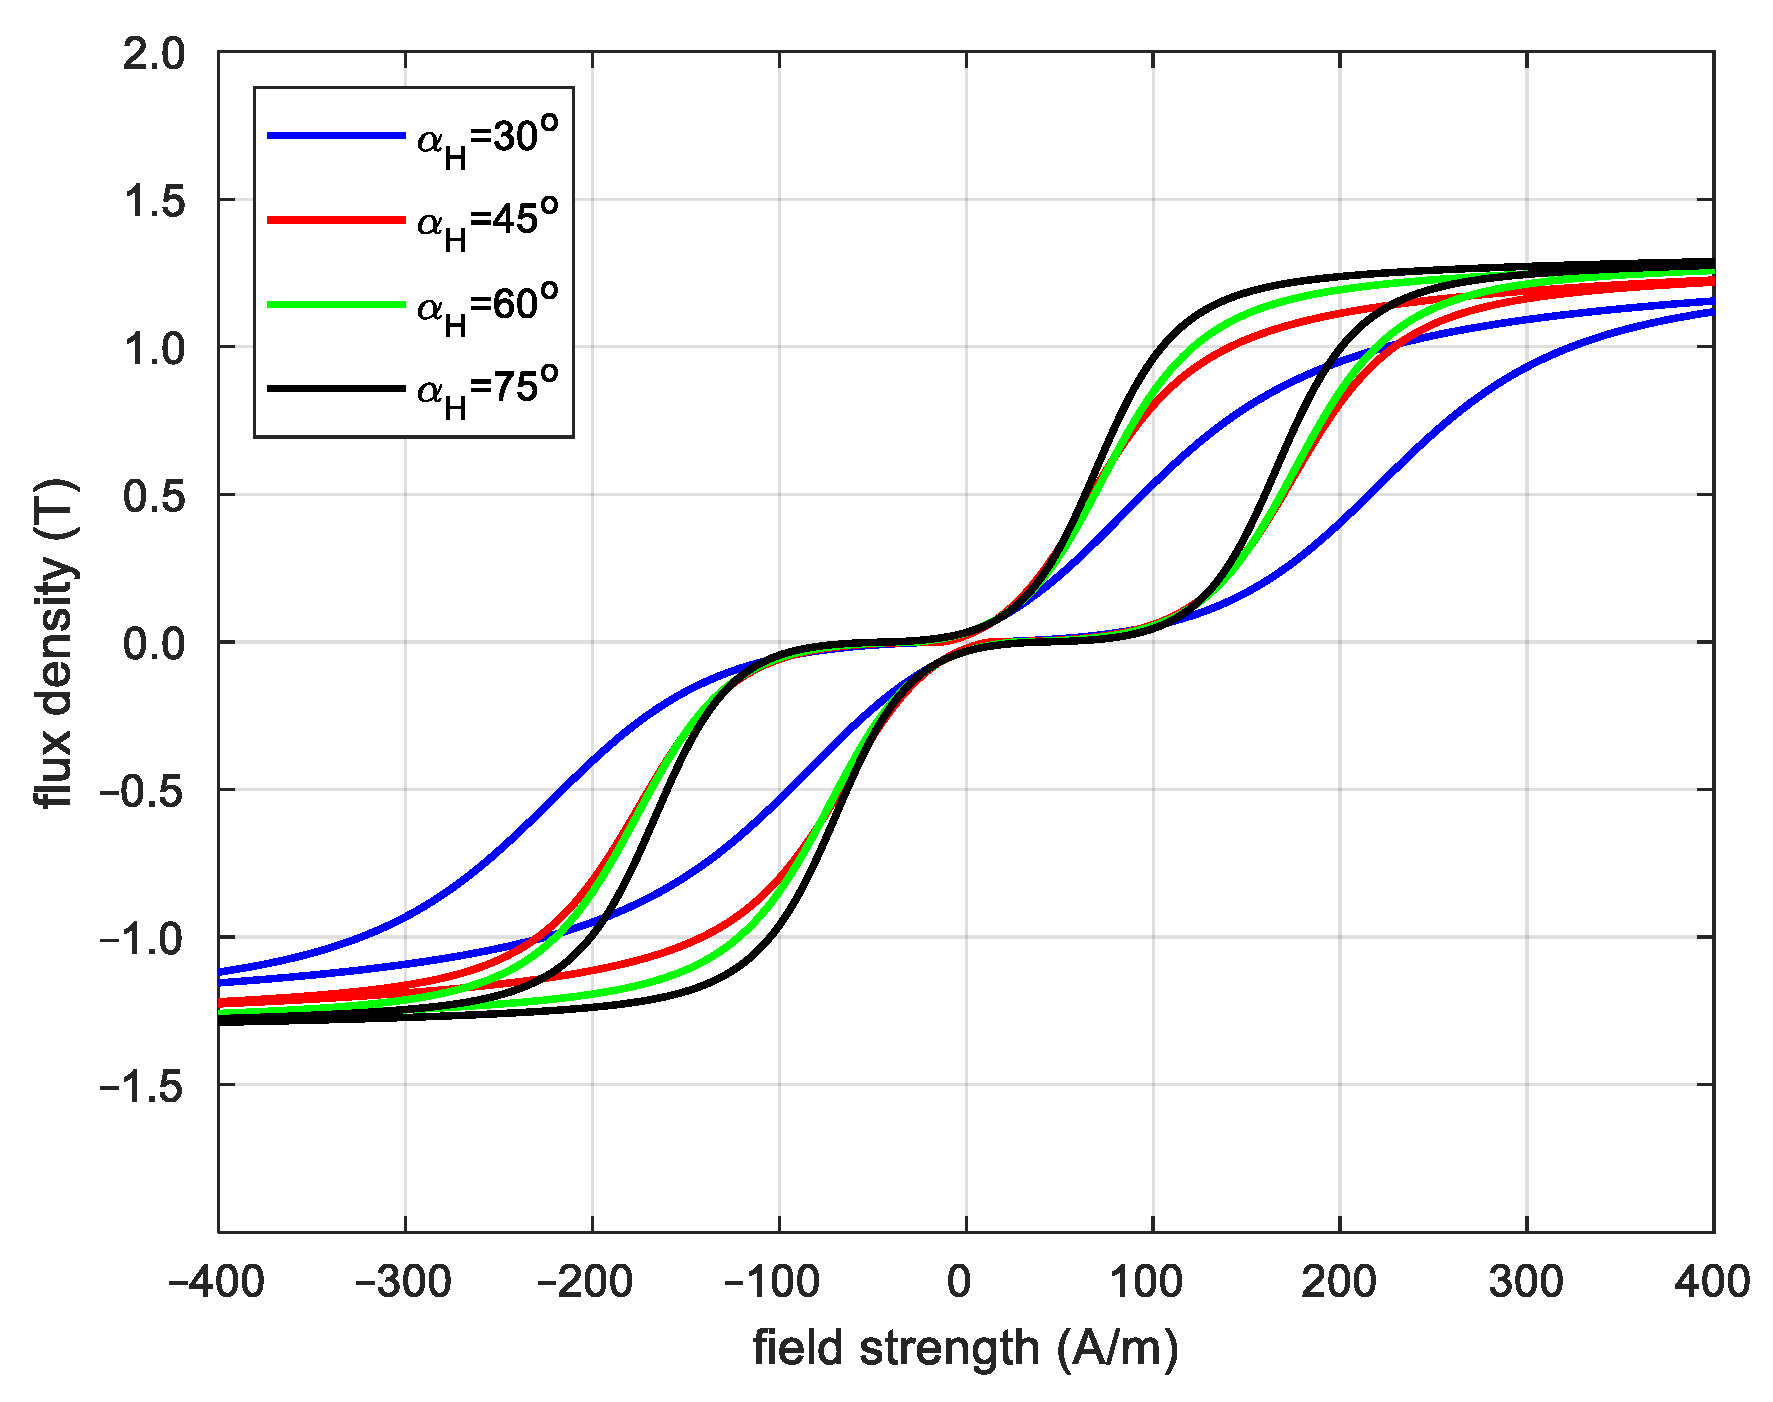
Figure 3 shows the limiting hysteresis loops of a M120-27S (This transformer sheet is produced in Stalprodukt SA in Bochnia (Poland))-type transformer steel sheet in the four magnetization directions.
Changes in the flux density in individual points of the transformer steel sheet depend also on the field strength value. Both the limiting loop for a given magnetization direction and minor loops, which are located inside the limiting hysteresis loop, should be taken into account [
2,
3]. For example,
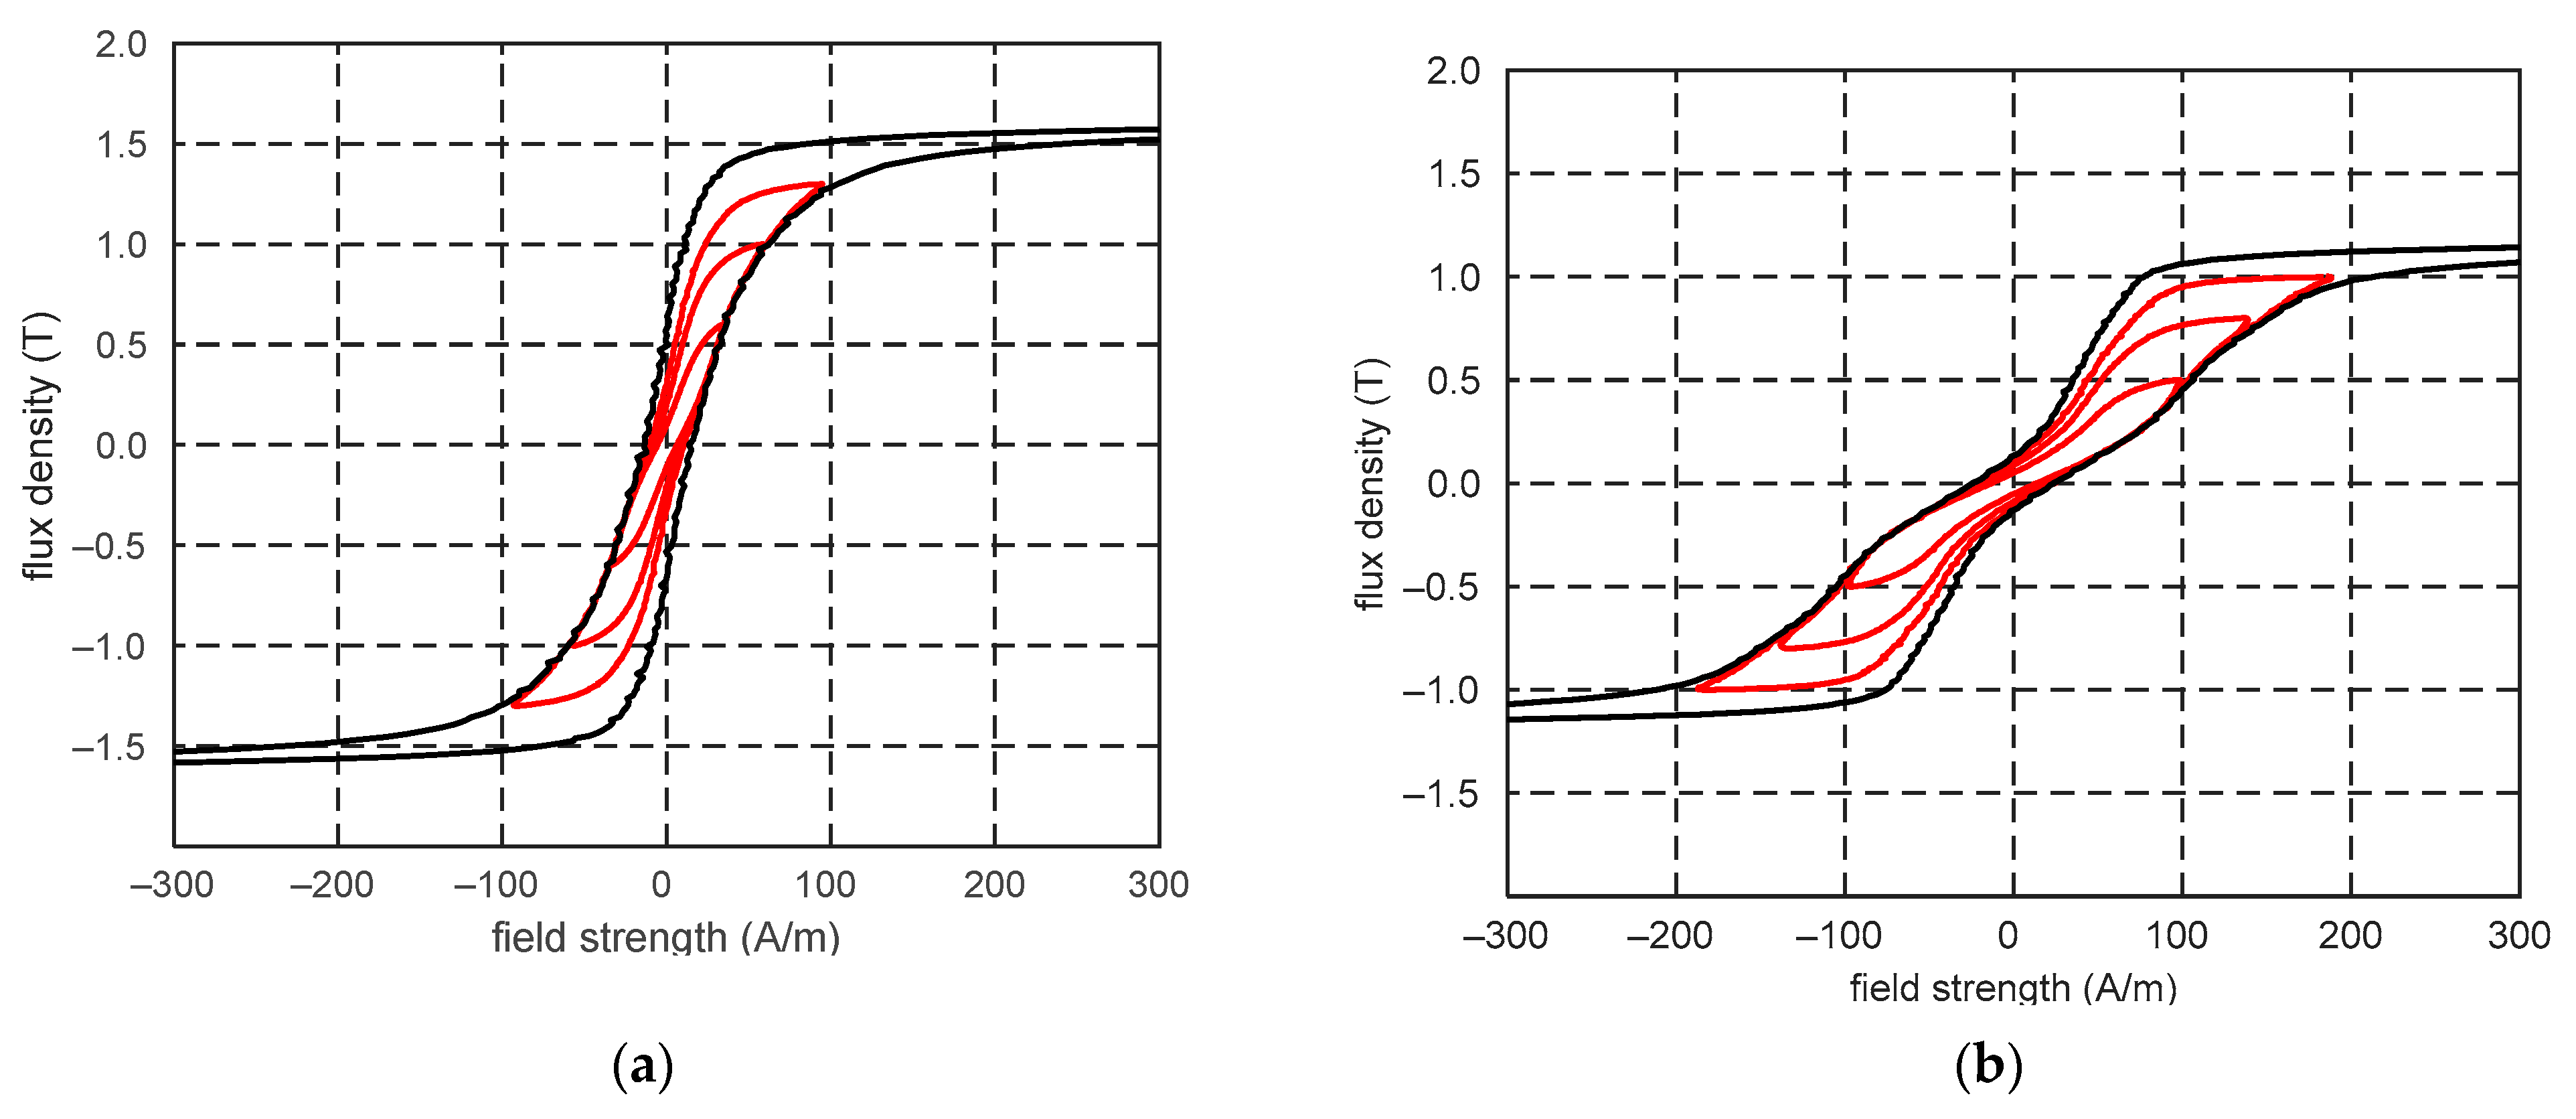
Figure 4 shows the family of minor hysteresis loops for two magnetization direction.
The hysteresis loops were determined using the Epstein frame, which is described in detail in [
9]. Despite some shortcomings, the Epstein frame is widely used for commercial magnetic measurements. The measurements of the hysteresis loops were performed at a frequency of 3 Hz (the influence of eddy currents on the measurement results can be omitted). Strips 330 mm long and 30 mm wide were cut at an assumed angle α relative to the rolling direction (RD) from a given transformer sheet (
Figure 5). Then, 16 such strips were placed in the Epstein frame and appropriate measurements were made for various currents in the winding forcing the magnetic field. As a result, a family of the minor hysteresis loops was obtained for the assumed magnetization direction.
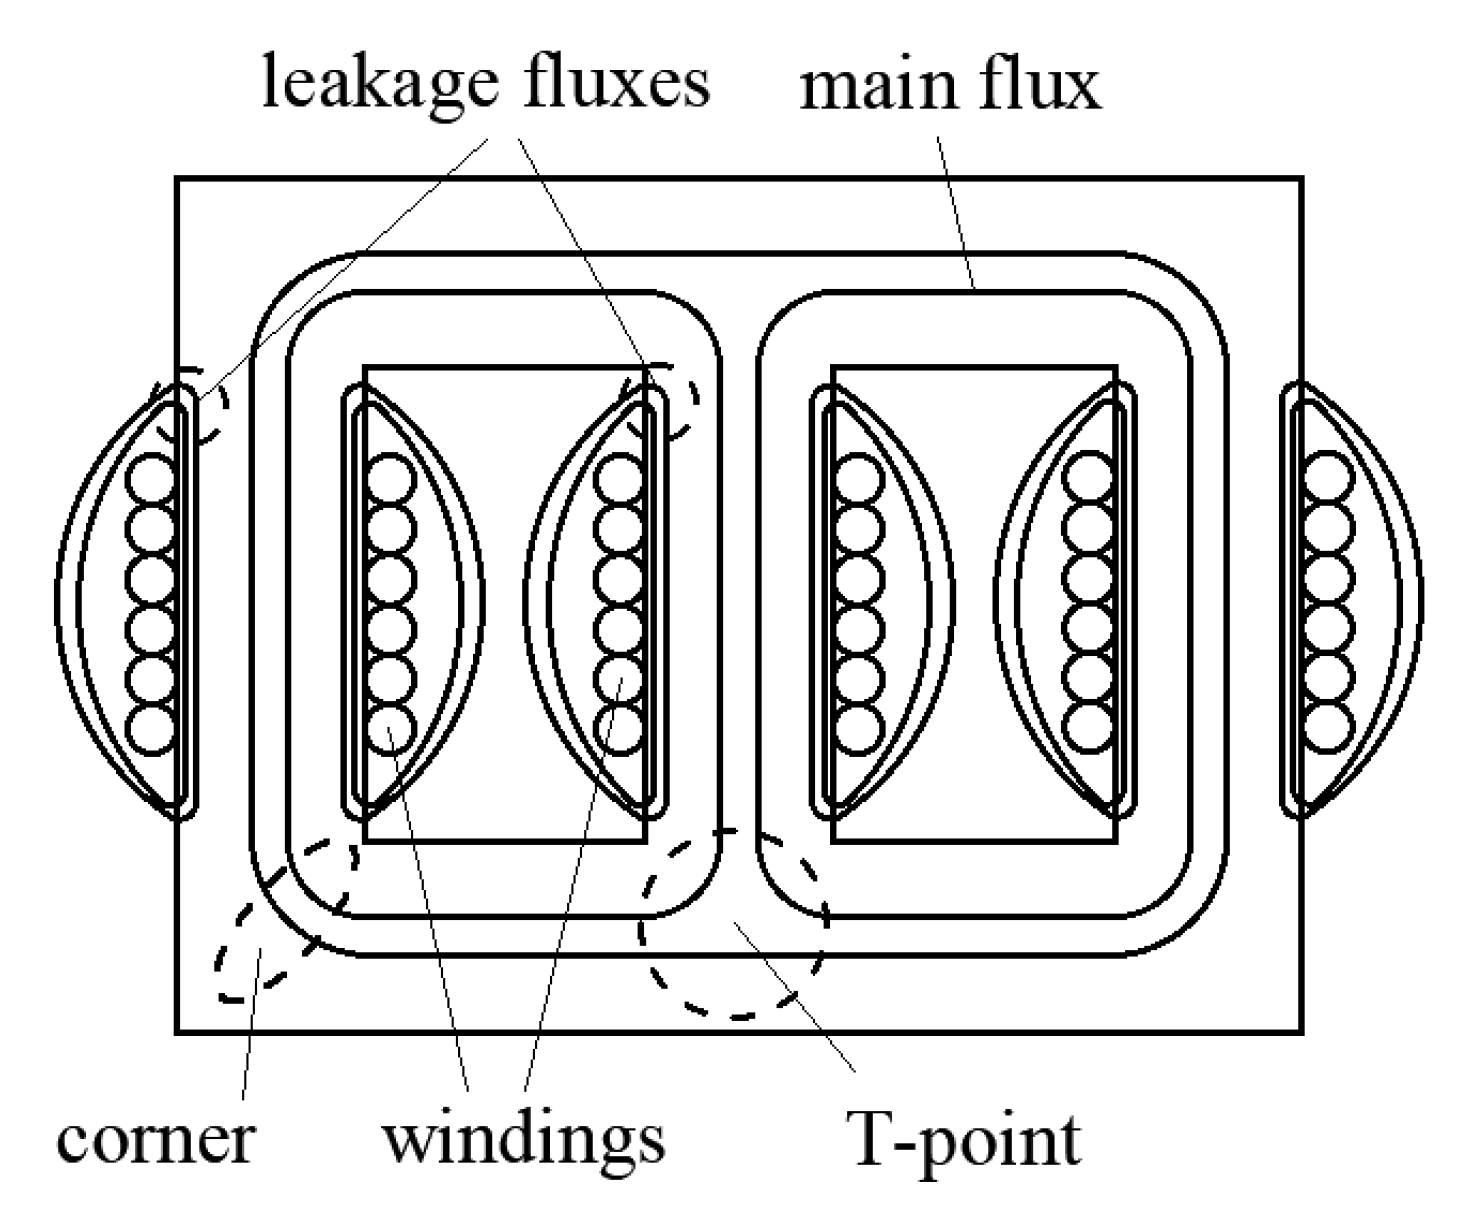
Determining the changes in the flux density at the corners of the transformer cores, particularly in the areas of column connections with yokes (T-joint points) in three-phase transformers, is difficult. In this case, the magnetic field cannot be regarded as one-dimensional field, unlike the magnetic field in the columns (
Figure 6). In certain cases, the magnetic field in certain areas of the core at the ends of the transformer windings cannot be regarded as a one-dimensional field when the winding currents are significantly higher than the rated values. Consequently, the leakage flux near air indicates high values, thus altering the direction of the field strength and flux density in the aforementioned fragments of the core [
10].
In these areas, the core temperature is typically higher than that in other sections of the transformer core. Therefore, the different characteristics of the magnetization process should be considered when calculating the flux density distribution and power losses.
3. Proposals for Modeling Magnetization Process
As it is emphasized in [
11], so far there are no satisfactory methods that make it possible to calculate changes in the flux density for any magnetization direction in grain-oriented transformer sheets. Note that the total losses should be estimated according to the general formula [
5,
12]:
where
Bx,
By—components of the flux density in a rectangular coordinate system in a considered point of a transformer steel sheet,
Hx,
Hy—components of the magnetic strength.
Therefore, it is advisable to determine changes in the flux density in the coordinate system whose axes are the same as the rolling and transverse directions. Losses in transformer cores have been determined in recent studies [
13,
14]. The nonlinear and anisotropic properties of transformer sheets, particularly the phenomenon of magnetic hysteresis, significantly hinder the analysis of the flux density distribution in the transformer sheets, thus affecting the accuracy of power loss determination. Nonetheless, advanced software makes it possible for one to consider the nonlinear and anisotropic properties of electrical sheets, as discussed in [
15]. The method that makes it possible to take the magnetic hysteresis into account is described in [
16], but that method concerns non-oriented grain sheets. Magnetic hysteresis can be directly included in the equations of magnetic field distribution when these equations are based on the integral form of Maxwell’s equations. A proposal to introduce a hysteresis model into magnetic field distribution equations is described in [
17]. In some approaches for modeling the magnetization process, the domain structure is used to represent changes in the magnetic flux density [
18,
19,
20,
21,
22,
23]. However, a method to determine the changes in the flux density for any magnetization direction has not been devised. This proposal is discussed in [
24], which presents a comparison between the measured and calculated loops for different magnetization directions; however, a method to determine minor hysteresis loops was not presented. Some researchers proposed the use of tensor relationships to determine the flux density of the transformer sheets [
25,
26].
The changes in the flux density at the individual corner points or T-joint point areas differ from each other. This indicates the necessity to consider the magnetization characteristics, and more precisely, the hysteresis loops in many directions of the magnetization process. This applies not only to the limiting hysteresis loops, but also to the minor hysteresis loops within the limiting loops. In this regard, infinitely many minor loops may be involved. To simplify the problem of modeling the magnetization process for any alternating excitation, the changes in the resultant flux density were determined based on the flux density along the RD and TD. The proposed method is based on a static hysteresis loop.
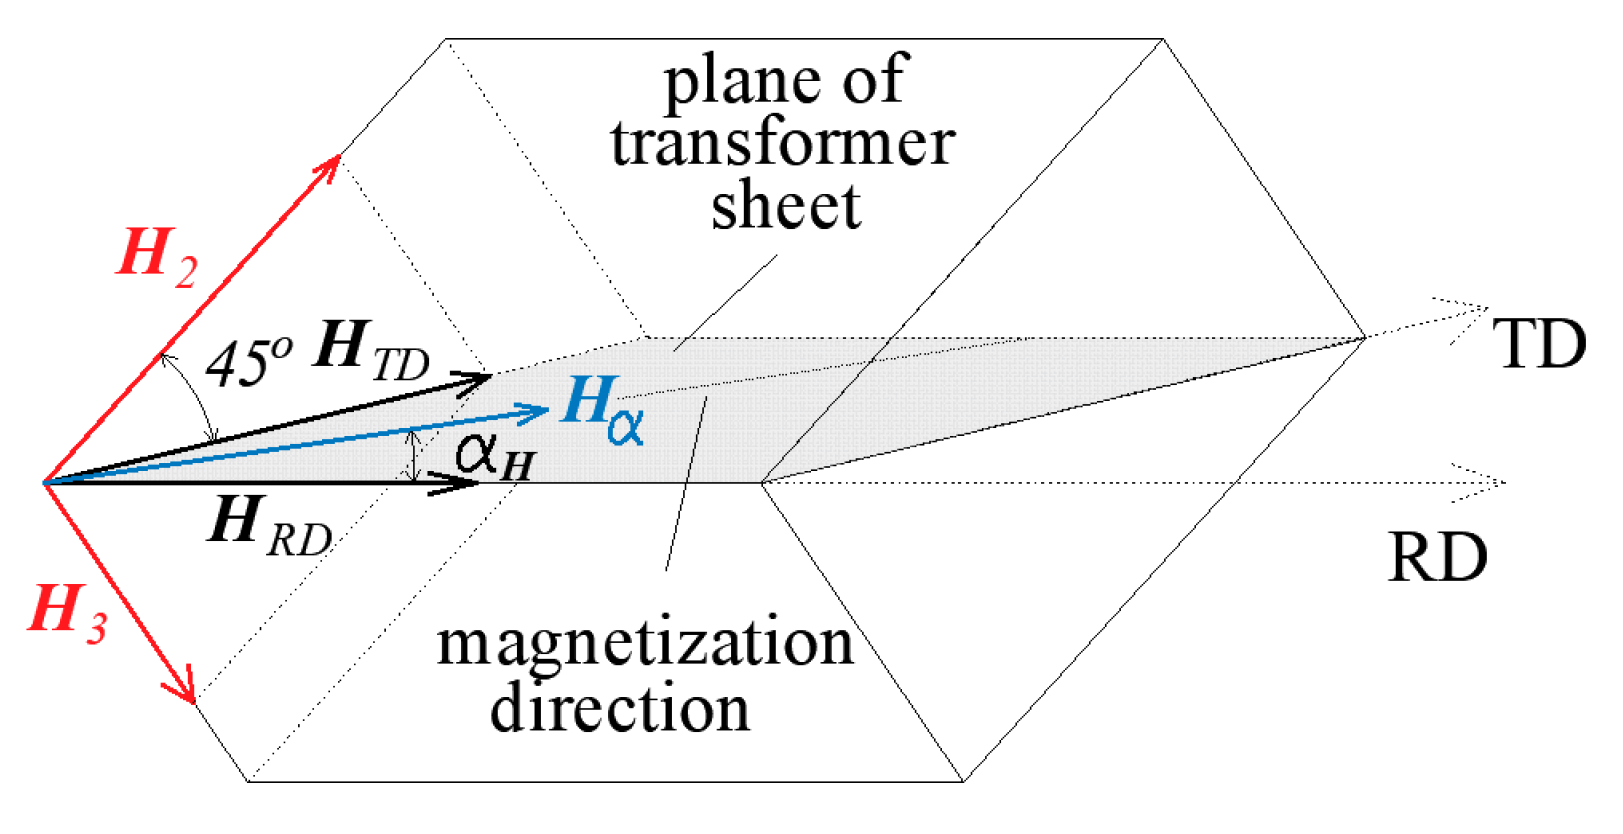
Each cubic iron crystal comprises three easy magnetization axes (
Figure 7) [
1,
4,
27]. The sheets investigated in this study were most easily magnetized along the RD. When the field strength direction was not parallel to the RD, magnetization processes occurred to varying degrees along each easy magnetization axis. Notably, magnetization first occurred along the easy magnetization axes; subsequently, the domain structure was rebuilt.
Figure 7 shows a certain magnetization direction with the vector
Hα of the magnetic field strength and the components
HRD and
HTD along the RD and TD, respectively, whereas the components
H2 and
H3 indicate the field strength values along two directions of easy magnetization, which formed a 45° angle with the sheet plane; the magnetization processes along these two axes are the same. Consequently, the changes in the flux density along these two axes are the same, and the projection of the sum of these flux densities onto the sheet plane can be regarded as the flux density in the TD.
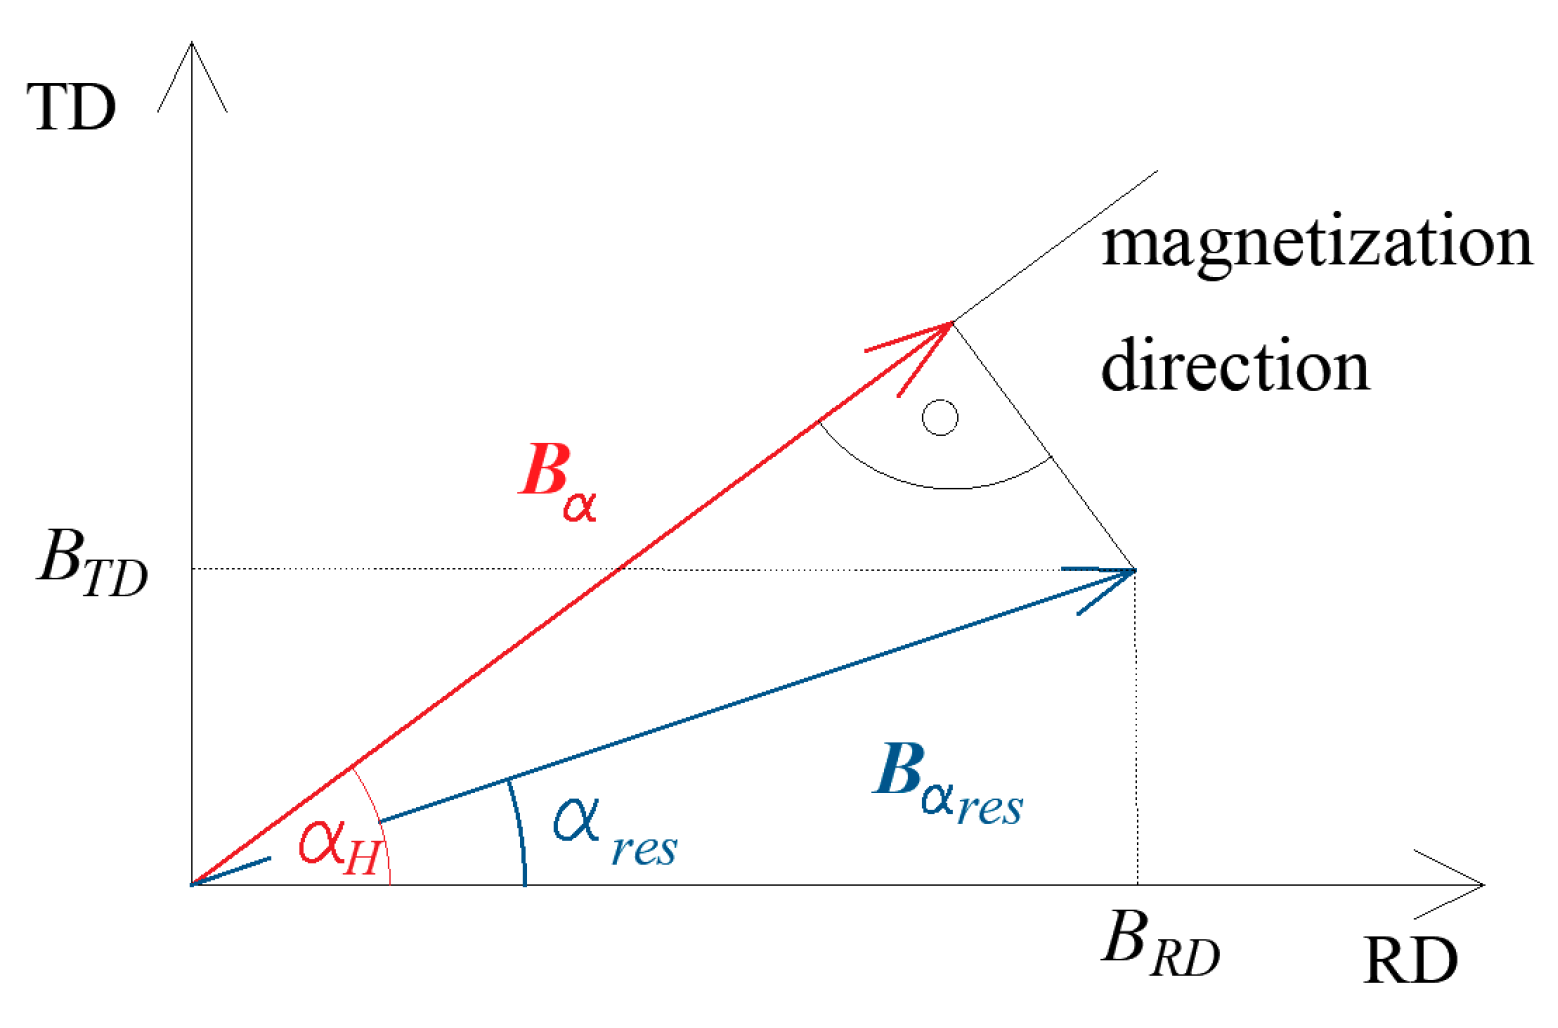
The resultant flux density, which cannot be measured directly, can be regarded as the geometric sum of the flux densities along the RD and TD (
Figure 8).
This approach makes it possible for one to consider the hysteresis if the equations of the magnetic field are based on the integral form of Maxwell’s equations; subsequently, the flux densities along the RD and TD can be introduced into the orthogonal coordinate system of the field strength and flux density.
The main issue in the calculation of hysteresis changes for any magnetization direction is determining the limiting hysteresis loops for both the RD and TD. These loops are not the same as the limiting hysteresis loops measured along the RD or TD because they depend significantly on the magnetization direction. After reaching saturation, the flux density along the TD may decrease and continue to increase in the RD or vice versa, depending on the magnetization direction, as described in
Section 2. If the limiting hysteresis loops are defined, then the changes in the flux density for minor hysteresis loops can be estimated, as described in detail in [
28].
4. Determination of Limiting Hysteresis Loops
The hysteresis loops measured along directions close to the RD exhibit a “classic” shape. If the magnetization direction is closer to the TD, then the hysteresis loops are significantly deformed and thus cannot be described using simple analytical functions. Owing to the “atypical” shape of the hysteresis loops measured for large magnetization angles, the bottom curve
BRDb(
HRD) and upper curve
BRDu(
HRD) of the limiting hysteresis loop along the RD can be approximated as follows:
where
aRD is the saturation flux density divided by 1.57,
bRD(
αH) is the coefficient determining the rate of increase in the flux density along the RD, and
HRDc(
αH) is the coercive force along the RD for particular magnetization angles.
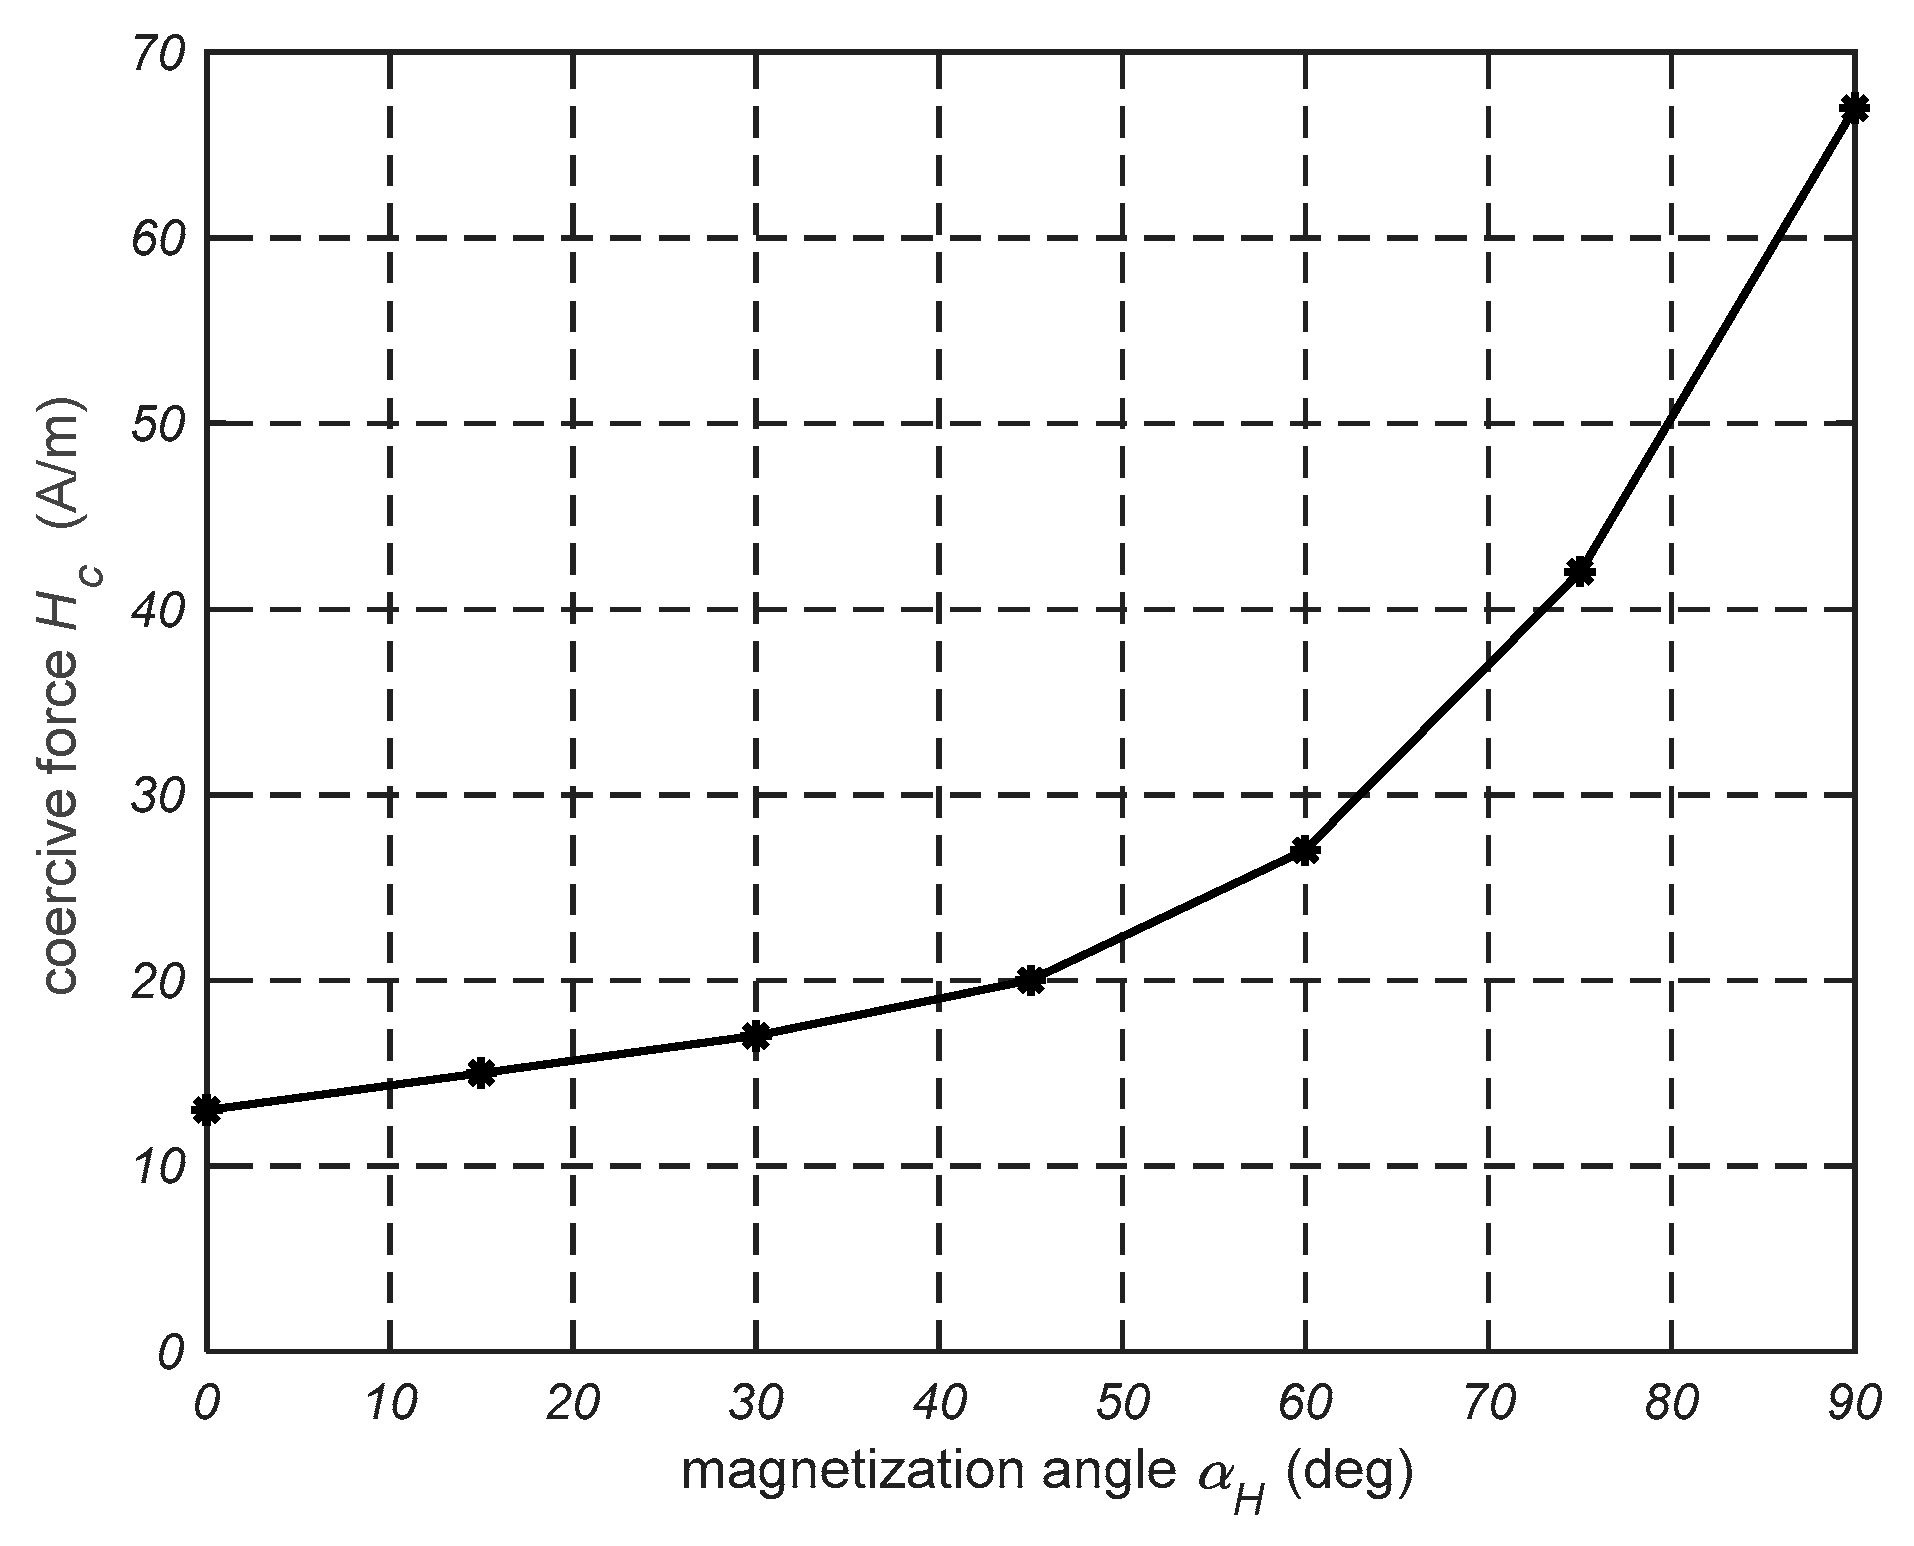
Based on the hysteresis loops measured for individual magnetization directions, the coercive force
Hc is determined and then the coercive force along the directions RD and TD is calculated as cosα
Hc and sinα
Hc, respectively. The dependence of the coercive force
Hc on the magnetization angle α
H for transformer sheet M120-27S is shown in
Figure 9. Similarly, the curves along the TD can be expressed as follows:
where
aTD = cos45
°aRD,
bTDb(
αH,
HTD), and
bTdu(
αH,
HTD) are coefficients that determine the rate of increase in the flux densities along the TD; and
HTDc(
αH) denotes the coercive force for particular magnetization angles determined similarly.
The coefficient
bRD depends only on the magnetization angle
αH. However, the coefficients
bTDb and
bTdu depend on two parameters, i.e.,
αH and
HTD, respectively; therefore, their determination is more difficult compared with that of
bRD. These coefficients are expressed as follows:
where
wTD and
dTD depend on the magnetization angle
αH, and
Hk =
Hk1 for
HTD <
HTDc or
Hk =
Hk2 for
HTD >
HTDc. Additionally,
where
Hk =
Hk1 for
HTD > −
HTDc or
Hk =
Hk2 for
HTD < −
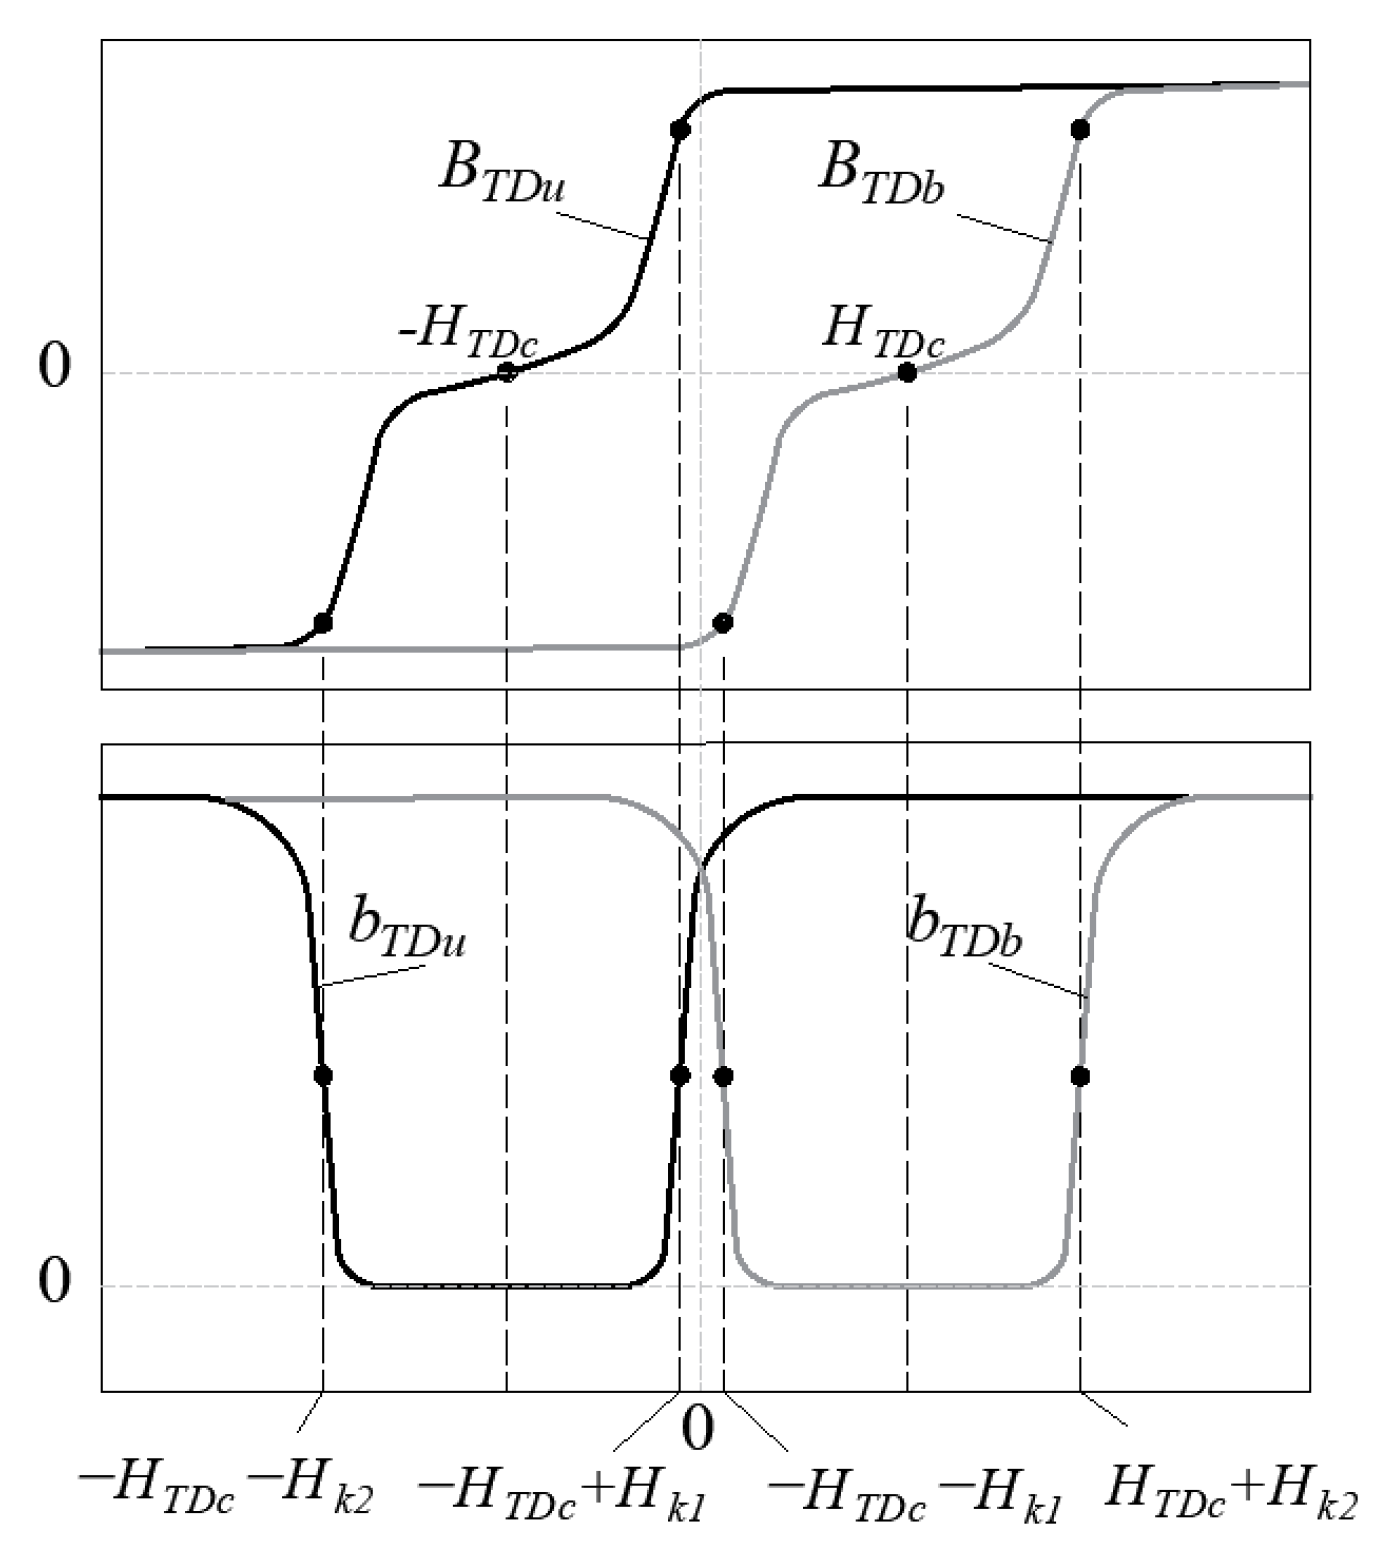
HTDc. Here,
Hk denotes the field strength when the irreversible displacements of domain walls end.
Figure 10 shows an example of a certain “atypical” hysteresis loop with parameters
HTDc,
Hk1, and
Hk2.
The coefficients
wTD and
dTD in Equation (4a,b) significantly affect the changes in the values of
bTDb and
bTdu. The parameter
Hk1 is the distance between the
HTDc and the inflection point on the curve
BTDb. Meanwhile,
Hk2 is a distance between
HTDc and the inflection point on the curve
BTDb. The coefficients
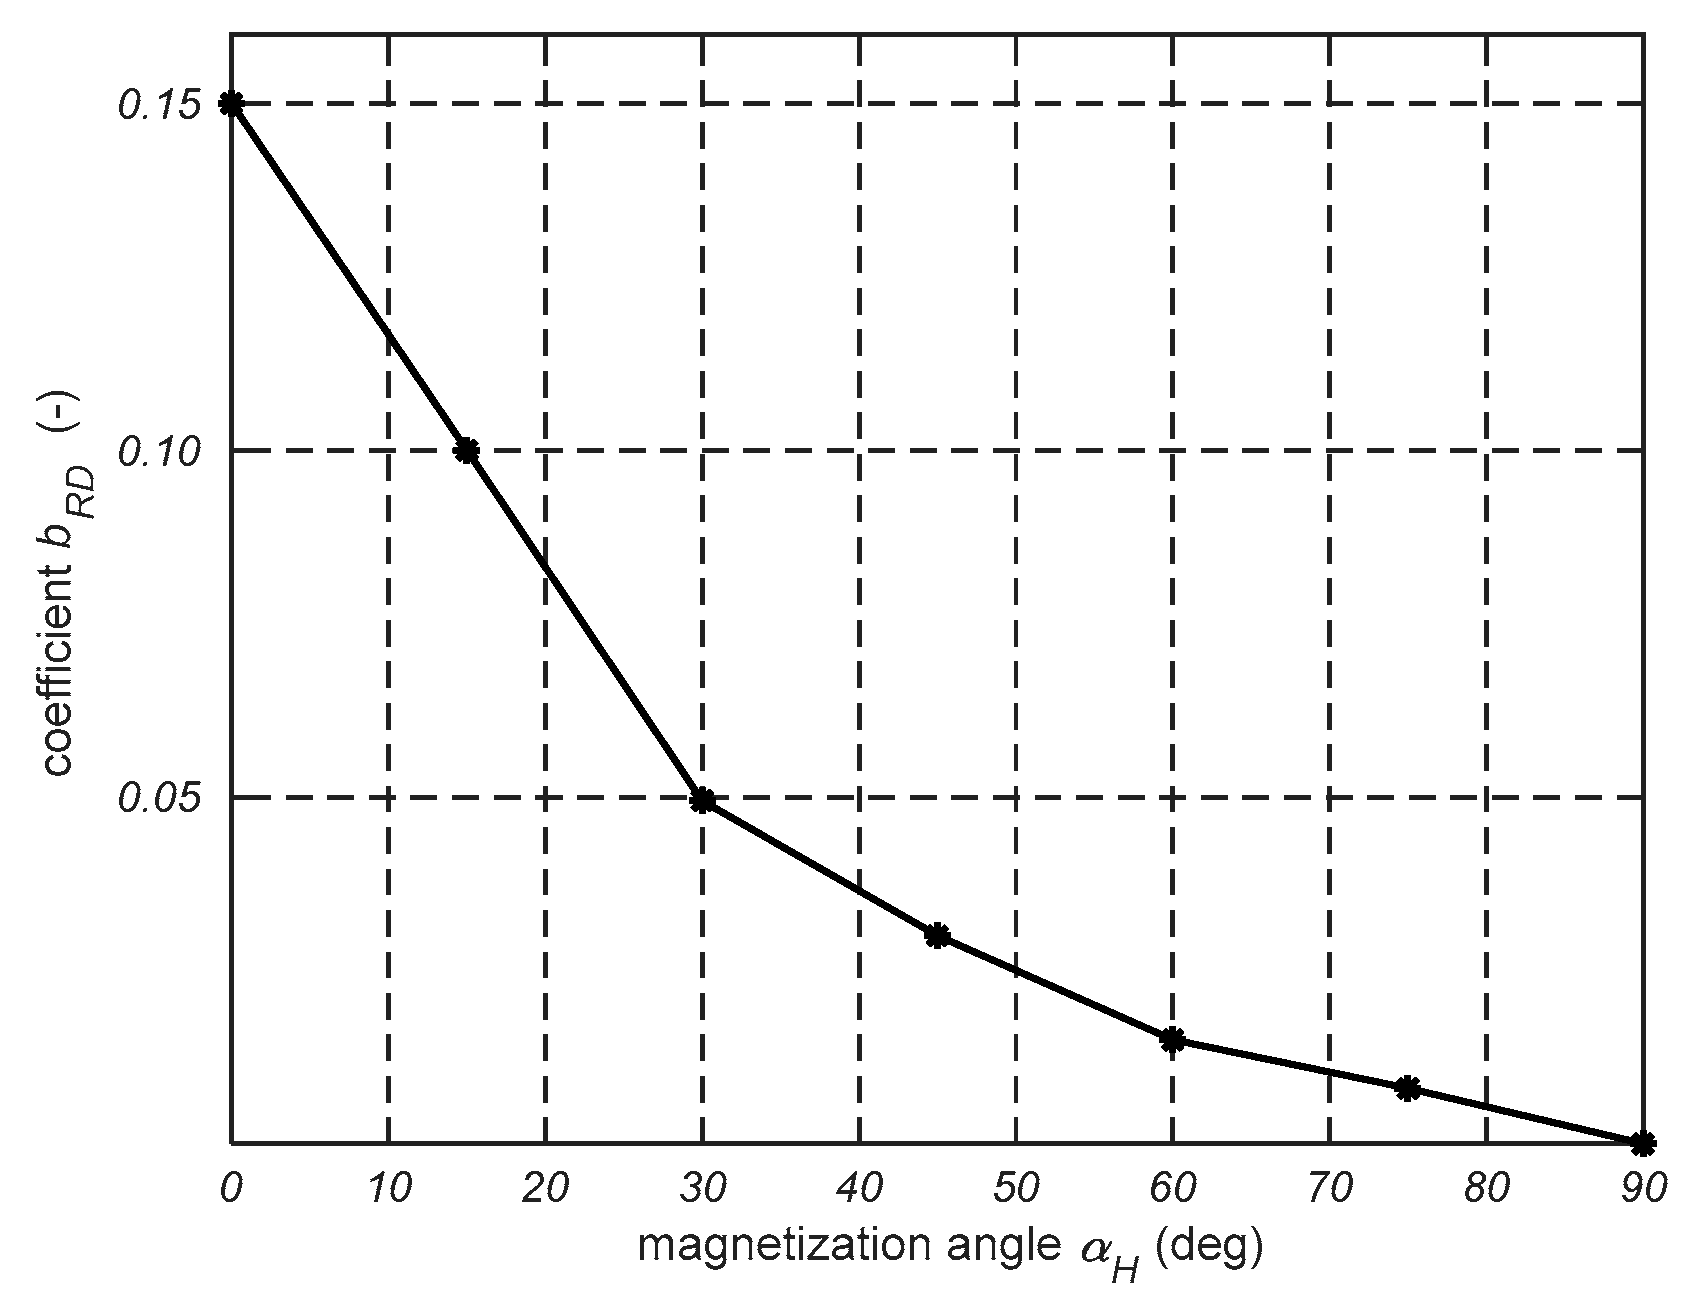
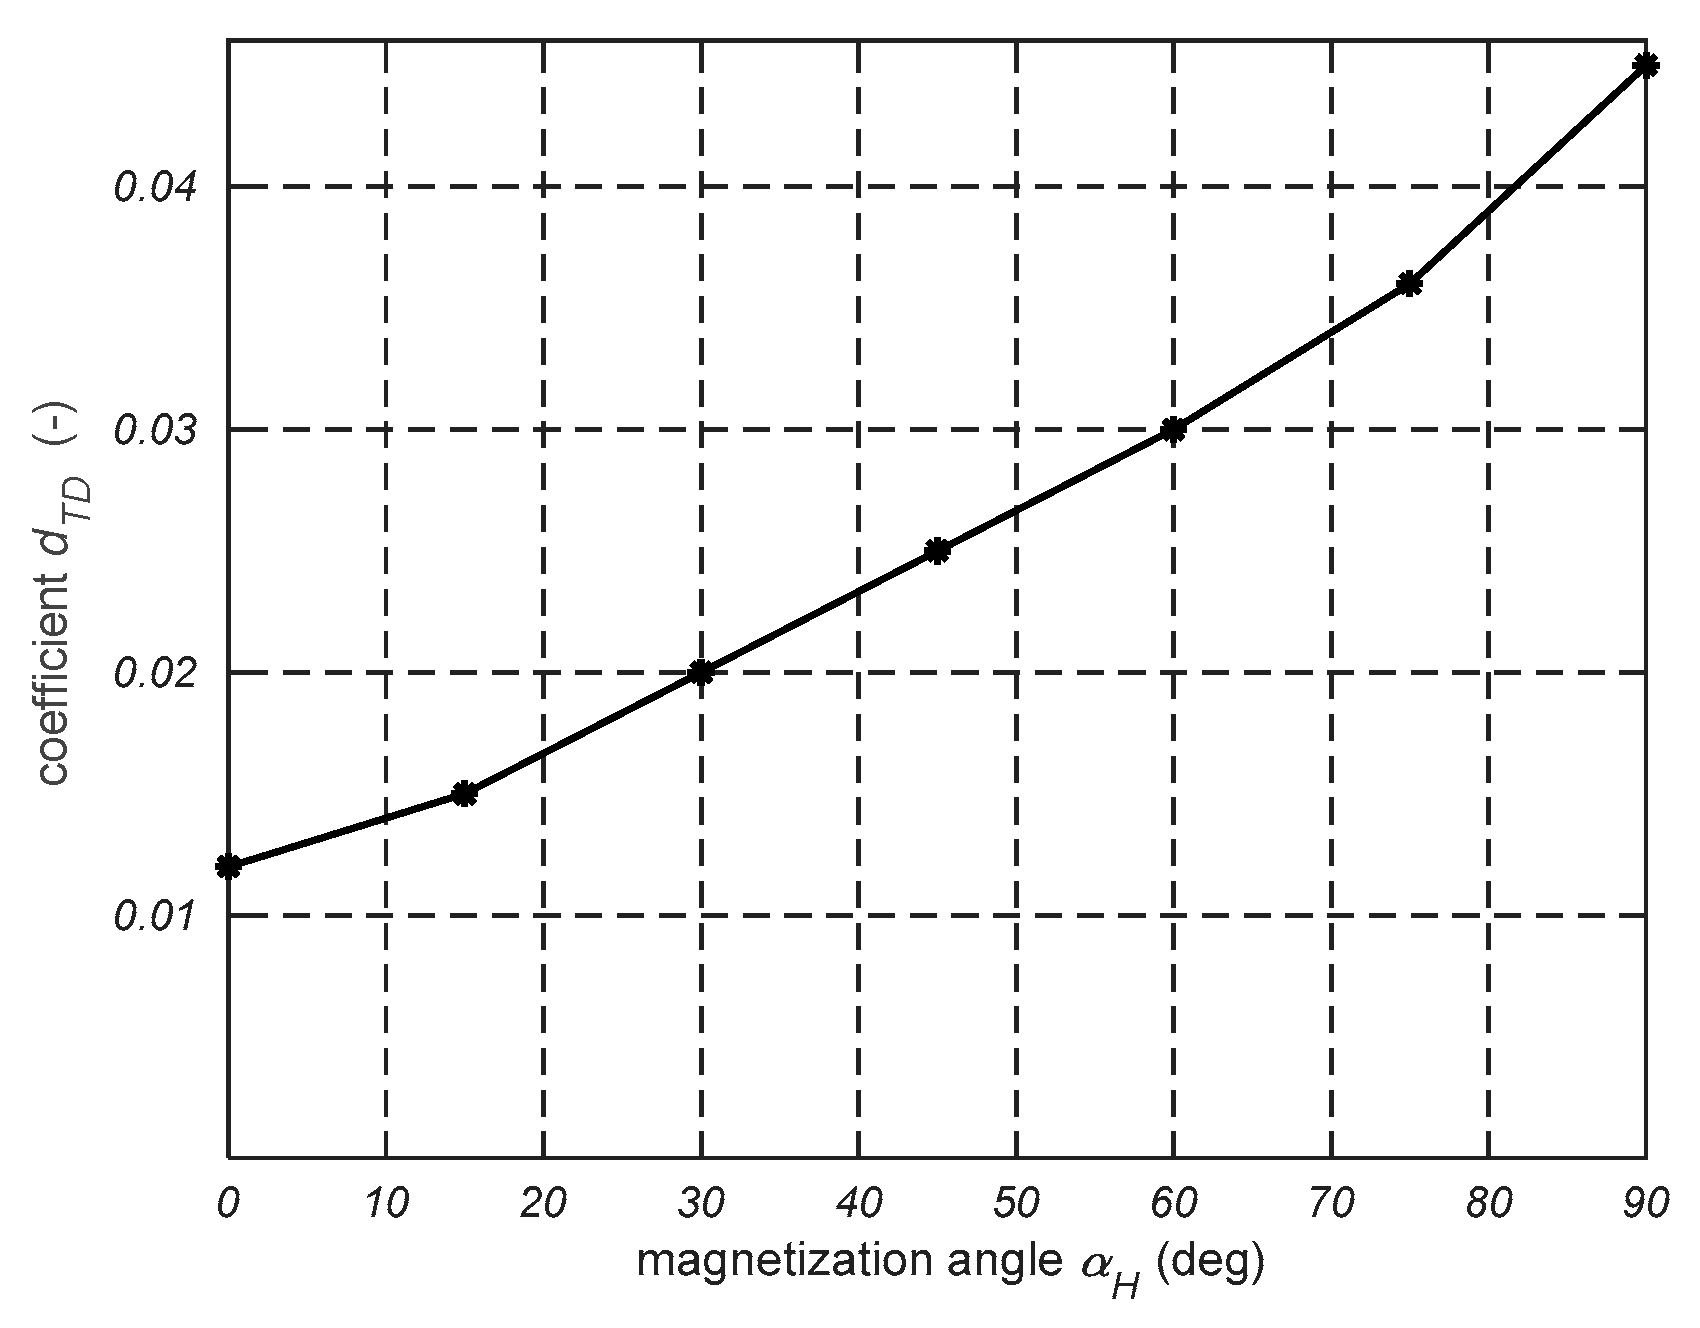
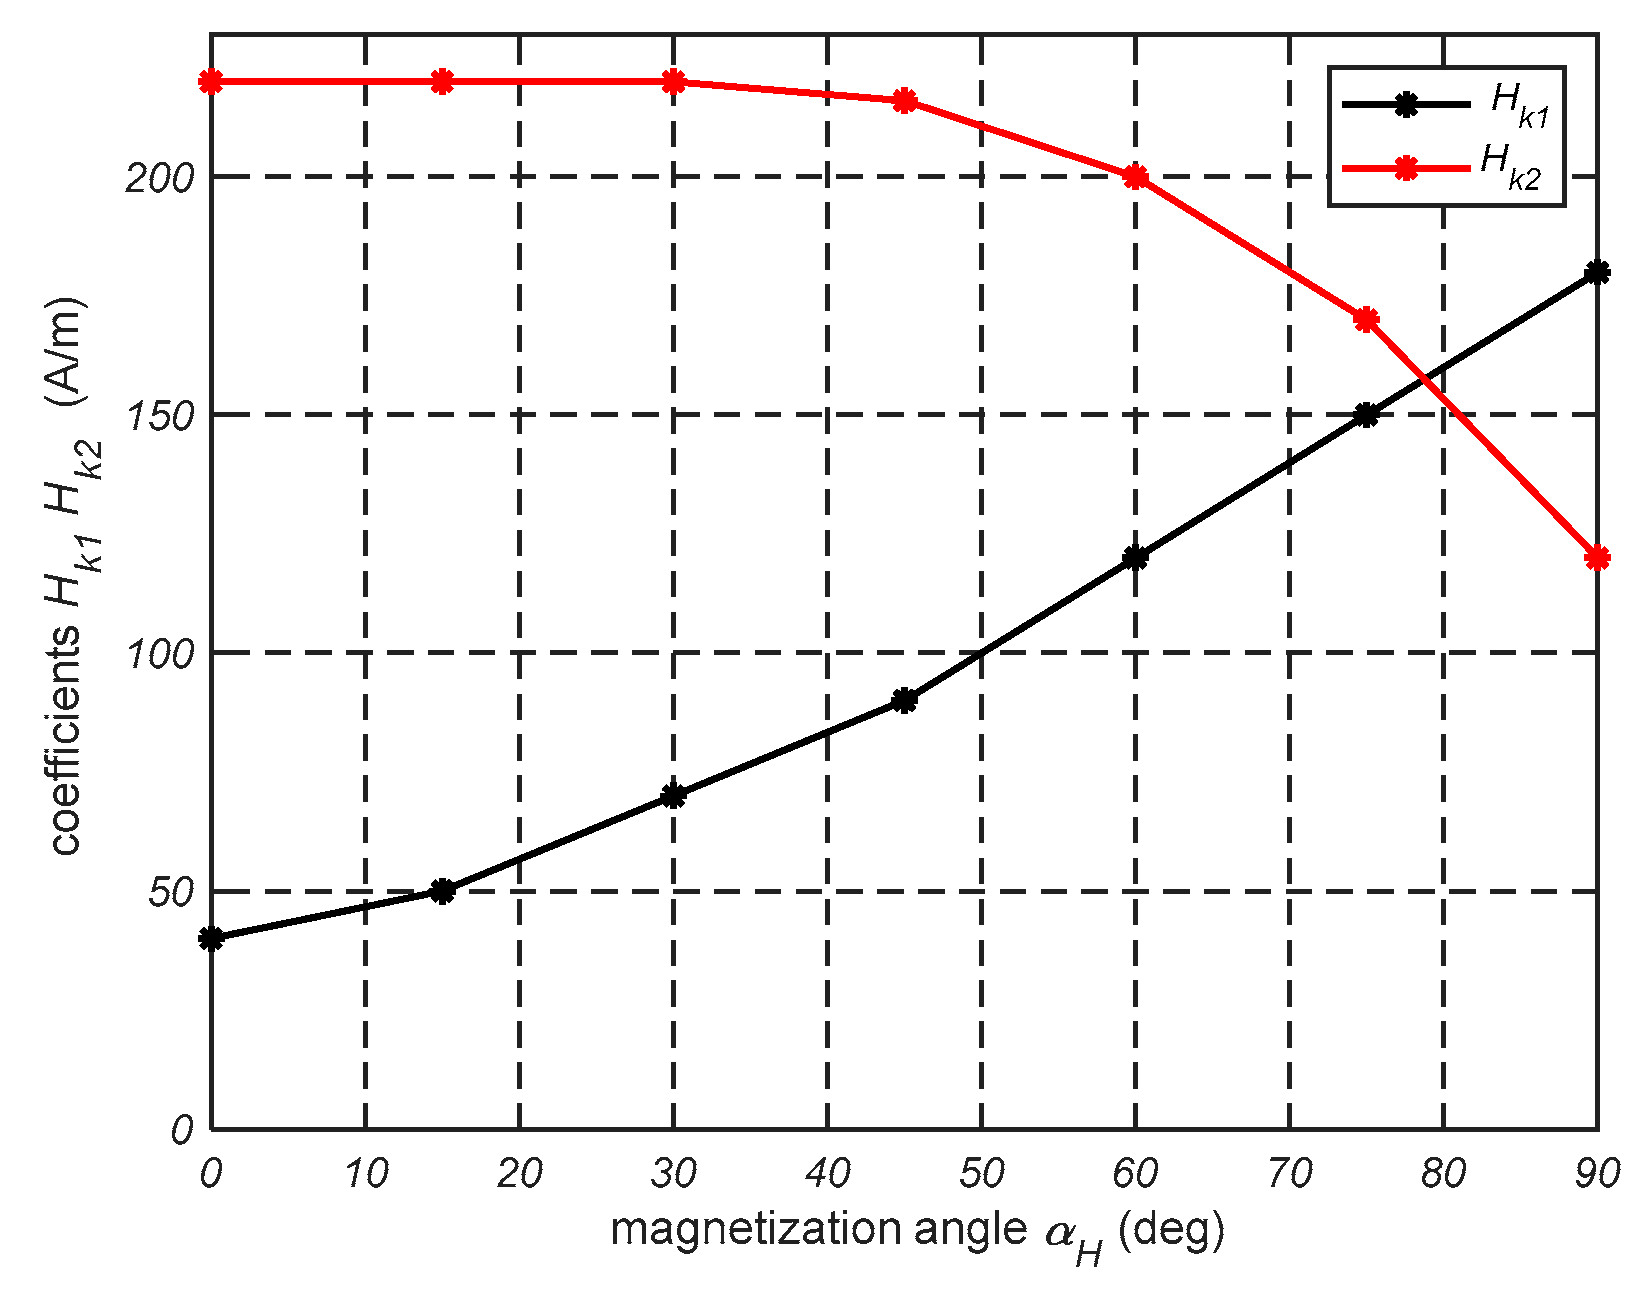
bRD,
wTD,
dTD, and
Hk were determined using the least-squares method to minimize differences between the measured and calculated hysteresis loop. Their dependence on the magnetization angle is shown in
Figure 11,
Figure 12,
Figure 13 and
Figure 14.
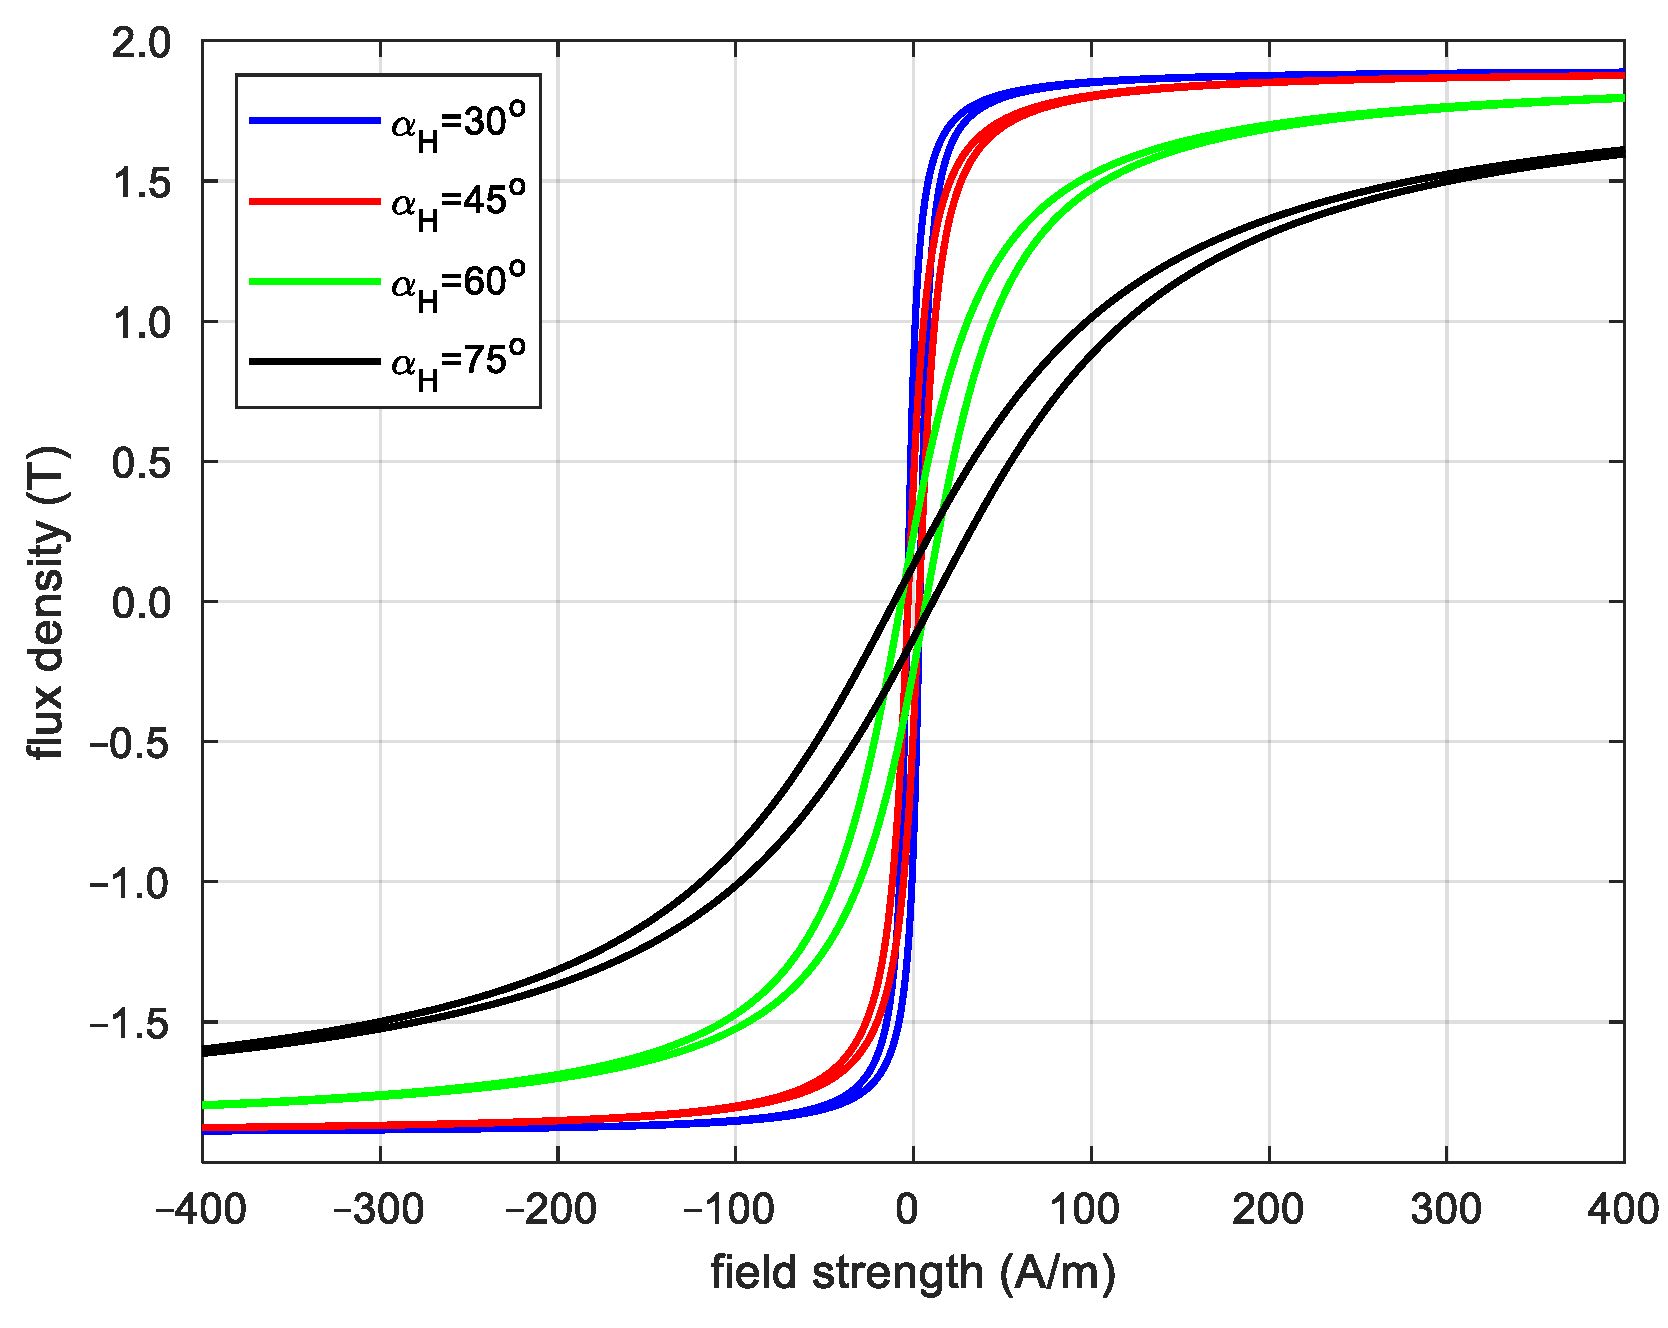
Determining the dependence of the aforementioned coefficients on the magnetization angle makes it possible for one to calculate the hysteresis loops along the RD and TD for any magnetization angle and magnetic field strength. If the hysteresis loops are not measured for a specified magnetization direction, then the values of these parameters are determined by approximating the values determined based on measurements.
Figure 15 and
Figure 16 show the hysteresis loops for four magnetization angles.
These considerations pertain to the determination of the limiting hysteresis loops, which should be determined to calculate the minor hysteresis loops.
The resultant flux density for a specified field strength value is the vector sum of the flux densities along the RD and TD because the value of the resultant flux density should be considered when calculating the changes in the magnetic field.
5. Comparison between Measured and Calculated Hysteresis Loops
For a specified field strength and magnetization direction, the flux density values are determined along the RD and TD. As mentioned previously, the resultant flux density is the vector sum of the flux densities along both directions. However, the magnetic flux density must not exceed the saturation flux density
Bsat. This implies that the algebraic sum (not the vector sum) of
BRDb and
BTDb cannot exceed
Bsat if the field strength
Hα increases:
Here,
BTDb is the perpendicular projection of the resultant flux density (for increasing field strength
Hα) along the easy magnetization axes inclined to the sheet plane at an angle of 45° (
Figure 7).
A similar condition applies to the flux densities
BRdu and
BTdu if the field strength
Hα decreases:
The flux density BTdu for decreasing field strength Hα is defined similarly to BTDb.
As previously mentioned, magnetization occurs mainly along the three easy magnetization axes but to different degrees depending on the field strength direction. Magnetic saturation occurs when all the flux density vectors of the elementary particles of the transformer sheet are parallel to the field strength direction. Assuming that the flux density vectors do not rotate at a certain value of field strength in the considered range of field strength changes, the flux density vectors of all particles are parallel to the easy magnetization axes. Subsequently, the sum of the resultant flux densities along the individual easy magnetization axes is equal to Bsat.
If the algebraic sum of
BRDb and
BTDb exceeds
Bsat, then for increasing
Hα, the flux density
BTDb decreases when the magnetization angle is less than 54.7°:
Otherwise, the flux density
BRDb decreases and is equal to:
Similar dependences refer to the flux densities
BTdu and
BRdu:
The angle
αres (
Figure 8) between the RD and the direction of the resultant flux density is not constant; for increasing
Hα, it can be expressed as:
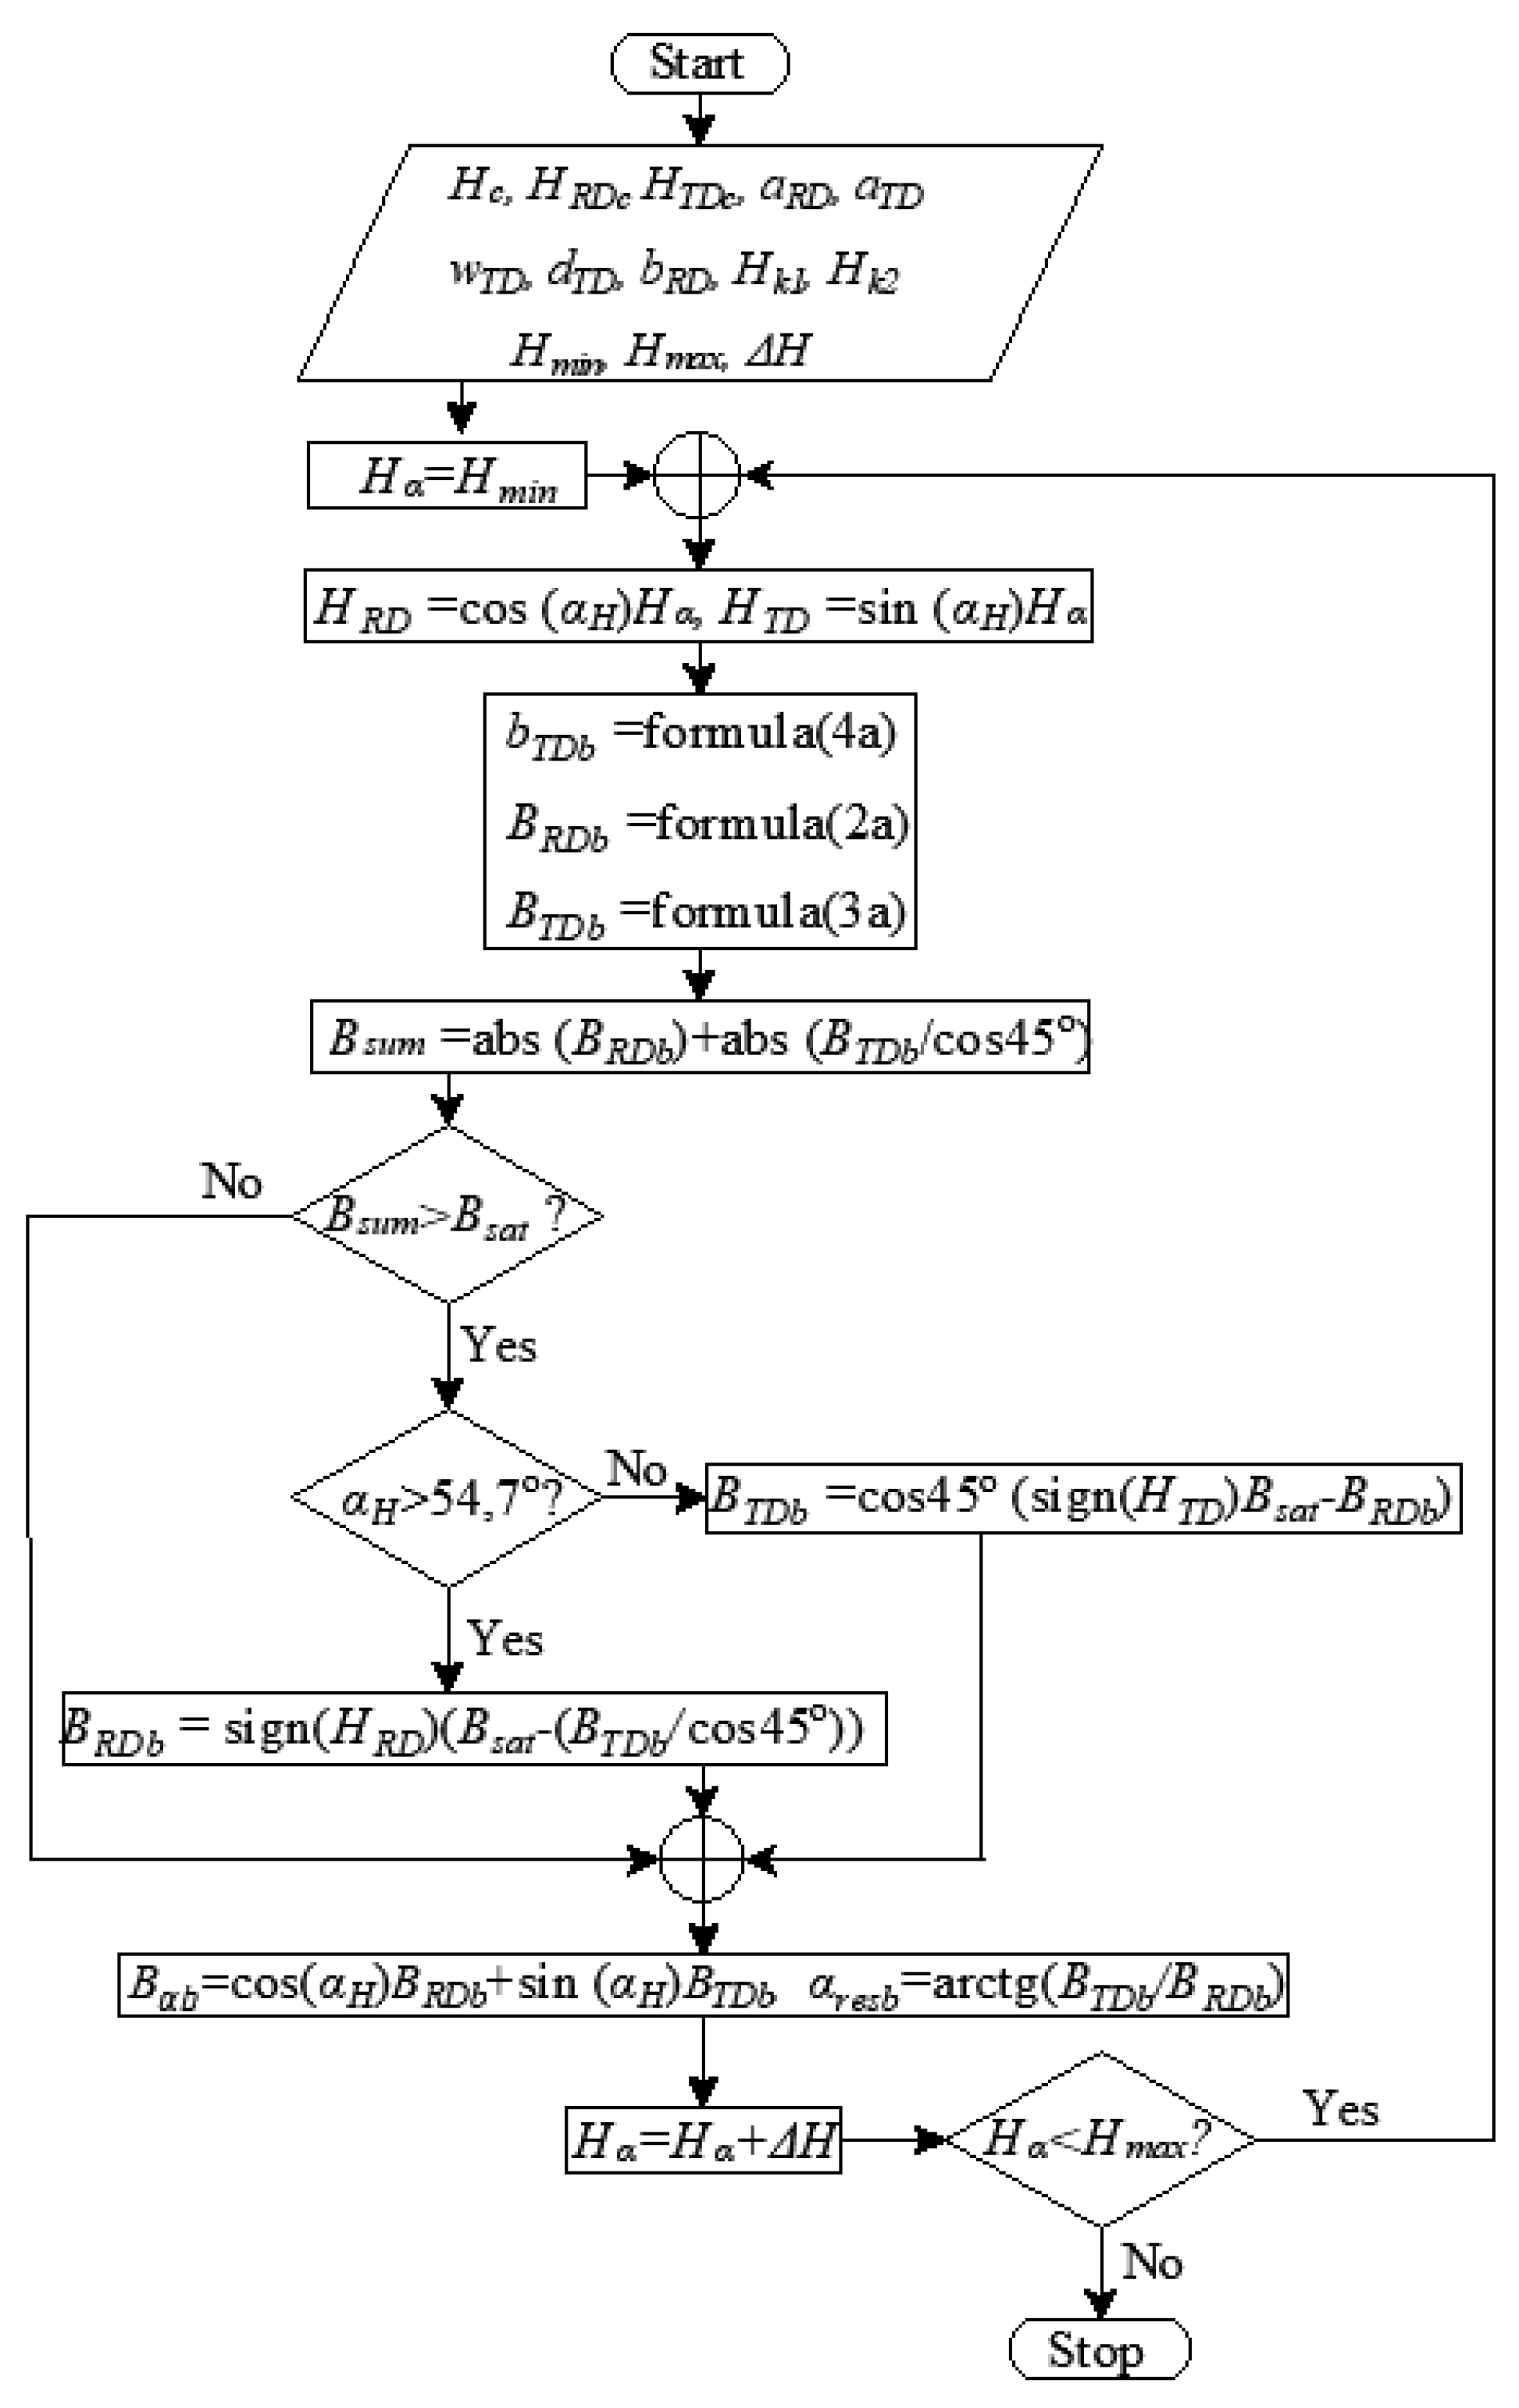
Figure 17 shows the flowchart for determining the flux density of the limiting hysteresis loop for any magnetization direction if the field strength increases. The similar form has the flowchart for decreasing field strength values.
To determine the flux density of the limiting hysteresis loop, the measured coercive force Hc and the saturation flux density Bsat are introduced into the algorithm. The values of the parameters occurring in Equations (2a,b) and (3a,b) are also determined. For subsequent values of the field strength Hα, the field strength values along the RD and TD are determined, and then the flux densities BRDb and BTDb (or BRdu and BTdu if Hα decreases) are calculated. In the next step, the saturation condition (5a) or (5b) is checked. If the sum of BRDb and BTDb (or BrDu and BtDu) is greater than Bsat, the value of either the flux density along TD or RD is modified depending on the magnetization direction. At the final step, it is possible to determine the flux density Bα along the magnetization direction, the position of the resultant flux density vector, and its value, which is the geometric sum of the flux densities along the RD and TD.
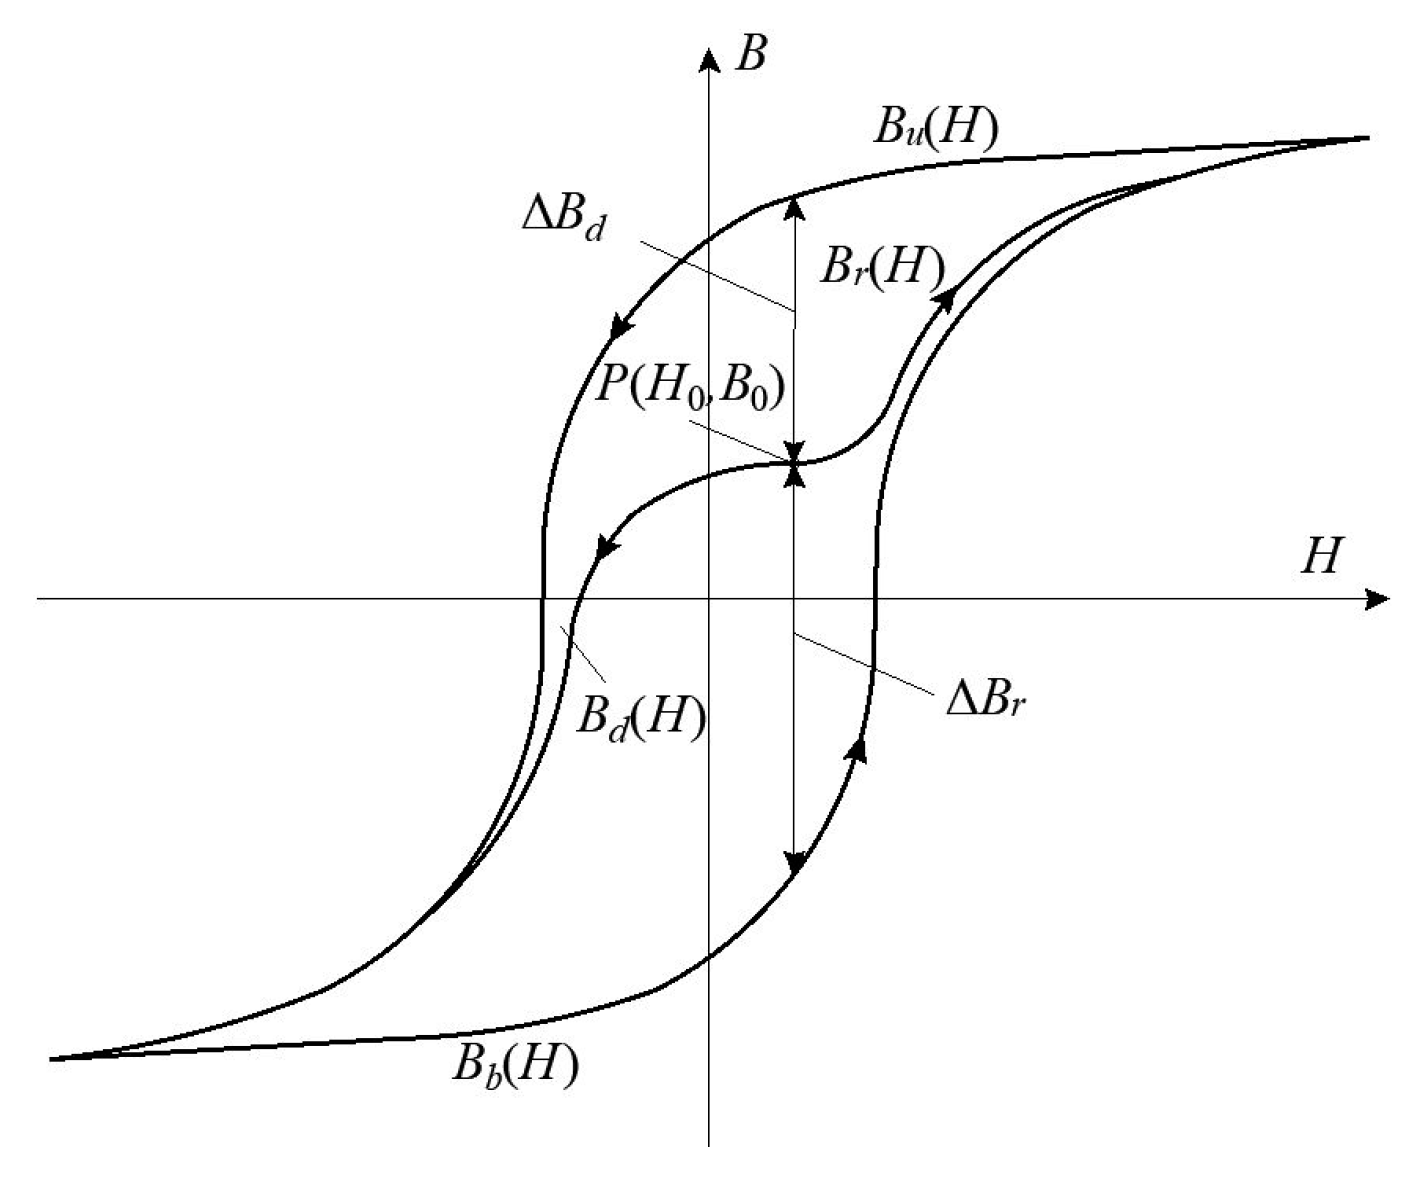
Determining the limiting hysteresis loops for a given magnetization direction makes it possible to calculate minor hysteresis loops (which are located inside limiting loop) for any changes in the field strength. As it was widely described in [
28], the changes in the flux density
Br(
H) of any point
P(
H0,
B0) (
Figure 18) can be described as follows if the field strength
H increases:
where
kBr(
H) is an attenuation coefficient when
H increases.
If
H decreases, the changes in the flux density
Bd(
H) can be written as:
where
kBd(
H) is an attenuation coefficient when
H decreases.
Figure 19 and
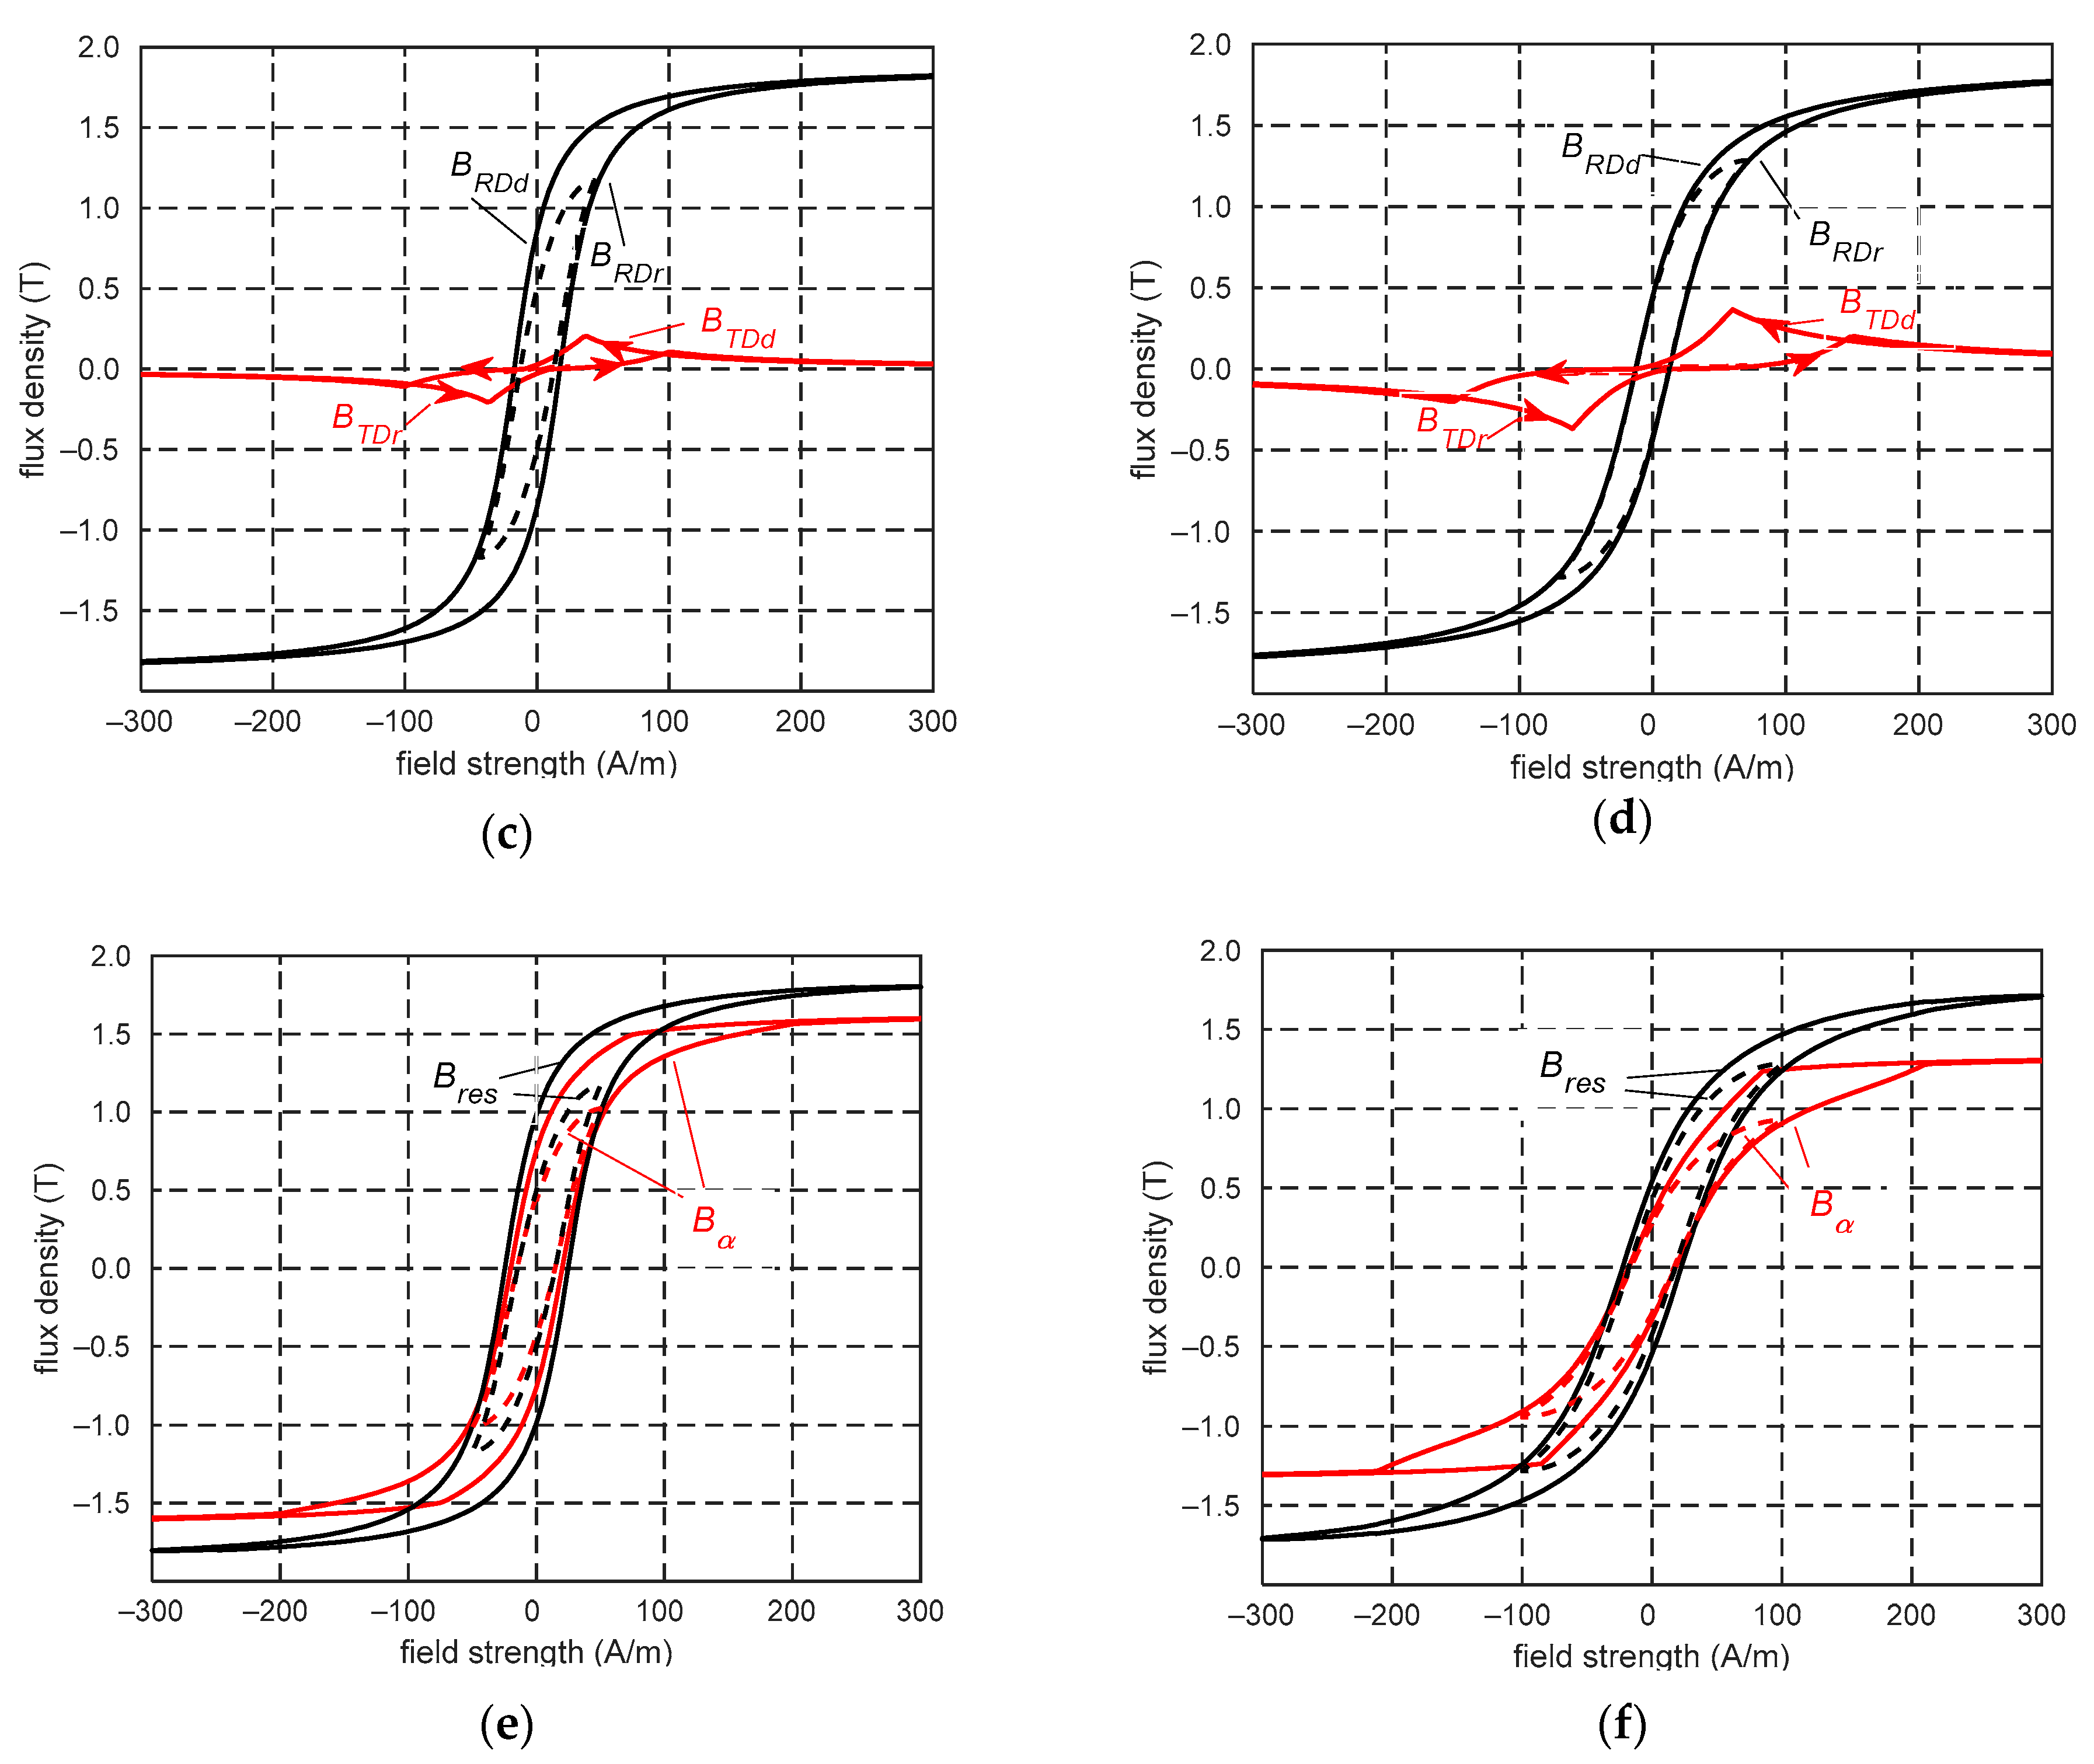
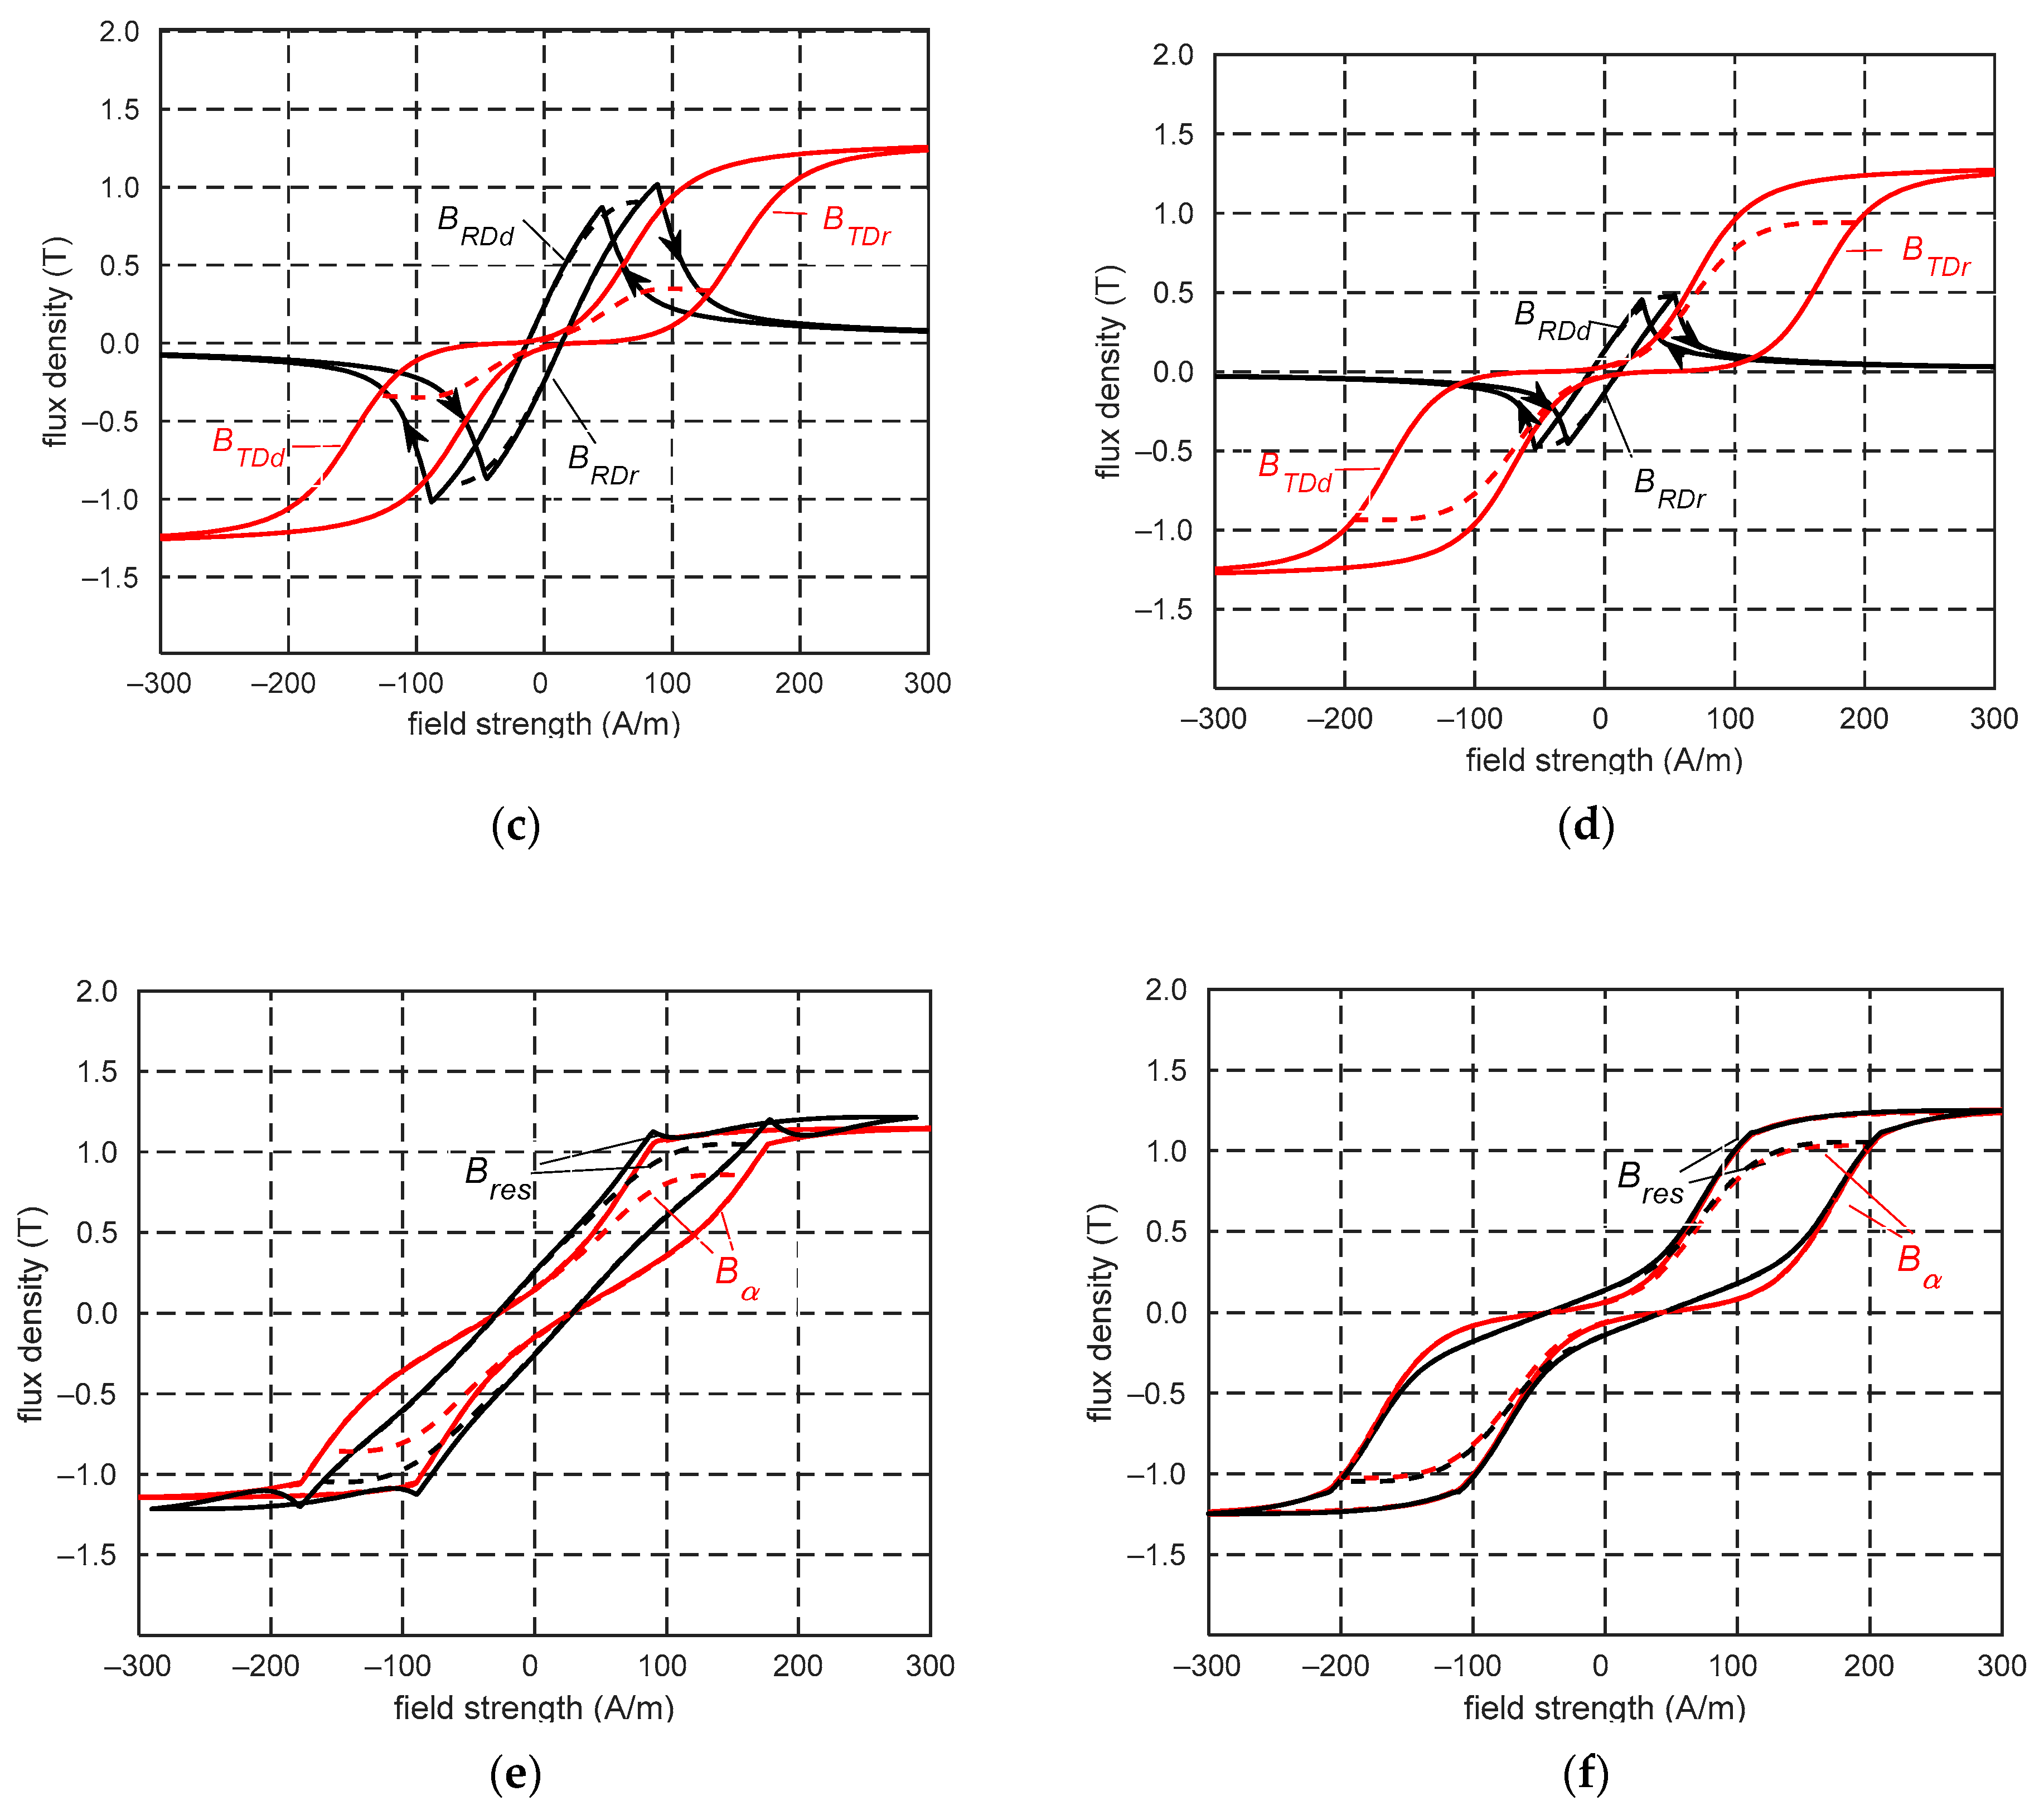
Figure 20 show the limiting and minor hysteresis loops for the four magnetization angles. In these figures, (a, b) show the measured and calculated hysteresis loops for individual magnetization angles, (c, d) show the appropriate changes in the flux density along the RD and TD, and (e, f) show the calculated hysteresis loops and the loops showing changes in the resultant flux density for a specified magnetization direction. Under a magnetization angle of 30° and a field strength of approximately 200 A/m (
HRD = 173 A/m,
HTD = 100 A/m), the sum of flux densities
BRD and
BTD/cos45° was equal to
Bsat. Changes in the flux density
BRD were predominant, and the flux density
BRD increased to
Bsat, and
BTD decreased to zero. The magnetization process has a similar character at an angle of 45°. For the field strength of approximately 212 A/m (
HRD = 150 A/m,
HTD = 150 A/m), the sum of
BRD and
BTD/cos45° was equal to
Bsat, and
BRD also increases to
Bsat. Unlike the previous angles, at a magnetization angle of 60°,
BRD decreased to zero and
BTD increased to
Bsat when the field strength exceeded 101 A/m (
HRD = 51 A/m,
HTD = 88 A/m). In this case, changes in
BTD significantly affected the magnetization process. The flux densities
BRD and
BTD change similarly at a magnetization angle of 75°. When the field strength exceeded 204 A/m (
HRD = 53 A/m,
HT D = 198 A/m),
BRD starts to decrease to zero.
The hysteresis loops of the resultant flux densities differed from those calculated and measured along the magnetization angles (
Figure 19e,f and
Figure 20e,f). This implies that the magnetization process in the transformer steel sheets cannot be regarded as axial magnetization.
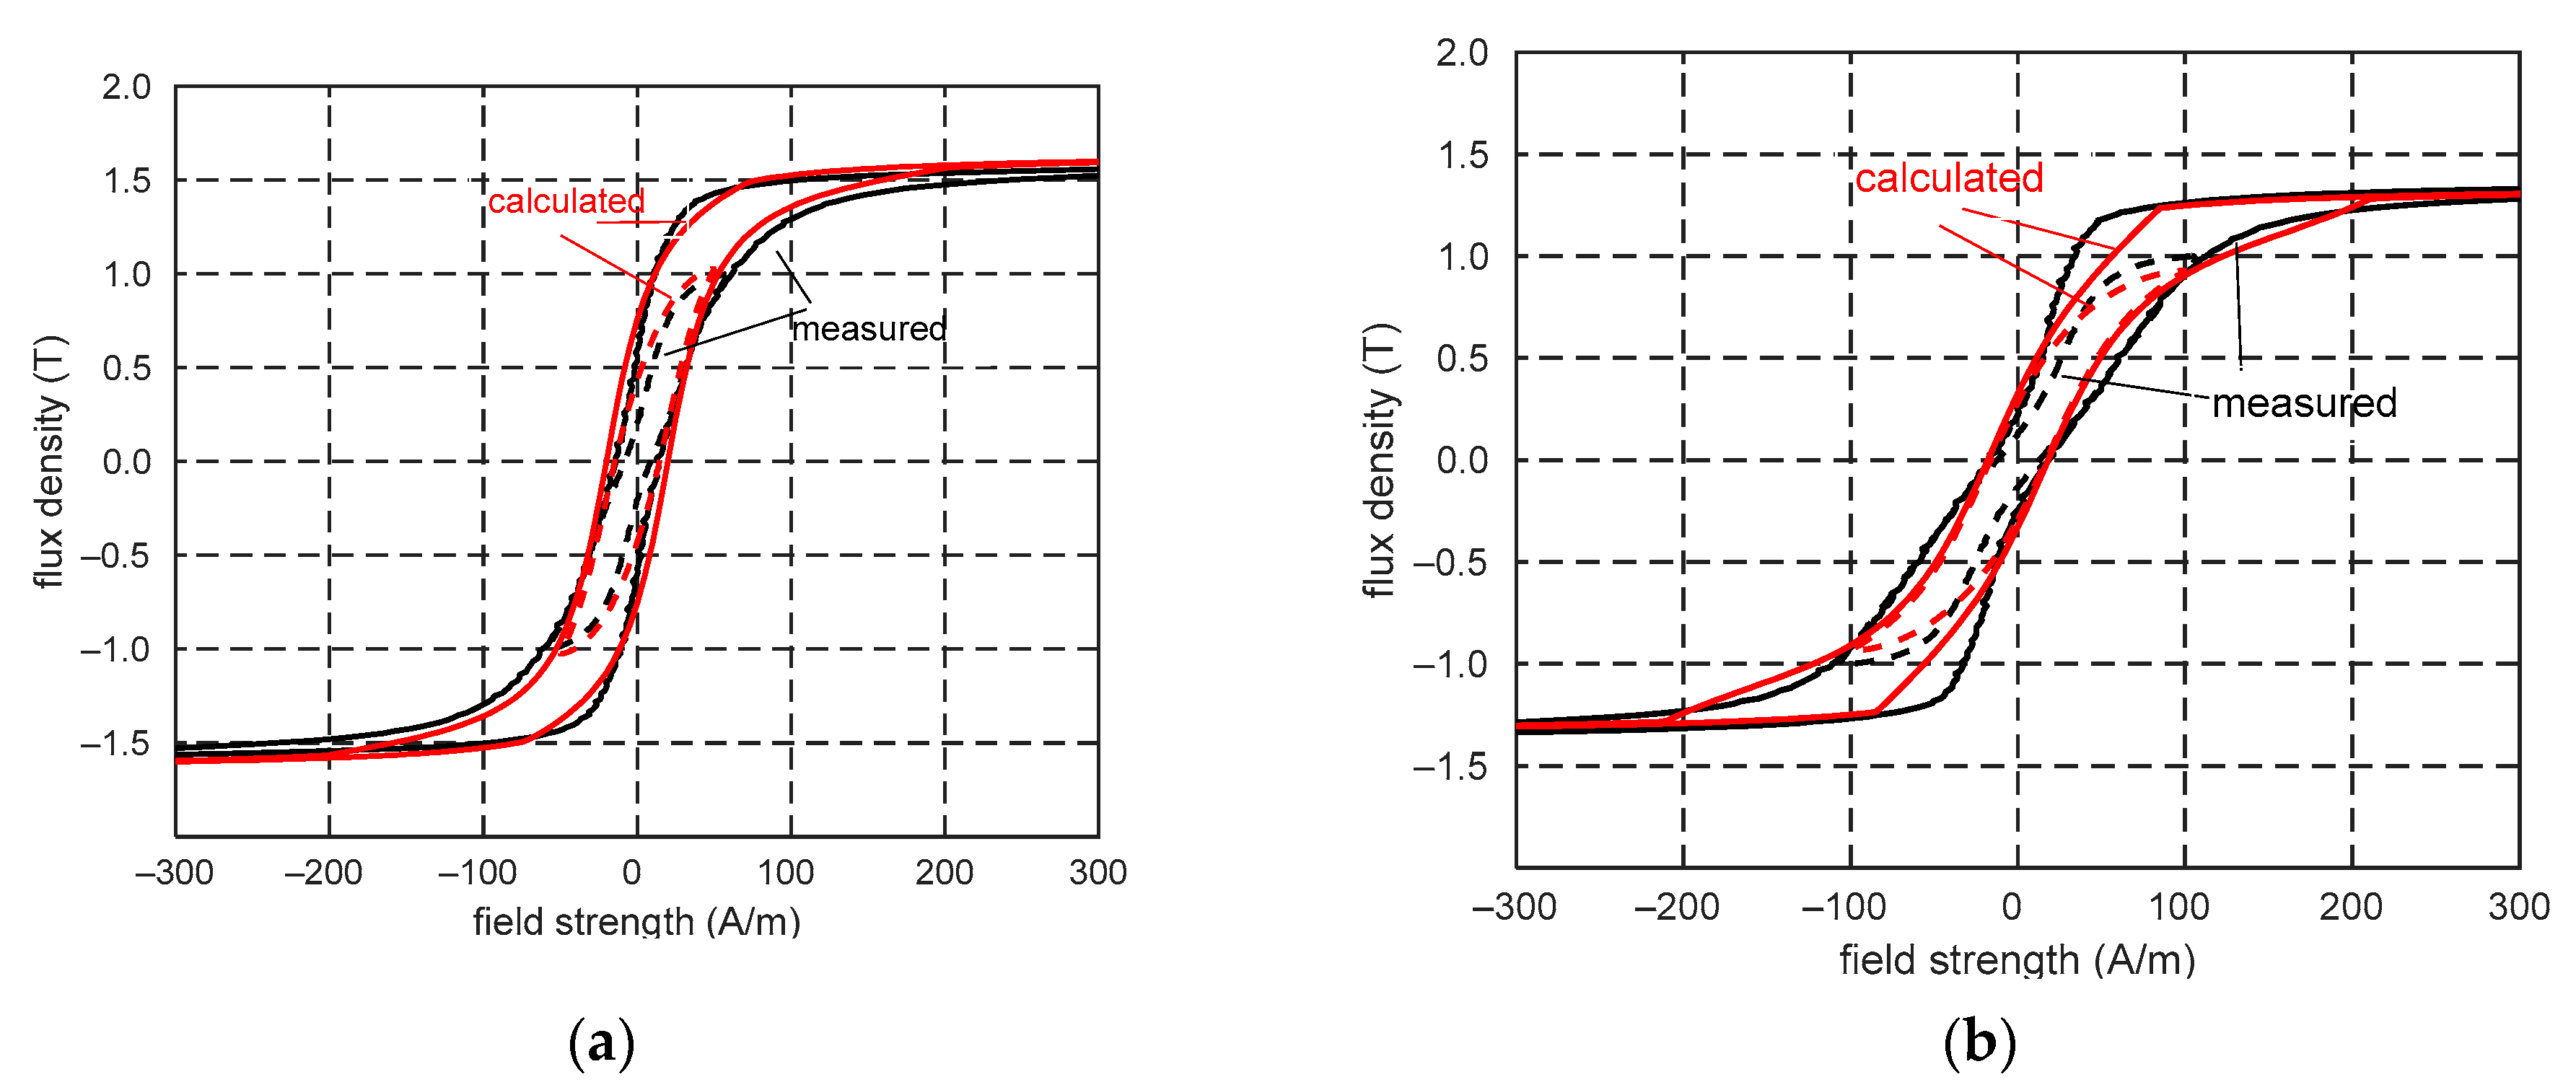
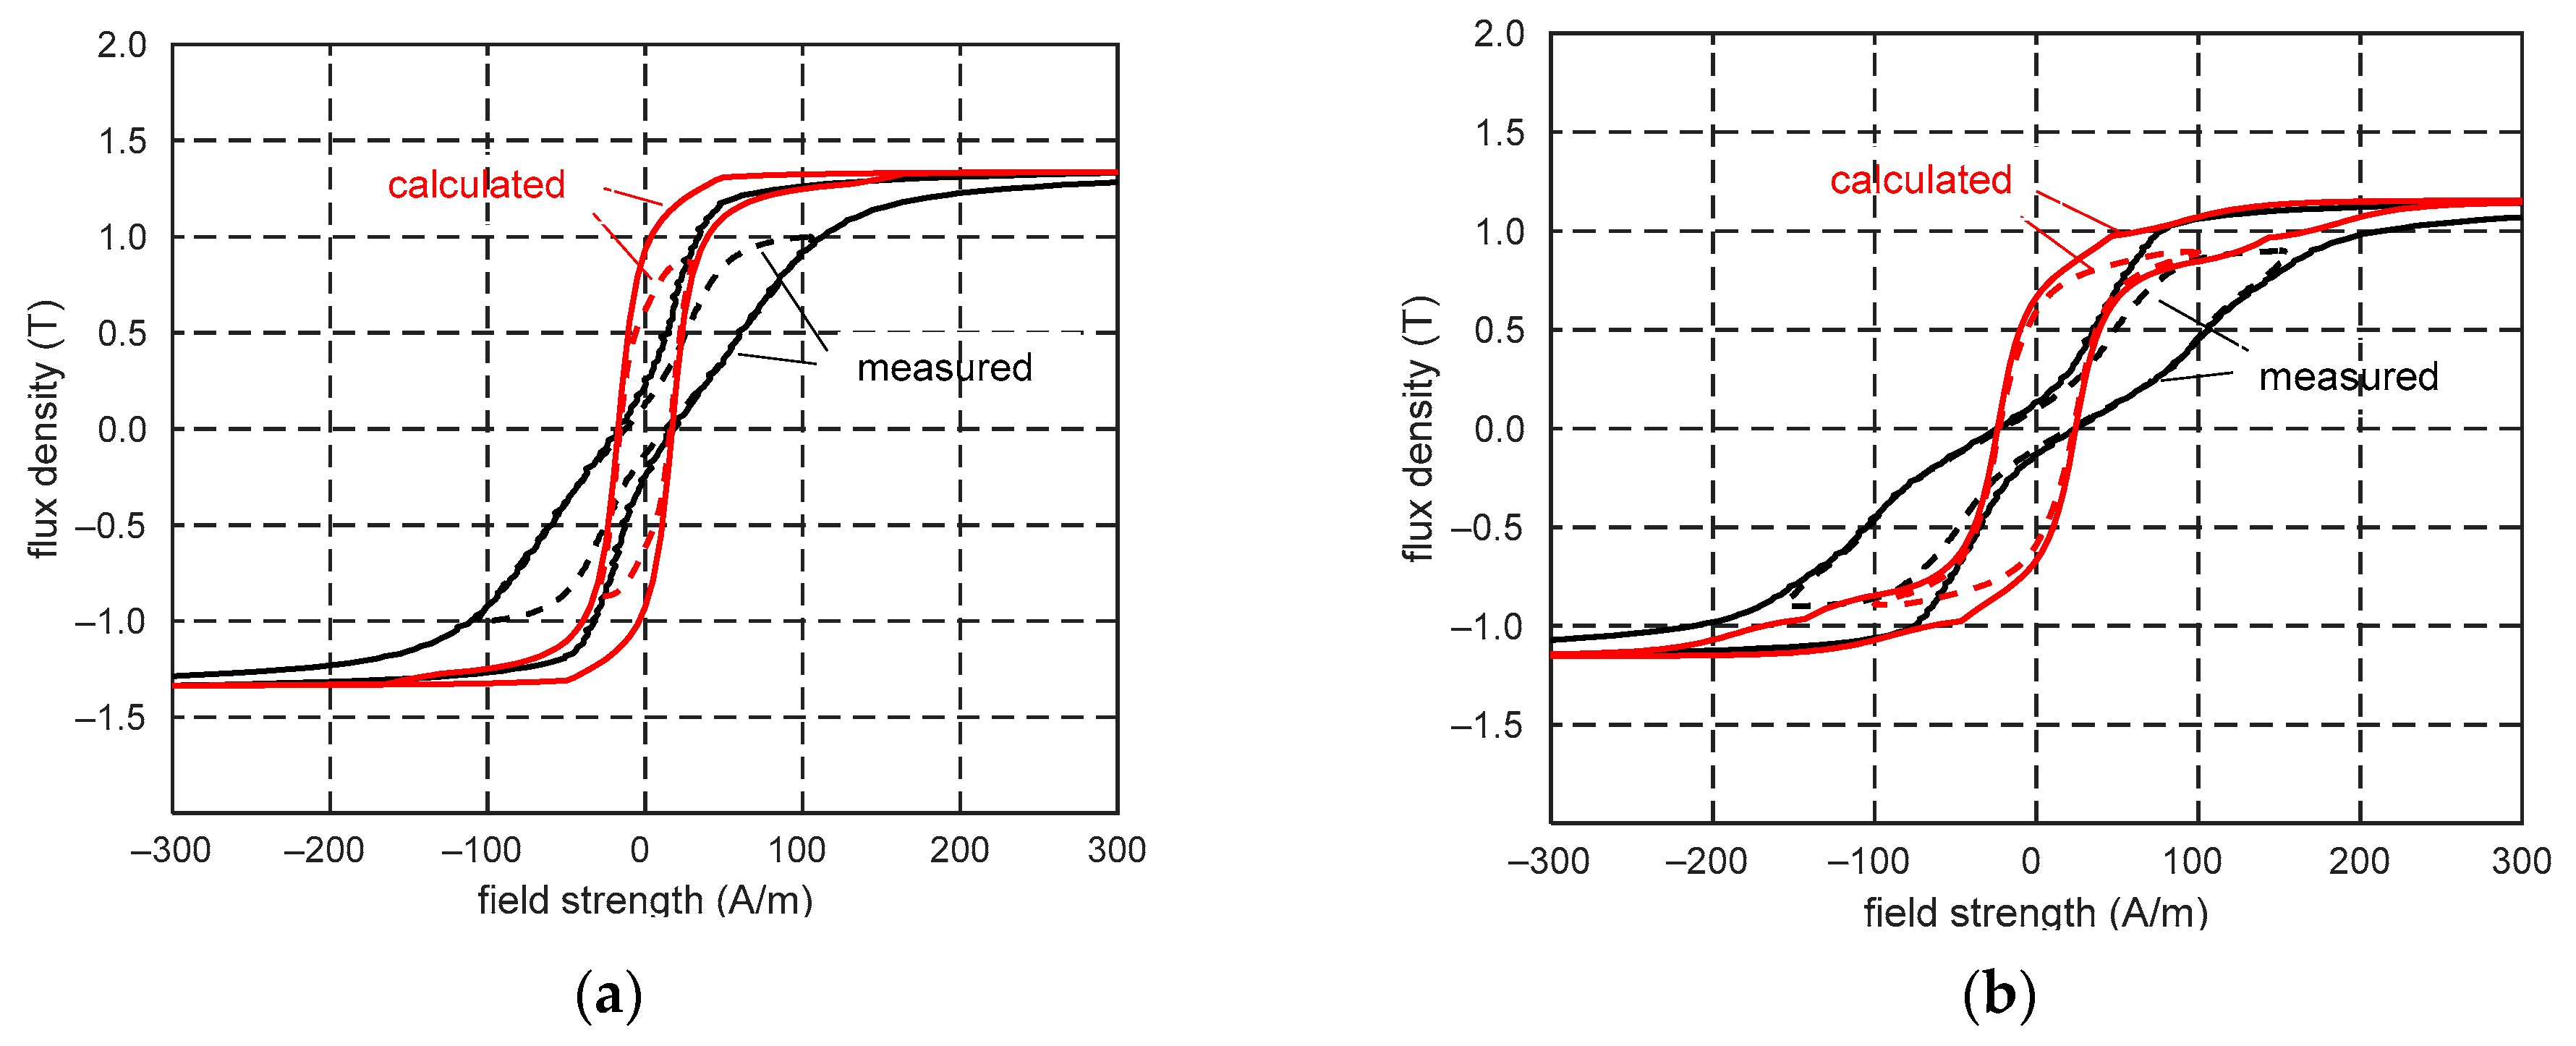
Note that the resultant flux density for a given field strength cannot be determined as the geometric sum of the flux densities determined using hysteresis loops (without their modification in relation to the magnetization direction) determined separately for both the rolling and transverse directions.
Figure 21 shows an example of the comparison of the limiting and minor hysteresis loops determined incorrectly with the measured hysteresis loops.
The described proposal for determining changes in the flux density in transformer steel sheets is intended to facilitate the introduction of the hysteresis model to the equations of the magnetic field distribution. This applies to the method of equivalent reluctance network method and especially to the significant modification of this method presented in [
17]. In the mentioned method, the field strength components and the corresponding flux density components are assigned to the edges of the grid dividing the magnetic field area, which are parallel to the rolling direction (RD) or transverse direction (TD).
6. Conclusions
Determining the changes in the flux density in the corners and T-joint areas of transformer cores is challenging because, at individual points of the transformer sheet plane, the directions of the magnetic strength and flux density are different. To eliminate the necessity to store the limiting and partial hysteresis loops for each magnetization direction, a method for determining changes in the flux density was proposed. Changes in the flux density for any value of the magnetic field strength were assumed to depend only on certain limiting hysteresis loops assigned separately to the RD and TD; these limiting hysteresis loops depended on the magnetization direction on the sheet plane. This approach makes it possible for one to determine the resultant flux density vector for any magnetization direction, as the geometric sum of the flux density along RD and TD.
The coefficients defining the limiting hysteresis loops for the individual magnetization directions were selected using the least-squares method such that the differences between the limiting hysteresis loops determined using the proposed approximation method and the measured hysteresis loops were minimal. The partial hysteresis loops, which were within the limiting hysteresis loop for a specified magnetization direction, were determined as described in [
28]; this was performed separately for the loops assigned to the RD and TD, where the resultant flux density value is the geometric sum of the flux densities in both directions. In each calculation step, the saturation condition should be verified because the algebraic sum of the flux densities in both directions cannot be greater than the saturated flux density.
The proposed method is not recommended for determining changes in the flux density in the transformer sheets when the field strength is relatively high because the resultant flux density vectors of the individual domains rotate toward the direction of the magnetic field. The method of determining the flux density for any magnetization direction based on changes in the RD and TD, which are mutually perpendicular, renders it relatively easy to incorporate magnetization in the equations of magnetic field distributions, particularly those based on the integral form of Maxwell’s equations. Then, the power losses in transformer steel sheets, especially in corners and T-joint points, can be directly determined using the general formula presented at the beginning of
Section 3.
