Article

Optimal Configuration of Hybrid Energy Storage Capacity in a Grid-Connected Microgrid Considering Laddering Carbon Trading and Demand Response

1
Power China Huadong Engineering Corporation Limited, Hangzhou 311122, China
2
College of Electrical Engineering, Zhejiang University, Hangzhou 310058, China
*
Author to whom correspondence should be addressed.
Energies 2024, 17(1), 139; https://doi.org/10.3390/en17010139
Submission received: 26 November 2023 / Revised: 18 December 2023 / Accepted: 21 December 2023 / Published: 26 December 2023
(This article belongs to the Section A1: Smart Grids and Microgrids)

Abstract

:
In order to enhance the carbon emission reduction capability and economy of the microgrid, a capacity optimization configuration method considering laddered carbon trading and demand response is proposed for a grid-connected microgrid consisting of photovoltaic, battery and hydrogen storage devices. Combined with the mathematical model and system structure of each unit in the microgrid, the integrated operation control strategy is determined in this paper. A demand response model containing three load types is developed to reduce the stress on the storage and generation side. A carbon-trading mechanism is introduced into the operating costs to establish a configuration model with annual overall profit and power supply reliability as the optimization objectives. The non-dominated sorting genetic algorithm II is used to optimize the capacity of each unit, and the effectiveness of this model is verified by taking a microgrid in a region in Northwest China as an example to analyze the impacts of ladder carbon trading and demand response on the configuration results and system operation.

1. Introduction

With the proposal of “carbon neutrality and carbon peak”, renewable energy technologies have been intensively developed in recent years, and a large number of distributed energy sources such as photovoltaic (PV) and wind power have been connected to the utility grid, gradually realizing the low-carbon and green transformation of energy. However, renewable energy sources have problems such as intermittency [1], which poses challenges to the stable power supply of loads and the safe operation of utility grids. Consequently, the concept of microgrids has been proposed, which utilize energy storage technology to achieve better renewable energy consumption [2] and to coordinate energy interactions with utility grids.
The capacity configuration is an important part of the design and planning of microgrids, and reasonable capacity configuration can better utilize the local resources and achieve the design objectives such as economy [3]. A capacity optimization configuration model based on the Levy–Harmony algorithm is proposed for multi-objective optimization of reliability, economy and pollution for islanded microgrids [4], and the results show that this algorithm can find the optimal configuration solution faster. The hybrid system is composed of wind power, PV, battery (BAT) and load, and the capacity of each unit is optimized by the Neuro-Fuzzy method, achieving low cost and low excess energy [5]. However, the microgrids in the above literature all use BATs as the energy storage unit, and the impact of hybrid storage systems on the optimization of the configuration has not been investigated.
With the development of hydrogen energy storage technology, hydrogen energy has been introduced into microgrids because of its advantages of being clean and efficient and being able to be stored in large capacity across seasons [6], combined with batteries to improve the comprehensive capacity of microgrids through hybrid electric–hydrogen energy storage. For hydrogen-based multi-microgrid systems, a two-layer multi-objective capacity optimization configuration model is proposed, with the inner layer aimed at minimizing the operating cost and the outer layer aimed at minimizing the total cost and carbon emission as well as maximizing the self-sufficiency rate [7].
In addition to economy and power supply reliability, the environmental benefits of microgrids are also very important. In order to exploit the carbon reduction capability of microgrids, schemes such as carbon-trading mechanisms have been introduced into microgrids [8,9]. For the electric–hydrogen hybrid energy storage system, carbon-trading mechanism and time-of-use electricity price are introduced to establish a low-carbon economic capacity configuration model, and the result proves that it can improve the self-balancing ability and economic efficiency of the system [10]. All of the above literature seldom dealt with the demand-side management of microgrids but rather rely on the generation side to realize system operation and energy coordination. Currently, many applications of demand response in microgrids are mainly in optimized scheduling [11,12,13,14], while the optimal configuration of microgrids can also be achieved by guiding users to change their electricity consumption behavior through demand response. An equipment capacity optimization method considering the demand response was proposed to achieve cost reduction by controlling the load demand for responding to generation fluctuations [14]. For multi-energy microgrids, a low-carbon economic scheduling model considering demand response and multi-step carbon trading is proposed, and the results show that this model can reduce carbon emissions and operating costs [15]. The branch-and-bound algorithm is applied to optimize the number of phasor measurement units (PMUs) for power system observability, and the results show that this algorithm has better results in the convergence [16,17]. As for the microgrid capacity configuration problem, many studies have used particle swarm algorithms, genetic algorithms and their improved algorithms in order to achieve various types of design objectives in the planning stage of microgrids [18,19,20].
In this paper, a capacity optimization configuration model considering laddering carbon trading and demand response is proposed for a grid-connected PV-BAT-hydrogen microgrid. To begin, the mathematical model of each unit and the mathematical model of demand response are constructed, while the control method of the microgrid is proposed. The carbon-trading mechanism is introduced into the operating cost of the system, and a multi-objective capacity configuration method with the maximum annual comprehensive profit and the minimum load shortage rate as the optimization objectives is proposed to comprehensively optimize the economy and reliability of the microgrid. The non-dominated sorting genetic algorithm II (NSGA-II) is utilized to solve the optimal configuration results of the arithmetic example, and the effects of laddered carbon trading and demand response on the capacity configuration results are analyzed.

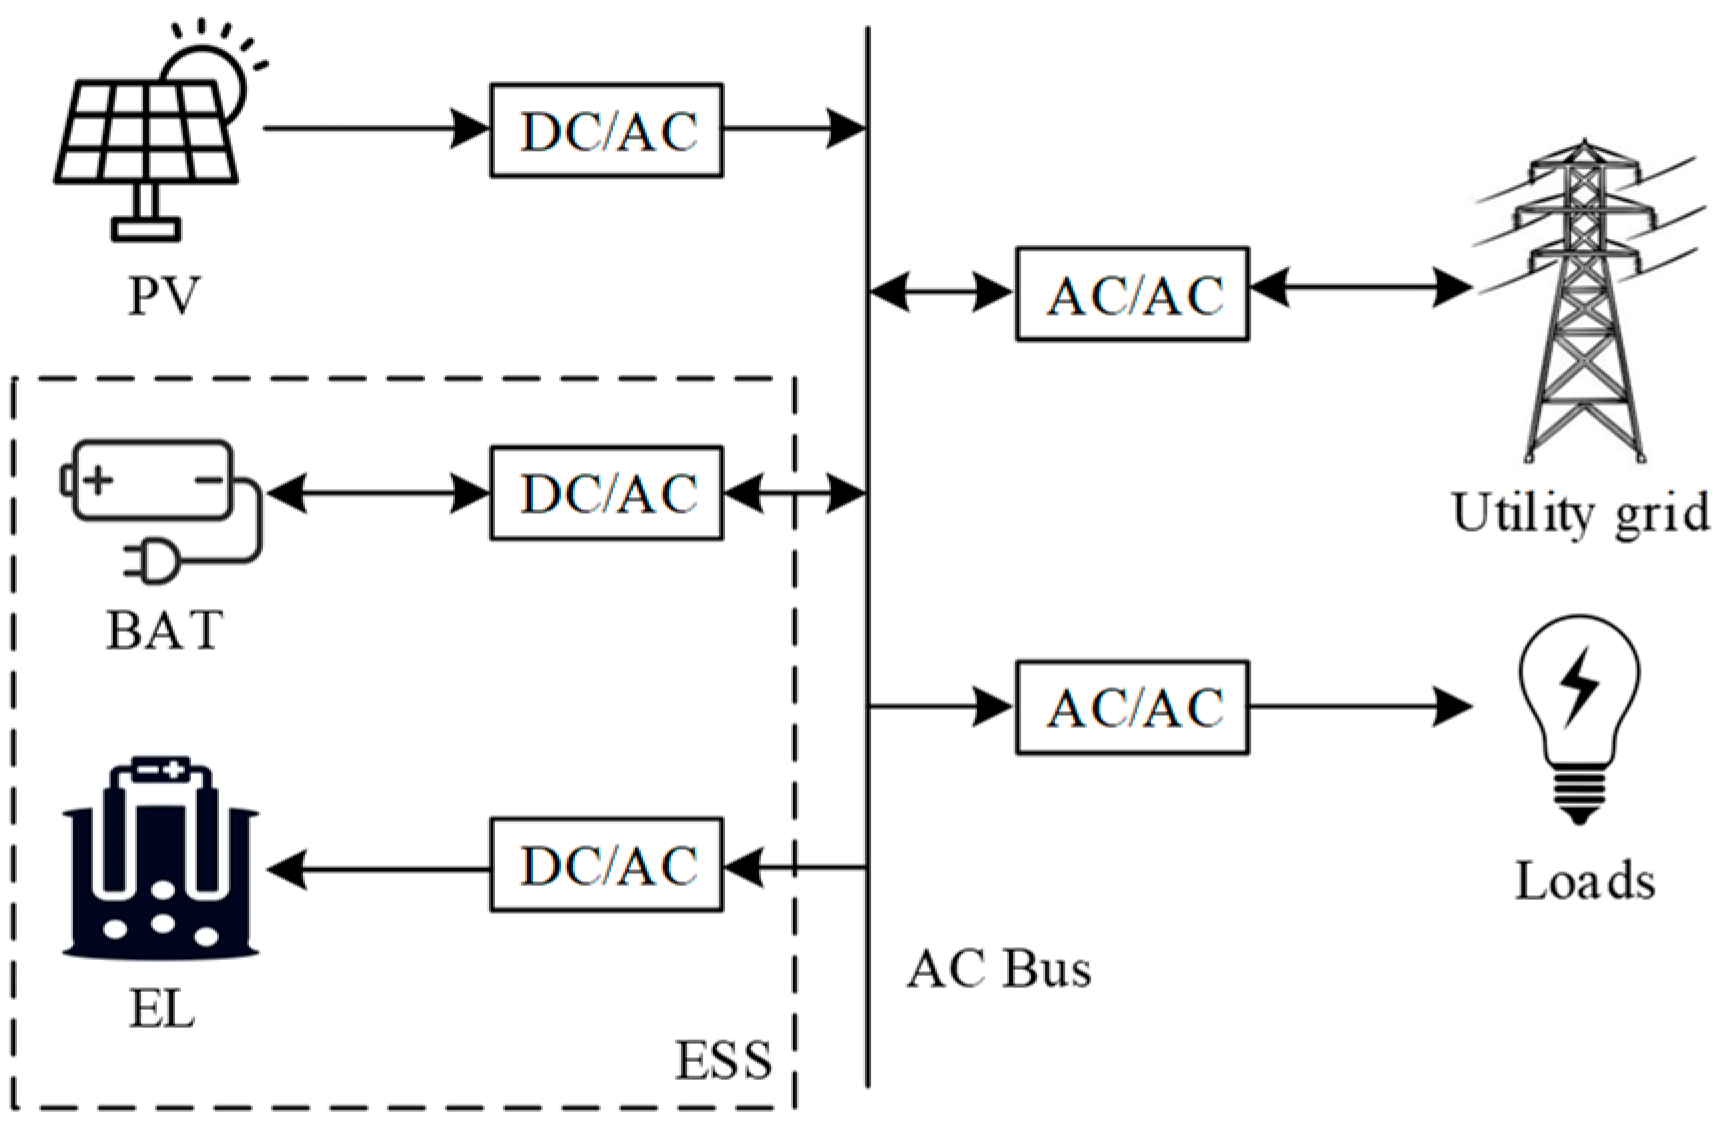
2. System Composition and Control

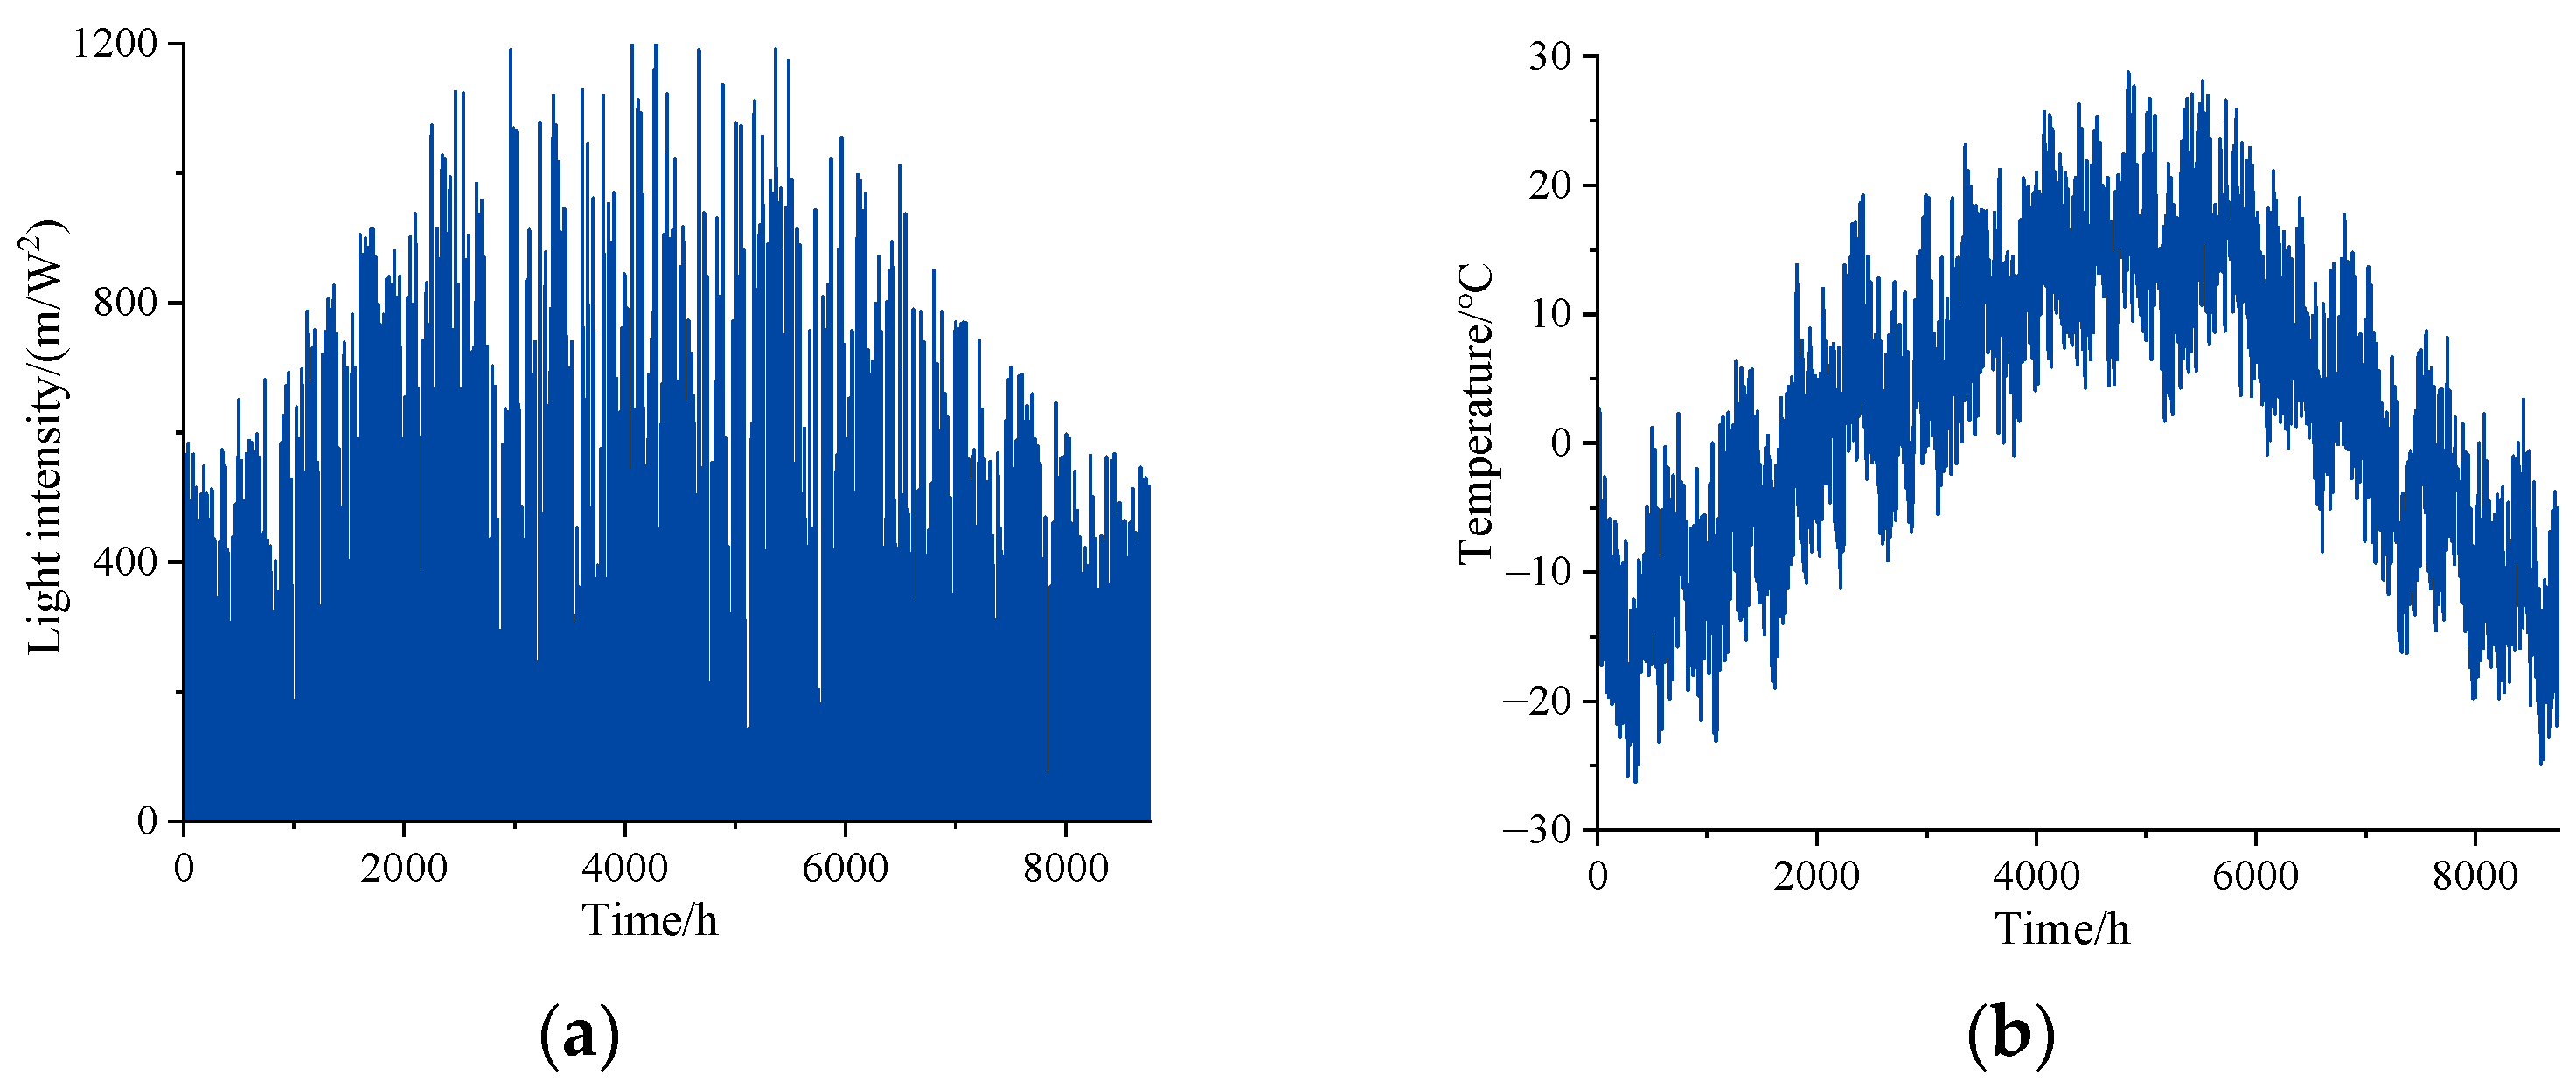
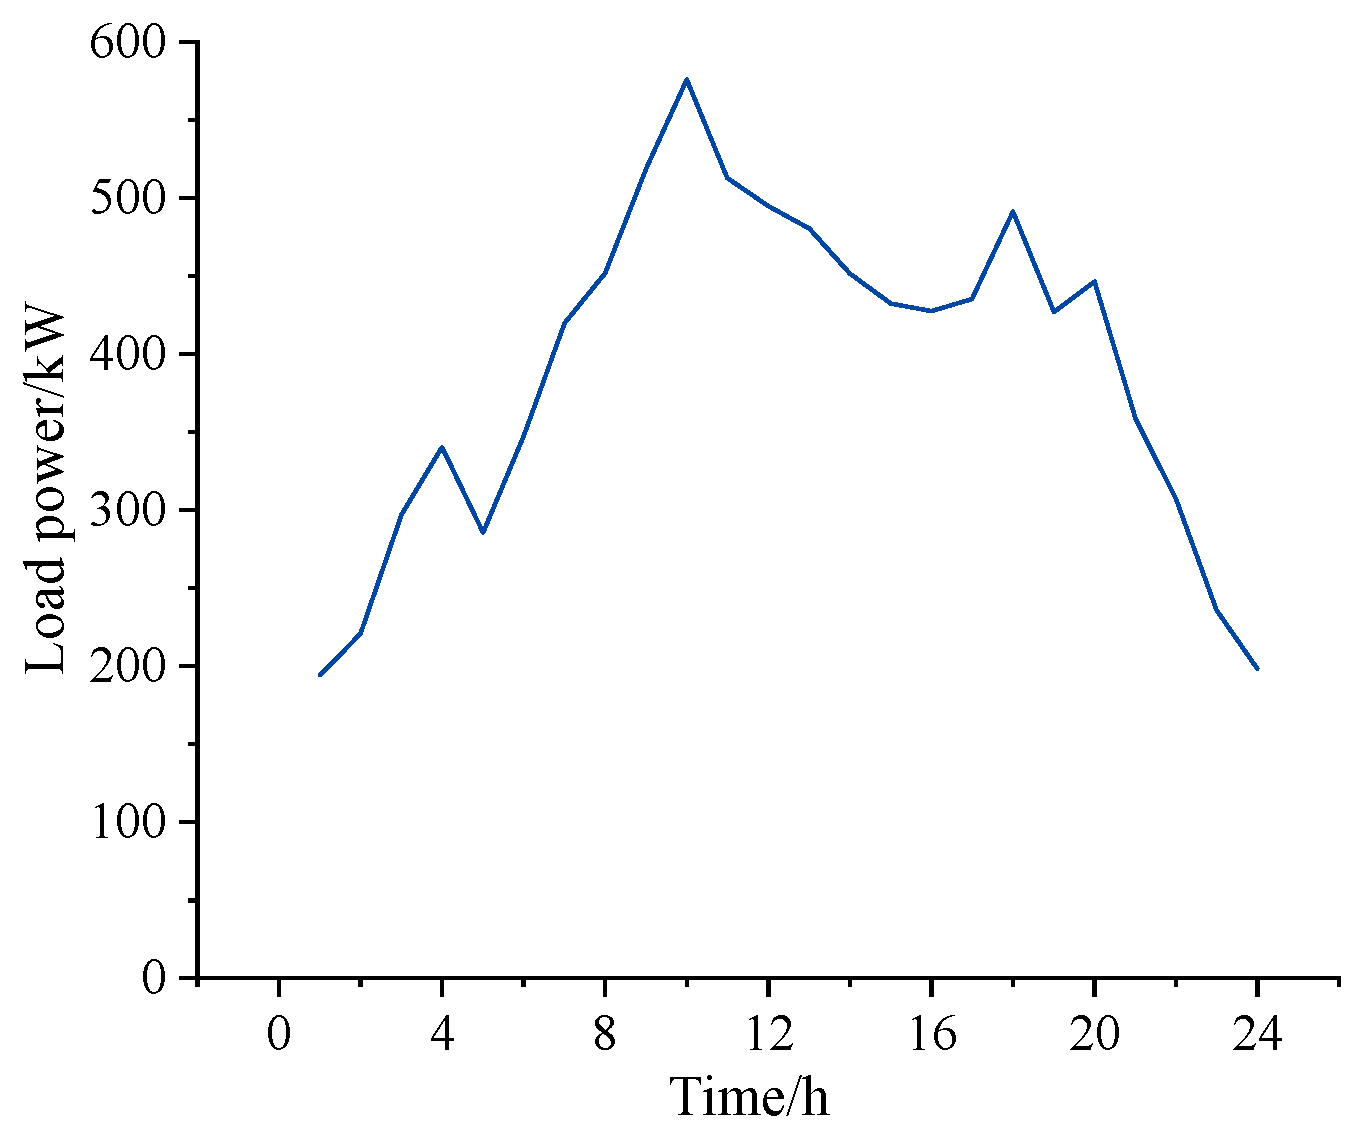
2.1. System Structure and Mathematical Models

This microgrid consists of PV, BAT, electrolyzer (EL) and loads, which are connected to the utility grid through a converter, as shown in Figure 1. The electrical energy storage corresponding to the BAT and the hydrogen energy storage corresponding to the EL together constitute the energy storage system (ESS) of the microgrid. The hydrogen storage system (HSS) consists of an EL and a hydrogen storage tank (HST), which produces hydrogen from new energy generation and transports it to the plants for consumption.
The mathematical model of each unit in the microgrid is shown as follows.
The output power of PV is related to light intensity and ambient temperature [21] and can be expressed as:
P PV ( t ) = P STC G a ( t ) G STC 1 + k T a ( t ) T STC
where PPV is the PV output power at time t; PSTC is the rated PV output power under standard conditions; Ga is the actual light intensity at time t; GSTC is the light intensity under standard conditions (1 kW/m2); k is the temperature coefficient (−0.0043/°C); Ta is the actual temperature at time t; TSTC is the temperature under standard conditions (25 °C).
The state of charge (SOC) of the BAT refers to the ratio of its actual stored power to the rated capacity, which reflects its remaining power and can be expressed as follows:
S O C ( t ) = S O C ( t 1 ) + η BAT P BAT ( t ) Δ t E BAT
where SOC(t) is the charging state of BAT at time t; PBAT(t) is the charging and discharging power of BAT at time t (positive for charging and negative for discharging); ηBAT is the charging and discharging efficiency of BAT; EBAT is the rated capacity of BAT; Δt is the sampling time step (1 h).
An EL uses electrical energy to electrolyze water for hydrogen production, and the amount of hydrogen produced is proportional to its input power and can be expressed as:
Q EL ( t ) = P EL ( t ) η EL ε
where QEL and PEL are the amount of hydrogen generated and the input power of EL at time t, respectively; ηEL is the efficiency of EL (75%); ε is the amount of hydrogen generated for every unit of electricity (0.19 Nm3·kWh−1).
HST stores the hydrogen produced by the EL, and the amount of hydrogen stored can be expressed as:
Q HST ( t ) = Q HST ( t 1 ) + Q EL ( t )
where QHST(t) is the amount of hydrogen stored in HST at time t.

2.2. Energy Scheduling Strategy

Since PV output and load power usage fluctuate all the time, there is a power difference between supply and demand in the microgrid, which needs to be balanced by a hybrid energy storage system to reduce the power interacting with the utility grid [3]. This power difference can be expressed as:
P PV ( t ) + P BAT ( t ) = P L ( t ) + P EL ( t ) + P G ( t )
where PL(t) is the load power at time t; PG(t) is the power exchanged between the microgrid and the utility grid at time t, the positive value of which indicates the microgrid sells electricity to the grid.
In order to determine the real-time power distribution of the hybrid energy storage system, an energy scheduling strategy is used to decide the charging and discharging power of the BAT, the input power of the EL and the interacting power with the utility grid. The corresponding scheduling strategy is shown in Figure 2, which mainly considers the charging and discharging power limitation and capacity limitation of the BAT, the input power limitation of the EL and the capacity limitation of the HST, which are all described in detail in Section 3.2.
The output power of PV is first supplied to the electricity loads. In the case of surplus PV output, the storage priority of the BAT is greater than that of hydrogen storage devices. That is to say, the excess power is stored in the BAT as a priority, and then fed into the EL to produce hydrogen, while the remaining power exceeds the capacity of the storage system and is, therefore, sold to the utility grid. If the PV output power is unable to meet the load’s demand, the BAT is prioritized to be discharged to balance the power difference, and if it still fails to meet the load’s demand, then it is necessary to purchase power from the grid. If the power interaction with the utility grid exceeds the limit, the phenomena of light abandonment and load shortage will occur.

2.3. Demand Response

In microgrids, the task of balancing the power difference between supply and demand is generally performed by energy storage systems. If demand response is introduced to guide and change the power demand on the user side, the latter one can be closer to the renewable energy output, thus decreasing the operating pressure on the energy storage device [22].
A mathematical model of demand response based on time-of-use electricity price is introduced in this microgrid [23], where loads are divided into shiftable loads, conserved or substituted loads and fixed loads:
P L ( t ) = P L 1 ( t ) + P L 2 ( t ) + P L 3 ( t )
where PL1(t) is the shiftable loads at time t that transfer between time periods; PL2(t) is the conserved or substituted loads that allow for conservation, increased electricity use or substitution between electricity and other energy sources; PL3(t) is the fixed loads.
For shiftable loads, a transfer rate model is adopted to represent it. Load shifting is set to take place within different periods of the day, and the periods during which the time-of-use electricity price is higher than the original price are noted as M = m 1 , m 2 , , m i , where i is the number of price-increasing periods; the periods during which the time-of-use electricity price is lower than the original price are noted as N = n 1 , n 2 , , n j , where j is the number of price-decreasing periods. For periods in M, their load power is transferred to other periods as Equations (7) and (8); for periods in N, the load power from other periods is transferred to this period as Equations (9) and (10).
P L 1 ( t ) = P L 1 ( t ) x N Δ P L 1 ( t , x )     t M
Δ P L 1 ( t 1 , t 2 ) = P L 1 ( t 1 ) f [ Δ q ( t 1 ) ] Δ q ( t 2 ) x J Δ q ( x )     t 1 M , t 2 N
P L 1 ( t ) = P L 1 ( t ) + x M Δ P L 1 ( x , t )     t N
Δ P L 1 ( t 4 , t 3 ) = P L 1 ( t 3 ) f [ Δ q ( t 3 ) ] Δ q ( t 4 ) x I Δ q ( x )     t 4 M , t 3 N
where P L 1 ( t ) is the shiftable load power after demand response at time t; ∆PL1(x, y) is the load power transferred from period x to period y; ∆q(t) is the difference between time-of-use electricity price and original price at time t; f(·) is a transfer rate function.
This load transfer rate model describes the relationship between the load transfer rate and the change in electricity price for each time period [24], which is divided into dead, linear and saturated zones:
f ( Δ q ) = 0 0 Δ q B Y ( Δ q a ) B < Δ q f max / Y + B f max Δ q f max / Y + B
where ∆q is the absolute value of the change in electricity price; B is the dead-zone threshold; Y is the slope of the linear zone; fmax is the maximum load transfer rate in the saturated zone.
For the conserved or substituted loads, an electricity demand elasticity matrix is adopted to describe it. The element est in this matrix represents the response coefficient of load power at time s to the change in electricity price at time t, which is defined as:
e s t = Δ P L 2 ( s ) / P L 2 ( s ) Δ q ( t ) / q ( t )
where ∆PL2(s) is the changing power of conserved or substituted loads in the response to the electricity price at time s; q(t) is the original electricity price.
Then, the power of conserved or substituted loads P L 2 ( t ) after demand response is:
P L 2 ( t ) = P L 2 ( t ) + Δ P L 2 ( t )
Δ P L 2 ( s ) = P L 2 ( s ) t = 1 T e s t Δ q ( t ) q ( t )
For the fixed loads, it remains constant regardless of the change in electricity prices.
P L 3 ( t ) = P L 3 ( t )
where P L 3 ( t ) is the power of fixed loads after demand response.
In summary, the total load power after demand response P L ( t ) is obtained by considering these three different load types and describing them with the corresponding mathematical models, after which the capacity of the microgrid is optimally configurated.
P L ( t ) = P L 1 ( t ) + P L 2 ( t ) + P L 3 ( t )

3. Optimal Configuration Model

3.1. Objective Function

3.1.1. Economy Model

The economy of a microgrid can be measured by the overall annual profit, which is the annual operating revenue minus the annual equivalent investment costs and operation costs. The variables for the optimal configuration of the microgrid are the capacity of PV, BAT, EL and HST. One of the optimization objectives is to maximize this overall annual profit, which can be expressed as follows:
max P F = R E + R H 2 + R Gre C Inv C Run C Pu C C O 2
where PF is the overall annual profit; RE, RH2 and RGre are income from electricity, income from selling hydrogen and income from green certificate trading, respectively; CInv and CRun are investment costs and operation and maintenance (O&M) costs, respectively; CPu is the penalty for light abandonment and load shortage; CCO2 is the cost from carbon trading.
R E = R Grid + R Load = t = 1 T α P G ( t ) Δ t + t = 1 T α 2 P L ( t ) Δ t
R H 2 = β t = 1 T Q EL ( t ) Δ t
C Inv = ( C Ma + C Re ) r ( 1 + r ) y ( 1 + r ) y 1
C Run = k BAT S BAT + k EL S EL + k HST S HST + k PV Q PV
C Pu = c 1 t = 1 T P La ( t ) Δ t + c 2 t = 1 T P Ls ( t ) Δ t
where RGrid and RLoad are the income from trading electricity with the utility grid and from load usage, respectively; α, α2 and β are the price of electricity and hydrogen, respectively; CMa and CRe are initial investment costs and replacement costs, respectively; r is the depreciation rate; y is the life cycle of the microgrid; kBAT, kEL, kHST and kPV are the unit O&M cost of BAT, EL, HST and PV; SBAT, SEL and SHST are the capacities of BAT, EL and HST; QPV is the annual generation of PV; c1 and c2 are the unit penalty costs of light abandonment and load shortage; PLa(t) and PLs(t) are the power of light abandonment and load shortage at time t; T is the scheduling cycle (8760 h).
The green certificate trading and carbon-trading mechanisms have been developed to promote the consumption of renewable energy and carbon emission reduction in China. Green certificates are granted for the amount of electricity generated from renewable energy sources, and those in excess of the quota can be sold for the green certificate trading revenue. Carbon trading is primarily the purchase and sale of carbon emission quotas. Carbon emissions of this microgrid come from thermal power purchased from the higher grid, incurring carbon-trading costs.
R Gre = p ( 1 ω ) Q PV
C C O 2 = q E C O 2 = q E C 1 E C 2 = q ( t = 1 T f 1 P G ( t ) Δ t t = 1 T f 2 P G ( t ) Δ t )
where p is the unit green certificate trading price; ω is the renewable energy generation quota share; q is the unit carbon-trading price; EC1 and EC2 are actual carbon emissions and allocated carbon emission quotas, respectively; f1 and f2 are carbon emissions and free quotas for carbon emissions from purchasing units of thermal power from the grid.
The unit carbon-trading price in a regular carbon-trading mechanism is fixed, while the unit carbon-trading price in laddering carbon-trading varies according to the amount of carbon emissions [10,25]. That is to say, in laddering carbon trading, the more carbon emissions, the higher the unit carbon-trading price and the greater the carbon-trading costs:
C C O 2 = q E C O 2 E C O 2 r q r + q ( 1 + s ) ( E C O 2 r ) r E C O 2 2 r q ( 2 + s ) r + q ( 1 + 2 s ) ( E C O 2 2 r ) 2 r E C O 2 3 r q ( 3 + 3 s ) r + q ( 1 + 3 s ) ( E C O 2 3 r ) 3 r E C O 2 4 r q ( 4 + 6 s ) r + q ( 1 + 4 s ) ( E C O 2 4 r ) E C O 2 4 r
where r is the length of interval for laddering carbon emissions; s is the growth rate of carbon-trading prices.

3.1.2. Reliability Model

When the power supply in a microgrid fails to meet the load power demand, parts of the load are removed to maintain the power balance. The ratio of the corresponding load shortage to the total load consumption is the load shortage rate (LSR) λLs, which is used to characterize the reliability of power supply in a microgrid [26].
min λ Ls = Q Ls Q Lo × 100 %
where QLs and QLo are the total load shortage and the total load consumption:
Q Ls = t = 1 T P Ls ( t ) Δ t
Q Lo = t = 1 T P L ( t ) Δ t

3.2. Constraints

3.2.1. Power Balance Constraints

The power supply and demand within the microgrid should be equal at any moment:
P PV ( t ) + P BAT ( t ) = P L ( t ) + P EL ( t ) + P G ( t )

3.2.2. Storage Operational Constraints

For BAT, there are depth constraints and power constraints for both charge and discharge:
S O C min S O C ( t ) S O C max P DMax P BAT ( t ) P CMax
where SOCmin and SOCmax are the minimum and maximum allowable values of SOC; PDMax and PCMax are the upper limits of discharging power and charging power.
For HSS, there are power constraints for EL and capacity constraints for HST:
0 P EL ( t ) P EL , max
Q HST , min Q HST ( t ) Q HST , max
where PEL,max is the maximum allowable value of input power; QHSTmin and QHSTmax are the lower and upper limits of capacity.

3.2.3. System Operational Constraints

There are limits to the amount of power that can be exchanged between the microgrid and the utility grid:
P G , min P G ( t ) P G , max
where PG,min and PG,max are the lower and upper limits of power exchanged with the utility grid, respectively.

3.3. Optimization Method of the Configuration Model

In the proposed capacity configuration model, the optimization variables are PV capacity, BAT capacity, EL capacity and HST capacity, while the optimization objective is to achieve Equations (17) and (26) with the constraints satisfied. Considering that the economy and reliability of the microgrid cannot be simultaneously optimized, the NSGA-II algorithm is selected to solve this multi-variable, multi-constrained and multi-objective problem, and the optimal solution is chosen among the obtained Pareto front.
NSGA was proposed based on genetic algorithms, considering the concept of Pareto optimality in 1995. The NSGA-II with elite strategies was proposed five years later. It improves on the following three aspects: the integration of a fast non-dominated sorting method and an elite strategy, and the adoption of crowding distance and its comparison operator, which reduces computational complexity and improves the convergence speed and optimization accuracy [27]. NSGA-II is employed for the optimization of this capacity configuration model due to its fewer parameters, simpler implementation, cleaner optimization idea and faster convergence rate. The main flowchart of the algorithm is shown in Figure 3.

4. Case Study

In this paper, a region in Northwest China is selected as a case for an optimal configuration study to verify the correctness of this proposed model. The local annual meteorological data for light intensity, temperature and the daily load data are shown in Figure 4 and Figure 5. The investment cost, the O&M cost and the lifespan of each piece of equipment [28] are shown in Table 1. The microgrid interacts with the grid by adopting a time-of-use model, and the corresponding electricity purchasing and selling prices are shown in Table 2. The power limit for the interaction with the utility grid is 300 kW.
The NSGA-II algorithm is used for simultaneous optimization of the two objective functions of overall annual profit and LSR to obtain the Pareto front, as shown in Figure 6. As can be seen from this figure, there is a contradiction between the economic and the reliability metrics of the microgrid, and it is impossible for them to take the optimal value at the same time: when the overall annual profit increases, the LSR decreases; conversely, when the consolidated profit decreases, the LSR increases. Therefore, the compromise solution in the Pareto optimal solution set, namely the turning point of the Pareto front, is chosen for the subsequent analysis [29].

4.1. Different Scenario Setting and Result Analysis

In order to study the impact of carbon trading and demand response on capacity configuration and system operation, four scenarios were set up for comparative analysis: scenario I adopts conventional carbon trading without considering demand response; scenario II adopts laddering carbon trading without considering demand response; scenario III adopts conventional carbon trading while considering demand response; and scenario IV adopts laddering carbon trading while considering demand response. The simulation for these four scenarios yields the results of the optimal configuration for the microgrid, as shown in Table 3, and the corresponding system operation is shown in Table 4.

4.1.1. Impact of Different Carbon-Trading Calculation Models on Capacity Configuration

By comparing the configuration results of scenario I and scenario II in Table 3, it can be seen that the configured capacity of PV and BAT increased by 48 kW and 177 kW·h, respectively, after the adoption of laddering carbon trading, which indicates that the laddering carbon trading is more likely to stimulate the system’s renewable energy consumption capacity. At the same time, there is an overall reduction in the HSS-configured capacity; while the EL-configured capacity increases by 22 kW, the HST-configured capacity decreases by 56 kg. As for the optimization result of the objective function, after the adoption of laddering carbon trading, the LSR drops by 0.07%, although the overall profit reduces by RMB 33,800. In other words, the economy of the microgrid decreases, but the reliability of power supply increases.
Comparing the operation of scenario I and scenario II in Table 4, the cost of carbon trading increases by RMB 7500 or 66.4% after the adoption of ladder carbon trading. Due to the increase in carbon-trading costs of purchasing power from the grid, the microgrid reduces the amount of power purchased from the grid side and, instead, increases renewable energy generation to meet the load’s electricity demand. Load shortages have been reduced by 2600 kW·h, so supply reliability has increased. In the meantime, investment costs and O&M costs increased by RMB 43,000 and RMB 15,800, respectively, while income from electricity and income from selling hydrogen increased by RMB 6900 and RMB 16,000, respectively. But the increment in costs is greater than the increment in income, so the overall profit of the microgrid has declined.
When comparing the results of scenarios III and IV, it can be seen that the change in the capacity of each device after the adoption of the laddered carbon-trading mechanism with simultaneous consideration of demand response is similar to scenario I and II, without consideration of the demand response, and the comparison of the system operation is also similar. This further demonstrates that the impact of laddered carbon trading on the configuration results and the effect of improving the reliability of the power supply still exist after consideration of the demand response.
In summary, it can be seen that laddering carbon trading increases the cost of purchasing electricity from the utility grid, which makes the microgrid tend to increase the capacity of PV and BAT and improves its renewable energy consumption capacity.

4.1.2. Impact of Demand Response on Capacity Configuration

Comparing the configuration results of scenario I and scenario III in Table 3, it can be seen that the configured capacities of BAT, EL and HST reduce by 177 kW·h, 4 kW and 123 kg, respectively, after considering demand response. This is because the demand response reduces the pressure on the storage to balance the power difference between supply and demand, and, therefore, the capacity of the electric–hydrogen hybrid storage system is reduced. Meanwhile, the configured capacity of PV decreases by 48 kW, and the amount of renewable energy to be consumed reduces accordingly. The optimized results of the objective function show that the overall profit increases by RMB 25,200, while the LSR increases by 0.01%, improving economy and weakening reliability in the microgrid.
The comparison of the operation of scenario I and scenario III in Table 4 shows that investment costs and O&M costs decrease by RMB 73,500 and RMB 22,500, respectively, because of the decrease in the configured capacity of each unit after considering the demand response. Simultaneously, revenues from electricity and hydrogen sales decline by RMB 47,400 and RMB 15,400, respectively, although these are lower than the decrease in investment and O&M costs. Thus, the economy of the microgrid has increased, and the load shortage has increased slightly (700 kW·h), which means that the reliability of the power supply has decreased.
In conclusion, it can be seen that the demand response reduces the power difference between supply and demand and reduces the stress on the energy storage system, which, in turn, decreases the configured capacity of BAT and HST, resulting in a slight decrease in microgrid supply reliability. Although the system’s operating revenue has decreased, the investment and O&M costs have increased more, so the overall profit has increased.

4.2. Analysis of Load Characteristics with Demand Response

The daily load changes before and after the implementation of demand response are shown in Figure 7. As a result, the load is shifted from the electricity price peak hours to the electricity price valley hours, which makes the peak–valley difference of the load smaller, thus reducing the pressure on the generation of renewable energy sources and the storage pressure on the energy storage system. As a result, the configured capacity of the units in the microgrid is reduced.

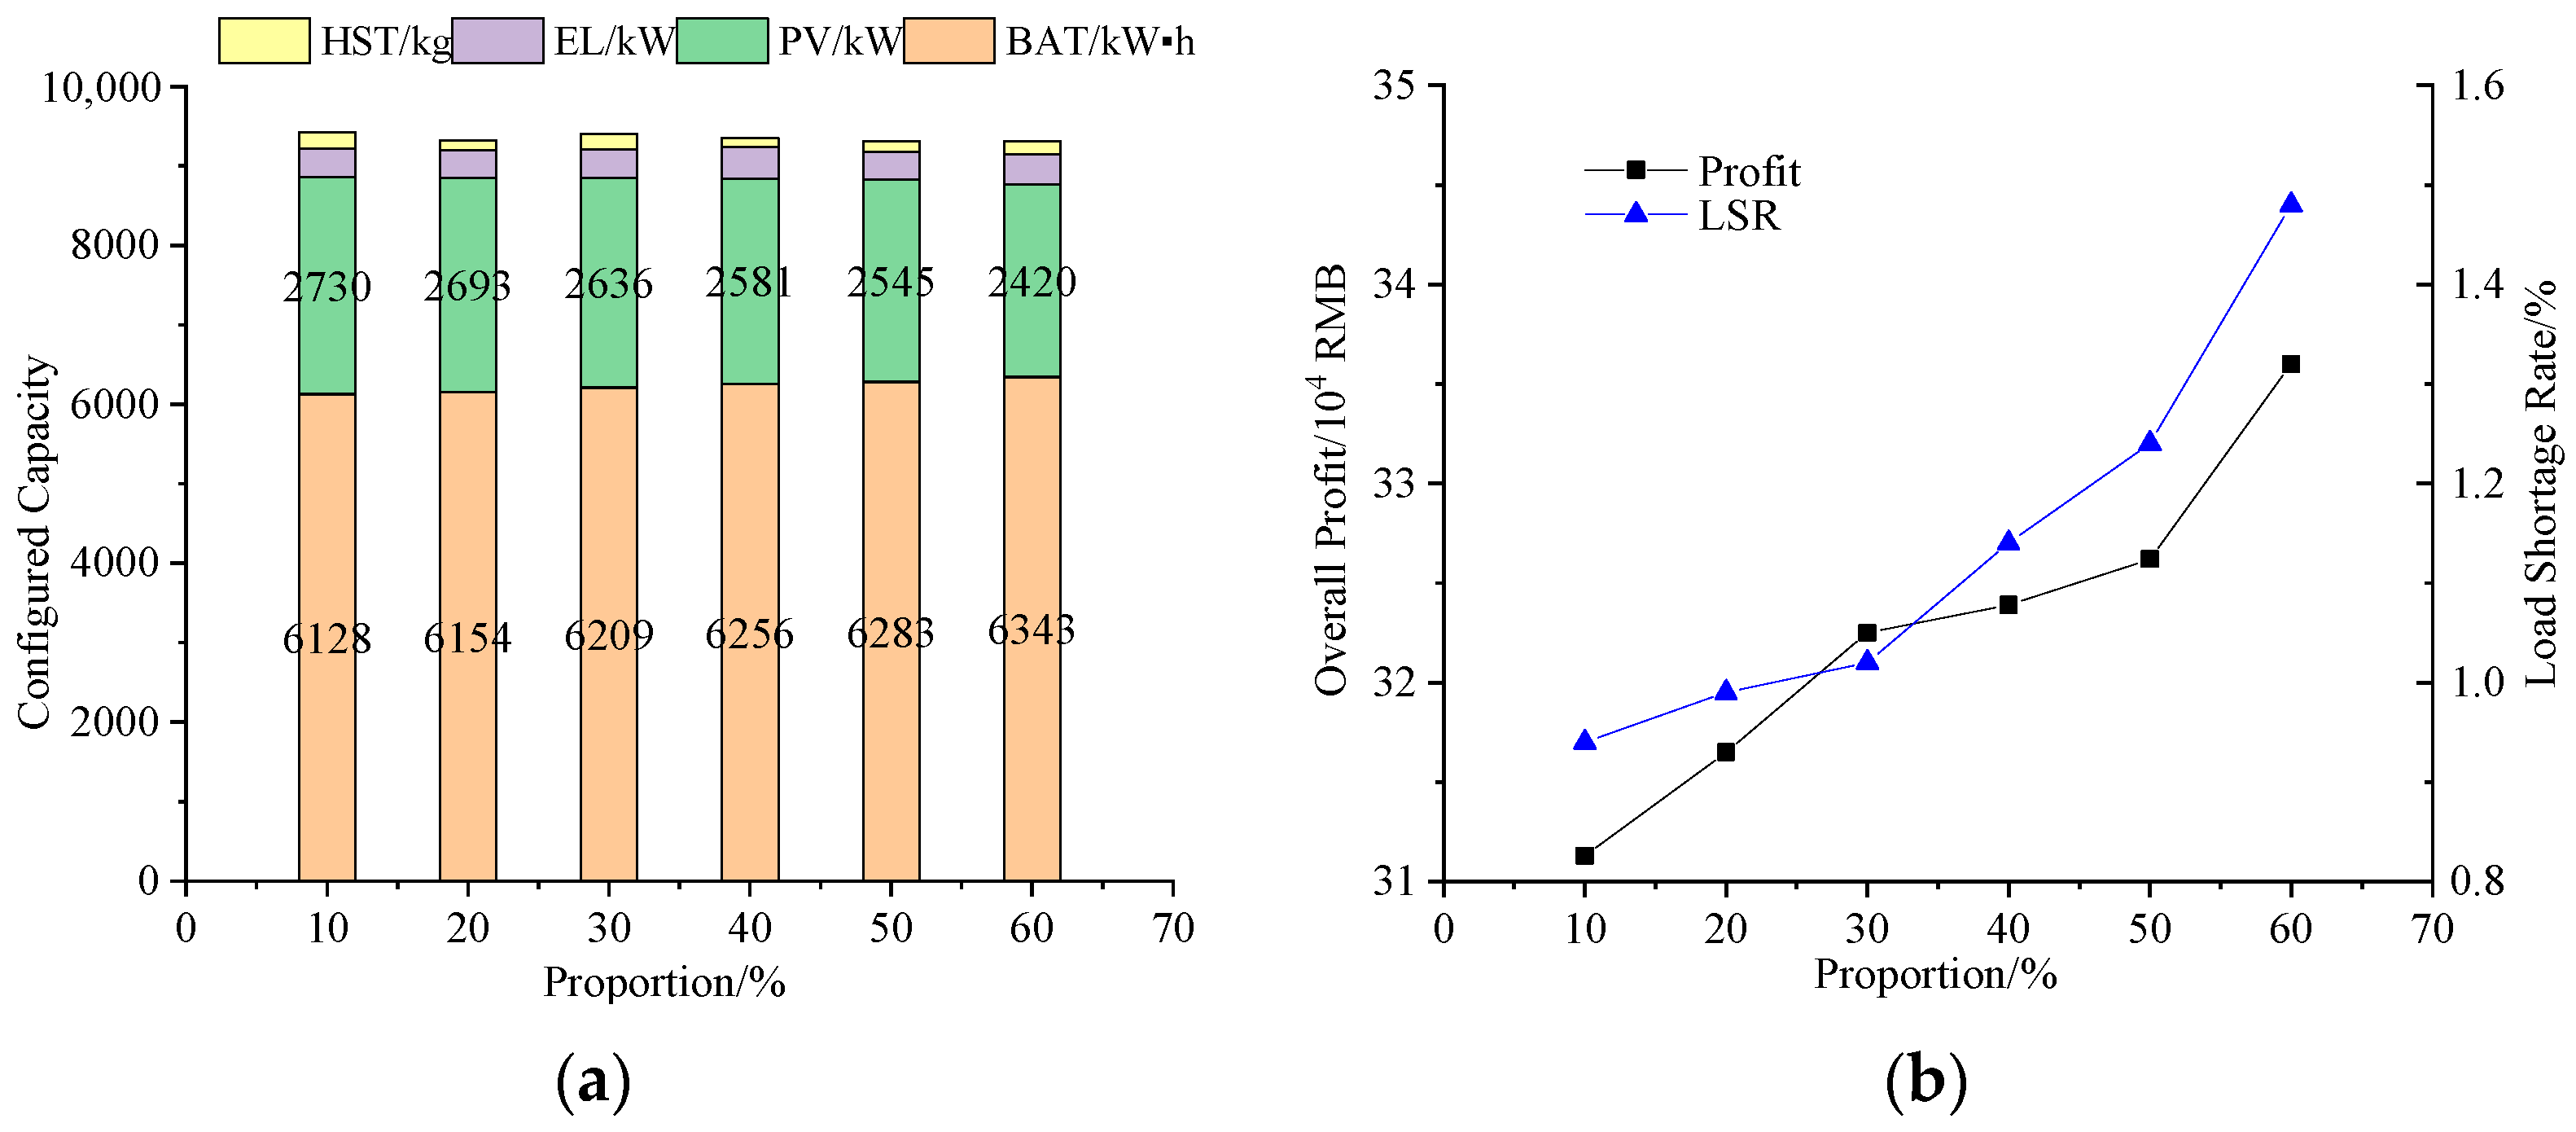
4.3. Sensitivity Analysis of Demand Response

The percentages of the three loads mentioned above for demand response are 20%, 10% and 70%, while the percentage of load for each type of demand response affects the effectiveness of demand response implementation. Therefore, the effects of shiftable load and served or substituted load shares on the capacity configuration results are analyzed.
The served or substituted load share and the total load are kept constant, and the shiftable load share is set to change from 10% to 60% with the percentage of the fixed load changing simultaneously, of which the change rate is 10%. The relationship between the percentage of shiftable load and the allocated capacity, annual overall profit and load shortage rate is shown in Figure 8. As can be seen from this figure, as the share of the shiftable load increases, the configured capacity of PV decreases from 2730 kW to 2420 kW, and the amount of solar energy required to be consumed decreases. In addition, the overall profit of the microgrid increases from RMB 311,300 to RMB 336,000, but the load shortage rate increases from 0.94% to 1.48%. To slow the decline in power supply reliability, the configured capacity of BAT increases from 6128 kW h to 6343 kW h. In summary, the increase in the share of shiftable loads can contribute to the improvement in microgrid economy, but the power supply reliability will decrease.
Similarly, the shiftable load share is kept constant, and the served or substituted load share is set to change from 10% to 60%, of which the change rate is 10%. The relationship between the percentage of served or substituted load and the allocated capacity, annual overall profit and load shortage rate is shown in Figure 9. As can be seen from this figure, as the served or substituted load share increases, the configured capacity of PV reduces from 2693 kW to 2348 kW, while the configured capacity of BAT reduces from 6154 kW·h to 5213 kW·h. However, the overall profit of microgrids rises from RMB 316,500 to RMB 359,800, indicating that the microgrid can achieve more economic returns with less configured capacity. However, as the BAT capacity declines, the power supply reliability of the microgrid drops: the load shortage rate increases from 0.99% to 1.46%. In conclusion, the increase in the share of served or substituted loads can promote the economy of microgrids, but it can cause the reliability of the power supply to decrease.

4.4. Sensitivity Analysis of Other Parameters

In order to explore the impact of different parameters in the model on the results of the microgrid configuration, sensitivity analysis of other key parameters is implemented. The sensitivity analysis here focuses on the change in the two optimization objectives, namely the annual overall profit and LSR. The change in the values of the key parameters and the corresponding change in economy and reliability are shown in Table 5.
By analyzing the results in Table 5, it can be seen that when the hydrogen price rises, the economy of the microgrid rises but the reliability decreases; when the carbon-trading price rises or the growth rate of the carbon-trading price rises, the cost of carbon trading increases, and the microgrid reduces the purchase of electricity from the large grid, resulting in a decrease in the economy but an increase in the reliability. In addition, compared to the other two factors, the hydrogen price has a greater impact on the annual overall profit of the microgrid, while the carbon-trading price has a greater impact on the LSR.

5. Conclusions and Discussion

For the grid-connected PV-BAT-HSS microgrid, this paper establishes a capacity configuration model considering laddering carbon trading and demand response, with economy and power supply reliability as the optimization objectives. Meanwhile, this paper compares and analyzes the configuration results of the four scenarios and investigates the impacts of laddering carbon trading and demand response on microgrid planning and operation, and we draw the following conclusions:
  • There is a contradiction between the economy and reliability of power supply in the microgrid, and they cannot be optimized at the same time. When the overall profit rises, the reliability of the power supply decreases; when the overall profit decreases, the reliability of the power supply increases.
  • When the model for calculating the cost of carbon trading changes from conventional to laddering, the penalties for carbon trading increase, and the overall profit of the microgrid decreases. The increased cost of power purchases by microgrids from the grid leads to a decrease in the amount of purchased power, which favors new energy generation for the grid, resulting in an increase in the capacity configuration of PV and BAT, as well as a rise in the reliability of the supply.
  • Demand response makes the peak-to-valley difference in daily loads smaller and reduces the supply–demand power differential, thereby reducing the pressure on renewable energy generation and energy storage systems to store energy. This means that demand response allows microgrids to achieve greater economic efficiency with less configured capacity but with lower supply reliability.
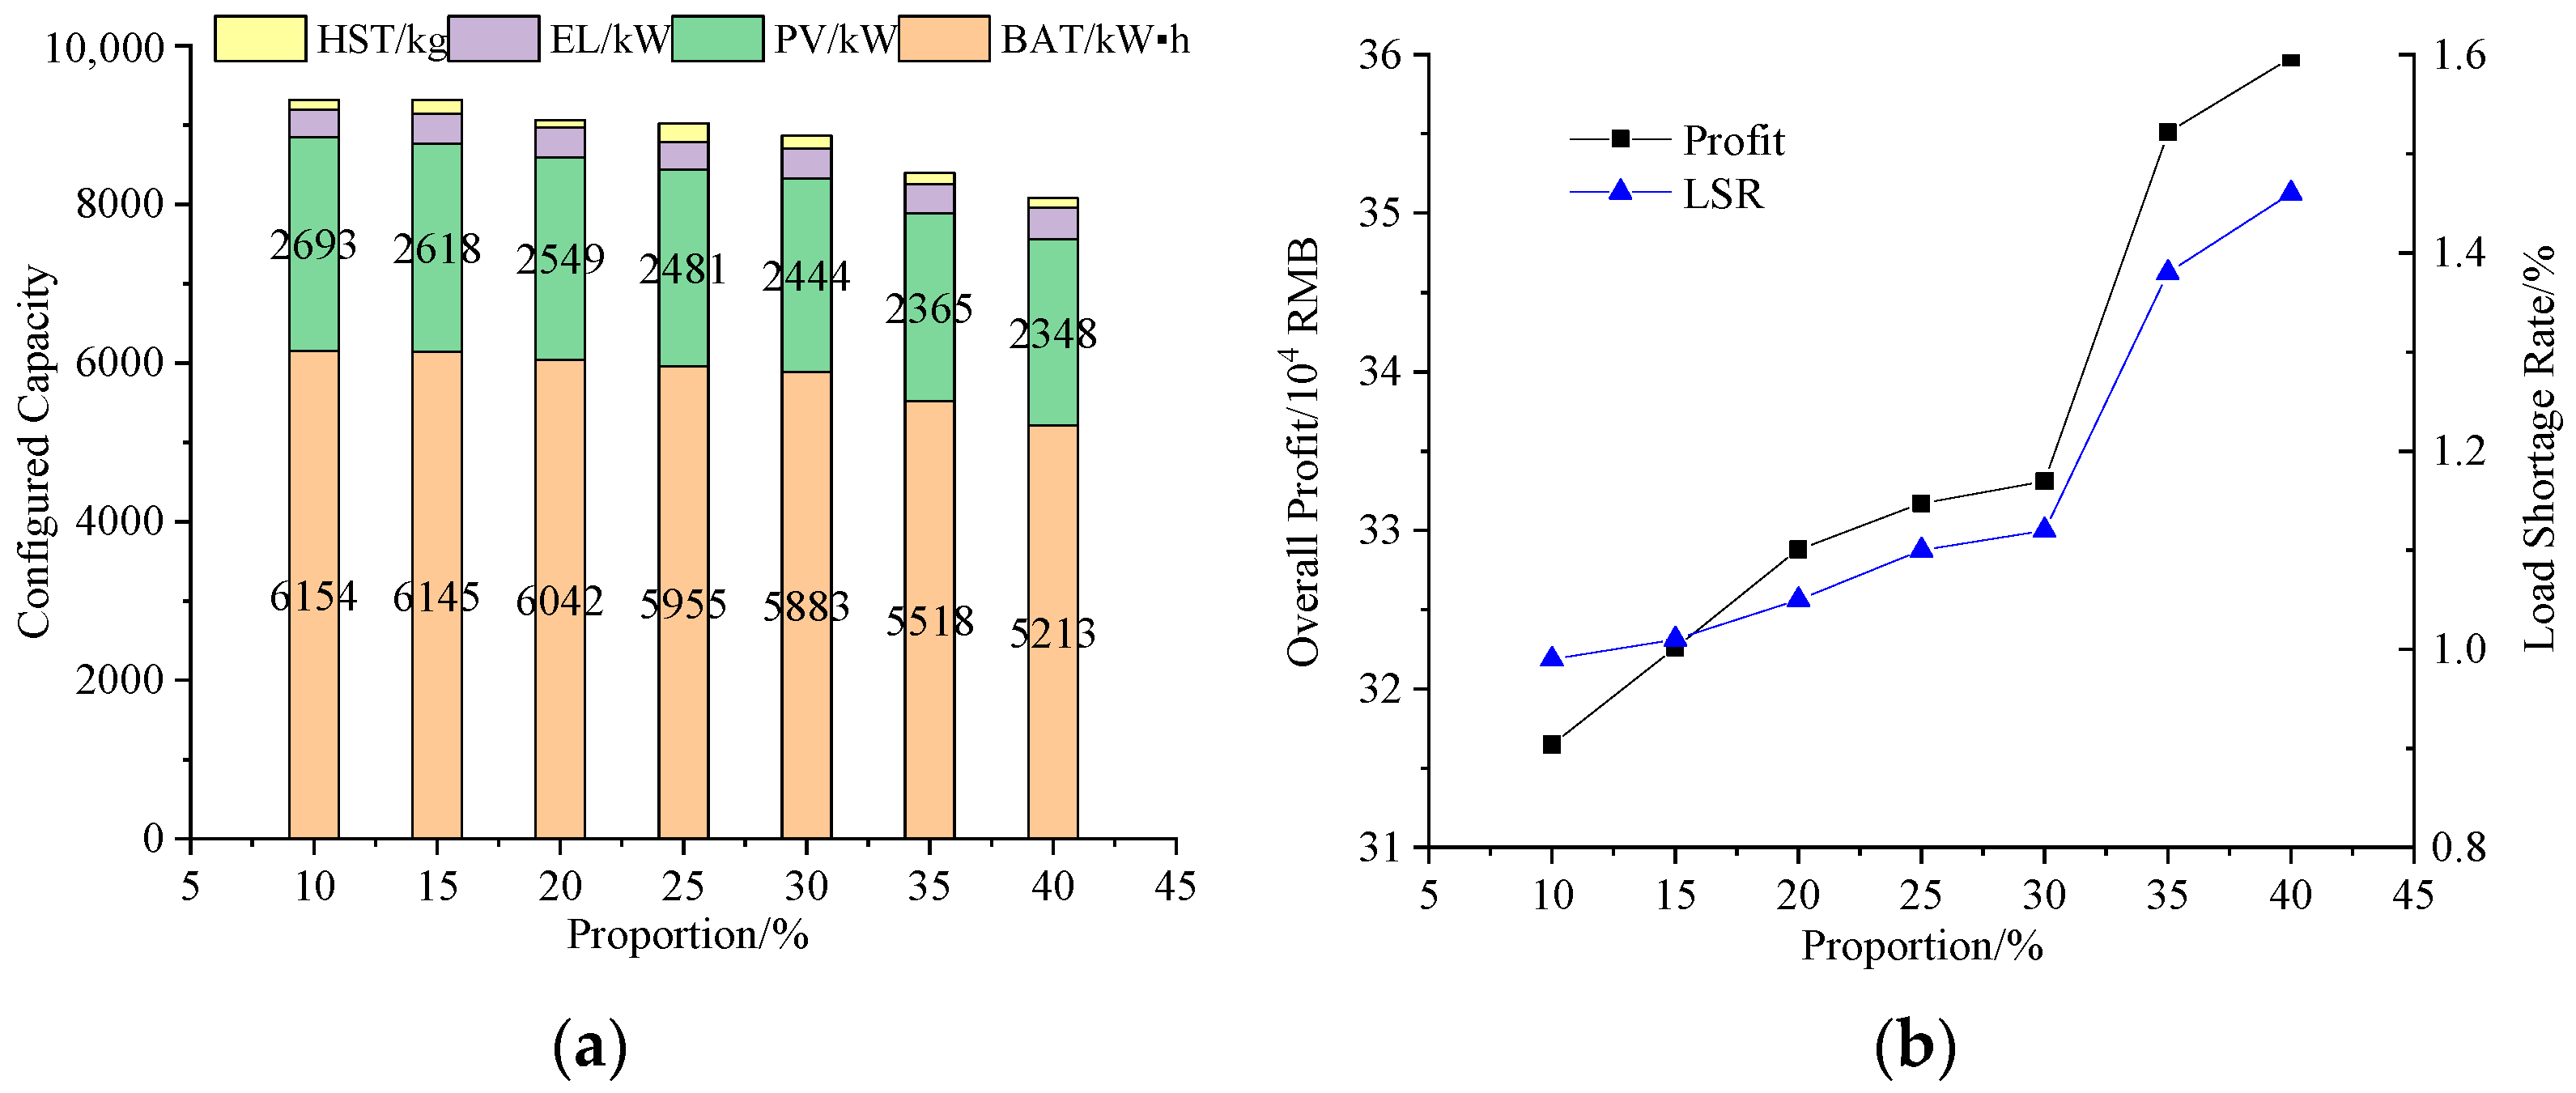
  • Different load shares in demand response can affect capacity configuration and system operation results. As the share of shiftable loads increases, the PV configuration capacity decreases, but the BAT configuration capacity increases; as the share of the served or substituted loads increases, the configuration capacity of both PV and BAT decreases. Both the increase in the share of shiftable and the served or substituted loads can contribute to the economics of microgrids but can lead to a decrease in the reliability of the supply.
Further research may focus on the expansion and extension of the optimal configuration model to quantify and analyze the challenges, environmental benefits and other factors in real-world applications, expanding the discussion on broader impacts. Comparison with other microgrid configuration models in terms of cost effectiveness, feasibility and other aspects must also to be conducted. Other optimization algorithms such as branch-and-bound algorithms should also be considered for optimizing the capacity configuration model and compared with the optimization results of existing algorithms. These are topics for subsequent research.

Author Contributions

Conceptualization, Z.X. and F.C.; methodology, X.Y.; software, X.Y.; validation, Z.X. and Q.L.; formal analysis, X.Y. All authors have read and agreed to the published version of the manuscript.

Funding

This research received no external funding.

Data Availability Statement

Data are contained within the article.

Conflicts of Interest

Authors Zhanpeng Xu and Fuxin Chen were employed by the company Power China Huadong Engineering Corporation Limited. The remaining authors declare that the research was conducted in the absence of any commercial or financial relationships that could be construed as a potential conflict of interest.

References

  1. Mu, C.; Zhang, Y.; Jia, H.; He, H. Energy-Storage-Based Intelligent Frequency Control of Microgrid with Stochastic Model Uncertainties. IEEE Trans. Smart Grid 2020, 11, 1748–1758. [Google Scholar] [CrossRef]
  2. Hatziargyriou, N.; Asano, H.; Iravani, R.; Marnay, C. Microgrid. IEEE Power Energy Mag. 2007, 5, 78–94. [Google Scholar] [CrossRef]
  3. Wang, H.; Wang, T.; Xie, X.; Ling, Z.; Gao, G.; Dong, X. Optimal Capacity Configuration of a Hybrid Energy Storage System for an Isolated Microgrid Using Quantum-Behaved Particle Swarm Optimization. Energies 2018, 11, 454. [Google Scholar] [CrossRef]
  4. Li, P.; Li, R.X.; Cao, Y.; Li, D.Y.; Xie, G. Multi-objective sizing optimization for island microgrids using a triangular aggregation model and the levy-harmony algorithm. IEEE Trans. Ind. Inform. 2018, 14, 3495–3505. [Google Scholar] [CrossRef]
  5. Rajkumar, R.K.; Ramachandaramurthy, V.K.; Yong, B.L.; Chia, D.B. Techno-economical optimization of hybrid pv/wind/battery system using Neuro-Fuzzy. Energy 2011, 36, 5148–5153. [Google Scholar] [CrossRef]
  6. Alzahrani, A.; Ramu, S.K.; Devarajan, G.; Vairavasundaram, I.; Vairavasundaram, S. A review on hydrogen-based hybrid microgrid system: Topologies for hydrogen energy storage, integration, and energy management with solar and wind energy. Energies 2022, 15, 7979. [Google Scholar] [CrossRef]
  7. Lu, Z.M.; Li, Y.T.; Zhuo, G.Y.; Xu, C.B. Configuration optimization of hydrogen-based multi-microgrid systems under electricity market trading and different hydrogen production strategies. Sustainability 2023, 15, 6753. [Google Scholar] [CrossRef]
  8. Lu, S.Y.; Lou, S.H.; Wu, Y.W.; Yin, X.G. Power system economic dispatch under low-carbon economy with carbon capture plants considered. IET Gener. Transm. Distrib. 2013, 7, 991–1001. [Google Scholar] [CrossRef]
  9. Fu, X.; Zeng, G.; Zhu, X.X.; Zhao, J.; Huang, B.; Liu, J. Optimal scheduling strategy of grid-connected microgrid with ladder-type carbon trading based on Stackelberg game. Front. Energy Res. 2023, 10, 961341. [Google Scholar] [CrossRef]
  10. Han, Y.; Yu, S.C.; Li, L.Y.; Hou, Y.J.; Li, Q.; Chen, W.R. Low-carbon and economic configuration method for solar hydrogen storage microgrid including stepped carbon trading. High Volt. Eng. 2022, 48, 2523–2533. [Google Scholar]
  11. Cui, Y.; Wang, Y.; Xu, Y.; Zhao, Y. Low-carbon economic dispatching of microgrid considering generalized integrated demand response and nonlinear conditions. Energy Rep. 2023, 9, 1606–1620. [Google Scholar] [CrossRef]
  12. Zhu, Y.; Hu, Z.; Yang, J.; Chang, Q.; Nie, C. Low carbon optimal dispatching of microgrid considering demand response. In Proceedings of the Asia Power and Electrical Technology Conference (APET), Shanghai, China, 11–13 November 2022; pp. 366–373. [Google Scholar]
  13. Li, H.; Lin, L. Optimal dispatch of CCHP microgrid considering carbon trading and integrated demand response. Distrib. Gener. Altern. Energy J. 2022, 3, 1681–1702. [Google Scholar] [CrossRef]
  14. Sugimura, M.; Gamil, M.M.; Akter, H.; Krishna, N.; Abdel-Akher, M.; Mandal, P.; Senjyu, T. Optimal sizing and operation for microgrid with renewable energy considering two types demand response. J. Renew. Sustain. Energy 2020, 12, 065901. [Google Scholar] [CrossRef]
  15. Long, Y.L.; Li, Y.; Wang, Y.H.; Cao, Y.J.; Jiang, L.; Zhou, Y.C.; Deng, Y.Y.; Nakanishi, Y. Low-carbon economic dispatch considering integrated demand response and multistep carbon trading for multi-energy microgrid. Sci. Rep. 2022, 12, 6218. [Google Scholar] [CrossRef]
  16. Theodorakatos, N.P.; Babu, R.; Moschoudis, A.P. The branch-and-bound algorithm in optimizing mathematical programming models to achieve power grid observability. Axioms 2023, 12, 1040. [Google Scholar] [CrossRef]
  17. Theodorakatos, N.P.; Lytras, M.D.; Moschoudis, A.P.; Kantoutsis, K.T. Implementation of optimization-based algorithms for maximum power system observability using synchronized measurements. AIP Conf. Proc. 2023, 2872, 120006. [Google Scholar]
  18. Luo, Z.; Yang, S.; Xie, N.; Xie, W.; Liu, J.; Souley Agbodjan, Y.; Liu, Z. Multi-objective capacity optimization of a distributed energy system considering economy, environment and energy. Energy Convers. Manag. 2019, 200, 112081. [Google Scholar] [CrossRef]
  19. Xu, C.; Ke, Y.; Li, Y.; Chu, H.; Wu, Y. Data-driven configuration optimization of an off-grid wind/PV/hydrogen system based on modified NSGA-II and CRITIC-TOPSIS. Energy Convers. Manag. 2020, 215, 112892. [Google Scholar] [CrossRef]
  20. Li, J.; Zhao, J.; Chen, Y.; Mao, L.; Qu, K.; Li, F. Optimal sizing for a wind-photovoltaic-hydrogen hybrid system considering levelized cost of storage and source-load interaction. Int. J. Hydrogen Energy 2023, 48, 4129–4142. [Google Scholar] [CrossRef]
  21. Mao, M.Q.; Jin, P.; Chang, L.C.; Xu, H.B. Economic analysis and optimal design on microgrids with SS-PVs for industries. IEEE Trans. Sustain. Energy 2014, 5, 1328–1336. [Google Scholar] [CrossRef]
  22. Jin, S.; Botterud, A.; Ryan, S.M. Impact of demand response on thermal generation investment with high wind penetration. IEEE Trans. Smart Grid 2013, 4, 2374–2383. [Google Scholar] [CrossRef]
  23. Chen, A.W.; Hua, H.R.; Li, P.; Su, Y.F. Optimal operation of AC/DC hybrid micro-grid based on real-time price mechanism. Power Syst. Prot. Control 2017, 45, 13–20. [Google Scholar]
  24. Stoft, S. Power System Economics: Designing Markets for Electricity; Wiley-IEEE Press: New York, NY, USA, 2002; pp. 140–152. [Google Scholar]
  25. Wang, Y.; Lin, Y.; Du, B.; Liu, Y.; Xu, S.; Li, D.; Wang, D. Operational optimization of an integrated electricity-thermal energy system considering demand response under a stepped carbon trading mechanism. J. Phys. Conf. Ser. 2022, 2396, 012056. [Google Scholar] [CrossRef]
  26. Borowy, B.; Salameh, Z. Methodology for optimally sizing the combination of a battery bank and PV array in a wind/PV hybrid system. IEEE Trans. Energy Conver. 1996, 11, 367–375. [Google Scholar] [CrossRef]
  27. Deb, K.; Pratab, A.; Agarwal, S.; Meyarivan, T. A fast and elitist multi-objective genetic algorithm: NSGA-II. IEEE Trans. Evolut. Comput. 2002, 6, 182–197. [Google Scholar] [CrossRef]
  28. Zuo, G.L.; Guo, H.X.; Lin, W.Z.; Yu, Y.L.; Lu, Y.H. Optimal configuration of microgrid considering low-carbon hydrogen production. Elect. Power Autom. Equip. 2023, 43, 9–18. [Google Scholar]
  29. Yang, D.F.; Jiang, C.; Cai, G.W.; Huang, N.T.; Liu, X.J.; Huang, Z. Multi-objective optimal configuration of ac/dc microgrid considering electricity/heat coupling. Autom. Electr. Power Syst. 2020, 44, 1000–1026. [Google Scholar]
Figure 1. System structure of a grid-connected microgrid.
Energies 17 00139 g001
Figure 2. The scheduling strategy of the microgrid.
Energies 17 00139 g002
Figure 3. The main flowchart of the optimization method using NSGA-II.
Energies 17 00139 g003
Figure 4. The local annual meteorological data: (a) light intensity; (b) temperature.
Energies 17 00139 g004
Figure 5. The daily load data.
Energies 17 00139 g005
Figure 6. The Pareto front of two objective functions.
Energies 17 00139 g006
Figure 7. The daily load change after and before demand response and electricity price.
Energies 17 00139 g007
Figure 8. Configuration results under different shiftable load shares: (a) configured capacity of each unit; (b) overall profit and load shortage rate.
Energies 17 00139 g008
Figure 9. Configuration results under different served or substituted load shares: (a) configured capacity of each unit; (b) overall profit and load shortage rate.
Energies 17 00139 g009
Table 1. The investment cost, the O&M cost and the lifespan of each piece of equipment.
EquipmentInvestment CostO&M CostLifespan/Year
PV6195 RMB/kW0.15 RMB/kW20
BAT1070 RMB/kW h5 RMB/kW h10
EL7615 RMB/kW120 RMB/kW10
HST2600 RMB/kg19 RMB/kg20
Table 2. The time-of-use electricity price.
Time PeriodPurchasing PriceSelling Price
0:00–8:000.37 RMB/kW h0.28 RMB/kW h
12:00–17:00, 21:00–24:000.69 RMB/kW h0.53 RMB/kW h
8:00–12:00, 17:00–21:000.87 RMB/kW h0.72 RMB/kW h
Table 3. The optimal configuration results with different scenarios.
ScenariosPV/kWBAT/kW hEL/kWHST/kgProfit/104 RMBLSR/%
I2762627135723729.130.98
II2810644837918125.750.91
III2693615435311431.650.99
IV2731638235715327.880.92
Table 4. The system performance with different scenarios.
ScenariosRE/104 RMBRH2/104 RMBCInv/104 RMBCRun/104 RMBCCO2/104 RMBLoad Shortage
/104 kW h
I260.6468.81223.9284.471.133.37
II261.3370.41228.2286.051.883.11
III255.9067.27216.5782.221.203.44
IV256.3968.58221.6583.511.973.19
Table 5. The sensitivity analysis of other key parameters.
ParameterBase ValueChanged toChange in Profit (%)Change in LSR (%)
Hydrogen price55 RMB/kg44 RMB/kg (−20%)−18.80−5.17
66 RMB/kg (+20%)16.785.30
Carbon trading price
(regular)
247.33 RMB/t197.86 RMB/t (−20%)12.026.69
296.80 RMB/t (+20%)−15.23−7.43
Growth rate of carbon
trading prices
25%20% (−20%)10.163.39
30% (+20%)−9.82−4.18
Disclaimer/Publisher’s Note: The statements, opinions and data contained in all publications are solely those of the individual author(s) and contributor(s) and not of MDPI and/or the editor(s). MDPI and/or the editor(s) disclaim responsibility for any injury to people or property resulting from any ideas, methods, instructions or products referred to in the content.

