Article

Assessment of the Robustness of the European Gas System to Massive Gas Outages and Evaluation of the Effect of Increased Energy Efficiency on the Security of Gas Coverage in Different Countries

CIRCE—Technology Center, Avenida Ranillas 3D 1ºA, 50018 Zaragoza, Spain
*
Author to whom correspondence should be addressed.
Energies 2024, 17(1), 137; https://doi.org/10.3390/en17010137
Submission received: 21 September 2023 / Revised: 15 December 2023 / Accepted: 22 December 2023 / Published: 26 December 2023
(This article belongs to the Section C: Energy Economics and Policy)

Abstract

:
The aim of this paper is to simulate the European natural gas system in extreme situations and to determine its weaknesses in terms of demand coverage. An assessment has also been made of the targets set for existing energy efficiency regulations and their effects on the coverage of future natural gas demand. This document assesses the potential for energy efficiency improvements associated with European countries and the effect of such improvements on the lessening of the natural gas demand. Once the efficiency improvement potential has been identified, the results of demand coverage in various scenarios of natural gas supply cut-off via pipelines were studied. The expected result reflects the study of the effect of the presumed demand reduction, due to the improvement of energy efficiency, on the self-sufficiency of the natural gas network and the improvement of energy coverage for EU countries. To carry out this study, an evaluation of the current infrastructures was developed, the existing resources were optimized, and the independence of the system was quantified in relation to the current situation of natural gas consumption at the European level. The proposed model has resulted in improvements in the coverage of the demand of certain countries and has detected those with systems that are not robust enough to face extreme crisis situations. The main conclusions are that the natural gas system has improved considerably from 2009 to the present, and that, in the event of massive gas cuts, there is a real risk of being unable to cover the natural gas demand of several countries with a very high dependence on gas from Russia.

1. Introduction

The evolution of non-renewable relative energy consumption in the world has followed different paths in every region, according to recent statistics from the BP annual review [1] and the World Bank [2]. In general terms, the overall non-renewable energy consumption in the world increased by about 60% in the period of 1990–2020, while the world population soared by almost 2.5 times and the GDP increased by 1.5 times in this period. This trend shows a decoupling of energy consumption versus GDP and population growth worldwide. However, the objective of keeping fossil fuel consumption flat has not been met. Indeed, the non-RES energy consumption per currency unit of GDP has increased since 2002 in percentual terms, as has the per-capita consumption since 2002, until the COVID-19 pandemic in 2020 (see Figure 1).
The situation in Europe shows better figures, with a non-RES energy consumption decrease of 16% (COVID−19 slump excluded). The GDP grew in Europe by 75%, while the population went up by 5% during that period. Therefore, there was a clear improvement in terms of per-capita and per-currency-unit non-RES energy consumption across the continent that provided room for an absolute decrease in energy consumption despite the GDP and population growth in that period (see Figure 2).
The better performance of the European region with respect to other regions of the world can be explained by three factors. First, the already high quality of living standards and the low vegetative growth do not exert much pressure on the absolute energy consumption increase; second, the transition from an industrial production economy to a service-based economy is helping to drive down the energy consumption per currency unit; third, the ambitious decarbonization targets set by the European Commission with the 20/20/20 objectives for 2020 have led to a push for country-level strategies to reduce energy consumption and increase the generation from renewable sources. Figure 3 shows the evolution of RES versus the total primary energy consumption in this period. Europe leads the statistics; it reached a 10% contribution by 2019, although this was still far below the 20% target.
Highly industrialized countries trigger significant carbon emissions [3]. Restrictive regulation places an important emphasis on companies’ environmental decision making [4]. The European Union has recently defined the Fit for 55 target within the European Green Deal [5].
Beyond the objective of increasing RES, the demand in Europe for energy used for climatization and heating systems for both residential and industrial purposes is covered mainly by natural gas and LNG.
At present, there is currently great uncertainty in Europe as to how to cover the energy demand in the winter months, especially in those countries with energy dependence on developing countries. The current situation exposes an evident and growing uncertainty due to the political and commercial situation in which Ukraine and Russia find themselves, which directly affects the European Union in terms of natural gas supply for energy use.
As can be seen in Figure 4, the EU demand decreased by 20% between 2009 and 2015, at which point it began to remain constant, with minimal fluctuations that are currently maintained. The trend of GN production has been declining since 2000 as well, in concordance with the previously reported analysis that demonstrated a reduction in the use of non-renewable resources in this region. On the other hand, net imports have been increasing since 2000, and it is expected that between 2019 and 2030, they will increase by approximately 15%.
In 2021, the European Union imported around 140 billion m3 (bcm) of natural gas (1 bcm of natural gas, with a calorific value of 43,128 MJ/m3, is equivalent to 11,980 GWh) from Russia throughout the year. In addition, some 15 bcm was received in the form of liquefied natural gas (LNG), adding up to a total of 155 bcm of imported natural gas. This number represented 45% of the European Union’s gas imports and 40% of its total gas consumption [6].
The second gas supplier was Norway. During 2021, this country exported 113 bcm via pipeline to Europe, covering 23% of the total demand. Despite the fact that Norway is a well-positioned country without commercial problems, it is unfeasible to increase their role in gas supply to Europe because they are constrained to 8% [7].
This conflict adds on to the confrontation between Algeria and Morocco in 2021, where the supply of 13.5 bcm1 of gas from Algeria was lost due to the closure of the Algeria–Morocco–Europe gas pipeline. After this event, in 2022, the situation worsened when Algeria interrupted the supply from the only gas pipeline that remained available, with which 8 bcm of gas was provided through the Megdaz pipeline linking Algeria and Europe. This has especially harmed Southern Europe, with Spain being the main affected country, since 45% of its gas energy demand was supplied through this channel [8].
In this context, the European gas system has been steadily reinforced from 2009 to the present, driven by legislative and economic initiatives by European nations. Within this framework, countries have a range of solutions to meet NG demand, influenced by factors like resources, geographic location, and relations with external gas producers.
A nation’s technical capacities for managing NG demand depend on its infrastructure, available resources, and management strategy. These capacities encompass NG production, gas storage, liquefied natural gas (LNG) imports, NG imports from developing countries, and cross-border gas pipelines.
The vulnerability of NG networks correlates directly with the number of existing infrastructures and the diversification of demand. For instance, access to LNG terminals and storage facilities can mitigate the impact of supply disruptions.
Even in cases where LNG facilities are inaccessible due to landlocked geography, various strategies are employed to enhance their interconnections with neighboring nations, thereby facilitating access to LNG infrastructure. Understanding these intricacies is crucial, in the broader assessment of the system’s resilience, to coping with varying changes in gas demand and availability.
The main objective of this work is to develop a study on the robustness of the European gas system to possible changes derived from direct actions that imply an interruption of the gas supply to the European Union by modeling different scenarios, as well as to evaluate the position and resilience of each Union Member State in light of these changes.

2. Bibliographical Review

The introduction delves into an analysis of various factors, including GDP, renewable integration, citizen behavior in relation to energy consumption, and their collective influence on the prospective demand for natural gas. Within this section, we explore three distinct perspectives aimed at fortifying network robustness: considerations of demand security, principles of solidarity and cooperation, and the examination of existing models designed for simulating networks.

2.1. Security of Energy Supply

According to Directive 2009/73/EC of the European Parliament and of the Council [9], security of energy supply constitutes an essential component of public security and is, therefore, intrinsically linked to the efficient functioning of the internal gas market and the integration of the isolated gas markets of the member states. Gas can only reach the citizens of the Union through the network.
One of the resources proposed for regulation purposes is the adaptability of the system for the supply of other energy carriers that collaborate in this energy security strategy. This can also be guaranteed through storage systems and a plan for preventive measures based on the results obtained via different crisis management models.

2.2. Solidarity and Cooperation

The concept of solidarity is directly linked to the need to guarantee basic service coverage to vulnerable consumers in the first place, i.e., residential households and small businesses, and the role of the member states is to ensure this coverage as a public service. In this way, these vulnerable customers should be able to benefit from security of supply and reasonable prices [10]. This social view is considered by green investors in their investment choices [11].
The solidarity mechanism is used as a mechanism of last resort once all emergency measures have been exhausted. Within the European Union, the member state requiring solidarity will have the possibility to opt for the most advantageous offer in case there is more than one option among the offering member states. From this, the concept of customers protected under the solidarity mechanism is created [12].
For its part, the cooperative action is defined to address cross-border situations with the regulatory authority of the concerned member states. In the case of infrastructure to or from a third country, the regulatory authority of the member state in which the first point of interconnection with the network of the member states is located may cooperate with the competent authorities of the third country after consulting the regulatory authorities of the other concerned member states [12]. A clear example of this cooperation and solidarity raised during 2022 in view of the current situation is that countries that do not have storage capacity can have a gas reserve in a neighboring country in a regulated and safe way.
Cooperation can also be regional and include the concept of emergency supply corridors in the simulations offered by crisis management models. With these results, risk groups are defined and preventive action plans and emergency plans are drawn up.
The interconnected system is a way to make up for supply outages or crises due to various reasons such as shortages of the resource, damage to the supply network, or political and commercial conflicts between countries. The latter is one of the most critical scenarios for supply coverage and is addressed in this paper.

2.3. Management Crisis Models

The following is a list, including details, of crisis management models that have been developed in recent years and have contributed to the definition of the model developed in this paper (See Table 1).

3. Methodology

This section describes the simulation model selected to solve the gas demand issue in different proposed scenarios. The countries have been analyzed with the methodology described in the paper “Assessing the Impact of Investments in Cross-Border Pipelines on the Security of Gas Supply in the EU” [21]. To summarize, the countries within the European natural gas system are considered as nodes with technical and capacity information on the country itself. The information for each of these countries includes:
C i : 
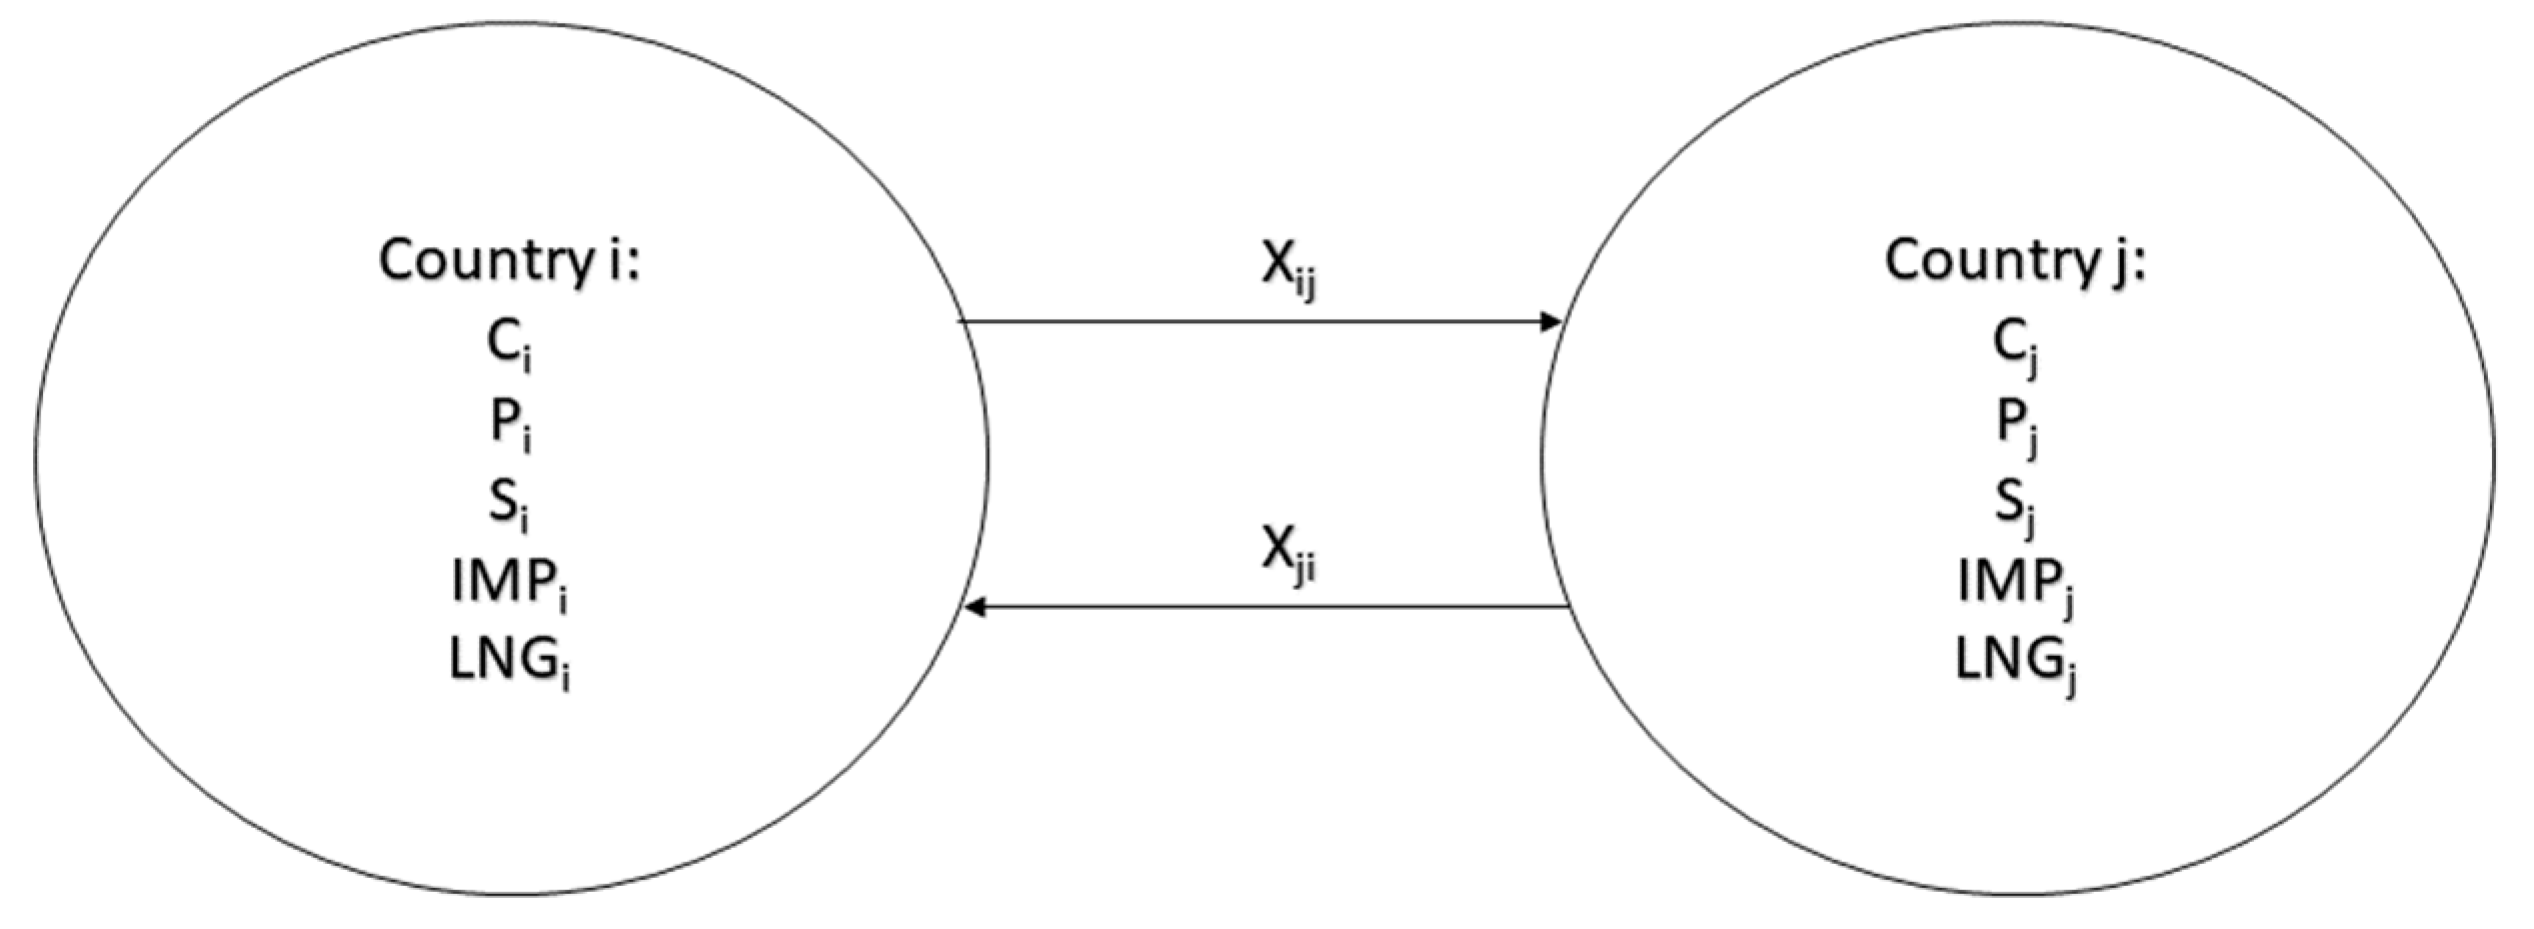
Satisfied daily demand of natural gas in country i;
P i : Daily gas production in country i;
S i : Daily quantity of gas extracted from underground storage in country i;
I M P i : Daily quantity of natural gas entering the system through pipelines from third countries;
L N G i : Daily quantity of liquefied natural gas injected into the pipelines of country i;
X i j , X j i : Daily quantity of gas exchanged via pipelines between countries i and j.
To solve the system, the proposed methodology establishes a linear optimization with the technical and capacity information of each of the countries considered as nodes. The interaction between neighboring countries within the general natural gas system occurs through existing pipelines. These interactions are intended to carry out punctual cooperation and to transfer natural gas from those countries with surpluses to countries that are vulnerable due to gas cuts from countries outside the system. The interaction capacity is measured according to the gas flow and the amount of energy that these countries are able to send and receive from neighboring countries. Natural gas can be exchanged through existing pipelines, as shown in Figure 5.
The model considers each country as a node composed of links that represent the connection with other members through cross-border pipelines, which can be unidirectional or bidirectional. Similarly, natural gas supply resources from developing countries are considered, either by pipelines or maritime routes. The production and storage capacities of each country are also considered in this study.
The exchange of natural gas takes place in two phases.
In the first phase, each country (i) must try to cover the maximum percentage of its domestic demand with its own resources. In this phase, countries that can cover their entire domestic demand and are able to deliver natural gas to neighboring countries through pipelines will be detected. Also, countries that cannot cover 100% of their demand and need cooperation from neighboring countries to avoid energy shortages will be detected.
Countries with a deficit to cover their internal demand:
P i + S i + I M P i + L N G i C i 0
0 S i S i m a x
Constraint 1.
Natural gas I M P i that is imported through pipelines from external countries can enter and transit within the integrated network under study. I M P i m a x is the maximum import capacity. If no regasification infrastructure exists, the I M P i m a x is equal to 0.
0 I M P i I M P i m a x
Constraint 2.
Some countries do not have LNG regasification plants. Therefore, the amount of gas injected into the grid is limited by its maximum capacity   L N G i m a x .
0 L N G i L N G i m a x
Constraint 3.
The amount of natural gas exchanged between countries allows us to solve possible national deficits through solidarity. Therefore, a limited amount of natural gas can be delivered and received via cross-border pipelines.
X j i m a x X i j X i j m a x
Constraint 4.
In the same cross-border pipeline, the natural gas transmission capacity in the i j direction may be different to the j i direction. Therefore, the limits X i j m a x and X j i m a x may have different values. The balance equations between countries i and j are represented in (6) and (7).
N o d e   i :     P i + S i + I M P i + L N G i X i j C i = 0
N o d e   j :     P j + S j + I M P j + L N G j + X i j C j = 0
Constraint 5.
The demand to be satisfied,   C i , ranges from 0 to C i m a x .
0 C i C i m a x
Once the objective function and the constraints of the mathematical problem have been formulated, it can be concluded that the problem is of linear type, because all the variables of the problem are continuous and the equations are linear. The optimization problem was programmed in MATLAB® software, version R2018a.

3.1. Proposed Scenarios

The mathematical model was applied to the EU-28 natural gas system and some neighboring countries (i.e., Switzerland, Serbia, North Macedonia, and Bosnia–Herzegovina) in order to provide possible solutions to collaboratively satisfy the domestic demand of all countries in crisis situations and massive gas cut-offs by the main suppliers. The studied scenarios are listed below:
  • Case 1. Base scenario.
  • Case 2. Massive gas cut-off scenario.
  • Case 3. Extreme scenario with achievement of energy efficiency targets for 2030.

3.1.1. Case 1. Base Scenario

The year 2019 will be used as the base for the analysis of the system’s robustness against massive gas cut-offs. Table 2 shows the technical data for each member of the European gas system for this year.
The gas demand to be covered which was selected for the model, C m a x , was the real consumption on 21 January 2020, which was the day of the highest natural gas consumption at the European level.
In maps of the European gas system, an improvement in the infrastructure was detected with respect to the 2009 configuration. The proposed simulations will evaluate whether this has been sufficient to eliminate the existing bottlenecks.

3.1.2. Case 2. Massive Gas Cut-Off Scenario

The main suppliers of natural gas via pipelines to European countries are Russia, Norway, Algeria, and Libya, with maximum system injection capacities of 9180, 4780, 1870, and 4200 GWh per day, respectively. Considering the interruptions and crisis events that have been occurring since 2009, the model will simulate the European gas system against a massive cut-off of natural gas injected by external countries. Only gas from Norway will be left in the model because there has been no crisis nor geopolitical or commercial events until now. Table 2 shows that the proposed massive cut-off represents 69.5% of the gas from developing countries.

3.1.3. Case 3. Extreme Scenario with Achievement of Energy Efficiency Targets for 2030

Once the current gas system in an extreme situation was simulated, the European gas system was studied for the energy efficiency improvement forecast proposed for 2030 if the infrastructure is maintained. Table 3 shows the expected future demand in the event of achieving the energy efficiency objectives. However, the simulation of this case is based on a hypothetical reduction in the European natural gas demand of 60% with respect to 2019, considering:
  • The increase in biogas that will replace the thermal demand covered by natural gas to date [25].
  • Improved energy efficiency, which will affect 32.5% of energy consumption [26].
  • Exploitation of natural gas infrastructures to inject H2 and carry out a blending of NG and H2 of between 5% and 20% [27].
  • Increase in RES up to 40%, avoiding the use of NG for electricity production [28].

4. Results

This section shows the simulation results of the different proposed scenarios, as well as a brief analysis from the point of view of demand coverage and pipeline congestion.

4.1. Analysis of Demand Response

Table 3 shows the results obtained in the base scenario and the scenarios proposed with respect to the percentage coverage of the system’s real demand. See Table 3.
It can be observed that the optimization model proposed to solve the system cooperatively was able to avoid cut-offs in most of the countries in all scenarios. However, four countries were detected that were unable to cover their demand partially or fully in extreme situations. Bulgaria, North Macedonia, and Greece did not manage to cover 100% of the demand, with 67.5, 47.7, and 89.6%, respectively. On the other hand, Finland would cover 0% of its gas demand in the event of a massive outage.
Once the consequences of a massive gas outage were analyzed, the effect of achieving energy efficiency targets and whether they are able to de-stress the system was assessed. The results show that a 60% reduction in demand compared to 2019 would avoid partial outages, and only Finland would be unable to cover its demand due to the isolation of the gas system.

4.2. Regarding Interconnections

The interconnections between the countries of the European system suffer significant modifications in order to compensate for the elimination of injected gas from developing countries. In the base case, the average saturation of interconnections is 25%, so there are no major bottlenecks for exchanging surplus gas. In the case of a massive gas cut-off, the system cooperates by increasing the percentage of network saturation to 33.4%. The third scenario shows a relaxation in infrastructure congestion, reducing the percentage to 17.7%, lower than the base scenario (see Table 4).

5. Discussion

Considering the analysis of the demand response results, the initial observation suggests that currently, under severe conditions, there might be countries unable to meet 100% of their demand. This highlights that the infrastructures are not adequately prepared to supply sufficient natural gas to all member countries in the event of a total outage. However, in the hypothetical scenario where energy efficiency goals are achieved, this risk is eliminated with the existing infrastructure. This implies that no additional infrastructure investment will be required if the energy efficiency objectives set for 2030 are met.
Our analysis of the results obtained in the evaluation of gas pipeline congestion indicates that in Case 3, congestion was even lower than in the baseline case, which assumes the absence of a supply crisis. Similar to the analysis of demand coverage results, infrastructure congestion improved with energy efficiency without the need for investments in gas infrastructure.

6. Conclusions

In the case of a massive natural gas outage, the demand coverage at the European level would suffer direct effects such as partial outages in countries like Bulgaria, North Macedonia, and Greece. On the other hand, Finland would suffer a total supply cut. In other words, the dependence on imported gas by the EU gas system is very high, and there is no internal alternative except cooperation against outages. Although there have been improvements in gas infrastructure that have enhanced the robustness of the system, it is unfeasible to eliminate all risks of shortages.
The third scenario assumes that the robustness and independence of the natural gas system will be improved through the application of energy efficiency measures, and that the EU countries will be able to achieve the objectives set for 2030. In this scenario, the network will be able to cover the total demand of all EU countries, except for Finland. This is mainly due to Finland’s physical isolation from the global gas system. The system’s robustness improved considerably in the 2030 target scenario, even improving on the 2019 baseline scenario. In other words, the correct implementation of energy efficiency measures in these countries can improve the robustness of the current network.

Author Contributions

Conceptualization, Y.R., L.L. and J.A.; methodology, Y.R.; software, Y.R.; validation, L.L. and J.A.; investigation, V.B.; resources, V.B.; data curation, J.A.; writing—original draft preparation, Y.R., L.L. and J.A.; writing—review and editing, V.B. All authors have read and agreed to the published version of the manuscript.

Funding

This research received no external funding.

Data Availability Statement

The data presented in this study are publicly available and referenced in the references section.

Conflicts of Interest

The authors declare no conflict of interest.

References

  1. British Petroleum. BP Energy Annual Review, 2021; British Petroleum: London, UK, 2021. [Google Scholar]
  2. The World Bank, Environment, Social and Governance Data. World Bank Statistics, 2021; The Word Bank: Washington, DC, USA, 2021. [Google Scholar]
  3. Idowu, A.; Ohikhuare, O.M.; Chowdhury, M.A. Does industrialization trigger carbon emissions through energy consumption? Evidence from OPEC countries and high industrialised countries. Quant. Financ. Econ. 2023, 7, 165–186. [Google Scholar] [CrossRef]
  4. Li, Z.; Huang, Z.; Su, Y. New media environment, environmental regulation and corporate green technology innovation: Evidence from China. Energy Econ. 2023, 119, 106545. [Google Scholar] [CrossRef]
  5. European Commission. A European Green Deal; European Commission: Brussels, Belgium, 2019. [Google Scholar]
  6. International Energy Agency. A 10-Point Plan to Reduce the European Union’s Reliance on Russian Natural Gas; International Energy Agency: Paris, France, 2022. [Google Scholar]
  7. IEA. Global Energy Review 2021—Analysis—IEA; IEA: Paris, France, 2021. [Google Scholar]
  8. ENENERGY. Gasoducto Argelia-España: La Importancia Del Gasoducto Medgaz. Available online: https://enenergy.es/blog/gasoducto-argelia-espana-gasoducto-medgaz/ (accessed on 2 September 2022).
  9. European Parliament. DIRECTIVE 2009/73/EC. 2009. Available online: https://eur-lex.europa.eu/legal-content/EN/ALL/?uri=CELEX%3A32009L0073 (accessed on 12 September 2022).
  10. Council of the European Union. Closer Cooperation and Reinforced Solidarity to Ensure Security of Gas Supply; Consilium Europe: Brussels, Belgium, 2017. [Google Scholar]
  11. Rupsha Bhattacharyya. Green finance for energy transition, climate action and sustainable development: Overview of concepts, applications, implementation and challenges. Green Financ. 2022, 4, 1–35. [Google Scholar]
  12. European Parliament. PE-CONS 58/19. HOLAND. 2019. Available online: https://data.consilium.europa.eu/doc/document/PE-58-2019-INIT/es/pdf (accessed on 6 October 2022).
  13. Lochner, S.; Bothe, D. From Russia with gas: An analysis of the Nord Stream pipeline’s impact on the European Gas Transmission System with the TIGER-Model; Institute of Energy Economics at the University of Cologne Albertus-Magnus-Platz: Cologne, Germany, 2007. [Google Scholar]
  14. Pambour, K.A.; Cakir Erdener, B.; Bolado-Lavin, R.; Dijkema, G.P.J. SAInt—A novel quasi-dynamic model for assessing security of supply in coupled gas and electricity transmission networks. Appl. Energy 2017, 203, 829–857. [Google Scholar] [CrossRef]
  15. Clees, T.; Cassirer, K.; Hornung, N.; Klaassen, B.; Nikitin, I.; Nikitina, L.; Suter, R.; Torgovitskaia, I. MYNTS: Multi-phYsics NeTwork Simulator. In Proceedings of the 6th International Conference on Simulation and Modeling Methodologies, Technologies and Applications (SIMULTECH), Lisbon, Portugal, 29–31 July 2016; pp. 179–186. [Google Scholar]
  16. Ruud Egging and Franziska Holz. Global Gas Model Model and Data Documentation v3.0 (2019). 2019. Available online: www.diw.de (accessed on 19 October 2022).
  17. Szikszai, A.; Monforti, F. GEMFLOW: A time dependent model to assess responses to natural gas supply crises. Energy Policy 2011, 39, 5129–5136. [Google Scholar] [CrossRef]
  18. Lise, W.; Hobbs, B.F.; van Oostvoorn, F. Natural gas corridors between the EU and its main suppliers: Simulation results with the dynamic GASTALE model. Energy Policy 2008, 36, 1890–1906. [Google Scholar] [CrossRef]
  19. Holz, F.; von Hirschhausen, C.; Kemfert, C. A strategic model of European gas supply (GASMOD). Energy Econ. 2008, 30, 766–788. [Google Scholar] [CrossRef]
  20. Zaccarelli, N.; Rodriguez-Gomez, N.; Pambour, K.; Bolado-Lavin, R. Towards EUGas-26: The European Gas Assessment model for EU Directive 2008/14/EC and EU Regulation No 994/2010. Int. Gas Res. Conf. Proc. 2014, 2, 1198–1206. [Google Scholar]
  21. Rqiq, Y.; Beyza, J.; Yusta, J.; Lavin, R. Assesing the impact of investments in Cross-Border Pipelines in the Security of Gas Supply in the EU. Energies 2020, 13, 2913. [Google Scholar] [CrossRef]
  22. European Network of Transmission System Operators for Gas—Gas Infrastructure Europe. System Development Map 2019/2020. Brussels. 2020. Available online: https://www.entsog.eu/sites/default/files/2021-01/ENTSOG_GIE_SYSDEV_2019-2020_1600x1200_FULL_047.pdf (accessed on 19 October 2022).
  23. European Network of Transmission System Operators for Gas Facilitating Cooperation between National Gas Transmission System Operators to Achieve European Union Energy Goals European Network of Transmission System Operator for Gas. The European Natural Gas Network 2019. 2019. Available online: https://www.entsog.eu/sites/default/files/2020-01/ENTSOG_CAP_2019_A0_1189x841_FULL_401.pdf (accessed on 19 October 2022).
  24. Gas Infraestructure Europe. Aggregated Gas Storage Inventory. 2022. Available online: https://agsi.gie.eu/ (accessed on 19 October 2022).
  25. European Biogas Association. Biomethane Production Potentials in the EU. A Gas for Climate Report. July 2022. Available online: https://www.europeanbiogas.eu/wp-content/uploads/2022/07/GfC_Biomethane-potentials_2022.pdf (accessed on 10 October 2022).
  26. European Council. Gas Demand Reduction in the EU, Infographic. 2023. Available online: https://www.consilium.europa.eu/en/infographics/gas-demand-reduction-in-the-eu/#:~:text=Infographic%20%2D%20Gas%20demand%20reduction%20in,billion%20cubic%20metres%20(bcm) (accessed on 3 November 2023).
  27. Fraunhofer IEE. The Limitations of Hydrogen Blending in the European Gas Grid. 2022. Available online: https://www.iee.fraunhofer.de/content/dam/iee/energiesystemtechnik/en/documents/Studies-Reports/FINAL_FraunhoferIEE_ShortStudy_H2_Blending_EU_ECF_Jan22.pdf (accessed on 6 November 2023).
  28. Eurostat. Energy Consumption in Households. Energy Products Used in the Residential Sector. 2021. Available online: https://ec.europa.eu/eurostat/statistics-explained/index.php?title=Energy_consumption_in_households#Energy_products_used_in_the_residential_sector (accessed on 6 November 2023).
Figure 1. Variation in non-RES energy and population from 1990 to 2020.
Energies 17 00137 g001
Figure 2. Variation in non-RES energy vs. GDP from 1990 to 2020.
Energies 17 00137 g002
Figure 3. RES and total primary energy evolution from 1990 to 2020.
Energies 17 00137 g003
Figure 4. European Union forecast demand.
Energies 17 00137 g004
Figure 5. Natural gas exchange model.
Energies 17 00137 g005
Table 1. Description of management crisis models [13,14,15,16,17,18,19,20].
ModelDate of ModelAgencyMinimum Study PeriodSoftware VersionResults
Gasmod2009DIW Berlin (German Institute of Economic Research)MonthlyNoEconomic optimization of a gas system; numerical resolution of the problem with maximization of global profit and by each country according to the strategy.
Gemflow2011JRC Commission, JRC Institute for Energy, Energy Security Unit (Kwabena)DailyNoInfrastructure analysis and bottleneck detection; probability of meeting demand in crisis situations generated.
Columbus2012EWIMonthlyNoTrade flow projections; infrastructure utilization; investment demand; price developments.
EUgas2014JRC Commission, Institute for Energy, Energy Security UnitDailyNoPhysical evaluation of critical infrastructures; satisfied demand broken down into domestic, industrial, and for electricity production.
MYNTS-Gas2016Fraunhofer InstitutDailyYesEuropean gas network modeling.
NEMO tool2016ENSTOGDailyYesLineal optimization and hydraulic
modeling of national infrastructure to model the European
infrastructure with the most relevant accuracy.
SAInt2017JRC Commission, Institute for Energy, Energy Security Unit (Kwabena)DailyYesDevelopment of parameters to quantify the impact of interruptions on security of supply; implementation in the innovative SAInt simulation tool to evaluate security of supply; detailed information on the weather and propagation of contingencies.
GAMAMOD2019Technische Universität Dresden (EE2)DailyNoOptimal European supply structure; use of natural gas infrastructures; minimization of system costs.
GGM (Global Gas Model)2019Franziska Holz (DIW Berlin)MonthlyYesAnalysis of gas pipelines, liquefaction, regasification, storage, and utilization extensions; production, consumption, trade, and seasonal prices.
Simple Optimization Model2020Universidad de ZaragozaDailyYesOptimal management of gas infrastructures to improve the response of the system in situations of energy crisis.
System Development Map2021ENSTOGDaily/MonthlyNoGas infrastructure and capacity information; historical gas demand, supply, and storage; deliverability achieved.
Table 2. Base scenario. Technical data of countries based on existing infrastructure of 2019 (GWh/day) [22,23,24].
NodeCountryCmaxPmaxPmax (Forecast)SmaxIMPmaxIMPmax (Extreme Condition)LNGmaxXij maxXji max
201920192030201920192019201920192019
1PT2550.0040.885.680.00020080.00144.00
2ES14961.53239.36200.48732.0001911.00368245.00
3FR28321.35453.122416.565905908096931783
4IT3699173.77591.842898.27155806016702103
5CH1810.0028.960.000.0000.009041051
6DE4888206.87782.086442.45421312400.0055365191
7BE9120.00145.92169.50488.00047724922679
8NL16491351.61263.842942.380.0048841833371145
9DK96128.6015.36180.90.009630.004124
10AT4693075.041057.70.0000.0020522114
11CZ465574.4529.40.0000.0025052706
12PL739135.01118.24543.0613360158.00932262
13LT790.0012.640.00325.00012218265
14LV420.006.722466300.0017068
15EE160.002.560.002700.004010
16SK26613.5242.56491.562028.0000.0023811721
17HU61850.3498.88839.7151700.00347381
18SI450.007.20.000.0000.0076149
19HR1422722.7260.57 0.0000.0057131
20BH110.001.760.000.0000.000.0015.00
21RS126 14.2720.1656.50 0.0000.0021316
22RO596335.1395.36491.56111400.00872225
23BG132321.1236.2057700.00939892
24MK130.002.080.000.0000.000.0020
25EL2520.0040.320.003990205356118
26IE217112.2534.7227.00 0.0000.000.00385
27UK39721454.12635.52892.331499.001499159712051297
28FI930.0014.880.0022000.00100
Table 3. Results of percentage coverage of real demand in the system based on existing infrastructure on 2019 (GWh/day).
CountryCase 1Case 1
% Demand Coverage
Case 2Case 2
% Demand Coverage
Case 3Case 3
% Demand Coverage
C real C real C real
PT255100%255100%102100%
ES1496100%1496100%598100%
FR2832100%2832100%1133100%
IT3699100%3699100%1480100%
CH181100%181100%72100%
DE4888100%4888100%1955100%
BE912100%912100%365100%
NL1649100%1649100%660100%
DK96100%96100%38100%
AT469100%469100%188100%
CZ465100%465100%186100%
PL739100%739100%296100%
LT79100%79100%32100%
LV42100%42100%17100%
EE16100%16100%6100%
SK266100%266100%106100%
HU618100%618100%247100%
SI45100%45100%18100%
HR142100%142100%57100%
BH11100%11100%4100%
RS126100%126100%50100%
RO596100%596100%238100%
BG132100%8967.50%53100%
MK13100%647.70%5100%
EL252100%22689.60%101100%
IE217100%217100%87100%
UK3972100%3972100%1589100%
FI93100%00%00.00%
Table 4. Optimal management of the European pipeline network (GWh/day).
Country
i
Country
j
Capacity maxCapacity minCase 1Case 1
% Pipeline
Saturation
Case 2Case 2
% Pipeline Saturation
Case 3Case 3
% Pipeline Saturation
GermanyFrance6090102.8316.90%74.7412.30%100.8416.60%
BulgariaMacedonia2001365.00%6.2131.00%5.226.00%
SerbiaBosnia1801161.10%1161.10%4.424.40%
CzechPoland28019.1368.30%20.2872.40%19.9571.30%
UKIreland385077.7520.20%77.7520.20%00.00%
AustriaSlovenia113065.7658.20%67.1559.40%34.3130.40%
AustriaHungary153060.5939.60%96.7663.20%24.8216.20%
LatviaEstonia168000.00%169.50%6.43.80%
HungarySerbia142066.2346.60%66.2346.60%4.43.10%
FranceSwitzerland258−100122.1547.30%151.1958.60%95.8937.20%
BelgiumNetherlands393−1437−200.7414.00%25.686.50%−47.323.30%
GermanySwitzerland349−1644.851.40%−9.145.60%−45.6927.90%
NetherlandsUK494−168−34.2220.40%−62.5637.20%17.173.50%
SloveniaCroatia54−819.2835.70%25.8947.90%7.3213.60%
AustriaItaly1150−19452.524.60%68.646.00%13.221.10%
HungaryCroatia77−4935.1545.60%28.5437.10%−7.3214.90%
RomaniaBulgaria806−148−4.022.70%779.60%15.221.90%
BulgariaGreece118−65−9.0513.90%20.8817.70%−3.585.50%
GermanyCzech2306−1231169.717.40%391.6717.00%200.078.70%
SlovakiaHungary129−5125.920.10%75.0158.10%−15.9831.30%
FranceBelgium270−85017.586.50%96.7335.80%49.2818.30%
ItalySwitzerland444−6405412.20%38.948.80%22.25.00%
SpainFrance224−16536.9116.50%173.1977.30%28.7112.80%
SpainPortugal144−8000.00%00.00%−11.7914.70%
BelgiumGermany397−320184.5346.50%191.3748.20%156.539.40%
NetherlandsGermany1446−593−157.1826.50%179.912.40%−46.917.90%
UKBelgium652−803−53.636.70%385.8259.20%41.856.40%
GermanyAustria350−390−93.8824.10%−63.8216.40%−123.7431.70%
CzechSlovakia1246−400150.5712.10%371.3929.80%180.1114.50%
LatviaLithuania65−6800.00%−1623.50%−6.49.40%
AustriaSlovakia246−1570−272.7517.40%−296.3818.90%−196.0912.50%
ItalySlovenia28−22−1.486.70%3.7413.40%−8.9840.80%
GermanyDenmark124−4−2.6566.30%−1.8947.30%−1.9247.90%
GermanyPoland234−932−153.5116.50%−20.282.20%−19.952.10%
HungaryRomania77−50−14.8829.80%77100.00%11.7715.30%
Total25.00% 33.40% 17.70%
Disclaimer/Publisher’s Note: The statements, opinions and data contained in all publications are solely those of the individual author(s) and contributor(s) and not of MDPI and/or the editor(s). MDPI and/or the editor(s) disclaim responsibility for any injury to people or property resulting from any ideas, methods, instructions or products referred to in the content.

