Article

Direct Numerical Simulation of Thermal Turbulent Boundary Layer Flow over Multiple V-Shaped Ribs at Different Angles

1
School of Intelligent Systems Engineering, Sun Yat-sen University, Shenzhen 510275, China
2
School of Materials Science and Engineering, Sun Yat-sen University, Guangzhou 510275, China
*
Authors to whom correspondence should be addressed.
Energies 2023, 16(9), 3831; https://doi.org/10.3390/en16093831
Submission received: 17 February 2023 / Revised: 26 April 2023 / Accepted: 26 April 2023 / Published: 29 April 2023

Abstract

:
Direct numerical simulations (DNSs) of spatially developing thermal turbulent boundary layers over angle-ribbed walls were performed. Four rib angles ( γ = 90 ° , 60 ° , 45 ° and 30 ° ) were examined. It was found that the 45 ° ribs produced the highest drag coefficient, whereas the 30 ° ribs most improved the Stanton number. In comparison to the transverse rib case, streamwise velocity and dimensionless temperature in the V-shaped cases significantly increased in the near wall region and were attenuated by secondary flows further away from the ribs, which suggested a break of the outer-layer similarity in the scenario presented. The surprising improvement of heat transfer performance in the 30 ° rib case was mainly due to its large dispersive heat flux, while dispersive stress reached its peak value in the 45 ° case, emphasizing the dissimilarity in transporting momentum and heat by turbulence over a ribbed surface. Additionally, by calculating the global and local Reynolds analogy factors, we concluded that the enhancement in heat transfer efficiency was attributed to an increasing Reynolds analogy factor in the intermediate region as the rib angle decreased.

1. Introduction

Turbulent flows over rough walls are ubiquitous in natural and engineering applications. Roughness significantly alters dynamics of flow and the progress of heat and mass transfer. As a result, the effects of various surface textures, such as longitudinal [1] and transverse ribs [2,3,4], regular and irregular distributed shaped elements [5], and irregular [6,7] roughness, have been extensively studied, through experiments and simulations, over the last decade. Several distinct phenomena caused by roughness, including secondary motions, outer-layer similarity [8], and dispersive flux, have received considerable attention, due to their influences on surface drag and thermal performance. Rough surfaces are widely used in many industrial devices to achieve heat transfer augmentation. However, the presence of rough elements means the flow systems suffer from a remarkable increase in drag, particularly for ribbed surfaces, which is undesirable for energy conservation. Therefore, understanding the complexities of the underlying physics in flow over rough surfaces is of great practical interest and requires further inspection.
Over the last decade, experimental and numerical studies have conclusively demonstrated that roughness with spanwise heterogeneities induces secondary flows [9,10,11]. The secondary flows manifest as high-momentum pathways and low-momentum pathways (HMPs and LMPs), respectively, flanked by counter-rotating vortices in time-averaged streamwise velocity. This differs from the high and low momentum regions observed in instantaneous flow over smooth surfaces. Secondary motions play a dominant role in the roughness sublayers, with their effects extending to several times the height of roughness in the wall-normal direction. This significantly modifies wall shear stress, wall heat flux and other flow properties. For example, Willingham et al. [12] numerically investigated the turbulent boundary layers on surfaces with alternating high and low roughness strips. Their results showed that secondary flows, or LMPs, occur at the junction of two strips. The counter-rotating rollers pump the low momentum fluid to the outer flow, increasing the boundary thickness and Reynolds stress in the cross-section. Moreover, wall stress increases significantly over rough surfaces when the ratio between the heights of two strips increases, or the width decreases, indicating an augmentation in secondary flows. Similar conclusions were drawn by Hwang [10] when investigating turbulent boundary layers over longitudinal bars. The size of secondary motions was found to be mainly determined by the pitch size and width.
Much attention has been devoted to conventional roughness, such as 2D rib-roughened surfaces. Mahmoodi and Wang [13] studied the turbulence on V-shaped and inclined ribs in a square duct and observed distinct mean and secondary flow structures. The pressure drag in the V-shaped rib case was nearly twice that of the inclined rib at a matched Reynolds number. Moreover, the location of the strongest turbulent levels was lower compared to the inclined case, due to the stronger down-wash of high-velocity flow. Fang et al. [14] investigated turbulent flow over V-shaped ribs of different angles using particle image velocimetry and compared this to a transverse ribs case. They attributed the remarkable differences observed in mean velocity, vorticity and Reynolds stresses to the geometrical skewness of V-shaped ribs. Their later study evaluated the influence of angled ribs on turbulent structures using large-eddy simulation. The effect of vortex shedding was attenuated in V-shaped rib cases, whereas angled ribs imposed stronger streamwise elongated vortices. This contributed to higher streamwise momentum immediately above the rib crests and skin friction when compared to that in perpendicular or transverse ribs [15]. They further studied turbulent structures by examining spatial and temporal autocorrelations and found isotropic turbulence in angled rib cases, which clearly differed from that in perpendicular rib cases.
Another similarly rough surface, named convergent–divergent (C–D) riblets, has been well-documented in recent literature. Guo et al. [16] focused on the influence of the C–D riblet wavelength on friction drag. They concluded that the strength of secondary motions first increases and then decreases as the wavelength increases. The strongest secondary flow was observed when the wavelength equaled the channel height. Moreover, factors contributing to drag increase when the wavelength varies. Compared to research on drag, limited attention has been paid to the variation of heat transfer efficiency in the presence of rough elements [17,18].
Significant differences arise in the thermal turbulent boundary layer when the flow is exposed to roughness. Among these differences, skin friction and heat transfer coefficient are the most crucial in practical applications. Wall quantities were demonstrated to have a direct relationship with the outer flow away from the surface in seminal research conducted by Fukagata, Iwamoto and Kasagi [19]. In this research, the skin friction factor of the turbulent channel was decomposed into laminar, turbulent and spatial heterogeneity terms using a method known as the FIK identity. Numerous studies have focused on extending the FIK identity [20,21]. However, the triple integration used in FIK identity suffers from a lack of clear physical interpretation. Renard [22] derived a new decomposition, named RD identity, by integrating the mean streamwise kinetic-energy budget equation. Recently, Guo [16] employed the RD identity to study the influence of secondary flow on drag augmentation of turbulence over convergent-–divergent riblets with different wavelengths. The contribution from the wake component to drag and the intensity of the secondary flow motion was enhanced with increasing wavelength. The aforementioned studies primarily investigated the impact of transverse and longitudinal ribs on wall turbulence. These studies concluded that the pitch size, height, and width of the ribs exert the greatest influence on the turbulent transport of momentum and heat. In contrast to a conventional 2D rough wall, surfaces with V-shaped ribs enhance drag and heat transfer through more complex mechanisms. Both drag and secondary motion play indispensable roles in fluid vortical motion. Additional parameters, such as wavelength and rib angle, also have significant impacts. Previous studies on V-shaped ribbed walls have primarily focused on the spatial distribution of mean and high-order flow statistics [13,14]. To the best of the authors’ knowledge, less attention has been paid to secondary motion and its influence on the drag coefficient and Stanton number, as well as its influence on the local Reynolds analogy factor in thermal turbulent boundary layer flow. In light of this, we conducted a comprehensive study on the contribution of secondary motions to the total drag and heat transfer coefficient in V-shaped ribbed turbulent boundary layers (TBLs) using the RD identity and examining the dissimilarity between momentum transport and heat transfer.
To further understand the influence of rib angle on drag increase and heat transfer augmentation, we performed direct numerical simulations (DNSs) of three V-shaped rib cases at different angles, with a transverse rib case as the baseline. Section 2 describes the numerical details and the averaging method. Section 3 presents the investigation on the total drag and heat transfer coefficient along the flow direction and the spatial distribution of mean velocity and temperature to examine the influence of ribs on the flow structure and heat transfer performance. We also analyze Reynolds stress and wall heat flux profiles by focusing on the effects of secondary motions and decomposing the drag coefficient and Stanton number. Moreover, global and local values of Reynolds analogy over ribs are compared to investigate dissimilarity in turbulent transport of momentum and heat caused by ribs. Finally, Section 4 provides the conclusions.

2. Methods

This section describes the geometry configurations and numerical details used in the simulations presented.

2.1. Geometric Model

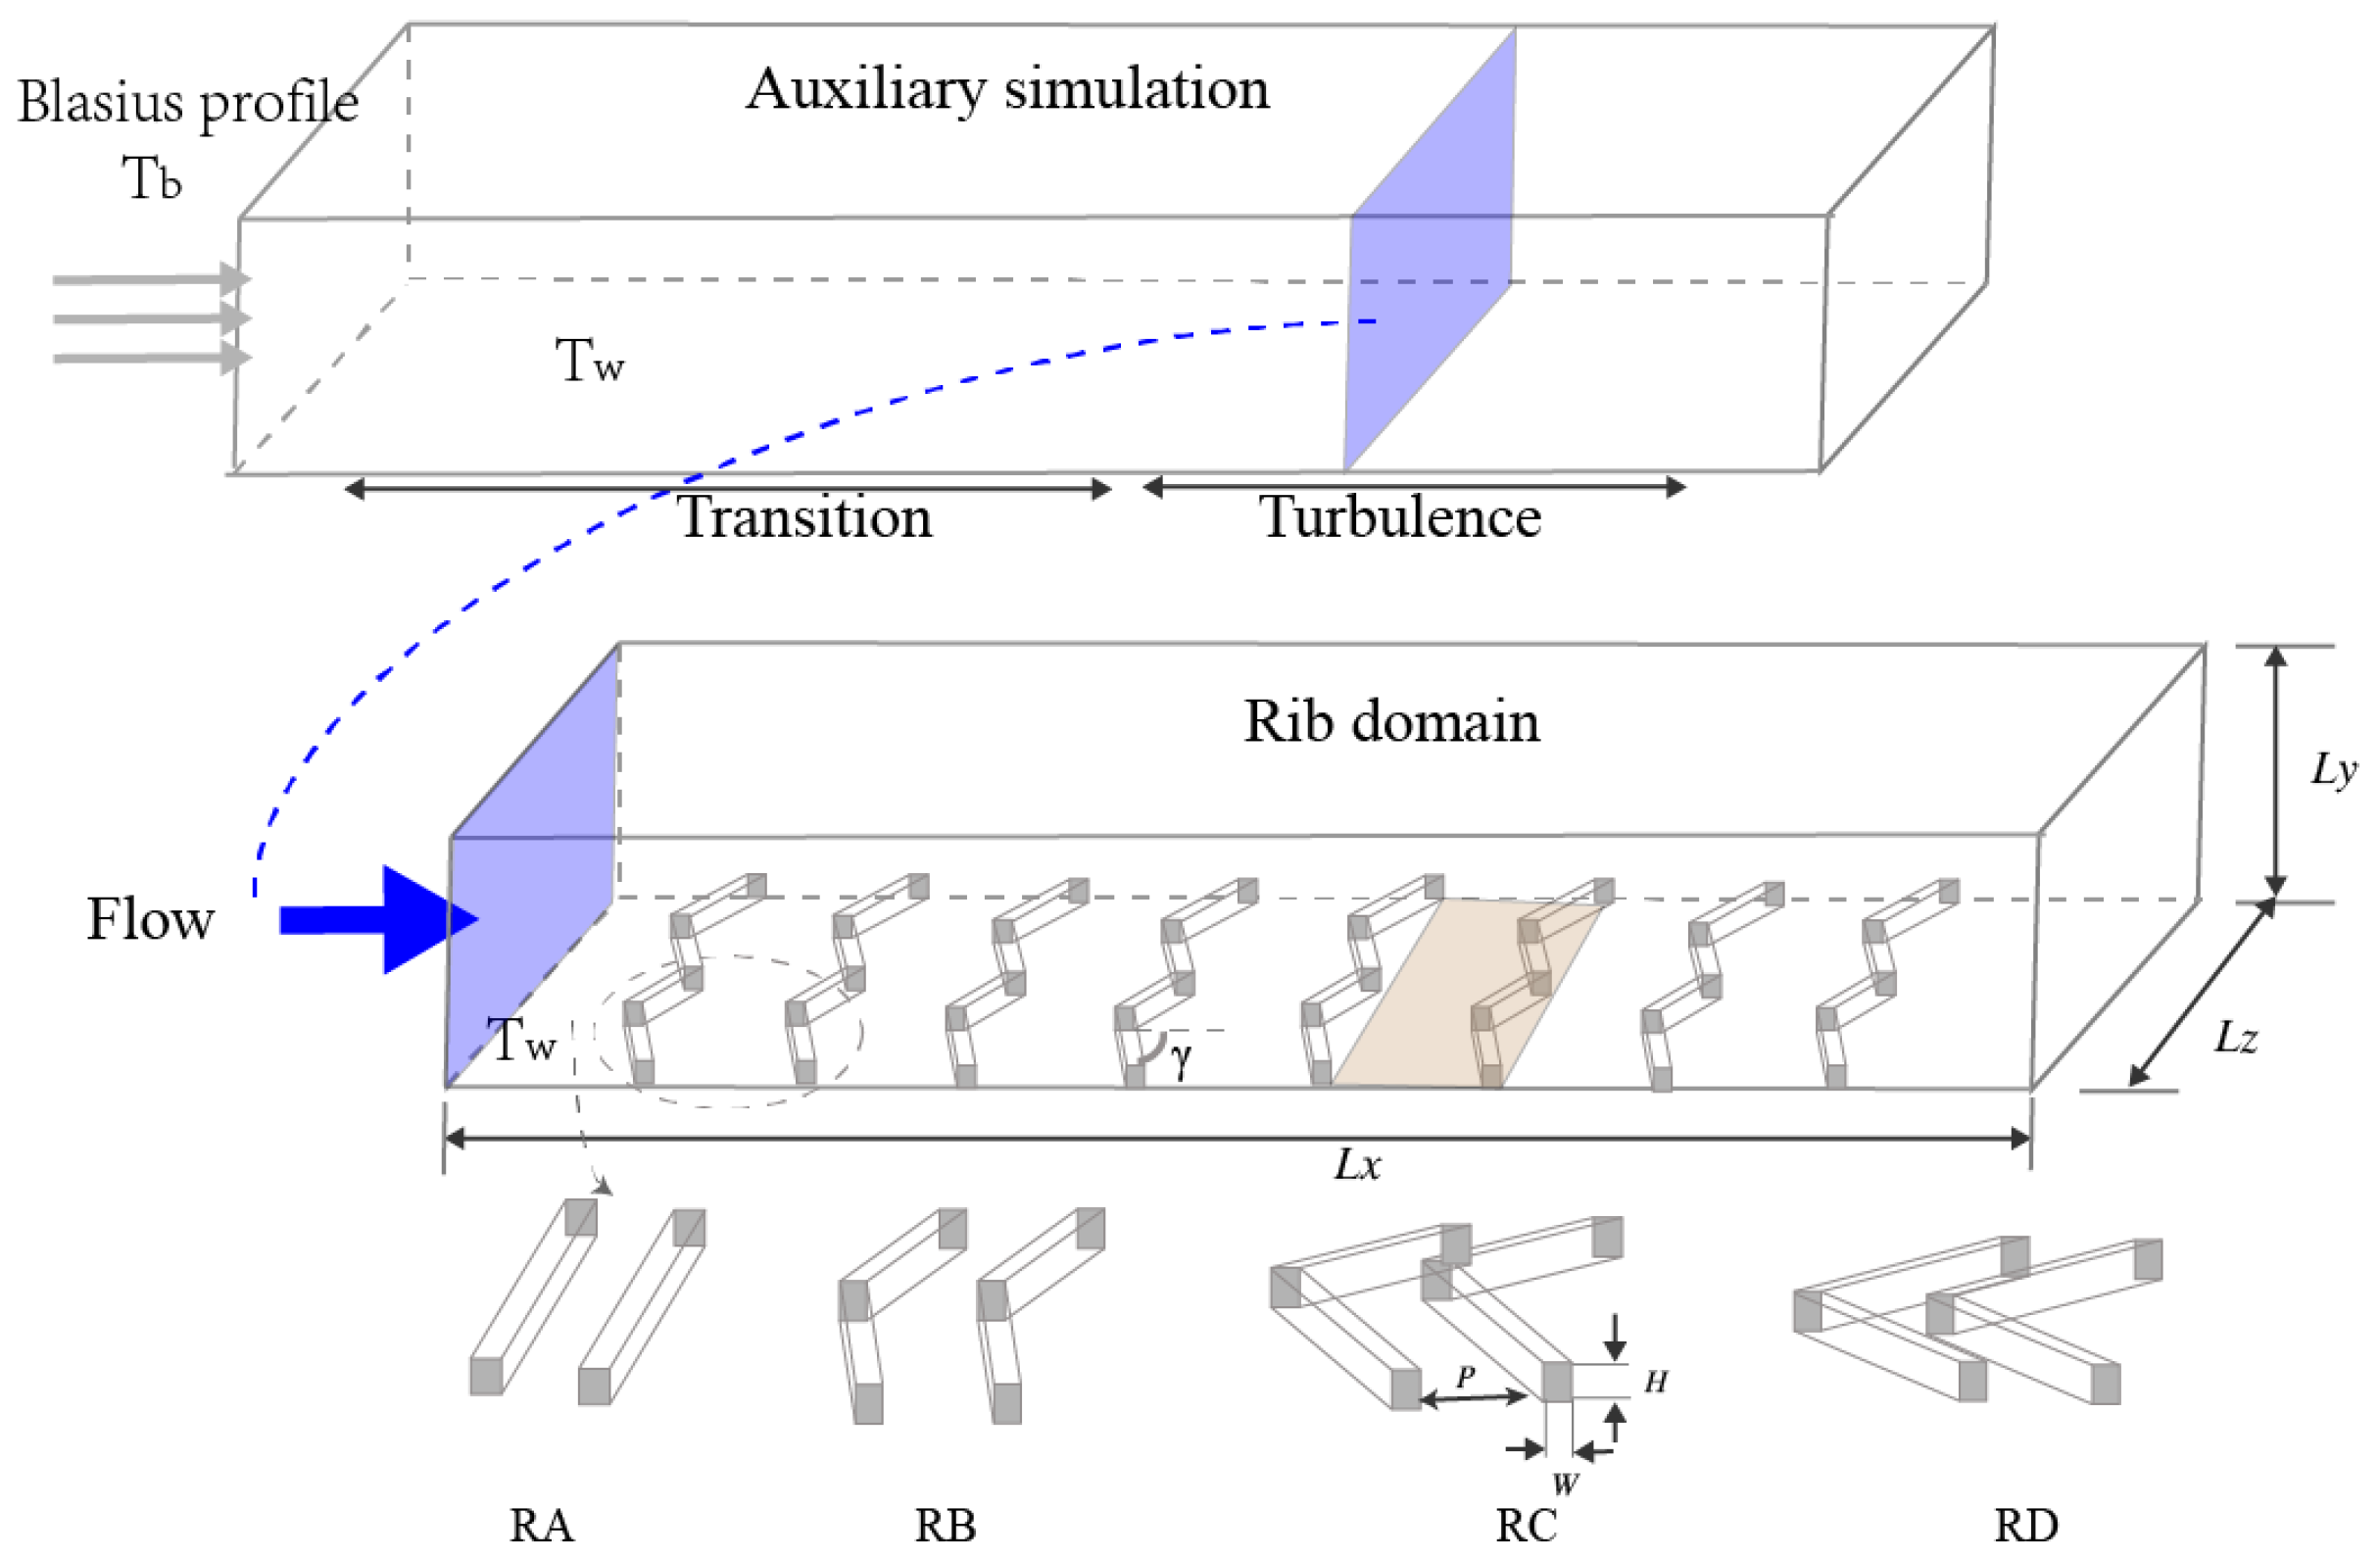
In the current study, DNSs were performed using an auxiliary simulation approach [23], where two computational domains are required. The first is an auxiliary region of smooth wall and supplies the inlet velocity and temperature profiles to the second domain, which is composed of multiple V-shaped ribs, as shown in Figure 1. The auxiliary domain is much longer than the second domain to generate a fully developed turbulent flow. A Blasius laminar boundary layer profile, with boundary layer thickness δ 0 , was initialized in the auxiliary domain, and then instantaneous velocity and temperature fields at the target position were extracted as the inflow condition of the rib domain. Four simulations were conducted: one for a transverse bars case and three for V-shaped ribs cases. he lengths of the rib domain were set to L x × L y × L z = 44 δ 0 × 10 δ 0 × 10 δ 0 . The height of the ribs H and the width of the ribs D were both set to 0.2 δ 0 , and the pitch value P, which denotes the distance between two adjacent ribs in the streamwise direction, was set to 1.4 δ 0 . Here, δ 0 was the initial boundary layer thickness set in the auxiliary domain.
The angle of ribs ( γ ) was the only varied parameter and was set at 60 ° , 45 ° , 30 ° in RB, RC and RD, respectively. Although the transverse ribs case can be treated as a specific case with a rib angle equal to γ = 90 ° , significant differences in turbulence statistics exist between the transverse rib case and the real V-shaped rib cases. These differences suggest that the angle of ribs is an important underlying mechanism influencing momentum and heat transport, as discussed in Section 3.

2.2. Numerical Method

The non-dimensional governing equations for incompressible fluid with heat transfer can be expressed as
u i x i = 0
u i t + u i u j x j = d P d x i + ν 2 u i x j x j + f i b m , i
T t + u j T x j = α 2 T x j x j + q i b m
where u i = u , v , w designates the instantaneous fluid velocity components in the i t h direction, where i = x , y , z refer to the streamwise, wall-normal, and spanwise coordinates, respectively, and P is the pressure, ν is the kinematic viscosity, α is the thermal diffusivity, and T is the temperature. For the correspondence with velocity, we adopted the dimensionless temperature Θ = ( T T w ) / ( T b T w ) in data processing, where subscript b and w denote the bulk flow and wall quantity, respectively. The terms f i b m , i and q i b m are the source terms derived from the immersed boundary method. Results discussed hereinafter are compared with a similar Reynolds number R e θ ( U b θ / ν ) 2200 . The same Prandtl number P r ( ν / α ) = 0.71 , which was, here, U b is the bulk flow velocity. The momentum thickness θ is defined as 0 δ u ¯ ( 1 u ¯ ) d y . The Richardson’s number is small enough to neglect the buoyancy forces, and temperature is treated as a passive scalar.
The present study simulated spatially developing zero-pressure-gradient turbulent boundary layers using the well-developed Fortran code Incompact3d [24], based on the finite difference method. The first and the second spatial derivatives were discretized by a fourth-order central difference and a sixth-order compact finite difference scheme for momentum and energy equations, respectively. A semi-implicit Adams-Bashforth method was adopted as a time marching scheme with viscous terms in a wall-normal direction integrated implicitly. The solid region was treated using the immersed boundary method (IBM), which allows for the modeling of complex geometries with lower computational resources than body-fitted mesh techniques. One problem that needs to be solved is the emergence of sawtooth waves when using IBM to resolve oblique lines. Different grid resolutions, as shown in Table 1, were chosen in the present study to ensure a straight-line rib boundary during the simulations.
The boundary conditions, other than the inflow condition described in Section 2.1, were the same for all the cases. For the outflow condition, a convective condition u i / t + c u i / x = 0 was applied and a constant temperature T w = 1 and zero velocity were set at the bottom wall. At the top of the computational domains, u = U b , v / y = 0   w / y = 0 , and T b = 0 were imposed [23]. In the present study, the time step Δ t was set to 0.0025 U b / δ 0 . The velocity and temperature fields reached a statistically quasi-steady state after 80,000 Δ t . Subsequently, statistics in RA were collected for an additional 60,000 Δ t , and in V-shaped cases were collected for an additional 80,000 Δ t .

2.3. Double-Averaging Method

The turbulence field variable over 3D rough elements varies in streamwise and spanwise directions. Hence, the double-averaging method, which decomposes an instantaneous variable using a time–space average, was applied to split the effect of spatial heterogeneity and turbulent fluctuation [25]. In Equation (4), an instantaneous variable g is decomposed into the space–time mean component g ¯ , dispersive component g ˜ and instantaneous fluctuation g . Overlines and angular brackets represent the temporal and spatial averages, respectively. Moreover, since both dispersive and instantaneous components contribute to the turbulent intensity, a total fluctuation g is introduced, here, in Equation (5)
g x , y , z , t = g ¯ x , y + g ˜ x , y , z + g x , y , z , t
g x , y , z , t = g ˜ x , y , z + g x , y , z , t
When the spatial-averaging operator is applied, the variables are averaged over spanwise and over one pitch as g y = 1 φ y L W g x , y , z d x d z , where φ y denotes the solid-occupied fraction and LW marks the averaging area [5,16], highlighted with the yellow color in Figure 1. The pitch, with matched momentum thickness Reynolds number, was selected for each case. Using the triple decomposition in Equation (4), the Reynolds stress could be divided into dispersive and turbulent portions, as
u v ¯ = u ˜ v ˜ + u v ¯
The first and second terms correspond to the dispersive shear stress and turbulent shear stress, respectively. Similar operations on the total heat flux in Equation (7) yielded the following decomposition:
v Θ ¯ = v ˜ Θ ˜ + v Θ ¯

2.4. Data Analysis

Some basic and advanced data analyses are reported here, due to the rough elements involved. The rough wall flow drag constitutes the skin friction and pressure or form drag, and individually calculating and integrating the two portions is difficult for some practical rough surfaces. Based on the immersed boundary method, we derived the total drag and heat transfer coefficient in a more direct way using the computed time-averaged IBM forcing terms.
The global drag coefficient, C f , and Stanton number, C h , used in this study are given as:
C f = τ t o t ¯ / 1 2 ρ U b 2 a n d C h = q t o t ¯ ρ U b c p T w T b
where τ t o t ¯ and q t o t ¯ are the double-averaged total wall shear stress and heat flux, respectively, and c p is the specific heat capacity. For turbulent boundary layer flow, the mean shear stress τ ¯ and heat flux q ¯ were varied in the wall-normal direction, and their spatial distribution with respect to the wall-normal coordinate expressed as:
τ ¯ y = ν d u ¯ d y u v ¯ u ˜ v ˜ + y δ F i b m , x d y + 0 y u ¯ d v ¯ d y v ¯ d u ¯ d y d y
q ¯ y = λ d Θ ¯ d y v Θ ¯ v ˜ Θ ˜ + y δ Q i b m d y 0 y u ¯ d Θ ¯ d x + v ¯ d Θ ¯ d y d y
As y approaches zero, the Reynolds stress, including dispersive and turbulent terms, and the last term, representing the growth of the boundary layer, tend to be zero. Then, the wall shear stress and heat flux can be rewritten as τ t o t ¯ = ν u ¯ y w + 0 δ F i b m , x d y and q t o t ¯ = α Θ ¯ y w + 0 δ Q i b m d y , respectively [26]. The friction velocity, u τ , and friction temperature Θ τ , which are used to scale the flow and thermal quantities in inner units, are then calculated as
u τ = τ ¯ t o t / ρ a n d Θ τ = q t o t ¯ ρ c p u τ
Therefore, the viscous length scale is y + = y u τ / ν , where + denotes that the quantity is in inner units.

2.5. Validation of the Numerical Method

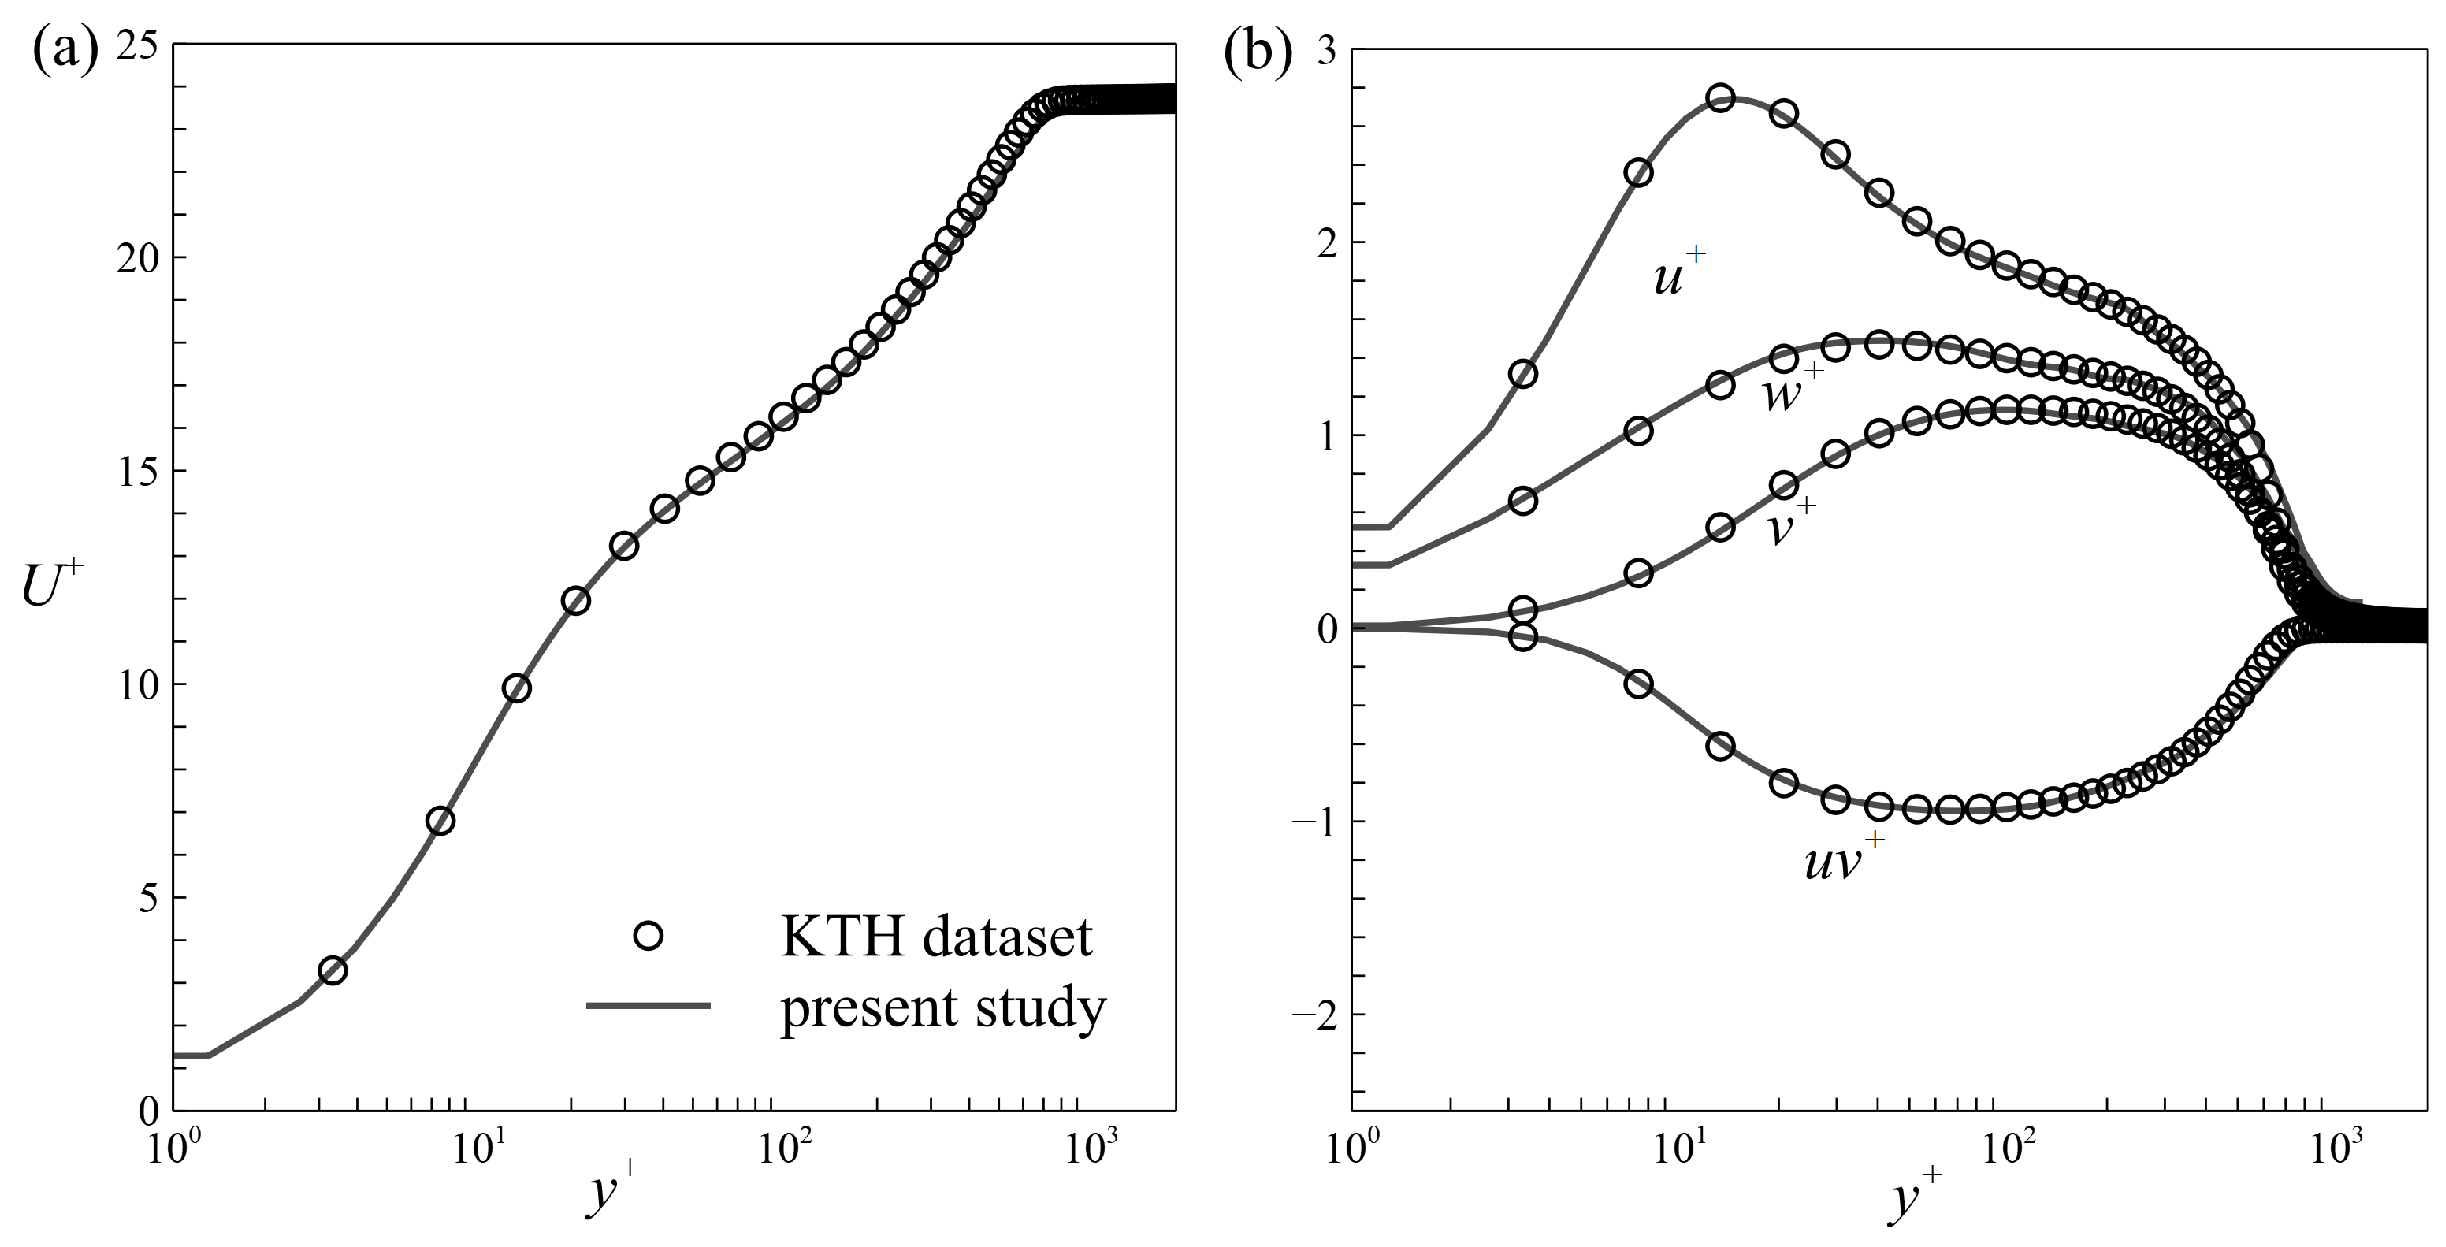
The reliability of the present simulations was validated by comparing the mean streamwise velocity and Reynolds stress profiles over a smooth wall in inner units with a reference dataset [27] in Figure 2. The results showed good agreement between the two datasets, indicating that the DNSs presented had sufficient accuracy. The present simulation employed IBM to enforce no slip velocity and constant temperature conditions on solid surfaces. To validate this approach, a channel flow, consisting of six rib periods at R e τ = 160 and a pitch-to-height ratio of 4, was conducted, identical to the set-up of Nagano et al. [28]. As shown in Figure 3, both the mean streamwise velocity and temperature showed good agreement with their results, demonstrating the reliability of the IBM used in this study.

3. Results

The impact of the rib angle upon turbulence and heat transfer performance is examined, based on global properties and first-order statistics. Next, the characteristics of turbulent momentum and heat transfer are discussed in detail by analyzing the shear stress and heat flux in the cross-sectional plane and decomposing the drag coefficient and Stanton number. Finally, the Reynolds analogy is analyzed to evaluate the heat augmentation performance of different surface regions.

3.1. Mean Statistics

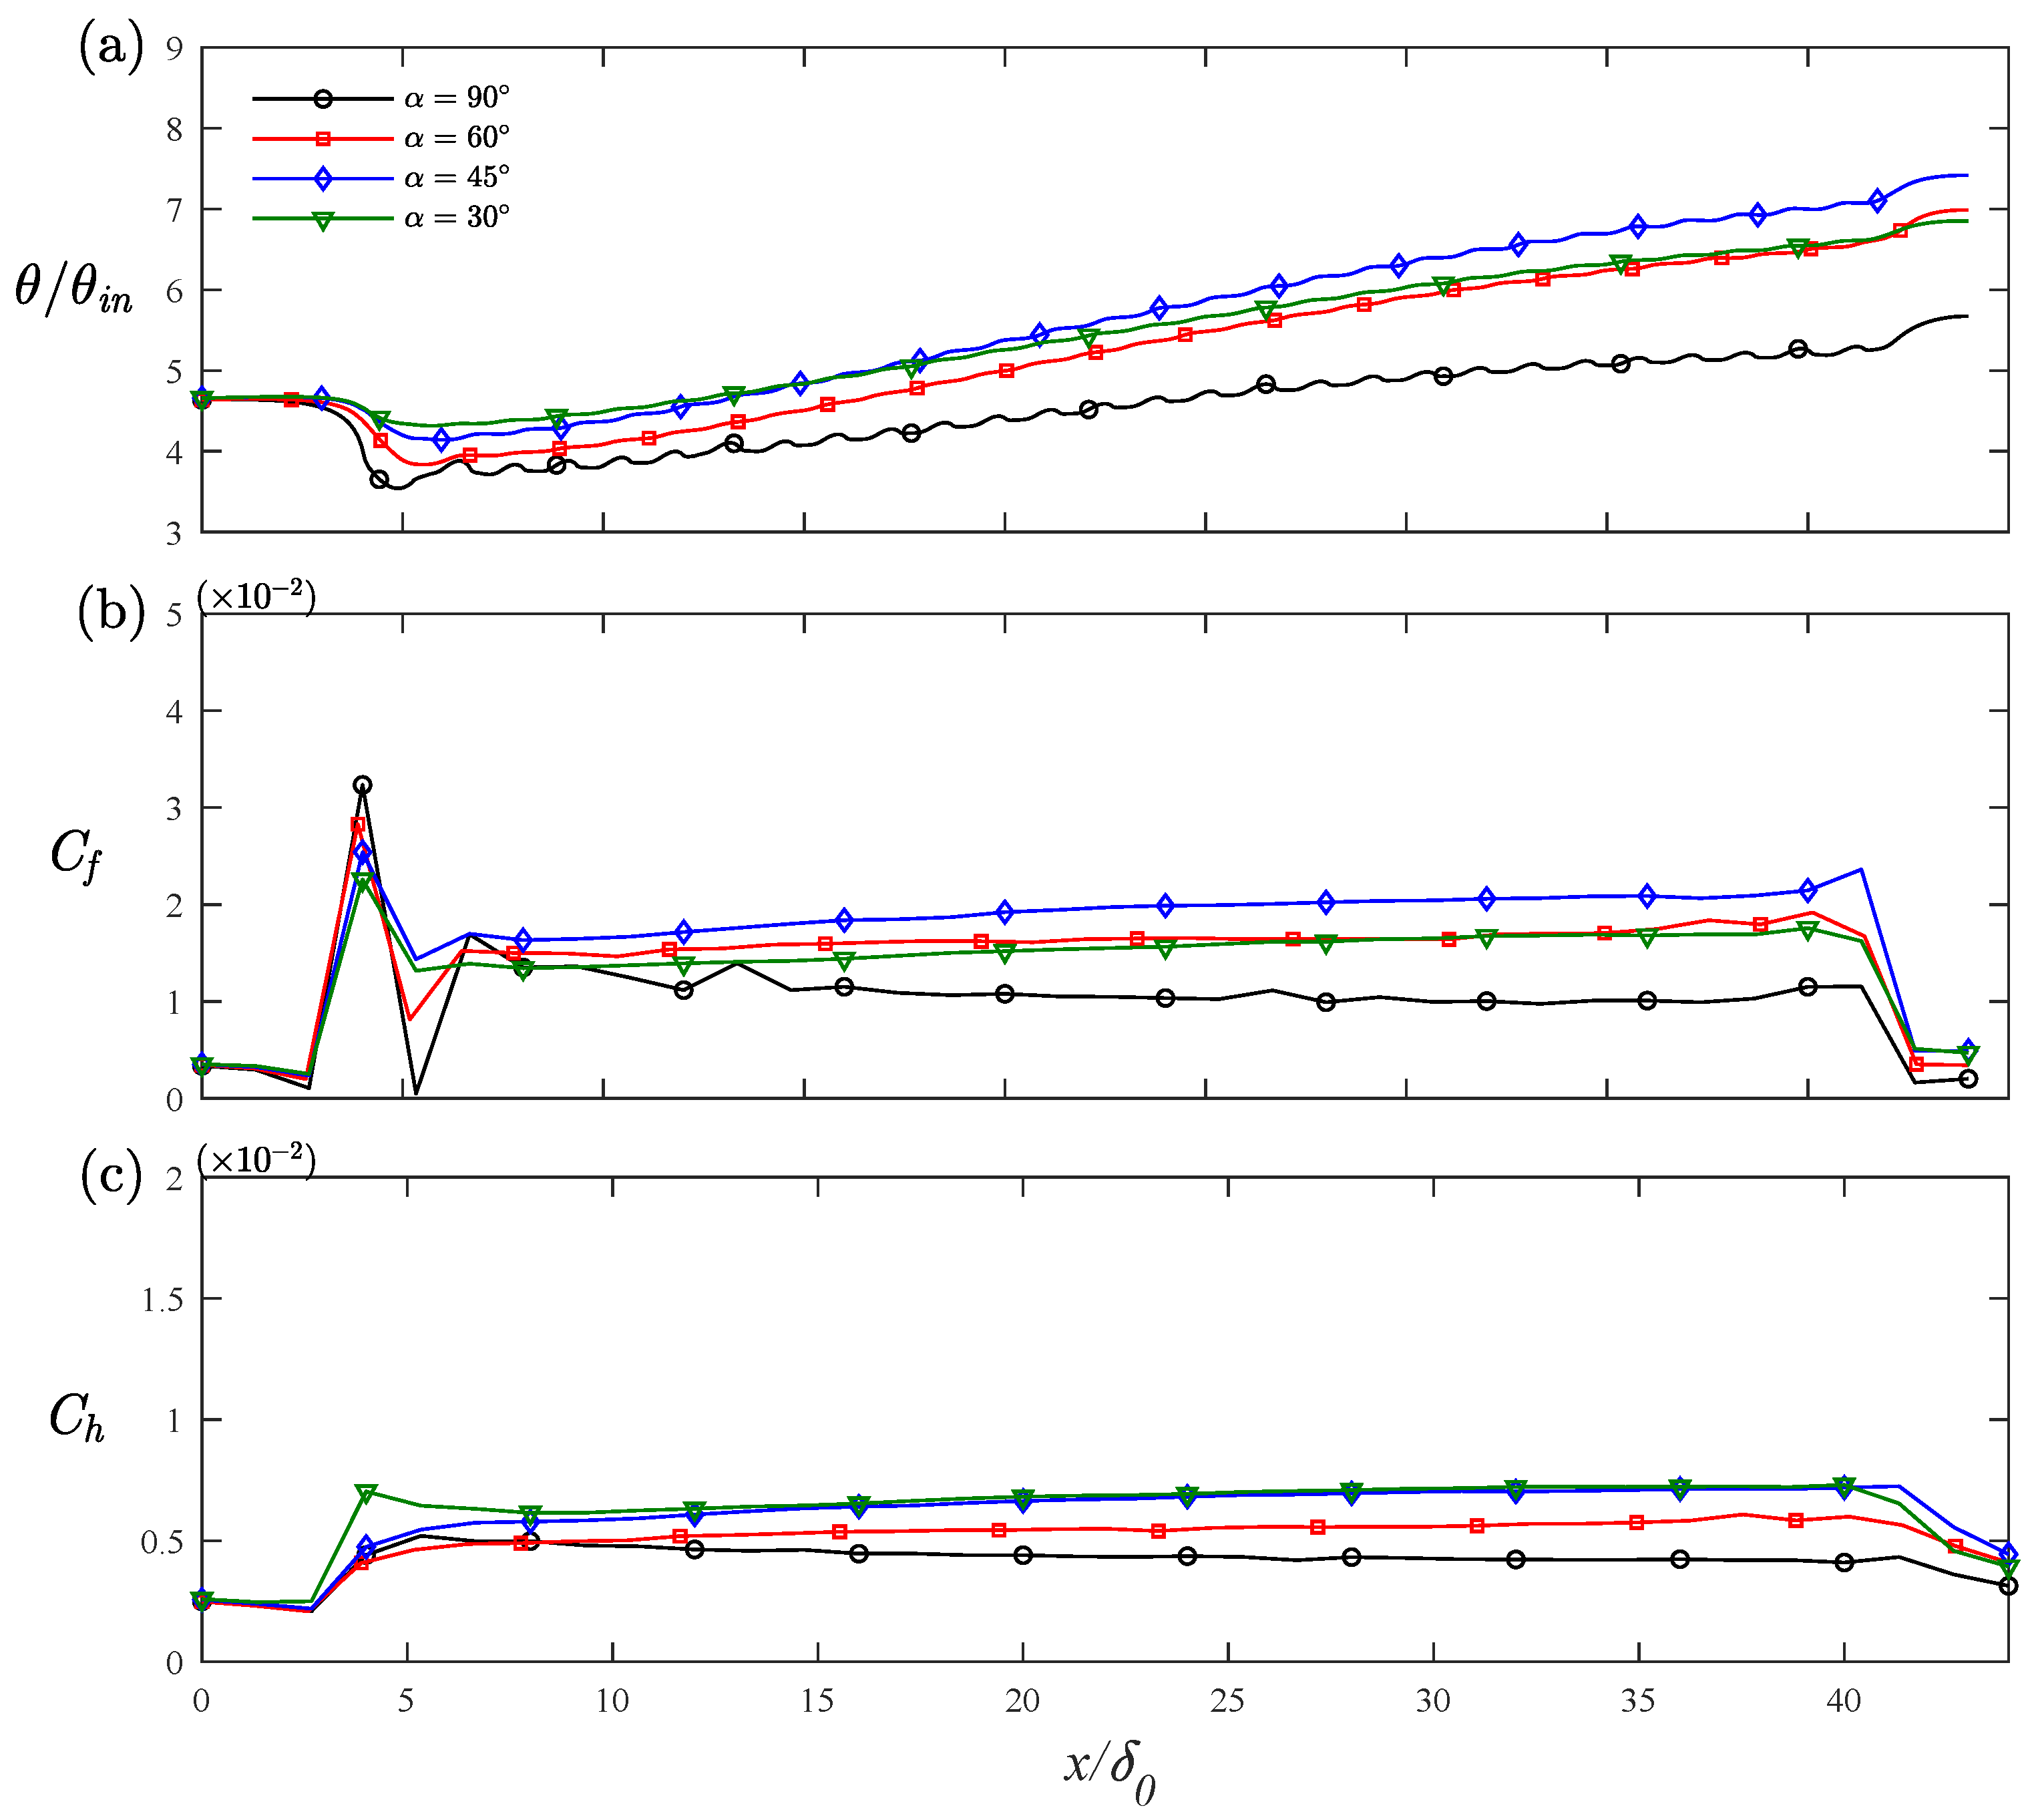
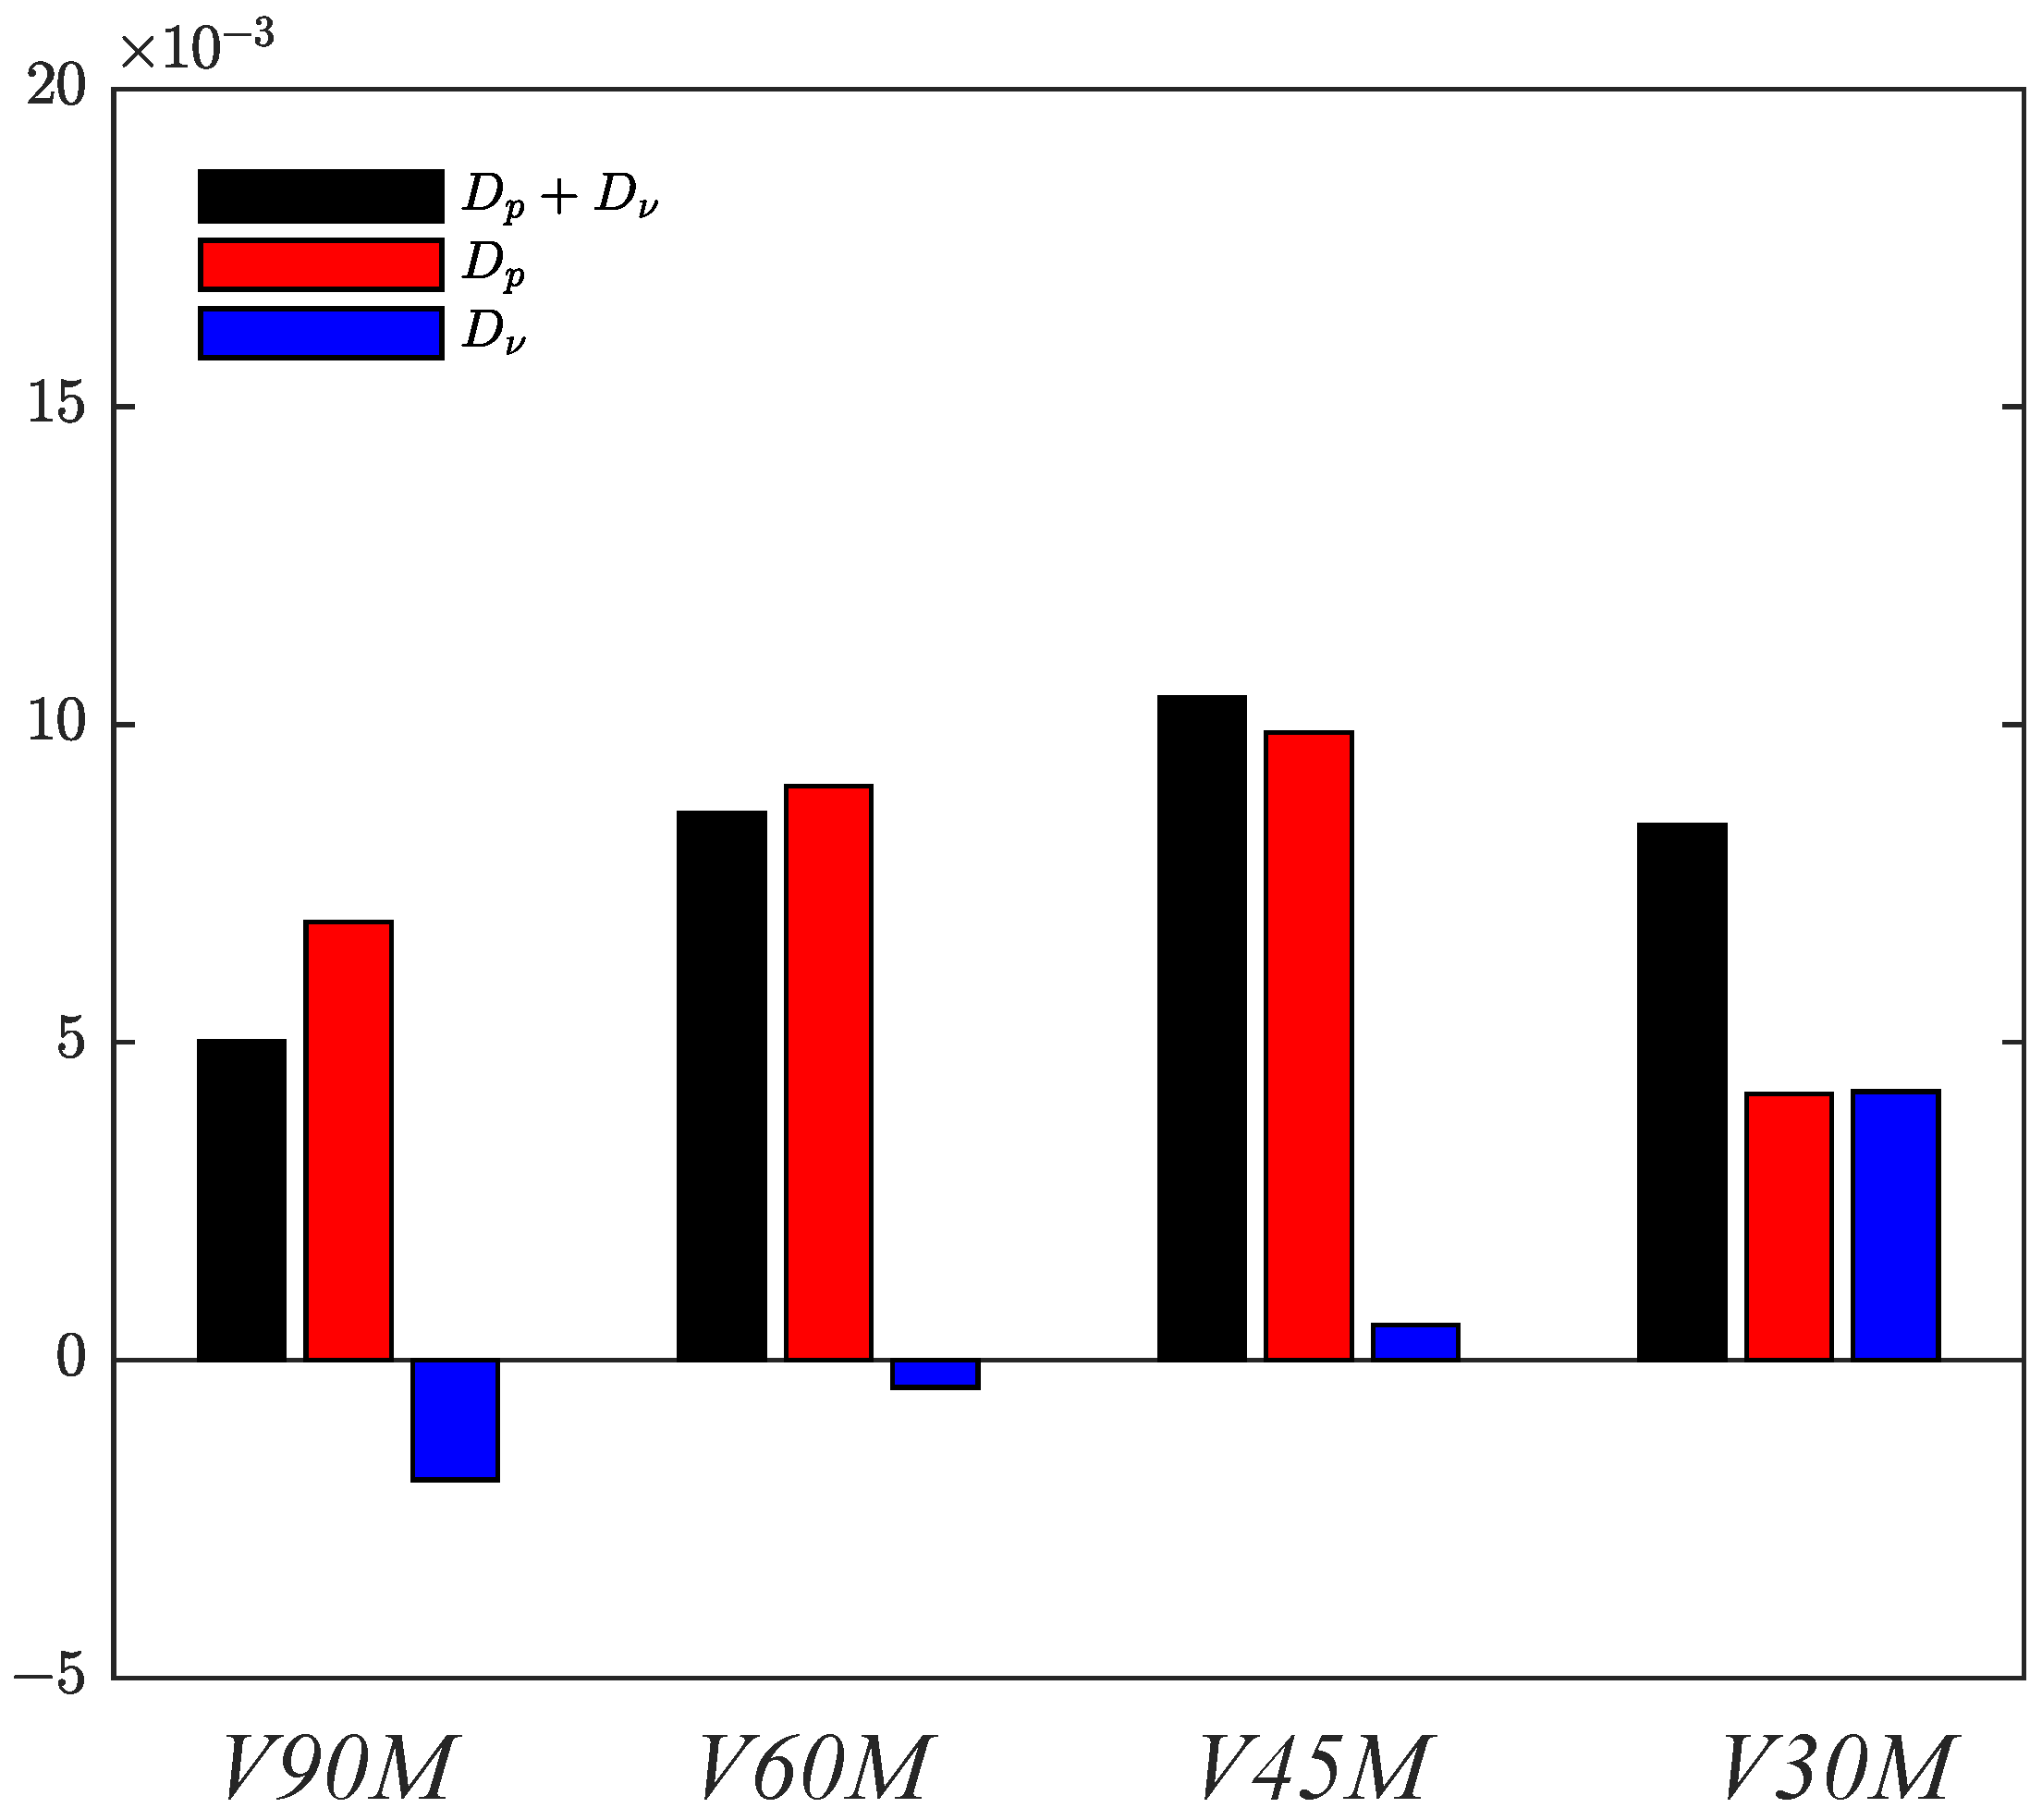
The influence of angled ribs on the overlying flow was assessed by evaluating the evolution of boundary layer momentum thickness θ , drag coefficient C f , and Stanton number C h along the streamwise direction in the rib domain. as shown in Figure 4. Compared to the transverse rib case, all quantities in the V-shaped rib cases substantially increased. The growth rate of momentum thickness increased and then decreased when the rib angle became smaller. A similar trend was also observed for C f and C h . The drag coefficient and Stanton number reached peak values of approximately 0.021 and 0.0073, respectively, in the 45 ° rib case. This non-monotonic behavior may be attributed to reduced pressure, or drag formed and the presence of secondary flows as the rib angle decreased. While similar trends were observed, significant differences existed between the momentum and heat transport. For instance, approximately the same drag coefficients were obtained in cases RB and RD, whereas better heat transfer performance was observed in RD. In order to further illustrate the changes in drag and heat transfer coefficients, Figure 5 was constructed show the comparison between pressure drag D p and frictional drag D ν . For the transverse rib case, drag mainly came from the pressure difference between the windward and leeward walls of the rib. Due to the formation of stable recirculation opposite the mainstream flow direction in the cavity, the drag at the bottom wall was negative, that is, opposite to the direction of the total drag. As the angle decreased, the contribution of pressure drag gradually decreased, and the contribution of viscous drag gradually increased. The variation in viscous drag was nonlinear and changed rapidly when approaching 0 ° and 90 ° . Furthermore, the decrease of drag accelerated when exceeding 45 ° . The decrease in drag from case RC to RD was primarily attributed to the decrease in pressure drag, which greatly exceeded the increase in viscous drag. Heat transfer was not affected by a pressure penalty and was greatly influenced by the mean velocity gradient. As the angle decreased, mean flow velocity increased, leading to an increase in C h from case RA to RC, but when the angle exceeded 45 ° , mean streamwise velocity had no evident change in the near wall region, and, consequently, no significant change was found in C h from case RC to RD.
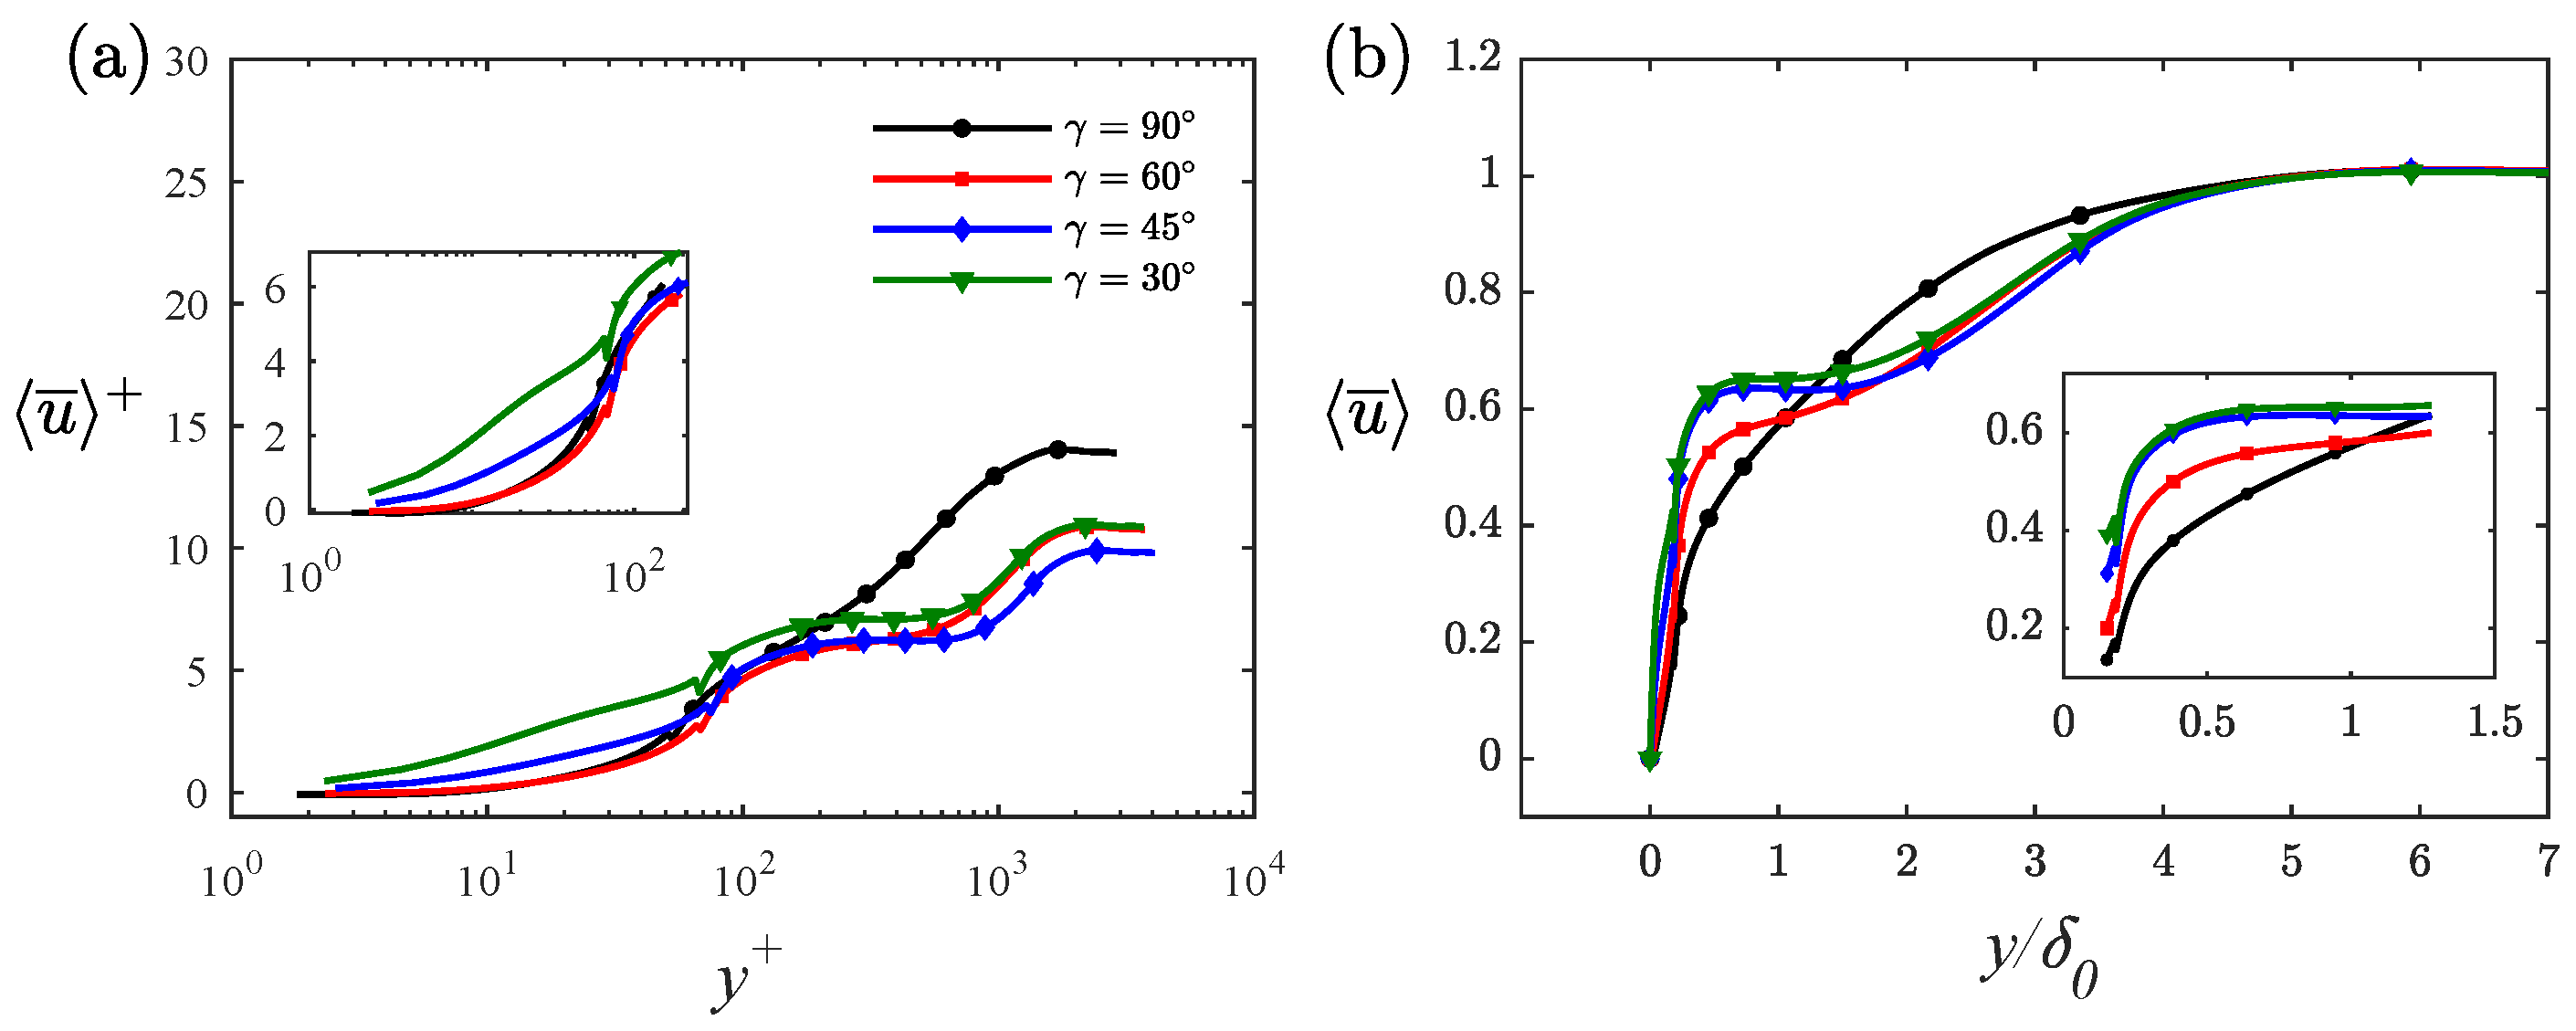
Figure 6 and Figure 7 demonstrate the mean streamwise velocity and temperature profiles in the inner and outer coordinates, respectively. The velocities in Figure 6a were non-dimensionalizedy friction velocity u τ , and showed evident downward shifts, known as momentum defects, due to hindrance from the rough elements. Under the crest of ribs, the maximal streamwise velocity occurred in RD as the rib obstruction reduced with decreasing rib angle. Close above the crest of the ribs, u ¯ , reflected significant improvement for all V-shaped cases relative to that in the transverse rib case. In the plots shown in the small box in Figure 6b, the velocity prominence above the rib gradually increased as the rib angle decreased. The peak occurred in the 30 ° rib case, reaching the value u ¯ / U b = 0.646 at y / δ 0 = 0.6 . Fang reported similar velocity bulges in their study on duct channel flow over aibbed surface. This non-typical behavior indicated the break of wall-similarity under the influence of angled ribs, which was preserved in the transverse rib case and smooth wall turbulence. The enhancement of double-averaged streamwise velocity just above and under the crest of ribs indicated that ribs with sharper angles effectively reduced the obstruction in the near wall regions. The coverage of this region expanded from the wall to approximately y / δ 0 = 1.3 , above which u ¯ was conversely suppressed up to the boundary layer edge. Therefore, we concluded that angled ribs influenced the flow across the boundary layer and that the area of influence could be classified into two regions, depending on whether u ¯ was enhanced or suppressed. We further plotted the mean streamwise velocity differences between V-shaped and transverse rib cases in Figure 8a to highlight the two regions. The enhanced region ranged, approximately, from the wall to y / δ 0 = 1.3 , which was nearly equal to seven times the height of the ribs, and the suppressed region extended from this position to the edge of the boundary layer. The maximal positive velocity difference occurred closely above the rib crests, whereas the maximal negative velocity was positioned at y / δ 0 = 2 . We explain the underlying mechanism leading to these differences in the streamwise velocity when we discuss the flow structure.
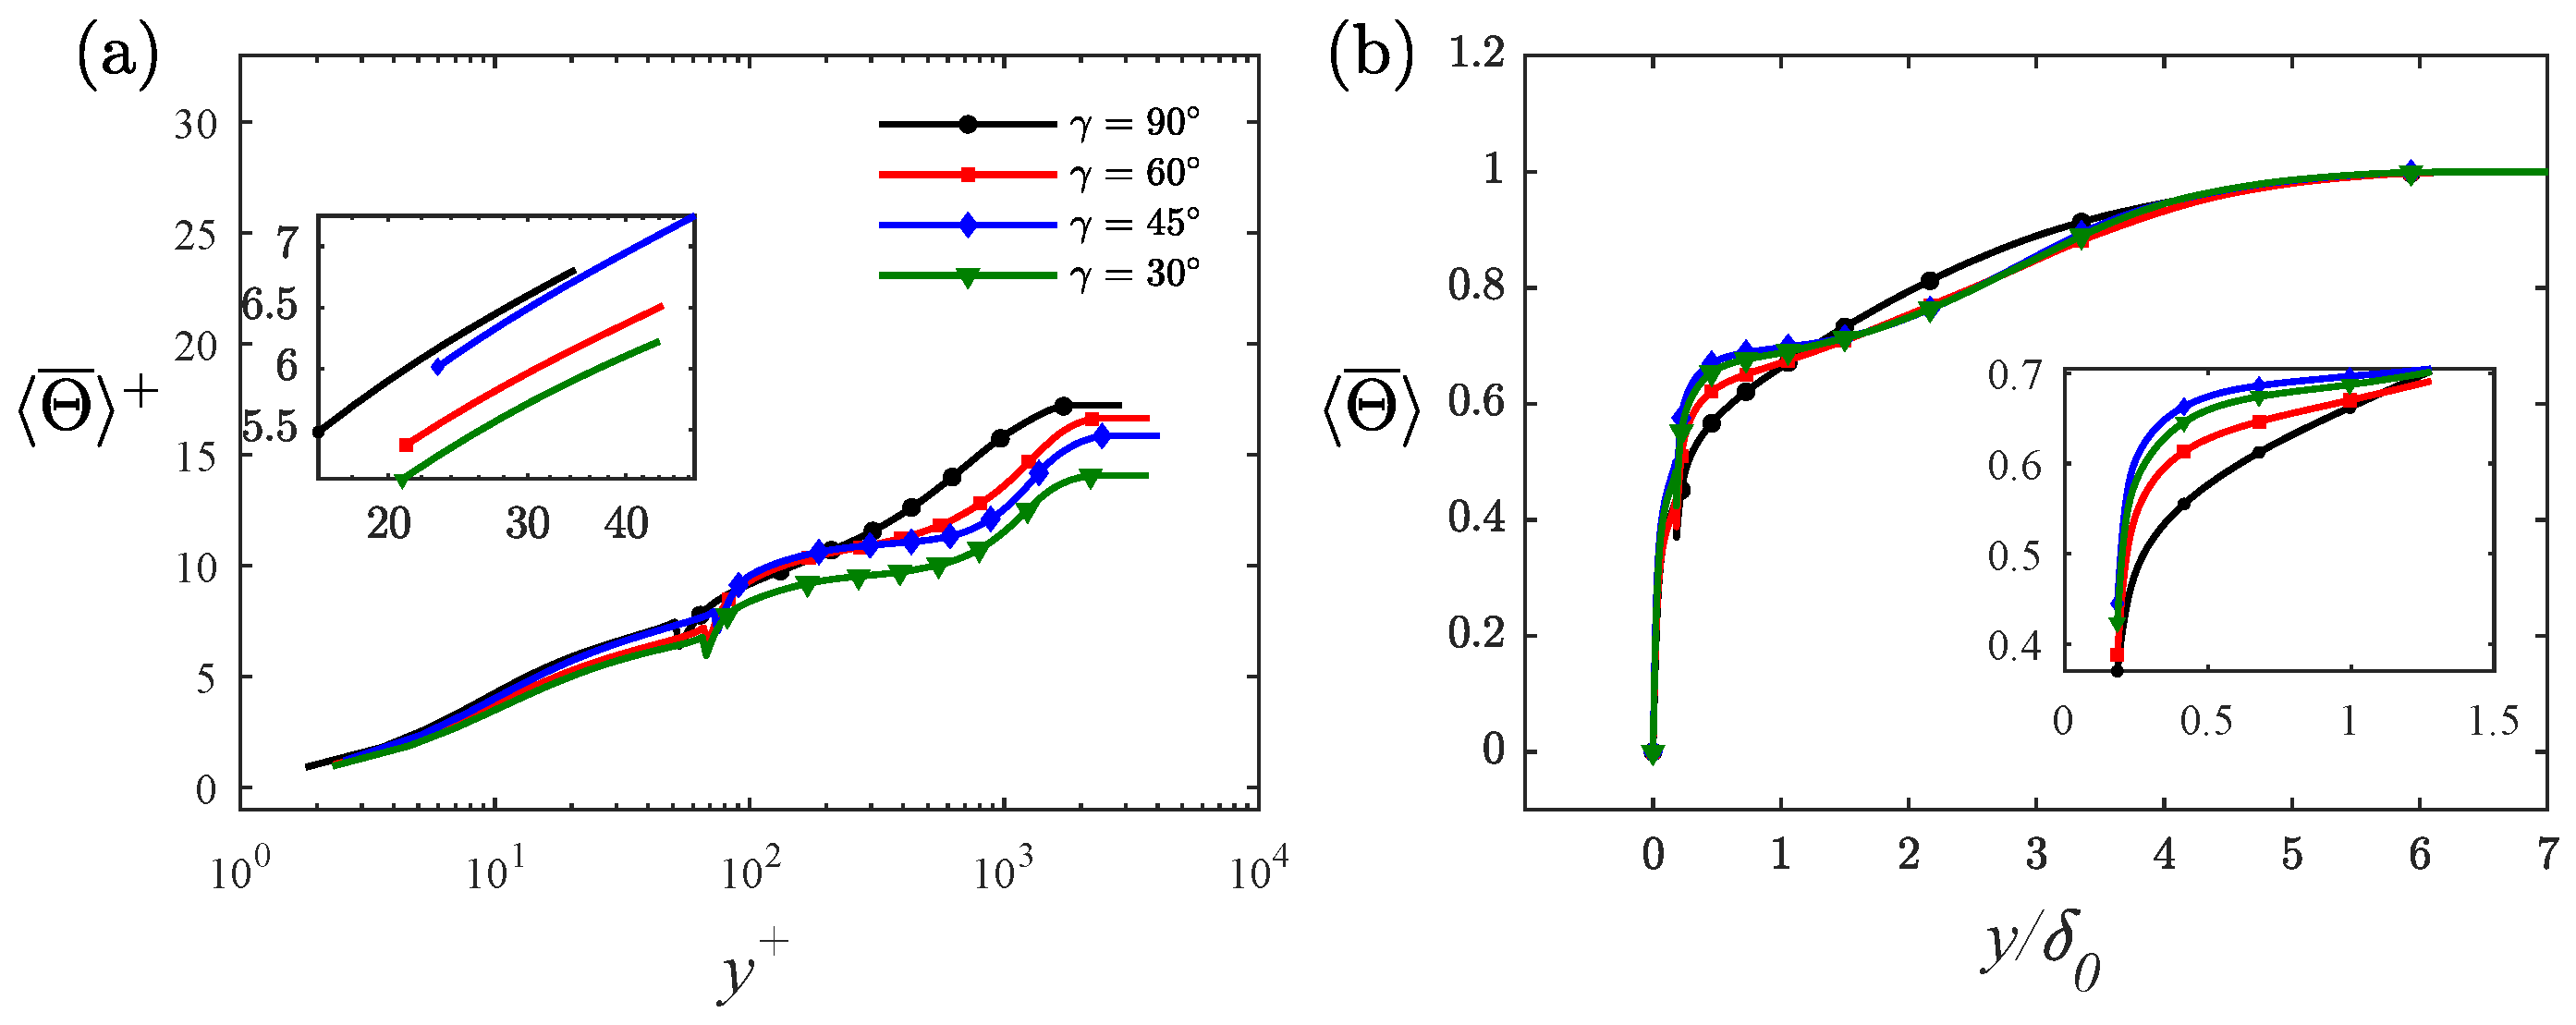
Similarly, we present the dimensionless temperature, normalized by Θ τ , in Figure 7. The maximum value at the edge of the boundary layer is indicative of the heat transfer efficiency for each case, due to the inherent definition of Θ τ , which takes into account both friction velocity and temperature. RD exhibited the highest heat transfer efficiency, while RC had the largest C h , as shown in Figure 4c. As discussed in the velocity flow section, enhanced and suppressed regions were also observed in Figure 8b. The temperature differences were overall smaller compared to streamwise velocity, with a larger difference observed in RC at the crest of the ribs than that in RD,nd the maximal negative difference in RD was significantly larger than that in RC. In regard to the velocity pattern, differences in RD were slightly smaller than those in RC. Moreover, the demarcation points of the positive and negative temperature differences were closer to the wall and located at y / δ 0 1 , equating to a smaller enhanced region in the temperature field. Thus, the larger suppressed region demonstrated the discrepancy in the vertical transport of momentum and heat in the thermal turbulent boundary layer flow over the ribbed surface.

3.2. Secondary Motion

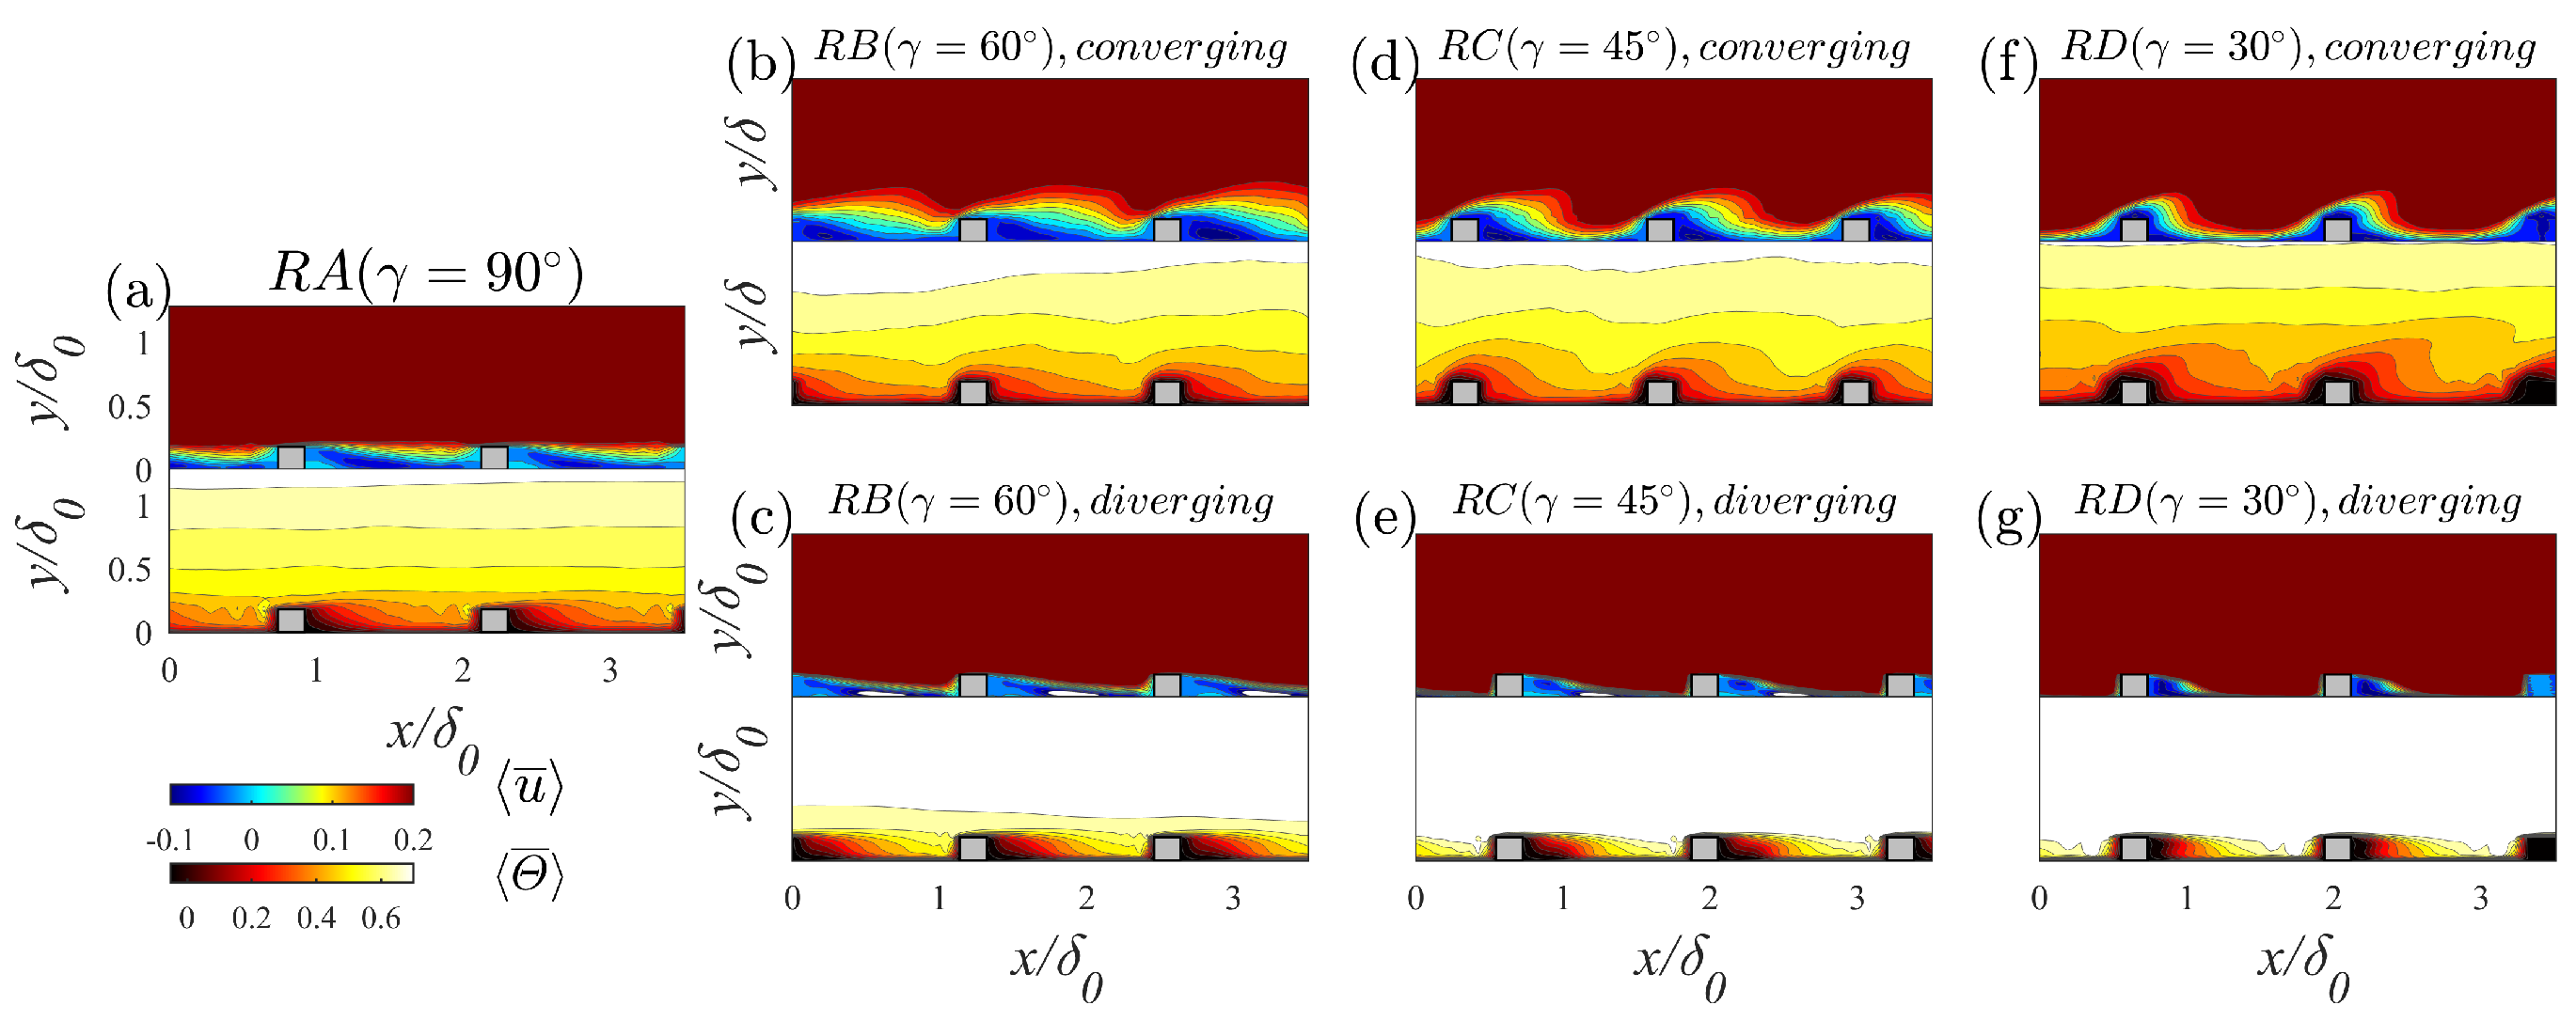
In this section, we present the flow structures and temperature spatial distributions to understand how angled ribs alter flow dynamics. Figure 9 presents a comparison of the mean streamwise velocity and temperature in the x y planes of both converging and diverging areas. These measurements were taken at spanwise coordinates z / δ 0 = 5 and z / δ 0 = 7.5 . In the transverse rib case, a shear layer was present n the crests of the ribs and recirculation occurred in the cavity between the two ribs, consistent with findings in previous studies [15]. For the V-shaped rib cases in the converging area (Figure 9b,d,f), the strength of the recirculated flow in the cavity under the crests of the ribs became weaker as the incoming flow was drawn into the sidewalls by the angled ribs, attenuating the streamwise impinging effect. In diverging slices displayed in Figure 9c, for example, as the rib angle decreased, the recirculation size became smaller, while strength was augmented. Reattachment points moved closer to the leeward sides of the ribs and the outer flow, with higher velocity, occupied a considerable space underneath the crests of the ribs. Thus, in the sharper angle case (RD), the velocity under the crests of the ribs was higher, as mentioned in Figure 6b. In regard to temperature, heat accumulated, due to the recirculated flow near the leeward surfaces of the ribs, resulting in low-temperature areas forming near the windward surfaces under the crest of the ribs, in both the diverging and converging slices. As rib angle decreased, the high-temperature fluid from the outer region had more opportunities to attach to the wall and then to enhance the heat transfer.
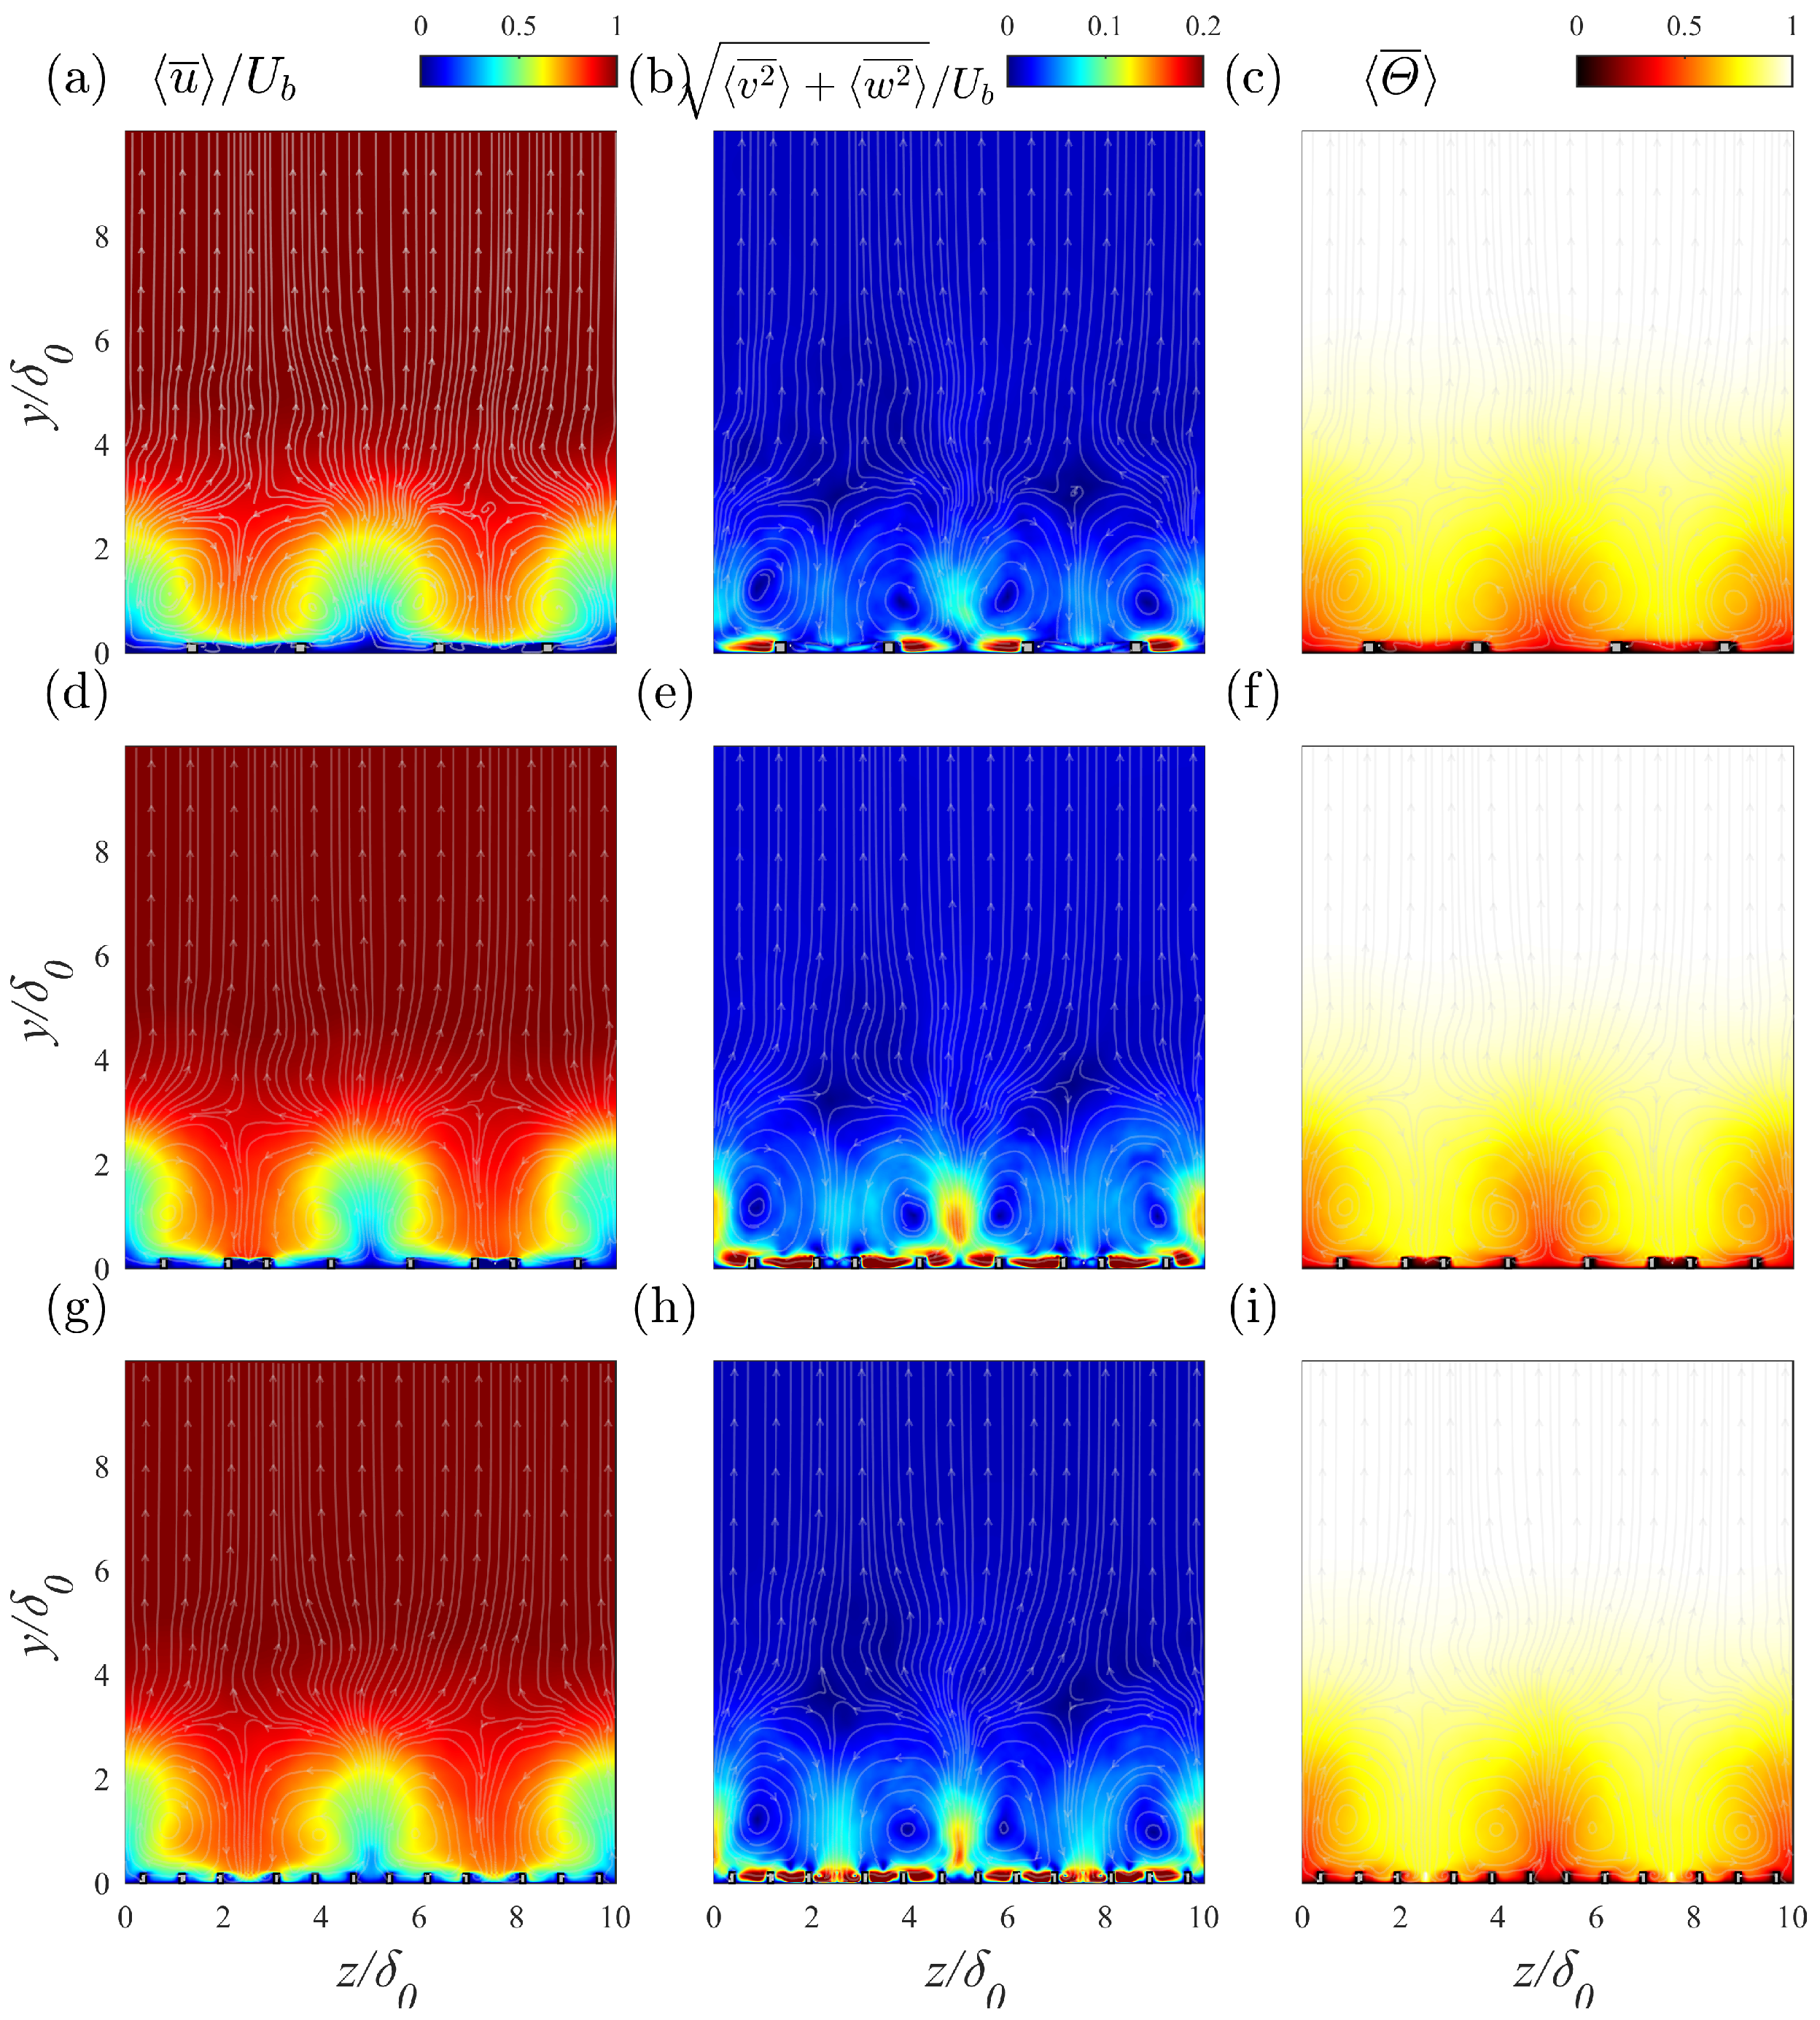
Contours of time-averaged normalized streamwise velocity, normalized strength of the secondary flow, and dimensionless temperature in the cross-stream plane, superimposed with the streamlines of secondary flows, are plotted in Figure 10. The magnitude of the secondary flow is defined as v ¯ 2 + w ¯ 2 . The first row of the figure highlights strong flow disturbances in the spanwise direction induced by the ribs. Secondary flows appear as LPMs and HPMs located above the diverging and converging regions of the ribs, respectively. The streamlines and secondary motion strengths in the second row clearly indicate that LMPs were flanked by a pair of counter-rotating vortices aligned in the flow direction. These vortices carried the high-velocity fluid in the domain center downward to the sidewalls, forming a relatively high velocity region above the windward angle of the ribs, as depicted in Figure 6.
As the rib angle decreased, the vortex edges extended further away from the wall (highest position y / δ = 0.5 for RD), while the strongest secondary motion intensity was observed in the 45 ° rib case RC. Thus, it was not possible to simply conclude which case was most affected by secondary flow. The overall impact is discussed in detail in Section 3.3 and Section 3.4. An analogous phenomenon is presented in the third column of Figure 10, where rotating vortices drove fluid with high dimensionless temperature to the lower region, enhancing heat exchange between the wall and the bulk flow.

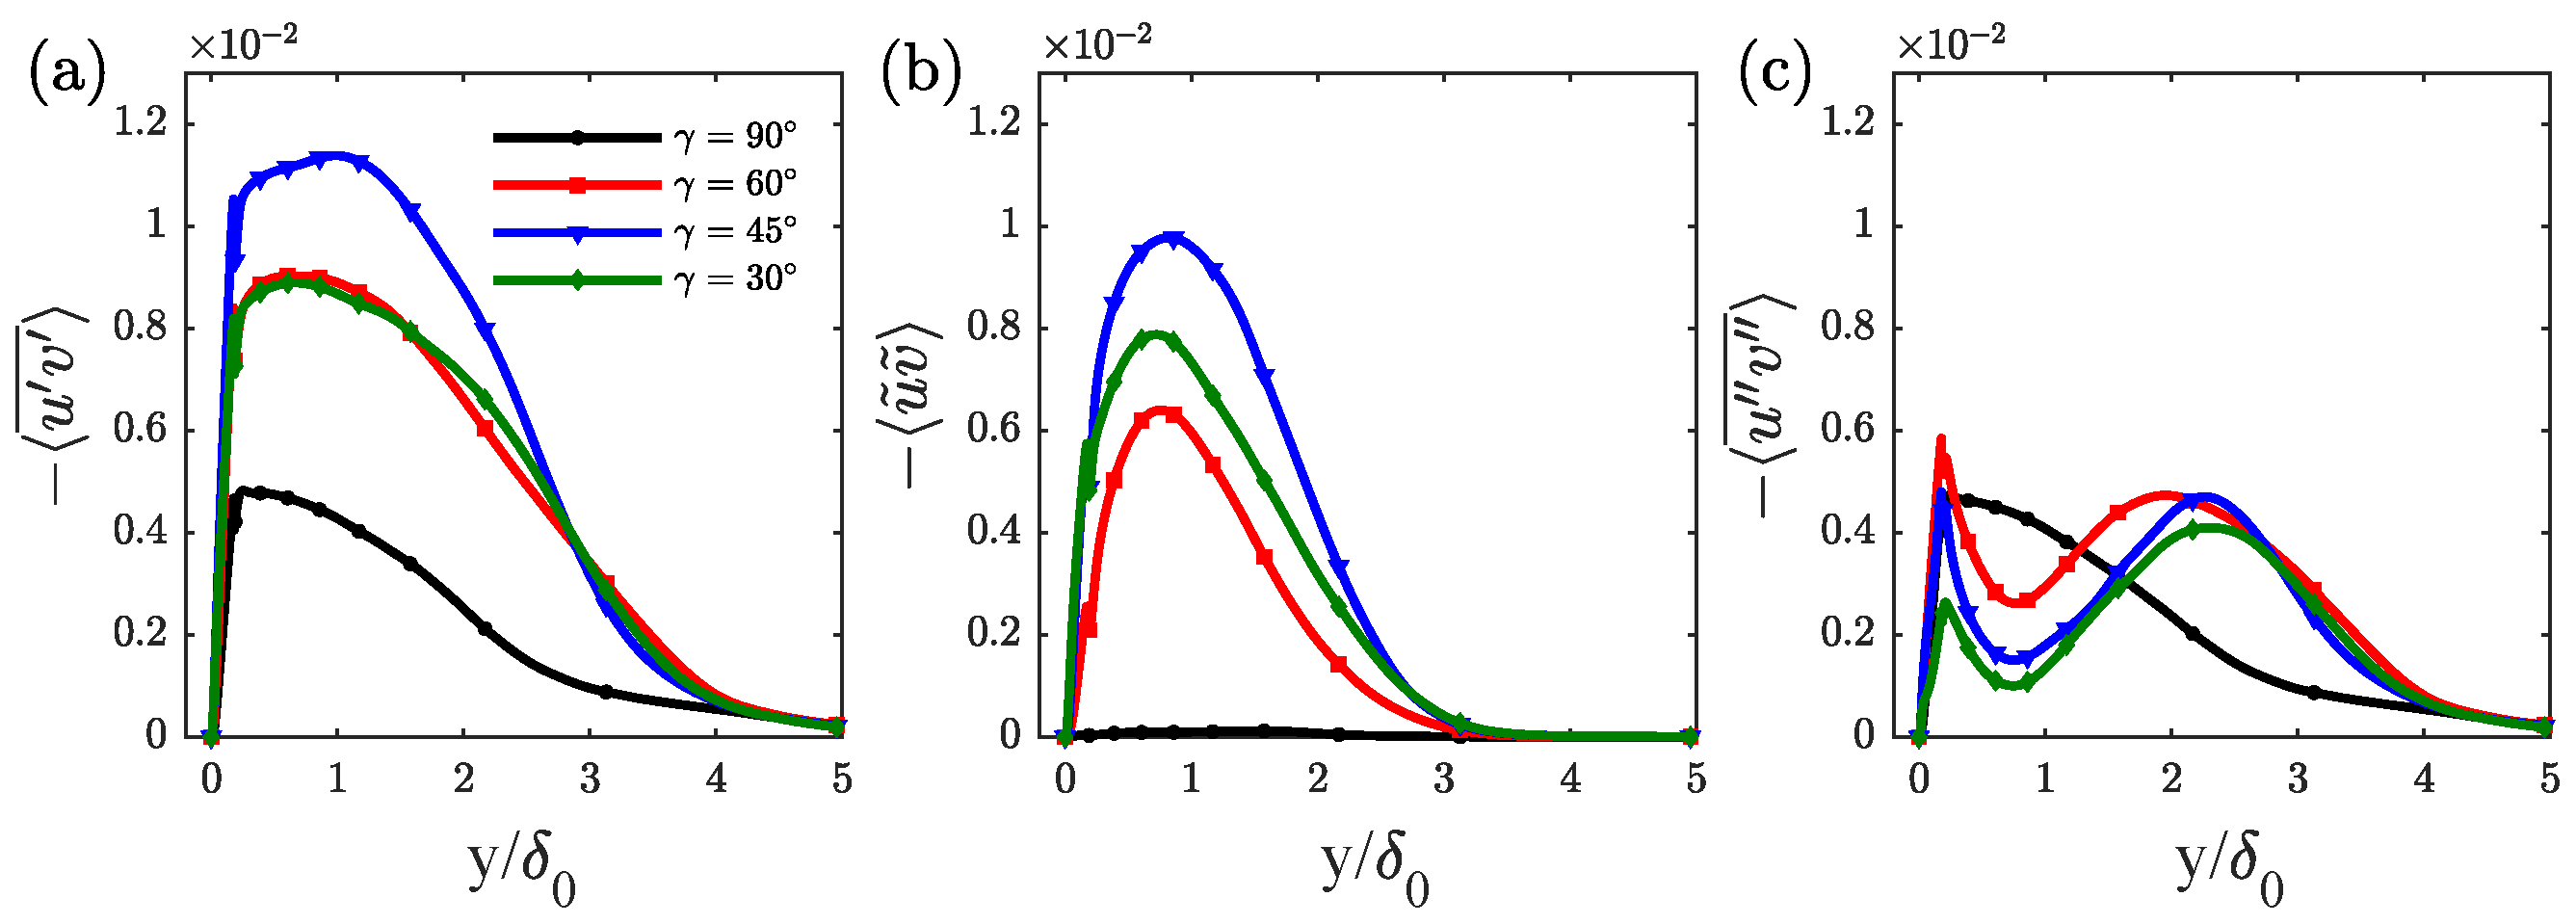
3.3. Characteristics of Shear Stress and Heat Flux

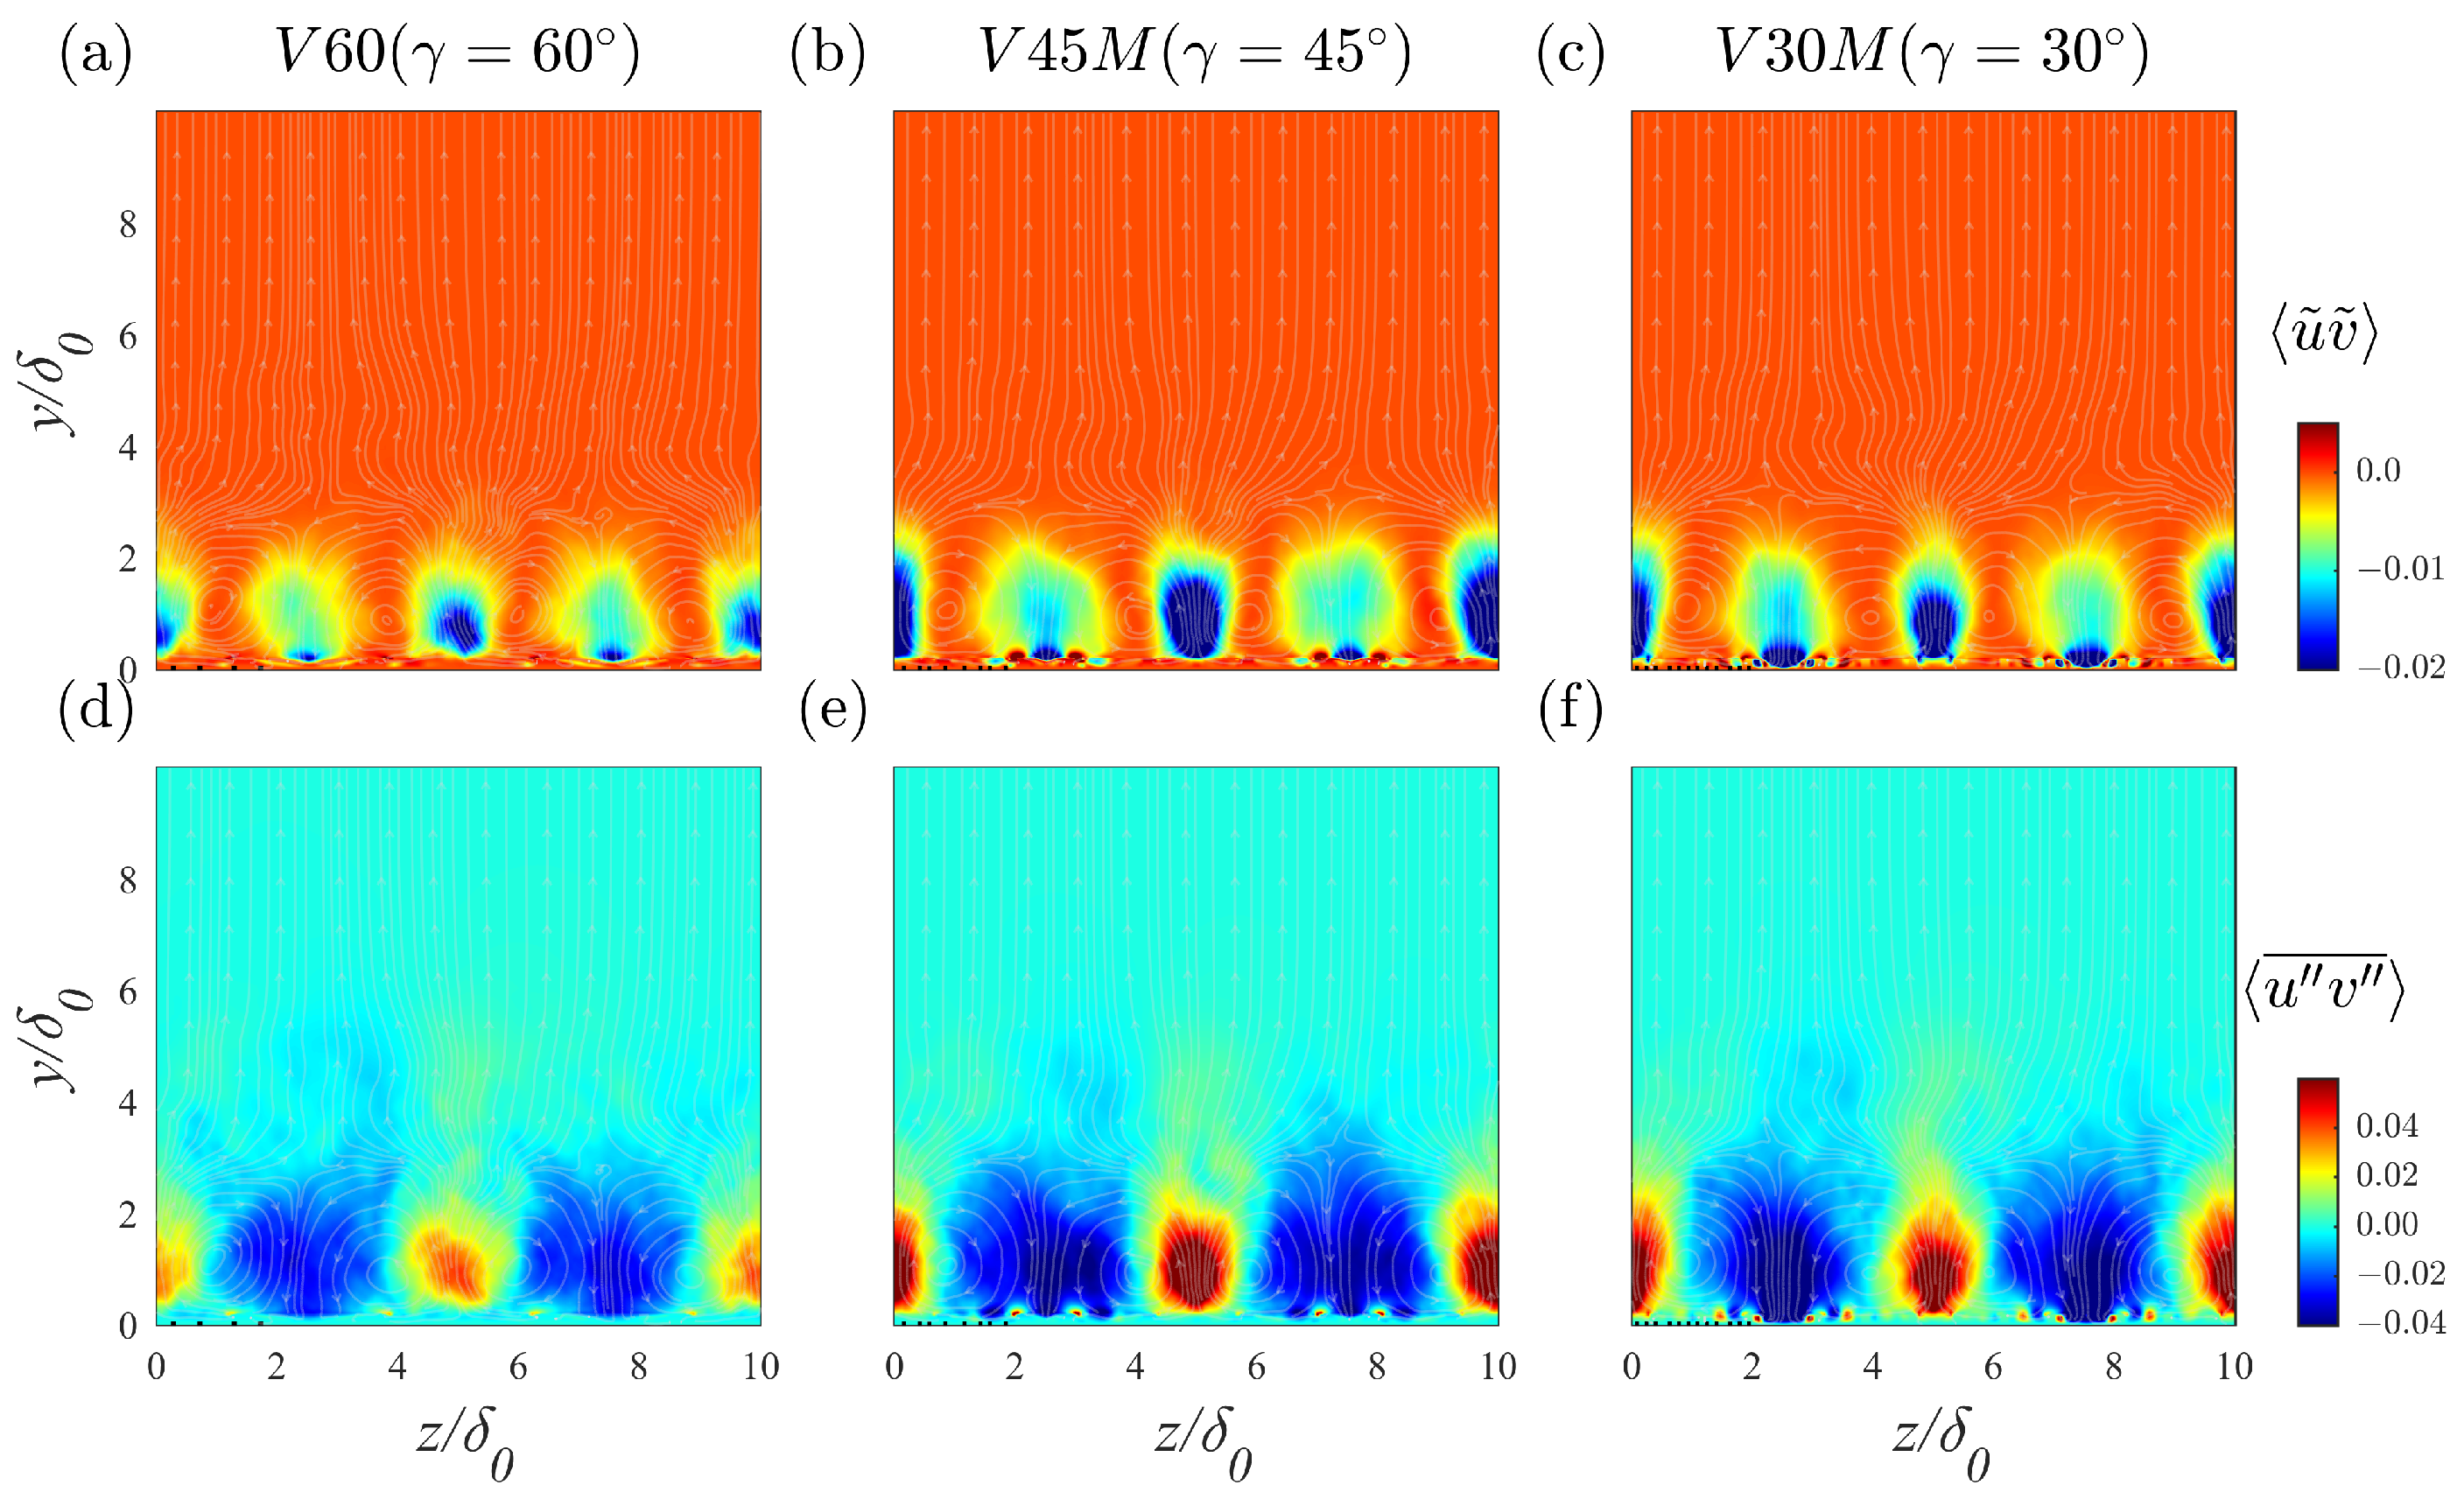
Understanding the total wall stress and heat flux modifications can provide insight into ow the angled ribs change the integral properties. Figure 11a presents he total shear stress along the wall-normal direction in the outer coordinate at the matched Reynolds number. The vertical position of the peak value for all cases occurred at y / δ 0 1 , which was nearly four times the height of the ribs, while, for the transverse rib case, the peak value was found closely above the ribs. Maximal total stress was obtained in RC, while the peak value of shear stress was roughly equal in RB and RD. However, the extent of stress in the outer region increase, with decreasing rib angle. The dispersive and turbulent components are depicted in Figure 12 to further investigate the distinct features of shear stress and their spatial distribution in the cross-stream plane. The results, illustrated in Figure 11b, show that the magnitude rank of dispersive stress was RC > RD > RB. Moreover, no stress contribution came from the dispersive component in the transverse rib case due tots homogeneity in the spanwise direction. In the first row of Figure 9, negative u ˜ v ˜ occupied both the diverging and converging regions and the intensity of u ˜ v ˜ above the converging region first increased and then decreased. Furthermore, the strength of the secondary motion in the diverging region grew consistently with decreasing rib angle, leading to a higher magnitude of u ˜ v ˜ in RD than that in RB. Turbulent stresses for all V-shaped cases, displayed in Figure 11c, showed double peaks, including an inner and an outer peak. The inner peak occurred in the vicinity of the rib crest, while the outer peak was further away from the wall. The emergence of double peaks resulted from turbulent shear stress with opposite signs forming above the diverging and converging regions. In the second row, the negative turbulent shear stress played a dominant role under the rib crest, while more positive spots appeared in the adjacent two sides of the ribs as the rib angle decreased, consistent with the decreasing inner peak values shown in Figure 9a. Above the crest of ribs, alternating positive and negative turbulent shear stress formed in the LMPs and HMPs, that is, converging and diverging regions, respectively, creating a defect between two peaks. Additionally, due to the faster attenuation of positive shear stress, the second peak formed vertically away from the ribs. The distance of extent in the wall-normal direction of the two components was consistent with that in the total shear stress.
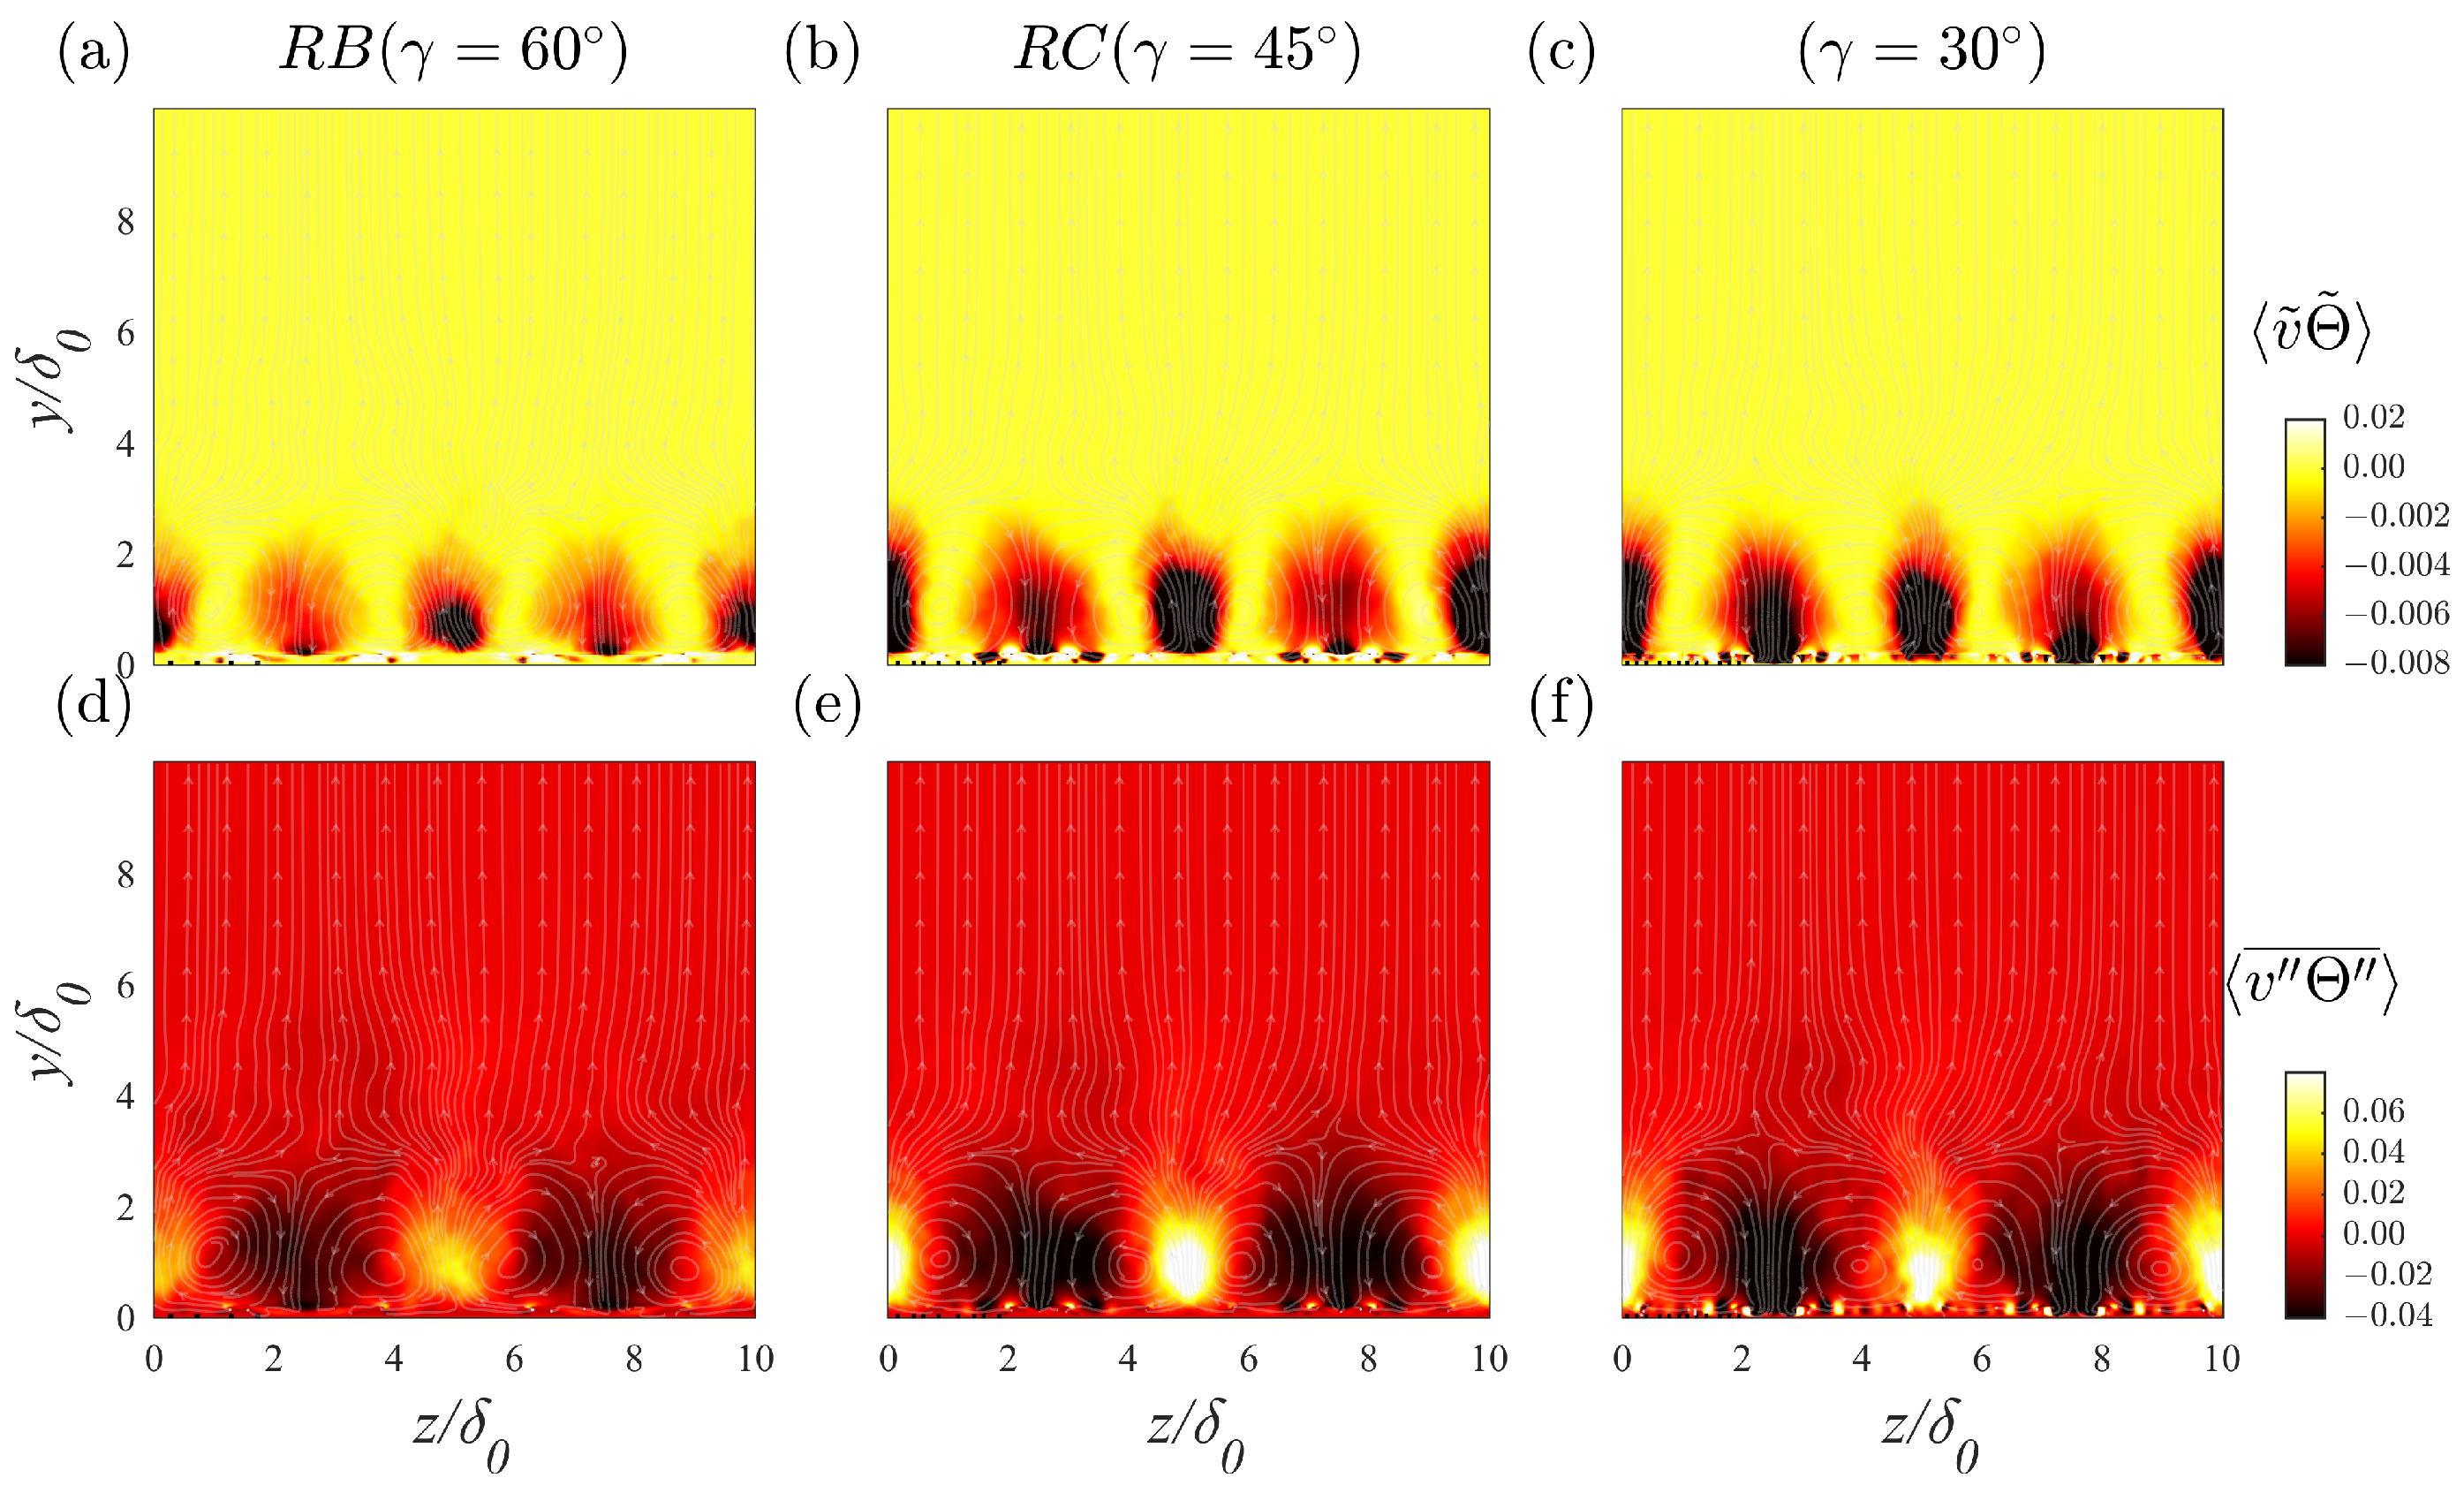
Contrary to the shear stress profiles, both RC and RD displayed relatively high total heat flux, as illustrated in Figure 13. This was primarily due to the nearly equal dispersive components in both cases. This behavior differed from the stress pattern, where the secondary motion contributed the most in the middle angle case (RC). By comparing Figure 12 and Figure 14b, a change in the intensity of the dispersive component in the diverging region was evident. For RD, a strong negative v ˜ Θ ˜ was found in the diverging regions, while the approximately equivalent strength of u ˜ v ˜ , relative to RC, is shown in Figure 12. This significant difference offers new insights into the underlying dissimilarity mechanisms in the turbulent transport of momentum and heat over ribbed surfaces.

3.4. Decomposition of Velocity and Thermal Field

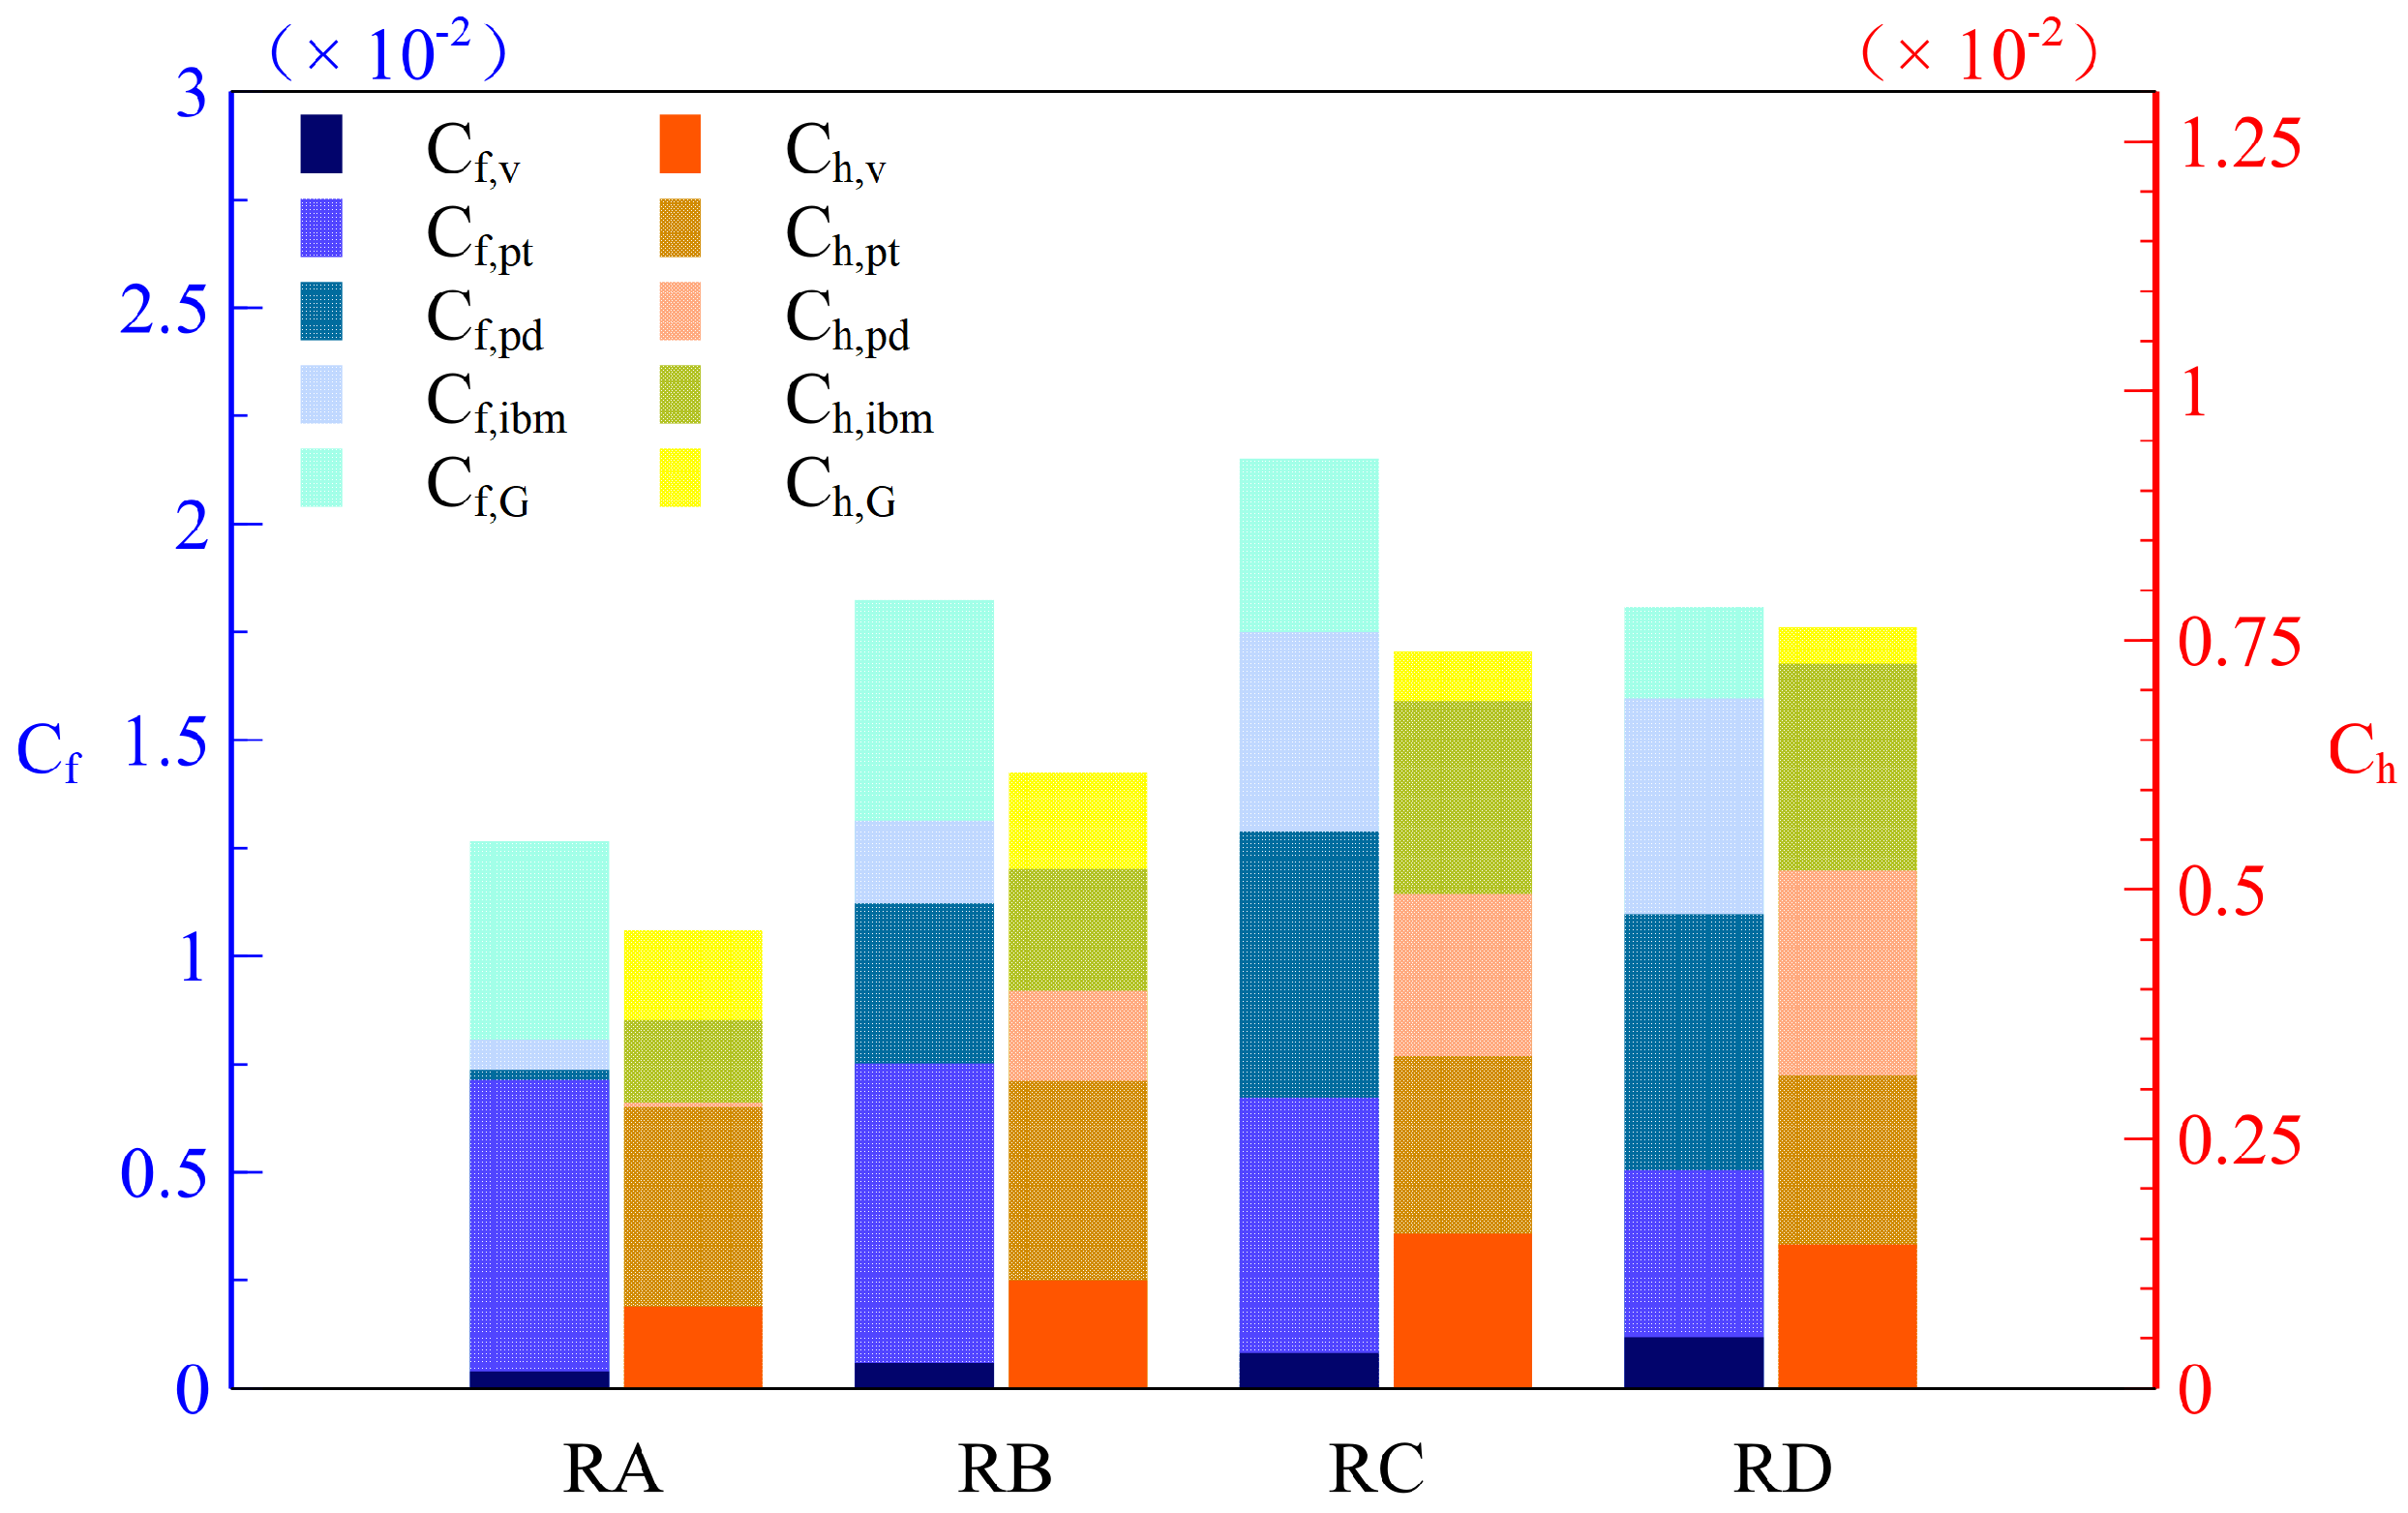
The contributions of constituents of C f and C h were examined to determine the effect of the secondary flow on the drag and heat transfer efficiency. The terms presented in Equation (12) were derived from the RD identity by performing triple decomposition of the mean transport equation of TKE and, subsequently, integrating from the wall to bulk flow as follows:
C f = 2 U b 3 ν 0 δ u ¯ y 2 d y C f , V + 2 U b 3 0 δ P k , t o t d y C f , P 2 U b 3 0 δ F i b m , x u ¯ d y C f , i b m + 2 U b 3 0 δ u ¯ U u ¯ v ¯ y v ¯ u ¯ y d y C f , G
where C f , V , C f , P , C f , i b m and C f , G on the right-hand side of Equation (12) are the laminar term, total production term, IBM forcing term and spatial growth term, respectively. The detailed process of derivation is presented in Appendix A. Based on Equation (6), C f , P can be further divided into the dispersive production term, C f , p t , and turbulent production term, C f , p d
0 δ P k , t o t d y = 0 δ u v ¯ u ¯ y d y C f , p t + 0 δ u ˜ v ˜ u ¯ y d y C f , p d .
The decomposition of C h and terms with analogous physical meanings are obtained in a similar manner
C h = α U b Θ b 2 0 δ Θ ¯ y 2 d y C h , V + 1 U b Θ b 2 0 δ P T , t o t d y C h , P 1 U b Θ b 2 0 δ Q i b m Θ ¯ d y C h , i b m 1 U b Θ b 2 0 δ Θ ¯ 1 u ¯ Θ ¯ x + v ¯ Θ ¯ y d y C h , G
0 δ P T , t o t d y = 0 δ v Θ ¯ Θ ¯ y d y C h , p t + 0 δ v ˜ Θ ˜ Θ ¯ y d y C h , p d
The contributions of these terms are shown in Figure 15. As expected, the dispersive constituent was absent in the transverse rib case. C f , V increased as the rib angle decreased due to the reduction in impingement of the incoming flow, resulting in higher u ¯ underneath the crests of ribs and generating large laminar effects. Conversely, turbulent shear stress was suppressed in the presence of the angled ribs, thereby decreasing the contribution of C f , p t . Although the dispersive component in the RC case was significantly higher than that in the RB case, no notable difference was observed when compared to that in the RD case. For heat transfer patterns, the laminar component C h , V accounts for a considerable portion in the Stanton number and presents a different trend from the drag pattern. RC had the largest laminar contribution in C h , indicating limited temperature gradient improvement when the rib angle exceeded 45 ° . The contributions of dispersive and turbulent components were similar to that of drag patterns. A remarkable difference was the increased C h , p d in RD relative to that in RC, which differed from that in C f , p d . Since nearly the same magnitude of dispersive flux was observed, as seen in Figure 13b, we concluded that the excess of dispersive production in RD resulted from a higher temperature gradient in the near wall region. The IBM-related terms, C f , i b m and C h , i b m , contributed more as the angle decreased. According to Fan’s research [21], boundary layer growth is strongly related to the pressure gradient. Although the total mean pressure gradient was zero in the cases presented, the appearance of ribs induced local non-equilibrium pressure in the streamwise direction. As shown in Figure 5, the influence of pressure decreased rapidly with a decreasing rib angle, exceeding 45 ° . Therefore, the growth terms, C f , G and C h , G , contributed less as the angle decreased in the V-shaped cases.

3.5. Global and Local Reynolds Analogy

From the view of energy saving, the goal is for the ribbed wall to enhance heat transfer performance without generating excessive additional drag. The Reynolds analogy was used here as an indicator of heat transfer augmentation capacity under this criterion. The Reynolds analogy was plotted globally and locally, in Figure 16 and Figure 17, for each case to investigate the performance of ribbed walls at different angles.
The Reynolds analogy factor s is defined as the ratio between the Stanton number and drag coefficient and can be expressed as [20]
s 2 C h C f = q t o t ¯ U b τ t o t ¯ c p T w T b
where C f and C h are evaluated at matched Reynolds number. Value 2 C h / C f = 1 for smooth wall boundary layer flow indicates the similarity in turbulent transport momentum and heat evident in the present study without rough elements. In this study, s = 0.52 , 0.43 , 0.44 and 0.56 correspond to the four cases, as shown in the Figure 16. According to the definition, a surface transports heat from wall to fluid more efficiently when s is large. Therefore, in the present study, the largest Reynolds analogy was obtained in RD, indicating that, among the angled ribs researched, ribs with 30 ° angle were favorable for heat transfer augmentation.
For clear visualization, the Reynolds analogy is shown in the C f / C f s C h / C h s coordinate in Figure 16b, based on Rouhi [29], where C f s and C h s correspond to the skin friction coefficient and Stanton number of the smooth surface at matched Reynolds numbers. In general, the point located at the top left corner represents high heat transfer efficiency, and the grey line denotes the smooth wall case. As shown in Figure 16b, RD generated a much higher heat transfer coefficient than the transverse rib case, while producing less drag than RC and, therefore, achieved the highest heat transfer efficiency.
The local distribution of Reynolds analogy factor in the x z plane is presented in Figure 17. The Reynolds analogy values at points sampled from diverging region to converging region (marked with point P 1 and P 2 , respectively) were plotted in Figure 17a,c,e,g for each case. The spatial distribution of C f / C f s and C h / C h s were contoured in the second and third columns of the figure. In the diverging region, both positive and negative drag existed in the cavity. As discussed in Section 3.1, steady recirculated flow formed near the leeward faces, and the reattachment point moved towards the leeward face with a decreasing rib angle, resulting in an increase in the area of contact between the wall and high-speed fluid. This is reflected in the second column of Figure 17, where the blue area, representing negative drag in the diverging region, decreased with decreasing angle. In the ribbed area of the diverging region, the pressure difference between the windward and leeward walls was the primary source of drag. As observed in Figure 17, as the angle decreased, the formed drag became increasingly concentrated on the ribs at the windward angle as the angle decreased. This phenomenon is primarily attributed to the stronger secondary flow in cases with sharper angles. In terms of the Stanton number in the diverging region, cases with sharper ribs’ angles exhibited better heat transfer performance, due to the smaller size of the recirculation zone in the cavity, which led to accumulation of heat. Consistent with the above analysis, P 1 , which represents the s in the diverging region in Figure 17c,e,g, gradually became close to the “smooth wall line” as the rib angle decreased, indicating higher heat transfer efficiency. RD showed the best heat transfer efficiency in the diverging region, due to its greatest heat transfer gain.
In the transition region, which ranged from point P 1 to P 2 , many points were distributed near the “smooth wall line” for all V-shaped rib cases, indicating enhancement in heat transfer efficiency in this region. This was mainly due to the fact that C f / C f s decreased faster than C h / C h s from P 1 to P 2 , in other words, from the diverging region to the converging region, for the V-shaped rib cases. This trend was more pronounced at smaller angles. When C f / C f s decreased to around 5, the points were densely distributed near the line in RD, indicating a relatively high heat transfer efficiency region near P 2 . However, in this region, both C f / C f s and C h / C h s were low and showed less effect on total shear stress and heat flux.
Additionally, the Reynolds analogy in the windward angle (marked with P 1 ) became larger with decreasing rib angle, due to the higher C h / C h s , and C f / C f s was almost unchanged, indicating that the heat transfer efficiency gradually improved from 90 ° to 30 ° in the diverging regions. In the converging area, marked with P 2 , lower streamwise fluid velocity led to the accumulation of heat and generated a smaller temperature gradient. Thus, low heat transfer efficiency was obtained in this area, especially in the central line of the V-shaped ribs. Differing from the diverging region, values of s within the converging area were distributed around the reference line with no significant difference found for all cases, suggesting that this area played no dominant role in changing the heat transfer efficiency. The heat transfer performance in immediate areas, ranging from P 1 to P 2 , varied significantly among the three V-shaped cases. In this area, the Reynolds analogy consistently changed from the value of P 1 to the value of P 2 in a convex form, with some points exceeding the diagonal line. The curvature of the convex line was linked with the rib angle, with more points above the reference line in the 30 ° rib case than in other cases. This indicated that most RD regions were heat-transfer friendly. Based on the above discussion, the immediate region with high heat transfer originated from the more rapid decline of C f / C f s than C h / C h s from P 1 to P 2 , and the increasing width of this region contributed more to heat transfer efficiency when the rib angle decreased.
4. Conclusions

To investigate the influence of rib angle on friction factor and Stanton number, DNSs of thermal turbulent boundary layer flow over ribbed surfaces were performed. Four rib angles, set to 90 ° , 60 ° , 45 ° and 30 ° , were considered in the present study. Data were collected at R e θ 2200 and a constant Prandtl number of P r = 0.71 was chosen. Among the configurations, the 45 ° rib case introduced the highest drag coefficient, while the 30 ° rib case exhibited the best heat transfer performance.
The profiles of mean streamwise velocity in wall-normal direction for V-shaped cases showed significant differences to that of the transverse rib case, suggesting a break of the outer-layer similarity. Streamwise velocity was enhanced, ranging from the wall to nearly seven times the height of the ribs and was then suppressed up to the boundary layer edge. A similar trend was observed in the temperature profile, albeit with smaller variation in amplitude. The physical mechanism behind these split regions was investigated by analyzing the spatial distribution of mean spanwise velocity and temperature in x y and y z planes. As the rib angle decreased, recirculations within the cavities between ribs in the diverging region became smaller and the shear layer over the rib crests became stronger, contributing higher u ¯ and Θ ¯ in the near wall region. The LMPs induced by secondary motion were responsible for the lower streamwise velocity and temperature further away in the outer region.
Dispersive and turbulent stress and heat flux were studied. The ranking of dispersive stress intensity near the rib crests was R C > R D > R B , and for the dispersive heat flux it was R C R D > R B . Depressions were observed at the location of the peak value in the dispersive profiles for both shear stress and heat flux patterns in V-shaped cases, and in turbulent components for V-shaped cases in both shear stress and heat flux patterns. To further investigate the specific physical mechanism responsible for the variations in drag and heat transfer performance, decompositions of C f and C h , based on the extended RD identity, were examined. The results showed higher dispersive, and nearly equal, turbulent heat fluxes, compared to those in the 45 ° rib case, were the main reason for enhancement of heat transfer in the 30 ° rib case.
The global Reynolds analogy factor s was presented. The 30 ° rib case achieved the best heat transfer efficiency ( s = 0.56 ), due to its lower drag coefficient, compared to the 45 ° rib case. The local Reynolds analogy factor was calculated, ranging from the converging to the diverging region. In the diverging region, s became larger with decreasing rib angle, while it remained almost unchanged in the converging region, with lower C f and C h . In the intermediate region, a sharper rib angle induced faster decline of C f than C h , resulting in an improvement in the global Reynolds analogy factor.

Author Contributions

Conceptualization, W.W.; methodology, J.D.; validation, F.J.; formal analysis, F.J.; investigation, F.J.; resources, W.W. and J.D.; writing—original draft preparation, F.J.; writing—review and editing, W.W. and J.L.; supervision, W.W. All authors have read and agreed to the published version of the manuscript.

Funding

This research was funded by the National Natural Science Foundation of China (52036011, U22A20213), and the National Natural Science Foundation of China (U1707603).

Institutional Review Board Statement

Not applicable.

Informed Consent Statement

Not applicable.

Data Availability Statement

Not applicable.

Conflicts of Interest

The authors declare no conflict of interest.

Appendix A. Grid Refinement

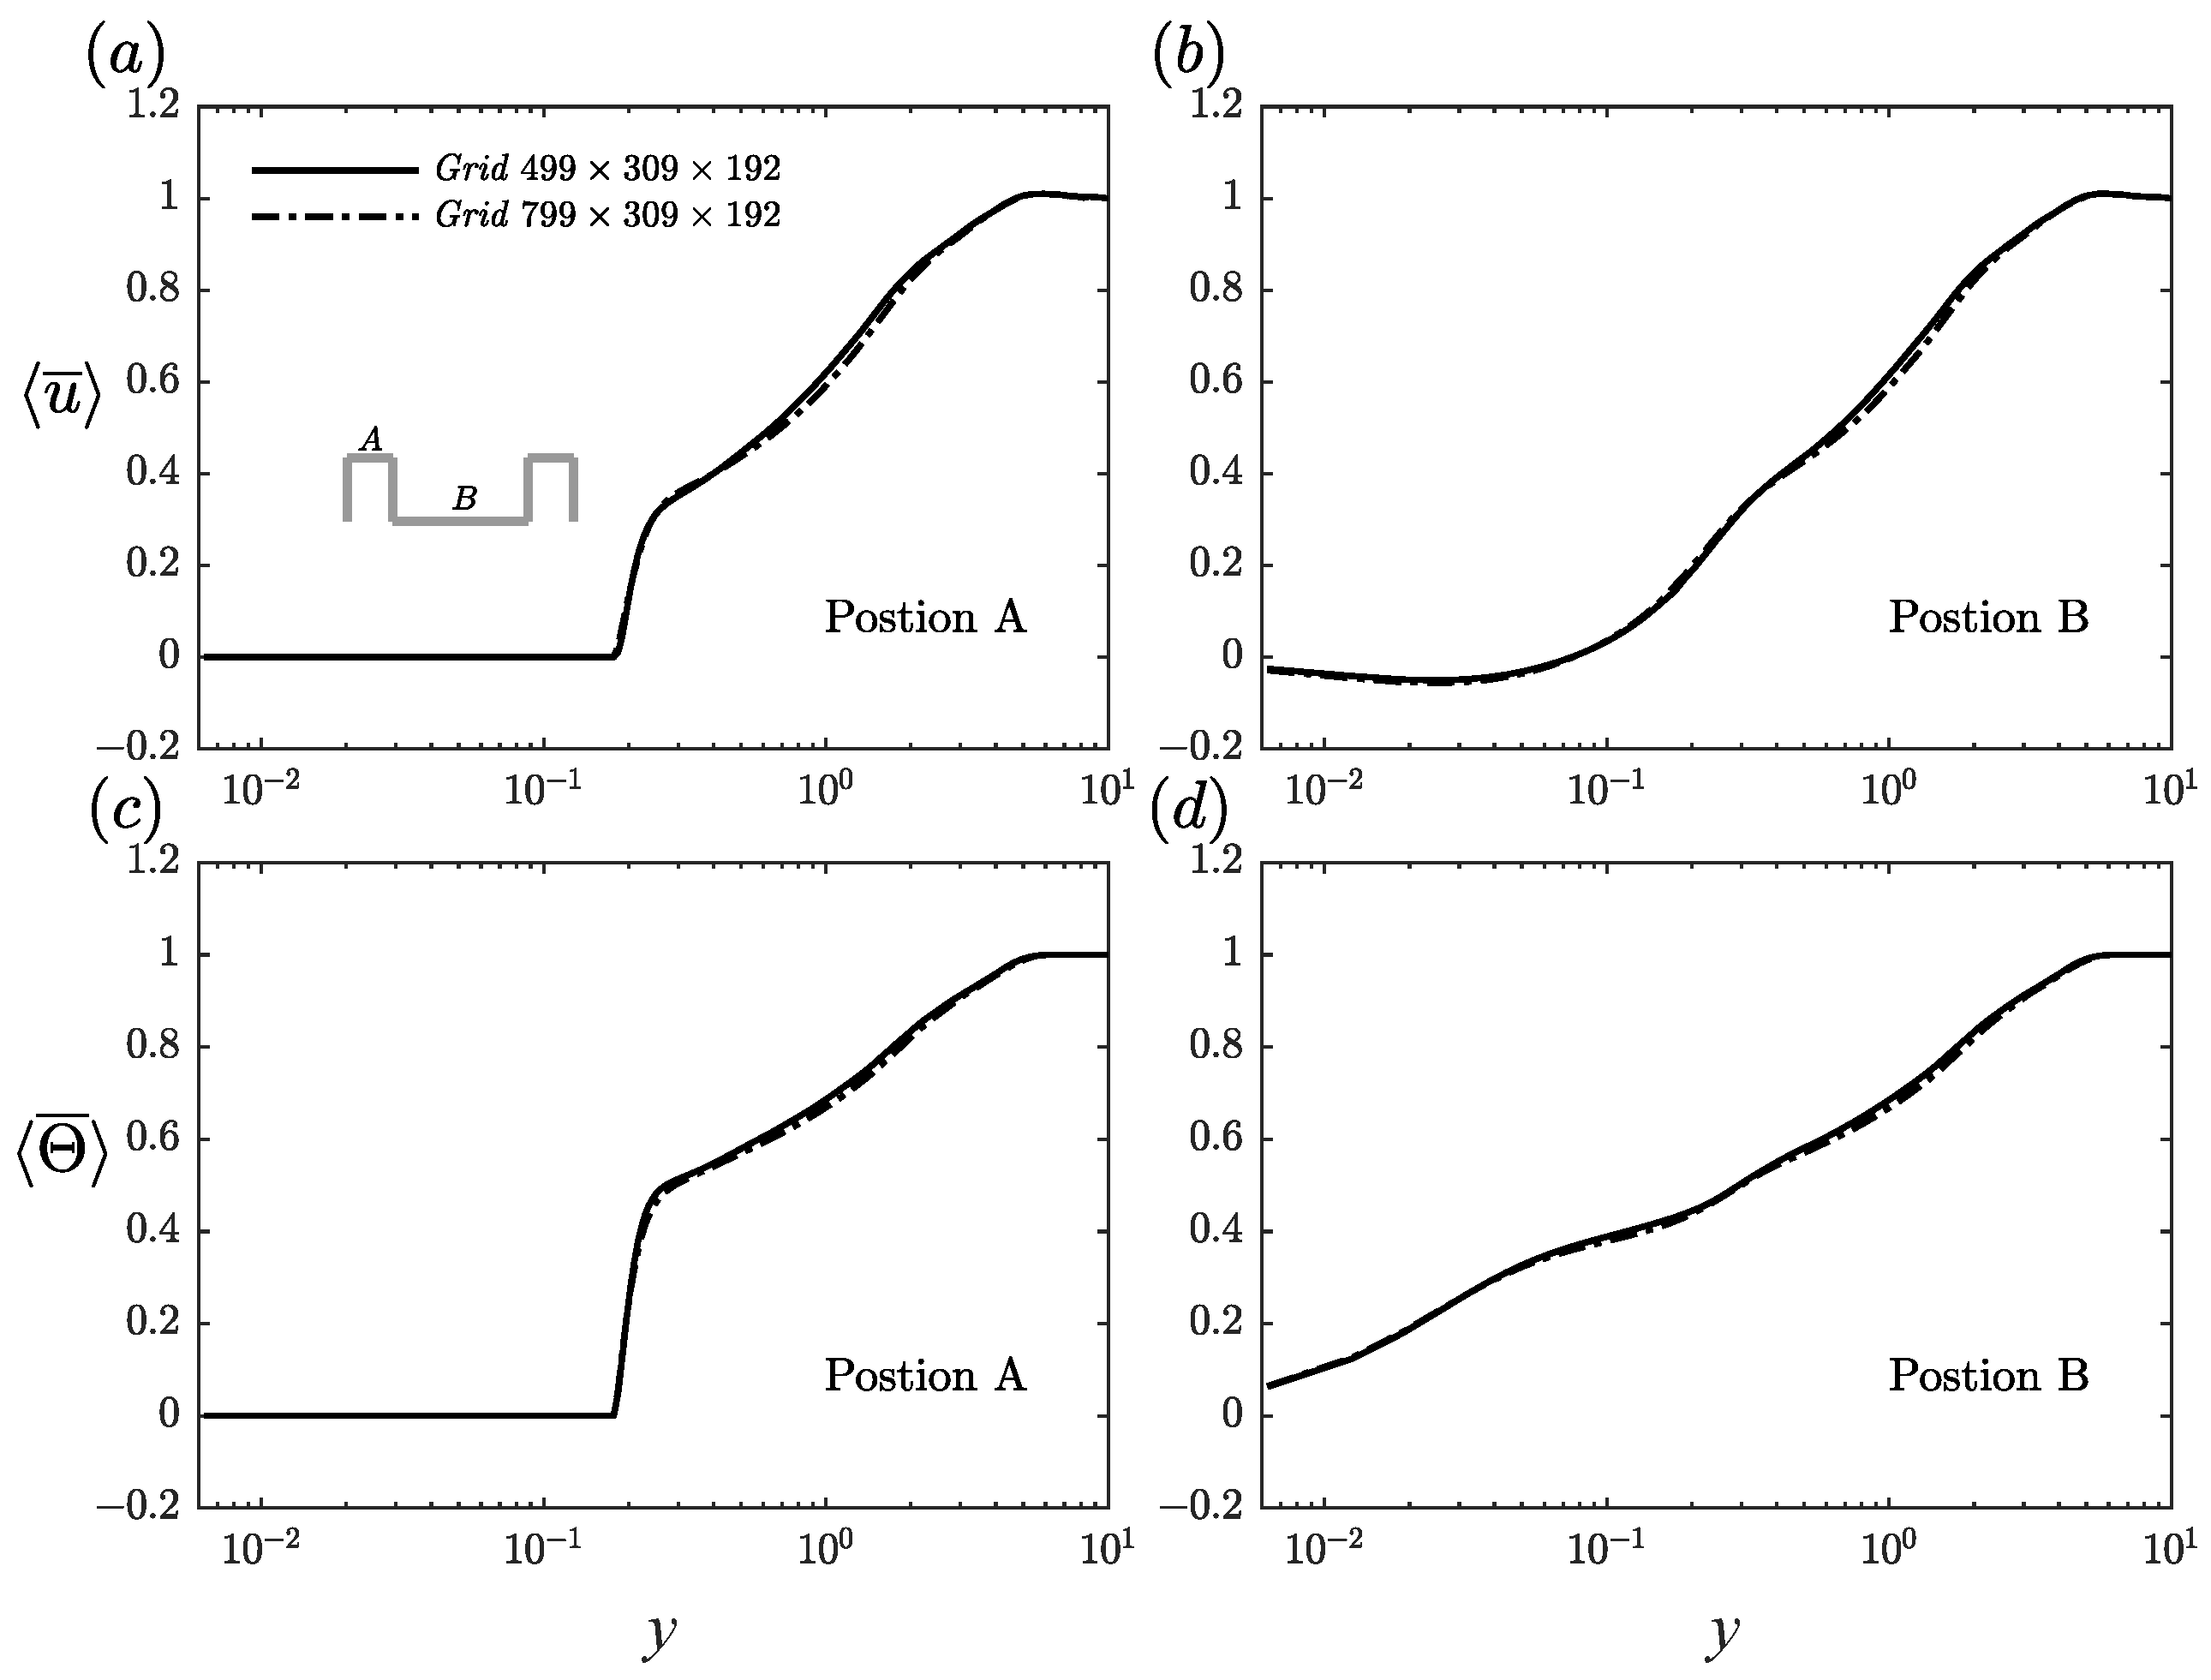
A grid-refinement analysis was performed to evaluate the sufficiency of the mesh in accurately resolving the momentum and heat transport. Calculations were performed on a finer mesh with a resolution of 799 × 309 × 192 for RA. The mean streamwise velocity and temperature above the crest (position A) and in the center of the cavity (position B) for two resolutions are presented in Figure A1. The results showed good agreement between the two simulations, indicating sufficient accuracy of the DNSs presented.
Figure A1. Grid refinement study: (a,b) streamwise velocity u ¯ and (c,d) dimensionless temperature Θ ¯ in position A and B, respectively.
Energies 16 03831 g0a1

Appendix B. Decomposition of Reynolds Stress and Heat Flux

We decomposed the decomposition of C f and C h based on the method proposed by Wei [30]. The double-averaged momentum balance equation for turbulent boundary layer flow with immersed boundary forcing term can be written as
0 = u ¯ v ¯ y v ¯ u ¯ y + ν 2 u ¯ y 2 u v ¯ y u u ¯ x + F i b m , x
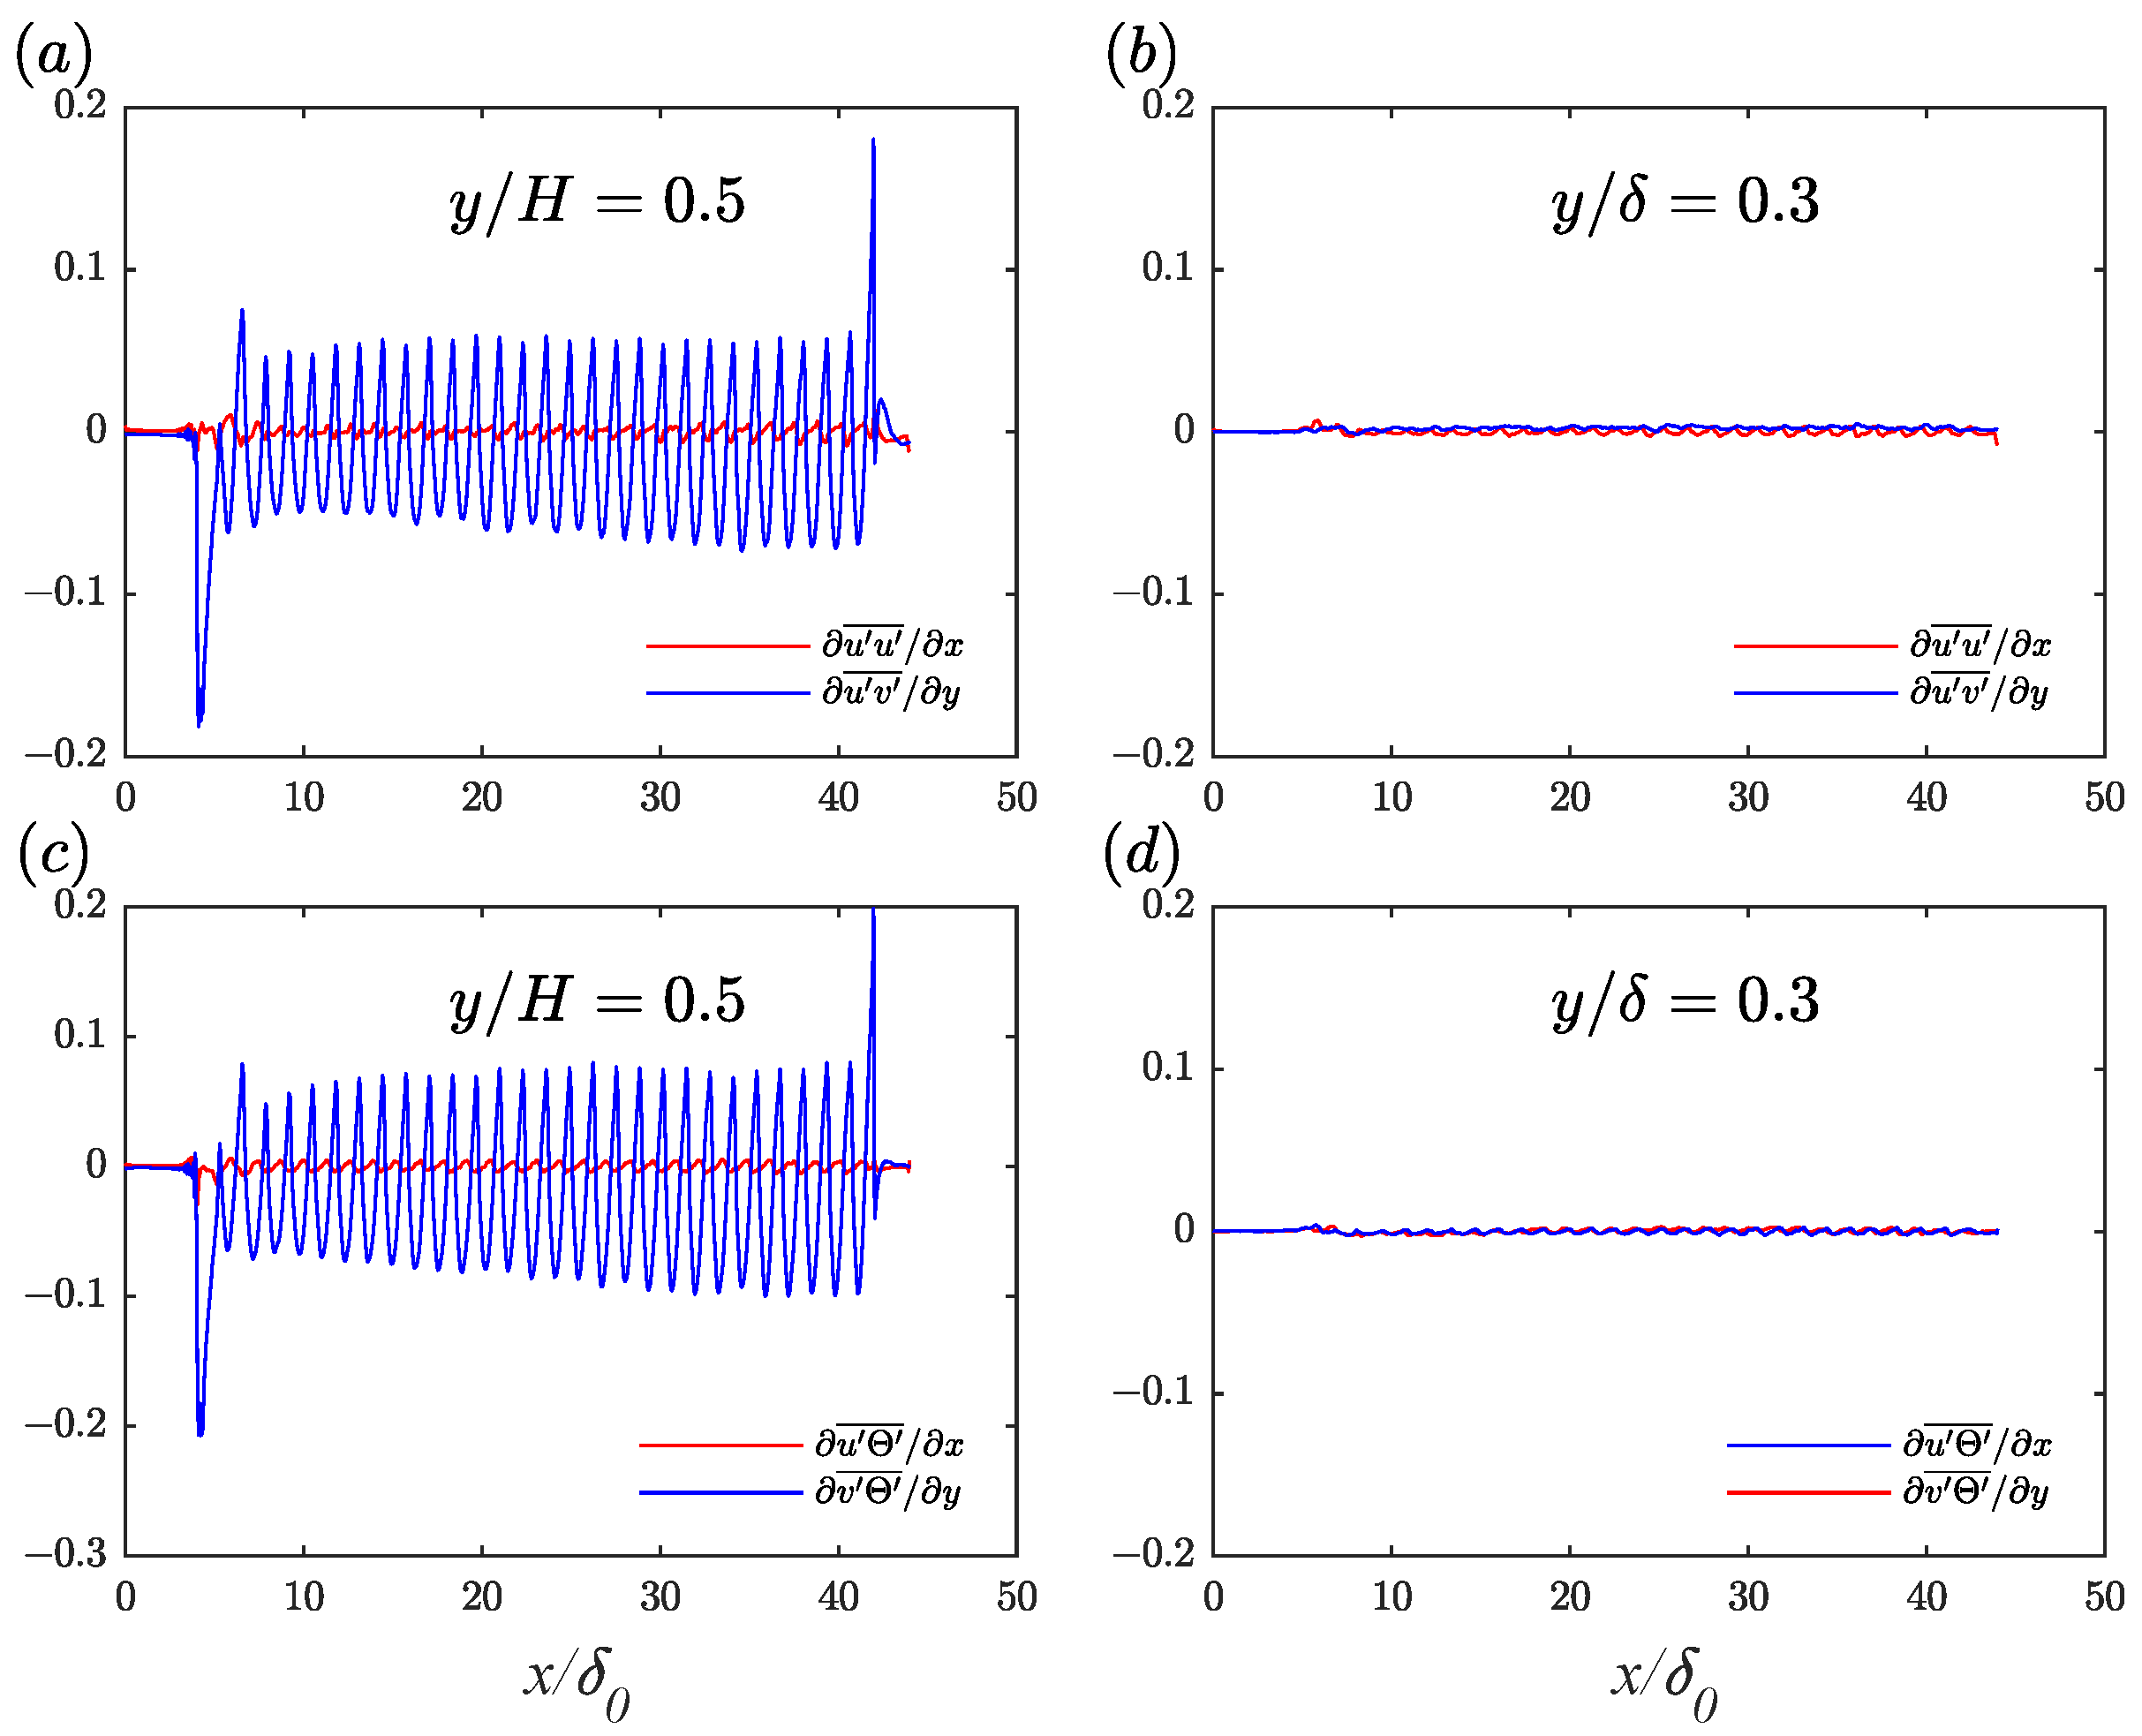
the fifth term in the right hand side of Equation (A1) is the spatial derivative in the x direction of the Reynolds normal stress, which can be neglected in smooth wall boundary layer flow [22,30]. As shown in Figure A2, u u / x and u Θ / x was small compared to u v / y , and v Θ / y both underneath and above the ribs. Therefore, u u / x and u Θ / x could also be neglected in turbulent boundary layer flow with ribs.
Integrating Equation (A1) from wall to boundary layer edge using the boundary condition yields: u ¯ = 0 , v ¯ = 0 and u v ¯ = 0 at wall; u ¯ = 1 and u v ¯ = 0 at the boundary layer edge
ν u ¯ y u v ¯ = ν u ¯ y w 0 y F i b m , x d y 0 y u ¯ v ¯ y v ¯ u ¯ y d y
we obtain the wall shear stress at y = 0
τ t o t ¯ ρ = ν u ¯ y w 0 δ F i b m , x d y = u τ 2
substitution of wall shear stress in Equation (A2) and transformation yield:
ν u ¯ y u v ¯ = u τ 2 + y δ F i b m , x d y 0 y u ¯ v ¯ y v ¯ u ¯ y d y
multiply the Equation (A1) by a weight function u ¯ :
0 = ν 2 u ¯ y 2 u ¯ u v ¯ y u ¯ + F i b m , x u ¯ + u ¯ v ¯ y v ¯ u ¯ y u ¯
integrate Equation (A5) in wall-normal direction and substitute the relation (A4) resulting in
0 = ν u ¯ y u ¯ ν 0 y u ¯ y 2 d y u v ¯ u ¯ 0 y u v ¯ u ¯ y d y + 0 y F i b m , x u ¯ d y + 0 y u ¯ v ¯ y v ¯ u ¯ y u ¯ d y
More information about the integration is discovered by rearranging the terms and taking advantage of the definition of C f . Eventually, we obtain the decomposition of drag friction based on RD identity:
C f = 2 U b 3 ν 0 y u ¯ y 2 d y + 2 U b 3 0 y P k , t o t d y 2 U b 3 0 y F i b m , x u ¯ d y + 2 U b 3 0 y u ¯ U b u ¯ v ¯ y v ¯ u ¯ y d y
The procedure of decomposing C h follows the same manner.
0 = u ¯ Θ ¯ x + v ¯ Θ ¯ y + α 2 Θ ¯ y 2 v Θ ¯ y + Q i b m
Integrate double-averaged mean dimensionless energy Equation (A8) in the wall-normal direction leading to
α Θ ¯ y v Θ ¯ = q ¯ + y δ Q i b m d y + 0 y u ¯ Θ ¯ x + v ¯ Θ ¯ y d y
At the wall, we obtain the wall heat flux (A10) using the analogous boundary condition stressed in the velocity pattern
q t o t ¯ ρ c p = α Θ ¯ y | w 0 δ Q i b m d y
Multiplying Equation (A8) by Θ ¯ leads to Equation (A11) and further integrating this relation from y = 0 to position y results in Equation (A12)
0 = u ¯ Θ ¯ x + v ¯ Θ ¯ y Θ ¯ + α 2 Θ ¯ y 2 Θ ¯ v Θ ¯ y Θ ¯ + Q i b m Θ ¯
0 = 0 y u ¯ Θ ¯ x + v ¯ Θ ¯ y Θ ¯ d y + α Θ ¯ y Θ ¯ α 0 y Θ ¯ y 2 d y v Θ ¯ Θ ¯ 0 y v Θ ¯ Θ ¯ y d y + 0 y Q i b m Θ ¯ d y
Similarly, we obtain Equation (A13) by substituting the heat flux relation in Equation (A12)
q ¯ ρ c p Θ ¯ = α 0 y ( Θ ¯ y ) 2 d y 0 y P T , t o t d y + Θ ¯ y δ Q i b m d y + 0 y Q i b m Θ ¯ d y 0 y u ¯ Θ ¯ x + v ¯ Θ ¯ y Θ ¯ d y + Θ ¯ 0 y u ¯ Θ ¯ x + v ¯ Θ ¯ y d y
and, finally, the decomposition of C h can be expressed as:
C h = α U b Θ b 2 0 δ Θ ¯ y d y + 1 U b Θ b 2 0 δ P T , t o t d y 1 U b Θ b 2 0 δ Q i b m Θ ¯ d y 1 U b Θ b 2 0 δ Θ ¯ Θ b u ¯ Θ ¯ x + v ¯ Θ ¯ y d y
Figure A2. Spatial derivatives of Reynolds stress and heat flux in case RC: (a) u u ¯ / x and u v ¯ / y underneath the ribs ( y / H = 0.5 ); (b) u u ¯ / x and u v ¯ / y above the ribs ( y / δ = 0.3 ); (c) u Θ ¯ / x and v Θ ¯ / y underneath the ribs ( y / H = 0.5 ); (d) u Θ ¯ / x and v Θ ¯ / y above the ribs ( y / δ = 0.3 ).
Energies 16 03831 g0a2

References

  1. Modesti, D.; Endrikat, S.; Hutchins, N.; Chung, D. Dispersive Stresses in Turbulent Flow over Riblets. J. Fluid Mech. 2021, 917, A55. [Google Scholar] [CrossRef]
  2. Mahmoodi-Jezeh, S.; Wang, B.C. Direct Numerical Simulation of Turbulent Heat Transfer in a Square Duct with Transverse Ribs Mounted on One Wall. Int. J. Heat Fluid Flow 2021, 89, 108782. [Google Scholar] [CrossRef]
  3. Leonardi, S.; Orlandi, P.; Smalley, R.J.; Djenidi, L.; Antonia, R.A. Direct Numerical Simulations of Turbulent Channel Flow with Transverse Square Bars on One Wall. J. Fluid Mech. 2003, 491, 229–238. [Google Scholar] [CrossRef] [Green Version]
  4. Nadeem, M.; Lee, J.H.; Lee, J.; Sung, H.J. Turbulent Boundary Layers over Sparsely-Spaced Rod-Roughened Walls. Int. J. Heat Fluid Flow 2015, 56, 16–27. [Google Scholar] [CrossRef]
  5. Lee, J.H.; Sung, H.J.; Krogstad, P.Å. Direct Numerical Simulation of the Turbulent Boundary Layer over a Cube-Roughened Wall. J. Fluid Mech. 2011, 669, 397–431. [Google Scholar] [CrossRef]
  6. Kuwata, Y.; Nagura, R. Direct Numerical Simulation on the Effects of Surface Slope and Skewness on Rough-Wall Turbulence. Phys. Fluids 2020, 32, 105113. [Google Scholar] [CrossRef]
  7. Jelly, T.O.; Busse, A. Reynolds and Dispersive Shear Stress Contributions above Highly Skewed Roughness. J. Fluid Mech. 2018, 852, 710–724. [Google Scholar] [CrossRef] [Green Version]
  8. Townsend, A.A. The Structure of Turbulent Shear Flow, 2nd ed.; Cambridge University Press: Cambridge, UK, 1976. [Google Scholar]
  9. Mejia-Alvarez, R.; Christensen, K.T. Wall-Parallel Stereo Particle-Image Velocimetry Measurements in the Roughness Sublayer of Turbulent Flow Overlying Highly Irregular Roughness. Phys. Fluids 2013, 25, 115109. [Google Scholar] [CrossRef]
  10. Hwang, H.G.; Lee, J.H. Secondary Flows in Turbulent Boundary Layers over Longitudinal Surface Roughness. Phys. Rev. Fluids 2018, 3, 014608. [Google Scholar] [CrossRef]
  11. Medjnoun, T.; Vanderwel, C.; Ganapathisubramani, B. Effects of Heterogeneous Surface Geometry on Secondary Flows in Turbulent Boundary Layers. J. Fluid Mech. 2020, 886, A31. [Google Scholar] [CrossRef]
  12. Willingham, D.; Anderson, W.; Christensen, K.T.; Barros, J.M. Turbulent Boundary Layer Flow over Transverse Aerodynamic Roughness Transitions: Induced Mixing and Flow Characterization. Phys. Fluids 2014, 26, 025111. [Google Scholar] [CrossRef]
  13. Mahmoodi-Jezeh, S.; Wang, B.C. Direct Numerical Simulation of Turbulent Duct Flow with Inclined or V-shaped Ribs Mounted on One Wall. J. Fluid Mech. 2022, 932, A48. [Google Scholar] [CrossRef]
  14. Fang, X.; Yang, Z.; Wang, B.C.; Tachie, M.F.; Bergstrom, D.J. Highly-Disturbed Turbulent Flow in a Square Channel with V-shaped Ribs on One Wall. Int. J. Heat Fluid Flow 2015, 56, 182–197. [Google Scholar] [CrossRef]
  15. Fang, X.; Yang, Z.; Wang, B.C.; Tachie, M.F.; Bergstrom, D.J. Large-Eddy Simulation of Turbulent Flow and Structures in a Square Duct Roughened with Perpendicular and V-shaped Ribs. Phys. Fluids 2017, 29, 065110. [Google Scholar] [CrossRef]
  16. Guo, T.; Fang, J.; Zhong, S.; Moulinec, C. Energy-Based Drag Decomposition Analyses for a Turbulent Channel Flow Developing over Convergent–Divergent Riblets. Phys. Fluids 2022, 34, 025115. [Google Scholar] [CrossRef]
  17. Leonardi, S.; Orlandi, P.; Djenidi, L.; Antonia, R.A. Heat Transfer in a Turbulent Channel Flow with Square Bars or Circular Rods on One Wall. J. Fluid Mech. 2015, 776, 512–530. [Google Scholar] [CrossRef]
  18. Stroh, A.; Schäfer, K.; Forooghi, P.; Frohnapfel, B. Secondary Flow and Heat Transfer in Turbulent Flow over Streamwise Ridges. Int. J. Heat Fluid Flow 2020, 81, 108518. [Google Scholar] [CrossRef]
  19. Fukagata, K.; Iwamoto, K.; Kasagi, N. Contribution of Reynolds Stress Distribution to the Skin Friction in Wall-Bounded Flows. Phys. Fluids 2002, 14, L73. [Google Scholar] [CrossRef] [Green Version]
  20. Xu, D.; Wang, J.; Chen, S. Skin-Friction and Heat-Transfer Decompositions in Hypersonic Transitional and Turbulent Boundary Layers. J. Fluid Mech. 2022, 941, A4. [Google Scholar] [CrossRef]
  21. Fan, Y.; Atzori, M.; Vinuesa, R.; Gatti, D.; Schlatter, P.; Li, W. Decomposition of the Mean Friction Drag on an NACA4412 Airfoil under Uniform Blowing/Suction. J. Fluid Mech. 2022, 932, A31. [Google Scholar] [CrossRef]
  22. Renard, N.; Deck, S. A Theoretical Decomposition of Mean Skin Friction Generation into Physical Phenomena across the Boundary Layer. J. Fluid Mech. 2016, 790, 339–367. [Google Scholar] [CrossRef]
  23. Li, D.; Luo, K.; Fan, J. Direct Numerical Simulation of Turbulent Flow and Heat Transfer in a Spatially Developing Turbulent Boundary Layer Laden with Particles. J. Fluid Mech. 2018, 845, 417–461. [Google Scholar] [CrossRef]
  24. Bartholomew, P.; Deskos, G.; Frantz, R.A.S.; Schuch, F.N.; Lamballais, E.; Laizet, S. Xcompact3D: An Open-Source Framework for Solving Turbulence Problems on a Cartesian Mesh. SoftwareX 2020, 12, 100550. [Google Scholar] [CrossRef]
  25. Raupach, M.R.; Shaw, R.H. Averaging Procedures for Flow within Vegetation Canopies. Boundary-Layer Meteorol. 1982, 22, 79–90. [Google Scholar] [CrossRef]
  26. Yuan, J.; Piomelli, U. Roughness Effects on the Reynolds Stress Budgets in Near-Wall Turbulence. J. Fluid Mech. 2014, 760, R1. [Google Scholar] [CrossRef]
  27. Schlatter, P.; Örlü, R. Turbulent Boundary Layers at Moderate Reynolds Numbers: Inflow Length and Tripping Effects. J. Fluid Mech. 2012, 710, 5–34. [Google Scholar] [CrossRef]
  28. Nagano, Y.; Hattori, H.; Houra, T. DNS of Velocity and Thermal Fields in Turbulent Channel Flow with Transverse-Rib Roughness. Int. J. Heat Fluid Flow 2004, 25, 393–403. [Google Scholar] [CrossRef]
  29. Rouhi, A.; Endrikat, S.; Modesti, D.; Sandberg, R.D.; Oda, T.; Tanimoto, K.; Hutchins, N.; Chung, D. Riblet-Generated Flow Mechanisms That Lead to Local Breaking of Reynolds Analogy. J. Fluid Mech. 2022, 951, A45. [Google Scholar] [CrossRef]
  30. Wei, T. Integral Properties of Turbulent-Kinetic-Energy Production and Dissipation in Turbulent Wall-Bounded Flows. J. Fluid Mech. 2018, 854, 449–473. [Google Scholar] [CrossRef]
Figure 1. Schematic of surface topographies discussed in the present study. Transverse bars were configured in case RA, and V-shaped cases with angles equal to 60 ° , 45 ° , 30 ° were set in RB, RC and RD, respectively.
Energies 16 03831 g001
Figure 2. Turbulent statistics of smooth wall case at R e θ = 2000 in inner units: (a) Mean streamwise velocity; (b) root mean square of turbulence intensities and Reynolds shear stress.
Energies 16 03831 g002
Figure 3. Comparison of the vertical profiles of (a) mean streamwise velocity and (b) temperature against the DNS data of Nagano et al.
Energies 16 03831 g003
Figure 4. Profiles of (a) momentum thickness ( θ ), (b) drag coefficient ( C f ) and (c) Stanton number ( C h ) in the streamwise direction for all cases.
Energies 16 03831 g004
Figure 5. Comparison between pressure drag D p and frictional drag D ν .
Energies 16 03831 g005
Figure 6. Comparison of the mean streamwise velocity profiles along the wall-normal direction with (a) viscous scaling, and (b) outer scaling.
Energies 16 03831 g006
Figure 7. Comparison of the mean temperature profiles along the wall-normal direction in (a) inner coordinate, and (b) outer coordinate.
Energies 16 03831 g007
Figure 8. Difference of (a) mean streamwise velocity and (b) mean temperature between V-shaped and transverse rib cases.
Energies 16 03831 g008
Figure 9. Contours of time-averaged normalized streamwise velocity and dimensionless temperature in diverging and converging areas in the x y coordinate.
Energies 16 03831 g009
Figure 10. Contours of time-averaged normalized statistics in the y z coordinate of the V-shaped cases. (a,d,g): mean streamwise velocity, (b,e,h): the intensity of the secondary flow motions, and (c,f,i): mean dimensionless temperature. Lines with arrows, which represent the direction of secondary flows, are superposed to highlight the vortical structures. The first, second and third rows represent cases RB, RC and RD, respectively.
Energies 16 03831 g010
Figure 11. Profiles of double-averaged (a) total shear stress, (b) dispersive shear stress and (c) turbulent shear stress along wall-normal direction.
Energies 16 03831 g011
Figure 12. Contours of time-averaged stress distributions in the wall-normal-spanwise planes: (ac) dispersive shear stress; (df) turbulent shear stress.
Energies 16 03831 g012
Figure 13. Profiles of double-averaged (a) total heat flux, (b) dispersive heat flux, and (c) turbulent heat flux along the wall-normal direction.
Energies 16 03831 g013
Figure 14. Contours of time-averaged heat flux in the wall-normal-spanwise planes: (ac) dispersive heat flux; (df) turbulent heat flux.
Energies 16 03831 g014
Figure 15. Comparison of contributions of different terms towards the total shear stress and heat flux.
Energies 16 03831 g015
Figure 16. (a) Mean Reynolds analogy s of each case, (b) Mean Reynolds analogy in the C f / C f s C h / C h s coordinate.
Energies 16 03831 g016
Figure 17. Investigation of local C f / C f s and C h / C h s . (a,c,e,g) are the local Reynolds analogies at the positions that crossed over the half range of the V-shaped ribs in the second-row figures. Only one point is plotted in the transverse rib case for the periodicity in the spanwise direction. (b,d,f,h) are the contours of C f / C f s and C h / C h s in the x z coordinate for each case.
Energies 16 03831 g017
Table 1. Numerical details for DNS cases in the rib domain.
Case γ ( ° ) Re θ nx × ny × nz u τ Θ τ δ / δ 0
RA902090499 × 309 × 1920.07350.05854.55
RB602124499 × 309 × 1920.09270.06154.62
RC452296739 × 309 × 1680.10250.07124.79
RD302160989 × 309 × 1280.09110.07904.87
Disclaimer/Publisher’s Note: The statements, opinions and data contained in all publications are solely those of the individual author(s) and contributor(s) and not of MDPI and/or the editor(s). MDPI and/or the editor(s) disclaim responsibility for any injury to people or property resulting from any ideas, methods, instructions or products referred to in the content.