Article

Energy Performance and Control Strategy for Dynamic Façade with Perovskite PV Panels—Technical Analysis and Case Study

by
Andrzej Ożadowicz
1,* and
Gabriela Walczyk
2
1
Department of Power Electronics and Energy Control Systems, Faculty of Electrical Engineering, Automatics, Computer Science and Biomedical Engineering, AGH University of Science and Technology, al. Mickiewicza 30, 30-059 Krakow, Poland
2
Somfy Sp. z o. o., Somfy Service Center, Project Technical Advisor, ul. Doktora Rudolfa Diesla 9, 32-005 Niepołomice, Poland
*
Author to whom correspondence should be addressed.
Energies 2023, 16(9), 3793; https://doi.org/10.3390/en16093793
Submission received: 13 March 2023 / Revised: 25 April 2023 / Accepted: 26 April 2023 / Published: 28 April 2023
(This article belongs to the Section A1: Smart Grids and Microgrids)

Abstract

:
Effective implementation of renewable energy sources (RES) is one of the main challenges in regard to the organization of local energy microgrids with buildings. One of the solutions is the use of dynamic building façades with photovoltaic (PV) panels, in particular the innovative perovskite solar cells (PSCs). This paper describes a case study performed on a pilot installation of perovskite PV panels located in Poland, Central-Eastern Europe. Results of preliminary measurements on this installation are provided in terms of verifying its energy efficiency and the possibility of selecting settings for the façade dynamics control system. Our experiments have considered the sun-tracking mechanism and its energy consumption as well as the impact of weather conditions at different times of the year. The energy efficiency results for the PV system, with average levels below 10%, are rather low. Therefore, even small energy savings in the operation of the PV system itself are significant. Changes in control scenarios for sun-tracking have been proposed and have obtained a reduction from 5% to 1% of energy consumption in autumn and from almost 3.2% to 0.6% in spring, in relation to overall energy produced by the PV system. The need for further experimental research from the perspective of the development and extension of the analyzed installation is pointed out as well.

1. Introduction

According to the latest industry report of the International Energy Agency (IEA), the buildings and building construction sectors combined are responsible for 30% of total global final energy consumption and 27% of total energy sector emissions. Energy demand from the buildings sector continues to rise not only driven by developing countries, but also by greater ownership and use of energy-consuming systems and appliances. Examples of this can be seen in the growing number of air conditioning devices and systems and the rapid growth in the floor area of global buildings [1,2,3]. However, at the same time, the renewable energy sources (RES) generation sector is growing and developing rapidly. According to another analysis and forecast published by IEA, the overall renewable electricity generation is expected to increase almost 60% to 2027, with solar photovoltaic (PV) sources as the leader, with a share of total cumulative power capacity from 12.8% in 2022 to 22.2% in 2027. It is estimated that RES generation will account for almost 40% of global electricity production in 2027, offsetting the declining share of the most popular sources based on coal, natural gas, and nuclear energy [4,5].
Over the last ten years, rapid advances in RES technology and changes in regulations for the construction of prosumer installations have resulted in an increasing number of RES being installed as part of building infrastructure. This applies, in particular, to PV panel systems placed on roofs, façades of buildings, and in their immediate surroundings, creating building-integrated photovoltaic (BIPV) solutions [6,7]. The accessibility of these technical solutions, with new policy and by building user awareness of effective use of energy, open new ways for ecological transition in electrical energy supply with local microgrids, as well as in virtual plants with building infrastructure [8,9,10]. There are many different technologies for the construction of the PV panels themselves with different technical parameters regarding the method of converting solar energy into electricity. They determine the dimensions of the panels, their weight, and, above all, energy efficiency. These three aspects are the subject of numerous research projects, development works, and case-study analyses conducted in many countries around the world [11,12,13].

1.1. State of the Art, Related Work

In this paper, a case study of a dynamic building façade with perovskite photovoltaic (PPV) panels is discussed. Basically, these kinds of installations refer to BIPV systems, which integrate PV materials into building envelopes to produce electricity on-site. In this form, the PV modules can be easily applied as parts of roofs, windows, façades etc., especially during the design and construction stages. Therefore, BIPV technologies are quite suitable to be applied to new buildings. However, the type of application is determined, primarily, by the technologies of PV panels. There are many such technologies, which generally fall into three generations [11,12,14]:
  • First generation, with single-crystal and monocrystalline silicon as well as polycrystalline and multicrystalline silicon—classic PV panels, generally not flexible;
  • Second generation, with amorphous silicon, cadmium telluride, and copper indium gallium selenide—flexible;
  • Third generation, with a very wide spectrum of materials such as organic solar cells, nanocrystal solar cells, and perovskite solar cells (PSCs)—flexible, thinner, and semi-transparent.
Technologies of all generations are still being developed due to their technical predispositions for various application areas. However, in the application of dynamic façades, PPV panels are very promising, primarily due to the simplicity of their manufacture, the ability to adapt to various surface shapes, and transparency. The PSCs could be applied with low-cost processing techniques such as spray coating, spin coating, screen coating, and thermal evaporation [15,16]. In addition, power and energy performance remains an extremely important issue. Tiantian Zhang et al. [14] discuss several aspects related to that question, highlighting the importance of overall energy performance verification studies on PPV systems installed in real facilities. Based on their own experience and tests conducted by other teams [17,18,19], they indicate the particular importance of various installation parameters affecting optical performance, thermal performance, and power performance. Moreover, in [3], Woo-Gyun Shin et al. discuss similar questions and go even further. They have focused on technical and environmental aspects related not only to the direct energy performance of BIPV systems but also to a prediction and forecasting of power generation. In this context, the location of buildings, their orientation in relation to the cardinal directions, and the climatic zones take on significant importance and are the subject of tests and case-study analyses [20,21,22]. There is other research, related directly to the performance evaluation of solar energy cells, that considers various methods of modeling and advanced calculations. For instance, in [23], Akram M. et al. proposed an advanced mathematical model and fuzzy tools for this kind of evaluation. Moreover, in [24], theoretical analysis and laboratory research on PSCs are described as well. However, most of these studies are based on theoretical models and simulations. There is a lack of real systems evaluations with dedicated case-study analyses. Therefore, they are very important in the context of technological and ecological transition of the energy supply systems, especially virtual power plants and distributed micro-grids with RES [9,25].
On the other hand, there are several challenges and even barriers in widespread adoption of BIPV that have been reported among others in [26,27,28]. They can be divided into three main groups: (i) technical, (ii) design, and (iii) legal and social. The last group concerns diversified standards and legal conditions at various levels (national, industry), enabling the implementation of BIPV installations. They are not considered nor discussed in this paper. The issues of the projects and designs concern various arrangement concepts of static and dynamic building façades with PV panel installations. It is worth emphasizing that the design concepts also determine the potential of installation in terms of energy performance and efficiency. Examples with pros and cons analysis are discussed in [5,26]. Finally, the first mentioned group of technical barriers and challenges includes different aspects. One of them is the rapid degradation of PSCs raised in the context of the commercialization of PPV panels. Numerous publications discuss the factors causing this degradation of PSCs in tested panels in various technologies, and they are primarily related to the impact of sunlight and high temperature, i.e., natural weather factors, which are conducive to the high energy efficiency of the panels themselves [29,30]. At the same time, researchers are working to verify techniques and tools aimed at limiting the degradation processes and ensuring the high stability of the operation of PPV panels in various weather and climate conditions [31,32,33]. However, the degradation of PSCs is not analyzed in this paper. All measurements and analyses of the PPV panels’ effectiveness were carried out for the installation as it was, taking into account the progressing phenomena of their degradation. Therefore, this paper is focused on a real BIPV system, considering possibilities to improve its energy efficiency with control scenarios for the sun-tracking system. Research and testing of these systems are focused on maximizing PV energy performance while simultaneously reducing energy consumption for the implementation of the sun-tracking function and ensuring light and thermal comfort in the rooms behind the façade [34,35]. One of the analyzed solutions is the selection of control scenarios for the dynamic façade slats in order to maximize the PV panels’ energy production while minimizing the necessary movements of the slats and the associated energy consumption. It should be noted that such solutions are not universal and should always consider a specific location and its conditions, hence the case-study analyses are important [20,36,37].
The latter are of particular importance due to the impact of natural weather, climate, and legal conditions on the RES, and in particular, PV panels and even the efficiency of local electrical microgrids [14,36,37]. In order to improve these, basic and advanced control systems are used, taking into account Building Automation and Control Systems (BACS). BACS and smart building systems based on distributed fieldbus technologies provide support and integration of necessary sensors (temperature, light intensity, weather stations, etc.) and building infrastructure actuators in event-based mode [38,39,40]. They are of particular importance considering the trend toward intelligent systems development with functions of building control and management. This trend is determined by the provisions of the latest European Union directives: the Energy Performance of Buildings Directive (EPBD) [6] and the Energy Efficiency Directive [41]. A new instrument and tool supporting the selection of building infrastructure control and management functions, considering RES and elements of energy microgrids, is the Smart Readiness Indicator (SRI)that was introduced by the EPBD Directive. The guidelines of this indicator are already an element of research and verification in scientific and engineering teams [42,43,44]. Moreover, they determine new social models for ecological transition by changing maintenance and management of building infrastructure by considering their significant energy consumption and the new role of buildings in a transactive energy market [45,46,47].

1.2. Contributions

Bearing in mind all these aspects, in this paper, a technical analysis of a dynamic building façade pilot installation with PPV panels is presented with the results of experiments regarding the verification of their energy efficiency in a real system. The main contributions of the paper are given as follows:
  • Detailed technical analysis of a pilot installation with PPV panels for a specific location in Central and Eastern Europe—a real case study;
  • An original set of measurement data of the most important parameters that have a direct impact on the energy efficiency of the dynamic building façade with PPV panels (short measurement periods for different seasons, conditioned by the availability of a pilot installation);
  • Multi-faceted analysis of power effectiveness and performance of PPV panels, considering trends of changes in the operating conditions of the pilot installation, along with a discussion of the results;
  • New strategy for control of the dynamic building façade to improve its energy efficiency and ensure the comfort of use of the rooms behind it.
The remainder of this paper is organized as follows. Information about the case study dynamic façade installation with a control and measurement system is presented in Section 2. Next, Section 3 provides an analysis of measurement data, with the determination of trends in changes of dynamic façade energy efficiency, for different weather conditions and sun-tracking options. Afterwards, a short energy performance analysis, together with a proposed control scenario for the façade to improve its energy efficiency, are discussed in Section 4. Finally, Section 5 gives the conclusions and suggestions for future work.

2. Methods and Tools

Real PV installations with perovskite technologies are still relatively new and innovative solutions. This applies to the use of PSCs built into the elements of the building’s dynamic façade as part of its power supply system. However, it should be emphasized that the basic functions of these façades are related to ensuring thermal and light comfort in the building, and the generation of energy from integrated PPVs is treated only as an additional power source. Therefore, in this paper, a technical and parametric analysis is provided by considering the operation of the real dynamic façade system with PPV modules in the context of its energy efficiency and by considering sun-tracking function. The results are important due to the planned façade expansion in the presented pilot installation and the construction of further twin systems in subsequent buildings, which are based on the experience from this pilot installation.
The research presented in this paper was carried out on a pilot installation of PPV (by Saule Technologies [48]) on the façade of the Aliplast Poland headquarters building in Lublin (Poland). This is the first PV façade system with PCSs in Poland; it was launched in August 2021. The first tests and measurements were carried out in October 2021, after 2 months of normal operation of the system.

2.1. Perovskite PV Pilot Façade

The pilot system with PPV panels is an integral part of the architectural design of the building, using the glazed surface of the façade oriented to the south and considering the required assumptions of interior lighting comfort and energy efficiency of buildings. The overall, real view of the façade with the installation is shown in Figure 1. The dimensions of the installation with PPV panels are: height 10 m, width 3 m.
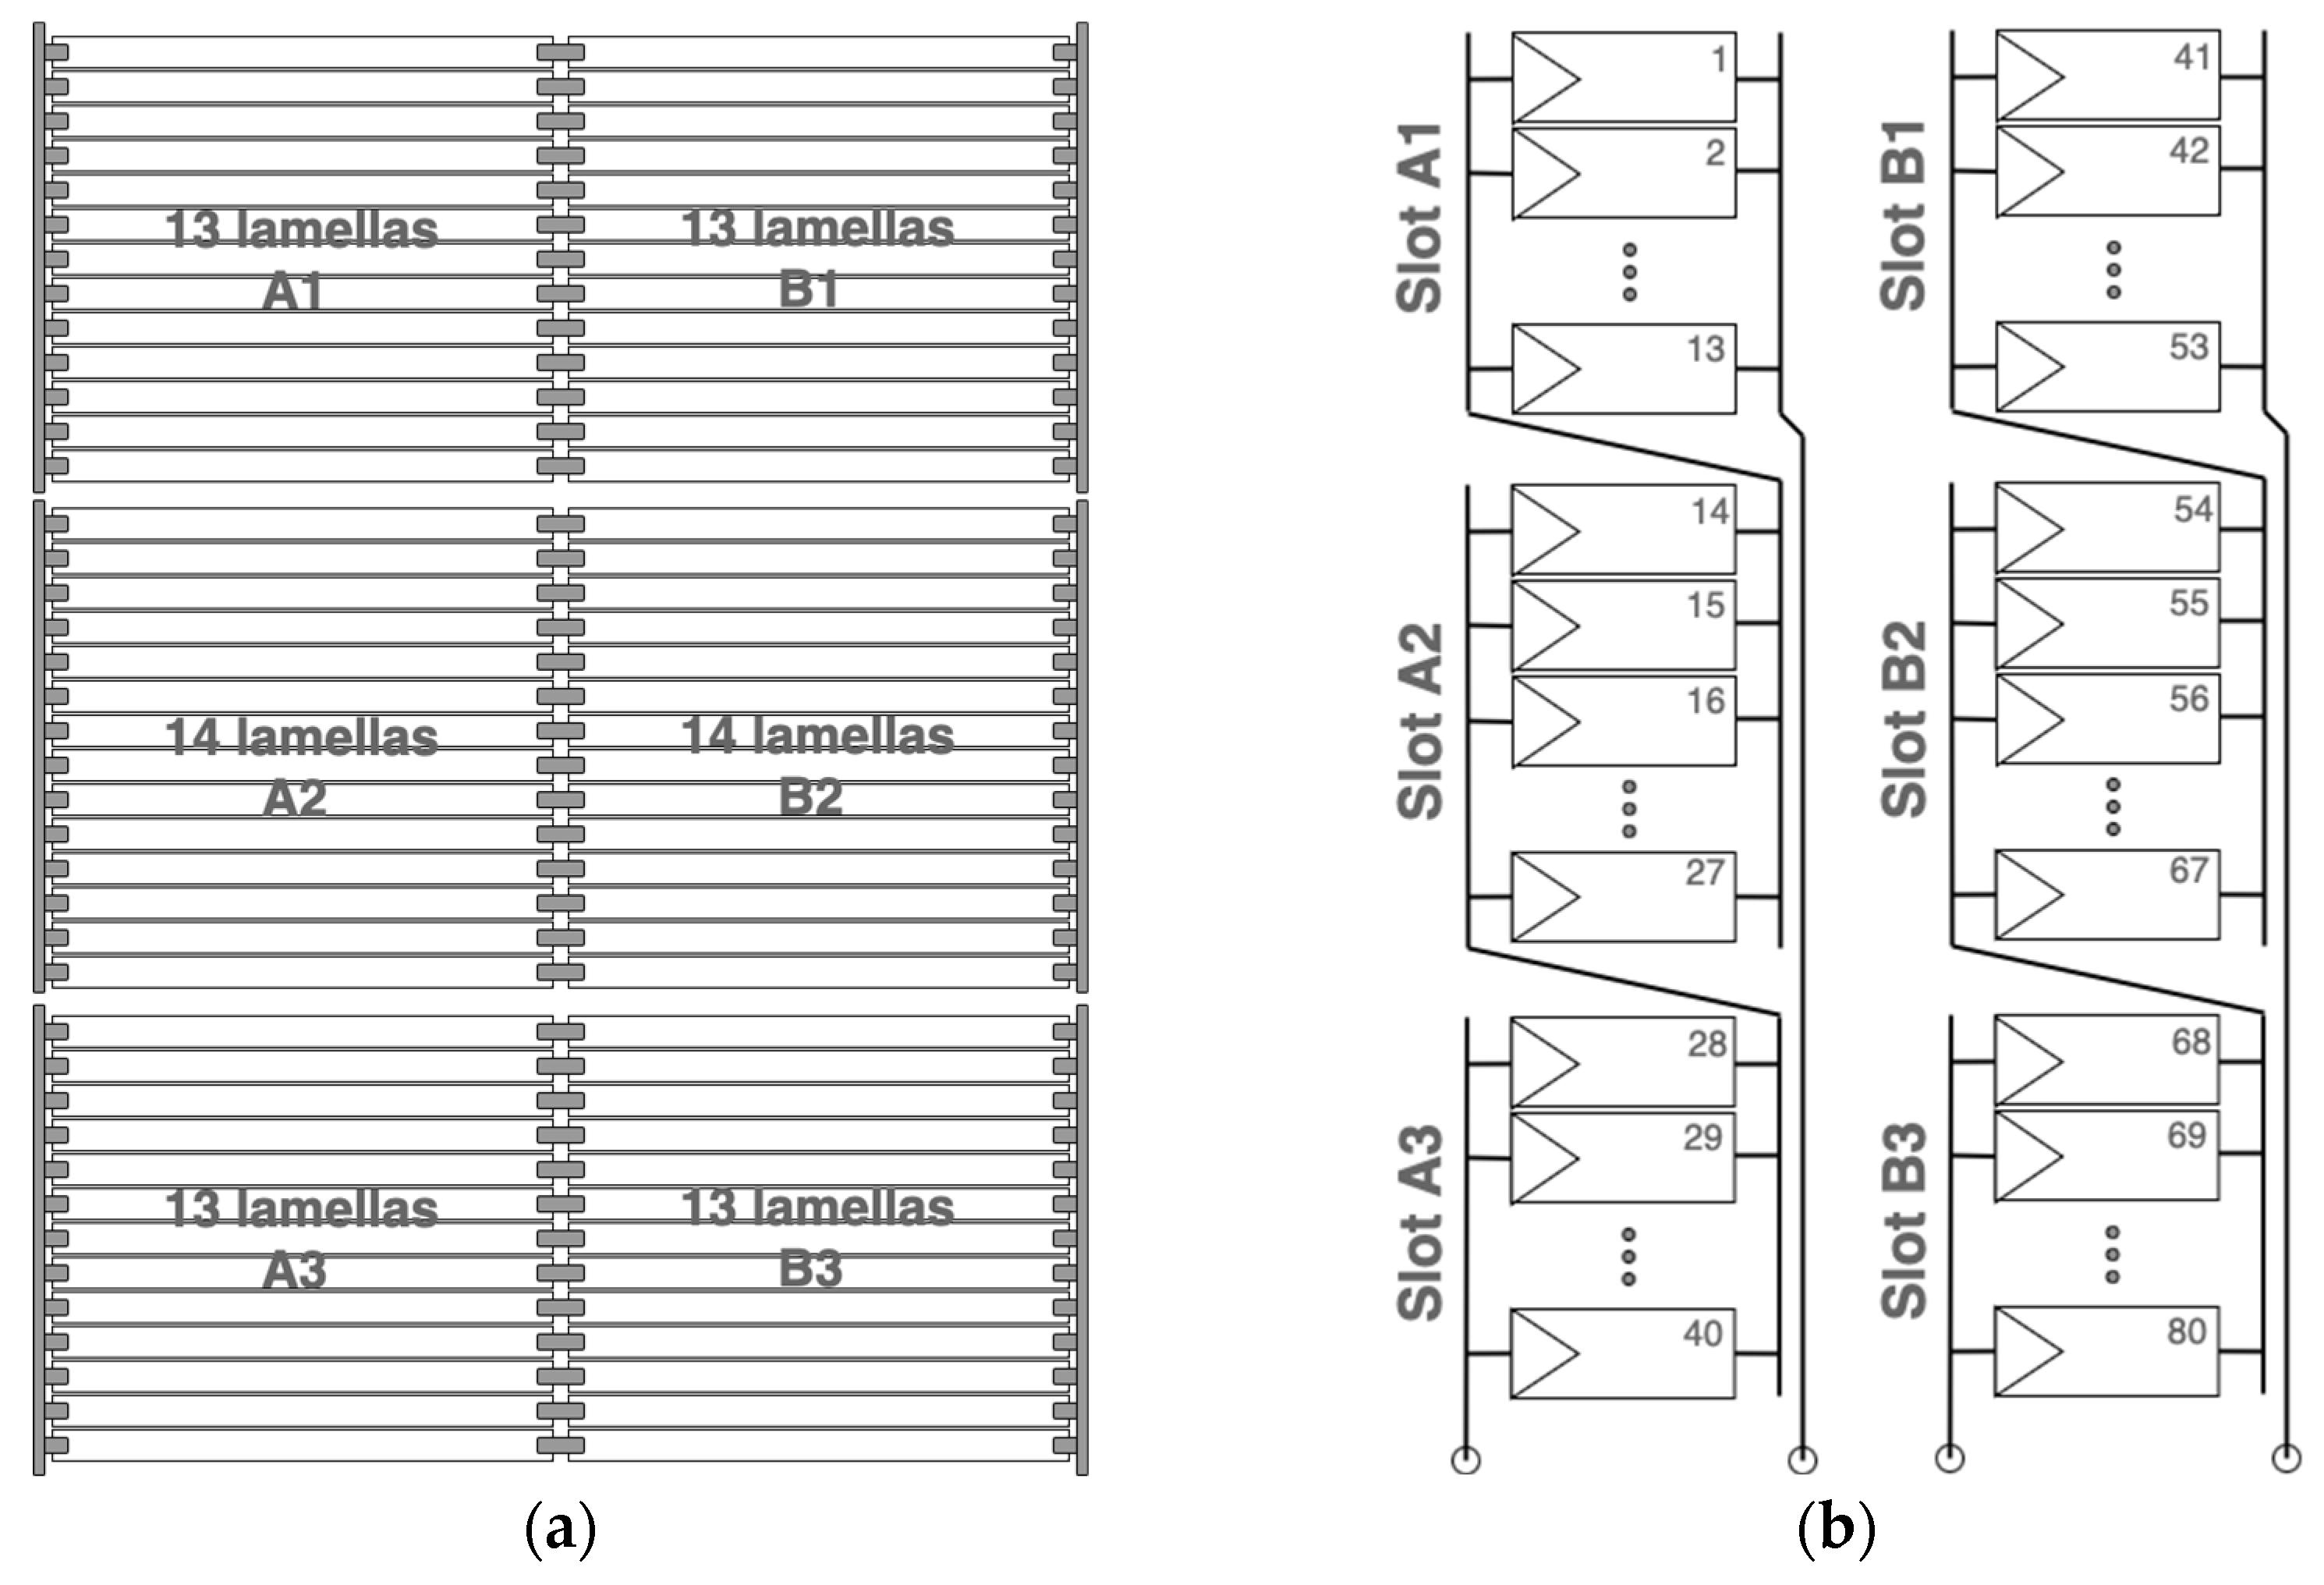
The entire façade consists of 80 slats (lamellas) divided into two groups (columns) of 40 slats and connected to a controller in a battery charger with the Maximum Power Point Tracking (MPPT) algorithm implemented. The PPV façade construction framework is shown in Figure 2a. Each group of 40 slats (called sun-breakers as well) is divided into 3 slots connected in series. The second, middle slot consists of 14 slats, while the third and first are 13 panels connected in parallel inside each slot. Figure 2b shows a simplified electrical diagram of the PPV façade installation.
There are no bypass diodes in this installation, instead there are blocking diodes. Each module has a blocking diode connected in series. During normal daytime operation of the PPV panels, the generated current passes uninterrupted through the anode of the blocking diode and on to the inverter. At night, when the panels do not produce electricity, the system tries to balance the difference in electrical charge between the PSCs and the batteries. There is a current flow from the batteries to the PPV panels, which can damage or destroy them. However, in this situation, the blocking diode is reverse biased and blocks the current flow, protecting the PSCs from damage. When the sunlight illuminates the PPV panels again, the blocking diode is biased in the forward direction and the system works normally and safely.

2.1.1. Moving PPV Slats with Motors

All the slats are made of aluminum and covered with a perovskite film of microscopic thickness; they are 90% lighter than silicon cells. The flexibility of the thin film with PSC modules enables almost entire coverage of the available surface of the slat. The dimensions of a single lamella in mm are shown in Figure 3. The length of each element is 2833 mm.
Technical data indicates that the usable surface of the slats is over 240,000 cm2. The energy conversion efficiency is specified by the manufacturer at 17%. It also guarantees a power yield of up to 170 W/m2, providing a generated power about 4.7 kWp for the entire installation at peak insolation.
The PPV façade is dynamic, and the slats move in the angular range from 0 to 90 degrees. The 0-degree angle corresponds to the horizontal position of the slats (open façade), and the 90-degree angle corresponds to the vertical position (closed façade—theoretically complete cut-off of sunlight penetrating inside the building). The full range of movements can be seen in Figure 4.
The slats in the façade are driven by linear motors Euro 1 from the Mingardi (Somfy group). They are powered by the mains voltage of 230 V AC directly from the MoCo module (Motor Controller), belonging to the animeo IB+ system (Somfy BMS platform presented in detail in Section 2.2) [49,50]. There are three such motors in the discussed installation, one for each of the three façade zones: ground floor, first floor, and second floor, respectively. This means that different scenarios can be implemented for each floor, since the groups of slats move independently. This approach also provides better control of the opening angle in response to the changing position of the sun than implementing the entire dynamic façade with a single drive. All three motors are installed on the ground floor for ease maintenance. Appropriate extension with the rods allows the movement to be transferred to the first and second floors. Friction and resistance to movement of the rods are negligible. The motors lift the façade with a maximum force of 450 N with the maximum power 35 W at the limit load.

2.1.2. Inverter and Batteries

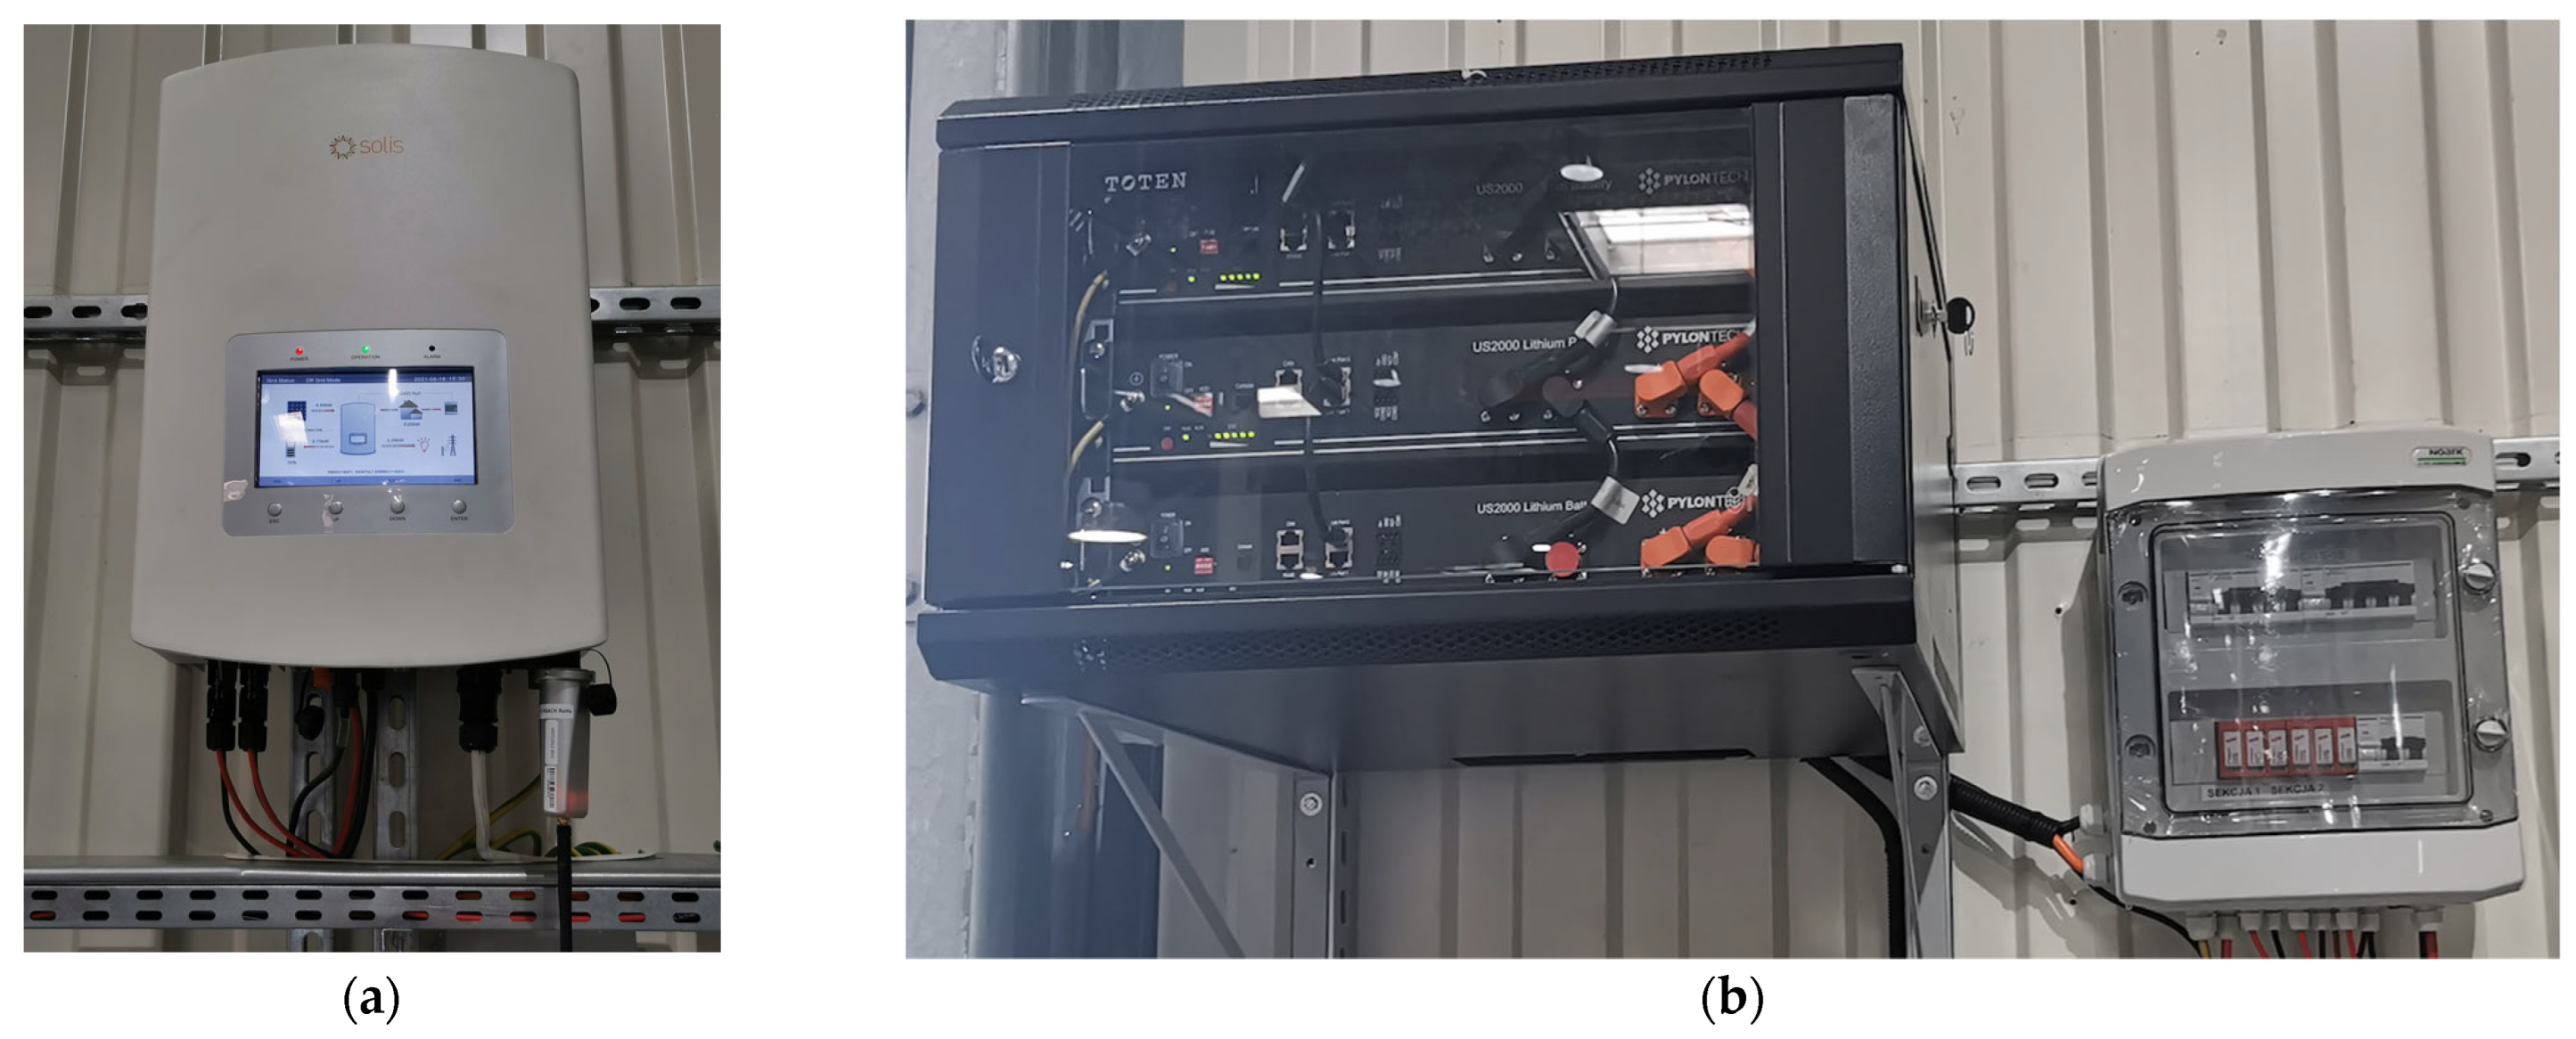
The installation uses a Solis RHI-(3-6) K-48ES-5G inverter with a maximum efficiency of 98.4%. Its nominal power consumption is 7 W. The inverter works with a set of PYLONTECH US2000 rechargeable batteries and LFP lithium batteries (pouch cell type). The 3 battery modules connected in parallel offer a total capacity of 150 Ah. Both inverter and batteries are shown in Figure 5.
There is a limited compatibility of connected devices within this pilot installation. The inverter provides a maximum battery charging current of 25 A, which is the minimum value recommended for this type of battery with a current of up to 50 A. Thus, compatibility is only ensured at the maximum current from the inverter to the batteries. With reduced efficiency of photovoltaic cells, unfavorable operating conditions are possible (excessive battery discharge or the need to use energy from the grid). This condition results from the preparation of the installation for the next façade modules planned to be installed in the future by the building owner.

2.2. Automation System Devices and Configuration

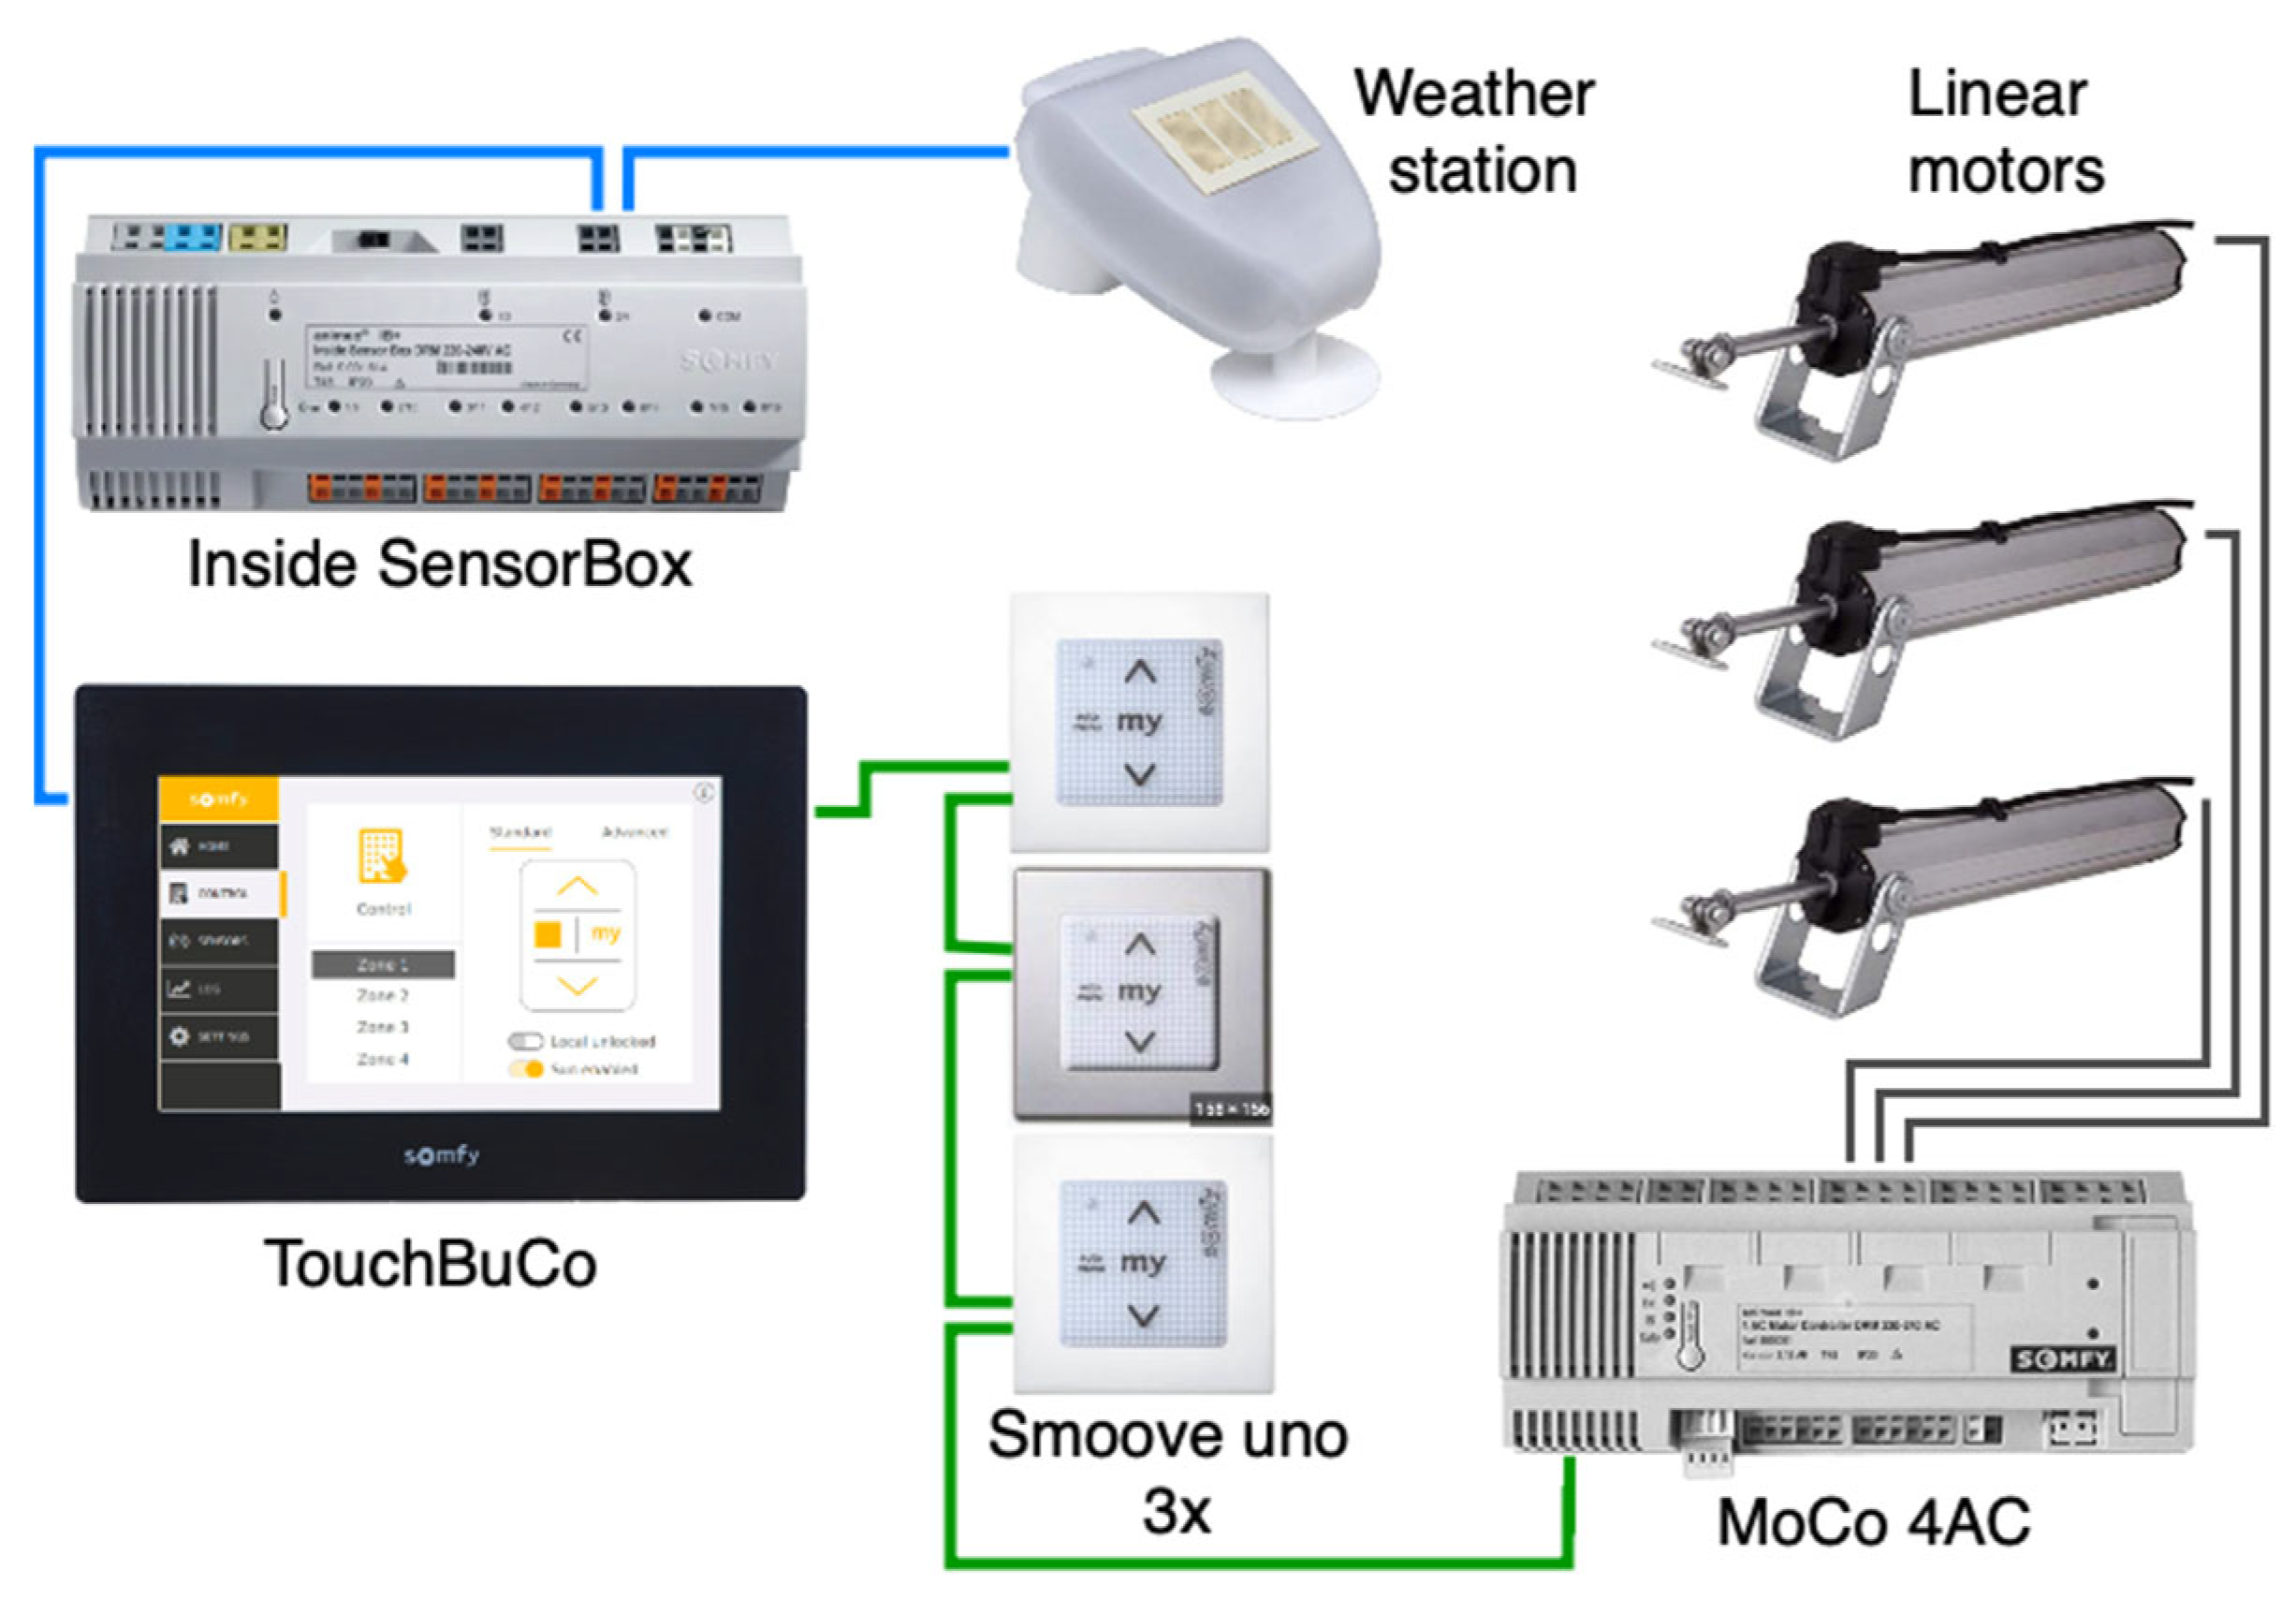
The façade control system is based on the animeo IB+ platform (Somfy BMS platform) and is integrated into the structure of the building management system (BMS) [49,50]. This ensures the possibility of constant monitoring of the system operation status, its configuration, and reading the history of events. It also provides access to weather condition sensors from the weather station integrated within the BMS and located at the roof of the building. Figure 6 shows the connection diagram of all the devices of the dynamic building façade control system.
The main controller is the Touch Building Controller (TouchBuCo). It cooperates with the BMS and controls the façade by considering information from sensors of sunlight illuminance level, rain, wind strength, and direction. The control of the façade slat groups is carried out by the Motor Controller (MoCo) with the three already mentioned Minigardi linear motors connected. In addition, Smoove Uno IB modules were placed on each floor of the building. They provide the possibility of local control of stat groups in the windows of a given floor, with the status transfer to the main controller TouchBuCo. In this way, Minigardi actuators can be controlled both individually by Smoove Uno IB modules or centrally from the BMS level (e.g., time schedules, weather conditions, etc.).
As mentioned at the beginning of Section 2, the basic functions of the dynamic façade are related to ensuring thermal and light comfort of the building’s rooms. By assumption, the issues of energy generation by PPV panels placed on the slats are of secondary importance. Therefore, the priority function of the animeo IB+ control system is “Sun”. It provides optimal protection against glare and overheating of rooms, while maintaining natural lighting conditions. This function is activated when the illuminance of sunlight remains above the activation threshold value set in the controller for longer than the set delay time for switching on the façade. When the function is activated, the covers are moved to an adjustable position (%) and the horizontal slats are set to an adjustable angle (°). The function is active until the sunlight illuminance drops below the switch-off threshold value for longer than the set delay time for switching off the façade.
In addition, the TouchBuCo controller also provides some extra functions. The first one is “Heat block”—it prevents overheating of the building in case of excessive insolation. Its activation depends on the intensity of the sunlight and on exceeding the predetermined threshold temperature, both outside and inside the building. Another additional function is “Solar heating”. When the temperature inside the building is too low, solar radiation can be used to heat it. The sun breakers (slats) are moved to the appropriate position, e.g., fully open. The function is activated based on the illuminance of sunlight and the value of the indoor temperature. The last of the extra functions is “Keeping warm” activated when the temperature difference between inside and outside the building exceeds the delta value set in the controller. The function allows to maintain the required temperature in the building’s rooms using a dynamic facade. In the discussed system, it is used outside working hours, without the activity of people in the building.

2.3. Measurement Stand and Procedures

To verify and analyze the effectiveness of the PPVs installation integrated in the dynamic façade, a dedicated measuring stand with additional light illuminance and temperature sensors was developed and implemented. These are two key physical parameters with a direct impact on the level of power generated in the PPV panels and transferred to the Solis inverter.

2.3.1. Sunlight Illuminance and Temperature Sensor

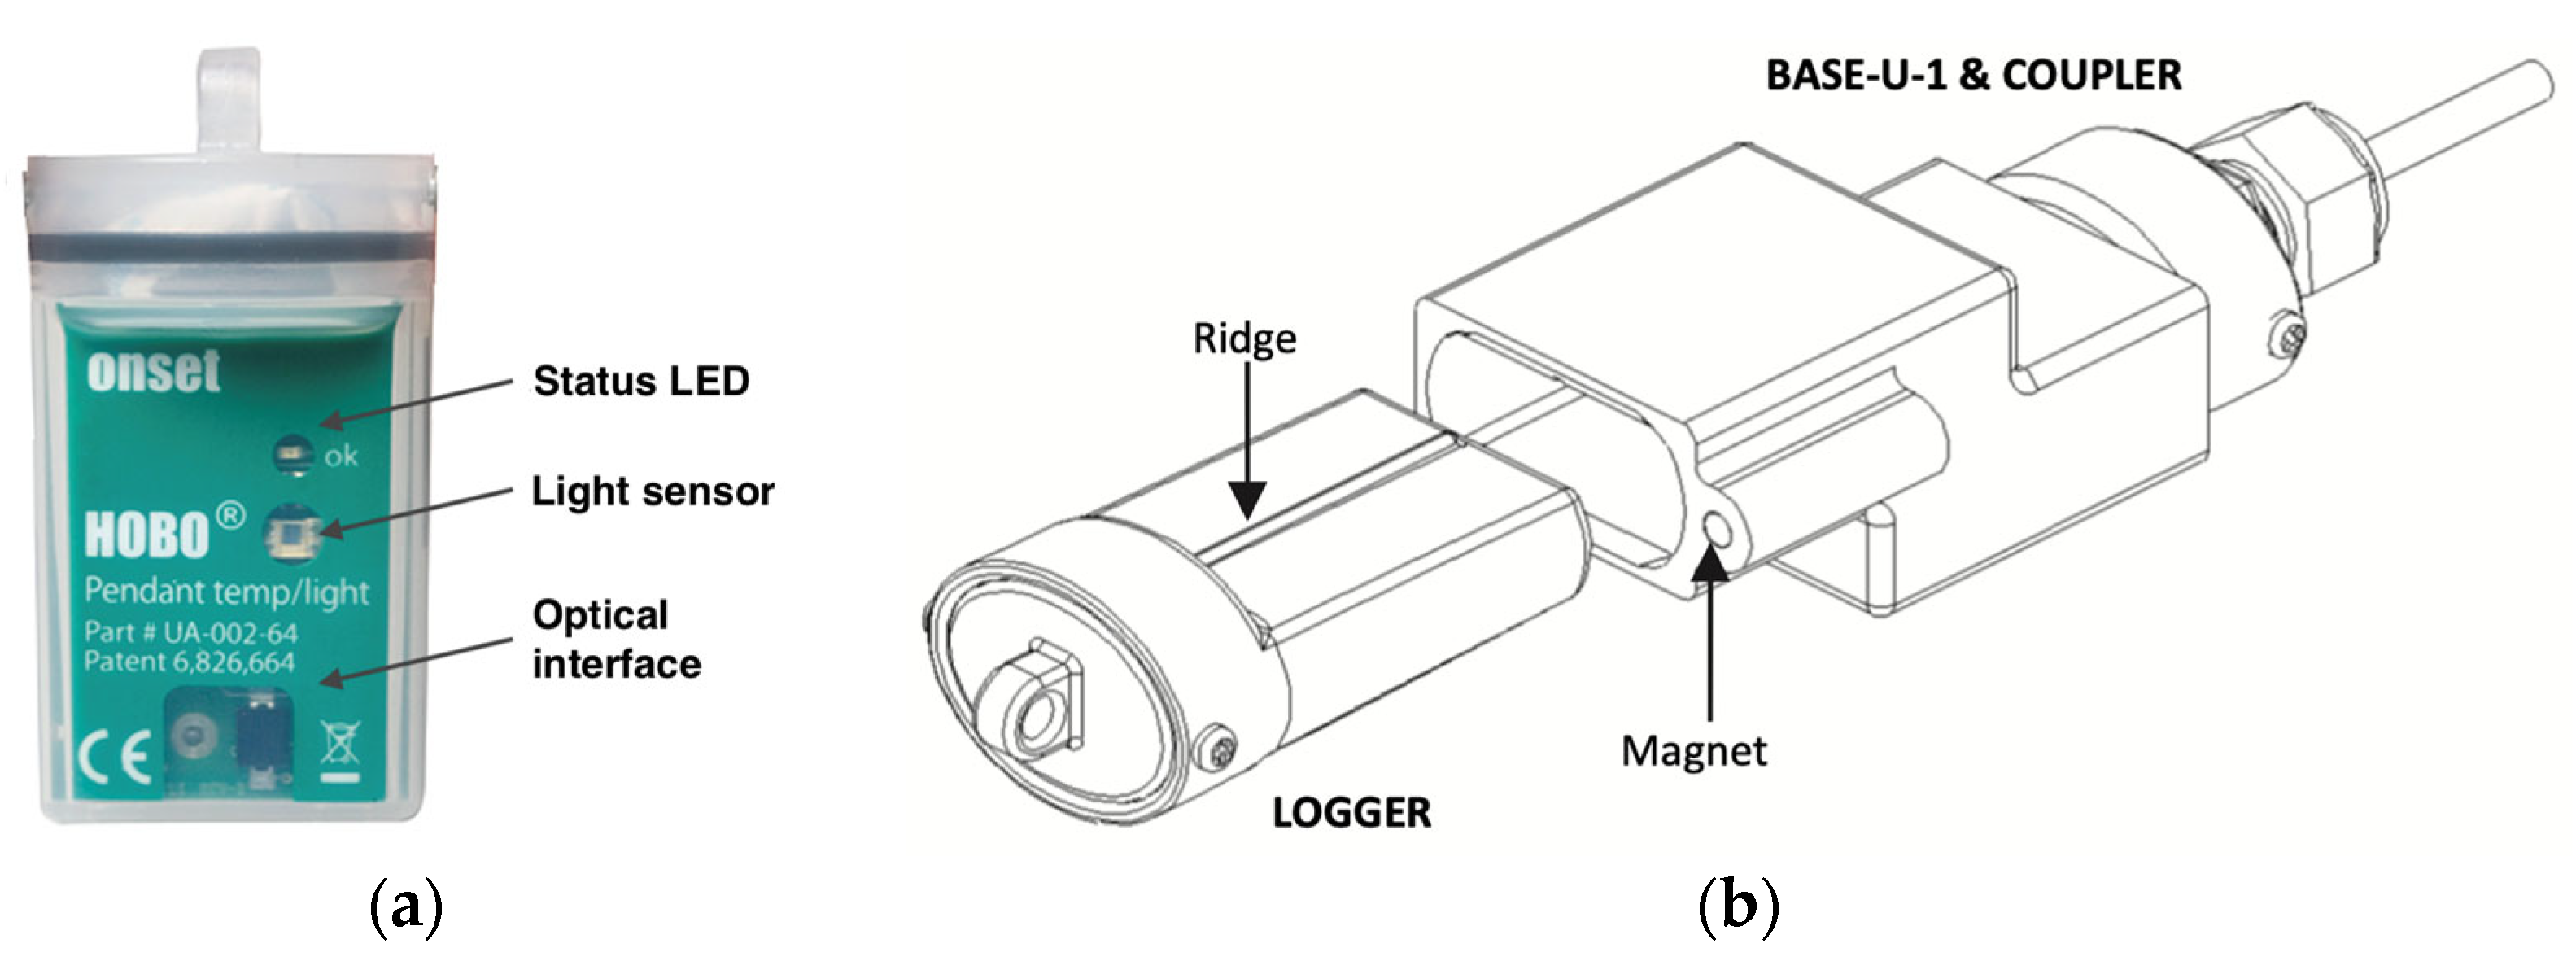
For verification measurements, a miniature two-channel temperature and relative light level data logger/sensor HOBO Pendant UA-002-64 was used. It is a sensor with 64 K memory for logging data, with a waterproof housing for deployment in indoor, outdoor, and underwater applications, measuring relative light levels and ambient temperatures. This 64 K model stores approximately 52 K of 10-bit readings. For analyses (for instance plotting data and trends), the recorded data can be transferred from the logger to a computer through the optical interface using the base station and the USB interface. The view of the sensor and the base station is shown in Figure 7 [51].
As is standard, data is processed in a dedicated HOBOware software (ver. 3.7.20) used for launching, reading out, and plotting data from HOBO data loggers. The data logs from the logger record: log number, date and time, temperature, intensity in lux, and coupler connection identifiers (if needed). An example of recorded real, raw sensor data is shown in Figure 8.
For the purposes of the analyses presented in this paper, data records were exported in text and Excel formats and finally imported into the MATLAB MathWorks tool to obtain greater data processing capabilities.

2.3.2. Measurement Stand and Infrastructure

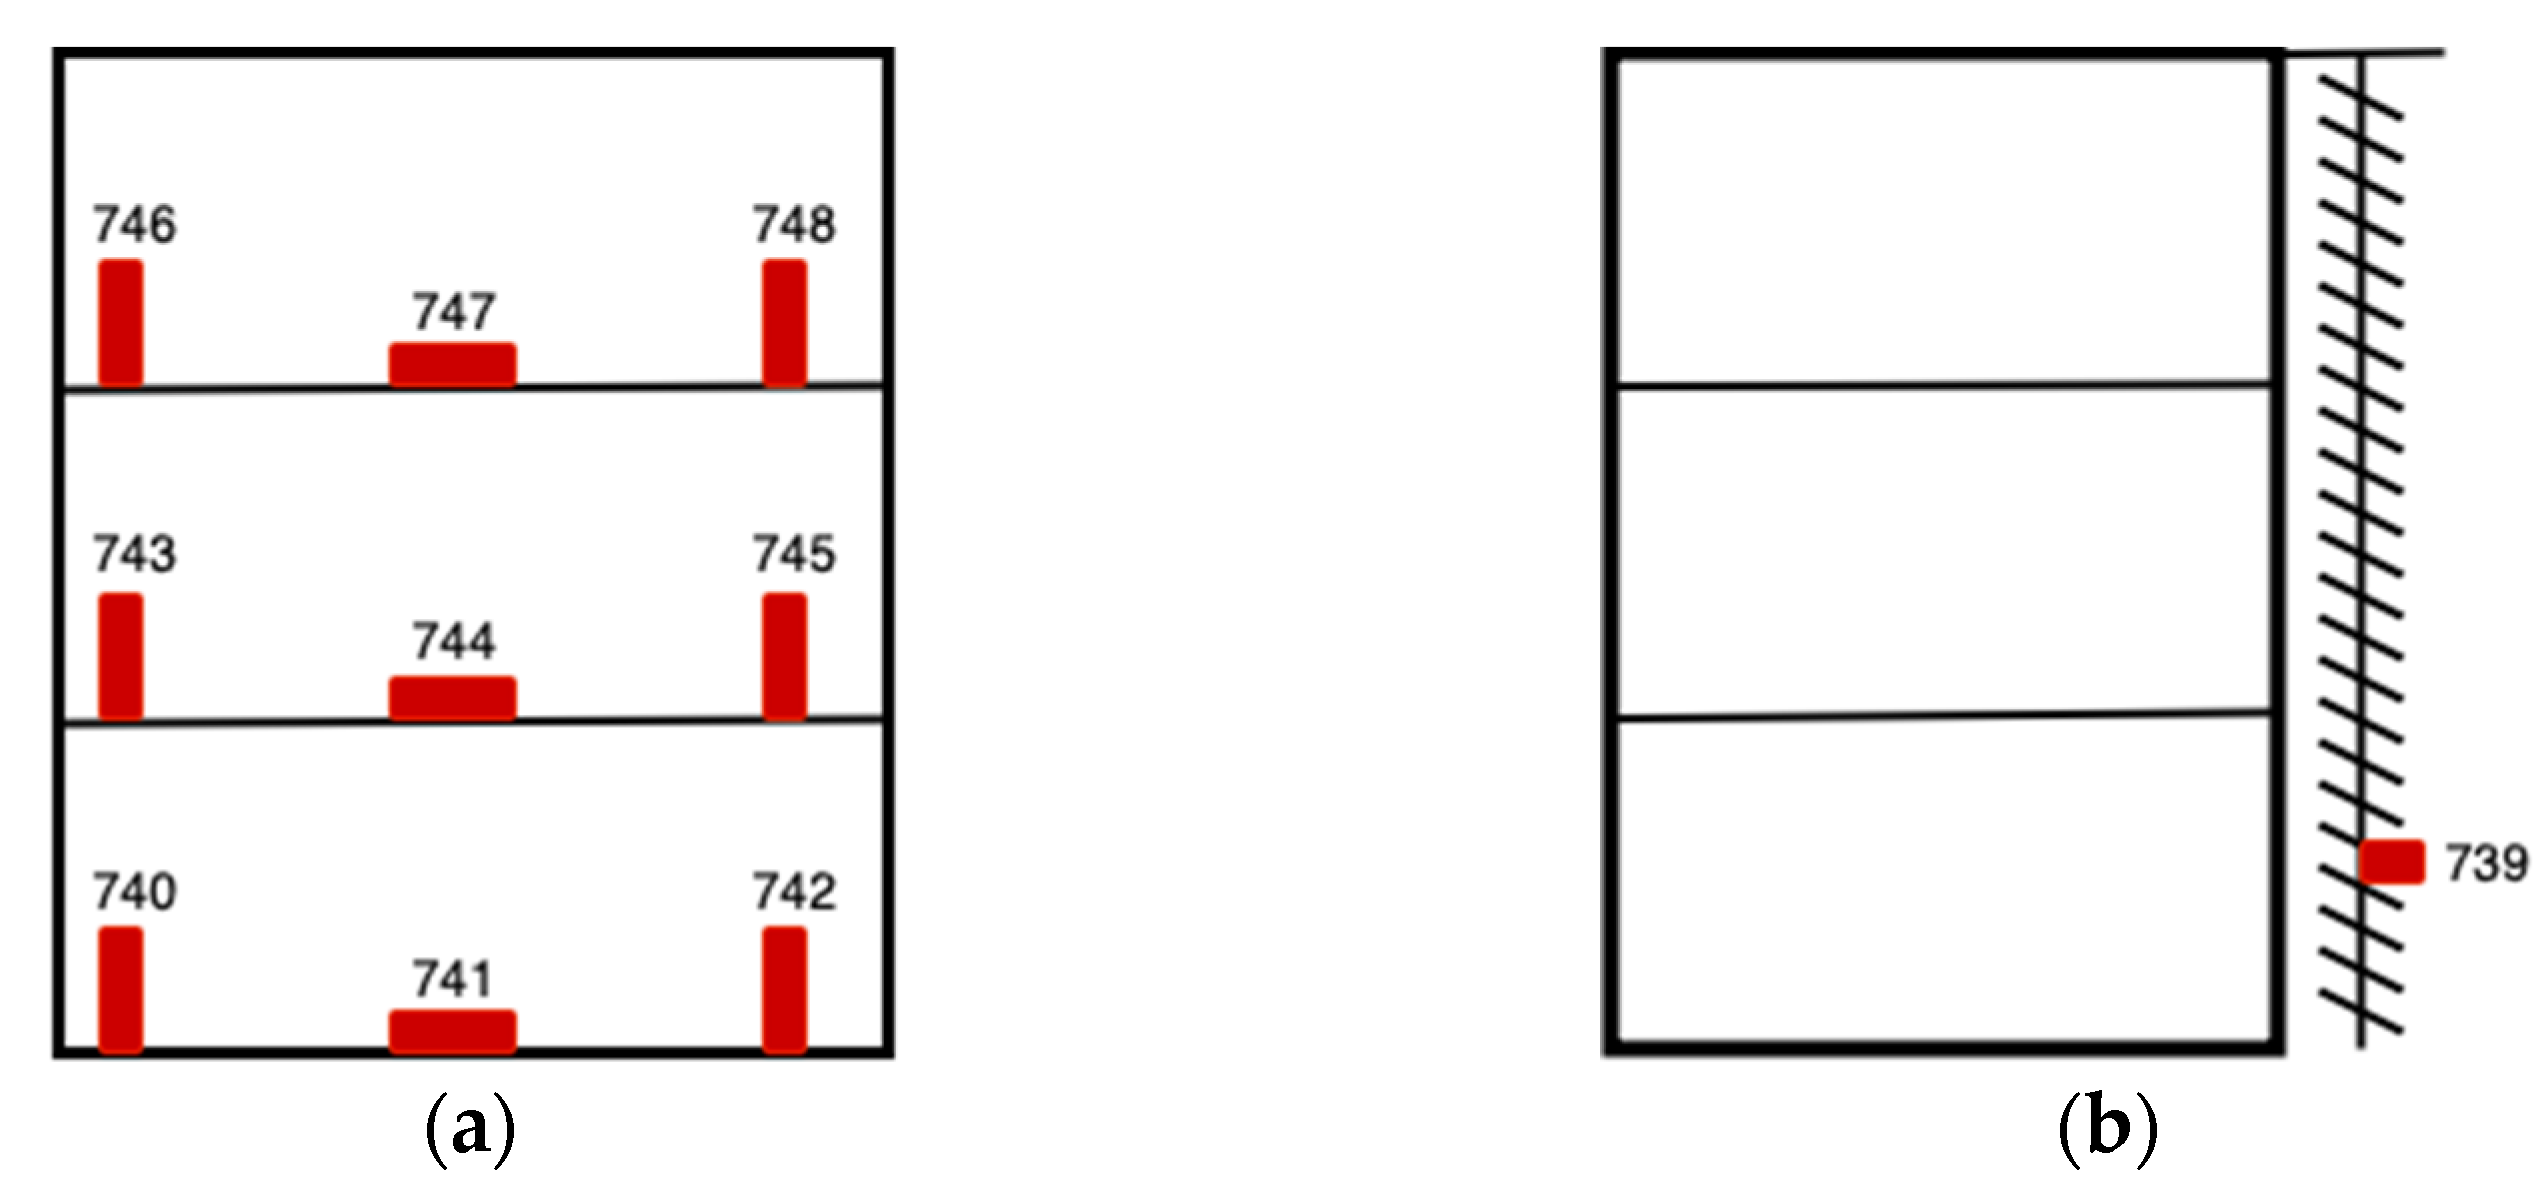
The most important parts of the test stand were the 10 data loggers with light and temperature sensors placed near the façade. One of them was directly mounted to it, providing key data for analysis. The other 9 loggers and sensors were placed within the building, directly at the windows of the façade, with 3 sensors for each floor. An illustrative view of the arrangement of data loggers is shown in Figure 9.
Loggers with numbers 740, 742, 743, 745, 746, and 748 were placed in a vertical position, and the rest (741, 744, 747) in a horizontal position. This approach ensured reliable, averaged results of measuring the illuminance of the light in the vicinity of windows.
Energy efficiency analyses also required data on the power delivered by the PPV installation to the battery storage and produced directly by the PPV panels on lamellas. Data on the delivered power was obtained from measurements carried out and recorded by the Solis inverter, which is important in kW units, with an accuracy of two decimal places. It should be noted that the inverter itself consumes 0.007 kW, which was not included in the measurement results due to the constant presence of the inverter module in the installation. Therefore, it is the power lost to maintain the device monitoring the operation of the panels and the distribution of power in the installation. Data on the power produced by the PPV panels was obtained indirectly based on the measured values of the illuminance of sunlight falling on the PPV panels, from the light sensor placed on the façade (logger 739). In accordance with the laws of optics and unit conversion guidelines, the following conversion factor was adopted [52,53,54]:
1 W/cm2 = 104 W/m2 = 6.83 × 10⁶ lux
It calculated for the maximum irradiance and illuminance of the solar light at the wavelength 555 nm (green). Based on it the conversion factor used in the measurement data, processing in MATLAB scripts for the analyses is as follows:
1 lux = 1.4641288433382138 × 10⁻⁷ W/cm2
To obtain the value of the power produced by PPV panels in Watts, the data from the light sensor was divided by the value of working surface of the panels (240,000 cm2). The values of the angle of the façade’s slats were set in the TouchBuCo controller. To increase the accuracy of the set angle and the repeatability of the setting and measurement procedures, each time after the measurements of a given angle, the slats were returned to the position 0° (zero degrees) and subsequent settings were made starting from this position.

3. Experimental Results, Analysis, and Discussion

As already mentioned in the paper, PPV panels applied to dynamic building facades are still innovative and experimental solutions. In addition, it should be emphasized that the effectiveness of their operation depends on many external factors and technical parameters of the entire façade installation [55,56]. Therefore, considering the availability of the pilot installation described in Section 2, a case-study approach has been organized to collect and present the results of two short series of measurements carried out with the use of sensors, elements, and devices of this installation.
The tests and measurements were carried out in two different seasons of the year in order to obtain real results in different weather conditions and to compare them with each other. The first measurement session was carried out on 19 October 2021, and the second session was on 12 May 2022.

3.1. First Measurement Session—Autumn

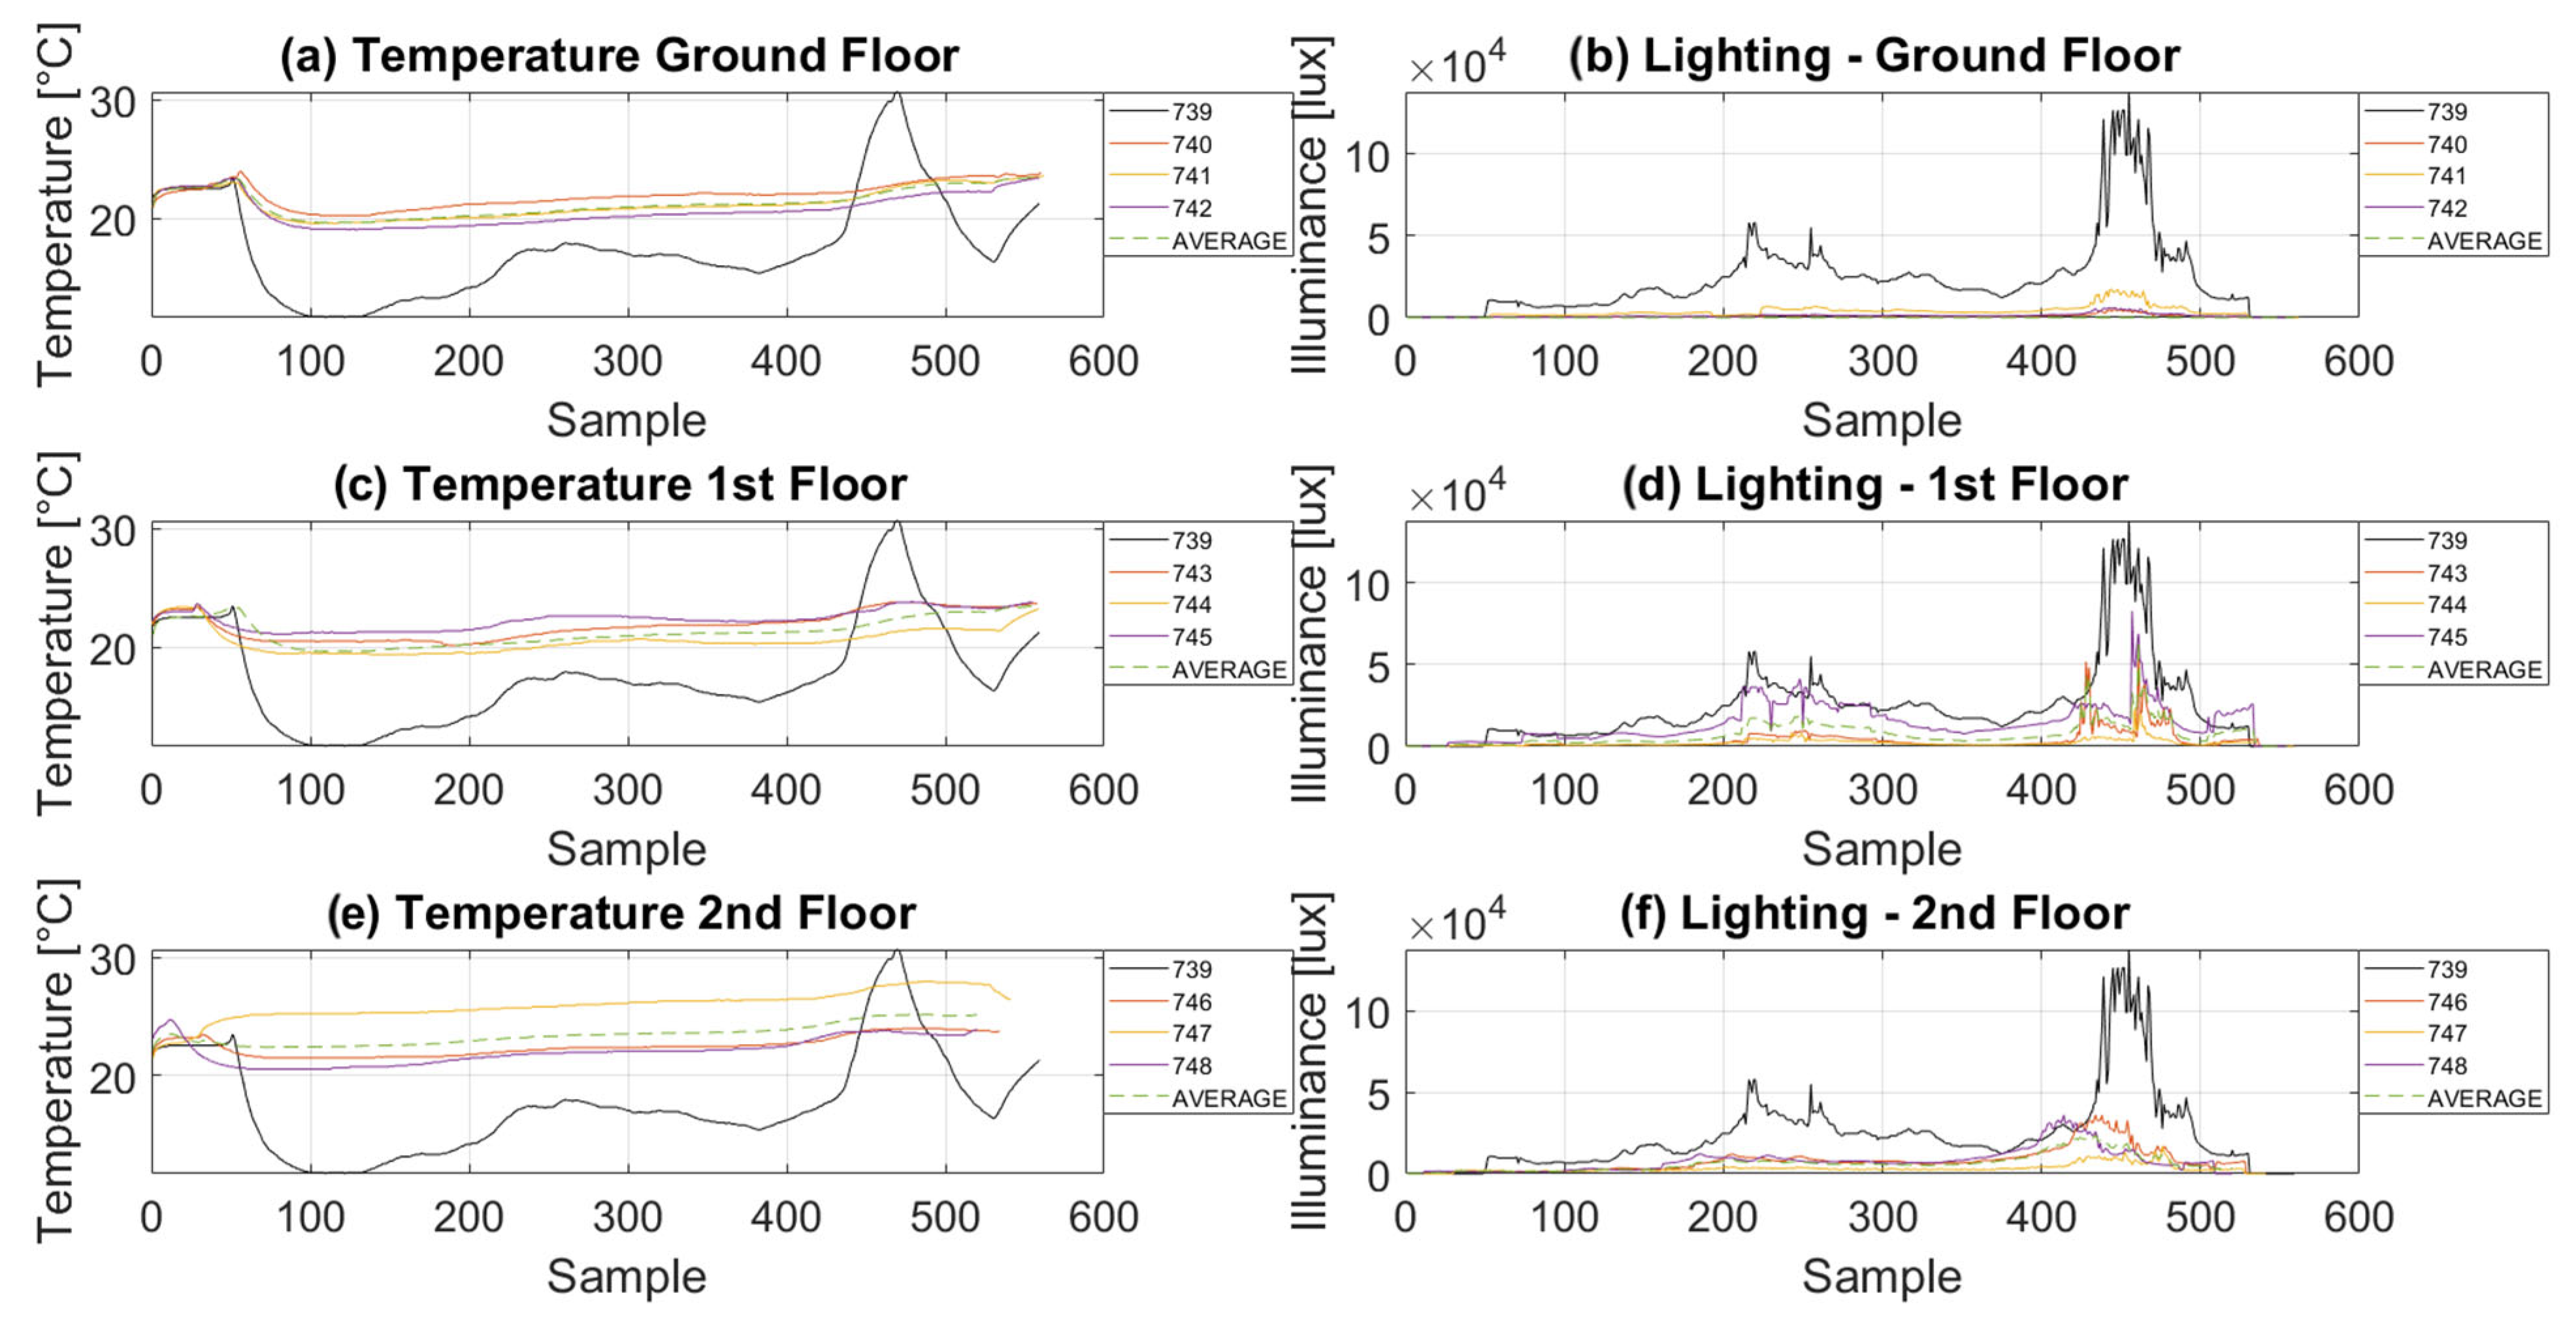
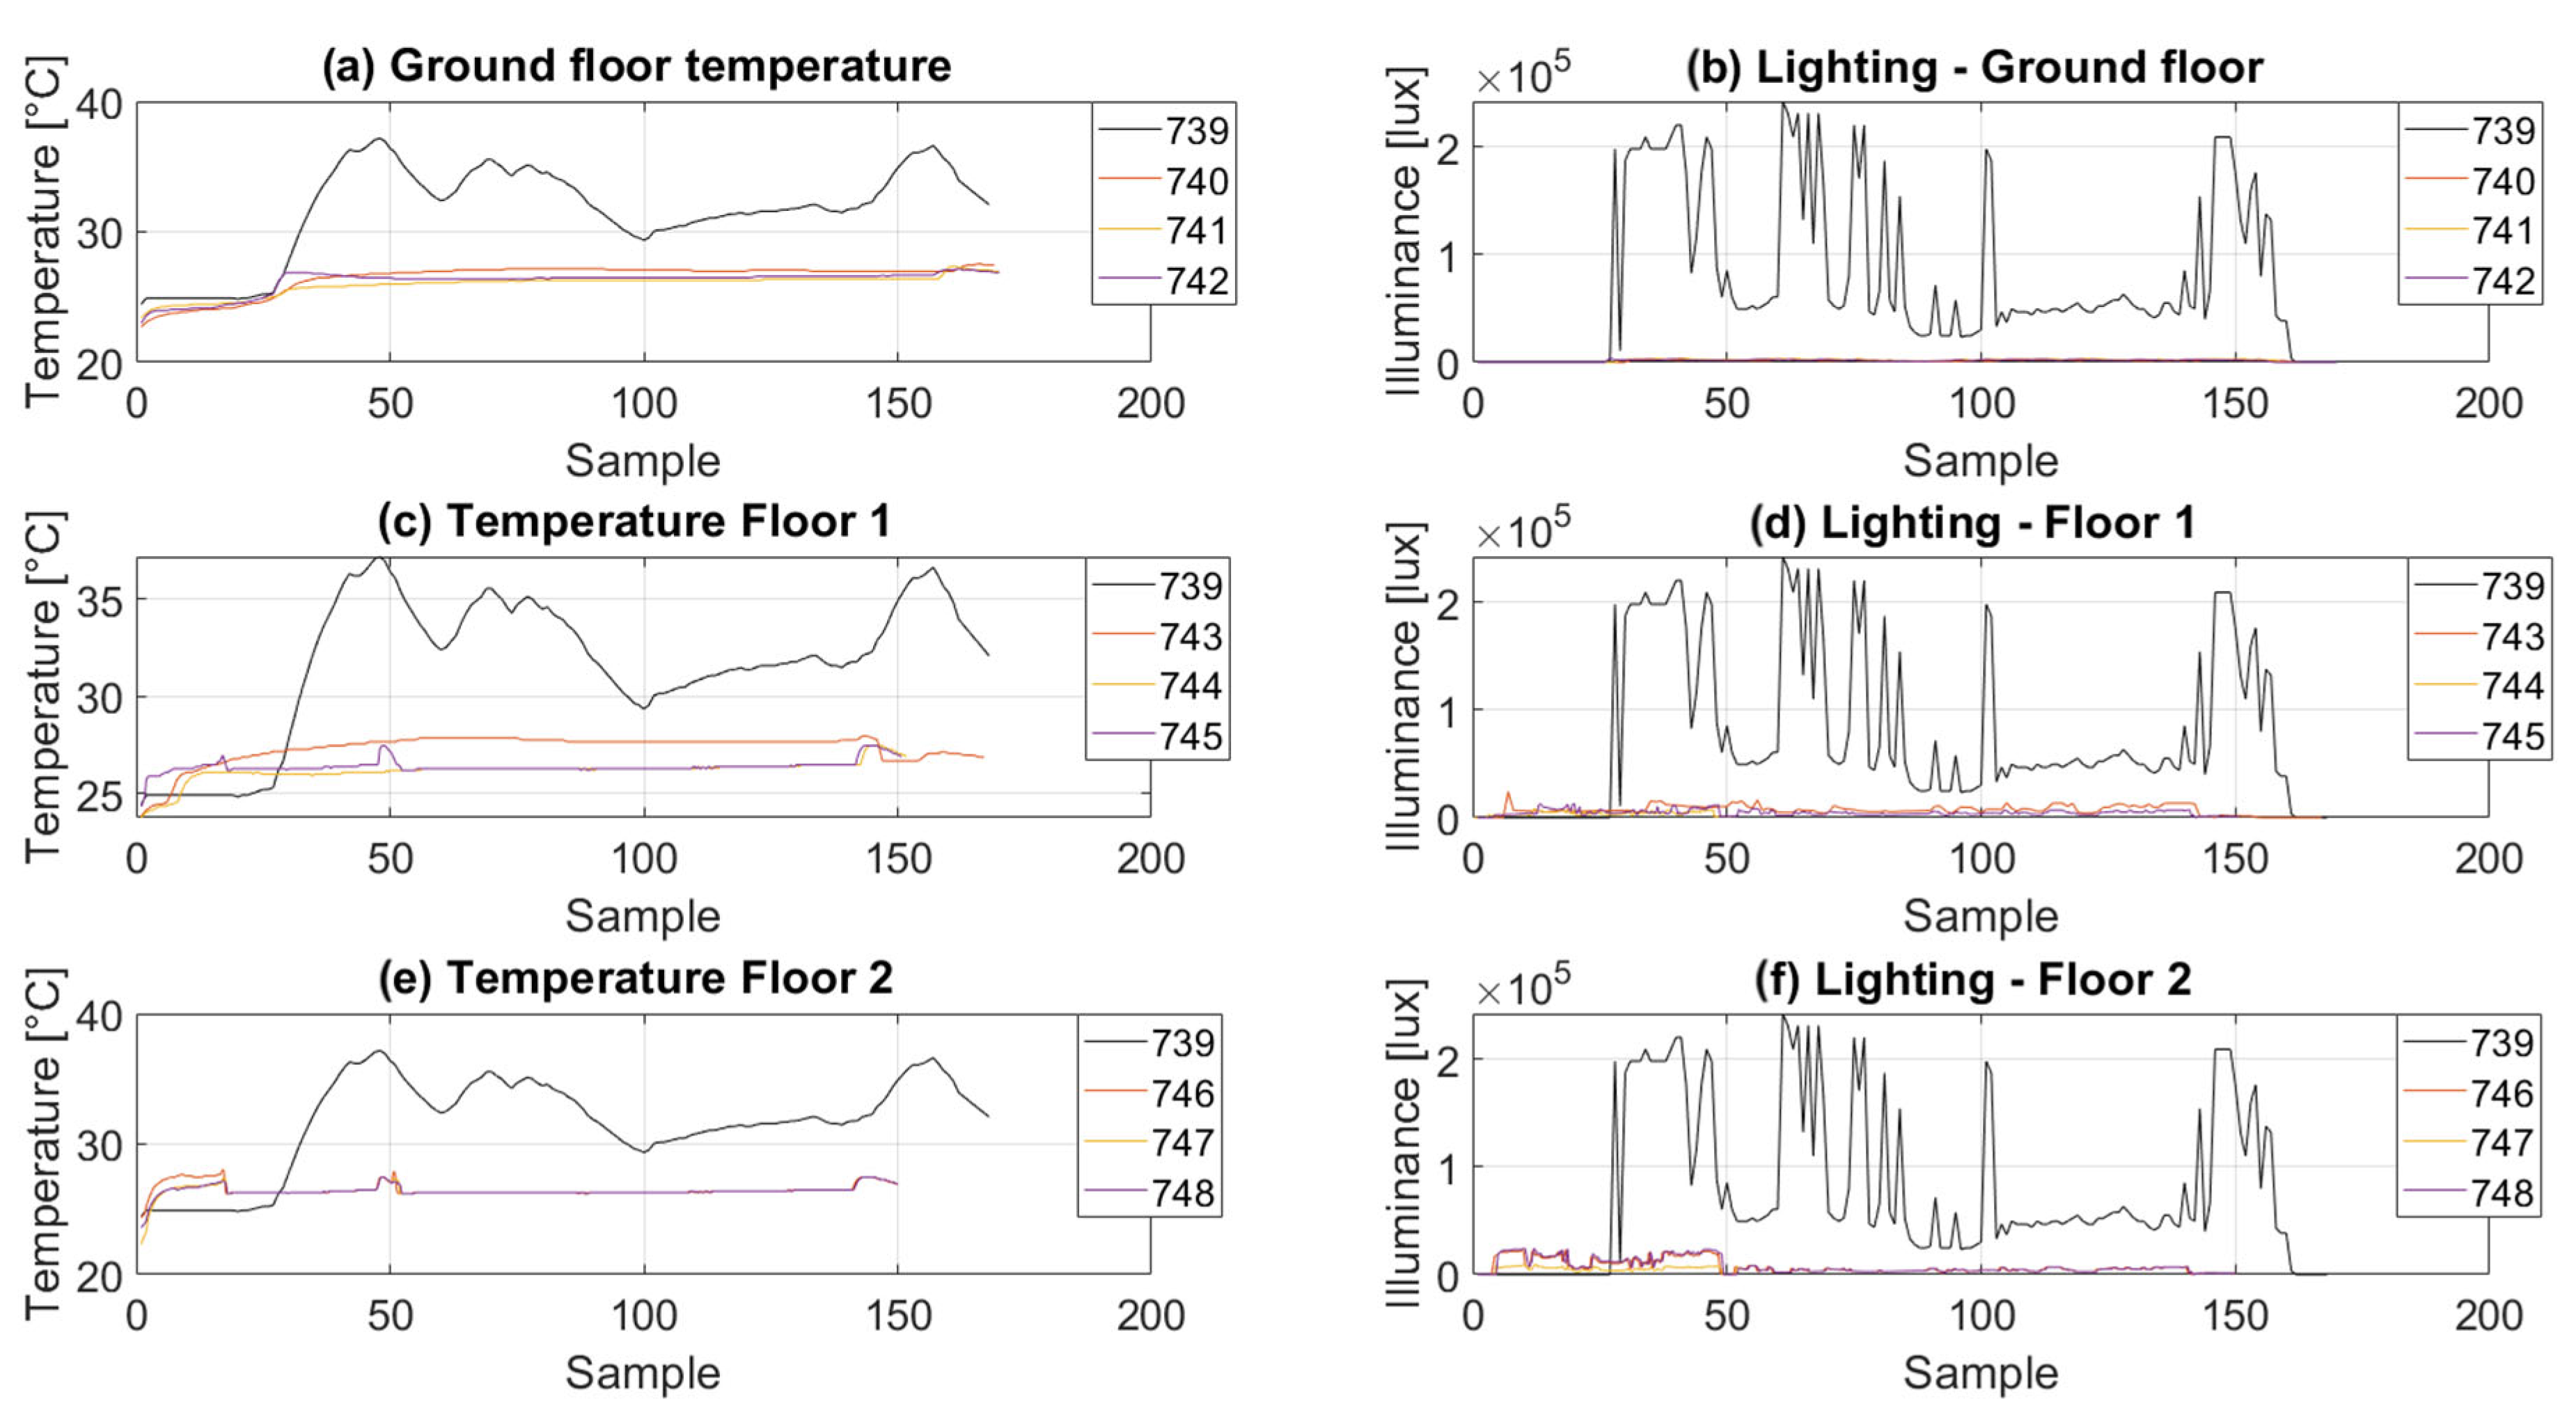
During the first series of measurements, the day was cloudy, and the outside temperature was 25 degrees Celsius. Therefore, the lighting intensity outside was relatively low, on average 50 klux (logger 739). During the measurements, about 600 samples were collected from each sensor, separately, for the temperature and illuminance values. Data was logged every 30 s from about 11:00 am to 4:00 pm. Finally, all data was processed in the MATLAB tool to generate trend graphs. Results are presented in Figure 10.
The temperature values from logger 739 were adopted in the analysis as were the temperature of the PPV panels on the façade. This parameter is only informative, without affecting the results of the analyses that primarily concern the illuminance data. In addition, to improve the analysis of the illuminance level, the measurements from the loggers on building’s floors were averaged to obtain one set of data with an average illuminance level for each floor, as presented in the next subsection.

3.1.1. Dynamic Façade Measurements

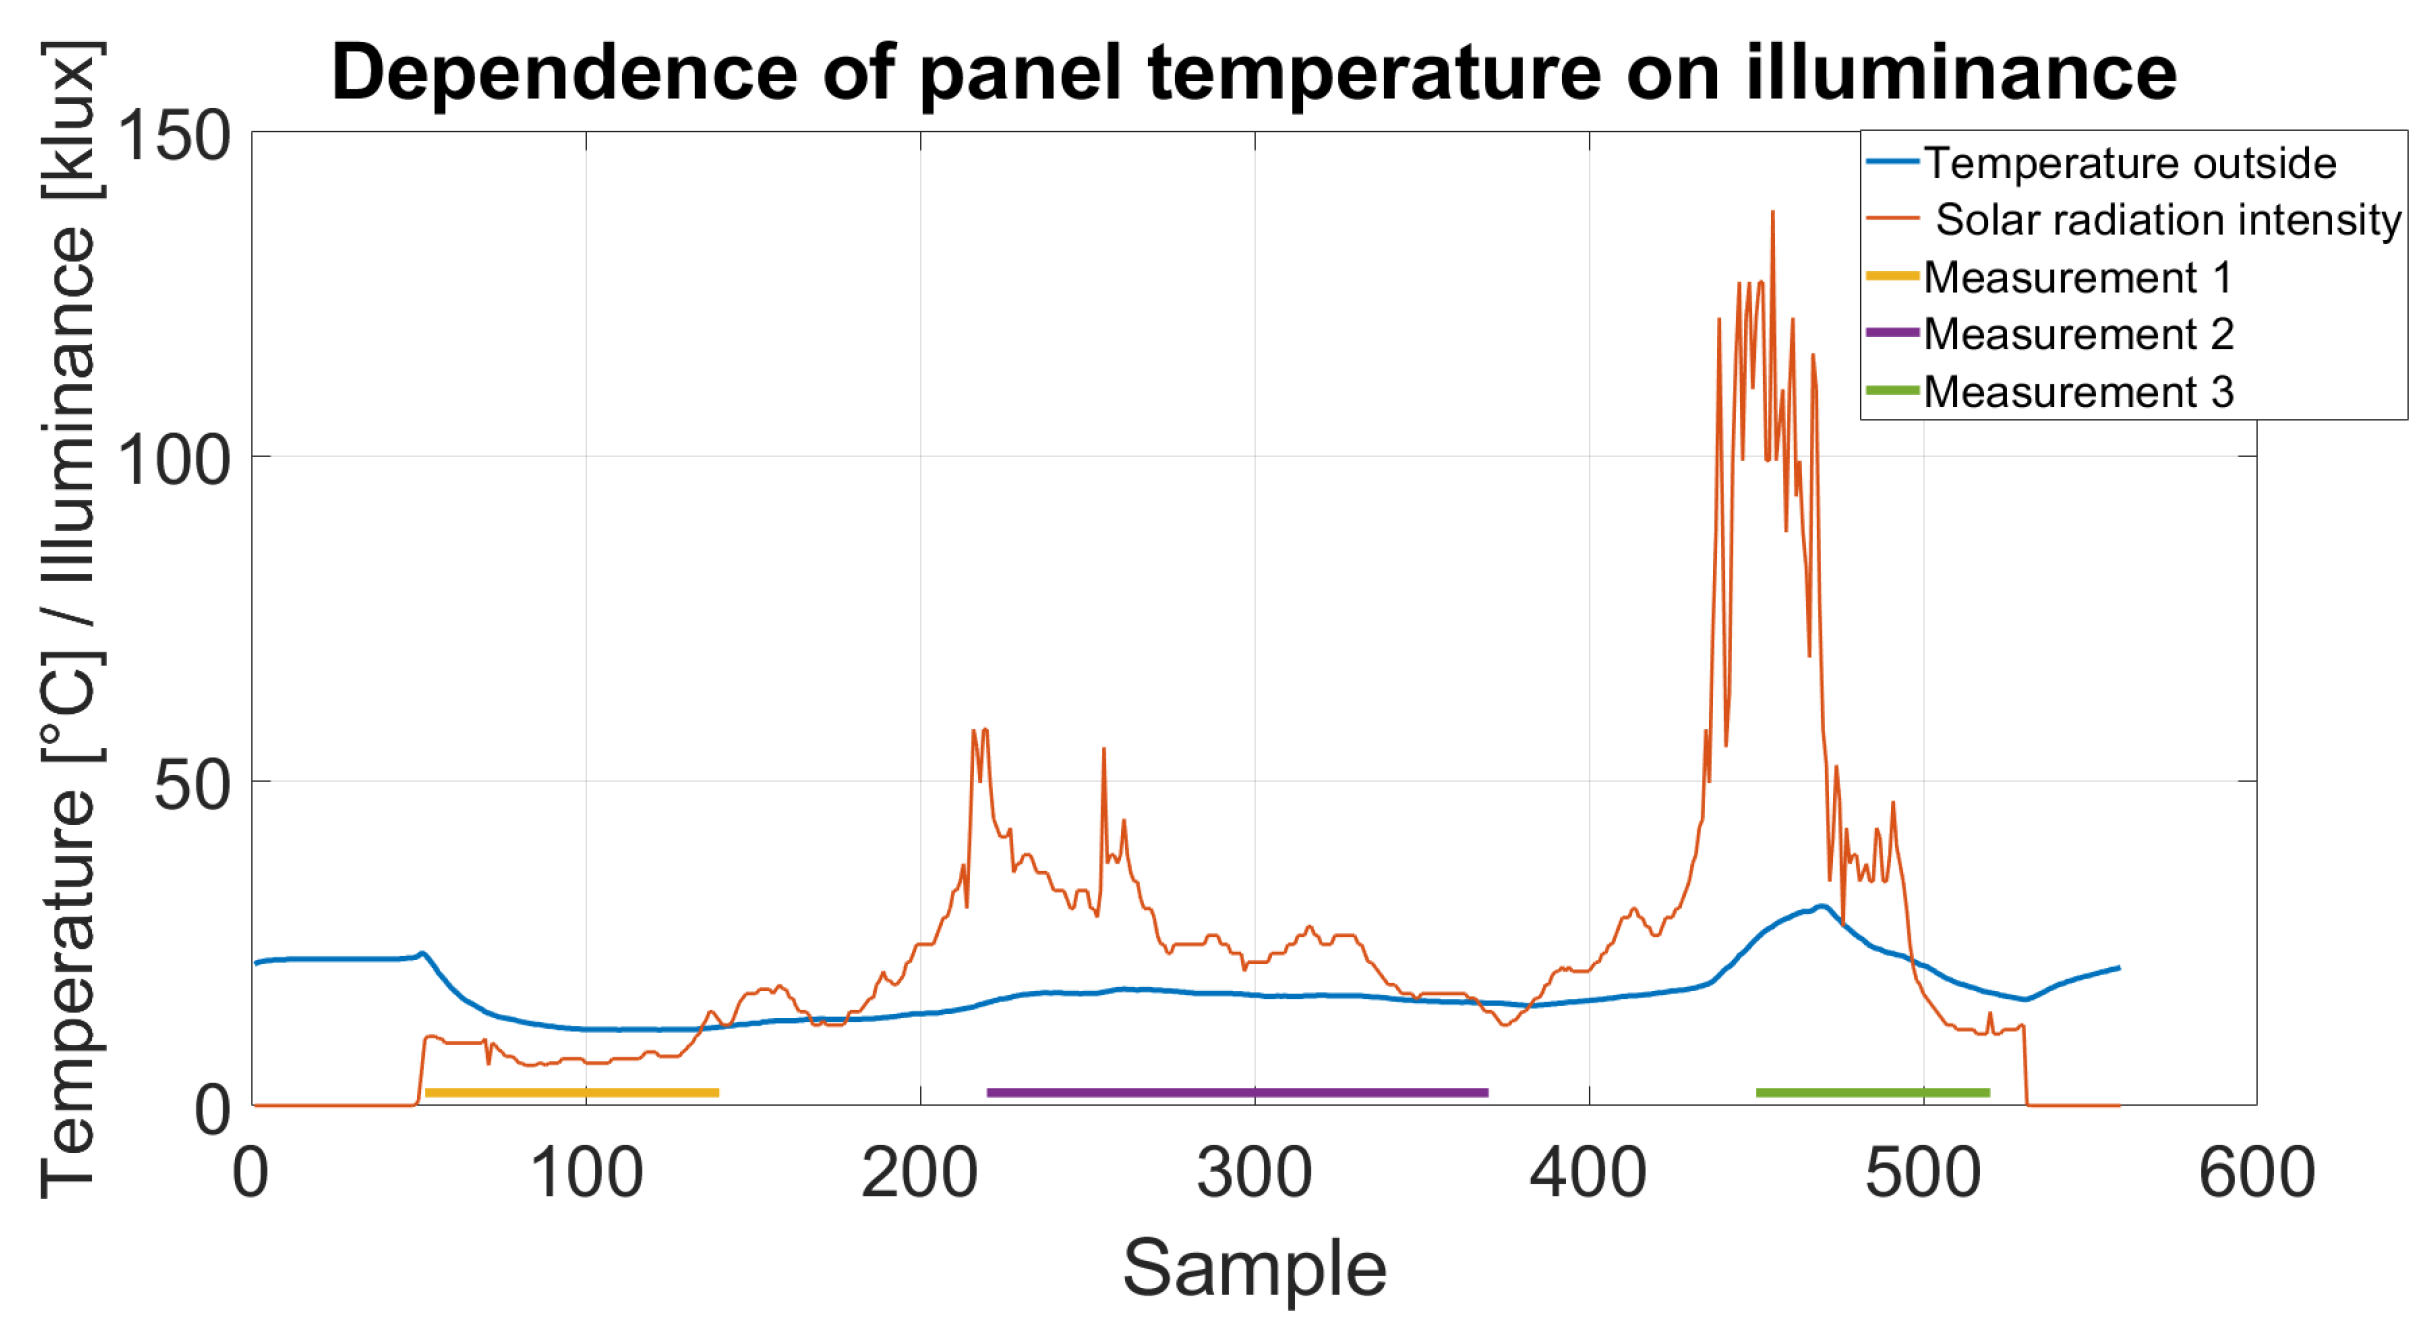
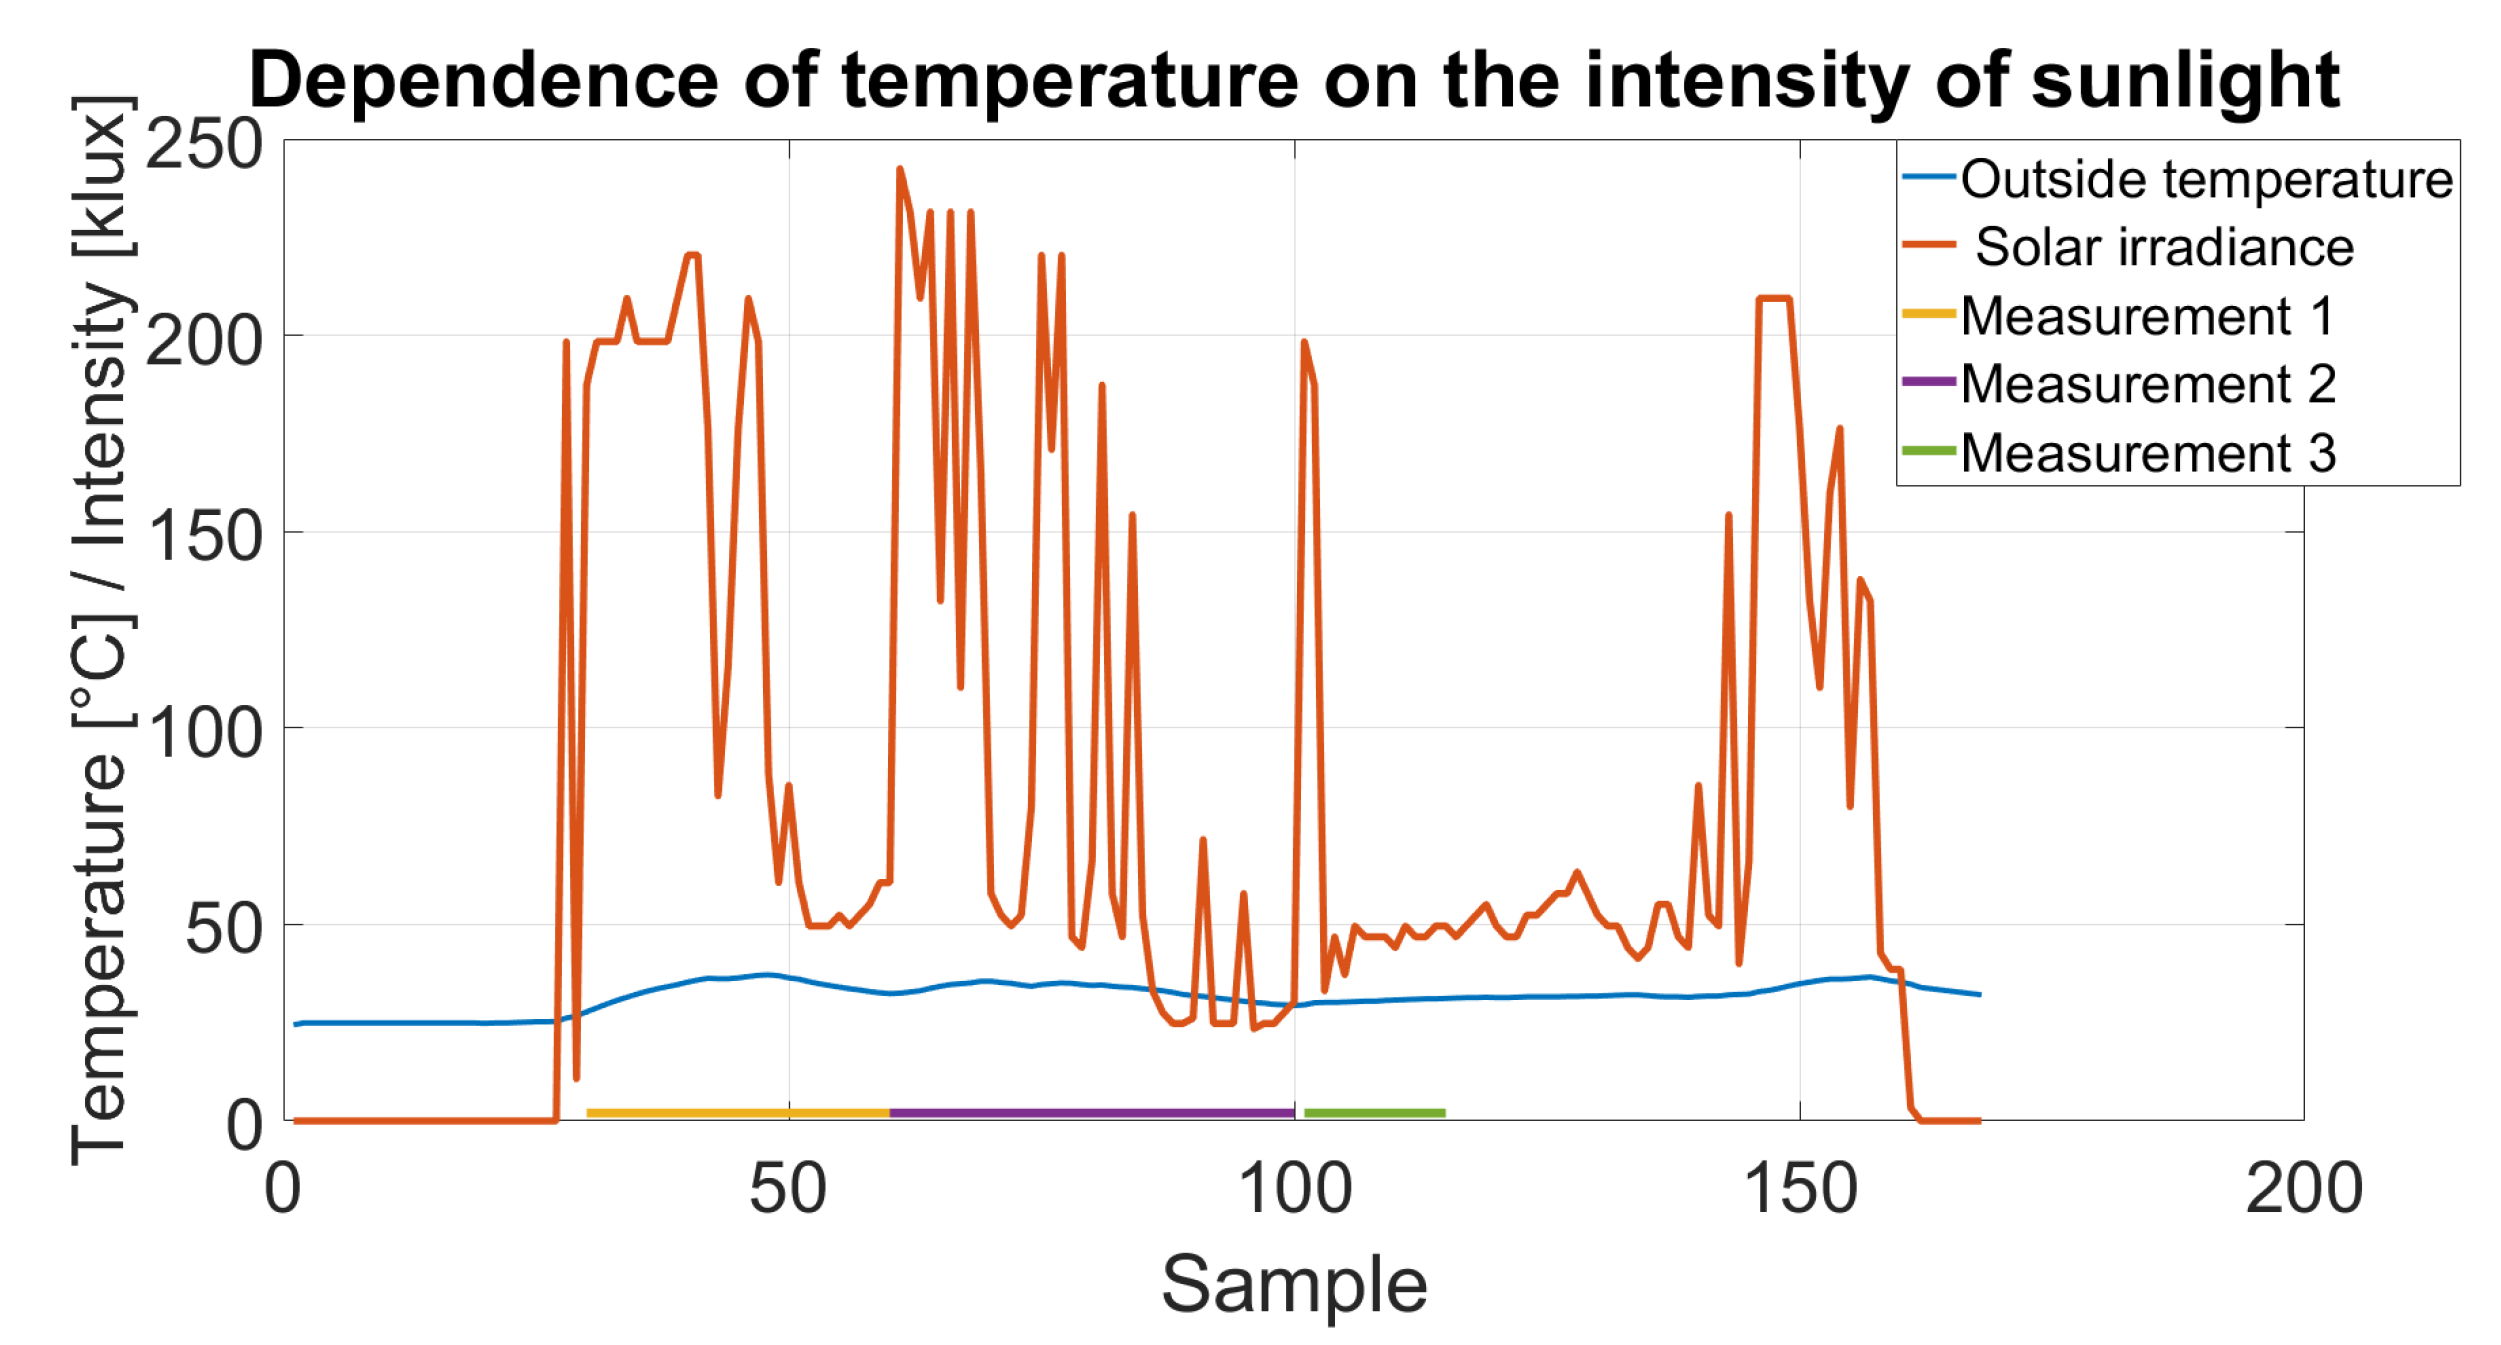
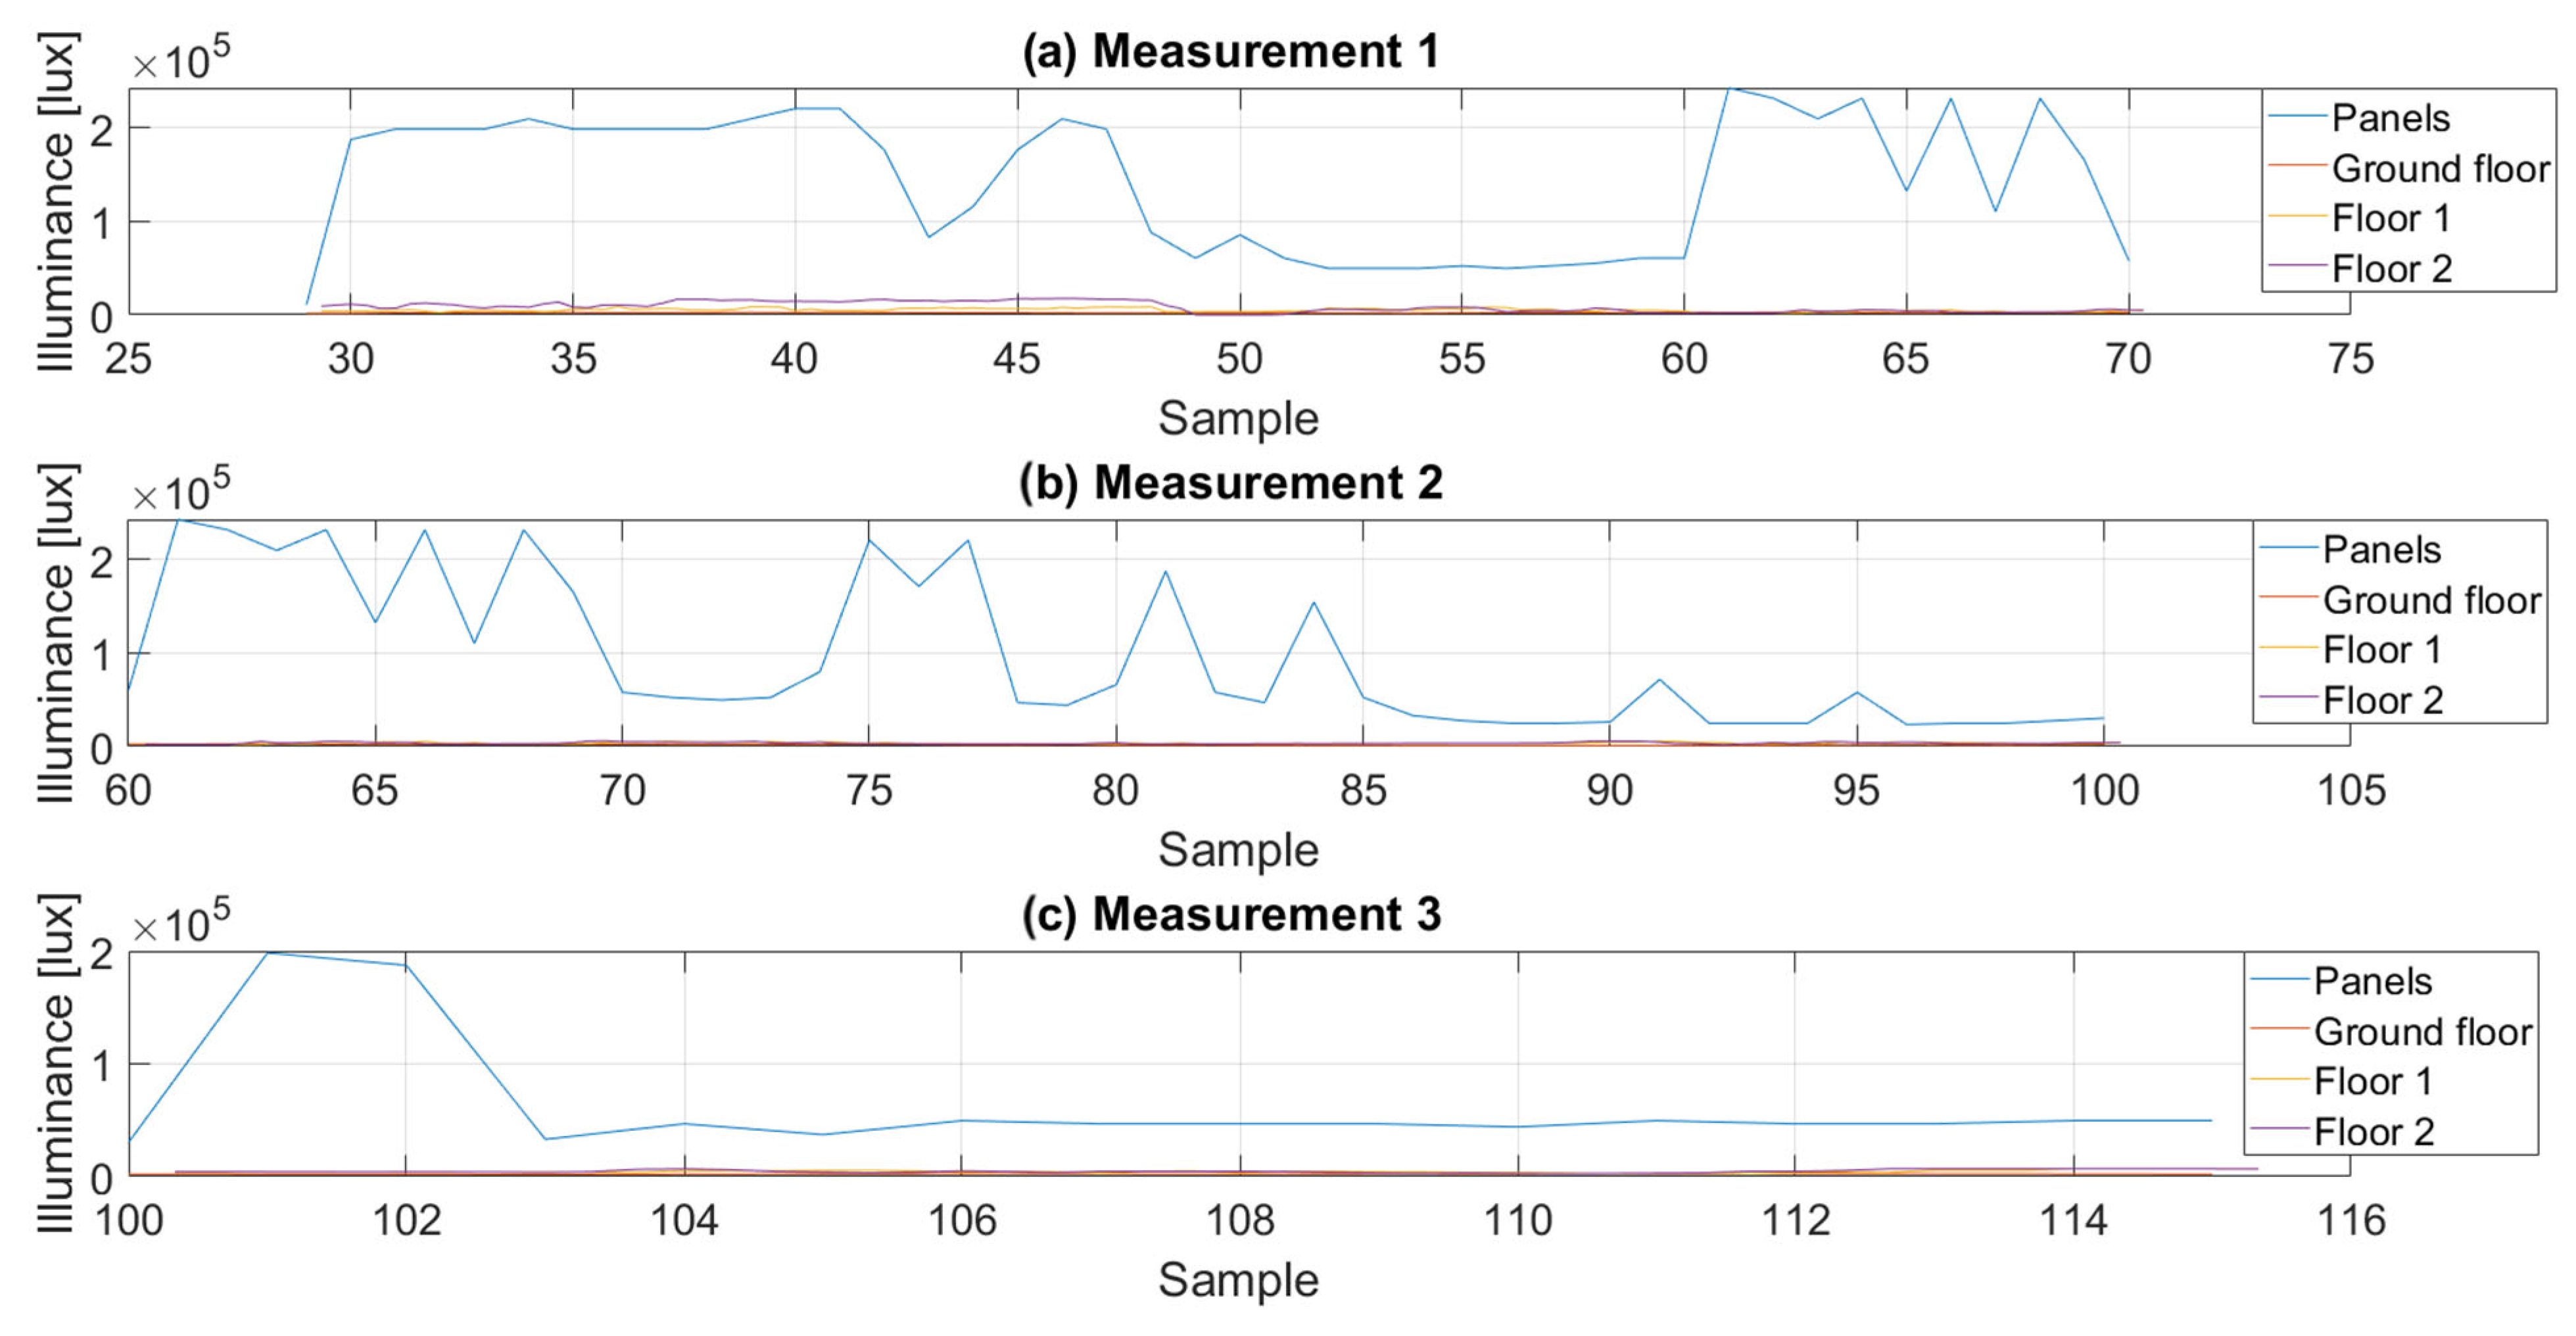
During the measurement series, periodic changes were also made to the position of the façade slats to verify the effect of the sun-tracking function on the level of illumination. Three time periods around 12:00 p.m., 1:00 p.m., and 3:00 p.m. were selected with 50 to 150 samples (data logs) separated for each period. Figure 11 shows separate periods in relation to the entire measurement series.
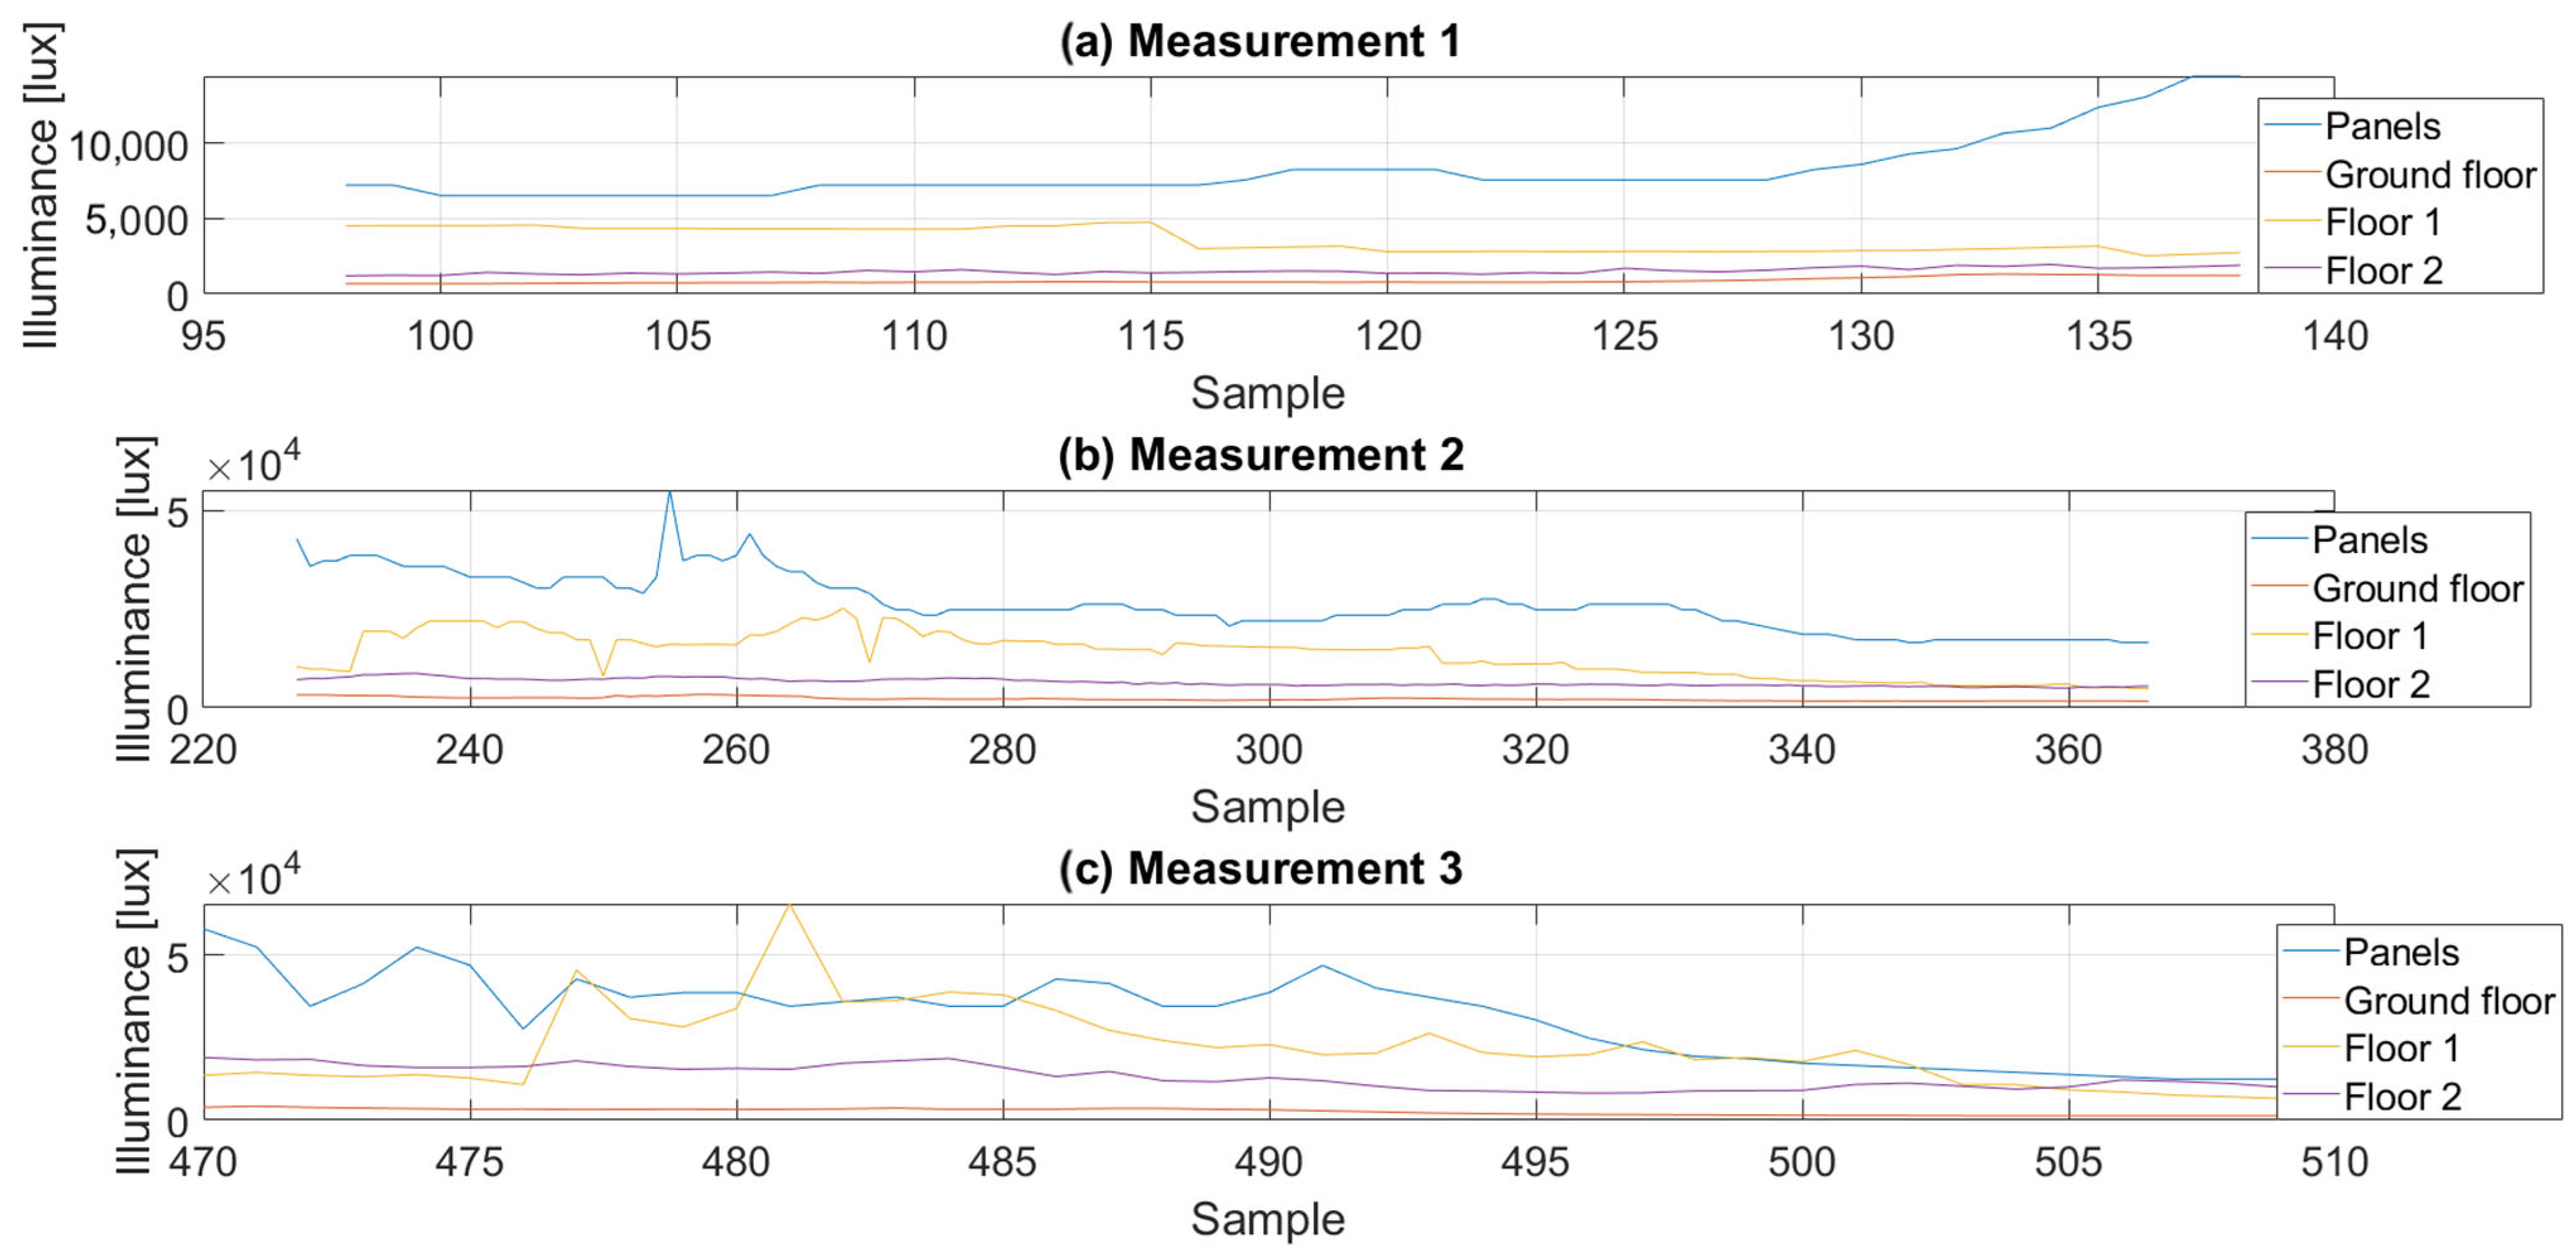
In period 1, the angle of the panels was changed from 0 to 60 degrees in an irregular cycle. Period 2 started with the panels position at 0 degrees and increased by equal 10 degrees to a maximum at 90 degrees. In period 3, the angle of tilt was increased every 5 degrees in a regular cycle. It should be noted that the results were also influenced by atmospheric factors; measurements in period 1 were carried out with cloud cover at the level of 90%, in period 2 at the level of 80%, and in period 3 with the most favorable conditions with cloud cover at the level of 70%. The sun’s altitude, measured in degrees up from the horizon, was 27.84 at 12:00 p.m. and 11.67 at 3:00 p.m. Even such small differences in the sun’s position and cloud cover have a significant impact on the amount of incoming sunlight and, thus, on the power generated by the panels (which is discussed later in the paper). Trends in Illumination changes in the analyzed periods are shown in Figure 12, with averaging of data from sensors/loggers on the floors of the building.
It is noticeable that the increase in the level of illumination on the surface of the panels at their final position of 60 degrees in period 1 (better positioning of the lamellas and PPV panels in relation to the position/altitude of the sun), is also visible in the graphs for periods 2 and 3, where after the decrease in the level of illumination for subsequent samples/data logs (with the increase in the angle of the position of the slats), its slight increase and decrease occurs again (at the position close to 90 degrees). This is important from the point of view of the effectiveness of the façade PPV panels as well as in terms of the strategy of controlling the sun-tracking function discussed in Section 4 of the paper.

3.1.2. Power Effectiveness Measurements

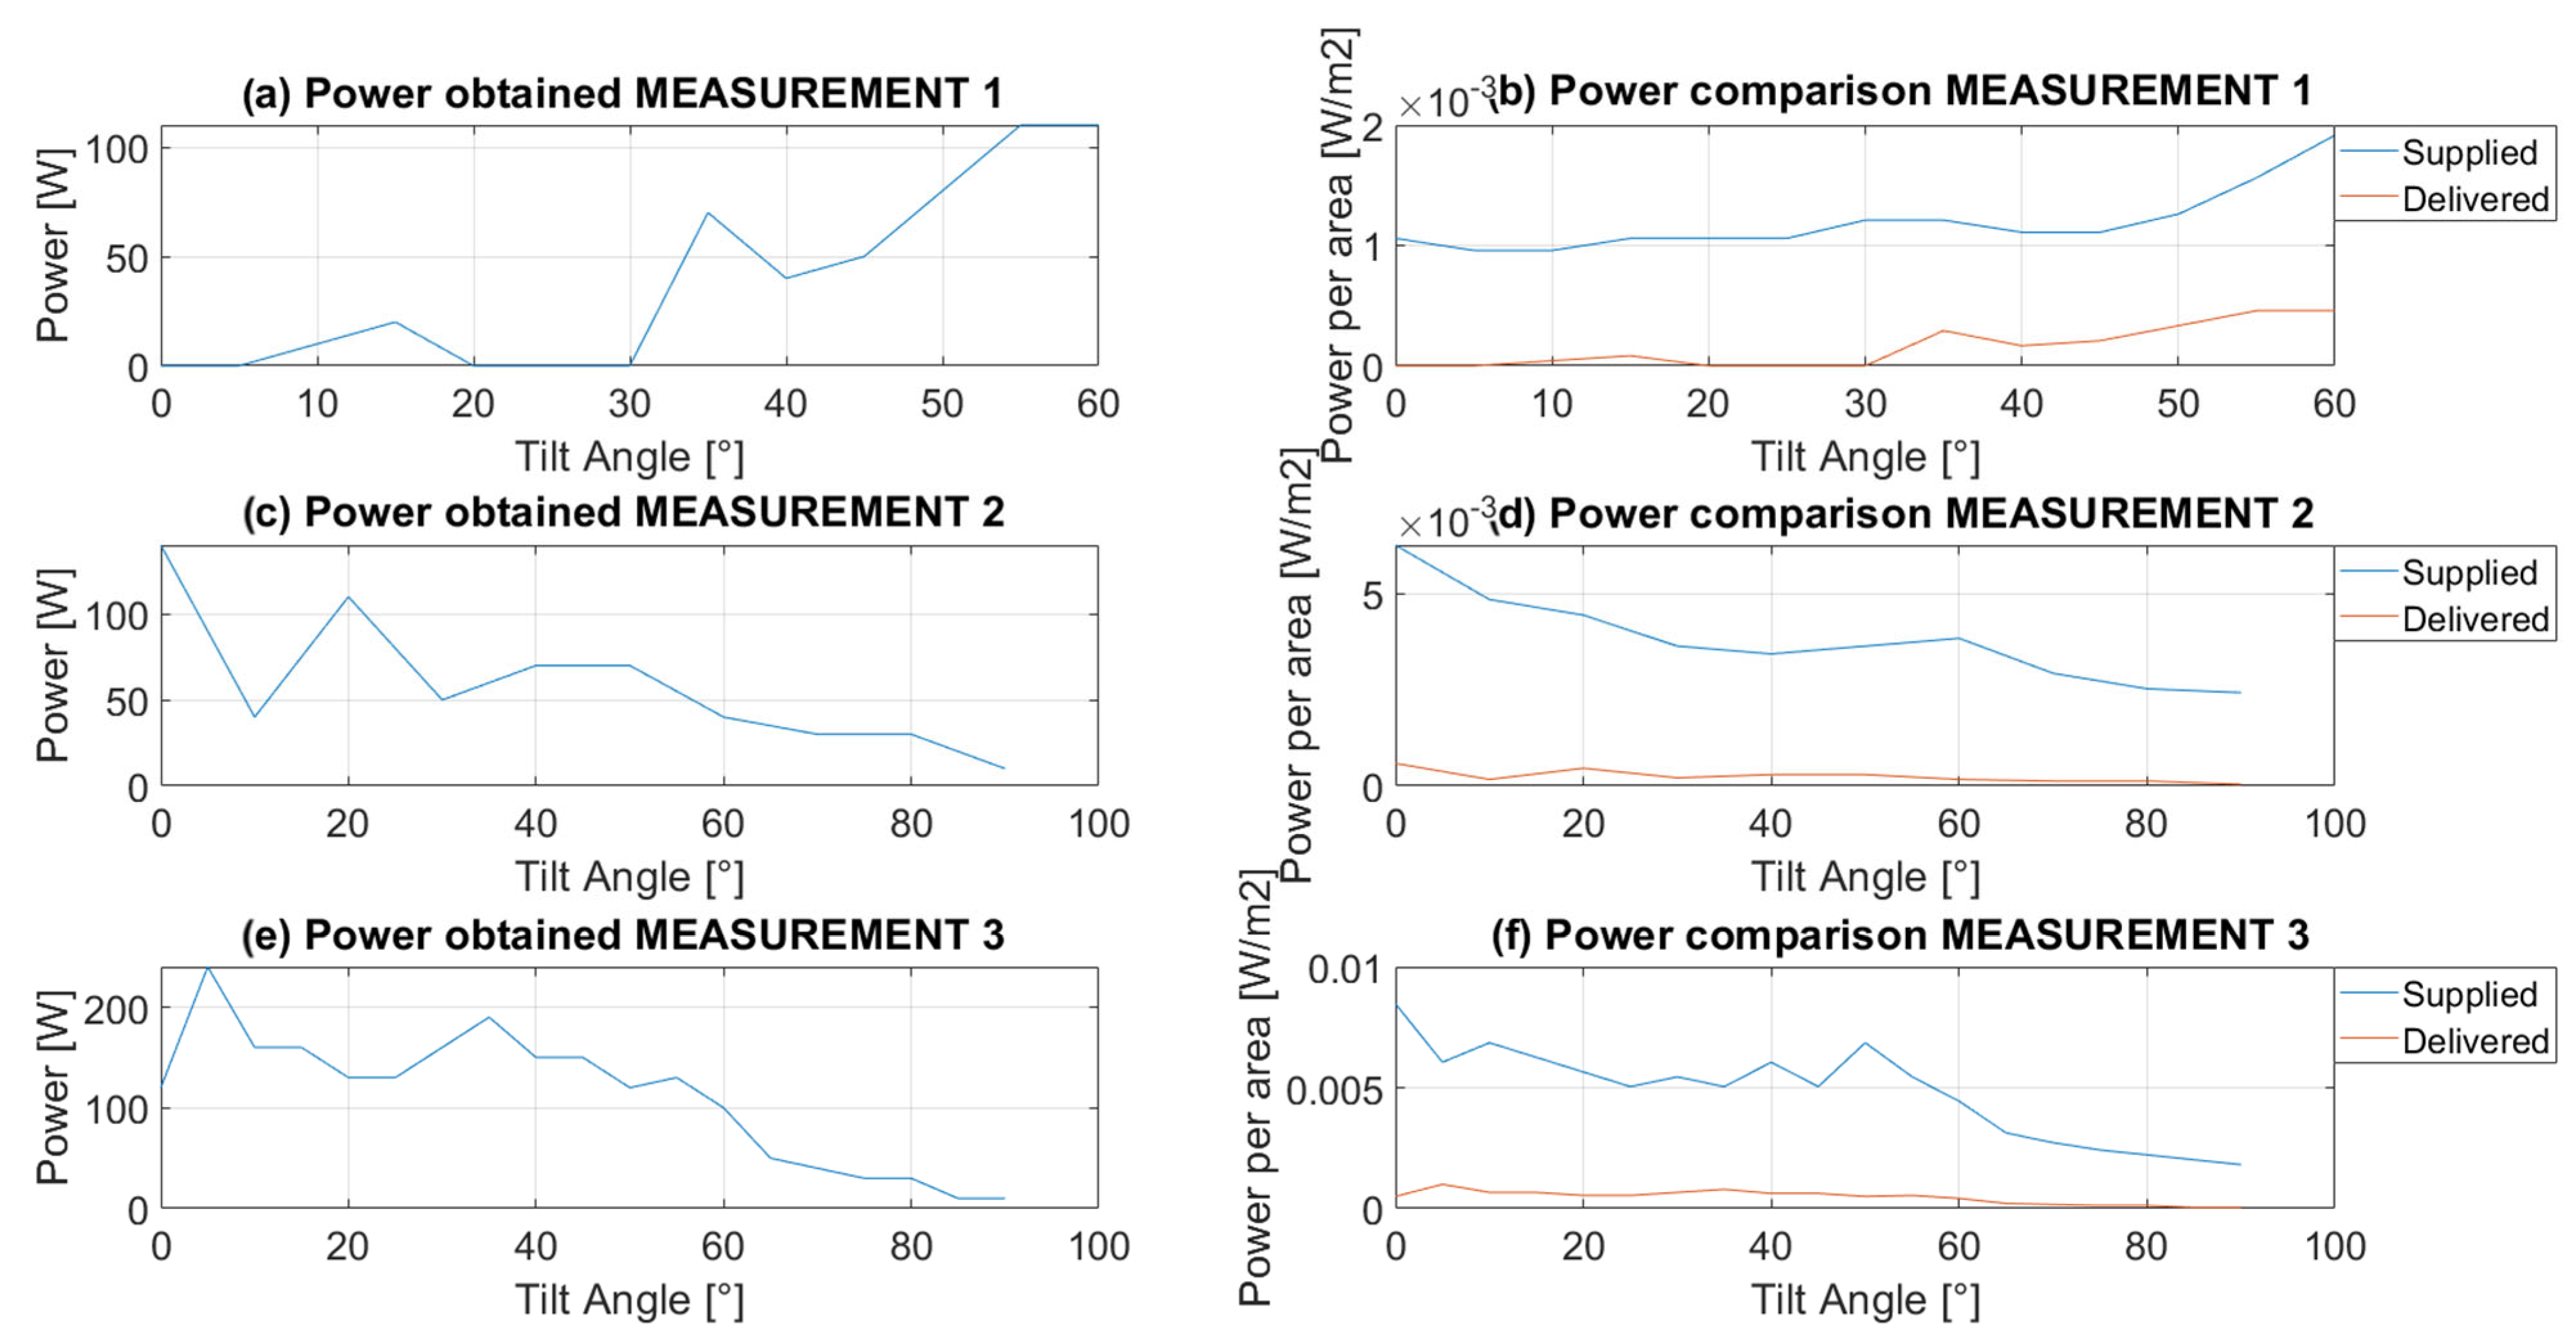
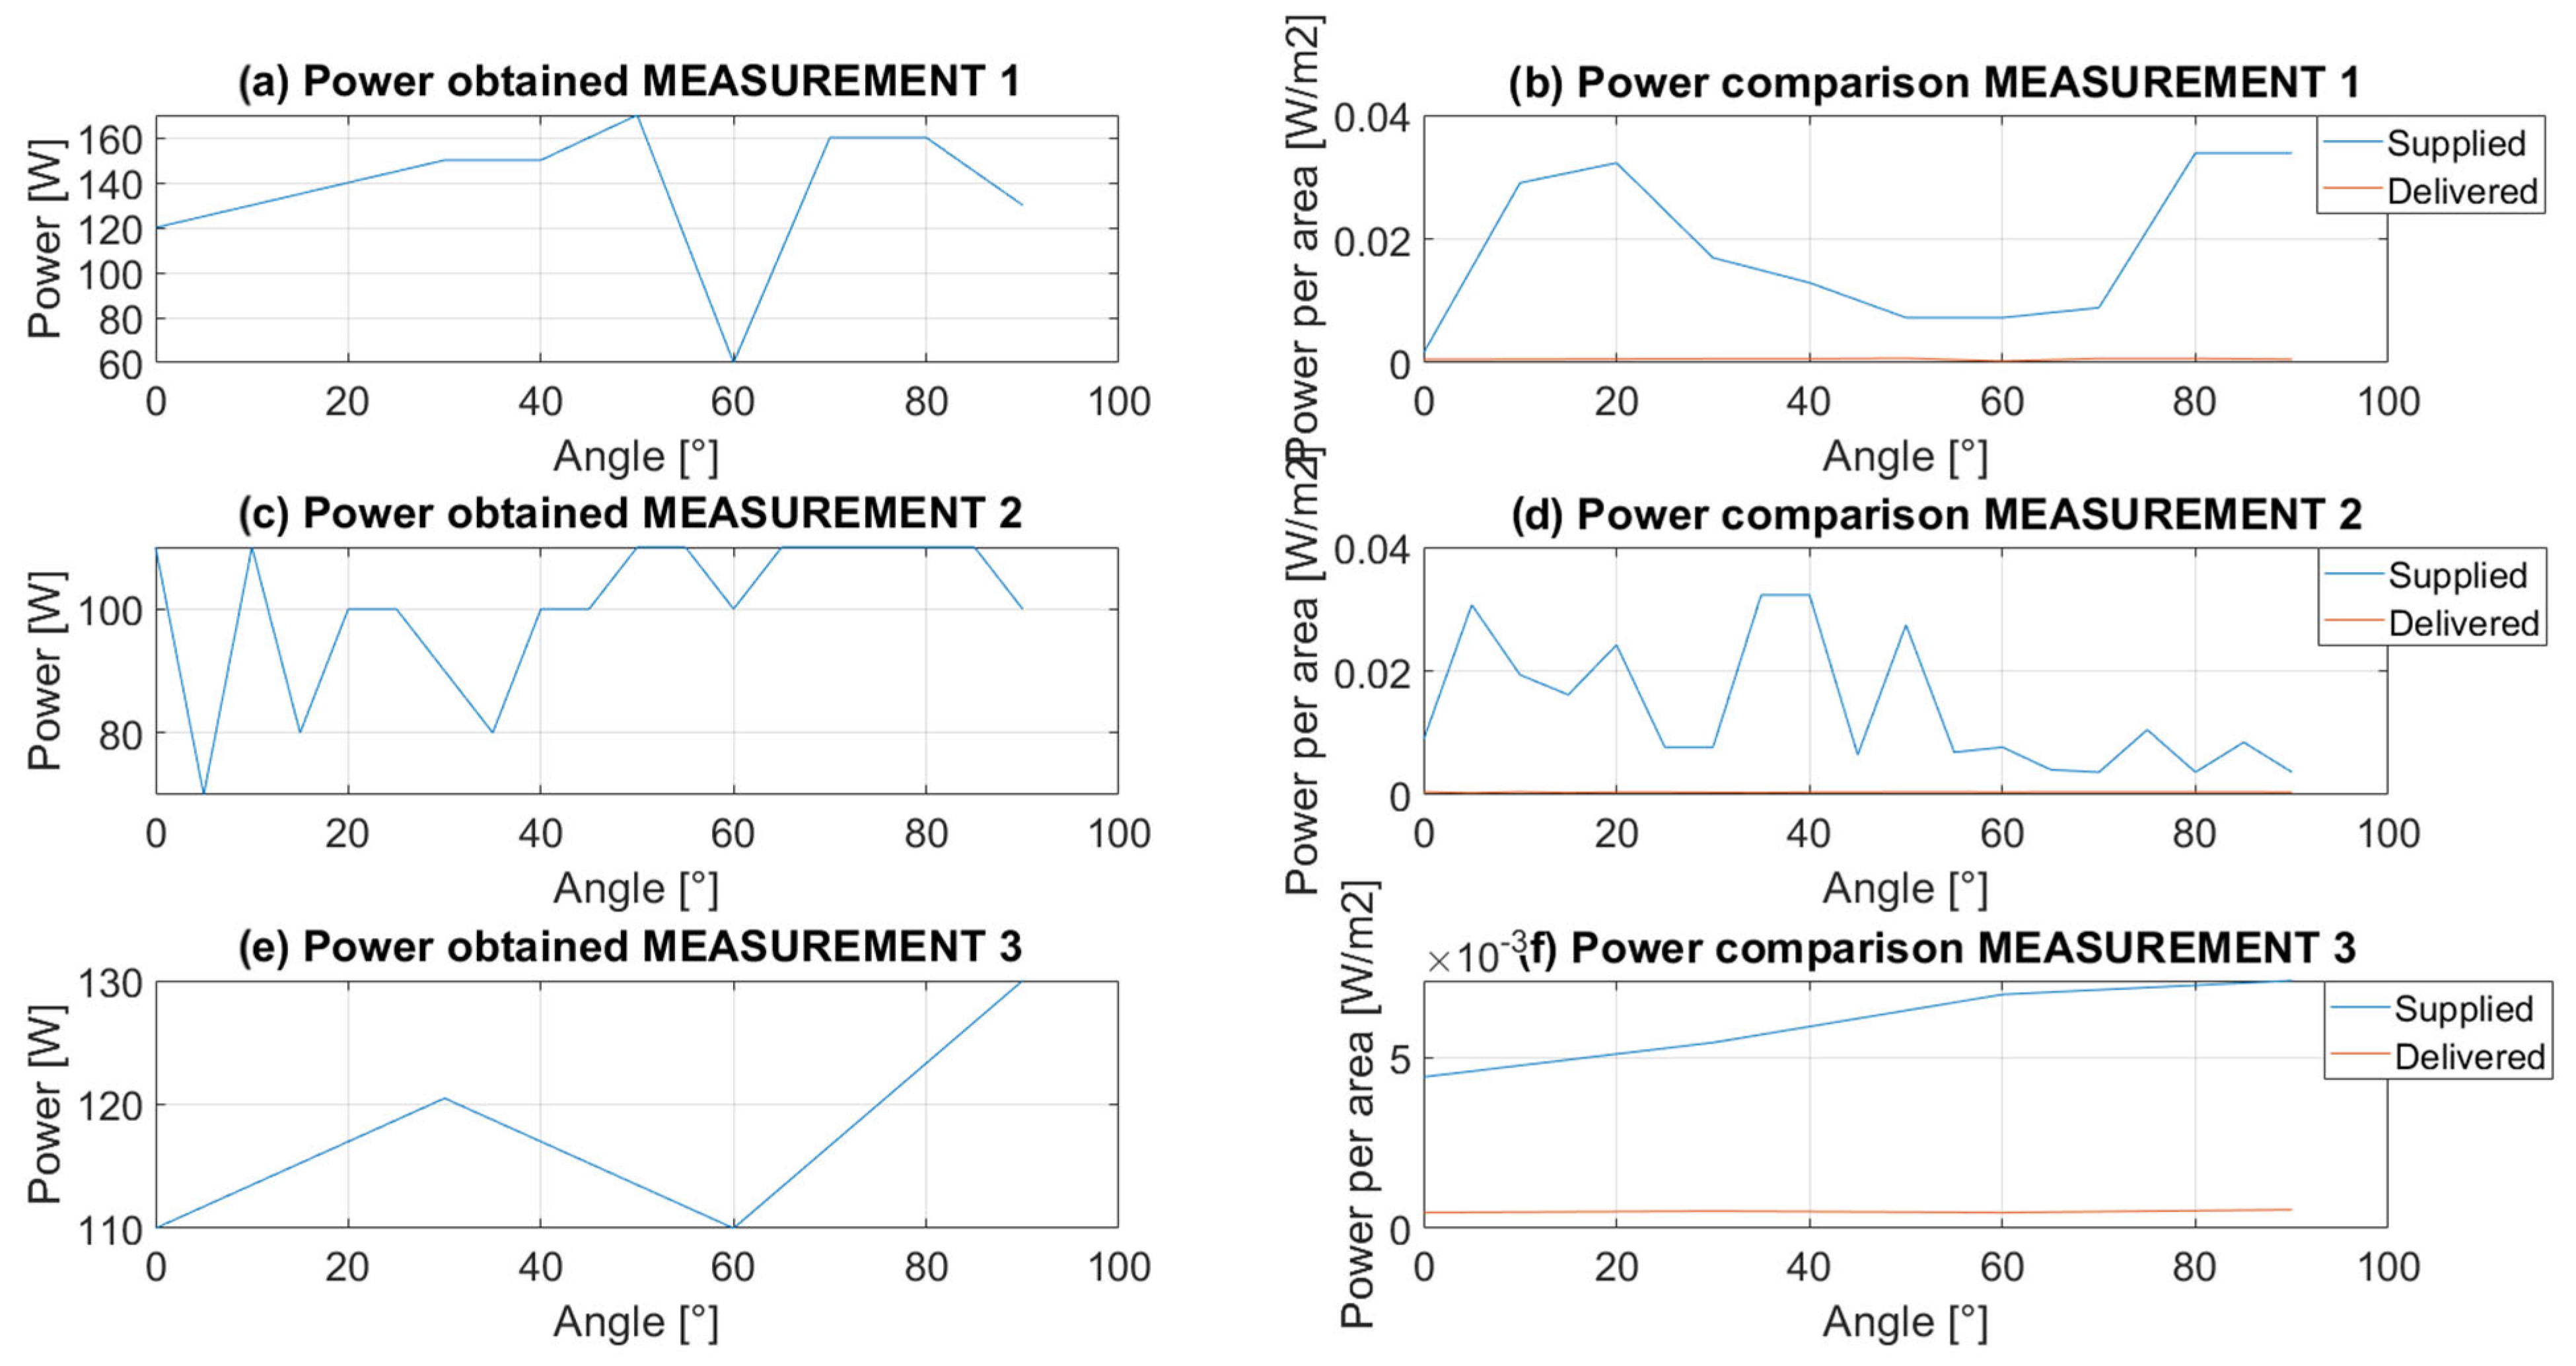
The last element of the analysis of data collected in the autumn session in the three periods mentioned above was the determination of the level of power supplied (generated) by PPV panels and its relation to the value of power delivered (produced) in the system installation. These last data were obtained directly from the inverter Solis module, and the trends of their changes for periods 1, 2, and 3 are shown in Figure 13 (graphs in the left column). Then, the data from the loggers and the Solis inverter were processed according to the procedures described in Section 2.3.2 and information on solar irradiance in W/cm2 was obtained. The results are presented in Figure 13 (graphs in the right column). All results are shown in relation to the position angle of the façade lamellas.
A direct correlation between the power supplied and the power delivered can be observed, which was the expected result. It should be mentioned that, in the geographical location of Poland, the most optimal tilt angle for the operation of PV panels is about 35 degrees. Measurements for periods 2 and 3 show that the regular power yield was the highest in the range from 20 to 60 degrees. Therefore, it can be concluded that this is the most optimal range for the use of PV panels with the sun-tracking control system.
Finally, for the average power values for the entire measurement period 1, 2, and 3, respectively, the efficiency of the pilot installation with PPV panels was calculated. The results obtained are presented in Table 1.

3.2. Second Measurement Session—Spring

In contrast to the autumn series, during the second one (spring), the day was very sunny, with a slight cloud cover, and the outside temperature was 30 degrees Celsius. The lighting intensity outside was high on average: 200 klux (logger 739). Bearing in mind the stable weather conditions, a shorter series of measurements was collected—about 170 samples logged each 30 s from about 11:00 am to 1:30 pm. All data was processed in the MATLAB tool to generate trend graphs. Results are presented in Figure 14.

3.2.1. Dynamic Façade Measurements

Like in the autumn series, during the measurements, periodic changes were also made to the position of the façade slats. Three time periods around 12:00 p.m., 12:30 p.m., and 1:00 p.m. were selected with about 50 samples (data logs) separated for each period. Figure 15 shows separate periods in relation to the entire measurement series.
This time, changes in the tilt angle of the PPV panels for all periods 1, 2, and 3 covered the full range from 0 to 90 degrees. In the first period, the angle was changed every 10 degrees and, in the second, every 5 degrees. Due to technical difficulties in the system, independent of the people making the measurements, in the third period the angle was changed every 30 degrees (low accuracy).
It should be noted that the results were also influenced by atmospheric factors. The outdoor temperature of the panels was high and stable at about 35 degrees Celsius. The sun’s altitude, measured in degrees up from the horizon, was 56.56 at 12:00 p.m. and 54.54 at 1:00 p.m. This indicates that with a clear sky, the PPV panels should show the highest efficiency at a tilt angle of about 10 to 60 degrees. This is confirmed by the results of the trends in illumination changes in the analyzed periods, 1 and 2, shown in Figure 16, with averaging of data from sensors/loggers on the floors of the building.
Because of the technical problems mentioned before, period 3 was considered independently. Moreover, for periods 1 and 2, the settings of subsequent angular positions were always carried out from the zero position (0 degrees) in order to achieve greater positioning accuracy. Hence the abrupt changes in the level of illumination visible on the charts.

3.2.2. Power Effectiveness Measurements

Similarly, in the spring series, the determination of the level of power supplied (generated) by PPV panels and its relation to the value of power delivered (produced) in the system installation were considered. Data about power delivered was obtained from the inverter Solis module, and the trends of their changes for periods 1, 2, and 3 are shown in Figure 17 (graphs in the left column). Then, the data was processed in the same way as the autumn series and according to the procedures described in Section 2.3.2 in order to obtain information on solar irradiance in W/cm2. The results are presented in Figure 17 (graphs in the right column). All results are shown in relation to the position angle of the façade lamellas.
A direct correlation between the power supplied and the power delivered can be observed again. Measurements for periods 1 and 2 show that the regular power yield was the highest in the range from 20 to 60 degrees. It could be concluded that the results in general are similar to the autumn series, however, in the range of angles from 60 to 70 degrees, an increase in illuminance and thus in generated power is visible, with no increase in delivered power. This is because the maximum power generated by the PPV panels is achieved, where the level of generated power does not increase with the increase in illumination.
Finally, for the average power values for the entire measurement period 1, 2, and 3, respectively, the efficiency of the pilot installation with PPV panels was calculated. It was lower than in the autumn. The obtained results are presented in Table 2.
Such a low result made it necessary to perform in-depth analyses. As a result, an additional external factor was noticed, which was the protruding, openwork roof over the façade (see Figure 1). In spring and summer, when the sun’s altitude is high, it limits the access of sunlight to the panels on the second floor of the façade.
Moreover, it should be noted that all illuminance level measurements and data provided by sensors placed indoors, near the window surface on different floors, are illustrative, and their in-depth analysis was not the subject of the research described in this paper. However, the results of measurements from the aforementioned sensors marked with numbers in the range 740–748 (indoor), indicate a significant reduction in the daylight that falls through the windows into the interior, compared to the results of the 739 sensor indications (outdoor). Therefore, for the spring measurements, an average level of outdoor (external) daylight illuminance was calculated based on the data series from the 739 sensor: Eoutavg = 1.0037 × 10⁵. Similarly, an average level of indoor (internal) daylight illuminance was calculated based on the data series from the 740–748 sensors: Einavg = 1.1972 × 10³. The comparison of these results indicates a 100-fold reduction in the level of intensity of daylight that enters the rooms through the windows. These results provoked the future works mentioned in Section 5—Conclusions. In addition, the results shown in Figure 12 and Figure 16 indicate the high dependence of the light falling inside on the position of the lamella (angle of position).

3.3. Discussion

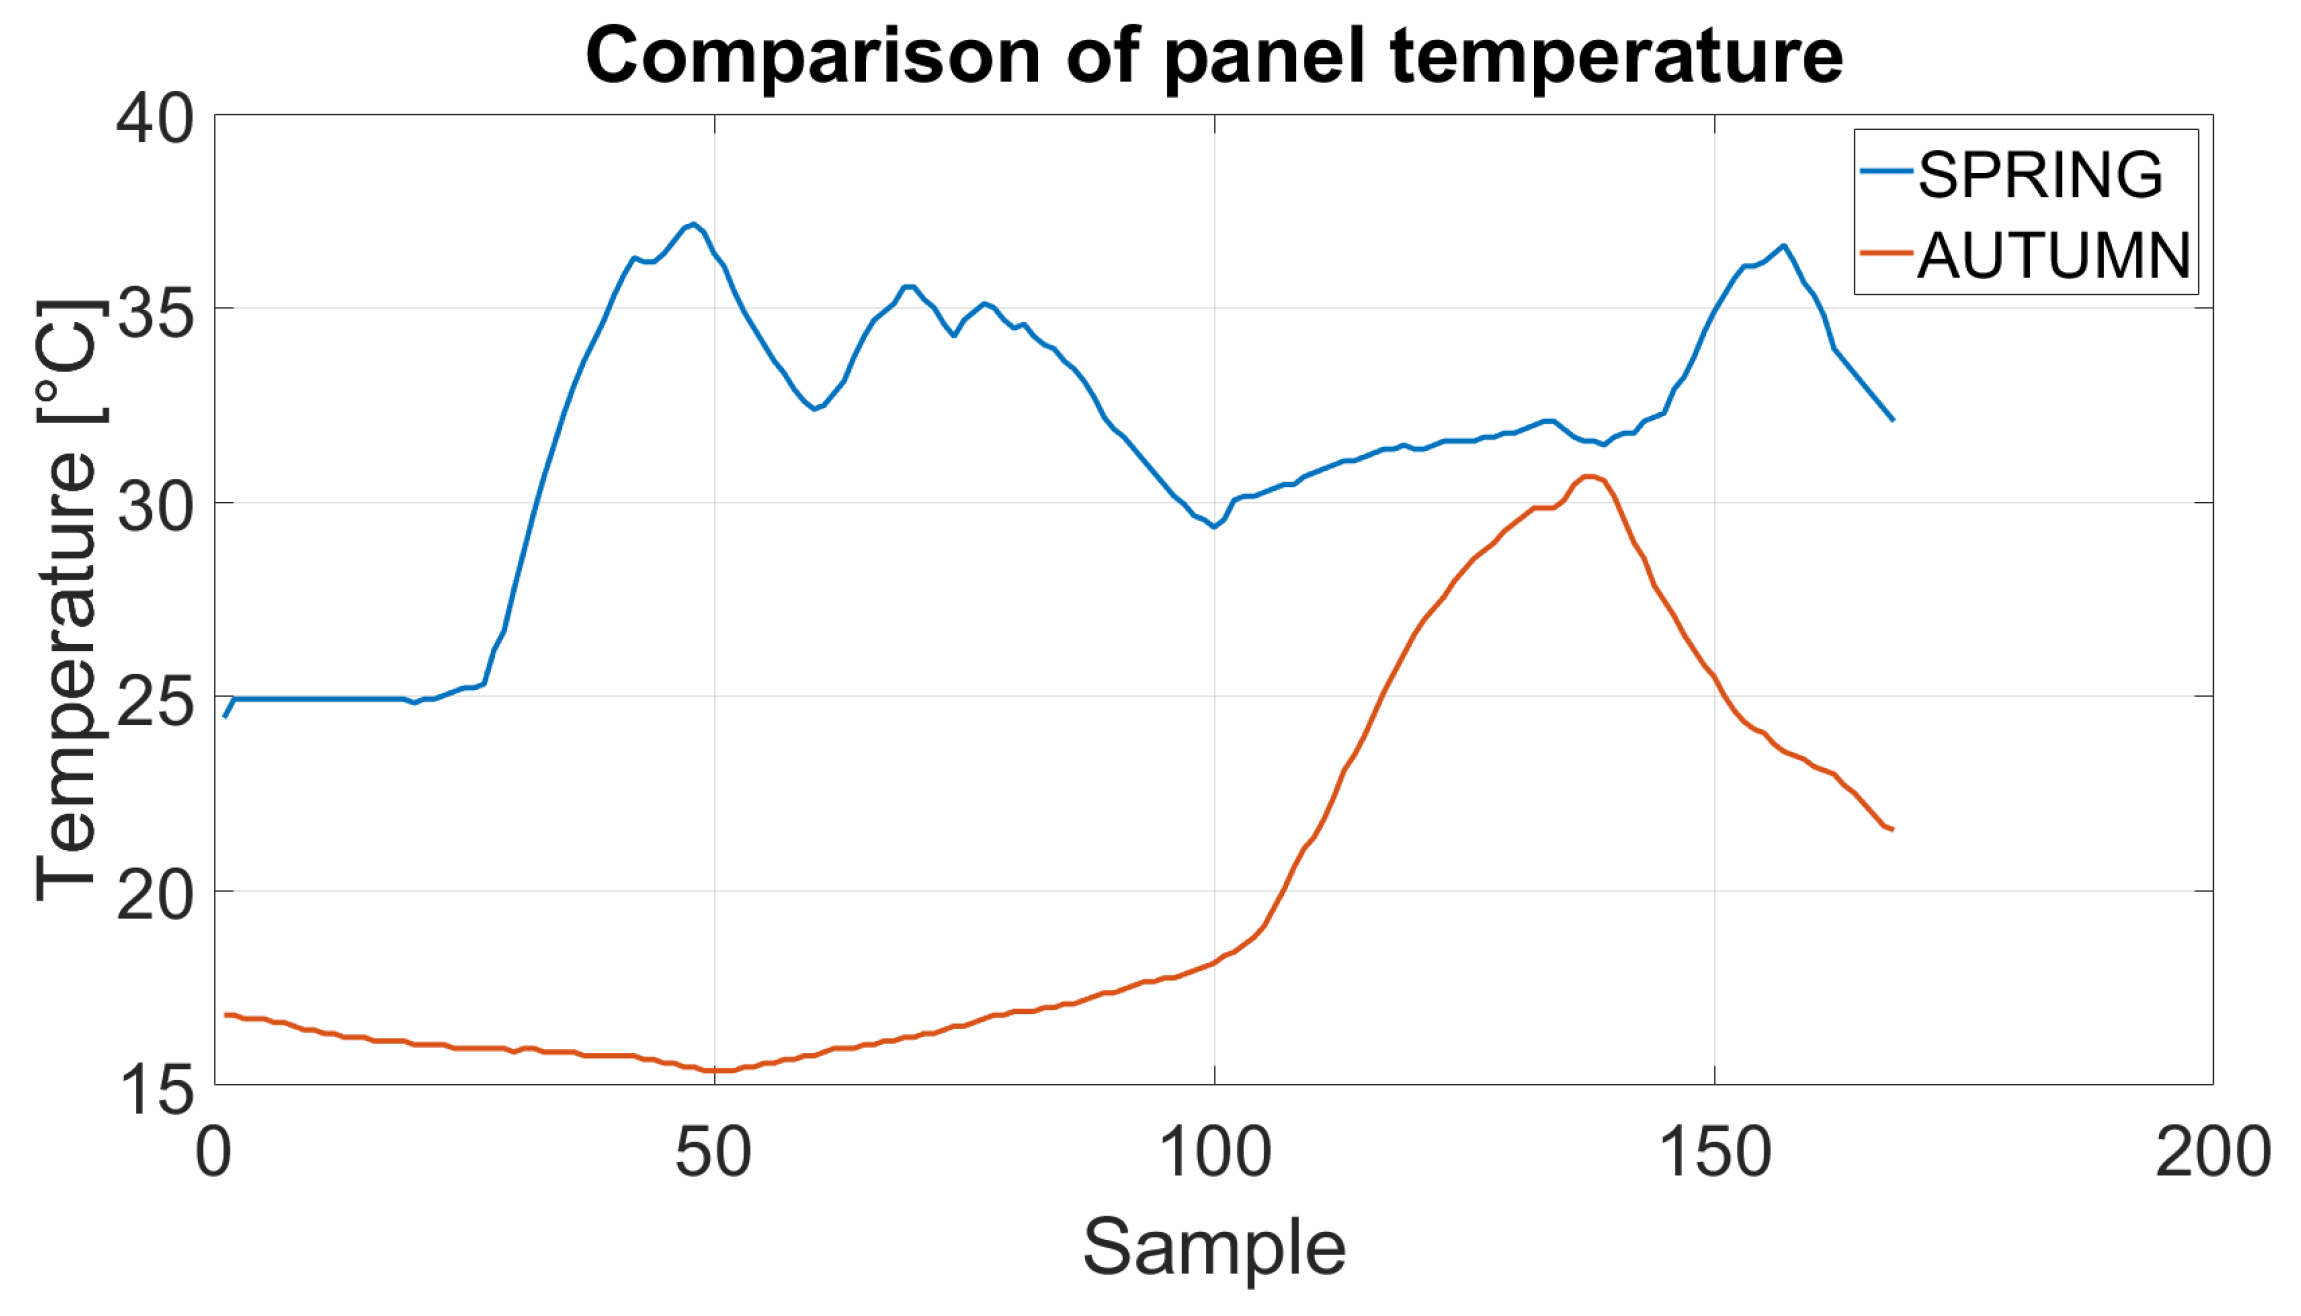
Measurements of the autumn and spring series indicate a relatively low efficiency of the PPV panels on the tested façade. Particularly noteworthy are the very low results in the spring measurements, where it might seem that, with a higher level of illumination, the effectiveness of the system should be also much higher. However, the adverse effects of high temperatures should be noticed and should also be associated with high insolation. The comparison of panel temperature in the autumn and spring series is shown in Figure 18.
Typically, the rated parameters of PPV panels are given for normal conditions, with a room temperature of about 25 °C. Meanwhile, in the spring series, the temperature of the PPV panels reached up to 37 °C. Such an increase in temperature limits the maximum current that can flow through the panels, and thus the power generated [3,48,57]. Hence the observed achievement of low levels of effectiveness of the façade system because the generated power shown in Figure 13 and Figure 17 is not the actual generated power but the direct result of the conversion of the illumination value. For efficiency calculations, it is compared with the real power delivered, and is measured on the inverter. The results presented in this paper are therefore illustrative, indicating the need to carry out more advanced measurements with the use of additional meters, e.g., current and voltage at the connection of PPV panels to the system installation.
To verify the maximum level of generated power, it was decided to prepare the current-voltage characteristics of the PPV panels, based on the data on the generated power and assuming a maximum current density of 23 mA/cm2 [48,54,57,58]. Measurement data from period 1 in the autumn series, with the highest calculated efficiency, were selected for plotting. The resulting characteristics are shown in Figure 19.
The graph shows the real characteristic (blue) and its curve after interpolation for determining the fill factor (FF) in relation to the ideal characteristic (black) [59,60]. The interpolation function has the form:
y = 3.28 ⋅ x3 − 4.21 ⋅ x2 + 0.96 ⋅ x + 0.23
For the analyzed characteristics, the FF is 27%. This is a very low level of this factor. For good quality PV cells, it should be about 70%, for low quality cells it should be at least 60%. However, it should be emphasized that such parameters apply to cells tested in ideal ambient conditions and to PV cell technologies known for years. Very high FFs are also reported for perovskite cells, but they are only reported for cells tested in laboratories in new PPV technologies research. Moreover, the same reports contain information about the verification of commercially available PSCs with similar FF levels as those present in the installation analyzed in this paper [61,62,63]. Therefore, this case study should be considered as a voice in the ongoing discussion and research related to the development of effective PSC technologies and, in particular, for commercial applications in building façade systems.

4. Dynamic Façade—Energy Efficiency and Control Strategy

Considering the energy efficiency of the PPV system and the rationality of using dynamic façades with PPV panels in buildings, a short performance evaluation has been analyzed and calculated. Furthermore, the assumptions of a new strategy for control of the dynamic façade have been proposed.

Energy Performance Analysis

Regarding the devices and elements of the control system supporting the dynamic façade with PPV panels, the nominal parameters provided by the manufacturers were adopted. The animeo IB+ (Somfy) platform controllers consume 3.5 W. The Solis Inverter consumes 7 W. Changing the position of the façade slats requires switching on 3 Mingardi linear motors with a power of 30 W each. Therefore, for the energy analysis of the operation of the dynamic façade system, the following assumptions were made:
  • Each movement of the slats is a load of 100.5 W (3 motors of 30 W each + 7 W inverter + 3.5 W controller);
  • In the standard (default) control scenario, the Somfy BMS platform checks and corrects the position of the slats every two minutes (maximum 720 correction movements per day), and one corrective movement lasts 10 s;
  • The façade and its slats are set in a safe position during the night and remain in it for 12 h, which means that the number of corrective movements is halved (360);
  • By analyzing the sun’s position changes during the day, it was initially assumed that the standard control scenario for the dynamic façade (sun-tracking) is not optimal, and the correction of the position of the slats every two minutes is too frequent.
Bearing in mind all these assumptions, a first stage of the analysis has been focused on determining the levels of power and energy consumption with the default, implemented dynamic façade control scenario (slats movements each 2 min). Then, a reduced number of movements, correcting the position of the slats every 10 min, was assumed and set, without a significant impact on the efficiency of the panels (see information in Section 3.1.1 and Section 3.2.1) and the comfort of use of the rooms. The results of simplified energy consumption calculations for both control scenarios are presented in Table 3. They are rather obvious and show a 20% improvement in the energy efficiency of sun-tracking.
The second stage of the energy performance analysis was to verify the self-sufficiency of the dynamic façade installation and its energy efficiency. For this, the actual peak power (kWp) of the PPV panels for the entire façade was determined on the measurement days. On the autumn day, it was 0.7 kWp and on the spring day, it was 1.18 kWp, which translates into daily energy production of 2 kWh and 3.13 kWh, respectively. In this respect, the relation of energy produced per day by the PPV panels to the energy consumed for the implementation of sun-tracking is summarized in Table 4.
Averaging the daily level of energy production for both measurement days, the value of 2.59 kWh was obtained. This is justified because the energy generated during the autumn and spring months, in particular for selected measurement days, is close to the annual average value, as the data analyzed indicates, for example, in [64,65]. Then, the losses resulting from the operation of the sun-tracking function were subtracted from this value, obtaining the values of daily energy yield 2.48 kWh and 2.56 kWh, respectively, for autumn and spring. In the annual period (365 days), this translates into the yield values of 906.84 kWh (autumn) and 936.19 kWh (spring). The self-sufficiency of the installation has been demonstrated. Moreover, in the context of its enlargement with subsequent façade segments, it can be concluded that even under unfavorable operating conditions (autumn, default control scenario with each 2 min movement), this analyzed installation can handle the sun-tracking functions for the next twenty identical installations. Furthermore, these new installations will produce energy only for the needs of the building’s infrastructure. Changing the control scenario to movement every 10 min means the possibility of operating the sun-tracking automation for even a hundred or more of the same installations.

5. Conclusions

This paper focuses on a case study of a specific, real dynamic building façade installation with perovskite photovoltaic panels. The results of measuring the dependence of key operating parameters of this installation on weather and atmospheric conditions, as well as the design of the façade itself, are presented and discussed. They confirm rather low energy efficiency of perovskite PV panels, with average levels below 10% for the real system presented in the paper. The authors are aware of the very short period of the measurement series, but it depended on the availability of the pilot installation and was due to the nature of the experimental approach. Therefore, it was assumed that random technical measurements of the operating installation would be carried out, with an attempt to make preliminary inferences about its effectiveness. However, the multi-faceted analysis of the experimental results described in this paper indicates a very high level of dependence of the energy efficiency of PPV panels on sunlight conditions and the temperature of the facade fins. As shown for a series of spring measurements, even potentially perfect weather conditions do not determine maximum efficiency but require prior good design of the distribution of panel sections in the façade and the selection of functions that control the dynamics of its changes in the sun-tracking mechanism. These observations are universal and should be taken as suggestions for potential new research and projects, especially on the installation of commercial dynamic façades with PPV panels. However, it should be emphasized that the method used to measure the illumination intensity of PPV panels and their energy efficiency, indirectly, is simplified, and this is the result of the limited access to the installation in the analyzed facility. Therefore, the approach described in this paper, with a small number of measurement modules and the assumption of nominal technical parameters of electrical devices in the installation, can be used in similar tests of the real installations of PPV panels on building façades, but only for the initial verification of the performance parameters and the efficiency of the installation.
Furthermore, the issue of the energy intensity of the installation infrastructure itself has been discussed, taking into consideration the realization of the active, dynamic sun-tracking function, especially in the context of the expansion of the façade with additional segments with PPV panels, as well as its integration into control and building management systems. Based on the results of the analyses described in Section 4, changes in the selection of the façade dynamics control function were proposed, enabling significant savings in use of the analyzed installation. The results presented in Table 3 and Table 4 are very promising in terms of significant self-energy consumption savings for sun-tracking in relation to overall energy produced by the PV system, from 5% to 1% in autumn and from almost 3.2% to 0.6% in spring periods, respectively. These observations are important both in the context of the planned expansion of the installation on the analyzed facility, as well as the implementation of advanced BACS and BMS, whose controllers, sensors, and actuators also require power [66,67].
The authors have given recommendations for designers and automation engineers implementing such installations in future. They have referred to the consideration of the possibility of using DC motors in the façade dynamics mechanism. Such a solution would make it possible to reduce additional losses resulting from energy conversion for their power supply. The same applies to the possibility of directly powering from PPV panels the building’s automation and BMS modules, which are usually powered by DC. These aspects will be part of future works.
Additionally, bearing in mind all experiences from experiments conducted and described in the paper, in future works, more accurate experimental measurements are planned over longer periods for this pilot installation. In particular, we intend to consider in-depth illumination performance analyses, both outdoor and indoor, according to information briefly mentioned at the end of Section 3.2. Moreover, more advanced scenarios for controlling the dynamics of the façade movement will be develop and verified, with support for the sun-tracking system, including the possibility of integrating the control within the BMS of the building. This is of particular importance in the context of the planned expansion of the façade with subsequent sections of PPV panels. It should also be pointed out that there is a need for a broader energy analysis of the case-study installation and consideration of the sun-tracking function, not only in the context of energy consumption but also to ensure lighting comfort in rooms (and reduce energy consumption for that lighting) as well as thermal comfort.

Author Contributions

Conceptualization, A.O. and G.W.; methodology, A.O. and G.W.; validation, A.O.; investigation, G.W.; resources, A.O.; data curation, G.W.; writing, review and editing A.O.; visualization, G.W.; supervision, A.O. All authors have read and agreed to the published version of the manuscript.

Funding

This research received no external funding.

Data Availability Statement

The data and datasheets presented in figures in this study are available on request from the corresponding author. The data are not publicly available due to privacy and company restrictions.

Acknowledgments

The Aliplast Poland (www.aliplastpoland.com (accessed on 10 March 2023)) is acknowledged for providing access to the facility with a dynamic building façade, as well as enabling measurements and technical support.

Conflicts of Interest

The authors declare no conflict of interest.

Abbreviations

The following abbreviations are used in this paper:
BACSBuilding Automation and Control Systems
BIPVBuilding-integrated Photovoltaic
BMSBuilding Management System
DCDirect Current
EPBDEnergy Performance of Buildings Directive
FFFill Factor
IEAInternational Energy Agency
MPPTMaximum Power Point Tracking
PPVPerovskite Photovoltaic
PSCsPerovskite Solar Cells
PVPhotovoltaic
RESRenewable Energy Sources
SRISmart Readiness Indicator

References

  1. IEA Buildings. A Source of Enormous Untapped Efficiency Potential. Available online: https://www.iea.org/topics/buildings (accessed on 24 January 2023).
  2. Kaminska, A.; Ożadowicz, A. Lighting Control Including Daylight and Energy Efficiency Improvements Analysis. Energies 2018, 11, 2166. [Google Scholar] [CrossRef]
  3. Shin, W.-G.; Shin, J.-Y.; Hwang, H.-M.; Park, C.-H.; Ko, S.-W. Power Generation Prediction of Building-Integrated Photovoltaic System with Colored Modules Using Machine Learning. Energies 2022, 15, 2589. [Google Scholar] [CrossRef]
  4. IEA Renewables 2022; International Energy Agency: Paris, France, 2022.
  5. Basher, M.K.; Nur-E-Alam, M.; Rahman, M.M.; Hinckley, S.; Alameh, K. Design, Development, and Characterization of Highly Efficient Colored Photovoltaic Module for Sustainable Buildings Applications. Sustainability 2022, 14, 4278. [Google Scholar] [CrossRef]
  6. European Parliament Directive (EU) 2018/844 of the European Parliament and the Council on the Energy Performance of Buildings. Off. J. Eur. Union 2018, 156, 75–91.
  7. Vassiliades, C.; Agathokleous, R.; Barone, G.; Forzano, C.; Giuzio, G.F.; Palombo, A.; Buonomano, A.; Kalogirou, S. Building Integration of Active Solar Energy Systems: A Review of Geometrical and Architectural Characteristics. Renew. Sustain. Energy Rev. 2022, 164, 112482. [Google Scholar] [CrossRef]
  8. Kiehbadroudinezhad, M.; Merabet, A.; Abo-Khalil, A.G.; Salameh, T.; Ghenai, C. Intelligent and Optimized Microgrids for Future Supply Power from Renewable Energy Resources: A Review. Energies 2022, 15, 3359. [Google Scholar] [CrossRef]
  9. Shayeghi, H.; Shahryari, E.; Moradzadeh, M.; Siano, P. A Survey on Microgrid Energy Management Considering Flexible Energy Sources. Energies 2019, 12, 2156. [Google Scholar] [CrossRef]
  10. Sierla, S.; Pourakbari-Kasmaei, M.; Vyatkin, V. A Taxonomy of Machine Learning Applications for Virtual Power Plants and Home/Building Energy Management Systems. Autom. Constr. 2022, 136, 104174. [Google Scholar] [CrossRef]
  11. Gul, M.; Kotak, Y.; Muneer, T. Review on Recent Trend of Solar Photovoltaic Technology. Energy Explor. Exploit. 2016, 34, 485–526. [Google Scholar] [CrossRef]
  12. Marques Lameirinhas, R.A.; Torres, J.P.N.; de Melo Cunha, J.P. A Photovoltaic Technology Review: History, Fundamentals and Applications. Energies 2022, 15, 1823. [Google Scholar] [CrossRef]
  13. Parida, B.; Iniyan, S.; Goic, R. A Review of Solar Photovoltaic Technologies. Renew. Sustain. Energy Rev. 2011, 15, 1625–1636. [Google Scholar] [CrossRef]
  14. Zhang, T.; Wang, M.; Yang, H. A Review of the Energy Performance and Life-Cycle Assessment of Building-Integrated Photovoltaic (BIPV) Systems. Energies 2018, 11, 3157. [Google Scholar] [CrossRef]
  15. Sabu, T.; Aparna, T. Perovskite Photovoltaics; Elsevier: Chennai, India, 2018; ISBN 978-0-12-812915-9. [Google Scholar]
  16. Romaní, J.; Ramos, A.; Salom, J. Review of Transparent and Semi-Transparent Building-Integrated Photovoltaics for Fenestration Application Modeling in Building Simulations. Energies 2022, 15, 3286. [Google Scholar] [CrossRef]
  17. Peng, J.; Lu, L.; Yang, H.; Han, J. Investigation on the Annual Thermal Performance of a Photovoltaic Wall Mounted on a Multi-Layer Façade. Appl. Energy 2013, 112, 646–656. [Google Scholar] [CrossRef]
  18. Olivieri, L.; Caamaño-Martín, E.; Moralejo-Vázquez, F.J.; Martín-Chivelet, N.; Olivieri, F.; Neila-Gonzalez, F.J. Energy Saving Potential of Semi-Transparent Photovoltaic Elements for Building Integration. Energy 2014, 76, 572–583. [Google Scholar] [CrossRef]
  19. Wang, M.; Peng, J.; Li, N.; Lu, L.; Ma, T.; Yang, H. Assessment of Energy Performance of Semi-Transparent PV Insulating Glass Units Using a Validated Simulation Model. Energy 2016, 112, 538–548. [Google Scholar] [CrossRef]
  20. Senkus, P.; Glabiszewski, W.; Wysokińska-Senkus, A.; Cyfert, S.; Batko, R. The Potential of Ecological Distributed Energy Generation Systems, Situation, and Perspective for Poland. Energies 2021, 14, 7966. [Google Scholar] [CrossRef]
  21. Zsiborács, H.; Pintér, G.; Vincze, A.; Baranyai, N.H.; Mayer, M.J. The Reliability of Photovoltaic Power Generation Scheduling in Seventeen European Countries. Energy Convers. Manag. 2022, 260, 115641. [Google Scholar] [CrossRef]
  22. Zhou, Y.; Herr, C.M. A Review of Advanced Façade System Technologies to Support Net-Zero Carbon High-Rise Building Design in Subtropical China. Sustainability 2023, 15, 2913. [Google Scholar] [CrossRef]
  23. Akram, M.; Ullah, K.; Pamucar, D. Performance Evaluation of Solar Energy Cells Using the Interval-Valued T-Spherical Fuzzy Bonferroni Mean Operators. Energies 2022, 15, 292. [Google Scholar] [CrossRef]
  24. Unger, E.; Paramasivam, G.; Abate, A. Perovskite Solar Cell Performance Assessment. J. Phys. Energy 2020, 2, 044002. [Google Scholar] [CrossRef]
  25. Subramanya, R.; Yli-Ojanperä, M.; Sierla, S.; Hölttä, T.; Valtakari, J.; Vyatkin, V. A Virtual Power Plant Solution for Aggregating Photovoltaic Systems and Other Distributed Energy Resources for Northern European Primary Frequency Reserves. Energies 2021, 14, 1242. [Google Scholar] [CrossRef]
  26. Attoye, D.E.; Hassan, A. A Review on Building Integrated Photovoltaic Façade Customization Potentials. Sustainability 2017, 9, 2287. [Google Scholar] [CrossRef]
  27. Bonomo, P.; Chatzipanagi, A.; Frontini, F. Overview and Analysis of Current BIPV Products: New Criteria for Supporting the Technological Transfer in the Building Sector. VITRUVIO—Int. J. Archit. Technol. Sustain. 2015, 67, 67–85. [Google Scholar] [CrossRef]
  28. Jelle, B.P.; Breivik, C. State-of-the-Art Building Integrated Photovoltaics. Energy Procedia 2012, 20, 68–77. [Google Scholar] [CrossRef]
  29. Juarez-Perez, E.J.; Ono, L.K.; Qi, Y. Thermal Degradation of Formamidinium Based Lead Halide Perovskites into Sym-Triazine and Hydrogen Cyanide Observed by Coupled Thermogravimetry-Mass Spectrometry Analysis. J. Mater. Chem. A Mater. 2019, 7, 16912–16919. [Google Scholar] [CrossRef]
  30. Guo, Y.; Jia, Y.; Li, N.; Chen, M.; Hu, S.; Liu, C.; Zhao, N. Degradation Mechanism of Perovskite Light-Emitting Diodes: An In Situ Investigation via Electroabsorption Spectroscopy and Device Modelling. Adv. Funct. Mater. 2020, 30, 1910464. [Google Scholar] [CrossRef]
  31. Hui, Y.; Tan, Y.; Chen, L.; Nan, Z.; Zhou, J.; Yan, J.; Mao, B. Stability of Perovskite Thin Films under Working Condition: Bias-Dependent Degradation and Grain Boundary Effects. Adv. Funct. Mater. 2021, 31, 2103894. [Google Scholar] [CrossRef]
  32. Finkenauer, B.P.; Akriti; Ma, K.; Dou, L. Degradation and Self-Healing in Perovskite Solar Cells. ACS Appl. Mater. Interfaces 2022, 14, 24073–24088. [Google Scholar] [CrossRef]
  33. Zhang, D.; Li, D.; Hu, Y.; Mei, A.; Han, H. Degradation Pathways in Perovskite Solar Cells and How to Meet International Standards. Commun. Mater. 2022, 3, 58. [Google Scholar] [CrossRef]
  34. Jung, S.; Han, S.; Lee, M.-G.; Lee, H. Development of a Solar Tracking-Based Movable Louver System to Save Lighting Energy and Create a Comfortable Light Environment. Buildings 2022, 12, 2017. [Google Scholar] [CrossRef]
  35. Chi, F.; Wang, R.; Li, G.; Xu, L.; Wang, Y.; Peng, C. Integration of Sun-Tracking Shading Panels into Window System towards Maximum Energy Saving and Non-Glare Daylighting. Appl. Energy 2020, 260, 114304. [Google Scholar] [CrossRef]
  36. Kang, H.; Hong, T.; Lee, M. A New Approach for Developing a Hybrid Sun-Tracking Method of the Intelligent Photovoltaic Blinds Considering the Weather Condition Using Data Mining Technique. Energy Build 2020, 209, 109708. [Google Scholar] [CrossRef]
  37. Brzezicki, M.; Regucki, P.; Kasperski, J. Optimization of Useful Daylight Illuminance for Vertical Shading Fins Covered by Photovoltaic Panels for a Case Study of an Office Room in the City of Wroclaw, Poland. Buildings 2021, 11, 637. [Google Scholar] [CrossRef]
  38. Al-Saadi, M.; Al-Greer, M.; Short, M. Reinforcement Learning-Based Intelligent Control Strategies for Optimal Power Management in Advanced Power Distribution Systems: A Survey. Energies 2023, 16, 1608. [Google Scholar] [CrossRef]
  39. Ożadowicz, A. A New Concept of Active Demand Side Management for Energy Efficient Prosumer Microgrids with Smart Building Technologies. Energies 2017, 10, 1771. [Google Scholar] [CrossRef]
  40. Chen, Y.; Wang, X.; Liu, Z.; Cui, J.; Osmani, M.; Demian, P. Exploring Building Information Modeling (BIM) and Internet of Things (IoT) Integration for Sustainable Building. Buildings 2023, 13, 288. [Google Scholar] [CrossRef]
  41. European Parliament Directive 2012/27/EU of the European Parliament and of the Council of 25 October 2012 on Energy Efficiency. Off. J. Eur. Union Dir. 2012, 55, 1–56. [CrossRef]
  42. Ożadowicz, A. A Hybrid Approach in Design of Building Energy Management System with Smart Readiness Indicator and Building as a Service Concept. Energies 2022, 15, 1432. [Google Scholar] [CrossRef]
  43. Märzinger, T.; Österreicher, D. Extending the Application of the Smart Readiness Indicator—A Methodology for the Quantitative Assessment of the Load Shifting Potential of Smart Districts. Energies 2020, 13, 3507. [Google Scholar] [CrossRef]
  44. Vigna, I.; Pernetti, R.; Pernigotto, G.; Gasparella, A. Analysis of the Building Smart Readiness Indicator Calculation: A Comparative Case-Study with Two Panels of Experts. Energies 2020, 13, 2796. [Google Scholar] [CrossRef]
  45. Chen, Y.; Yang, Y.; Xu, X. Towards Transactive Energy: An Analysis of Information-related Practical Issues. Energy Convers. Econ. 2022, 3, 112–121. [Google Scholar] [CrossRef]
  46. Hou, P.; Yang, G.; Hu, J.; Douglass, P.J.; Xue, Y. A Distributed Transactive Energy Mechanism for Integrating PV and Storage Prosumers in Market Operation. Engineering 2022, 12, 171–182. [Google Scholar] [CrossRef]
  47. Babar, M.; Grela, J.; Ożadowicz, A.; Nguyen, P.; Hanzelka, Z.; Kamphuis, I. Energy Flexometer: Transactive Energy-Based Internet of Things Technology. Energies 2018, 11, 568. [Google Scholar] [CrossRef]
  48. Saule Technologies Saule Technologies Products. Available online: https://sauletech.com/product/ (accessed on 10 January 2023).
  49. Somfy Systems Inc. Available online: https://www.somfy.com/en-en/ (accessed on 17 January 2023).
  50. Somfy, P.L. Available online: https://www.somfy.pl (accessed on 17 January 2023).
  51. OneTemp—Trading as HOBO Data Loggers Australia. Available online: https://www.hobodataloggers.com.au/hobo-pendant-ua-002-64-temperaturelight-data-logger-64k (accessed on 19 January 2023).
  52. Ryer, A. Light Measurement Handbook; International Light Inc.: Newburyport, MA, USA, 1997; ISBN 0-9658356-9-3. [Google Scholar]
  53. Michael, P.R.; Johnston, D.E.; Moreno, W. A Conversion Guide: Solar Irradiance and Lux Illuminance. J. Meas. Eng. 2020, 8, 153–166. [Google Scholar] [CrossRef]
  54. Karabulut, M.; Kusetogullari, H.; Kivrak, S. Outdoor Performance Assessment of New and Old Photovoltaic Panel Technologies Using a Designed Multi-Photovoltaic Panel Power Measurement System. Int. J. Photoenergy 2020, 2020, 8866412. [Google Scholar] [CrossRef]
  55. Arkar, C.; Žižak, T.; Domjan, S.; Medved, S. Dynamic Parametric Models for the Holistic Evaluation of Semi-Transparent Photovoltaic/Thermal Façade with Latent Storage Inserts. Appl. Energy 2020, 280, 115994. [Google Scholar] [CrossRef]
  56. Lee, K.; Han, K.; Lee, J. The Impact of Shading Type and Azimuth Orientation on the Daylighting in a Classroom–Focusing on Effectiveness of Façade Shading, Comparing the Results of DA and UDI. Energies 2017, 10, 635. [Google Scholar] [CrossRef]
  57. Liu, H.; Xiang, L.; Gao, P.; Wang, D.; Yang, J.; Chen, X.; Li, S.; Shi, Y.; Gao, F.; Zhang, Y. Improvement Strategies for Stability and Efficiency of Perovskite Solar Cells. Nanomaterials 2022, 12, 3295. [Google Scholar] [CrossRef]
  58. Wu, T.; Qin, Z.; Wang, Y.; Wu, Y.; Chen, W.; Zhang, S.; Cai, M.; Dai, S.; Zhang, J.; Liu, J.; et al. The Main Progress of Perovskite Solar Cells in 2020–2021. Nano-Micro Lett. 2021, 13, 152. [Google Scholar] [CrossRef]
  59. Sharma, D.K.; Purohit, G. Analysis on the Efficiency of Solar PV System for Improved Design of MPPT. In Proceedings of the 6th World Conference on Photovoltaic Energy Conversion, Kyoto, Japan, 23–27 November 2014; pp. 1281–1282. [Google Scholar]
  60. Kanareykin, A.I. On the Correctness of Calculating the Fill Factor of the Solar Module. In Proceedings of the IOP Conference Series: Earth and Environmental Science, Hangzhou, China, 1 July 2021; IOP Publishing Ltd.: Bristol, UK, 2021; Volume 808, p. 012018. [Google Scholar]
  61. Ma, C.; Park, N.-G. A Realistic Methodology for 30% Efficient Perovskite Solar Cells. Chem 2020, 6, 1254–1264. [Google Scholar] [CrossRef]
  62. Hu, D.; Yang, Q.; Chen, H.; Wobben, F.; Le Corre, V.M.; Singh, R.; Liu, T.; Ma, R.; Tang, H.; Koster, L.J.A.; et al. 15.34% Efficiency All-Small-Molecule Organic Solar Cells with an Improved Fill Factor Enabled by a Fullerene Additive. Energy Environ. Sci. 2020, 13, 2134–2141. [Google Scholar] [CrossRef]
  63. Cao, Q.; Li, Y.; Zhang, H.; Yang, J.; Han, J.; Xu, T.; Wang, S.; Wang, Z.; Gao, B.; Zhao, J.; et al. Efficient and Stable Inverted Perovskite Solar Cells with Very High Fill Factors via Incorporation of Star-Shaped Polymer. Sci. Adv. 2021, 7, 633–640. [Google Scholar] [CrossRef] [PubMed]
  64. Atsu, D.; Seres, I.; Farkas, I. The State of Solar PV and Performance Analysis of Different PV Technologies Grid-Connected Installations in Hungary. Renew. Sustain. Energy Rev. 2021, 141, 110808. [Google Scholar] [CrossRef]
  65. Gulkowski, S. Specific Yield Analysis of the Rooftop PV Systems Located in South-Eastern Poland. Energies 2022, 15, 3666. [Google Scholar] [CrossRef]
  66. Kräuchi, P.; Dahinden, C.; Jurt, D.; Wouters, V.; Menti, U.-P.; Steiger, O. Electricity Consumption of Building Automation. Energy Procedia 2017, 122, 295–300. [Google Scholar] [CrossRef]
  67. Iváncsy, T.; Tamus, Z.Á. Analysis of the Energy Consumption of Building Automation Systems. In Sustainability Through Innovation in Product Life Cycle Design; Springer: Singapore, 2017; pp. 871–881. ISBN 978-981-10-0471-1. [Google Scholar]
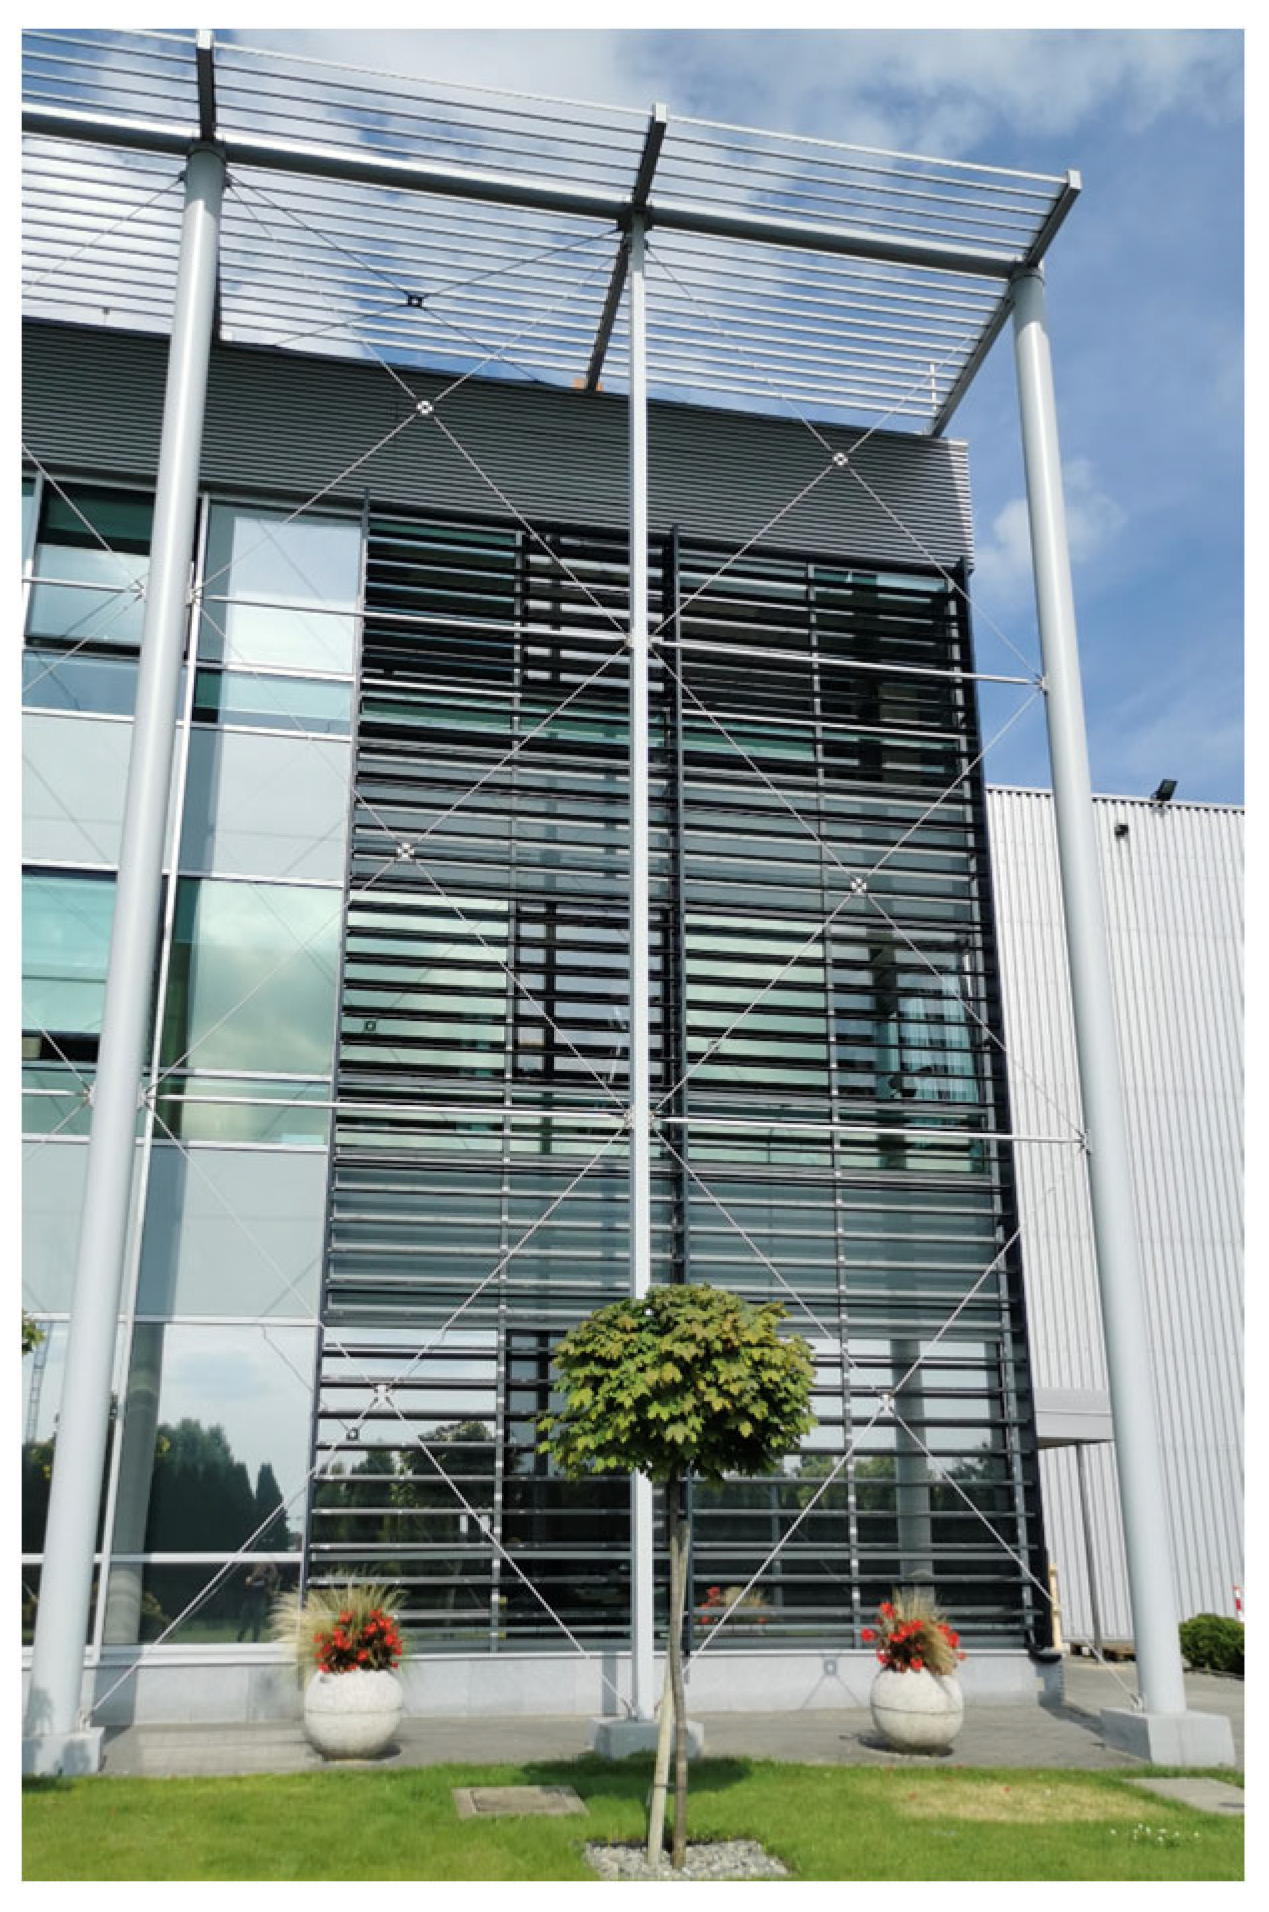
Figure 1. Real view of dynamic building façade with PPV panels.
Energies 16 03793 g001
Figure 2. The PPV façade: (a) construction framework; (b) electrical connections.
Energies 16 03793 g002
Figure 3. Section of the slat with external dimensions [48].
Energies 16 03793 g003
Figure 4. Range of lamella movement—one lamella section view [48].
Energies 16 03793 g004
Figure 5. The PV installation devices: (a) inverter Solis RHI-(3-6) K-48ES-5G; (b) rechargeable batteries PYLONTECH US2000.
Energies 16 03793 g005
Figure 6. The connection diagram of control system animeo IB+ for dynamic façade with PPV panels [49,50].
Energies 16 03793 g006
Figure 7. The data logger HOBO Pendant UA-002-64: (a) logger module with sensors and memory; (b) data reader base port U-1 [51].
Energies 16 03793 g007
Figure 8. A set of raw data from logger module—example.
Energies 16 03793 g008
Figure 9. Deployment of data loggers: (a) nine loggers near windows indoor—three for each floor (front view); (b) one data logger outside on the façade construction (left side view).
Energies 16 03793 g009
Figure 10. Trends of the temperature and illuminance levels from all the indoor sensors related to the outdoor façade temperature and daylight illuminance level (autumn series).
Energies 16 03793 g010
Figure 11. Three periods of measurements with changes in the position of the façade slats (lamellas) during the entire autumn measurement series.
Energies 16 03793 g011
Figure 12. Measurement data for three periods with changes in the position of the façade slats (lamellas)—autumn measurement series.
Energies 16 03793 g012
Figure 13. Power and solar irradiance measurements in the three discussed periods with changes in the position of the façade slats (lamellas) (autumn series).
Energies 16 03793 g013
Figure 14. Trends of the temperature and illuminance levels from all the indoor sensors related to the outdoor façade temperature and daylight illuminance level (spring series).
Energies 16 03793 g014
Figure 15. Three periods of measurements with changes in the position of the façade slats (lamellas) during the entire spring measurement series.
Energies 16 03793 g015
Figure 16. Measurements data for the three periods with changes in the position of the façade lamellas—spring measurement series.
Energies 16 03793 g016
Figure 17. Power and solar irradiance measurements in the three discussed periods with changes in the position of the façade slats (lamellas) (spring series).
Energies 16 03793 g017
Figure 18. Panel temperature changes in autumn and spring measurement series.
Energies 16 03793 g018
Figure 19. Current-voltage characteristic of the PPV panels based on the real data.
Energies 16 03793 g019
Table 1. Calculated efficiency of the pilot installation in a series of autumn measurements.
Period of MeasurementsEfficiency of the Installation
113.1442%
26.4822%
39.6635%
Average9.7633%
Table 2. Calculated efficiency of the pilot installation in a series of spring measurements.
Period of MeasurementsEfficiency of the Installation
13.1036%
23.0441%
38.1666%
Average4.7714%
Table 3. Energy consumption for sun-tracking function considering different basic control scenarios of dynamic façade.
DescriptionEach 2 min MovementsEach 10 min Movements
Energy consumption
for 10 s
slats movement
1005 Ws,
i.e., 0.28 Wh
1005 Ws,
i.e., 0.28 Wh
Energy consumption
for 360 movements
during the day
100.5 Wh
i.e., 0.1005 kWh
20.1 Wh
i.e., 0.0201 kWh
Annual energy consumption (365 days) for sun-tracking 36.68 kWh7.34 kWh
Table 4. Relation of energy production by PPV panels and consumption for sun-tracking, considering different basic control scenarios of the dynamic façade.
DescriptionEach 2 min MovementsEach 10 min Movements
Ratio of energy consumed for sun-tracking to produced (autumn 1 day)5.03%1.01%
Ratio of energy consumed for sun-tracking to produced (spring 1 day)3.17% 0.63%
Disclaimer/Publisher’s Note: The statements, opinions and data contained in all publications are solely those of the individual author(s) and contributor(s) and not of MDPI and/or the editor(s). MDPI and/or the editor(s) disclaim responsibility for any injury to people or property resulting from any ideas, methods, instructions or products referred to in the content.