Abstract
The coordinated use of electricity and a heat energy system can effectively improve the energy structure during winter heating in the northern part of China and improve the environmental pollution problem. In this paper, an economic scheduling model of an electric–thermal integrated energy system, including a wind turbine, regenerative electric boiler, solar heat collection system, biomass boiler, ground source heat pump and battery is proposed, and a biomass boiler was selected as the auxiliary heat source of the solar heat collection system. A mixed integer linear programming model was established to take the operating cost of the whole system as the target. A day-ahead optimization scheduling strategy considering the demand side response and improving new energy consumption is proposed. In order to verify the influence of the coordinated utilization of the flexible load and energy storage equipment on the optimal scheduling in the model built, three scenarios were set up. Scenario 3 contains energy storage and a flexible load. Compared with scenario 1, the total cost of scenario 3 was reduced by 51.5%, and the abandonment cost of wind energy was reduced by 43.3%. The use of a flexible load and energy storage can effectively reduce the cost and improve new energy consumption. By increasing the capacity of the energy-storage device, the wind power is completely absorbed, but the operation and maintenance cost is increased, so the capacity of energy storage equipment is allocated reasonably according to the actual situation.
1. Introduction
Under the background of increasing energy demand and serious damage to the global ecological environment, developing a clean energy industry, promoting the revolution of energy production and consumption, and building a clean, low-carbon, safe, and efficient energy system are the directions of future energy development [1,2,3]. Electric–thermal integrated energy systems (IESs) can reduce the operating cost of the whole system through the coordination of the electric–thermal energy unit and load and at the same time, improve the consumption rate of new energy and improve the level of large-scale development and utilization. At present, the IES has become the focus of energy transformation and development in countries all over the world [4,5,6]. The research of this paper involves energy storage, a ground source heat pump, a solar heat collector system, a flexible load, and a scheduling optimization strategy. The following is analyzed based on the research of scholars from these aspects.
- Energy storage
Energy storage is the “soul” of electric–thermal IES, which can effectively improve energy efficiency and reduce consumption costs [7,8,9,10]. In reference [11], under the environment of time-sharing electricity prices, an electricity–thermal IES regulation strategy considering heating network transmission delay and heating storage is proposed. Taking the heating network system as scheduling resources, the heating load transfer of the system can be realized. In reference [12], the heating reserve of the heat storage unit is converted into the generating reserve of the unit and incorporated into the constraints. In reference [13], the Benders decomposition algorithm is used to effectively solve the optimal scheduling problem of the electric–thermal IES, including heating storage, electric boiler, and carbon capture equipment, which effectively promotes the wind power consumption and improves the economy and low-carbon performance of the whole system. Reference [14] simulates the uncertainty of wind power output, considers the thermal energy-storage characteristics of the water supply pipeline of the heating system and the thermal delay of the heating network pipeline, and takes the lowest energy purchase cost of the system as the objective function to put forward the scheduling plan of the system. In reference [15], the optimal scheduling problem of the IES, including the ground source heat pump, combined cooling, heating, and power supply system, and many kinds of energy supply and storage equipment is studied. In reference [16], the CCHP system with photovoltaic and energy-storage equipment is established, and the influence of energy storage on the system is analyzed. In reference [17], the effect of heat storage equipment on wind power consumption of the lifting system is analyzed by constructing the scheduling model of the cogeneration unit, including heat storage. In order to improve the capacity of wind power consumption, a joint system of wind power and energy-storage equipment is established, and the particle swarm optimization algorithm is used to optimize the scheduling of each equipment, in reference [18]. In this paper, the framework structure of an electric–thermal integrated energy system is presented, including wind turbines, batteries, regenerative electric boilers, ground source heat pumps, solar heat collection systems, and biomass boilers. Energy-storage equipment includes a battery and heat regenerator. For the first time, a biomass boiler as an auxiliary heat source for solar heat collection systems is proposed in this paper.
- 2.
- Ground source heat pump and solar heat collector system
At present, a ground source heat pump and solar heat collector system are added to the integrated energy system to improve the economy of the system and the infiltration ratio of new energy. Reference [19] presents the design of an IHS with a wind turbine, photovoltaic, diesel generator, and battery and mobile energy-storage systems (ESSs). A multi-objective optimization to minimize the total cost of construction, maintenance, and operation of sources and ESSs within the IHS and the emission level of the system using two separate objective functions is proposed. In references [20,21], the thermal performance of an energy pile-solar-collector-coupled system for underground solar energy storage was investigated using numerical modeling. The results suggested that a lower flow rate should be adopted for the energy pile-solar-collector-coupled system to save the operational cost of the circulation pump. In reference [22], a new combined energy system composed of the parabolic dish solar collector, stirling engine, and thermoelectric device is proposed. In reference [23], the influence of distributed generation on the transmission line is studied, and the optimal control strategy of distributed generation is proposed. In reference [24], the effect of different operation strategies of the combined system on the system performance and soil temperature variation is discussed. Reference [25] designs a novel solar-assisted ground-source heat pump system with the heat-cascading of borehole heat-exchangers and realizes both cascaded heat-storage and heat-utilization. In reference [26], a novel combined cooling, heating, and power or trigeneration system driven with a gas engine and flat plate solar collector is proposed. In reference [27], to find an optimal economic solution for solar district heating (SDH), an evaluation model based on the levelized cost of heat is developed. Reference [28] establishes the analytical model for a hybrid heating system, containing a solar collector, air-source heat pump, and water tank, and provides guidance for practical design of the heating system with multiple heat source and TES equipment. Reference [29] presents the numerical simulation of a solar-assisted ground-coupled heat pump system, which can provide both space heating and domestic hot water. Reference [30] proposes a complete two-wavelength band radiation model of a direct-absorption solar collector. Reference [31] develops an exergy-based hierarchical control for the ACUREX solar collector field.
- 3.
- Scheduling optimization strategy
Fully considering the flexible load in the optimal scheduling can improve the energy-consumption capacity of the system [32,33]. Combined with the characteristics of all kinds of translatable loads, the load translation of cooling and thermoelectric loads is carried out in reference [34], and an optimal scheduling model, including economic, environmental, and energy operating costs, is established. In order to fully utilize the flexibility potential of the CCHP system, reference [35] divides the system with the energy supply process in an analytical viewpoint of flexibility and proposes a novel operational strategy of following system flexibility to schedule energy dispatch. Reference [36] fully considers the robust optimal scheduling method of virtual power plant heat and power cogeneration under flexible load. the coordinated optimization effect of many kinds of flexible loads is improved. In reference [37], a scheduling strategy suitable for load aggregators to reduce the real-time demand response of a flexible load is proposed, which is optimized by the combination of mixed integer linear optimization and Monte Carlo simulation based on Copula to realize the real-time random scheduling of a residential flexible load. In this paper, considering the demand-side response of the two kinds of flexible load, which can reduce the load and shift the load, in coordination with the electricity storage and heat storage unit, an economic day-ahead optimization scheduling model of an electric–thermal integrated energy system is proposed.
In references [38,39,40], in view of the increasingly serious environmental pollution problem, a multi-objective optimization model of a CCHP microgrid considering polluting gas emissions is established. In references [41,42,43], combining renewable energy with a CCHP microgrid is proposed in order to solve the problem of wind–solar consumption and reduce the energy consumption of the CCHP system. In references [44,45,46], the heat transfer process in the basic components of a thermal system from the perspective of energy flow is introduced, and it puts forward an electric–thermal IES optimization model. In reference [47], an active distribution network planning model is proposed, which includes multiple options, such as the expansion of substations, addition of CCHP systems, gas boilers, and central air-conditioning. In references [37,48], using a matrix form to construct the input and output model of the CCHP system, the system evaluation model is established.
At present, the units of the IES are mainly the wind turbine (WT), photovoltaic (PV), combined cooling, heating and power system (CCHP), and electric refrigeration unit (EC) or absorption refrigeration unit (ABC). The optimal scheduling strategy of the system uses the NSGA-II algorithm or alexa tool to solve the optimization problem. Moreover, there are few IESs in which the solar heat collector system (SHCS), ground source heat pump (GSHP) with biomass boiler (BB), and the BB are selected as the auxiliary heat source of SHCS. In this paper, the structure of an IES is proposed for the first time, and the optimal scheduling strategy of the IES with this structure has not been studied and reported.
In order to enrich the system structure and energy equipment types of the IES and make the IES more extensive, on the basis of existing research, an electric–thermal IES is established in this paper, which includes a wind turbine (WT), SHCS, GSHP, BB, regenerative electric boiler (REB), and battery. The REB consists of an electric boiler (EB) and a regenerator (RG). For this IES structure, a day-ahead scheduling optimization model is proposed. Considering the demand-side response of the two kinds of flexible load, which can reduce the load and shift the load, in coordination with the electricity storage and heat storage unit, the optimization model is solved by Pyomo-GLPK. Pyomo-GLPK is an open source solver, which can be easily combined with other software programs and can be widely used in practical engineering projects. Through three scenarios, the system operating costs of different schemes are compared, and the effectiveness of the optimization strategy proposed in this paper is verified. At the same time, compared with other commercial solvers, the computing time of the Pyomo-GLPK algorithm is equal to that of other commercial solvers.
Accordingly, the main contributions of this paper are as follows:
- (i)
- Proposed the framework structure of an electric–thermal integrated energy system including wind turbines, batteries, regenerative electric boilers, ground source heat pumps, solar heat collection systems, and biomass boilers. For the first time, proposed a biomass boiler as an auxiliary heat source for solar heat collection systems.
- (ii)
- Considering the demand-side response of the two kinds of flexible load, which can reduce the load and shift the load, in coordination with the electricity storage and heat storage unit, an economic day-ahead optimization scheduling model of electric–thermal integrated energy system is proposed.
- (iii)
- Established a mixed integer linear programming model to take the operating cost of the whole system and improve the consumption of new energy as the target, and used Pyomo-GLPK to solve the model.
2. Electric–Thermal IES Model
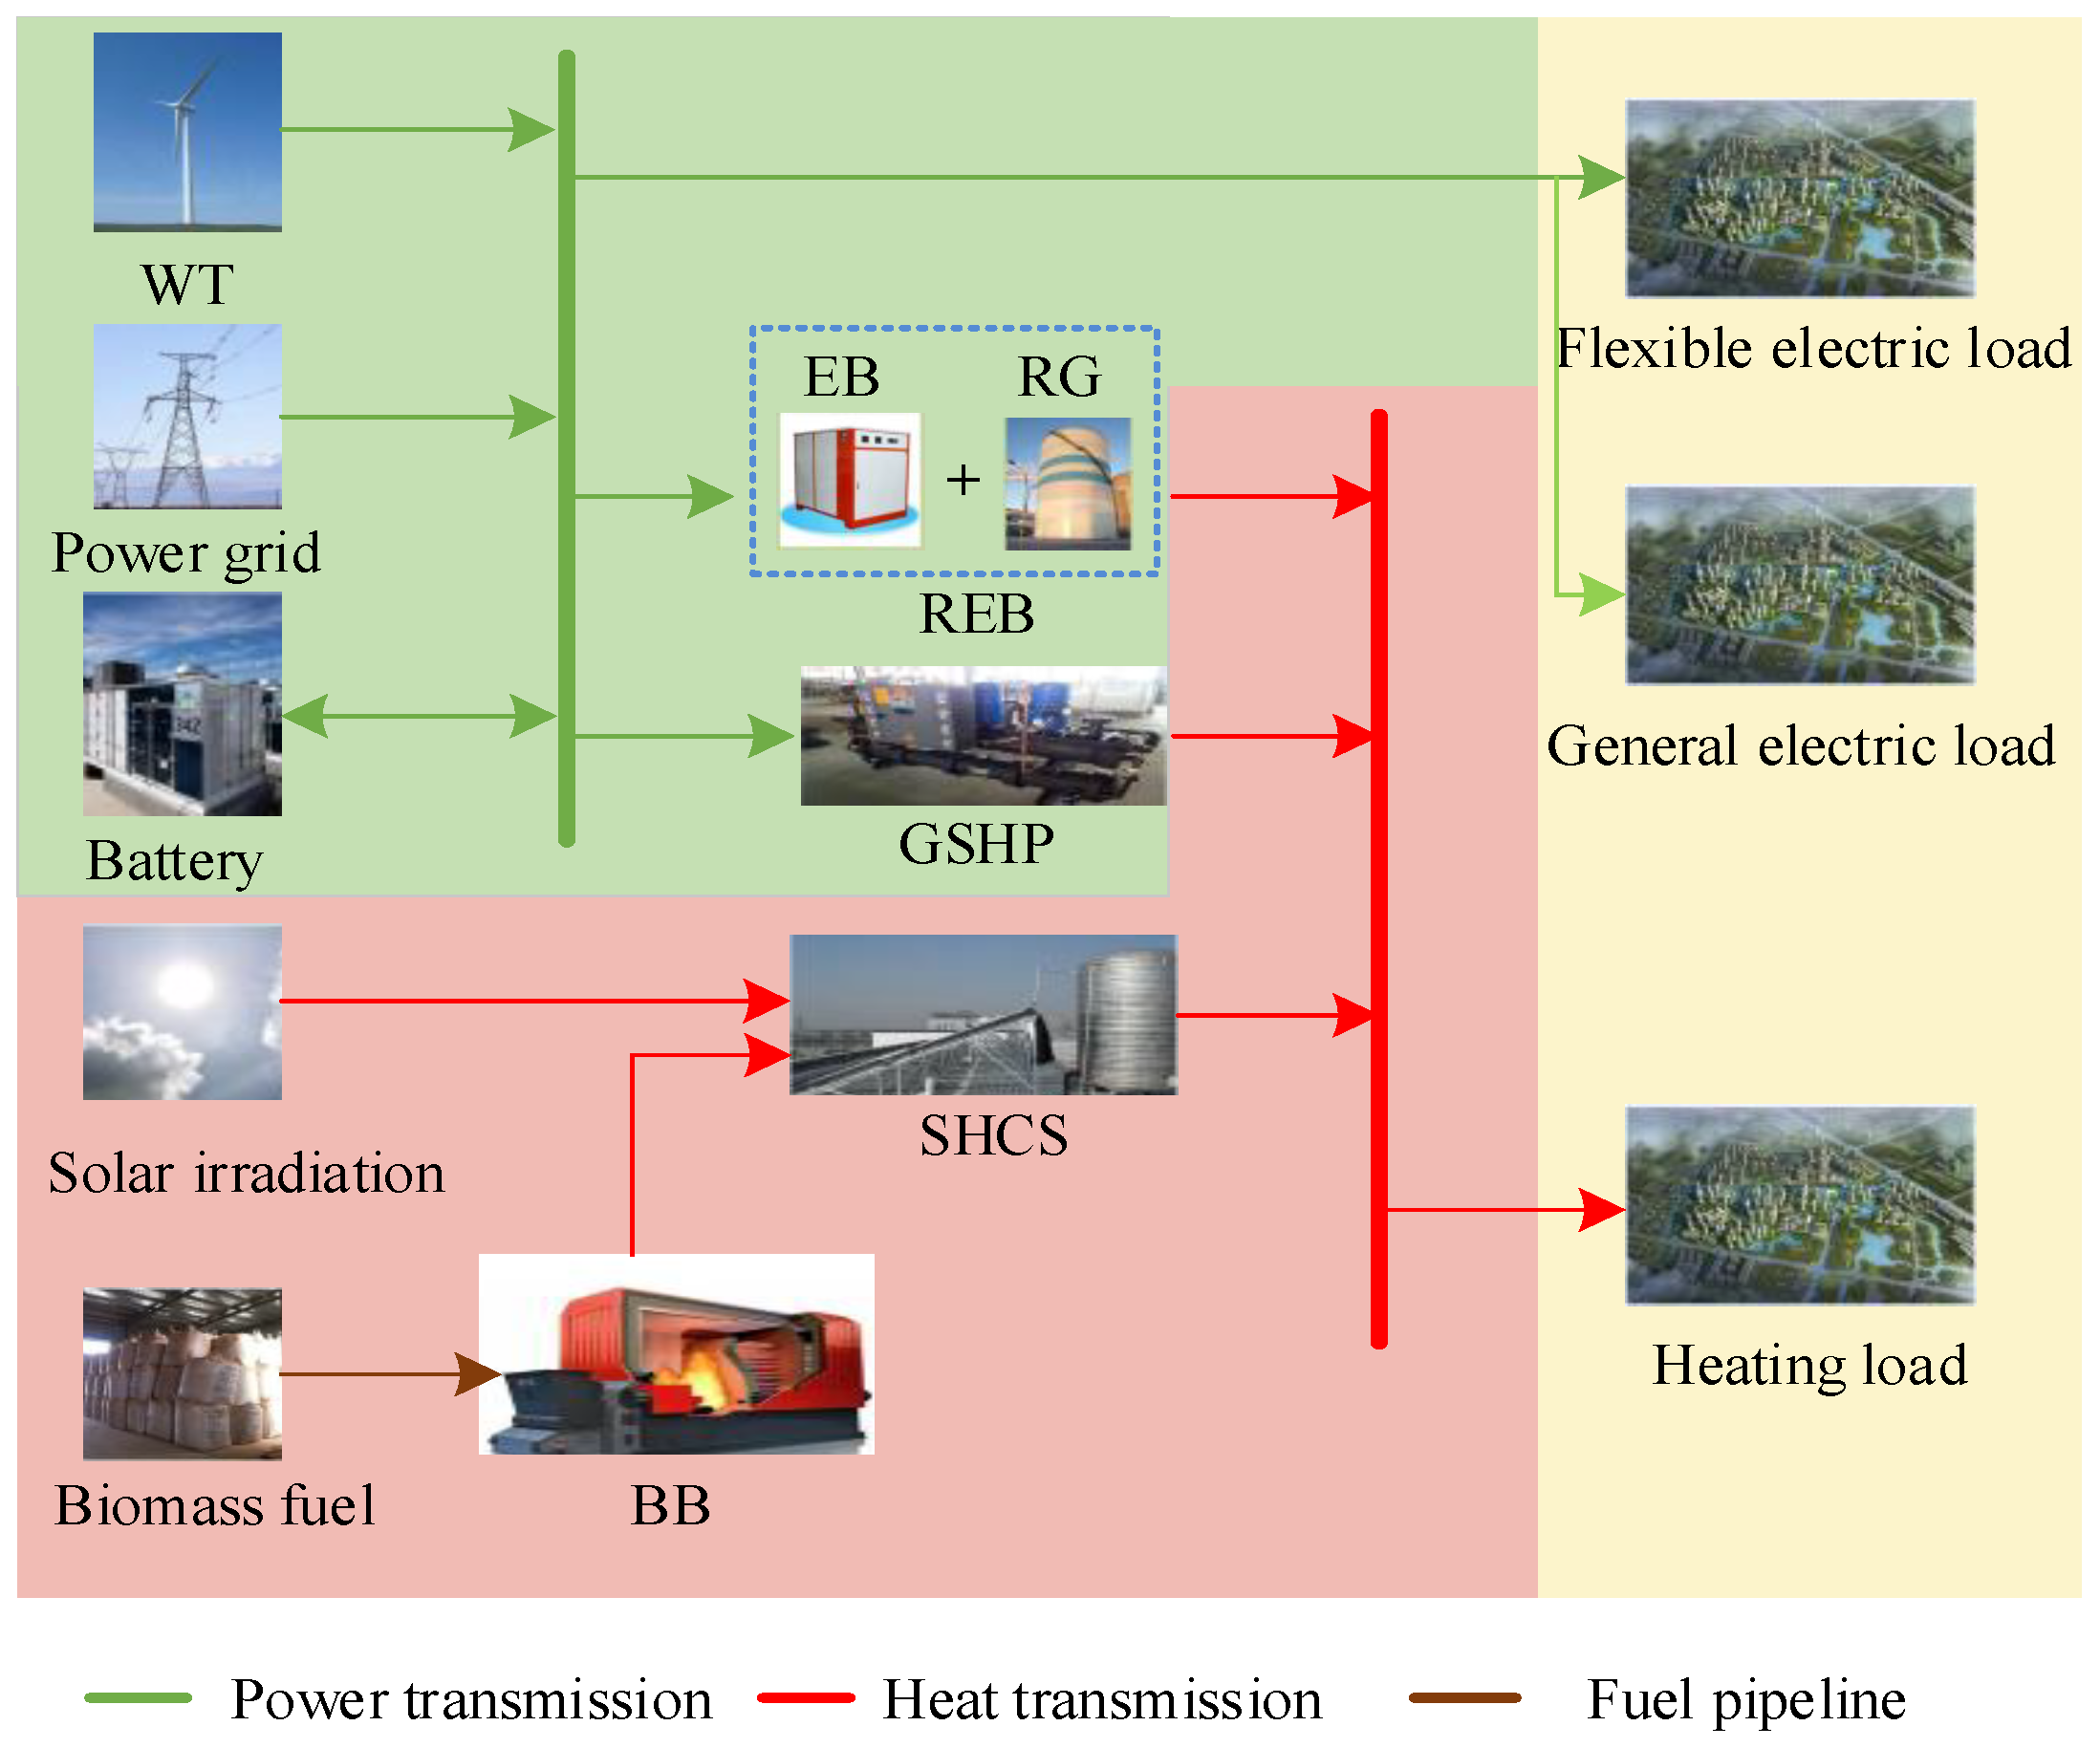
In order to enrich the system structure and energy equipment types of the IES and make the IES more extensive, on the basis of existing research, the structure of the electric–thermal IES is proposed, as shown Figure 1, which includes WT, batteries, REB, GSHP, SHCS, and biomass boilers (BBs). The REB consists of an electric boiler (EB) and a regenerator (RG). Among them, the wind turbine uses clean energy wind energy to generate electricity. Batteries as an electric storage device, combined with a time-sharing electricity price, meet the flexibility of users. When the WT and batteries cannot meet the electric load, the user buys electricity through the power grid. The SCHS generates heat power by absorbing solar energy for use by users. The BB is as the auxiliary heat source of SHCS, which uses biomass fuel for heating. The REB can transform electric energy into thermal energy and store heat. The GSHP uses geothermal energy to supply heat under the drive of electric energy. The user load in this paper includes electric load and heating load, in which the electric load is divided into general electric load and flexible electric load.
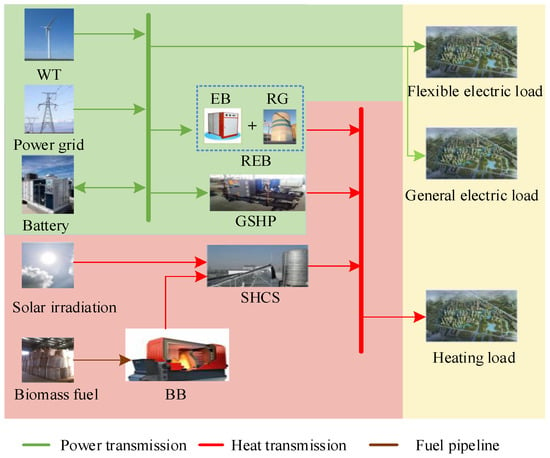
Figure 1.
Electrical–thermal IES structure.
For the IES structure of Figure 1, a day-ahead scheduling optimization model is proposed. Considering the demand-side response of the two kinds of flexible load, which can reduce the load and shift the load, in coordination with the electricity storage and heat storage unit, the optimization model is solved by Pyomo-GLPK.
2.1. REB Model
The REB makes use of the electricity price during the low period of the night, which provides users heat demand and at the same time converts electric energy into heat energy and stores it in the RE of the boiler. When heat is needed, the heat transfer of the RE is realized through a high-efficiency heat exchanger (HE), so as to meet the heat needs of users and play the role of cutting the peak and filling the valley. The REB is an ideal substitute for coal to electricity, and the operating cost is only 1/3 that of the traditional electric direct heating boiler. The REB has the advantages of no pollution, zero emission, and a low operating cost, which can effectively solve the problems of the high pollution of traditional coal-fired boilers and high operating costs of traditional electric direct heating boilers. REB uses a low electricity price for heating.
Based on the electrothermal conversion efficiency of REB equipment, the electric energy is converted into heating energy. The energy conversion model of REB is as follows:
in which QREB,t is the heat generation power of the REB in the t time period (kW). ηREB is the conversion efficiency of the REB. PREB,t is electric power in the t time period (kW).
The characteristics of the heat storage part of the REB can be described as the relationship among equipment capacity, input and output capacity, heat transfer efficiency, and heat loss. Moreover, the heat transfer model can be expressed as follows. The REB heat storage capacity at the current time is the heat storage capacity at the previous time plus the input heat minus the output heat in Δt steps.
in which ηloss1 is the heat loss coefficient of the heat storage part. and are the heat storage and release of the regenerator of the REB in the t time period, respectively. SREB,t and SREB,t+1 are the heat storage capacity in the t time period and t + 1 time period, respectively. ηr,in and ηr,out are the heat storage efficiency and exothermic efficiency, respectively.
2.2. SHCS Model
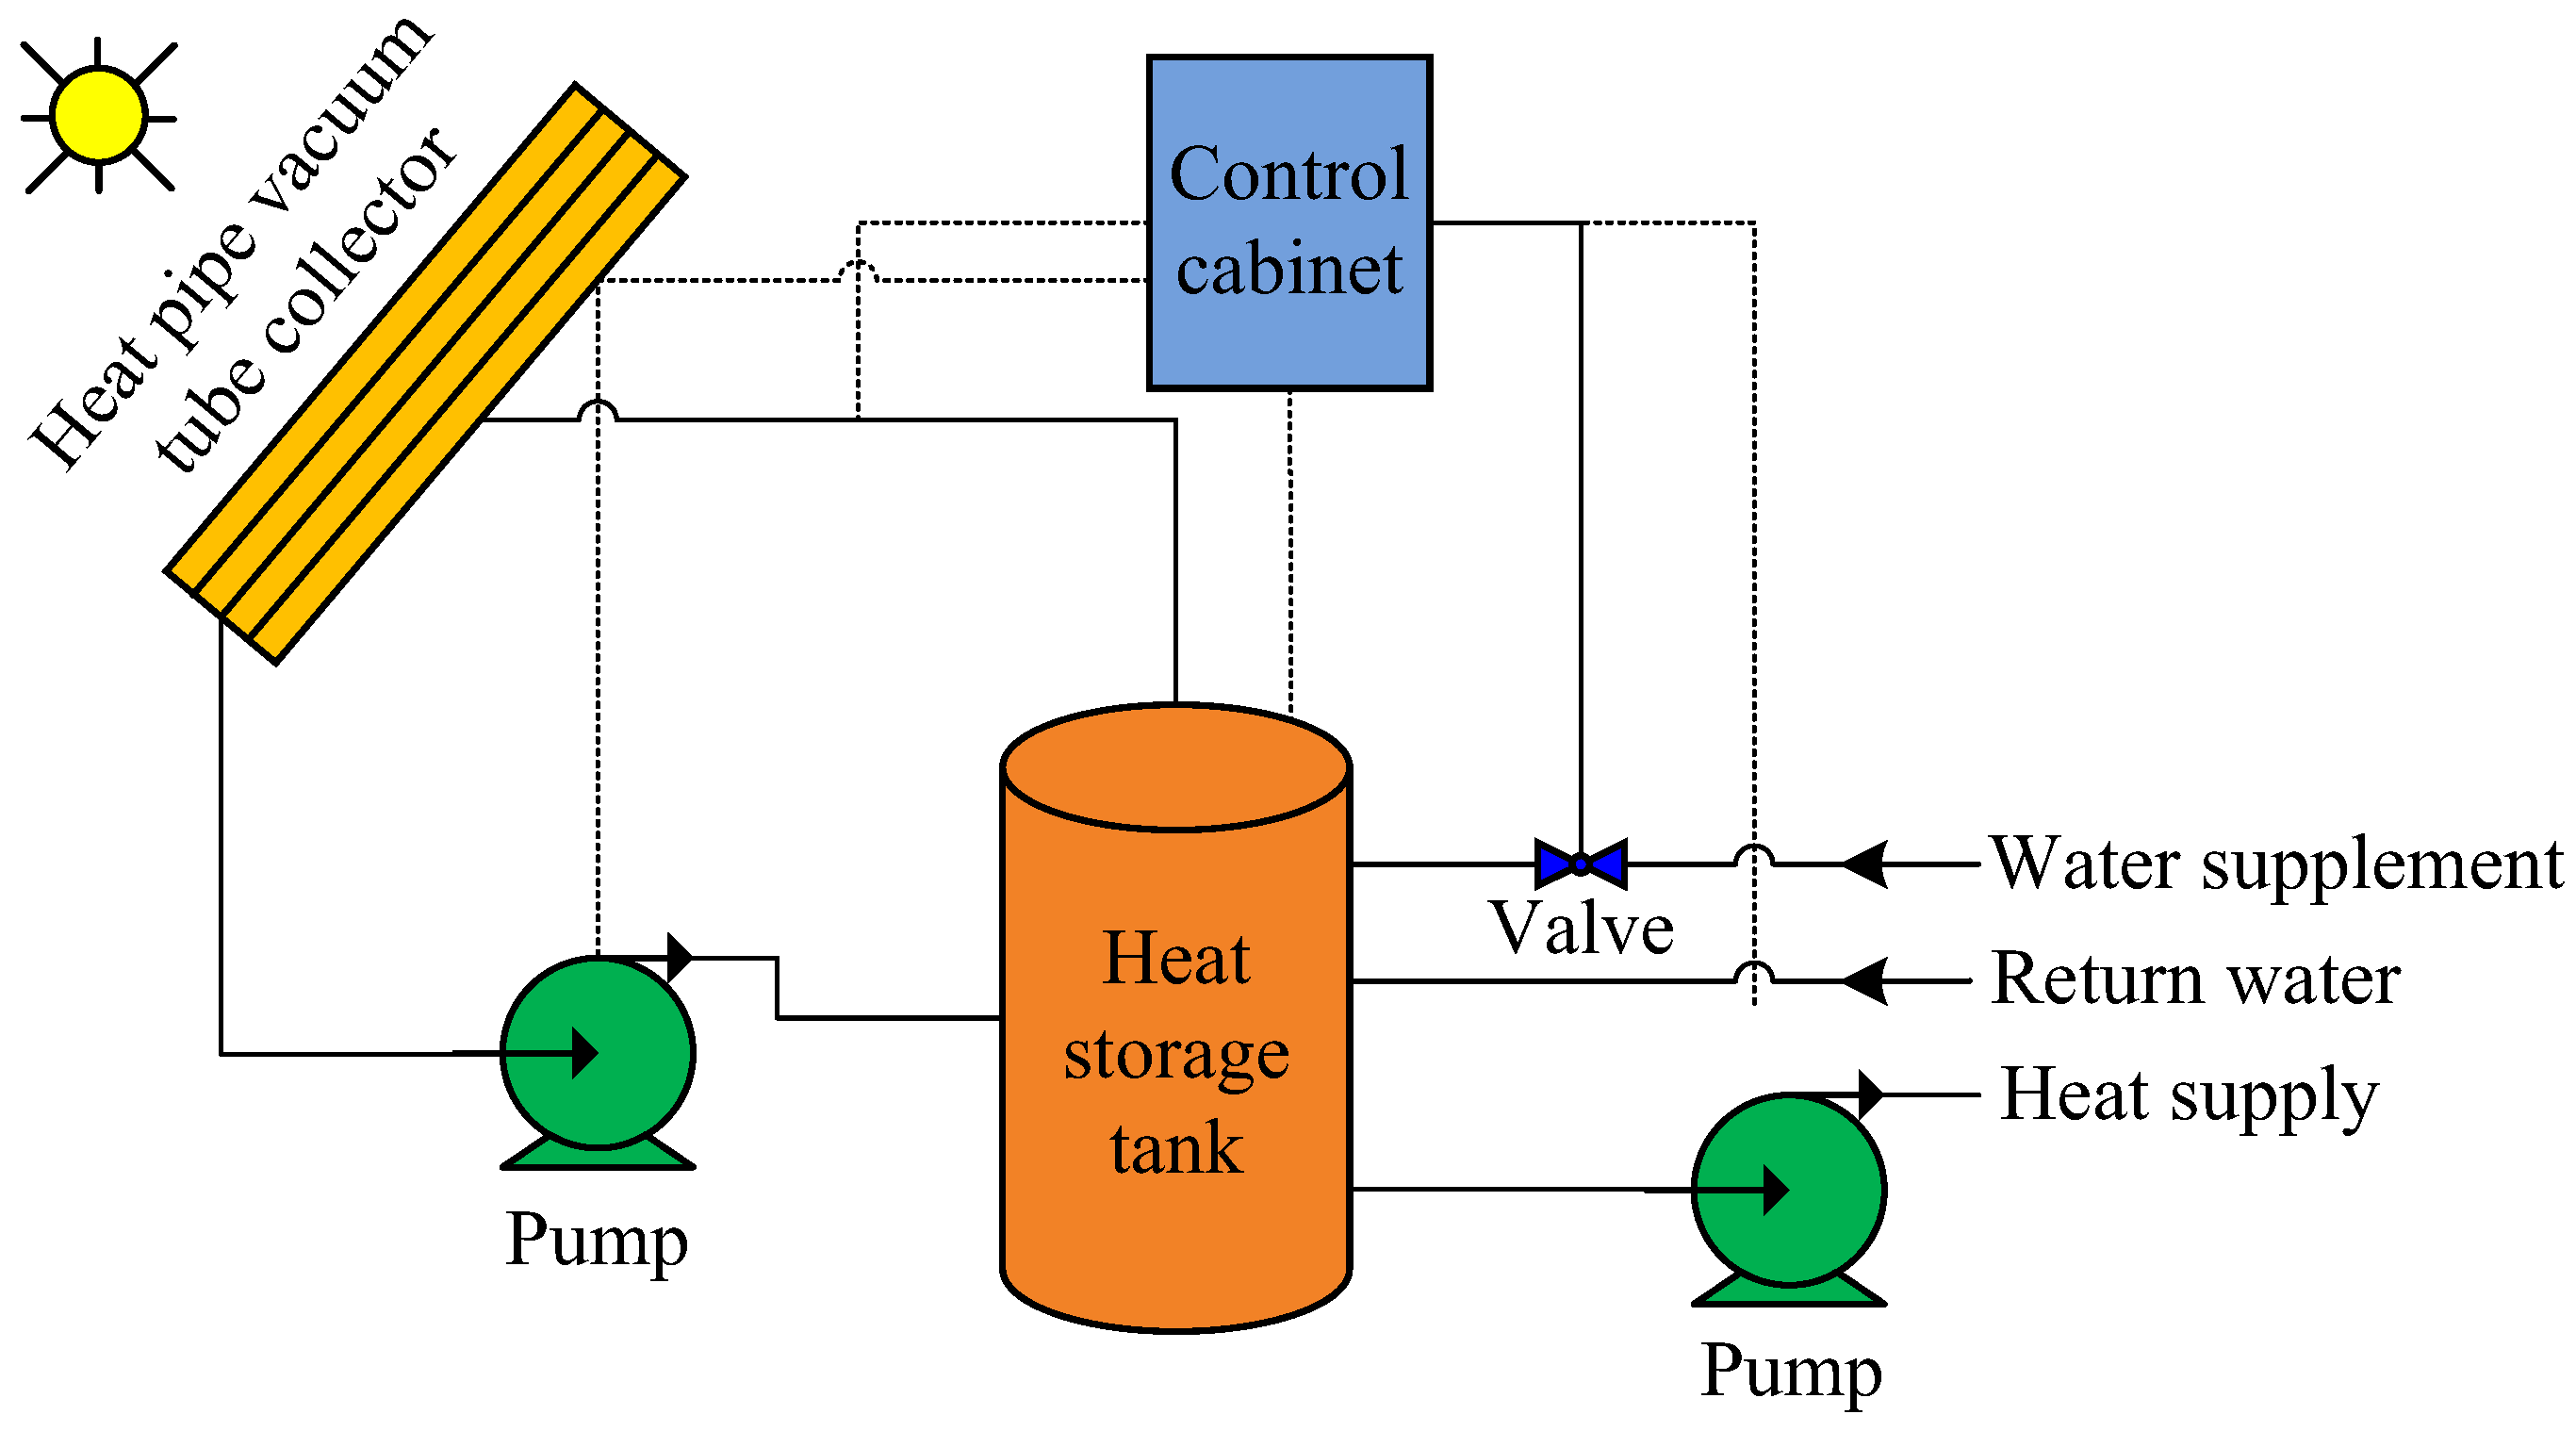
As shown in Figure 2, the SHCS uses a heat pipe vacuum tube collector, which absorbs solar energy on a sunny day, heats the water entering the lower part of the heat storage tank into the upper part of the heat storage tank, and stores the heat in the heat storage medium. The heating hot water enters the heating coil under the action of the circulating water pump, and the return water of the heating system enters the bottom of the heat storage tank, which repeatedly transfers the heat to the room. At night or on cloudy and rainy days, the heat collector circulation pump stops working, and the heat storage tank supplies heat directly to the room. The auxiliary heat source replenishes the heat to the heat storage tank where appropriate to meet the needs of users.
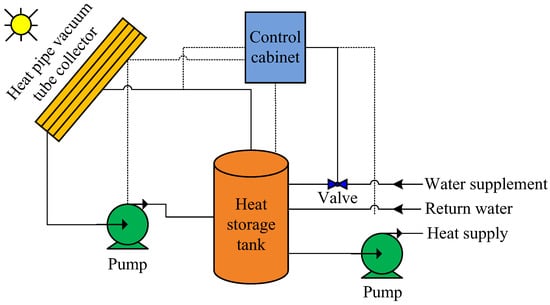
Figure 2.
Solar collector system structure.
The heating collection model of SHCS is related to the total area of the collector, the average solar radiation, the average heat collection efficiency, the heat loss rate of pipelines and heat storage devices, and the solar energy guarantee rate, as follows.
in which As is the total area of the collector, taking 3000 m2. Jt is the average solar radiation in the t time period (kJ/(m2·d)). ηSHCS is the average heat collection efficiency of the collector, which is dimensionless, taking 50%. ηpipe is the heat loss rate of pipelines and heat storage devices, taking 15%. f is taken as the solar energy guarantee rate, which is dimensionless, taking 60%.
2.3. BB Model
Limited by the season, climate, location, and other factors, solar energy is an unstable source of energy, which cannot be used on rainy, snowy, or even cloudy days. Therefore, in order to ensure the stable heat supply of the solar energy system, the solar energy system must be used in conjunction with the heating equipment of other energy sources, which is called an auxiliary heat source. When the solar radiation is insufficient, the auxiliary heat source is used as the energy supplement of the solar heat collection system. Biomass boilers use biomass energy as fuel. Compared with traditional boilers, the biomass boiler efficiency is higher, the exhaust gas temperature is low, and biomass energy belongs to renewable energy. On the one hand, the energy crisis has been alleviated, and on the other hand, environmental pollution has been reduced. Therefore, the biomass boiler is selected as the auxiliary heat source of the solar energy-collecting system in this paper.
The heating generation model of the BB is based on the weight of input fuel, the calorific value of fuel, and the thermal efficiency of the BB, as follows.
in which QBB,t is the thermal power of BB in the t time period (kW). ηBB is the thermal efficiency of BB, taking 0.8. βBB is the calorific value of biomass solidified fuel (kW/kg), taking 5.4. WBB,t is the fuel weight of BB in the t time period, and the fuel price is 0.108 $/kg.
2.4. GSHP Model
The GSHP is used to extract the ground source heating for users to use. The heating model of the GSHP is based on the thermal efficiency ratio of GSHP and electric power of the GSHP, as follows:
in which QGSHP,t is the thermal power of the ground source heat pump in the t time period. copGSHP is the thermal efficiency ratio of GSHP. PGSHP,t is electric power in the t time period.
2.5. Battery Model
As an electric energy-storage unit, the battery is an important part of the IES, which can effectively stabilize the fluctuation of new energy output, realize the time decoupling of energy production and consumption, and effectively solve the contradiction of the energy supply and demand mismatch. The output model of the battery is related to the current state of the battery, and it is the charging state when the battery output is negative and the discharge state when the battery output is positive, as follows:
in which PBattery,t is the output power of battery in the t time period. and are the input and output power of the battery in the t time period, respectively.
2.6. Flexible Load
The utilization of flexible load is one of the important means of demand-side management. Demand-side management compensates users by signing policy agreements with demand-side users to urge users to adjust energy consumption plans according to electricity prices. In this way, part of the rigid load is converted into flexible load, which enhances the coordination of the whole system, reduces the peak–valley difference in user power consumption, and ensures the safety and economy of the system operation. In this paper, two kinds of flexible loads are cited, which are reducible load and translatable load.
2.6.1. Reduced Load Model
Reduced load is that the user’s electrical load is reduced in accordance with the agreement signed with the user without affecting the normal demand.
The electric power in the t time period after load reduction is the electric load before optimization minus the electric load, which can be reduced according to the proportion within the scope of the agreement, as follows:
in which Pper,t is the electric power in the t time period before user optimization. nt is the 0 or 1 state variable to judge whether the load is reduced or not. αt is the reduction ratio within the scope of the agreement.
The compensation cost Ccut after scheduling is the product of the sum power of the reduced load in a cycle and the compensation price of the unit power load in the agreement, as follows:
in which is the compensation price of unit power load in the agreement.
2.6.2. Translatable Load Model
The translatable load is that the power consumption time is continuous and the time length is fixed, and the load translation needs to be carried out as a whole. The acceptable translation time interval of translatable load is [t1–t2]. When the load shifts to the interval with τ as the starting time, in order to ensure the continuity of running time, it should meet Equation (9) [49].
in which ts is the duration of the translatable load and ts < (t2 − t1). mt is the 0 or 1 state variable to judge whether the load is translating or not.
After optimization, the translatable load power in the t time period is:
in which Pshift is the rated power of the translatable load. mt is the 0 or 1 state variable to judge whether the load is translating or not.
The compensation cost given to the user after scheduling is the product of the power sum of the translation load and the compensation price of the unit power load translation in the agreement.
in which is the compensation price of the unit power load translation in the agreement.
3. Day-Ahead Optimal Scheduling Model of Electric–Thermal IES Based on MILP
3.1. Objective Function
Considering the demand-side response and energy storage of the electric–thermal IES, through the coordination between different equipment to meet the load needs of users at the same time to find the lowest total operating cost of the whole system, the total operating cost F includes the cost Cele of purchasing electricity from the power grid, the purchase cost Cb of biomass fuel, the penalty cost Cwind of abandoning wind, and the cost Cyw of equipment operation and maintenance, as follows:
in which F is the total operating cost of the system ($). Cele is the purchasing electricity cost. Cb is the purchase cost of biomass fuel. Cwind is the penalty cost of abandoning wind. Cyw is the operation and maintenance cost of energy equipment. Cbc is the flexible load compensation cost.
The cost Cele of purchasing electricity is the product of the time-sharing electricity price and the electricity purchased from the power grid, as follows:
in which λele is the time-sharing electricity price. PBuy,t is the electricity purchased from the power grid in the t time period. T is the total scheduling time period, which is 24 h.
The purchase cost Cb of biomass fuel is the product of the unit mass price of biomass fuel and the fuel weight of BB, as follows:
in which λBb is the unit mass price of biomass fuel.
The penalty cost Cwind of abandoning wind is the product of the abandonment penalty coefficient of the wind turbine and the difference between the predicted power and actual power, as follows:
in which λwind is the abandonment penalty coefficient of the wind turbine. is the predicted power generation of the wind turbine in the t time period. Pwind,t is the actual power consumption of the wind turbine in the t time period.
The operation and maintenance cost Cyw of energy equipment is the product of the unit operation and maintenance cost of energy equipment and the output power of equipment, as follows:
in which λj,yw is the unit operation and maintenance cost of energy equipment j. N is the total number of energy equipment components. Pj,t is the output power of equipment j in the t time period.
The flexible load compensation cost Cbc is the sum of the compensation cost Ccut and the compensation cost Cshift given to the user after scheduling.
3.2. Constraint Condition
3.2.1. Electric Power Balance Constraint
The electric power input and output of the whole system should meet the balance of supply and demand, that is the output power is equal to the power consumption. The input electric power includes power purchase, wind turbine power, and the output power of batteries. The power consumption includes electric power of the REB, electric power of the GSHP, and electricity load demand, as follows:
in which is the electricity load demand after optimization for users in the t time period.
3.2.2. Thermal Balance Constraint
The thermal load of the whole system satisfies the law of the conservation of energy. The heating generation equipment includes REB, RG, SCHC, and GSHP. The heating generation is equal to the heating load required by users, as follows:
in which is the heating release of the SHCS in the t time period. QHp,t is the heating release of the GSHP in the t time period. Qper,t is the heating load required by users in the t time period. Ain,t and Aout,t are 0 or 1 variables representing the heat storage and heat release state of the REB, respectively.
3.2.3. REB Constraint
The REB is the equipment that consumes electricity to generate heat, which is the core equipment of system operation optimization, and is also the coupling device of electric power system and the thermal system.
- 1.
- The electric power constraint of the REB is that the electric power of the REB is less than the maximum electric power of the REB, as follows:in which the maximum electric power of the REB.
- 2.
- The REB can both release and store heat, and the charging and discharging power of the REB is restricted. The charging power is less than the maximum heat storage of the REB, and the discharging power is less than the maximum release heat power of the REB, as follows:in which and are the maximum heat storage and release heat power of the REB, respectively.
- 3.
- In order to prevent the heat storage and heat release depth of the REB from being too large, the heat storage is restricted. The heat storage is less than the maximum heat storage of the REB, and the heat storage is greater than the minimum heat storage of the REB, as follows:in which and are the maximum and minimum heat storage of the REB, respectively.
- 4.
- The operation constraint of the heat storage part of the REB is Equation (2).
- 5.
- In order to facilitate management, the heat storage of the initial state is equal to the end state, as follows:
- 6.
- Because the regenerator of the REB can only be stored by the electric boiler itself, the heat release of the electric boiler is greater than that of the regenerator, that is:
3.2.4. SHCS Constraint
The SHCS stores heat in the heat storage tank for the cooperation of the collector and the auxiliary heat source and releases heat from the heat storage tank when the user needs heat.
- 1.
- This constraint of heat release capacity of the SHCS is that the heating release is less than the maximum heat release of the SHCS, as follows:in which is the maximum heat release of the SHCS in the t time period.
- 2.
- SHCS heat storage tank operation constraints:in which SSHCS,t and SSHCS,t+1 are the heat storage capacity of the heat storage tank in the t time period and the next time interval. ηsr,in and ηsr,out are the heat storage efficiency and release heat efficiency, respectively.
- 3.
- SHCS heat storage tank heat storage capacity constraints are that heat storage capacity is less than the maximum heat storage of the heat storage tank and is greater than the minimum heat storage of the heat storage tank, as follows:in which SSHCS,max is the maximum heat storage of the heat storage tank. SSHCS,min is the minimum heat storage of the heat storage tank.
3.2.5. BB Constraint
- 1.
- The BB output constraint is that heat production of the BB is less than the maximum heat release of the BB, as follows:in which is the maximum heat release of the BB in the t time period.
- 2.
- The BB climbing constraint is that heating gain in time t is less than the maximum increment of the BB and is greater than the minimum increment of the BB, as follows:in which and are the maximum increment and minimum increment of the BB in the t time period, respectively.
3.2.6. Battery Constraint
- 1.
- Constraint on the upper and lower limits of battery charging and discharging power:
The storage power of the batteries is less than the maximum charging power of the batteries and is greater than the maximum discharging power of the batteries, as follows:
in which and are the maximum charging and discharging power of the battery, respectively. Ain1,t and Aout1,t are 0 or 1 variables representing the charge and discharge status of the battery, respectively.
- 2.
- Battery capacity constraints:
The storage capacity of batteries at the current moment is the storage capacity of the previous moment plus the difference between charging power and discharging power, as follows:
in which SBattery,t and SBattery,t+1 are the storage capacity in the t time period and the next interval, respectively. ηB,in and ηB,out are the storage and discharge efficiency, respectively. and are the maximum and minimum capacity of the batteries, respectively.
The storage capacity of batteries is less than the maximum capacity of the batteries and is greater than the minimum capacity of the batteries.
in which and are the maximum and minimum capacity of the batteries, respectively.
The storage capacity of the initial state is equal to the end state, as follows:
3.2.7. Reduced Load Constraints
Limit constraint for reduced load is less than the upper limit, as follows:
in which is the upper limit of the reduced load.
3.3. Model Solving Method
The MILP scheduling model of electric–thermal IES constructed in this paper is in the following standard form:
in which f(x) is the objective function. and are the equality constraints and inequality constraints of the model, respectively.
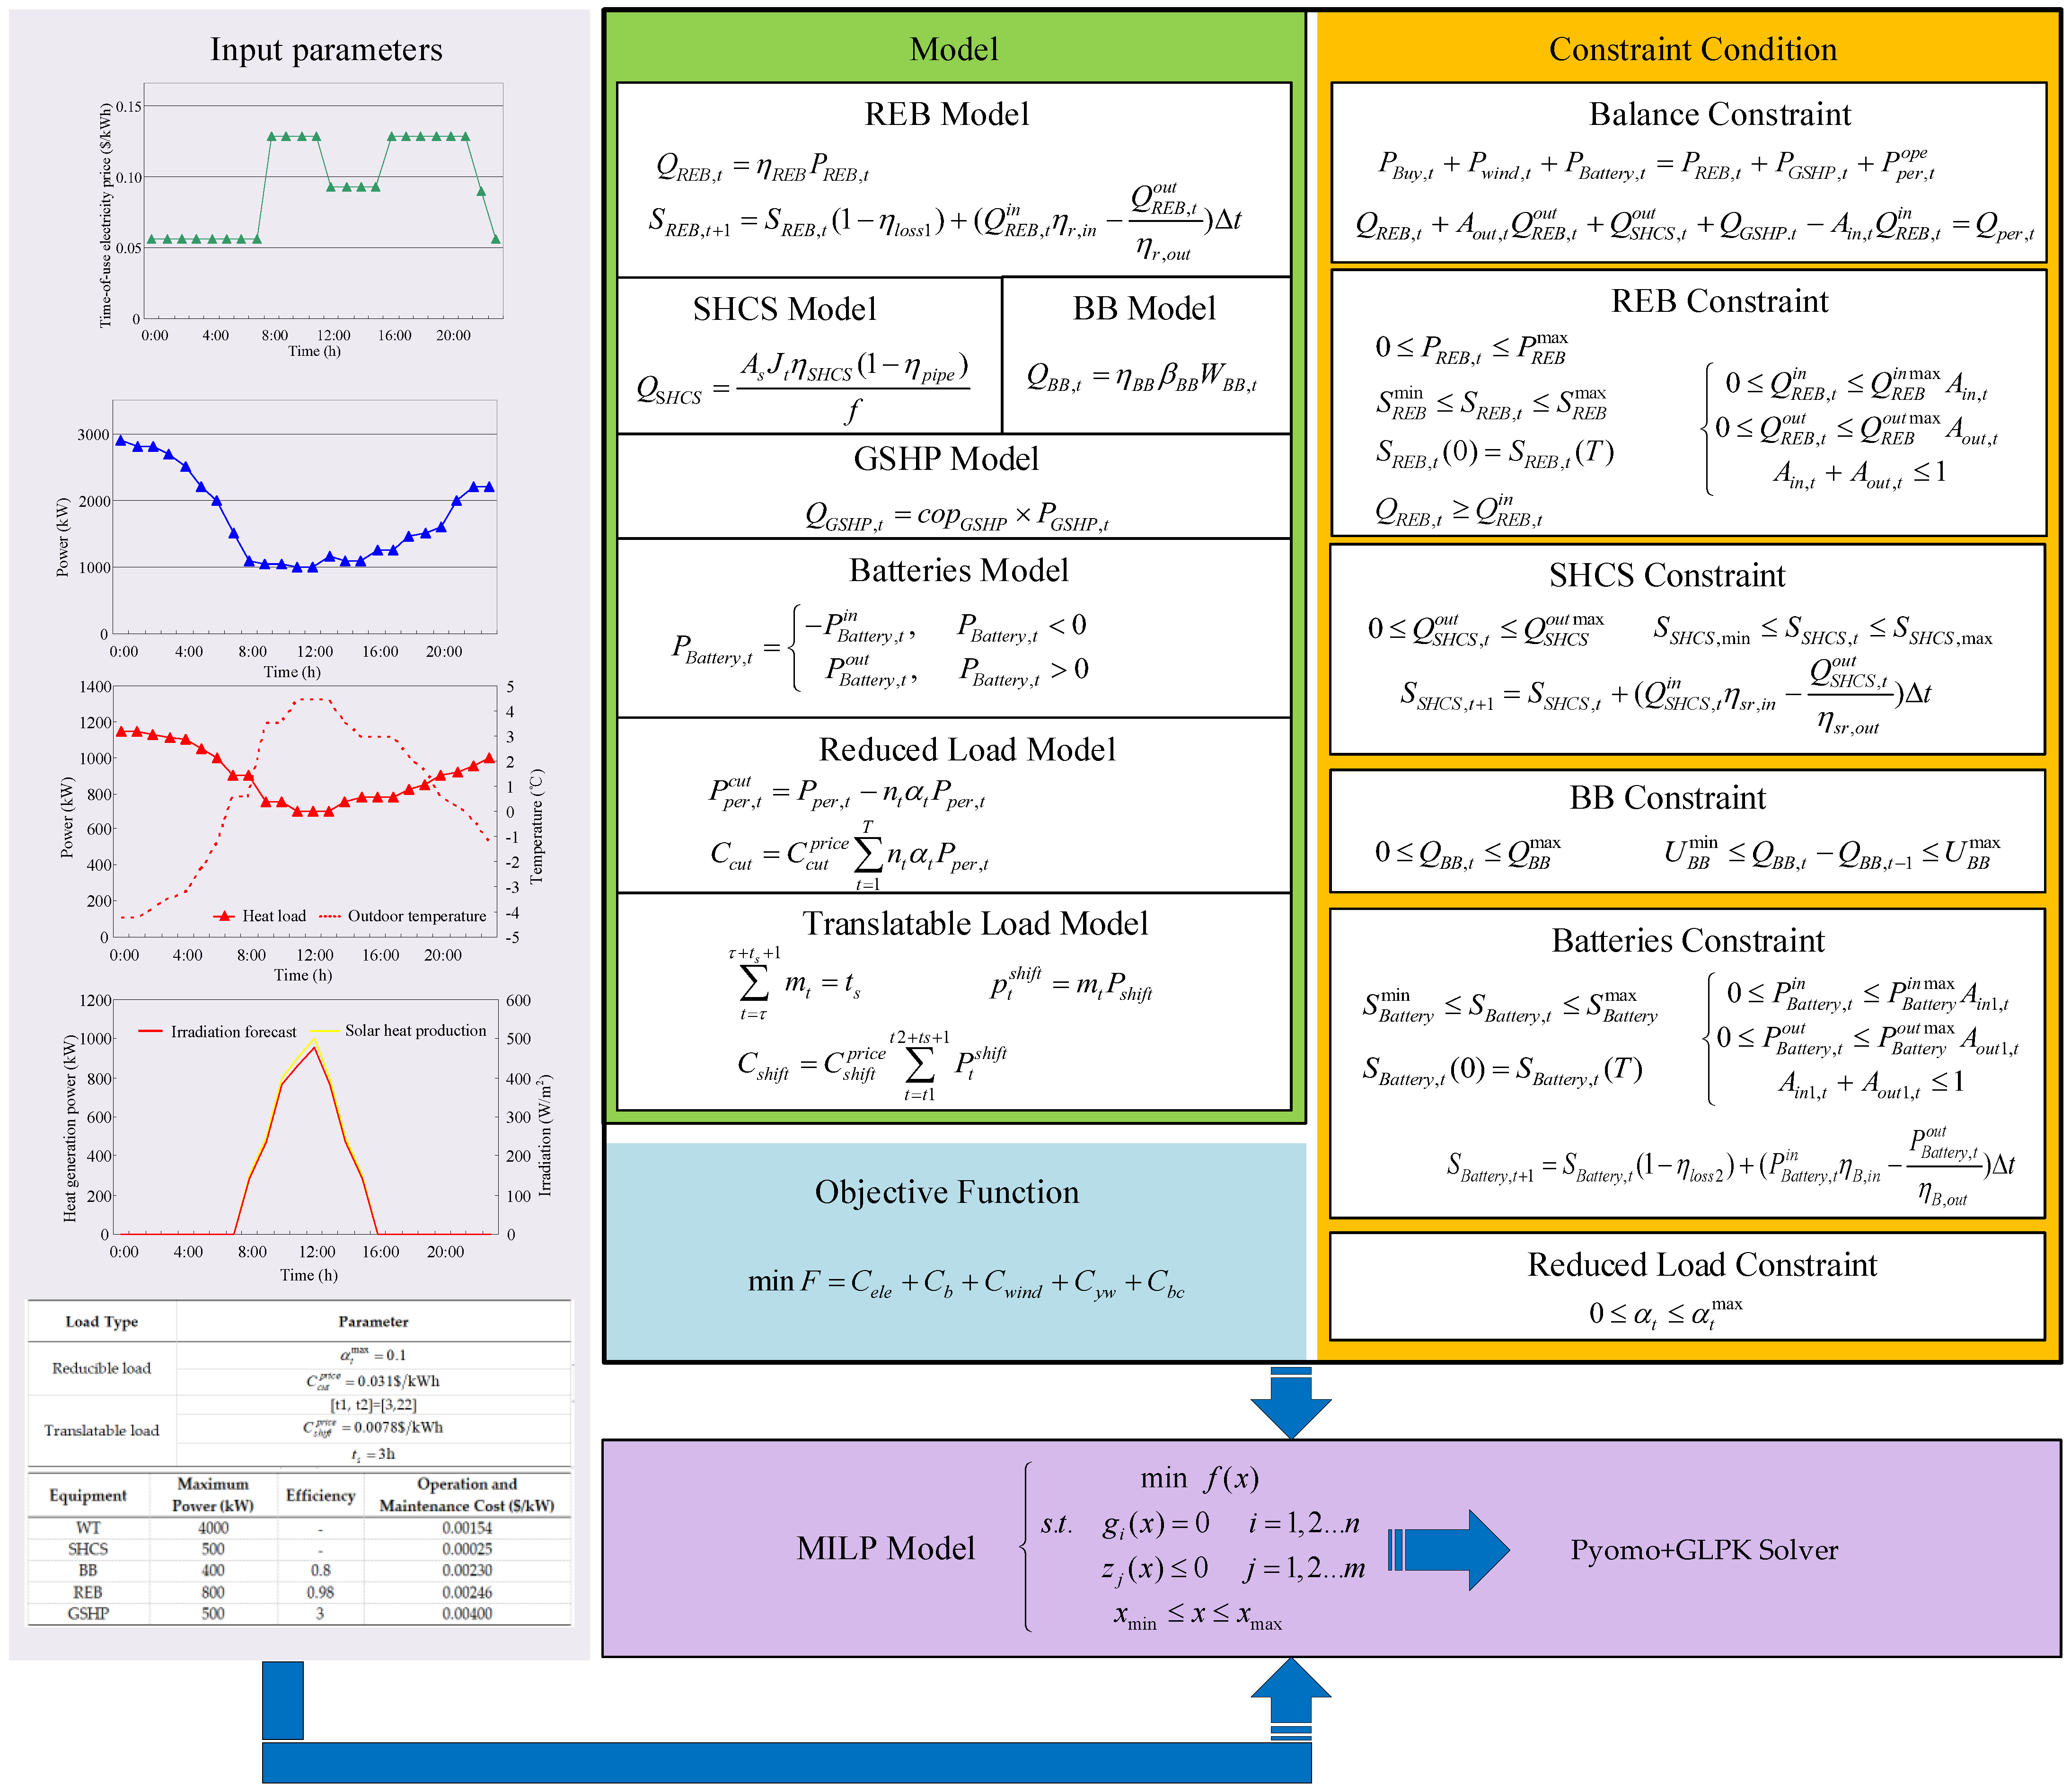
Pyomo + GLPK is used to solve the MILP model. Because there is a nonlinear coupling relationship between the binary variable (0 or 1) of the equipment running state and the equipment output power, the following linearization method is used to deal with [17]. Figure 3 is the structure block diagram of date-ahead scheduling strategy.
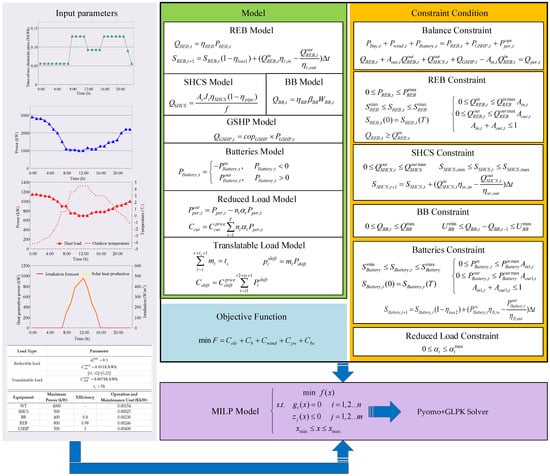
Figure 3.
The structure block diagram of the date-ahead scheduling strategy.
4. Example Analysis and Verification
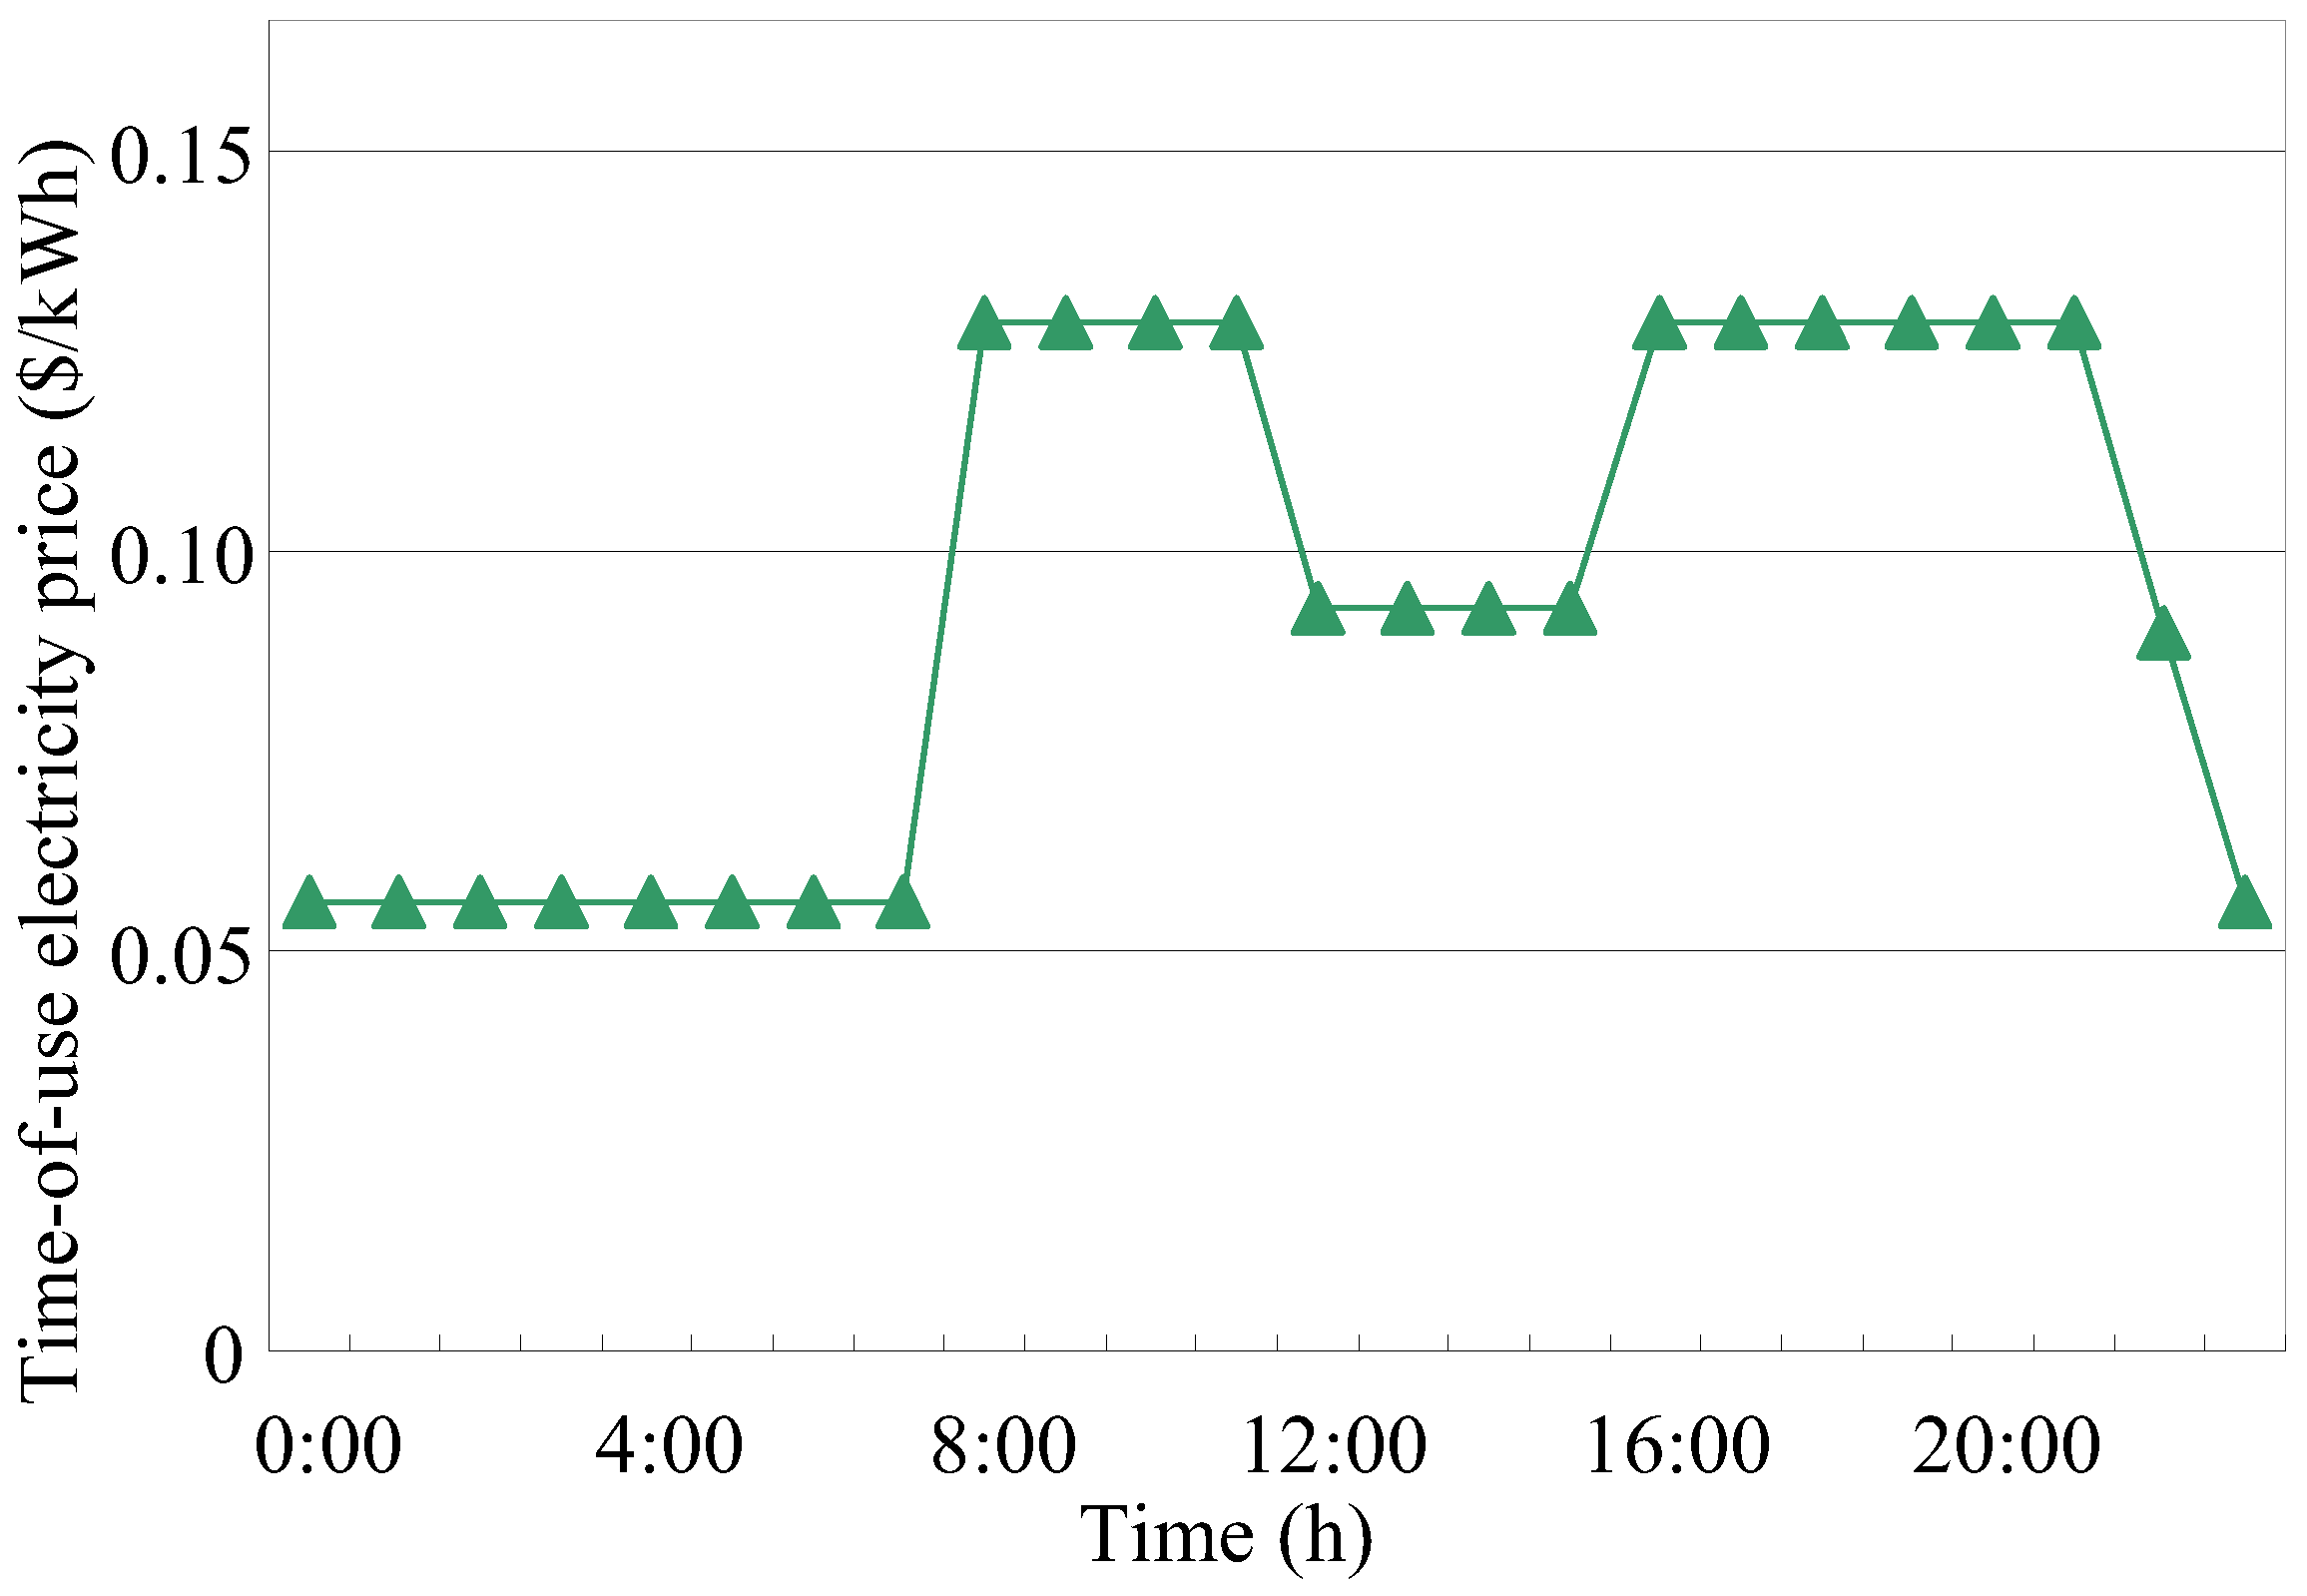
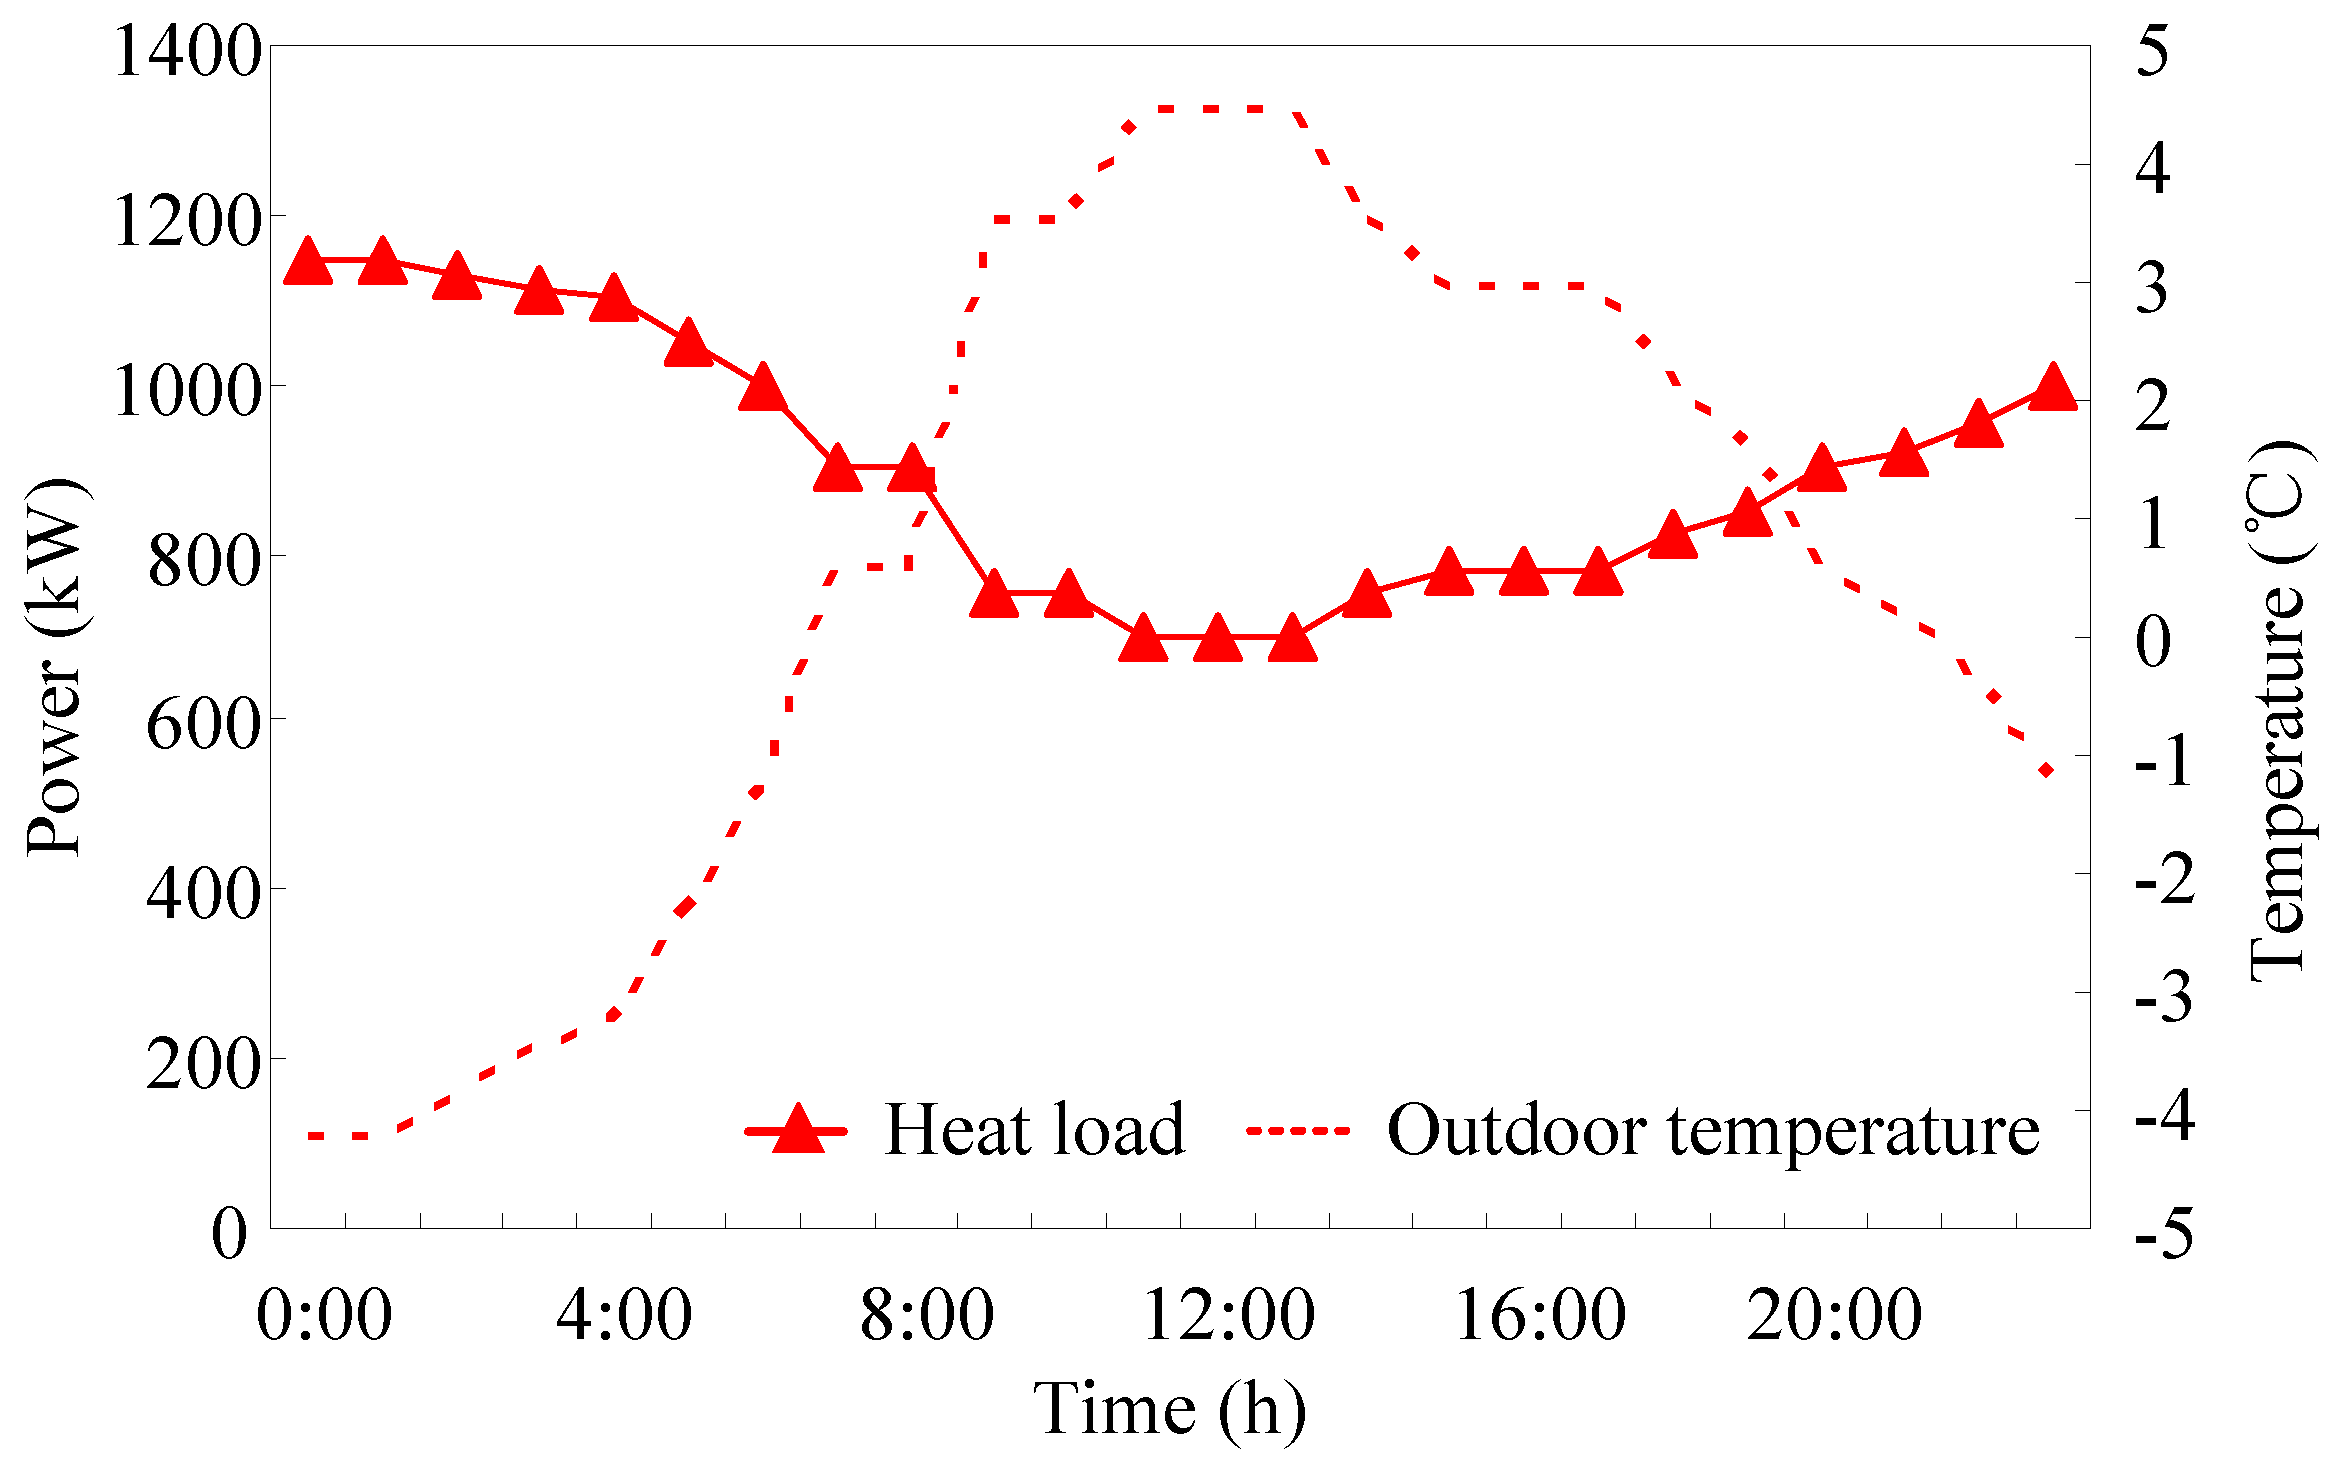
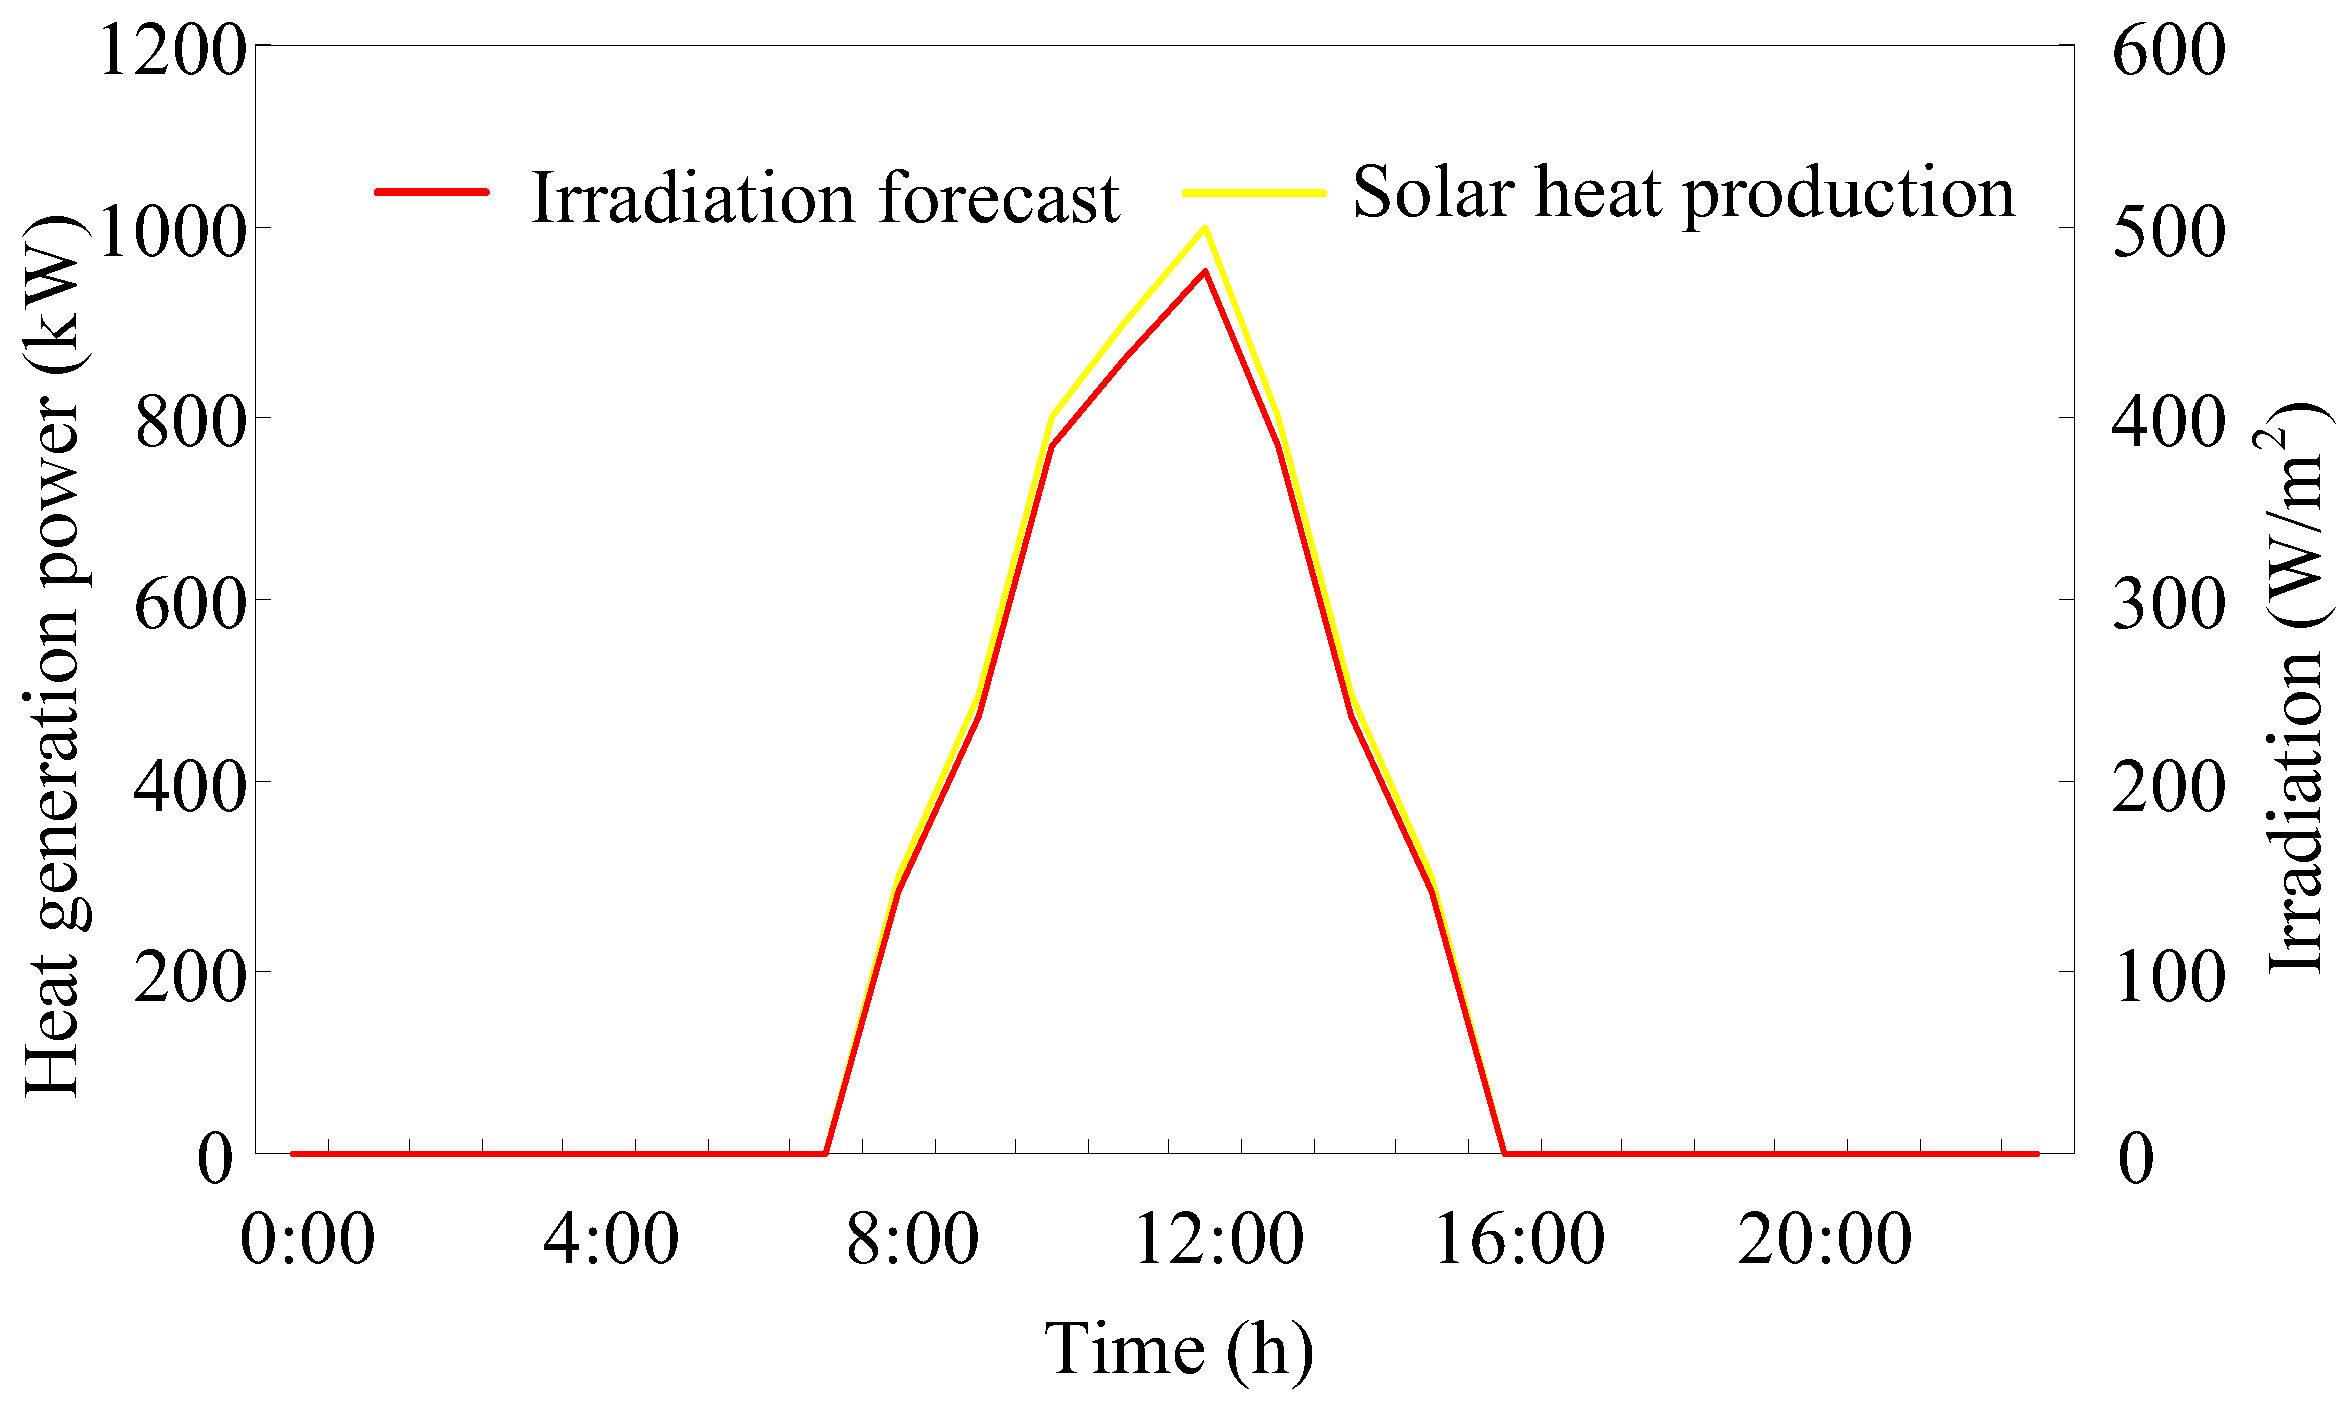
The example structure of this paper is shown in Figure 1, and the equipment includes the WT, SHCS, battery, REB, and GSHP. Taking 24 h as a scheduling cycle, the unit scheduling time is 1 h, and the new energy utilization and total cost of the model in different scenarios are compared. Among them, the wind turbine power forecast, time-sharing electricity price, heat load forecast and outdoor temperature, radiation forecast, and heat power of SHCS are detailed in Figure 4, Figure 5, Figure 6 and Figure 7. The relevant parameters of the power flexible load are shown in Table 1.
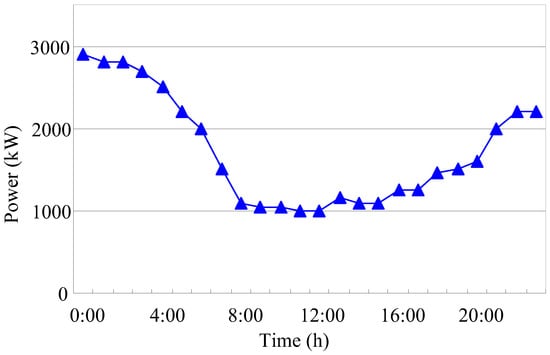
Figure 4.
Wind power generation predictive value.
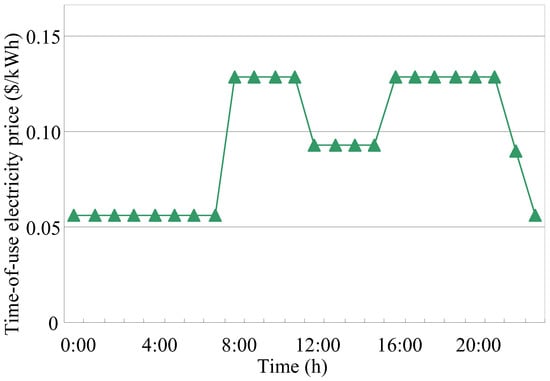
Figure 5.
Times electricity price.
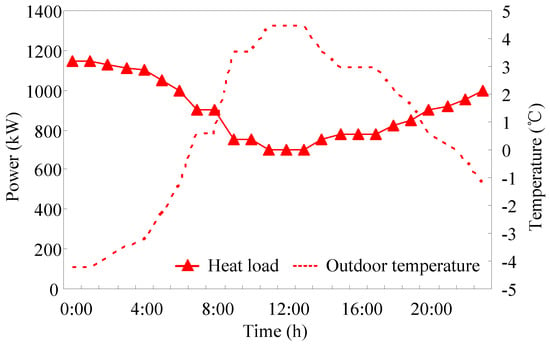
Figure 6.
Heat load prediction and outdoor temperature.
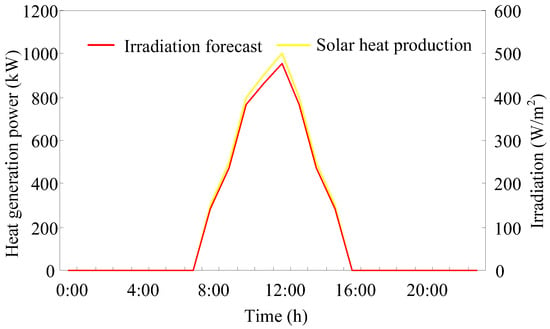
Figure 7.
Irradiation prediction value and heat transfer power of solar.

Table 1.
Demand-side response parameters.
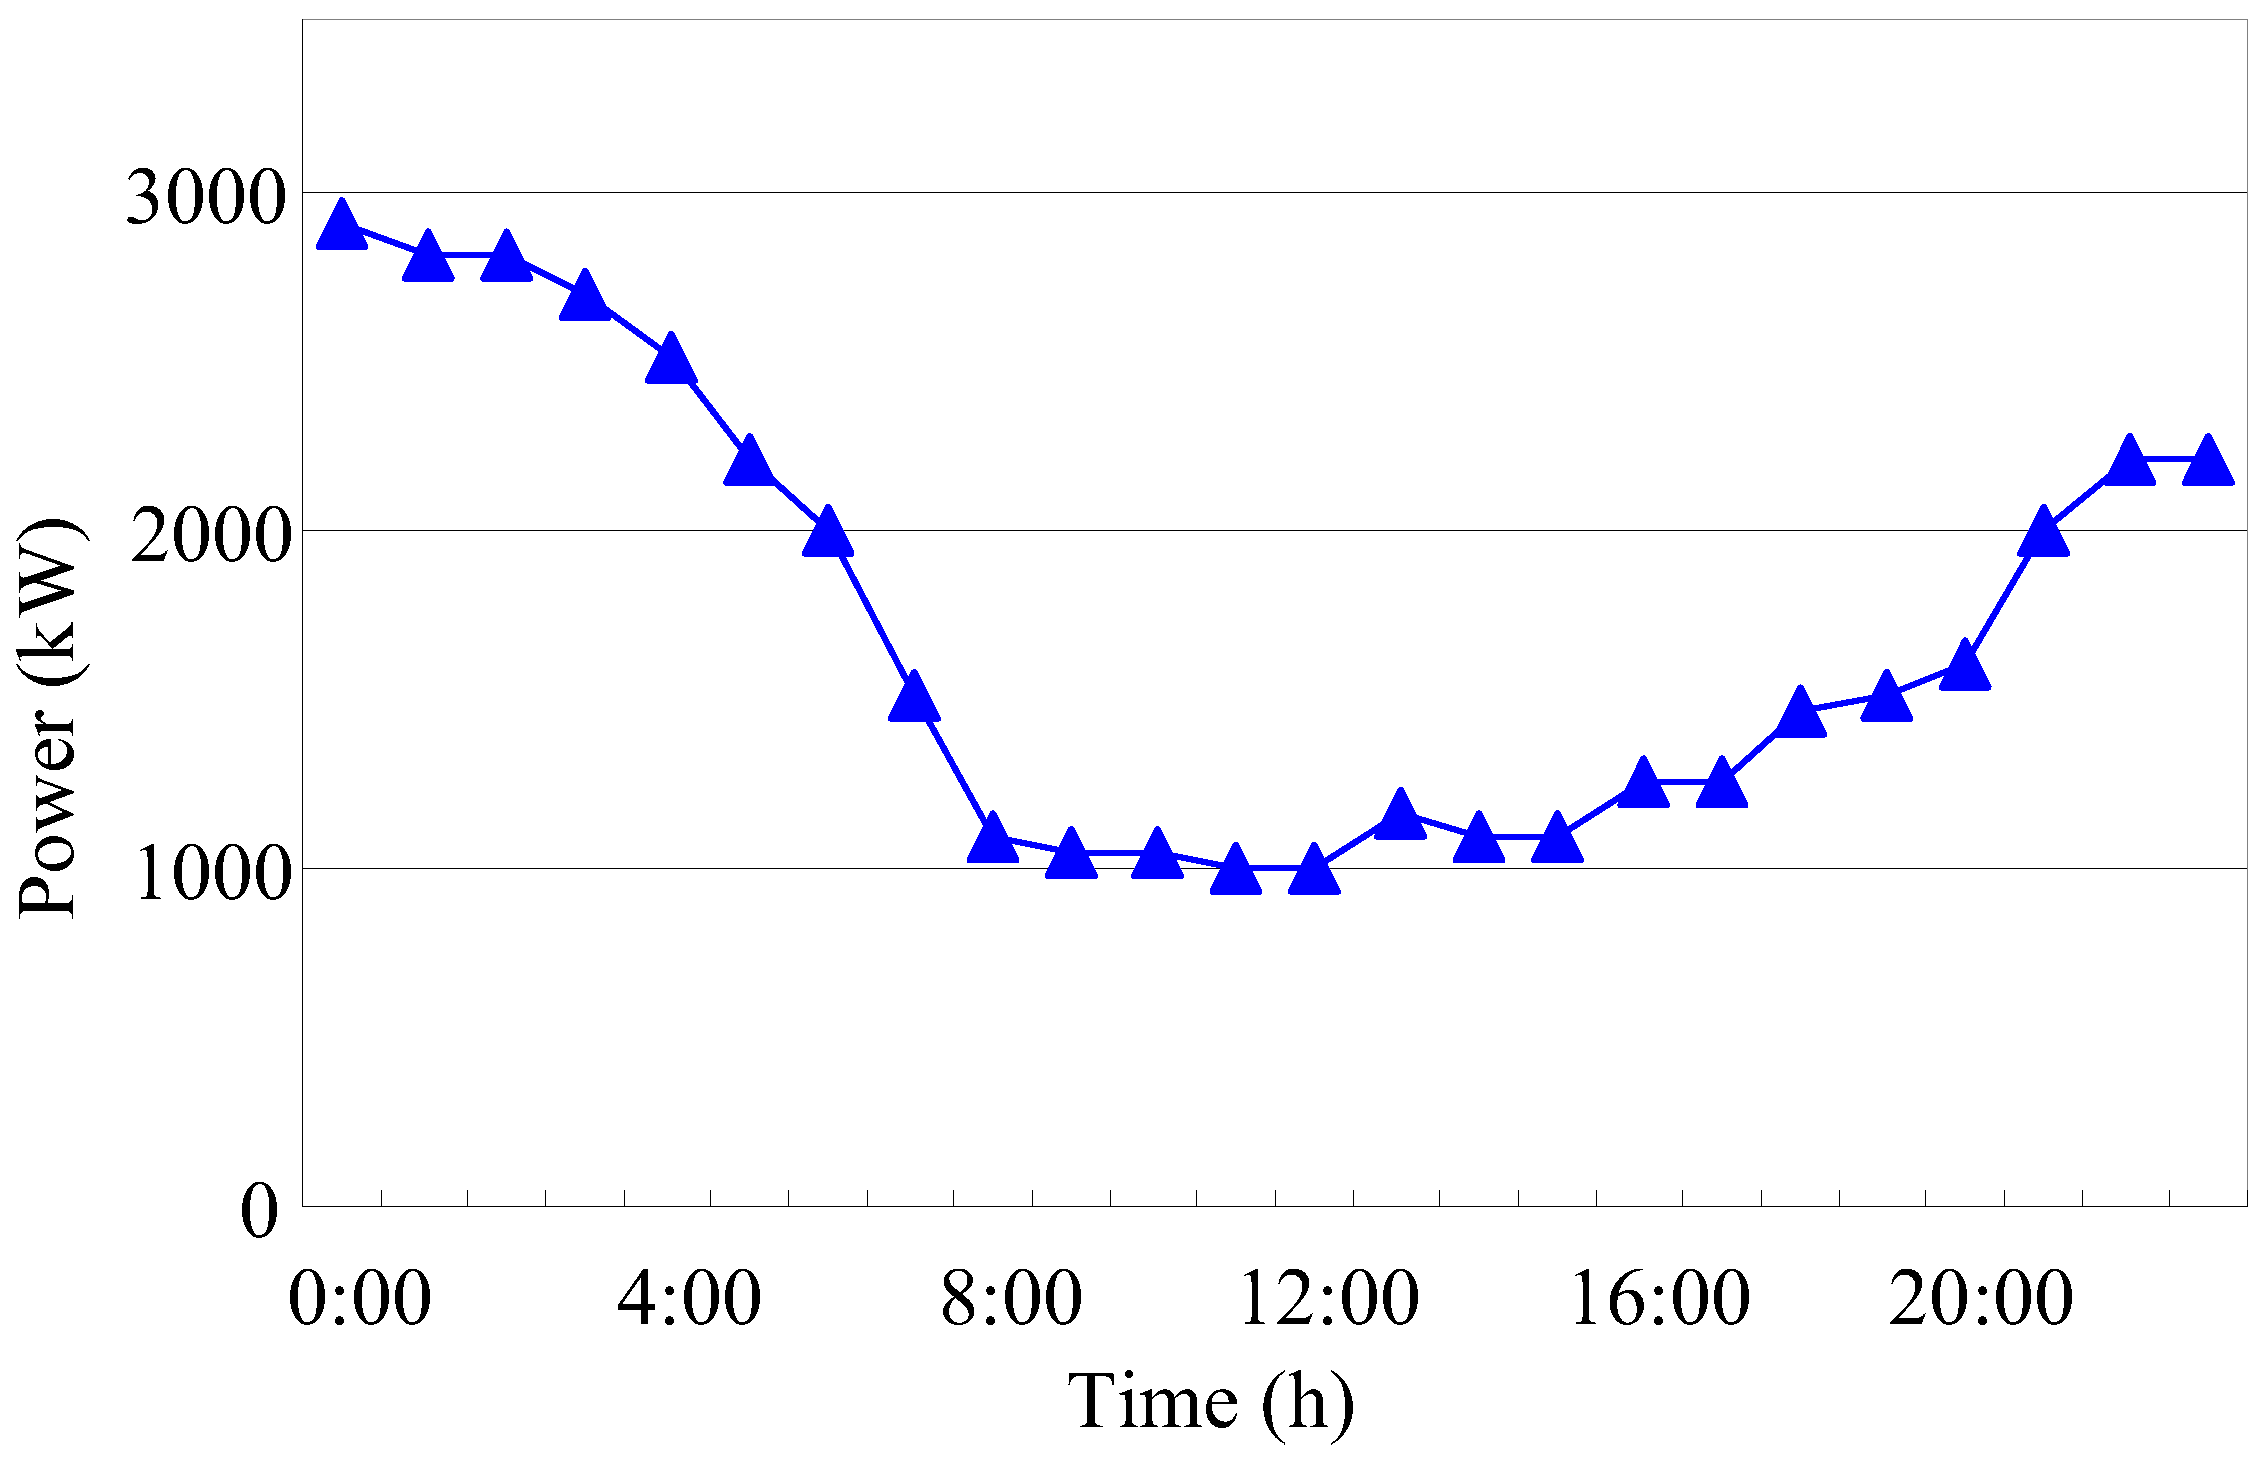
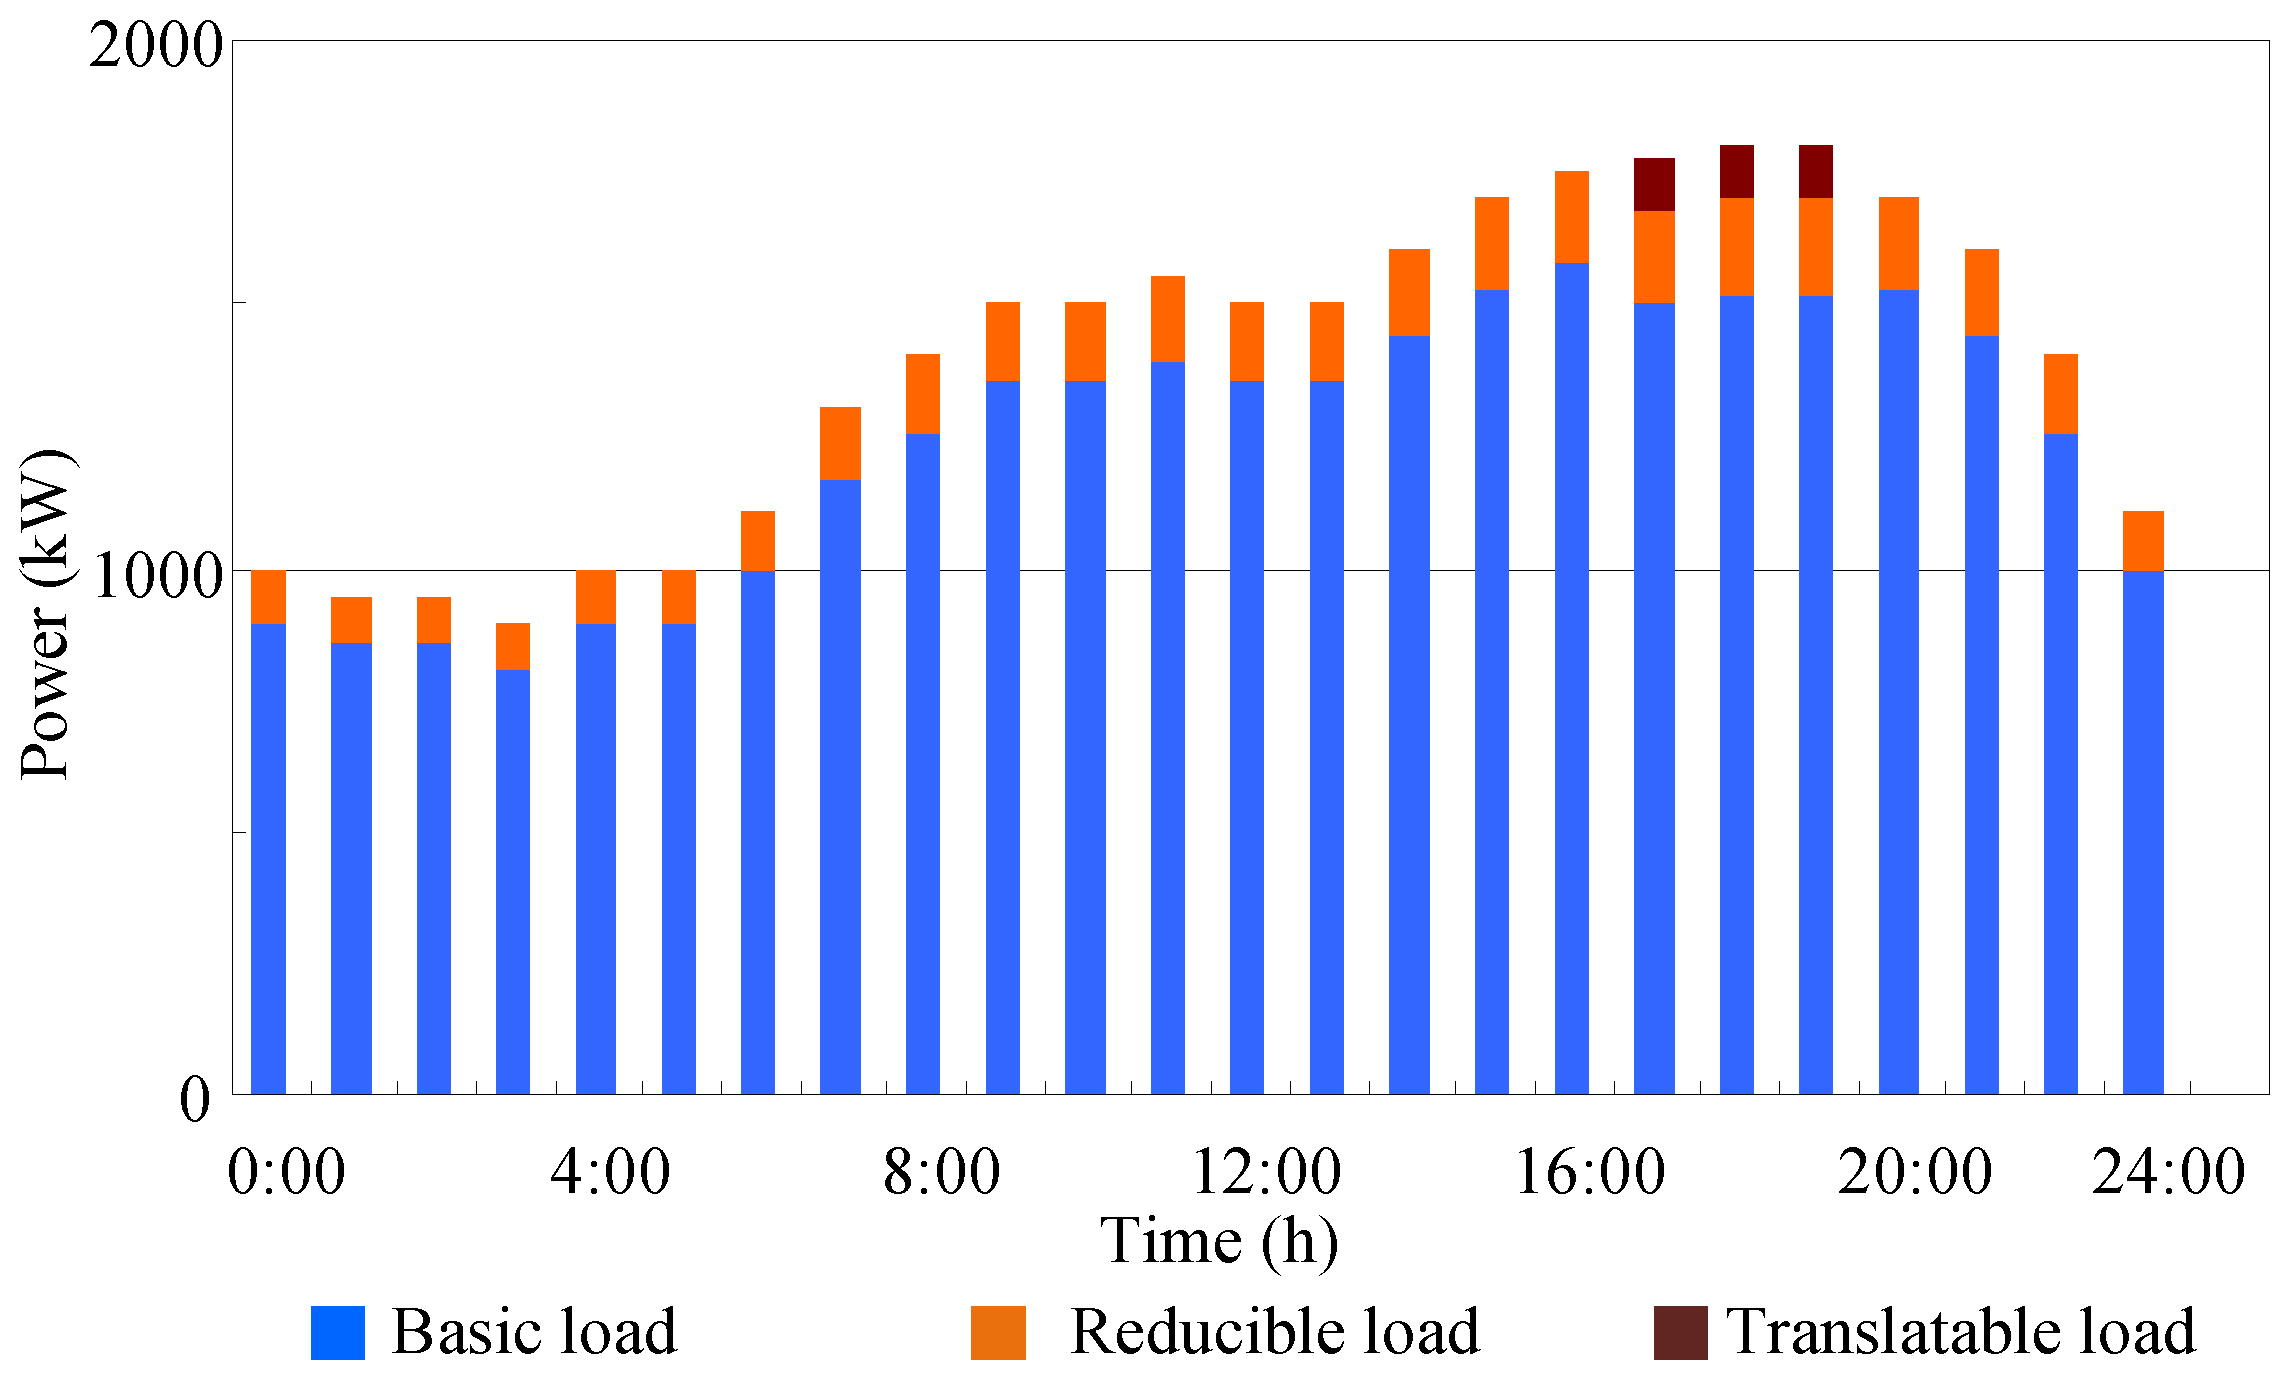
The composition of the electric load before optimization in each time period of the example is shown in Figure 8. Among them, the basic load is the non-optimized load, and the translatable load is the load for which the power supply time can be changed according to the plan, including a washing machine, disinfection cabinet, etc. The load that can be reduced is mainly the lighting, which can reduce the number of lights.
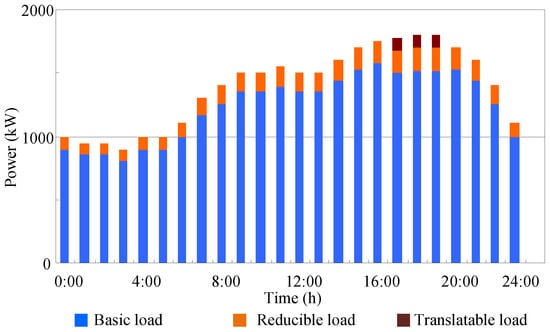
Figure 8.
Electric load before optimization.
4.1. Basic Data
The operation parameters of each output equipment in the electric–thermal IES are shown in Table 2, and the operation parameters of energy-storage equipment are shown in Table 3. The BB is the auxiliary heat source of SHCS and the BB climbing power is 200 kW.

Table 2.
Output equipment parameters.

Table 3.
Energy-storage equipment parameters.
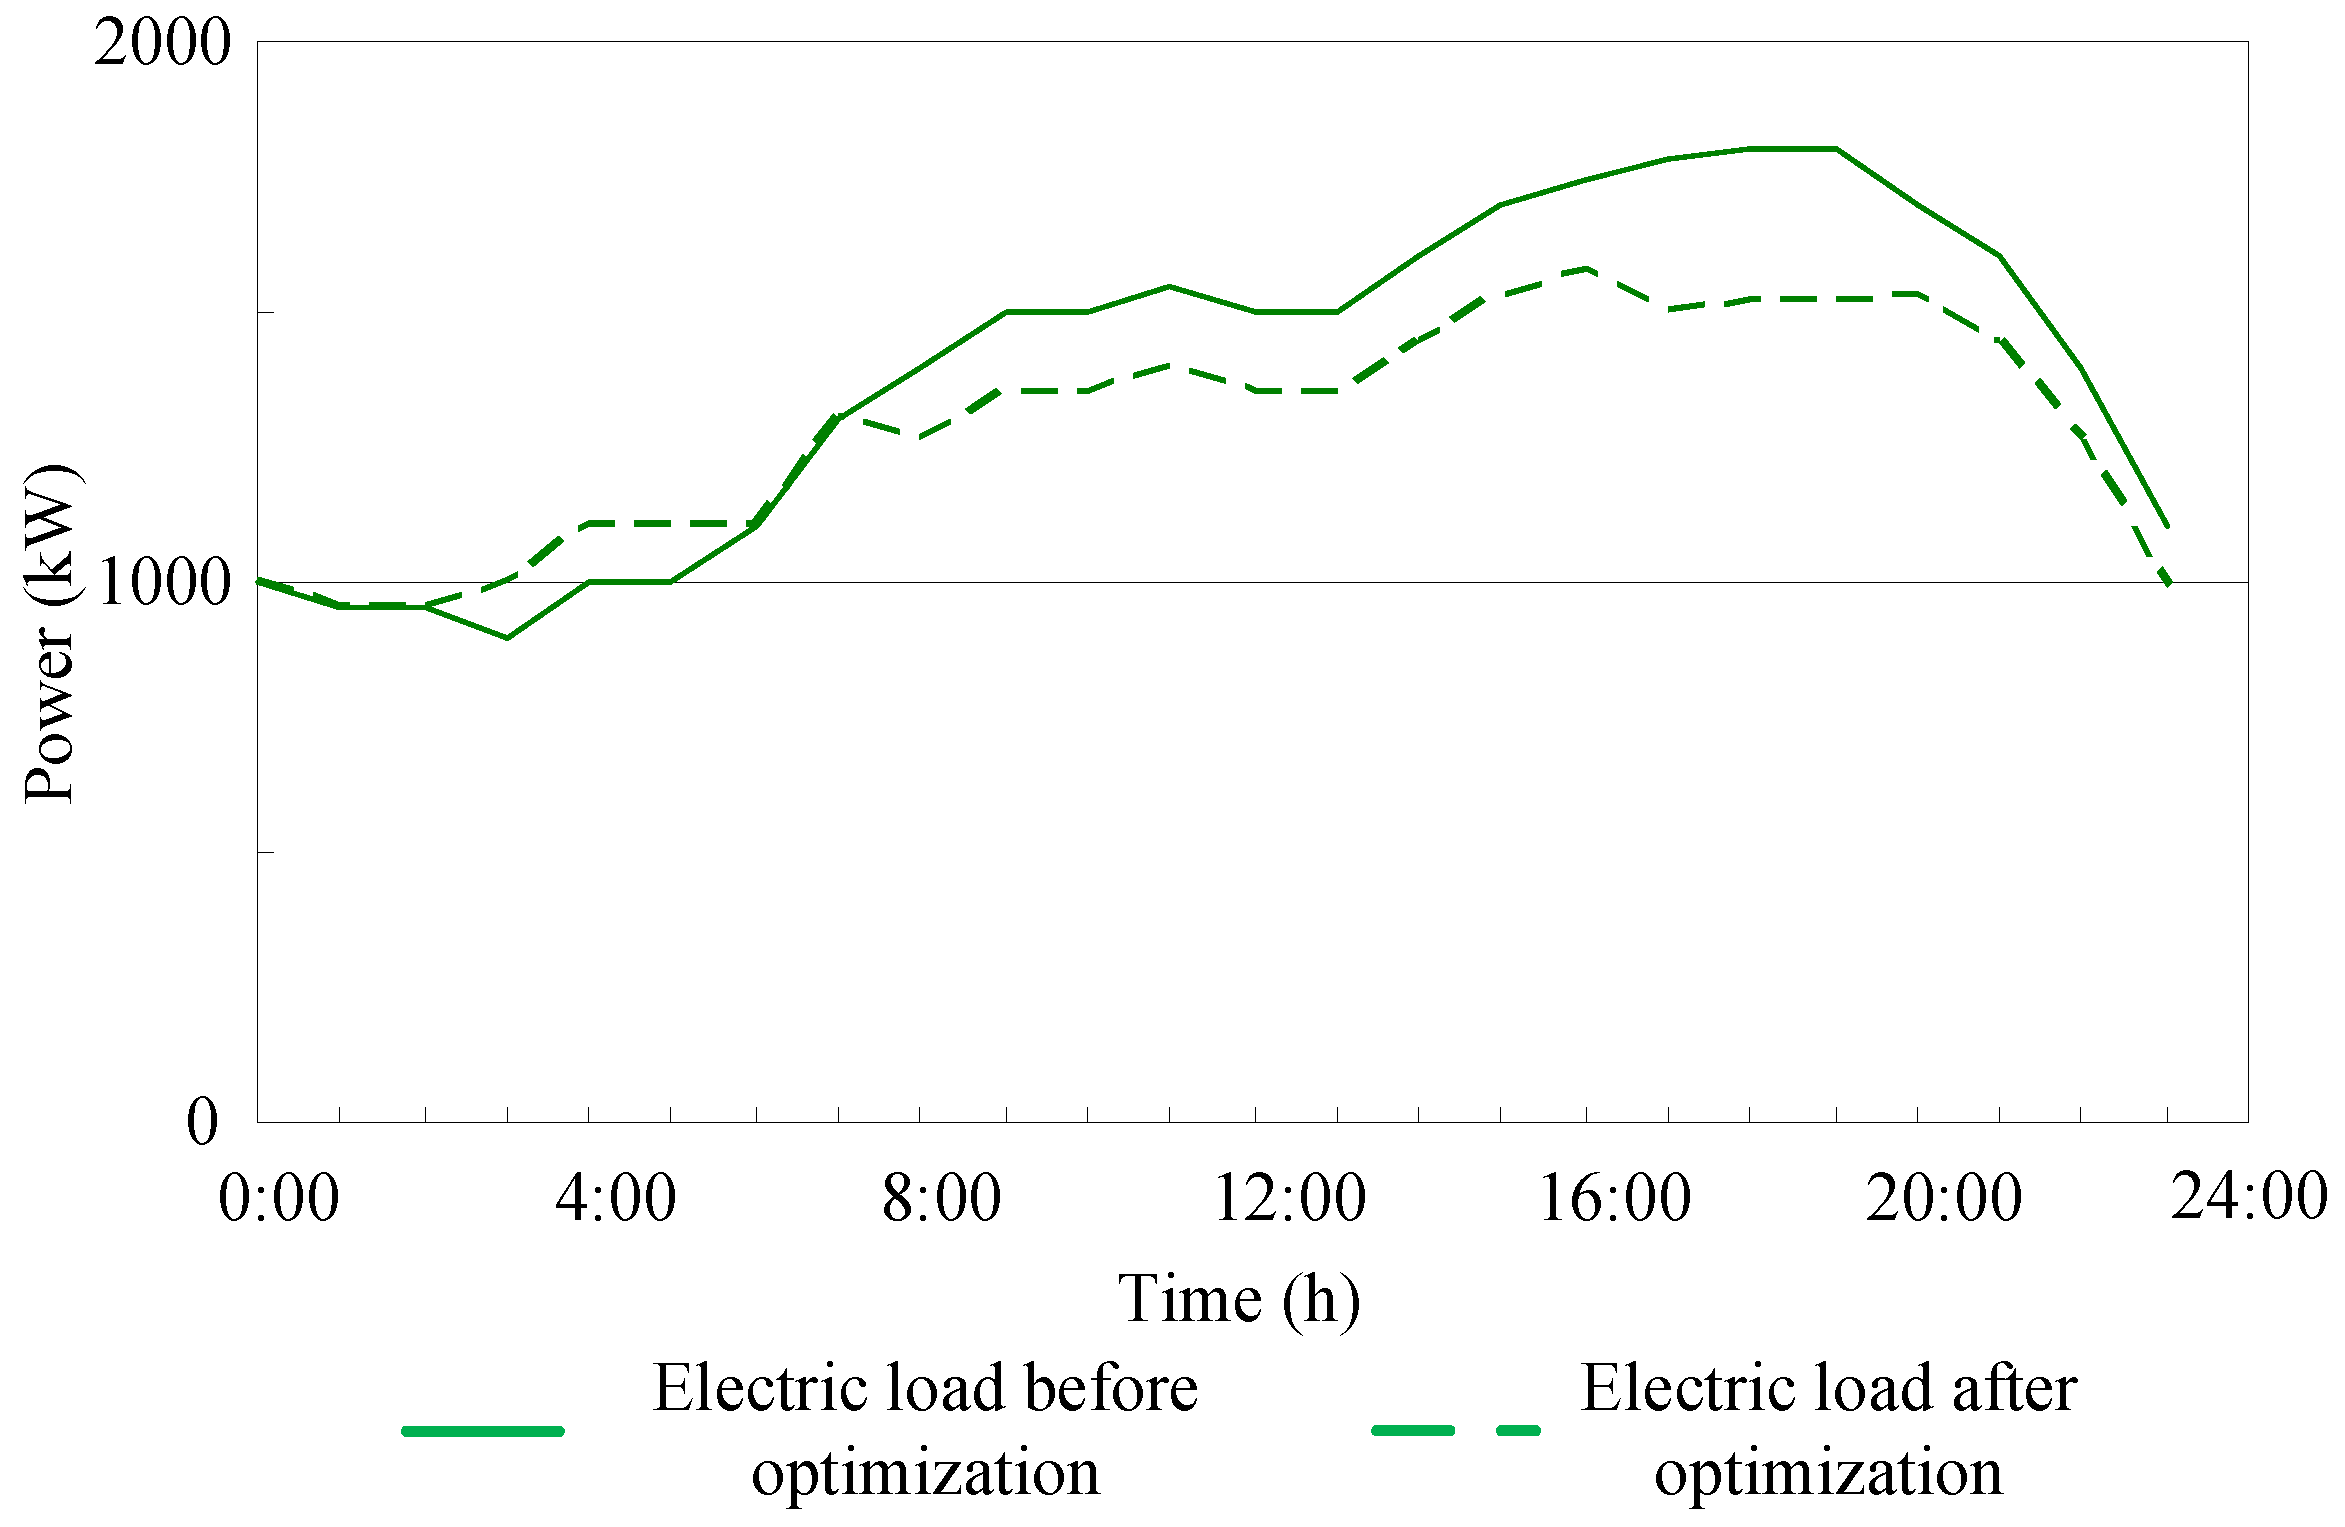
Figure 8 shows the comparison of electric load before and after optimization considering a power flexible load. As shown in Figure 9, the power loads are reduced between 08:00 and 21:00 while meeting the reduction conditions, which relieves the power supply pressure of the whole system. From the comparison between Figure 3 and Figure 7, it can be seen that the output power of the WT between 00:00–08:00 and 21:00–24:00 fully meets the power load demand. Therefore, the load is not reduced. Comparing Figure 7 and Figure 8, it can be seen that in the three hours between 17:00 and 20:00, the translatable load is shifted to between 03:00 and 06:00 in order to alleviate the power supply tension of the evening peak and reduce the peak–valley difference in the load. At the same time, it is beneficial to improve the economy of the system by translating from the peak time of the time-sharing price to the valley time.
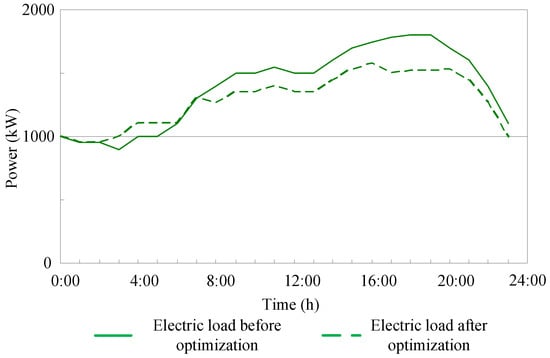
Figure 9.
Comparison before and after power flexible load.
4.2. Scheduling Analysis in Different Scenarios
In order to verify the influence of the coordinated utilization of flexible load and energy-storage equipment on the optimal scheduling in the model built in this paper, the following three scenarios are set up.
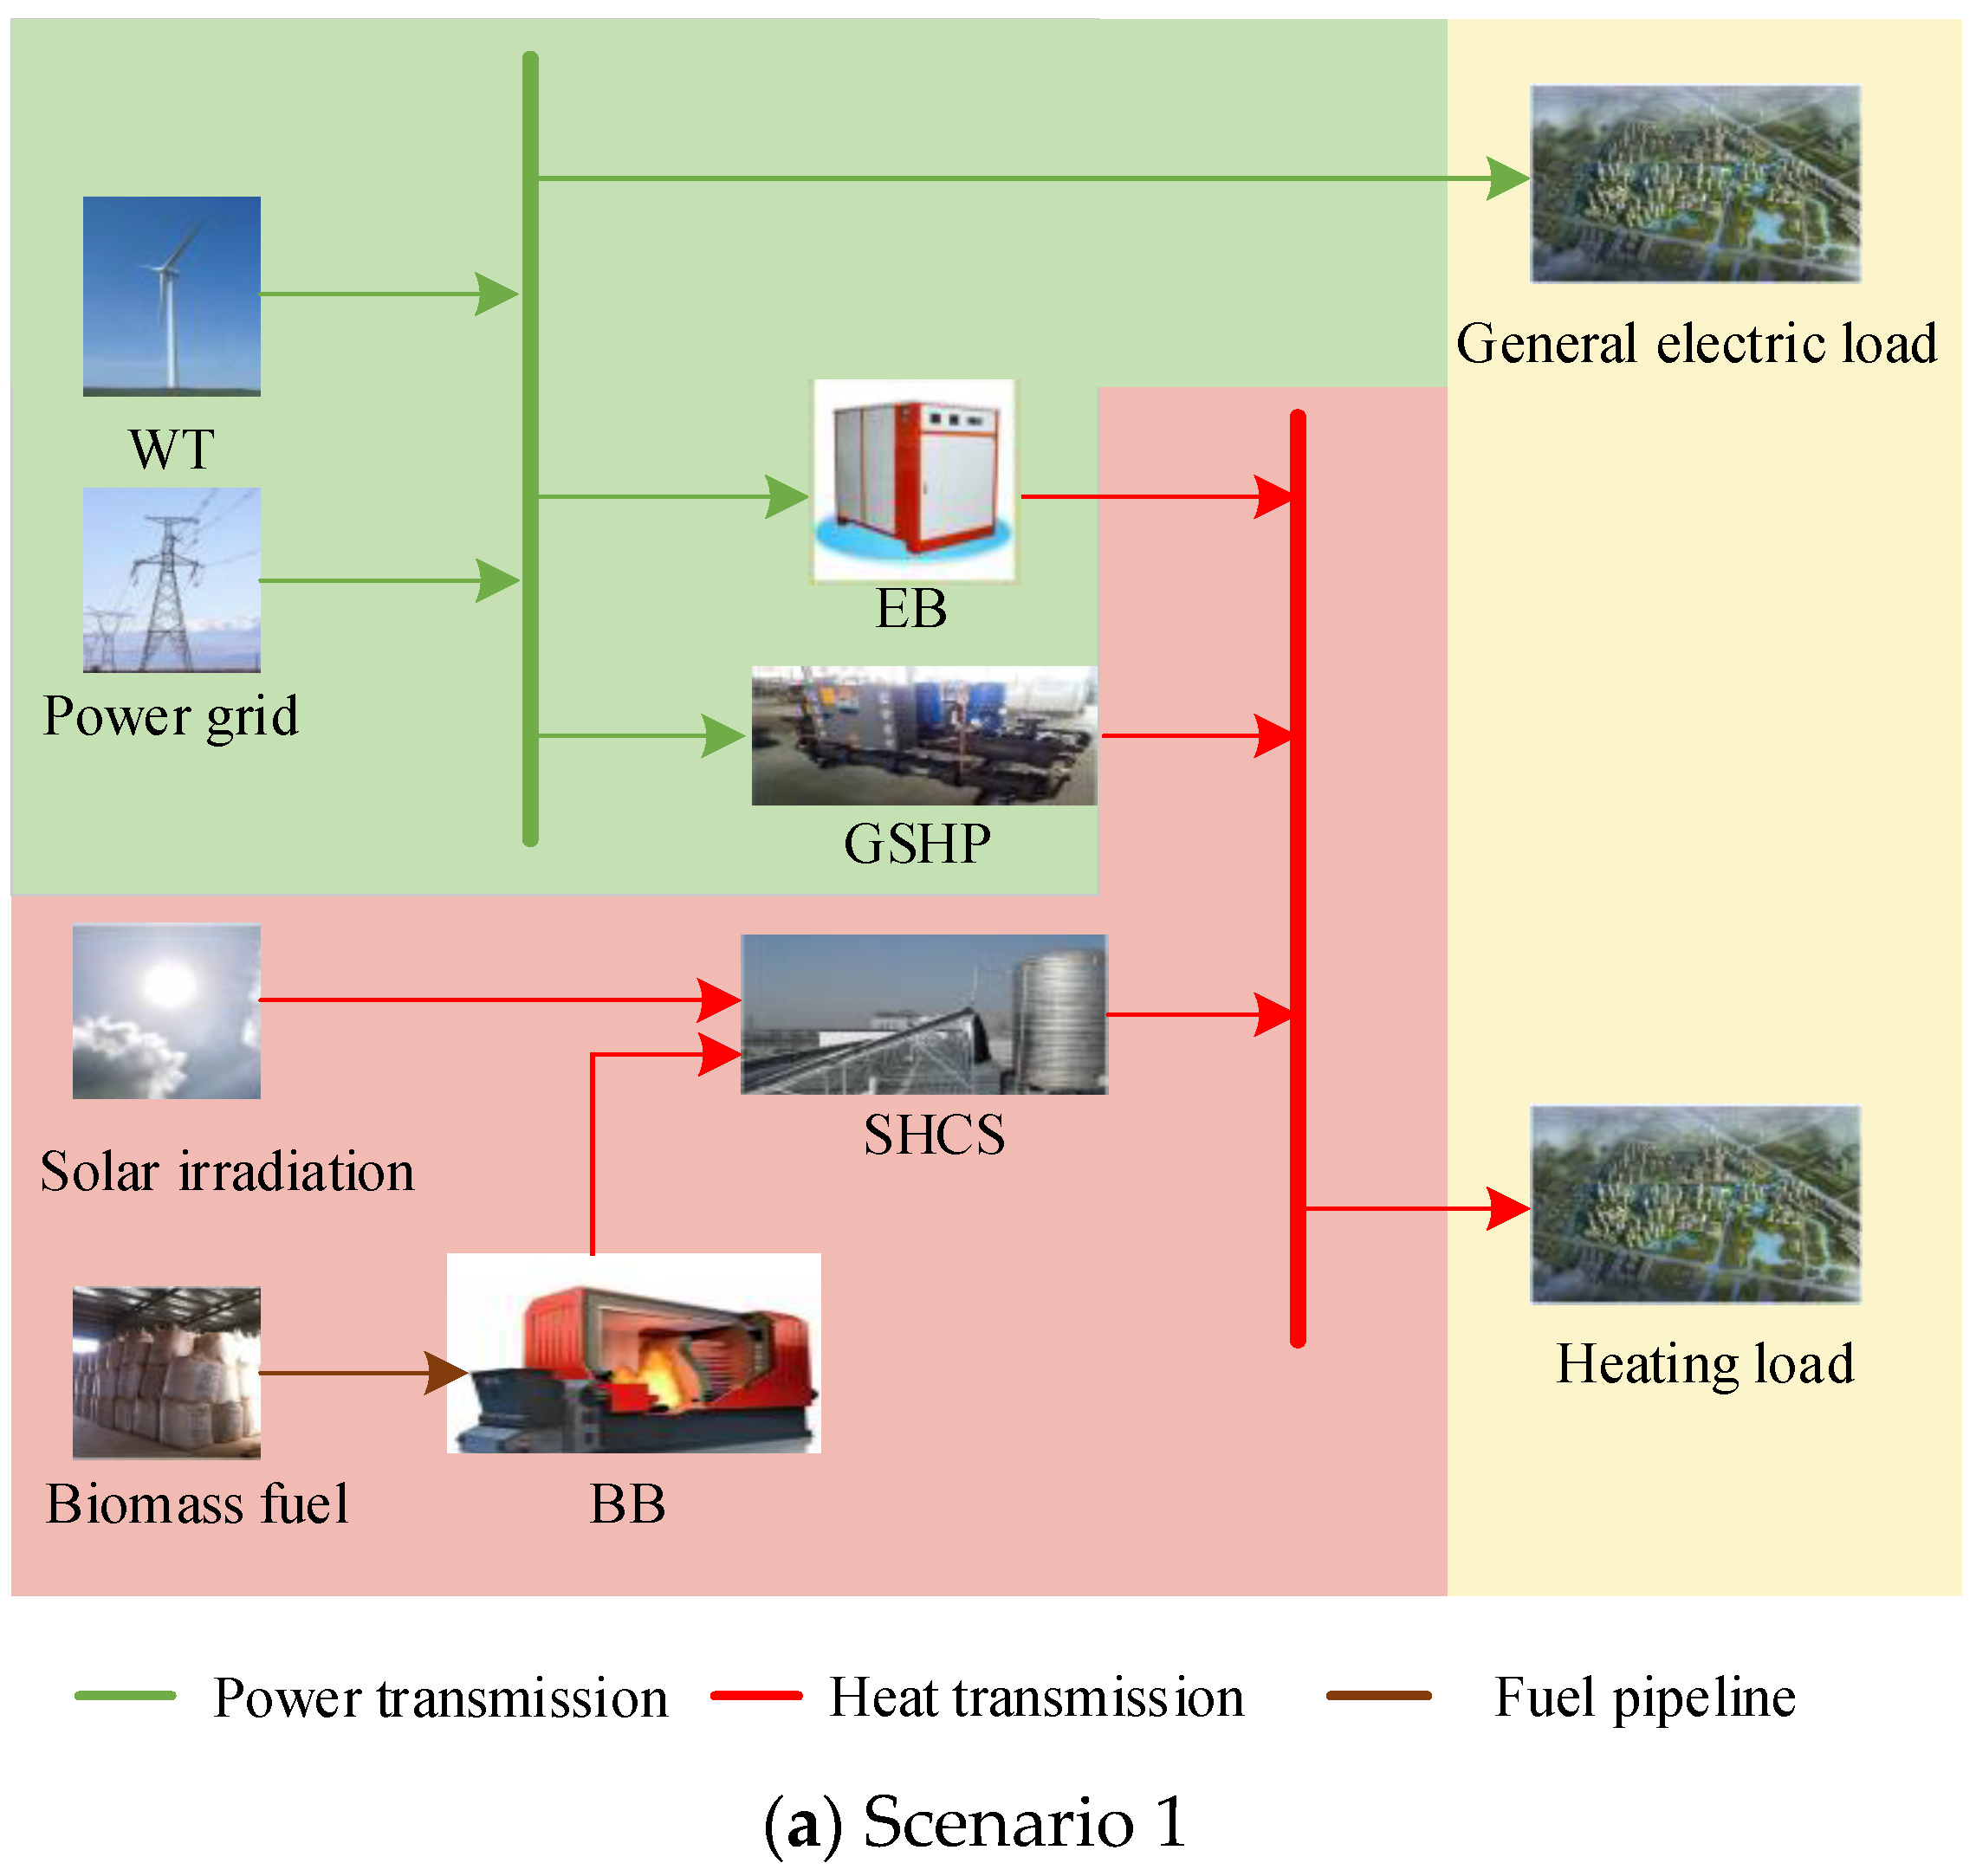
Scenario 1: On the basis of the structure of Figure 1, the flexible load, regenerator and battery are removed, as shown in Figure 10a.
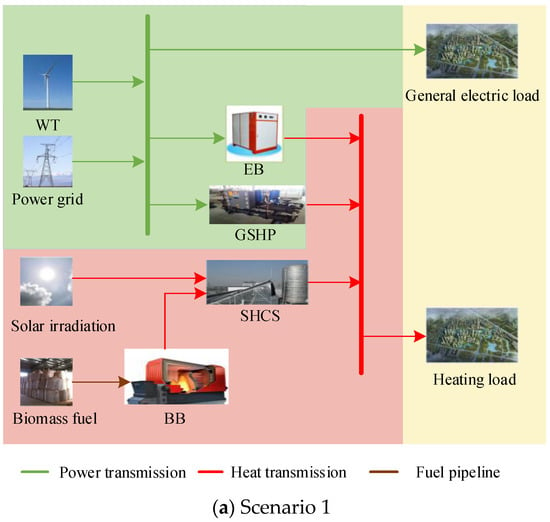
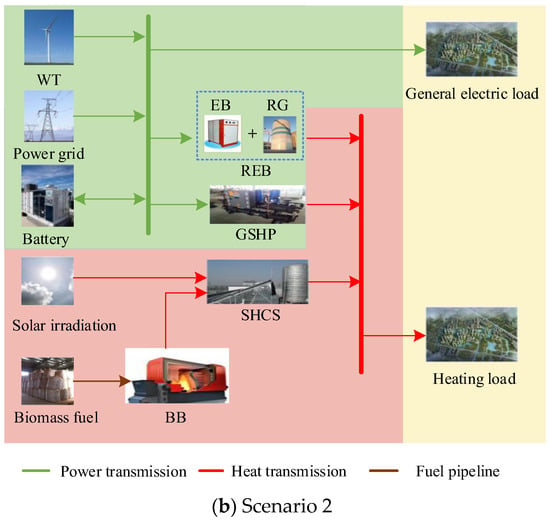
Figure 10.
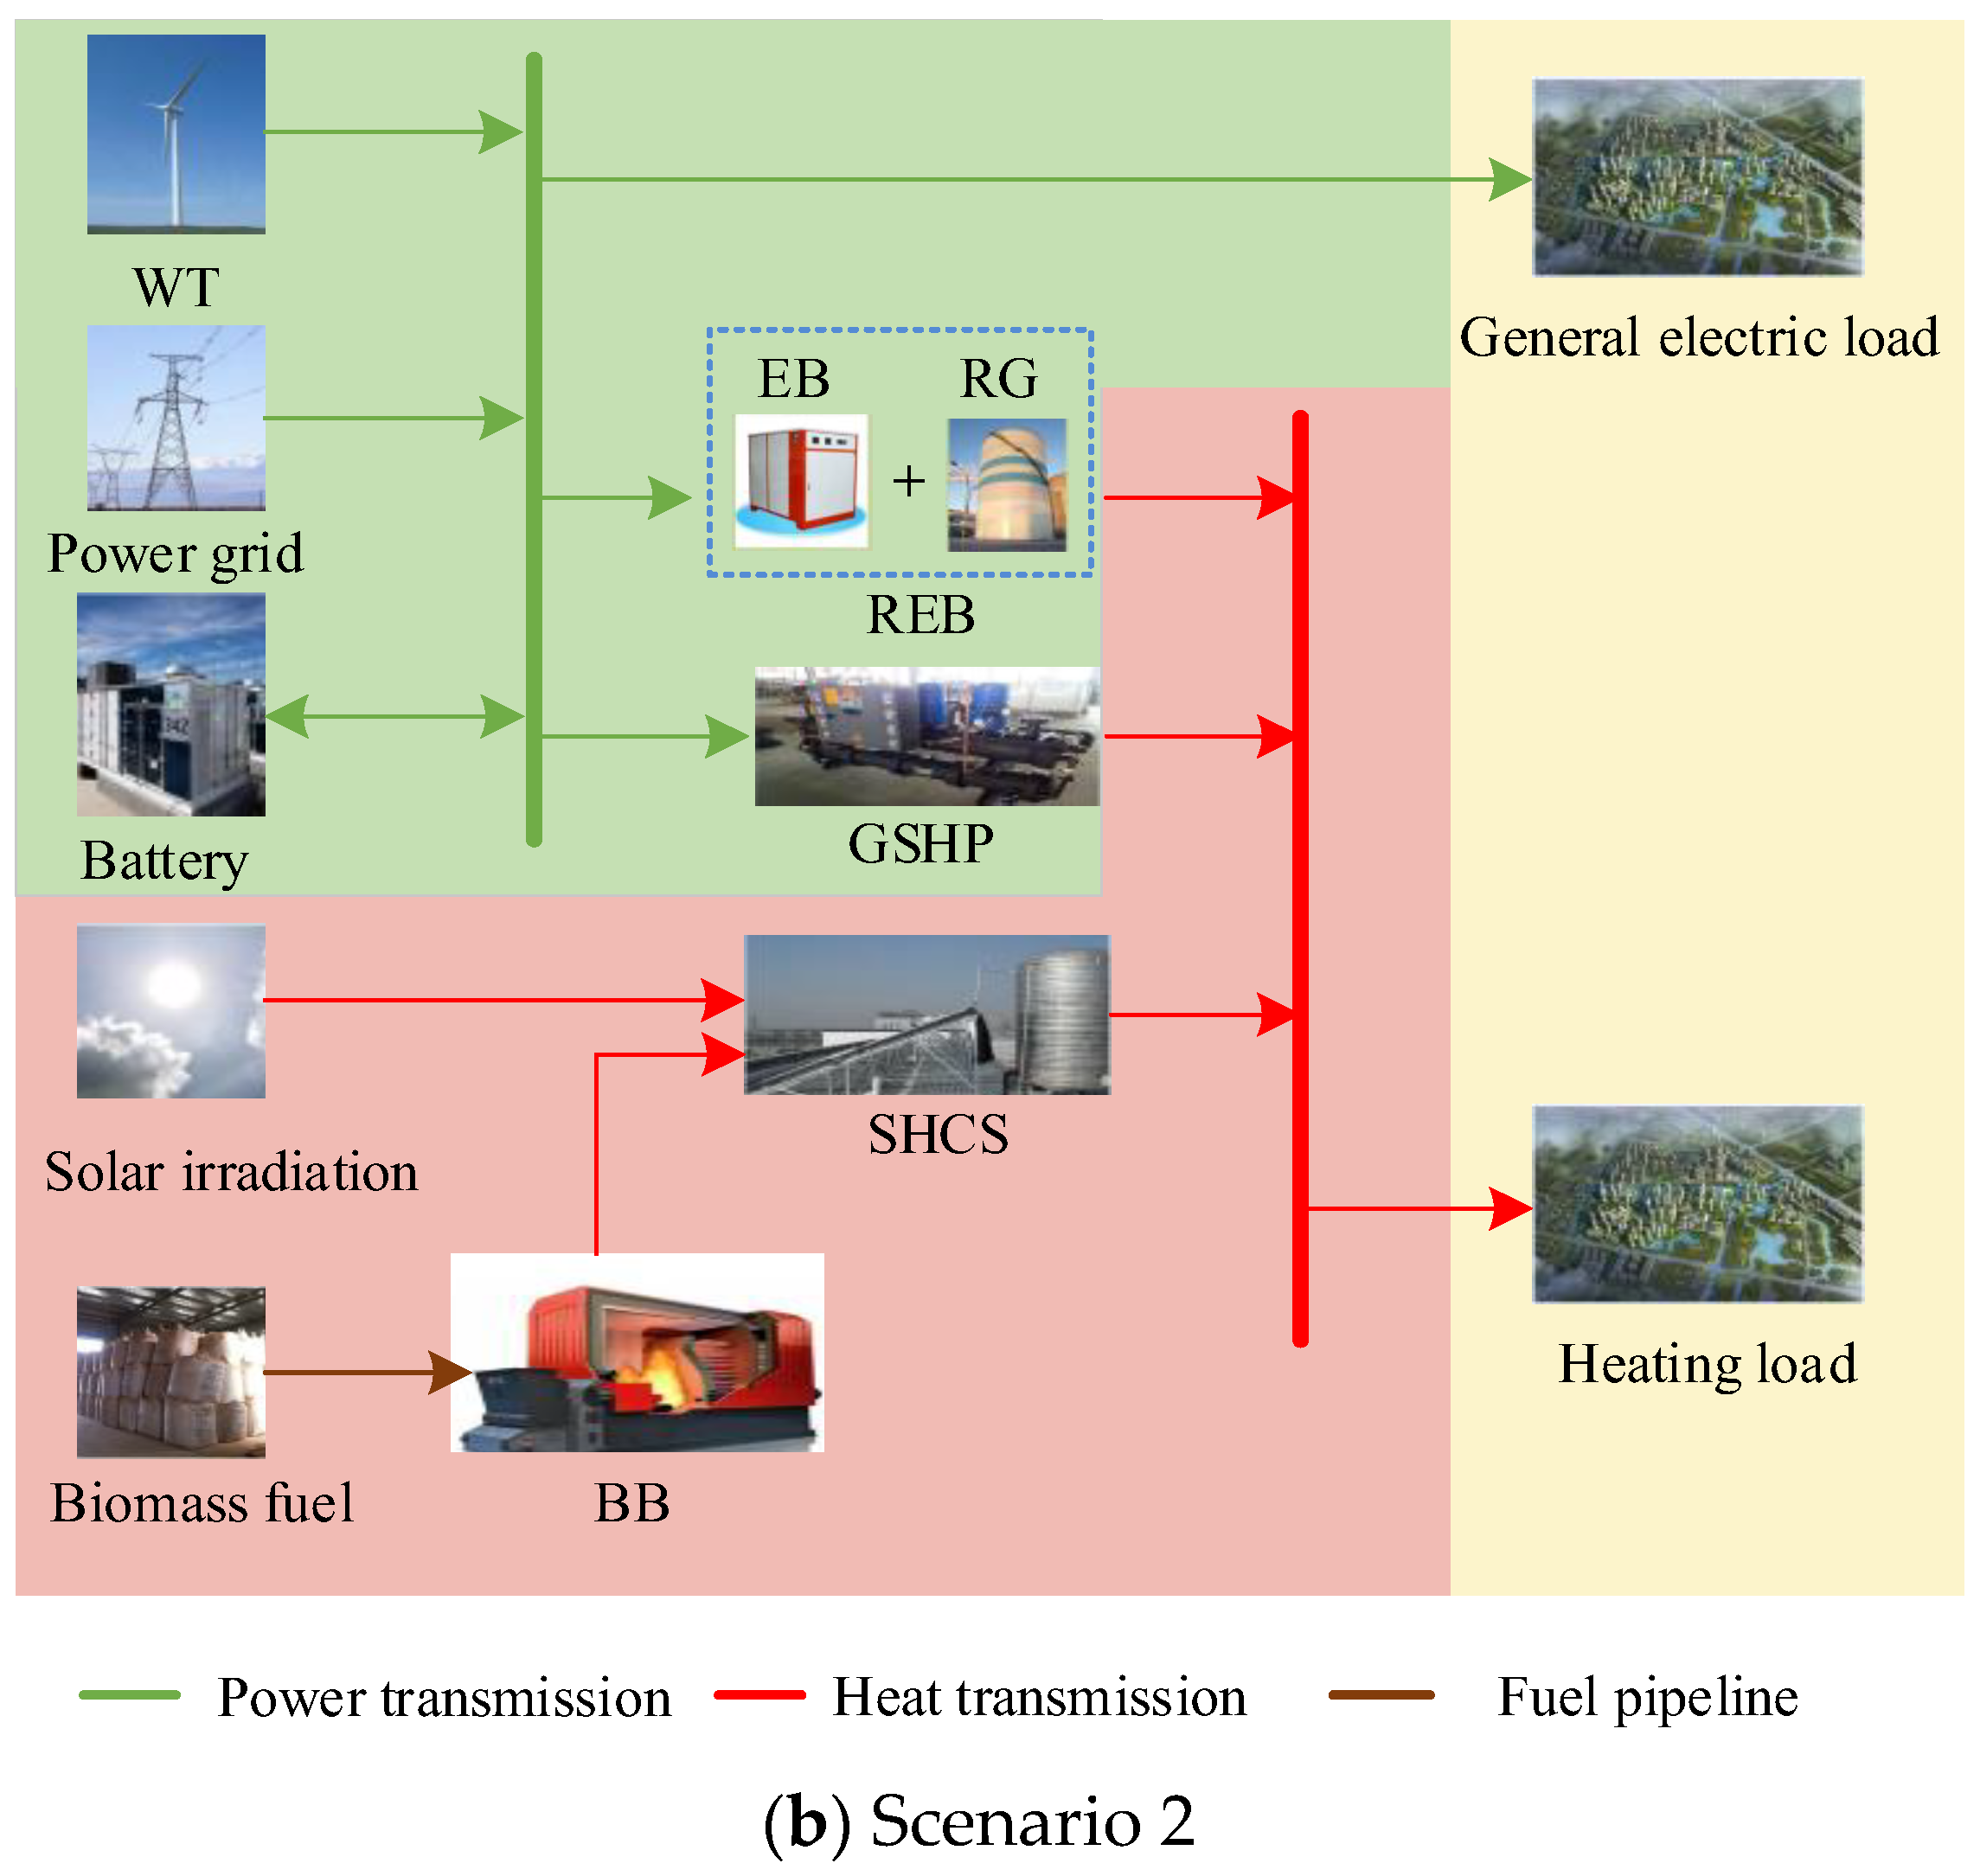
Electrical–thermal IES structure in various scenarios.
Scenario 2: On the basis of Scenario 1, the regenerator and battery are added, as shown in Figure 10b.
Scenario 3: with flexible load, the system is configured with energy-storage equipment, as shown Figure 1.
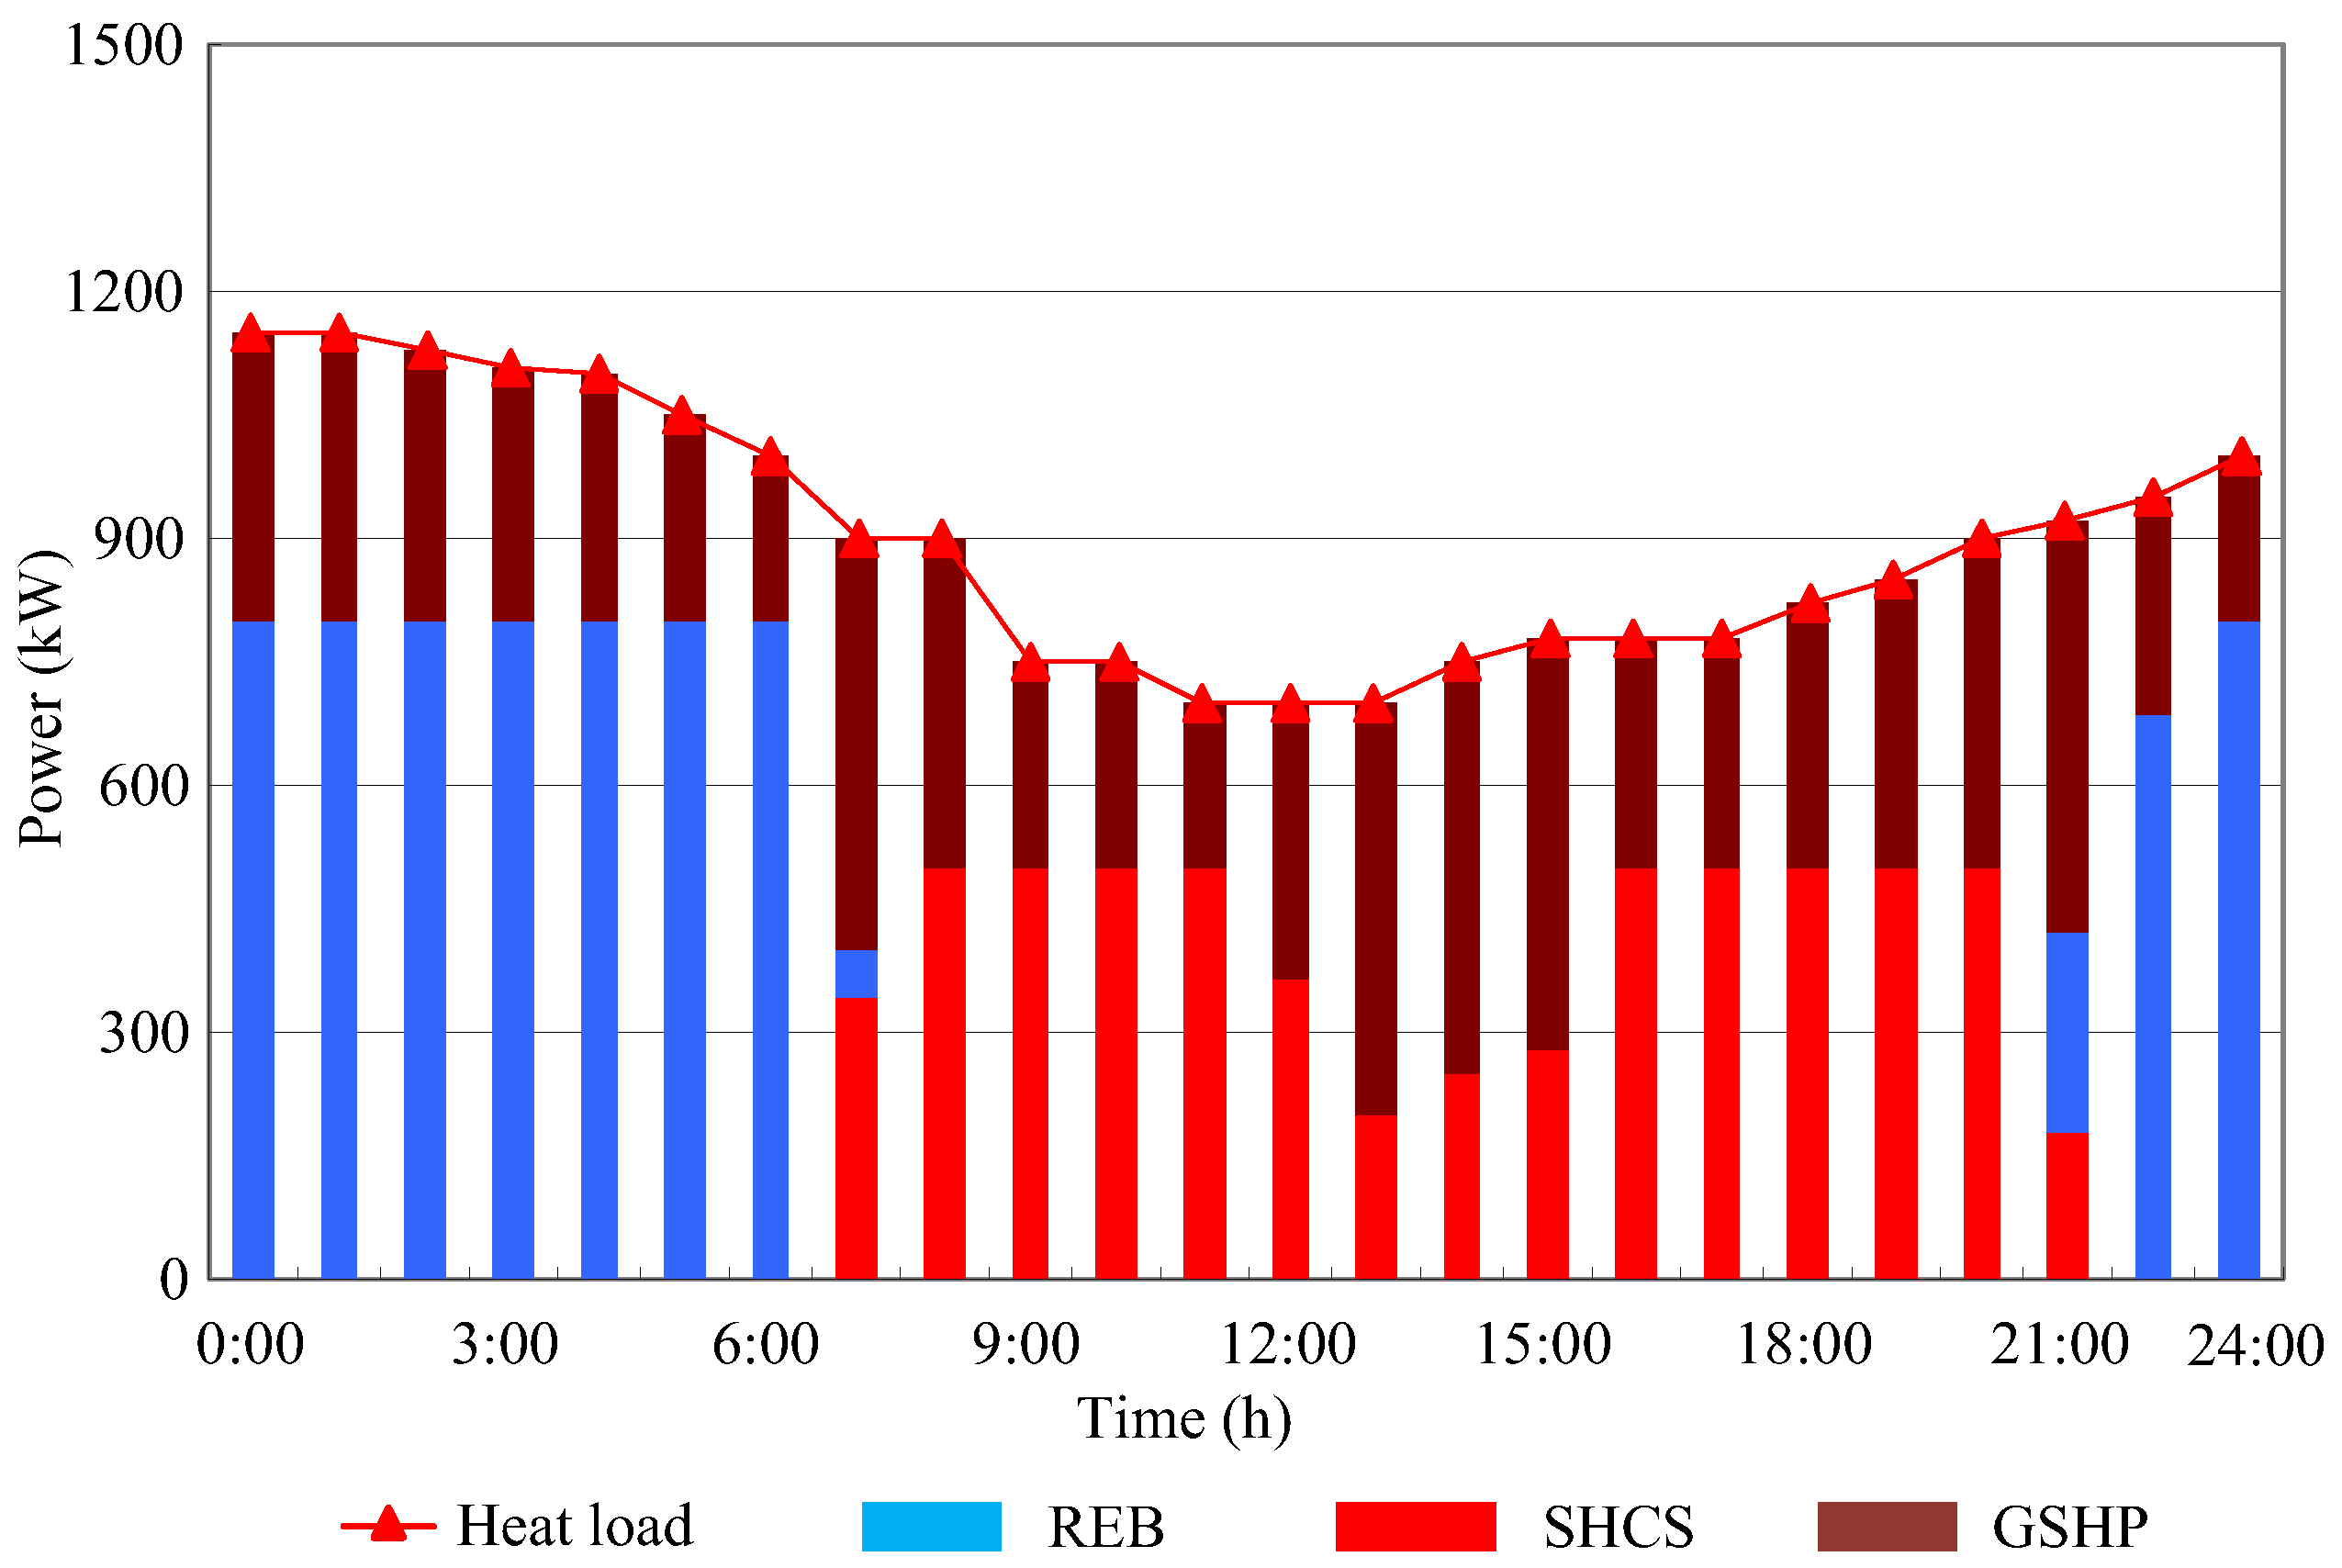
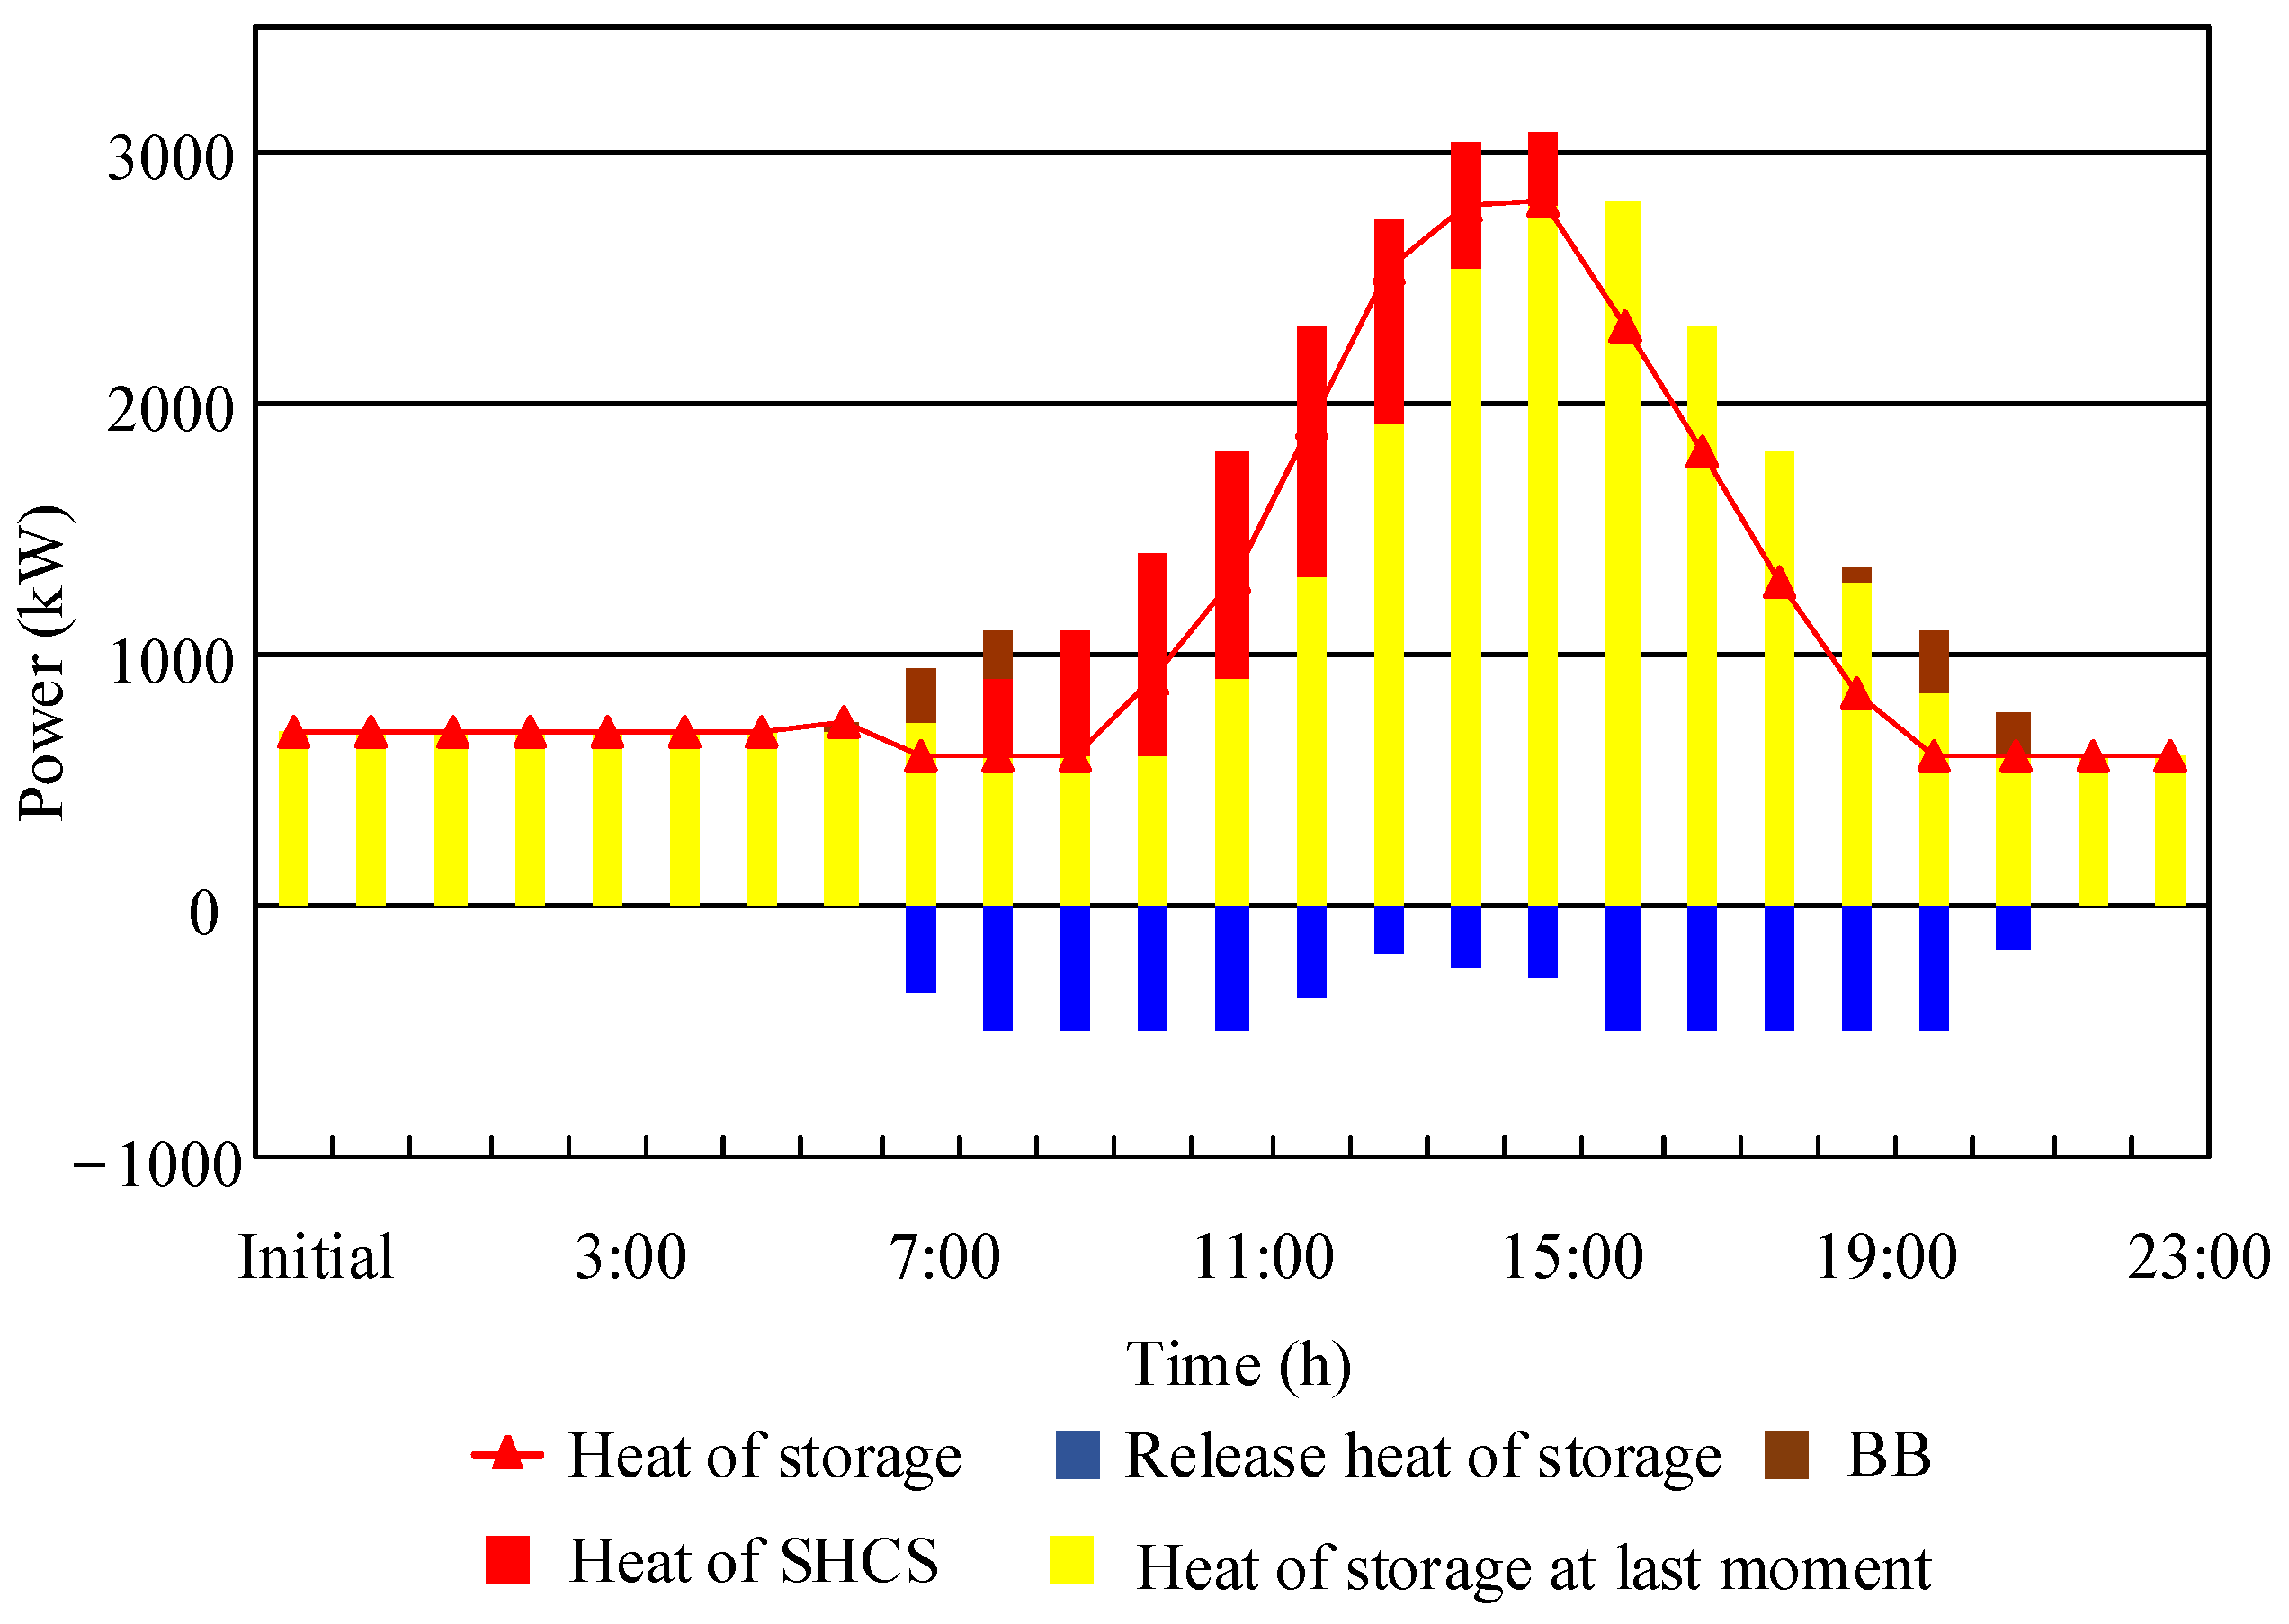
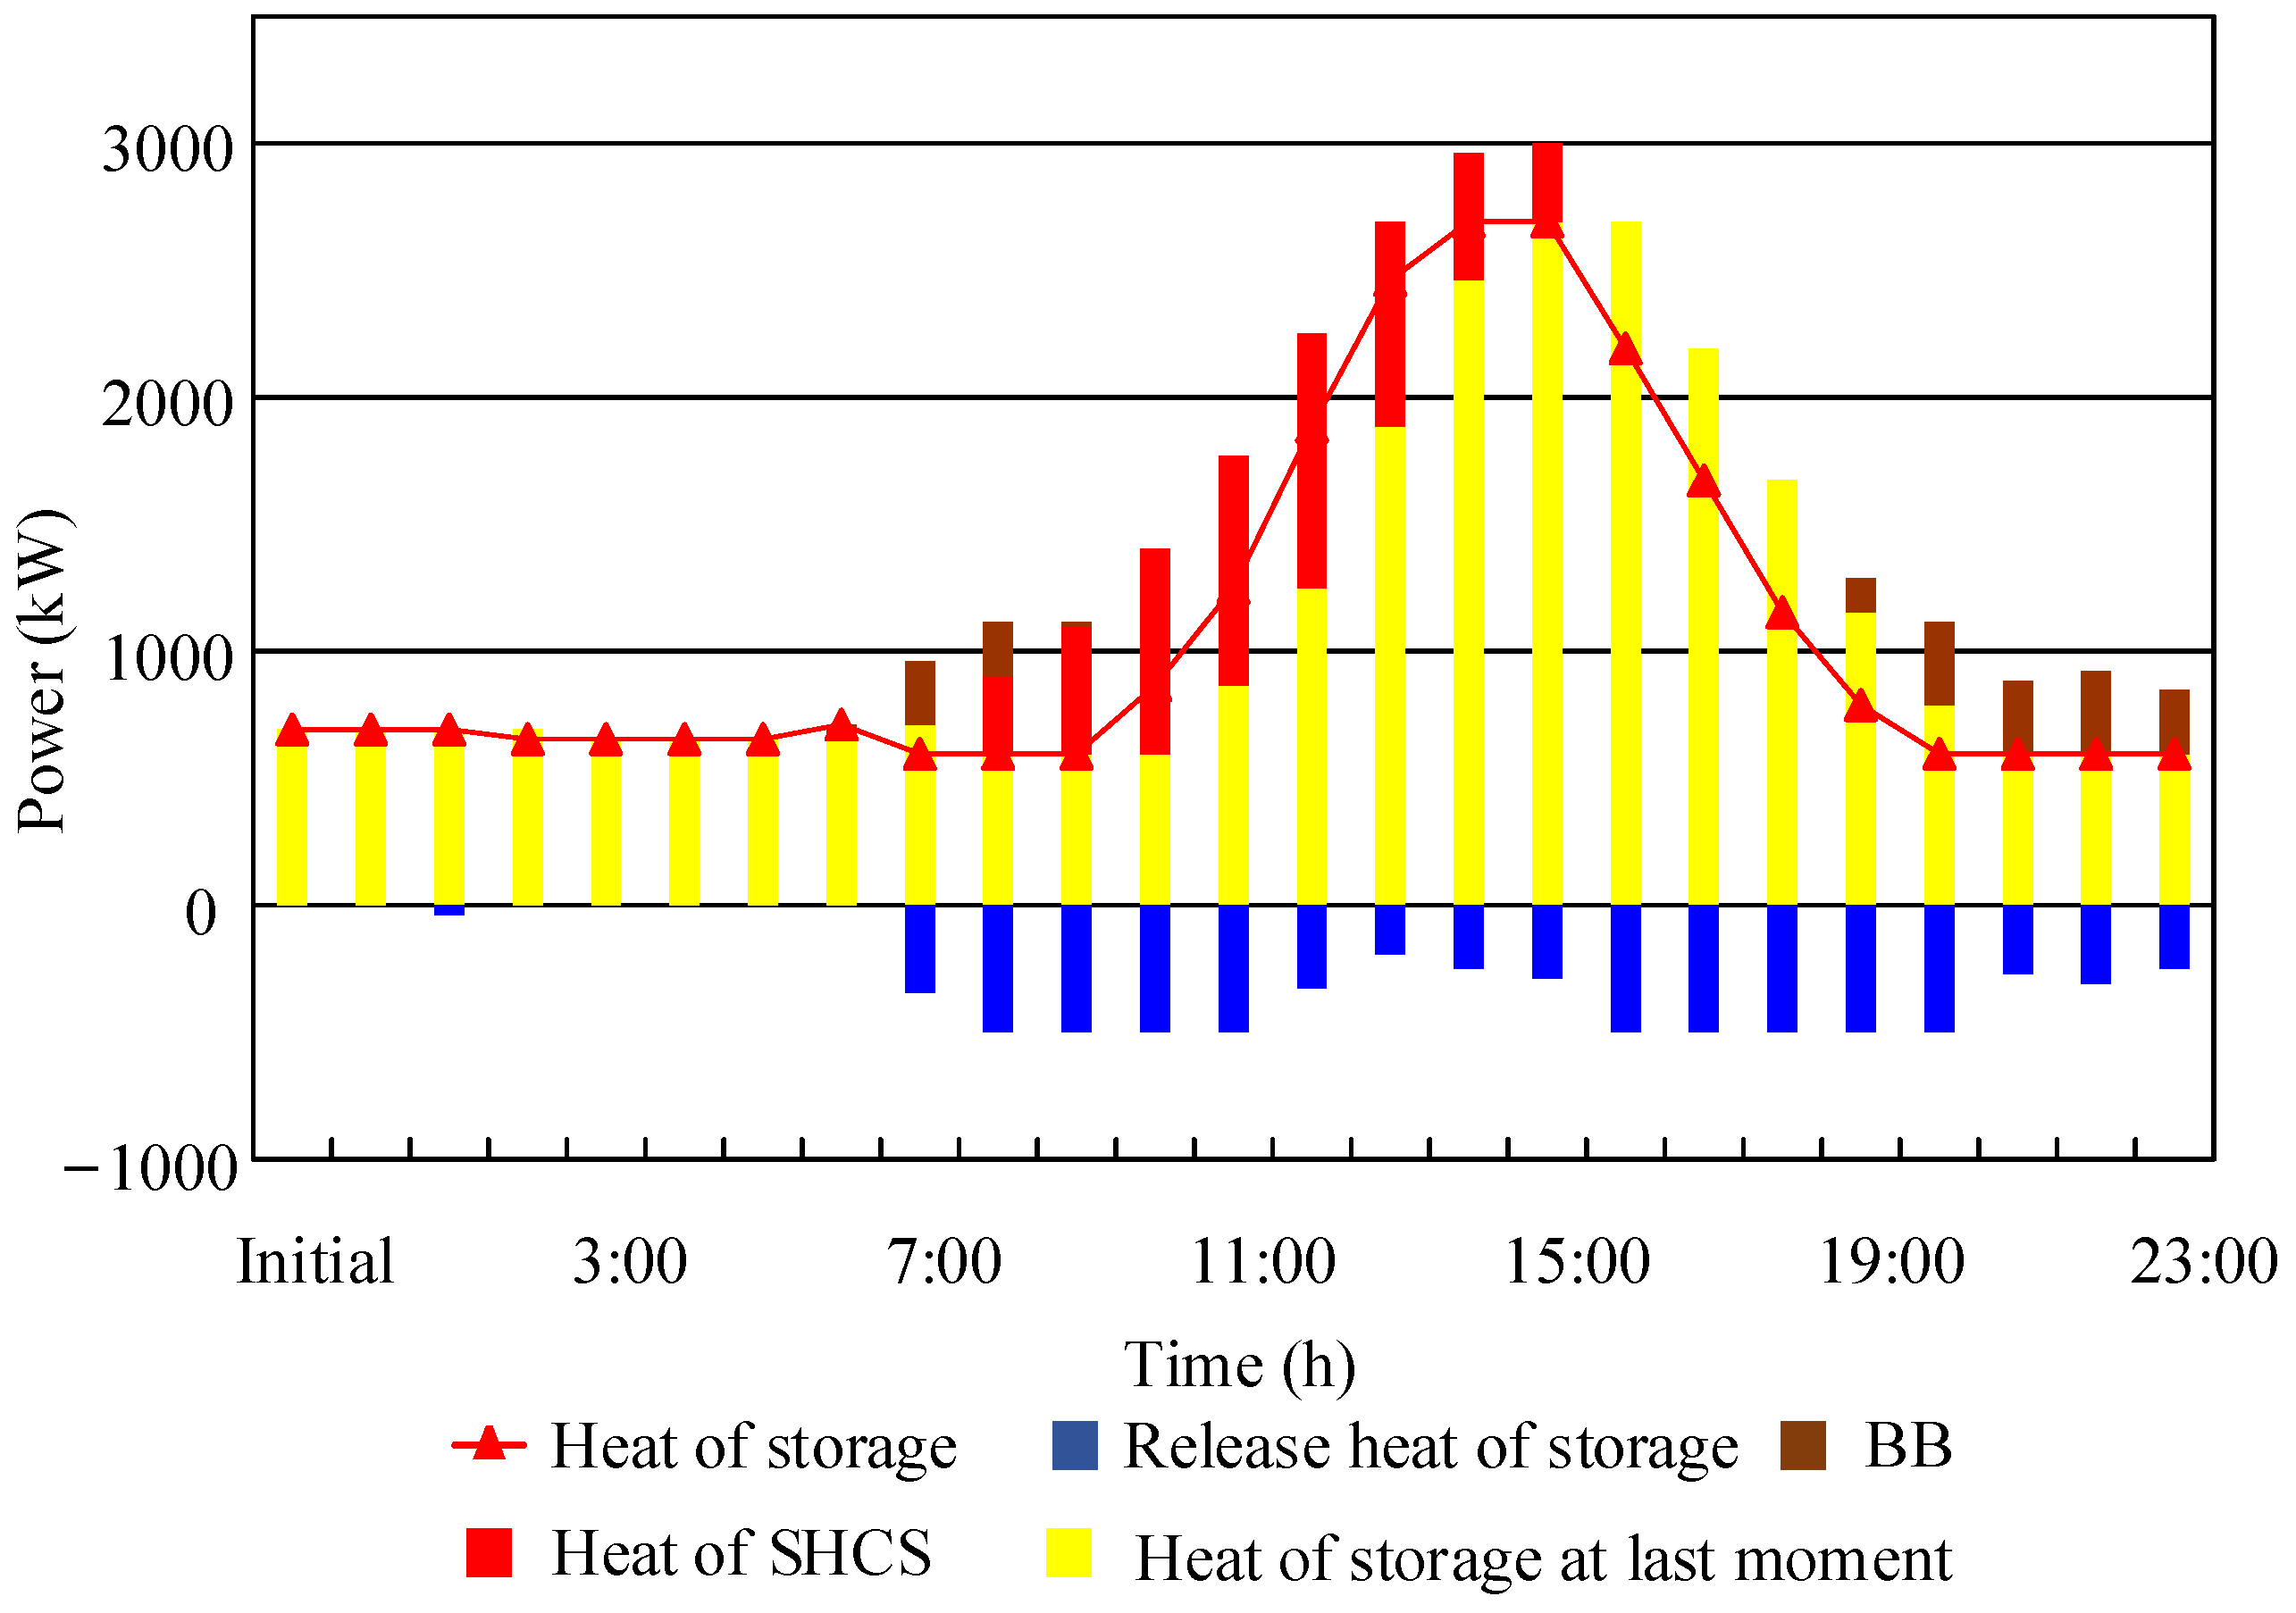
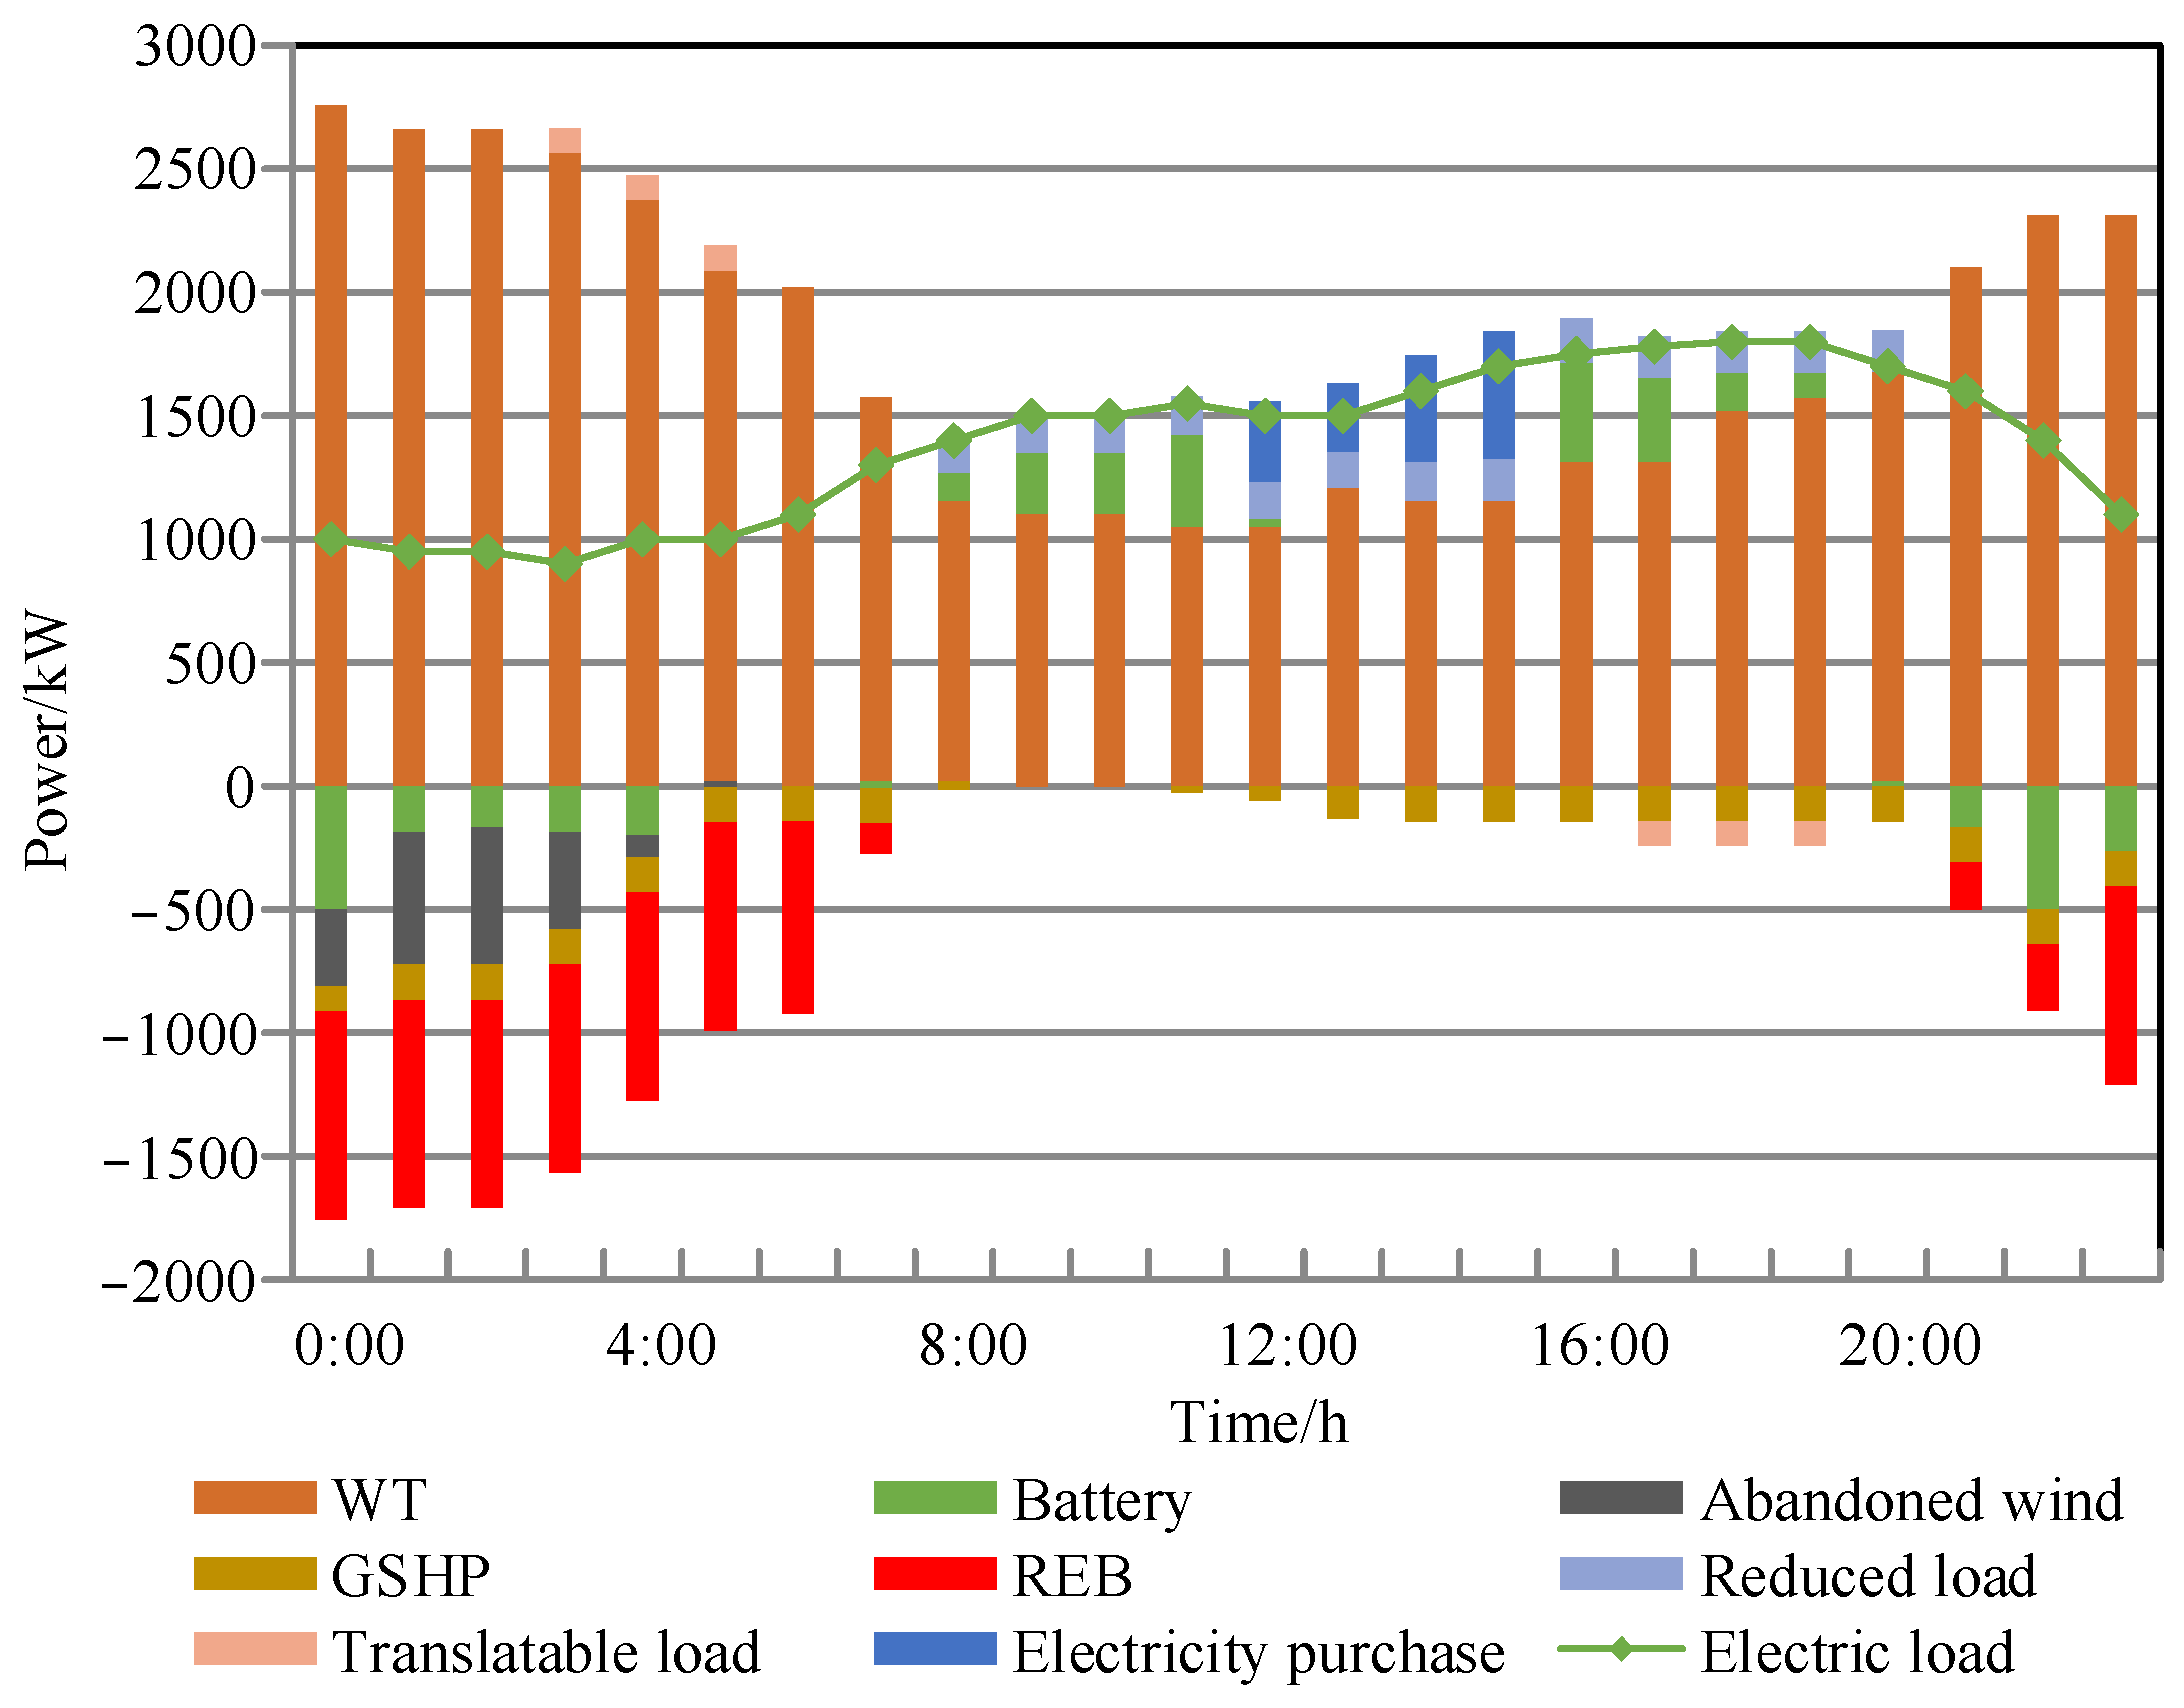
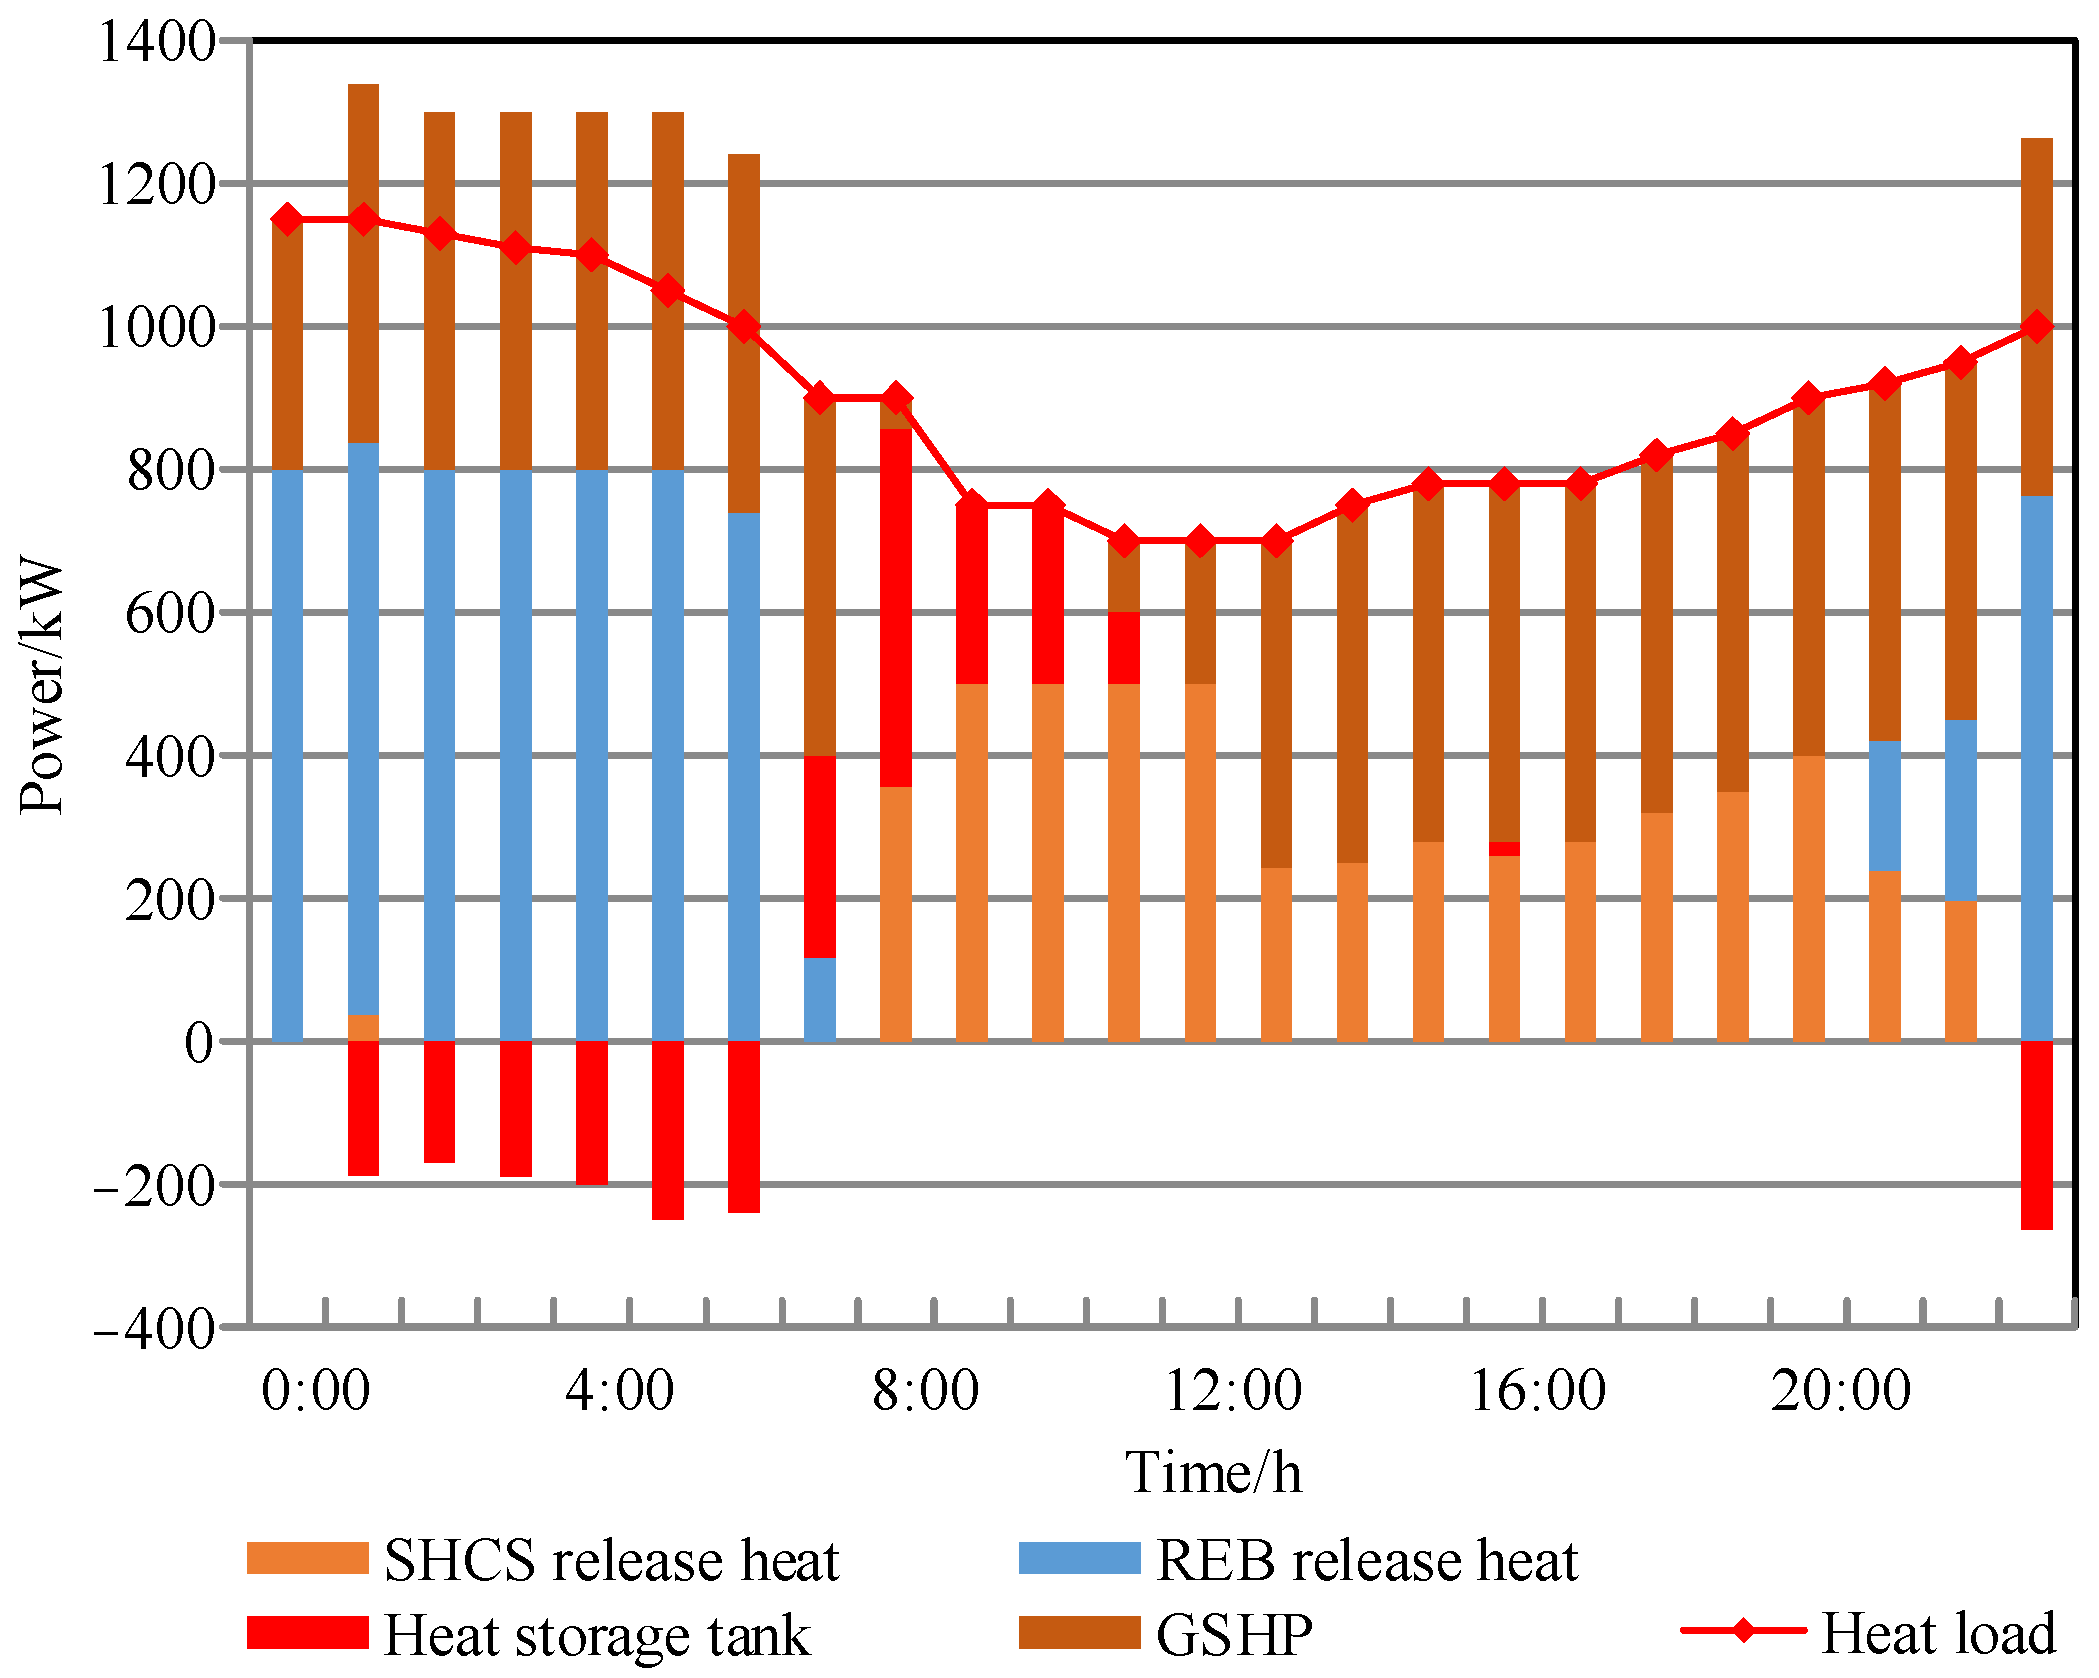
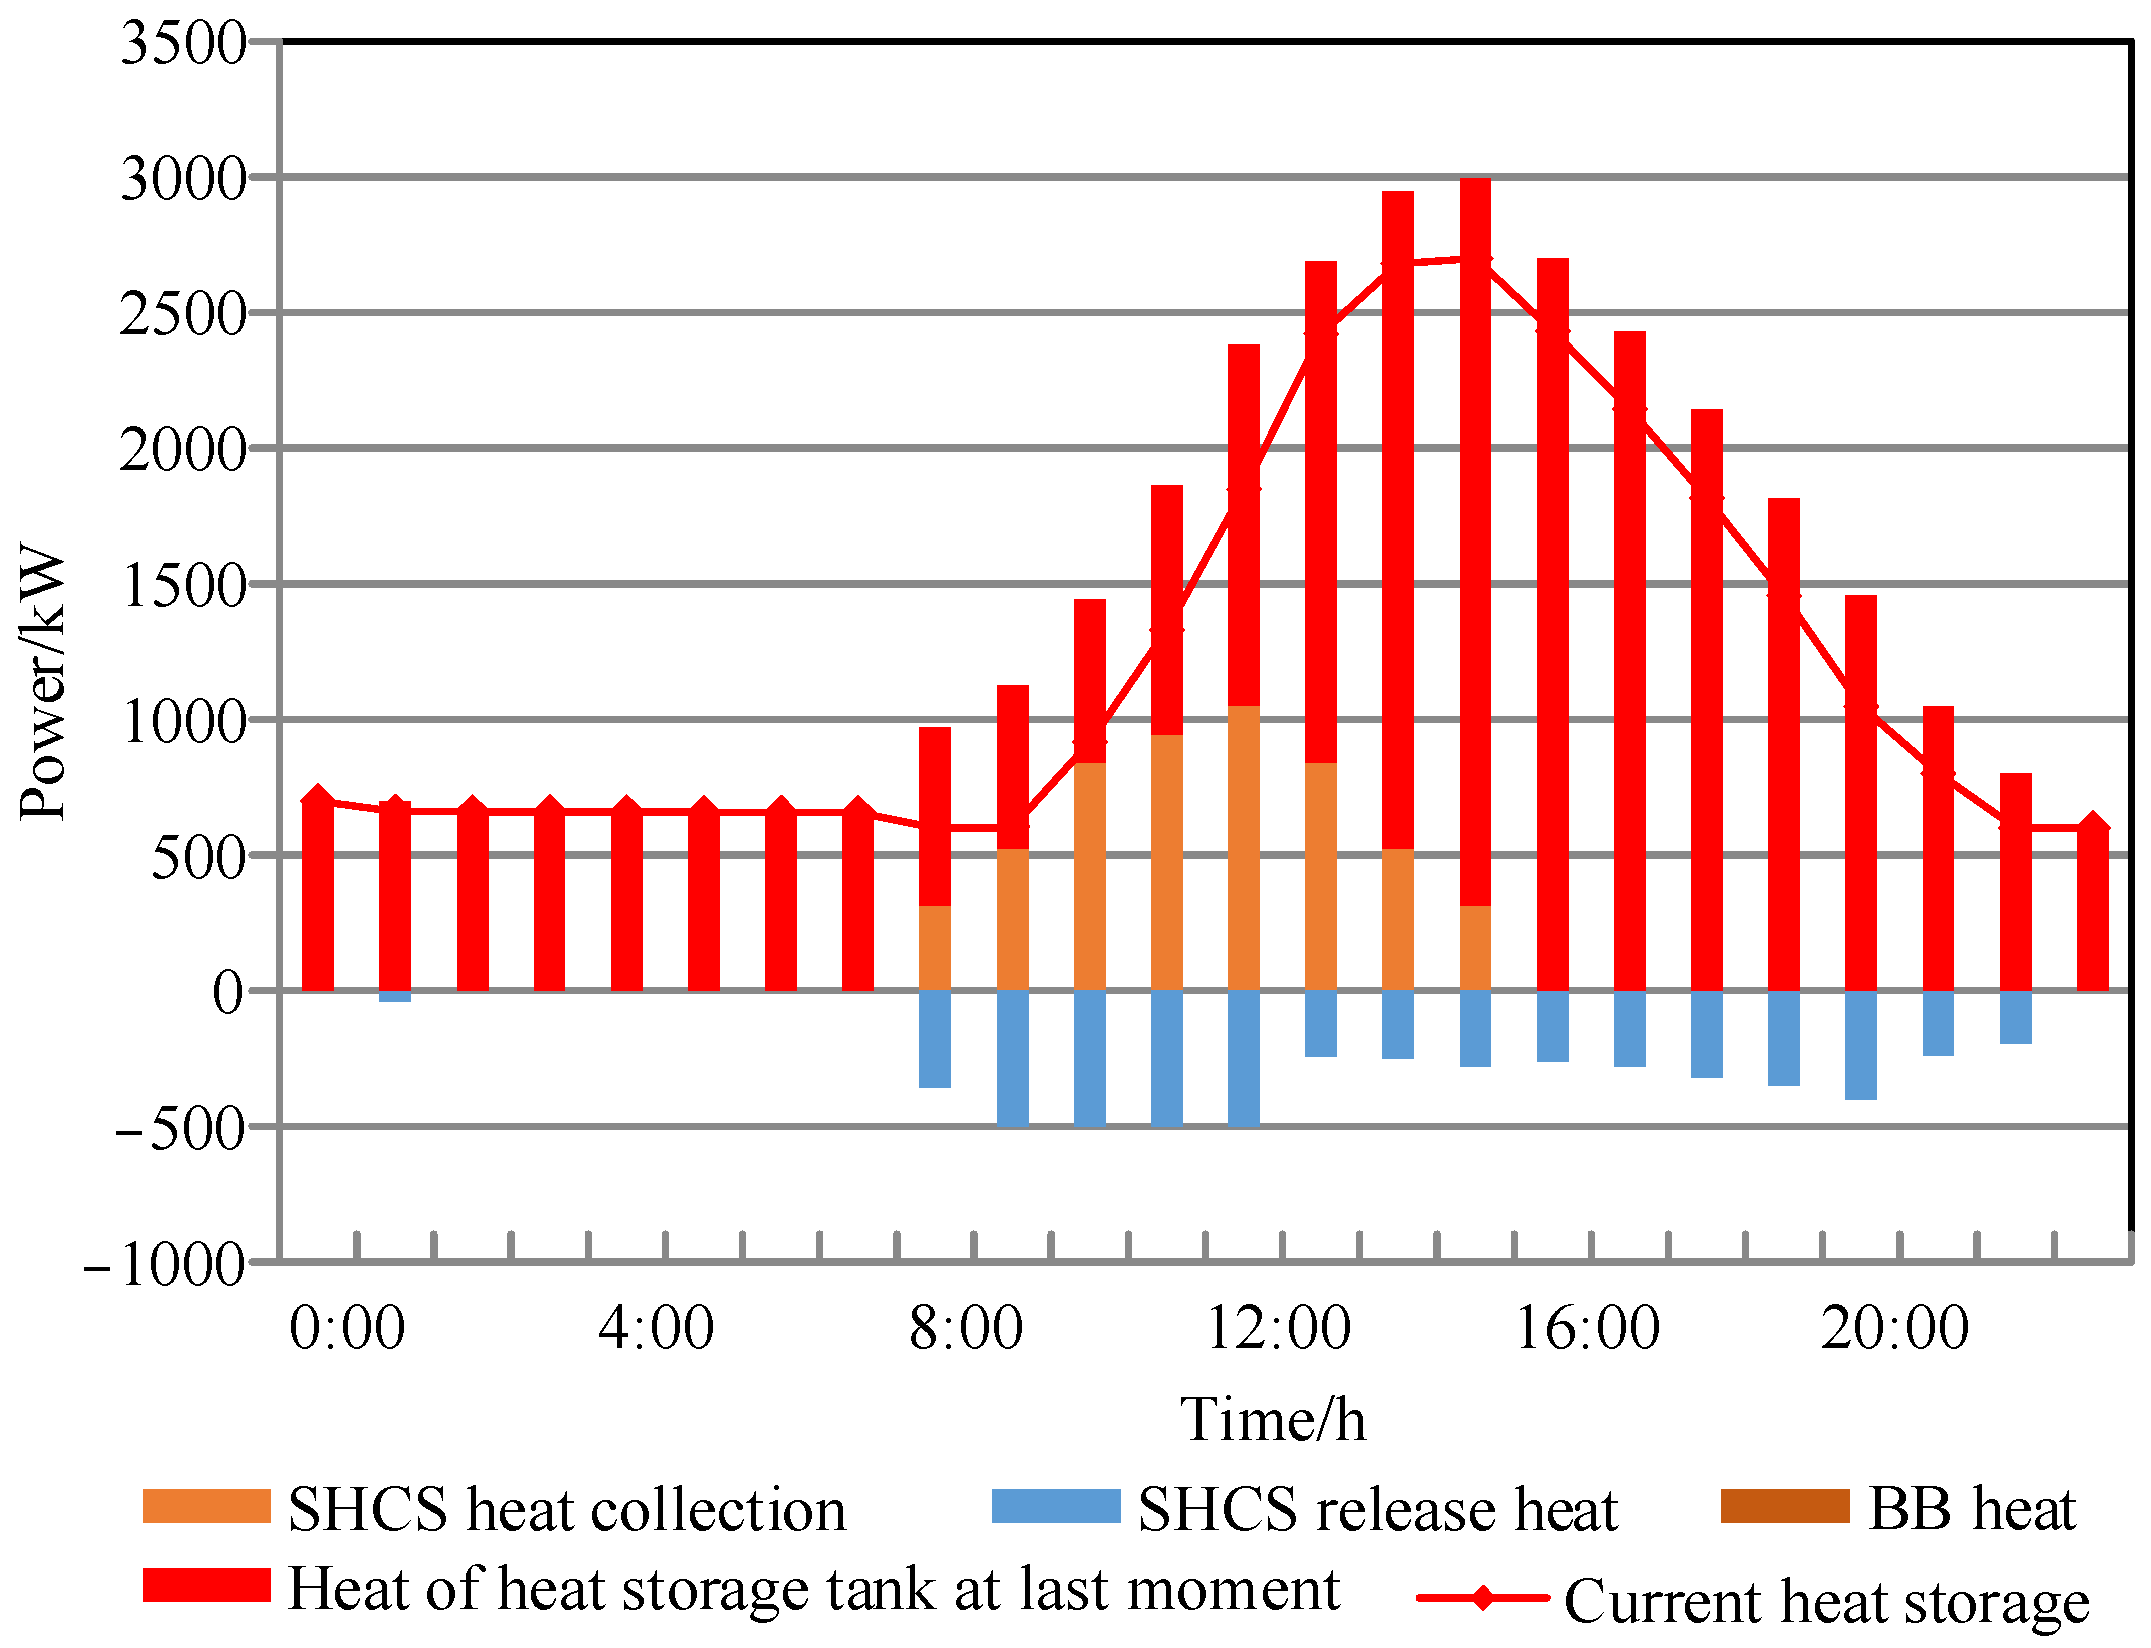
Figure 11 and Figure 12 show the output balance curves of electrical load and heat load in Scenario 1, respectively. Figure 13 shows the heat balance diagram of the SHCS. These do not contain flexible load and battery and do not include the heat storage part of the REB under Scenario 1. The heat load of the whole system is supplied by the SHCS, REB, and GSHP. Moreover, the basic electric load and the electric power of the equipment are satisfied by the WT and power grid.
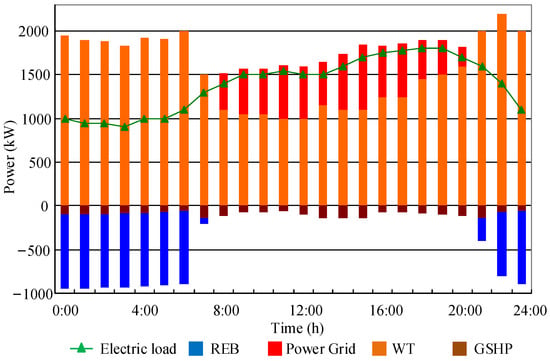
Figure 11.
Scenario 1 power load balance diagram.
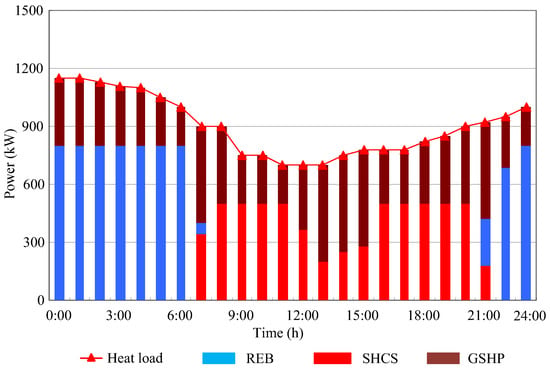
Figure 12.
Scenario 1 heat load balance diagram.
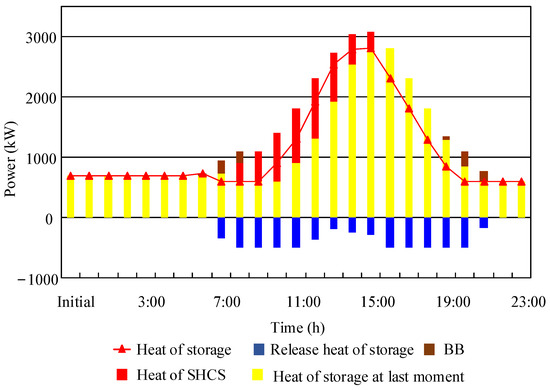
Figure 13.
Scenario 1 output balance of solar collector system.
As can be seen from Figure 11 and Figure 12, under Scenario 1, when the generation capacity of the WT at 0:00–07:00 is larger than the user’s basic electricity load and sufficient to supply the heat load, too much abandonment of wind energy can be avoided. The operation and maintenance cost of the REB is low; that is, priority is given to the use of REB for heating, and the GSHP is used for heating when the REB is insufficient.
During the period from 07:00 to 08:00, the generating capacity of the WT is not enough to support users’ basic electricity load and heat load; that is, under the condition of meeting the basic power load demand, surplus wind power is used to give priority to the efficient GSHP. Secondly, the REB is used to supply the user’s heat load. Finally the heat storage in the SHCS is used to supplement the heat energy.
During the period from 08:00 to 21:00, the generating capacity of the WT cannot meet the needs of users, users need to purchase electricity from the power grid. Therefore, at the peak of the electricity price, the heat load is first supplied by the heat energy of the SHCS, and then the GSHP is used. At an ordinary time of the electricity price, the SHCS and the GSHP cooperate with each other for heating.
During the period from 21:00 to 24:00, because the generating capacity of the WT is larger than the electricity load of users and there is no energy-storage equipment, at this time, the REB and the GSHP are heated, and the SHCS is used to assist the heating.
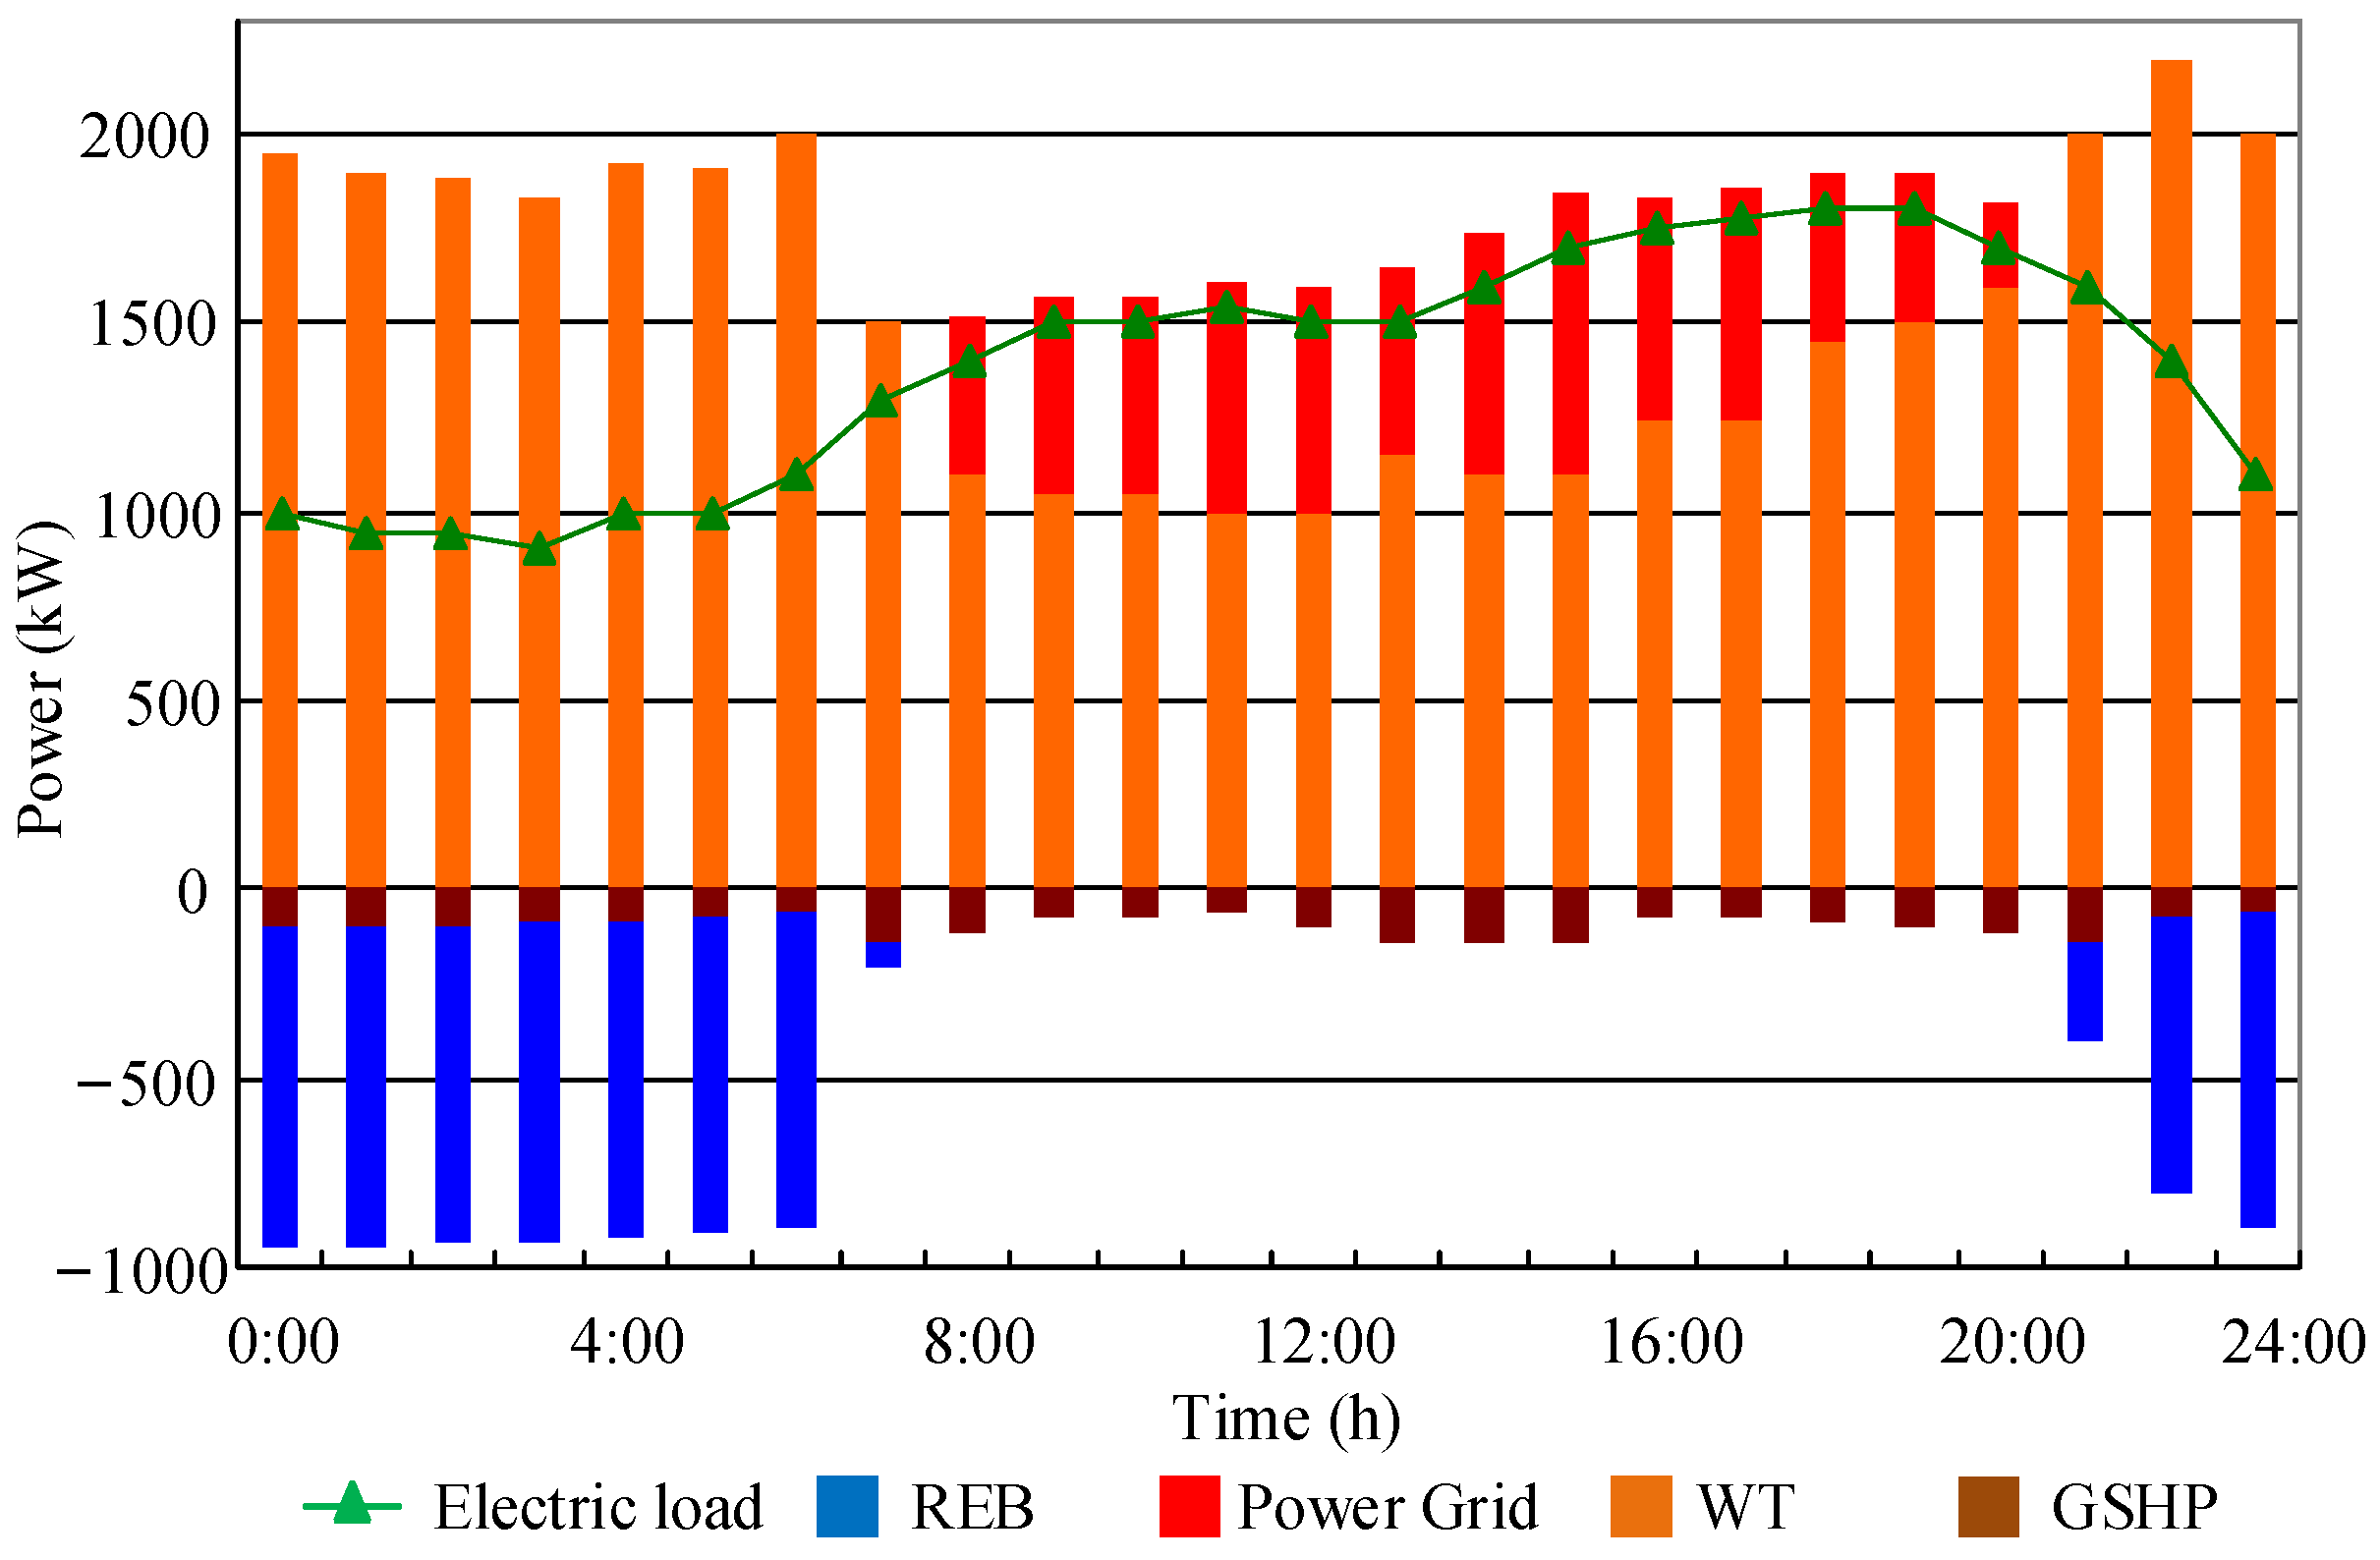
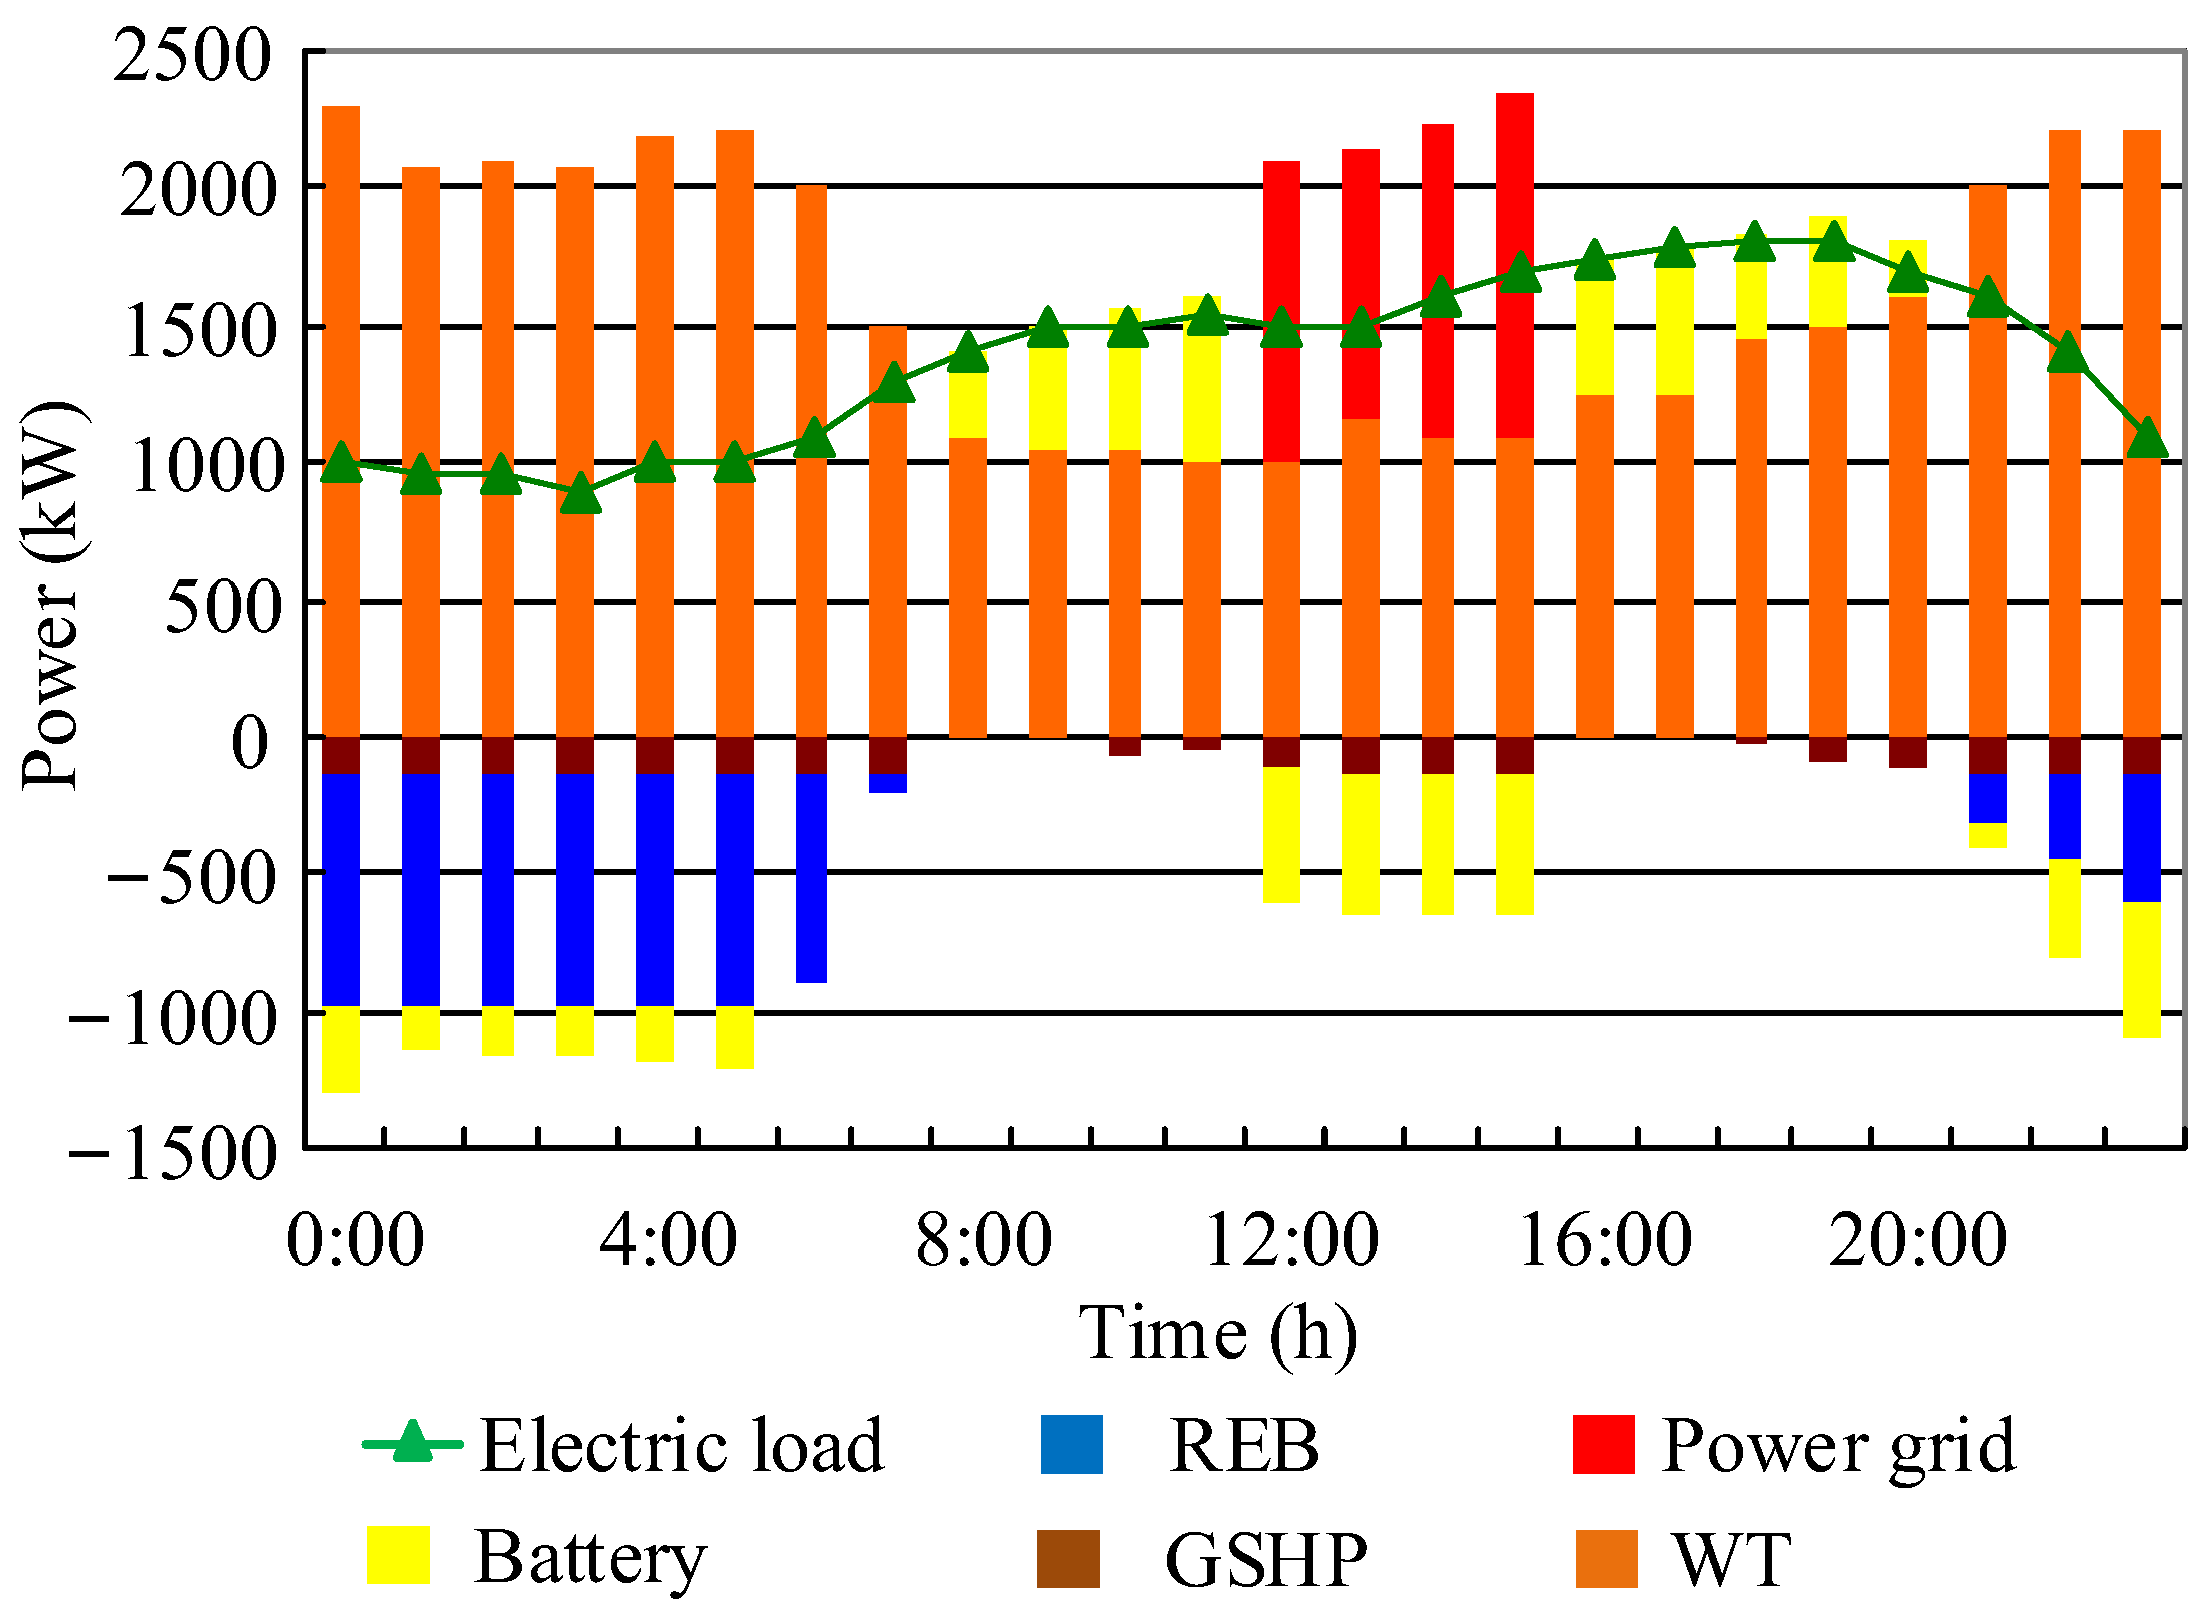
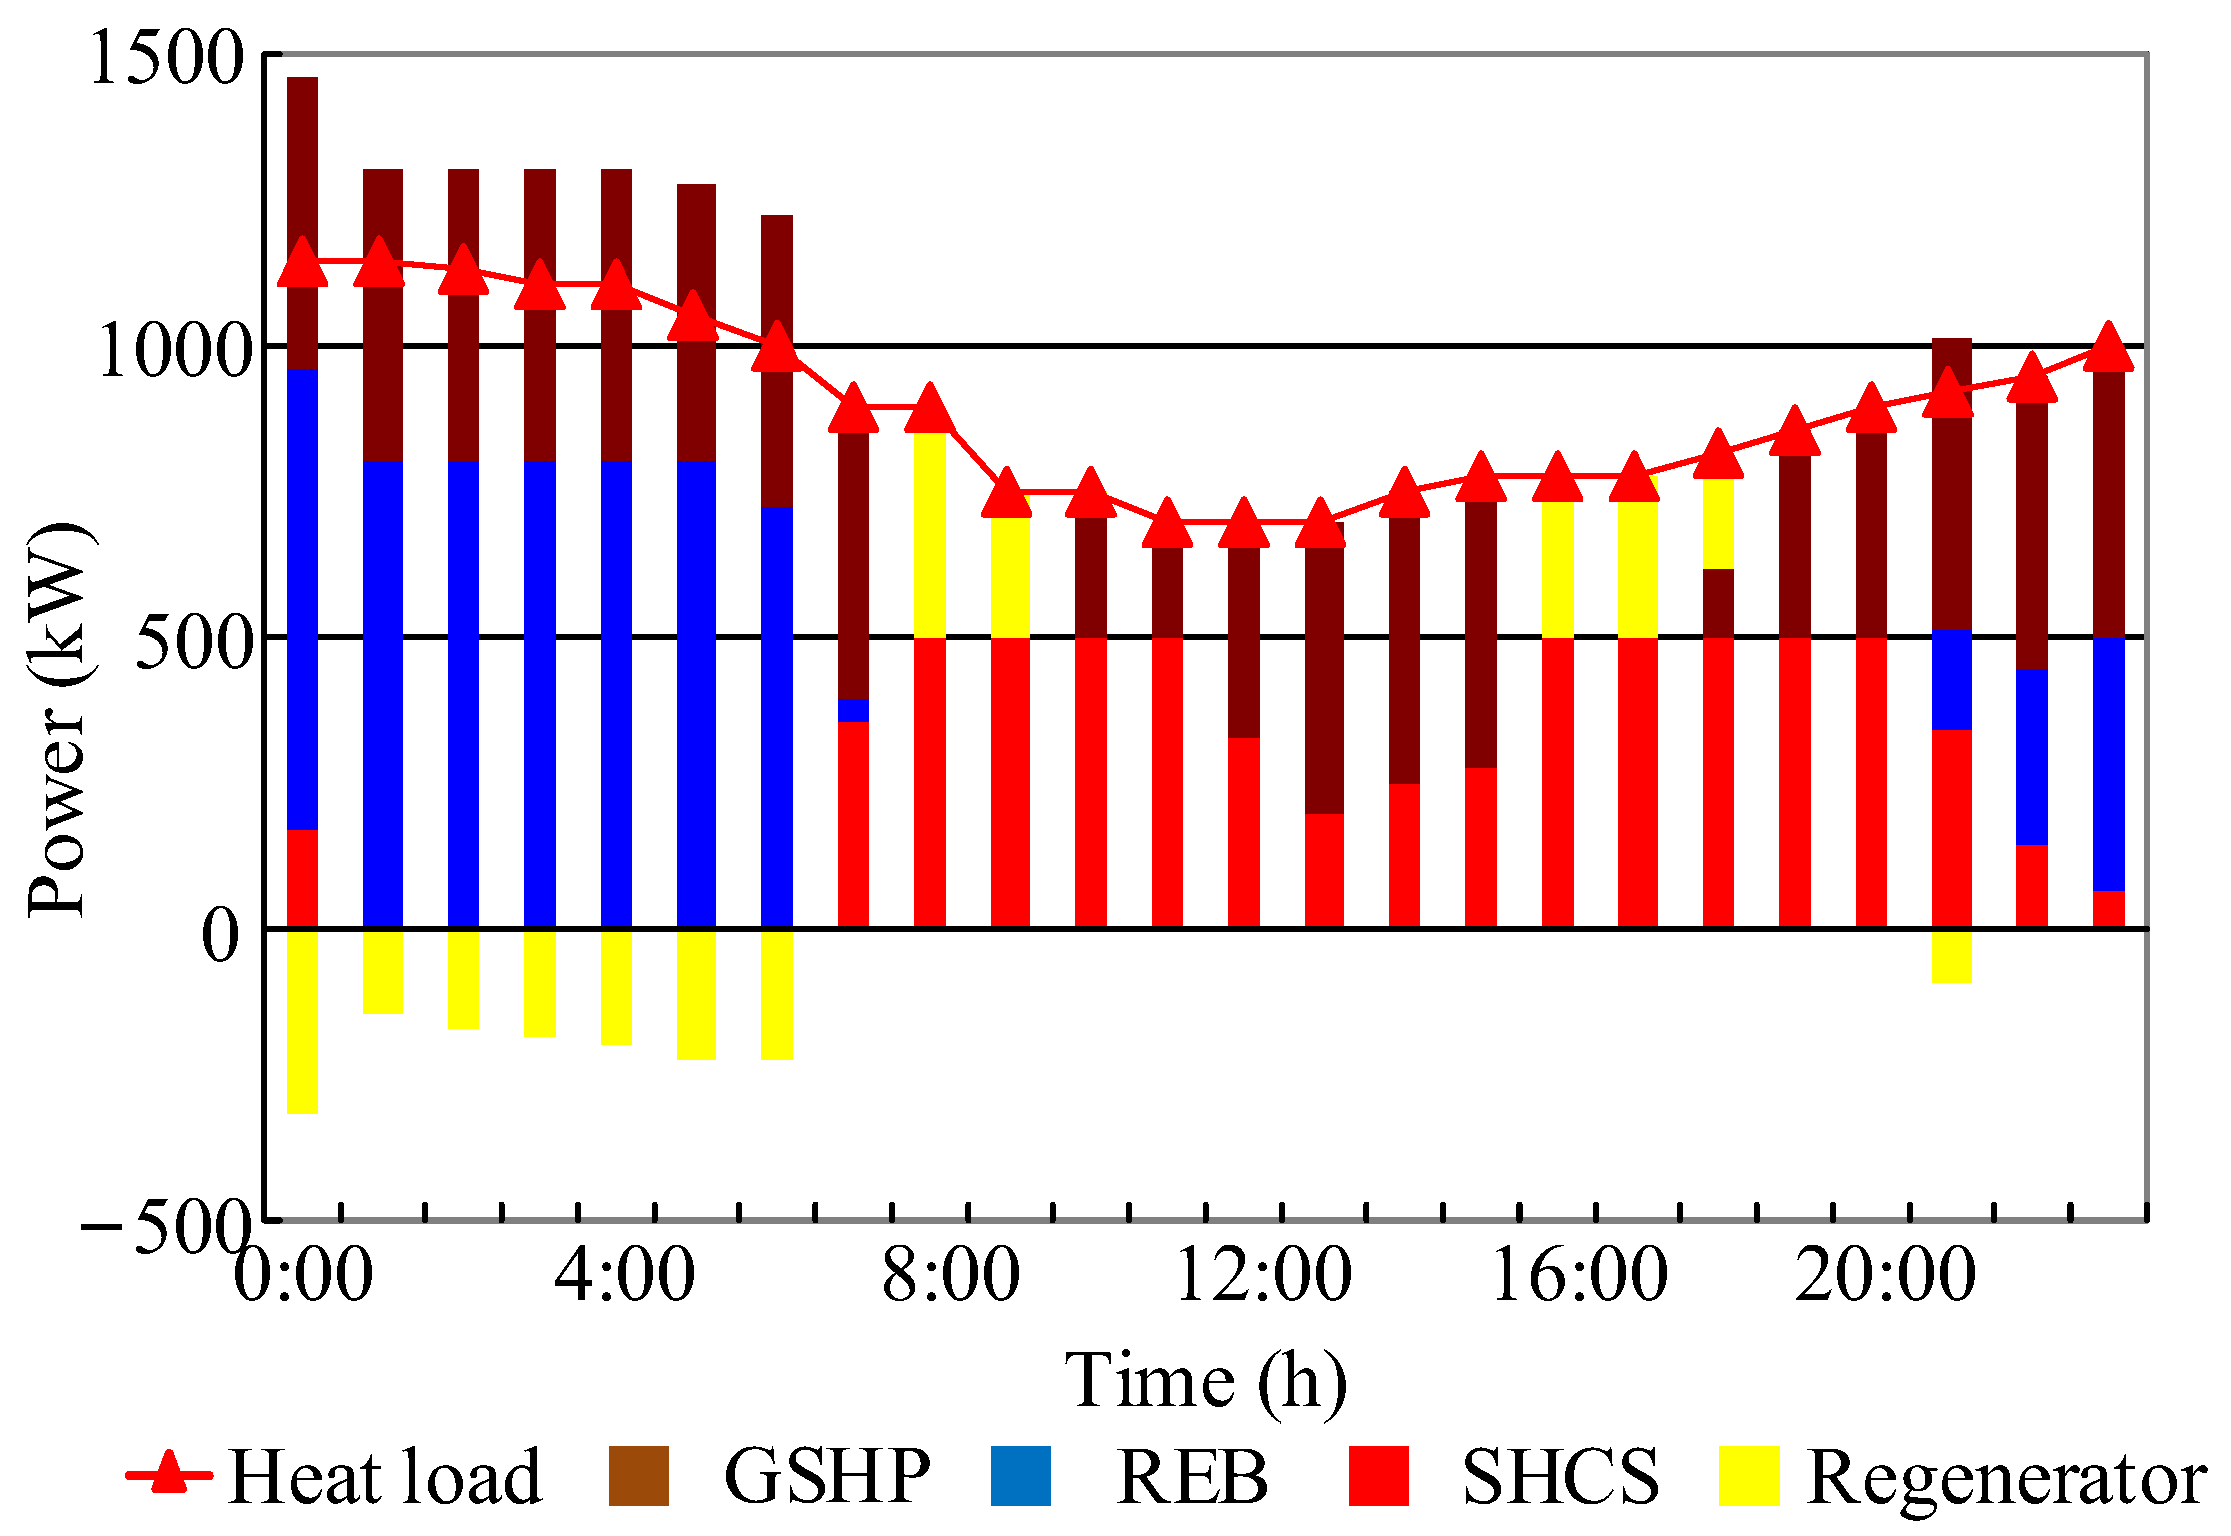
The balance curve of the electricity load and heat load in Scenario 2 is shown in Figure 14 and Figure 15. Moreover, Figure 16 shows the heat balance diagram of the SHCS. The balance curve of the electricity load and heat load in Scenario 3 is shown in Figure 17 and Figure 18. In addition, Figure 19 shows the heat balance curve of the SHCS. There is little difference in the balance curve between Scenario 3 and Scenario 2, but Scenario 3 considers more flexible power load than Scenario 2. The power load curve is smoother, and the optimization result is better.
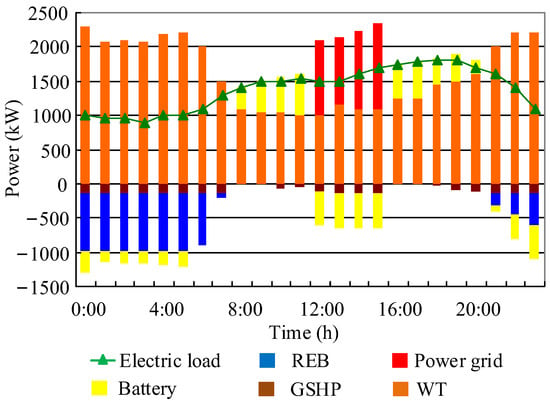
Figure 14.
Scenario 2 power load balance diagram.
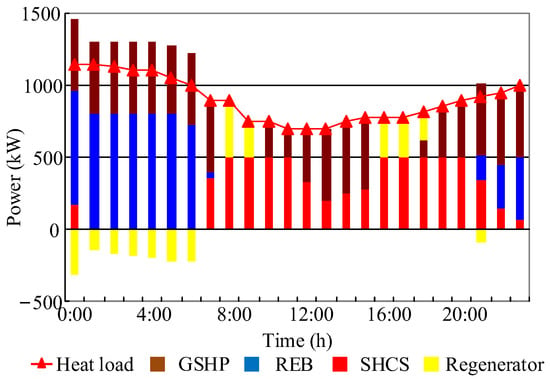
Figure 15.
Scenario 2 heat load balance diagram.
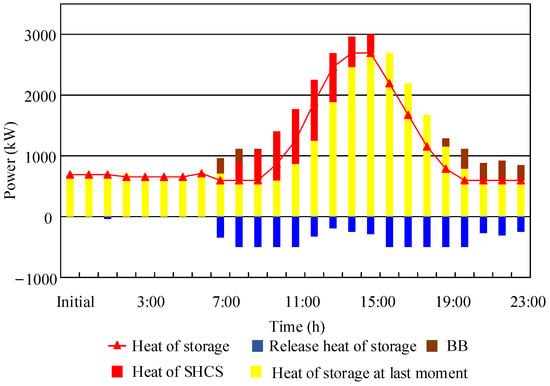
Figure 16.
Scenario 2 output balance of solar collector system.
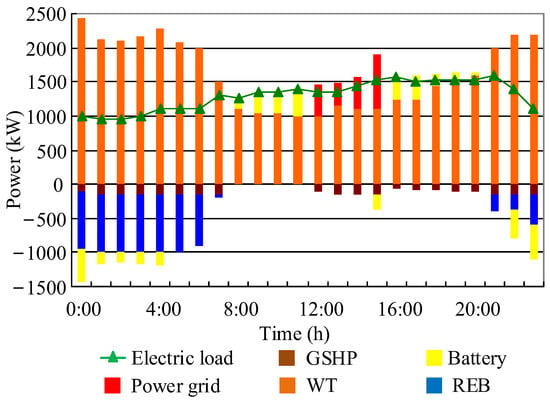
Figure 17.
Scenario 3 electric load balance diagram.
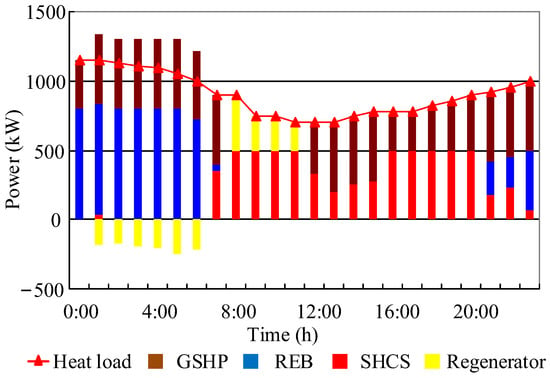
Figure 18.
Scenario 3 heat load balance diagram.
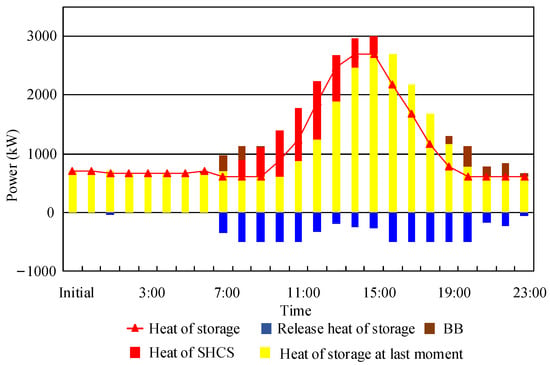
Figure 19.
Scenario 3 output balance of solar collector system.
During the periods of 0:00–08:00 and 21:00–24:00, in Scenario 3, the power generated by WT can store as much energy as possible in the batteries and REB regenerator while ensuring the daily load demand and equipment constraints. This is realized to increase the consumption capacity of wind power while storing energy.
The period from 08:00 to 12:00 and from 16:00 to 21:00:00 is the peak period of the electricity price, and at this time, the power generation of WT cannot meet the daily load demand, so priority is given to using the energy stored in the energy-storage device to supply the user’s demand. In order to reduce the system cost, it is possible to not purchase electricity from the power grid while meeting the load requirements. The electric load in Scenario 3 is optimized between 16:00 and 21:00. Compared with the heat load of Scenario 2, heat is provided by the regenerator of the REB. When the power consumption of Scenario 3 is reduced, the battery discharge can supply the electric load needed for heat generation. This reduces the use of heat storage devices and reduces the loss of equipment and energy.
The period from 12:00 to 16:00 is the normal period of the electricity price. Because the energy in the energy-storage device needs to be given priority to be released at the electricity price peak, it is necessary to purchase electricity from the power grid to meet the load demand and store an appropriate amount of energy to supply the electricity price peak at the same time.
During the period from 21:00 to 24:00, because the constraint conditions of energy storage equipment need to be met in Scenario 2 and Scenario 3, the heating part chooses the SHCS with lower cost to supply heat through auxiliary heat source compared with scenario 1 at this time.
In the whole operation cycle, the flexible load can make the load curve smoother. Determining the state of energy storage charge and discharge under the guidance of electricity price and the output power of WT can reduce the peak-valley difference of load, reduce the operating cost of the system, and further verify the economy of the model.
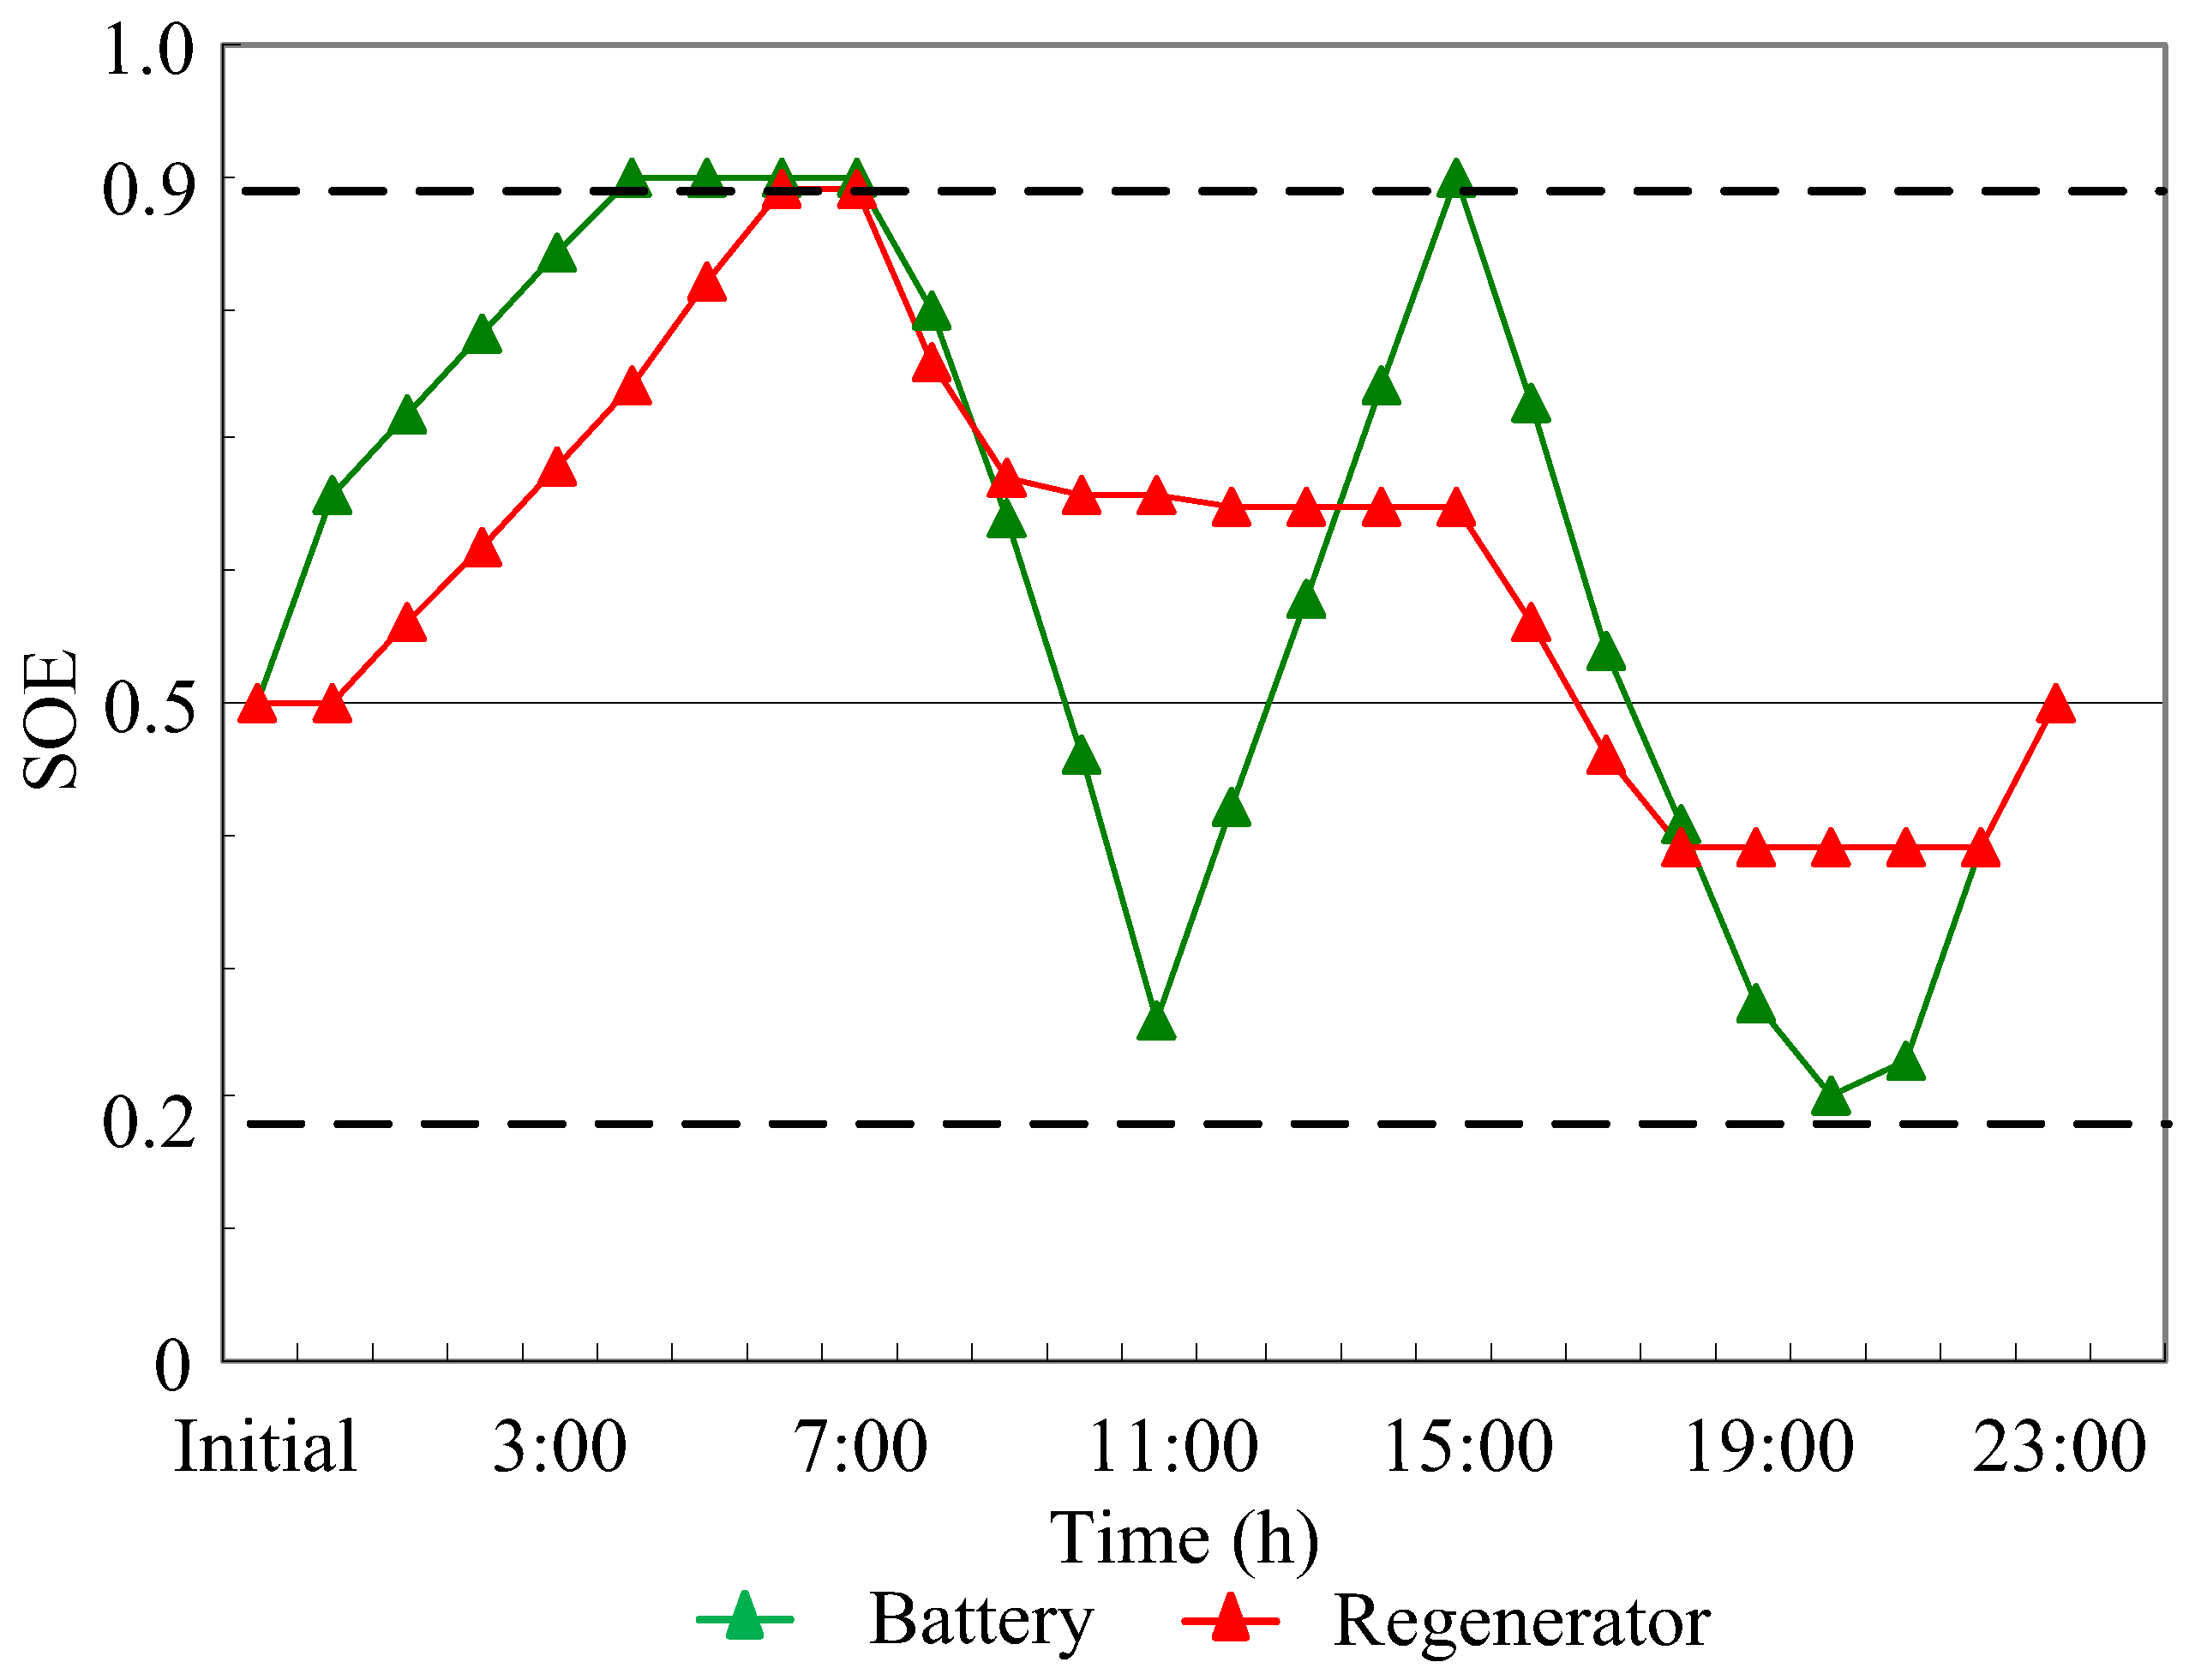
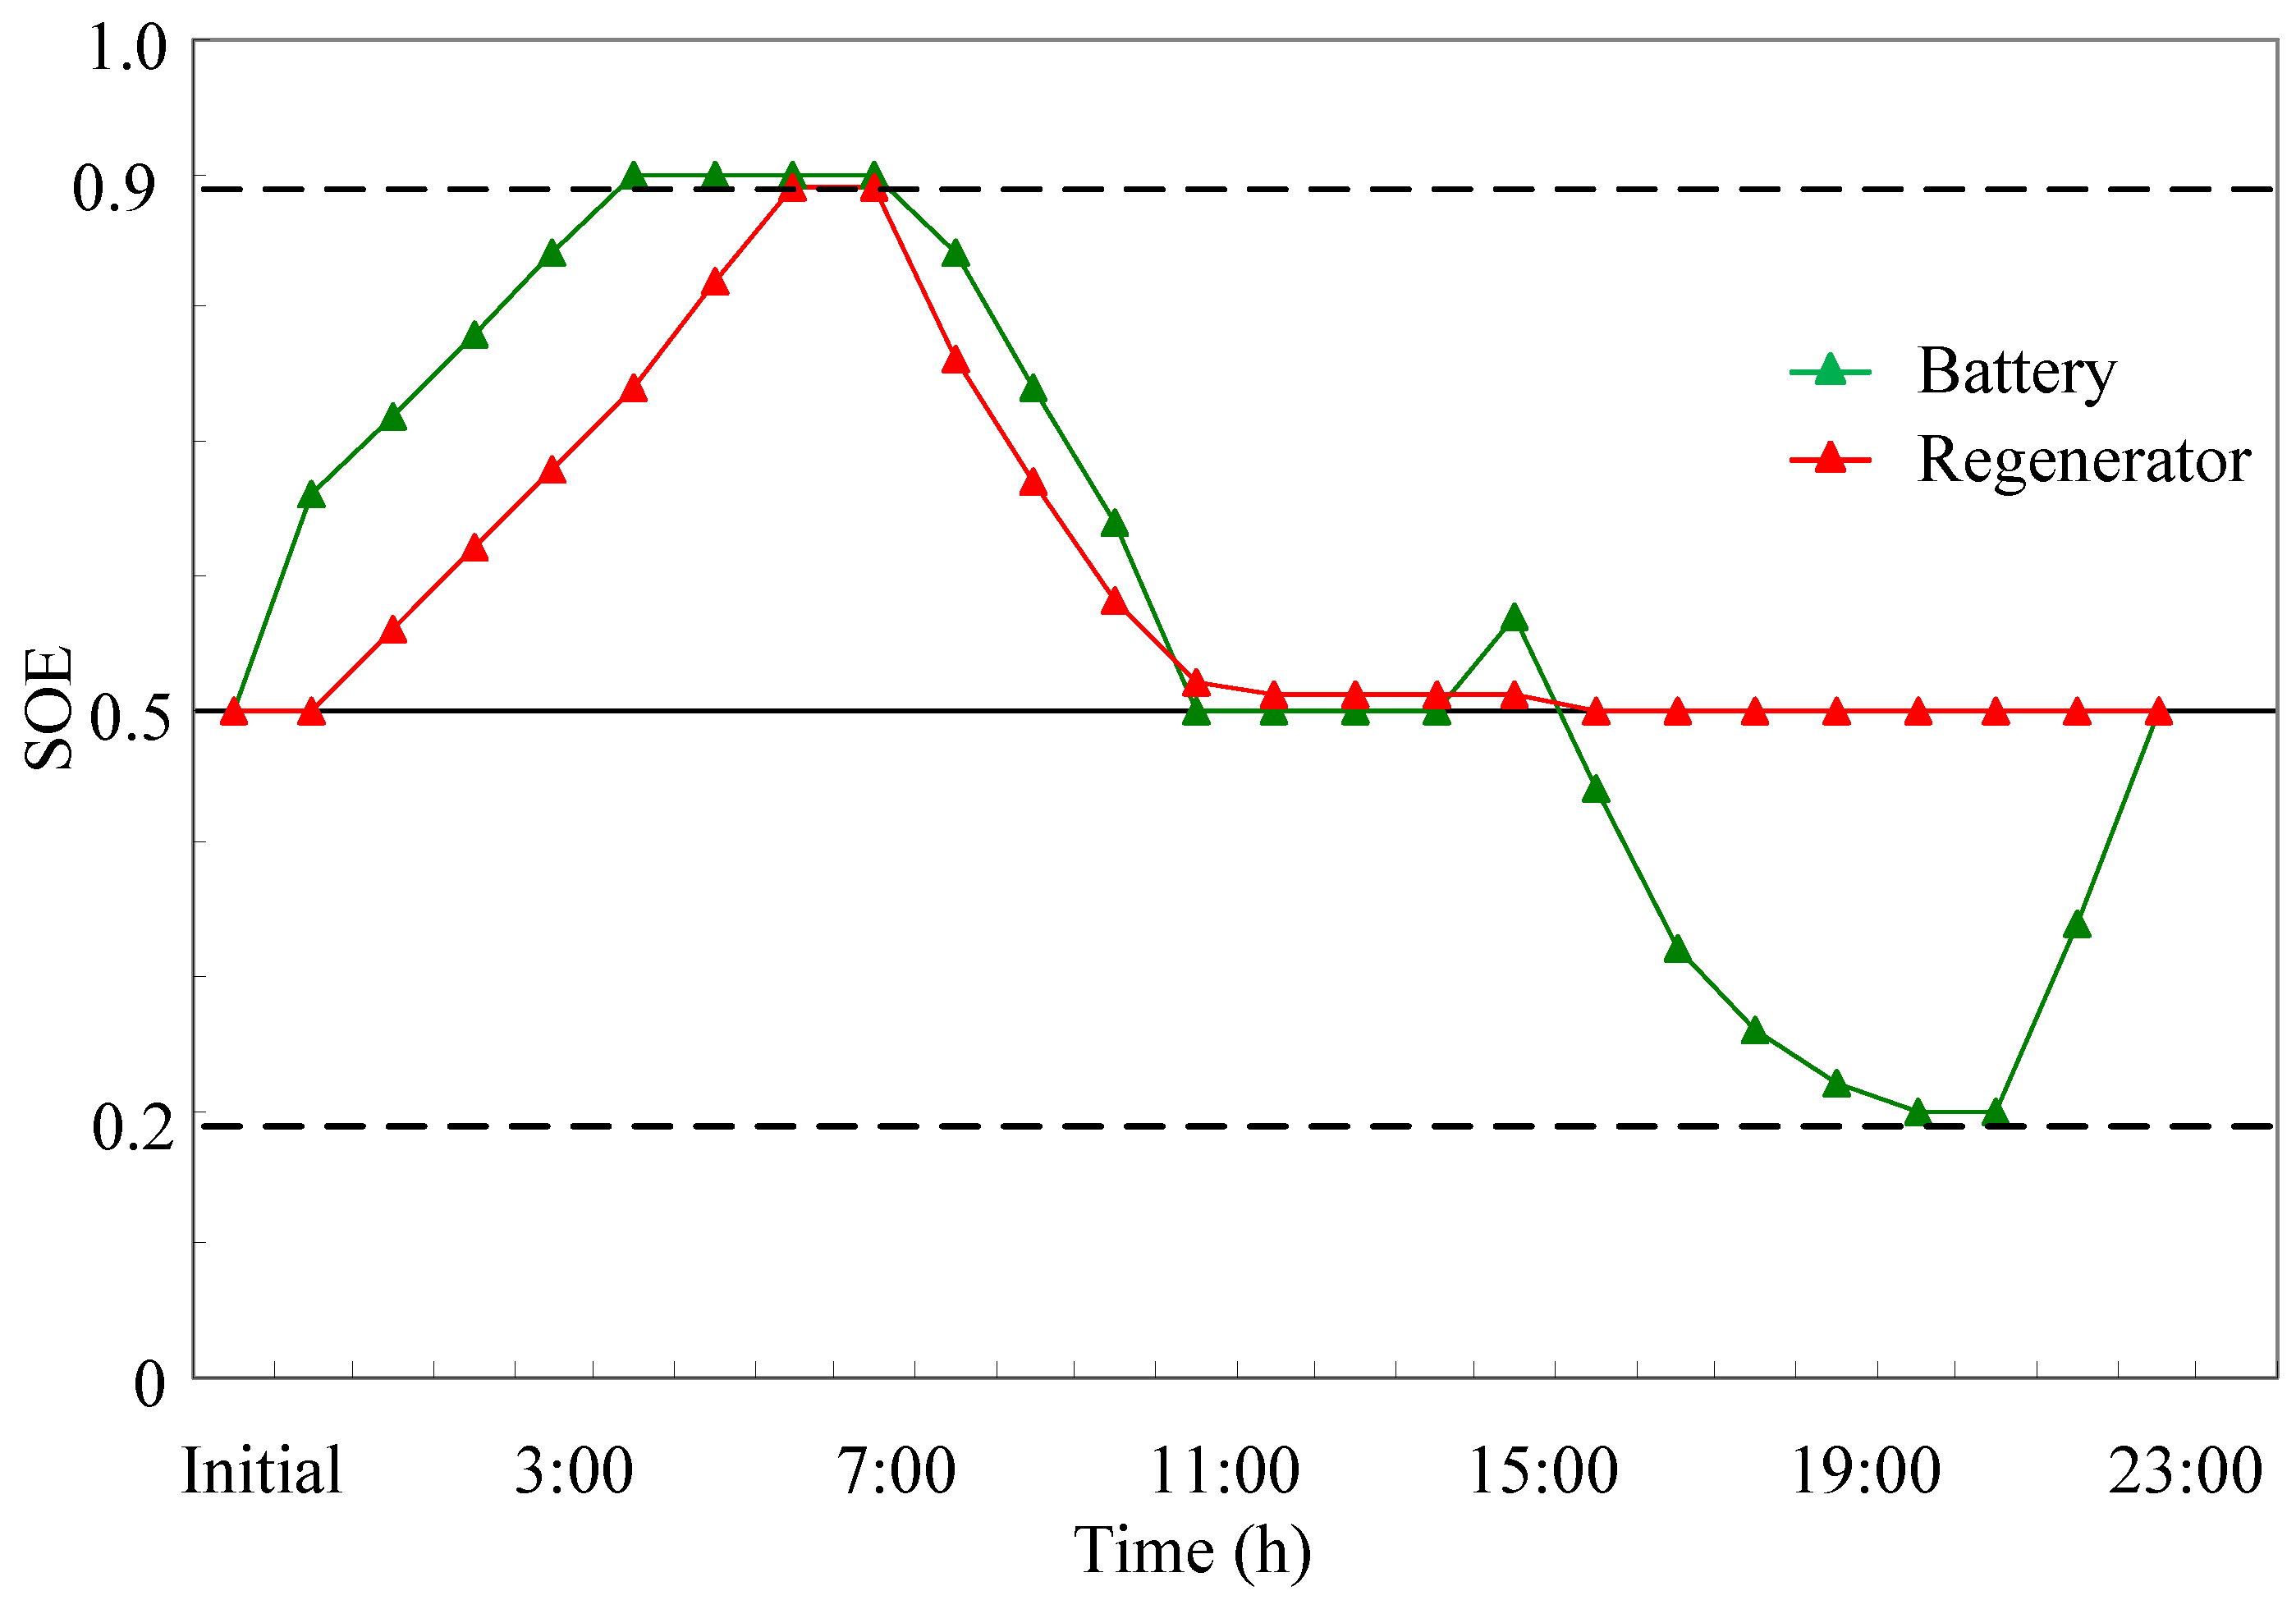
Figure 20 and Figure 21 are the energy storage diagrams of Scenario 2 and Scenario 3, respectively. It can be clearly seen from Figure 17 and Figure 18 that the output power of the energy-storage device in scenario 3 is smoother and the fluctuation is smaller, so the energy storage-device in scenario 3 has less loss and the system is more secure. In Scenario 3, due to the increase in flexible load, the flexible management of user load is realized. As can be seen from Figure 19, in Scenario 2, because there is no flexible load, the battery outputs power at the peak at 8:00–11:00 and charges the battery at 11:00–16:00. As can be seen in Figure 21, in Scenario 3, the battery power is relatively stable and so is the operation of the regenerator.
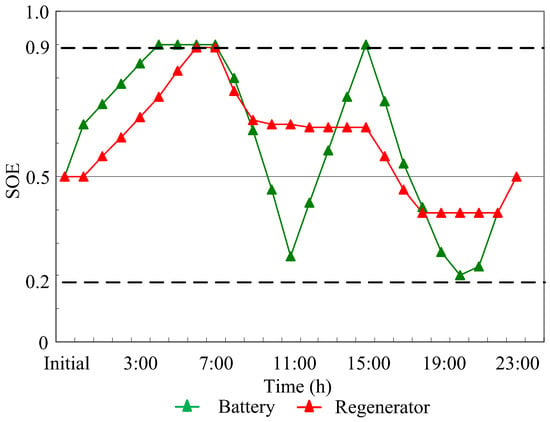
Figure 20.
Scenario 2 storage energy state.
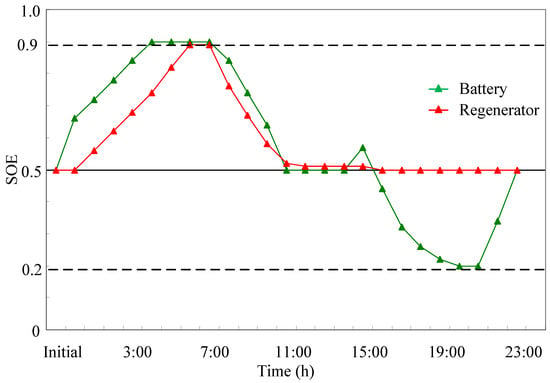
Figure 21.
Scenario 3 storage energy state.
The costs of the system in three scenarios are shown in Table 4. Through the comparison of the scheduling results in Table 4, it can be analyzed that the use of flexible load and energy storage can effectively reduce the cost and improve the consumption capacity of wind power. Compared with Scenario 1, the total cost of Scenario 3 is reduced by 51.5%, and the abandonment cost of wind energy is reduced by 43.3%. Because Scenario 3 contains energy storage and flexible load, the wind power consumption is significantly increased, which plays a positive role in the economy of the system. The cost of operation and maintenance in Scenario 1 is lower, because the energy-storage equipment is added in Scenario 2 and Scenario 3 and the utilization rate of wind power is high, so the operation and maintenance cost of the equipment is higher. The energy-storage devices in Scenario 2 and Scenario 3 store energy as much as possible during the period of abundant wind power and electricity price valleys, so the SHCS is required to provide more heat than Scenario 1 to meet the heat load demand, resulting in an increase in fuel costs.

Table 4.
Operating costs under three scenarios.
4.3. Influence of Power and Capacity of Energy-Storage Equipment on the System
In order to further verify the advantages of introducing an energy-storage device into the electric–thermal IES, on the basis of Scenario 3, the capacity and charge and discharge power of the battery are increased to 4000 kW and 1000 kW, respectively. The REB is equipped with 1500 kW, and the maximum heat storage of the REB is 4000 kW in Scenario 4. The operating costs of Scenario 4 are shown in Table 5.

Table 5.
Operating costs in Scenario 4.
The total operating cost of Scenario 4 is as much as 75.8% lower than that of Scenario 1, and the wind power is completely absorbed, but the operation and maintenance cost is increased. Although the scheduling effect of Scenario 4 is better, considering that the increase in equipment under the actual working conditions will increase the investment cost, it is necessary to configure the installation scale of the equipment reasonably according to the actual situation.
4.4. Influence of Power and Capacity of Energy-Storage Equipment on the System
The power output of WT and SHCS are affected by weather factors, and the prediction of wind power output has a strong uncertainty. In the actual system decision-making, it is often difficult to obtain an accurate probability density function, but it is relatively easy to obtain the range of uncertain variables, and the information needed is greatly reduced. In this paper, interval linear programming is used, which is an effective method to deal with uncertainty.
Figure 22 and Figure 23 show the uncertainty intervals of wind power and solar heat generation, respectively. Table 6 shows the cost range of Scenario 3 under different new energy fluctuations.
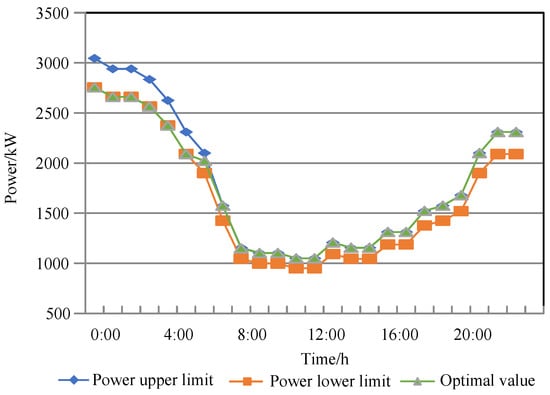
Figure 22.
Uncertainty interval of wind power output.
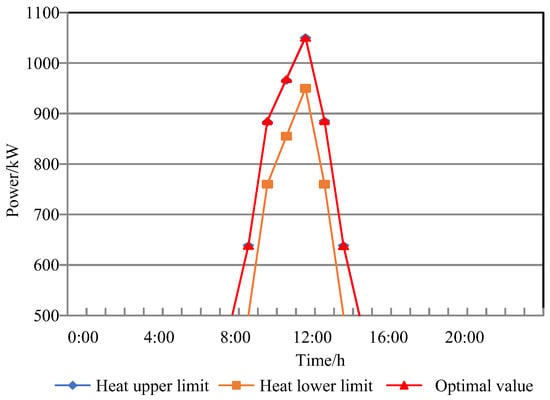
Figure 23.
Uncertainty interval of SHCS output.

Table 6.
The results of day-ahead economic operation under different fluctuations of new energy.
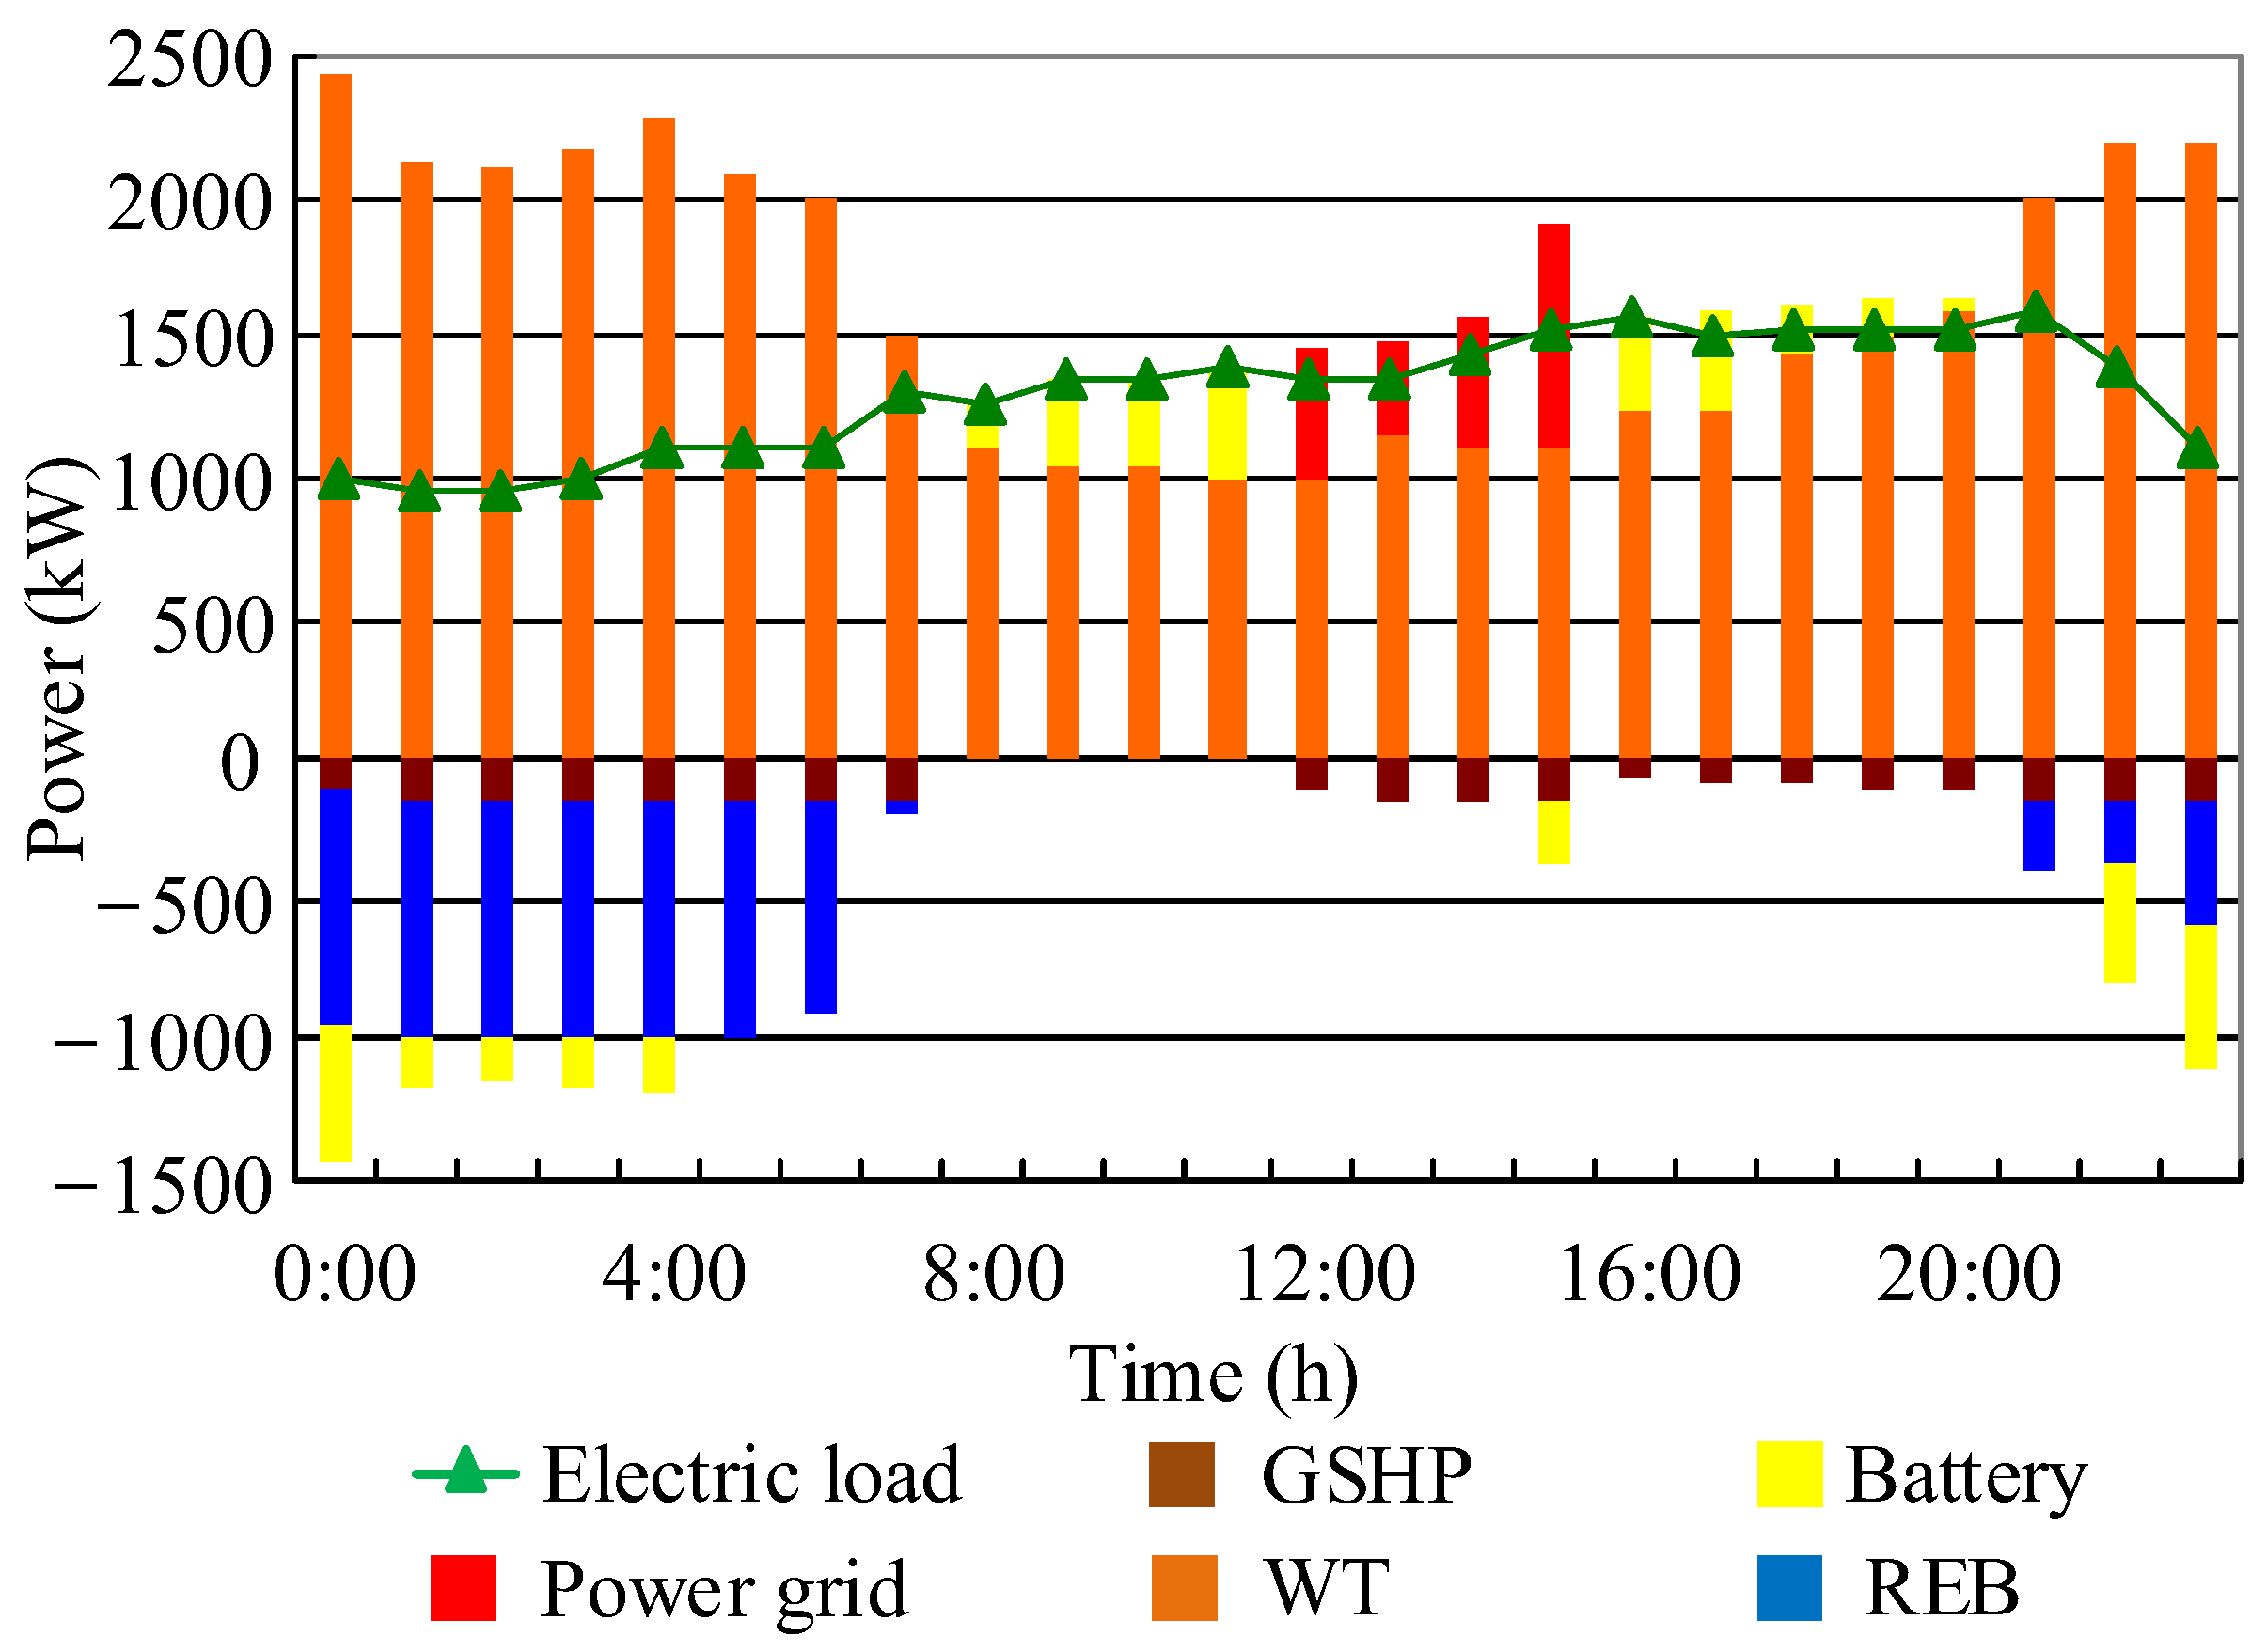
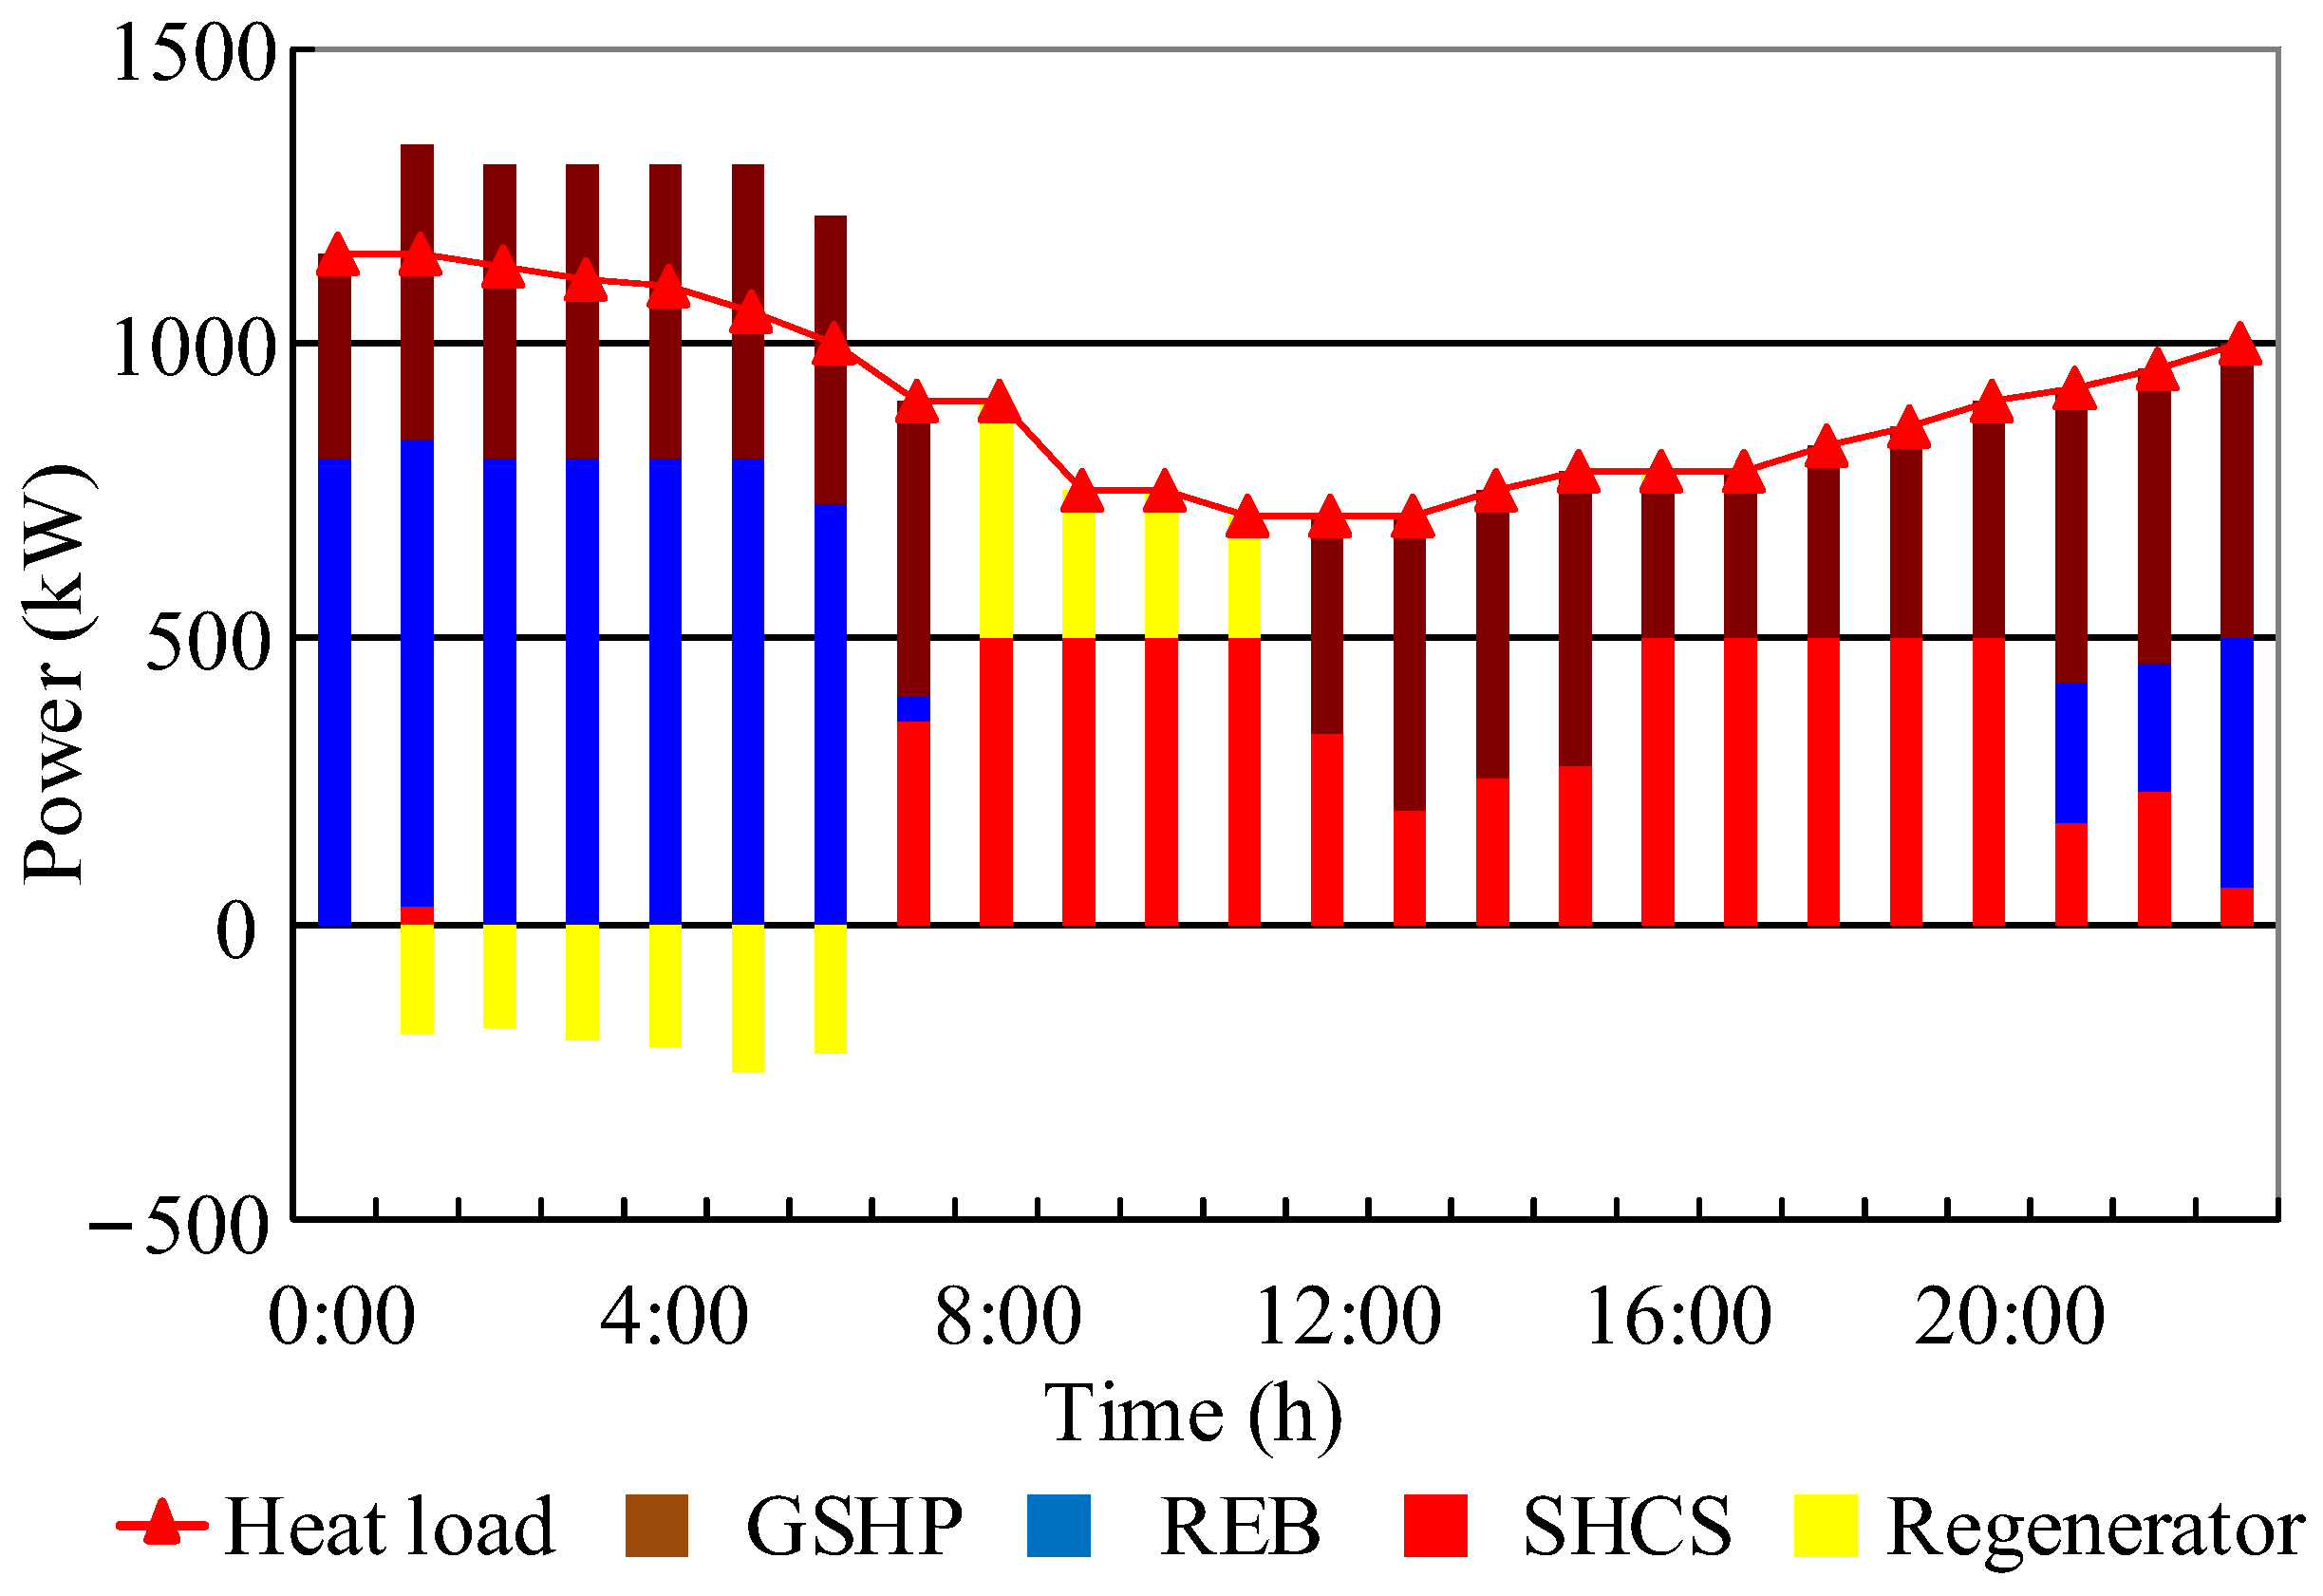
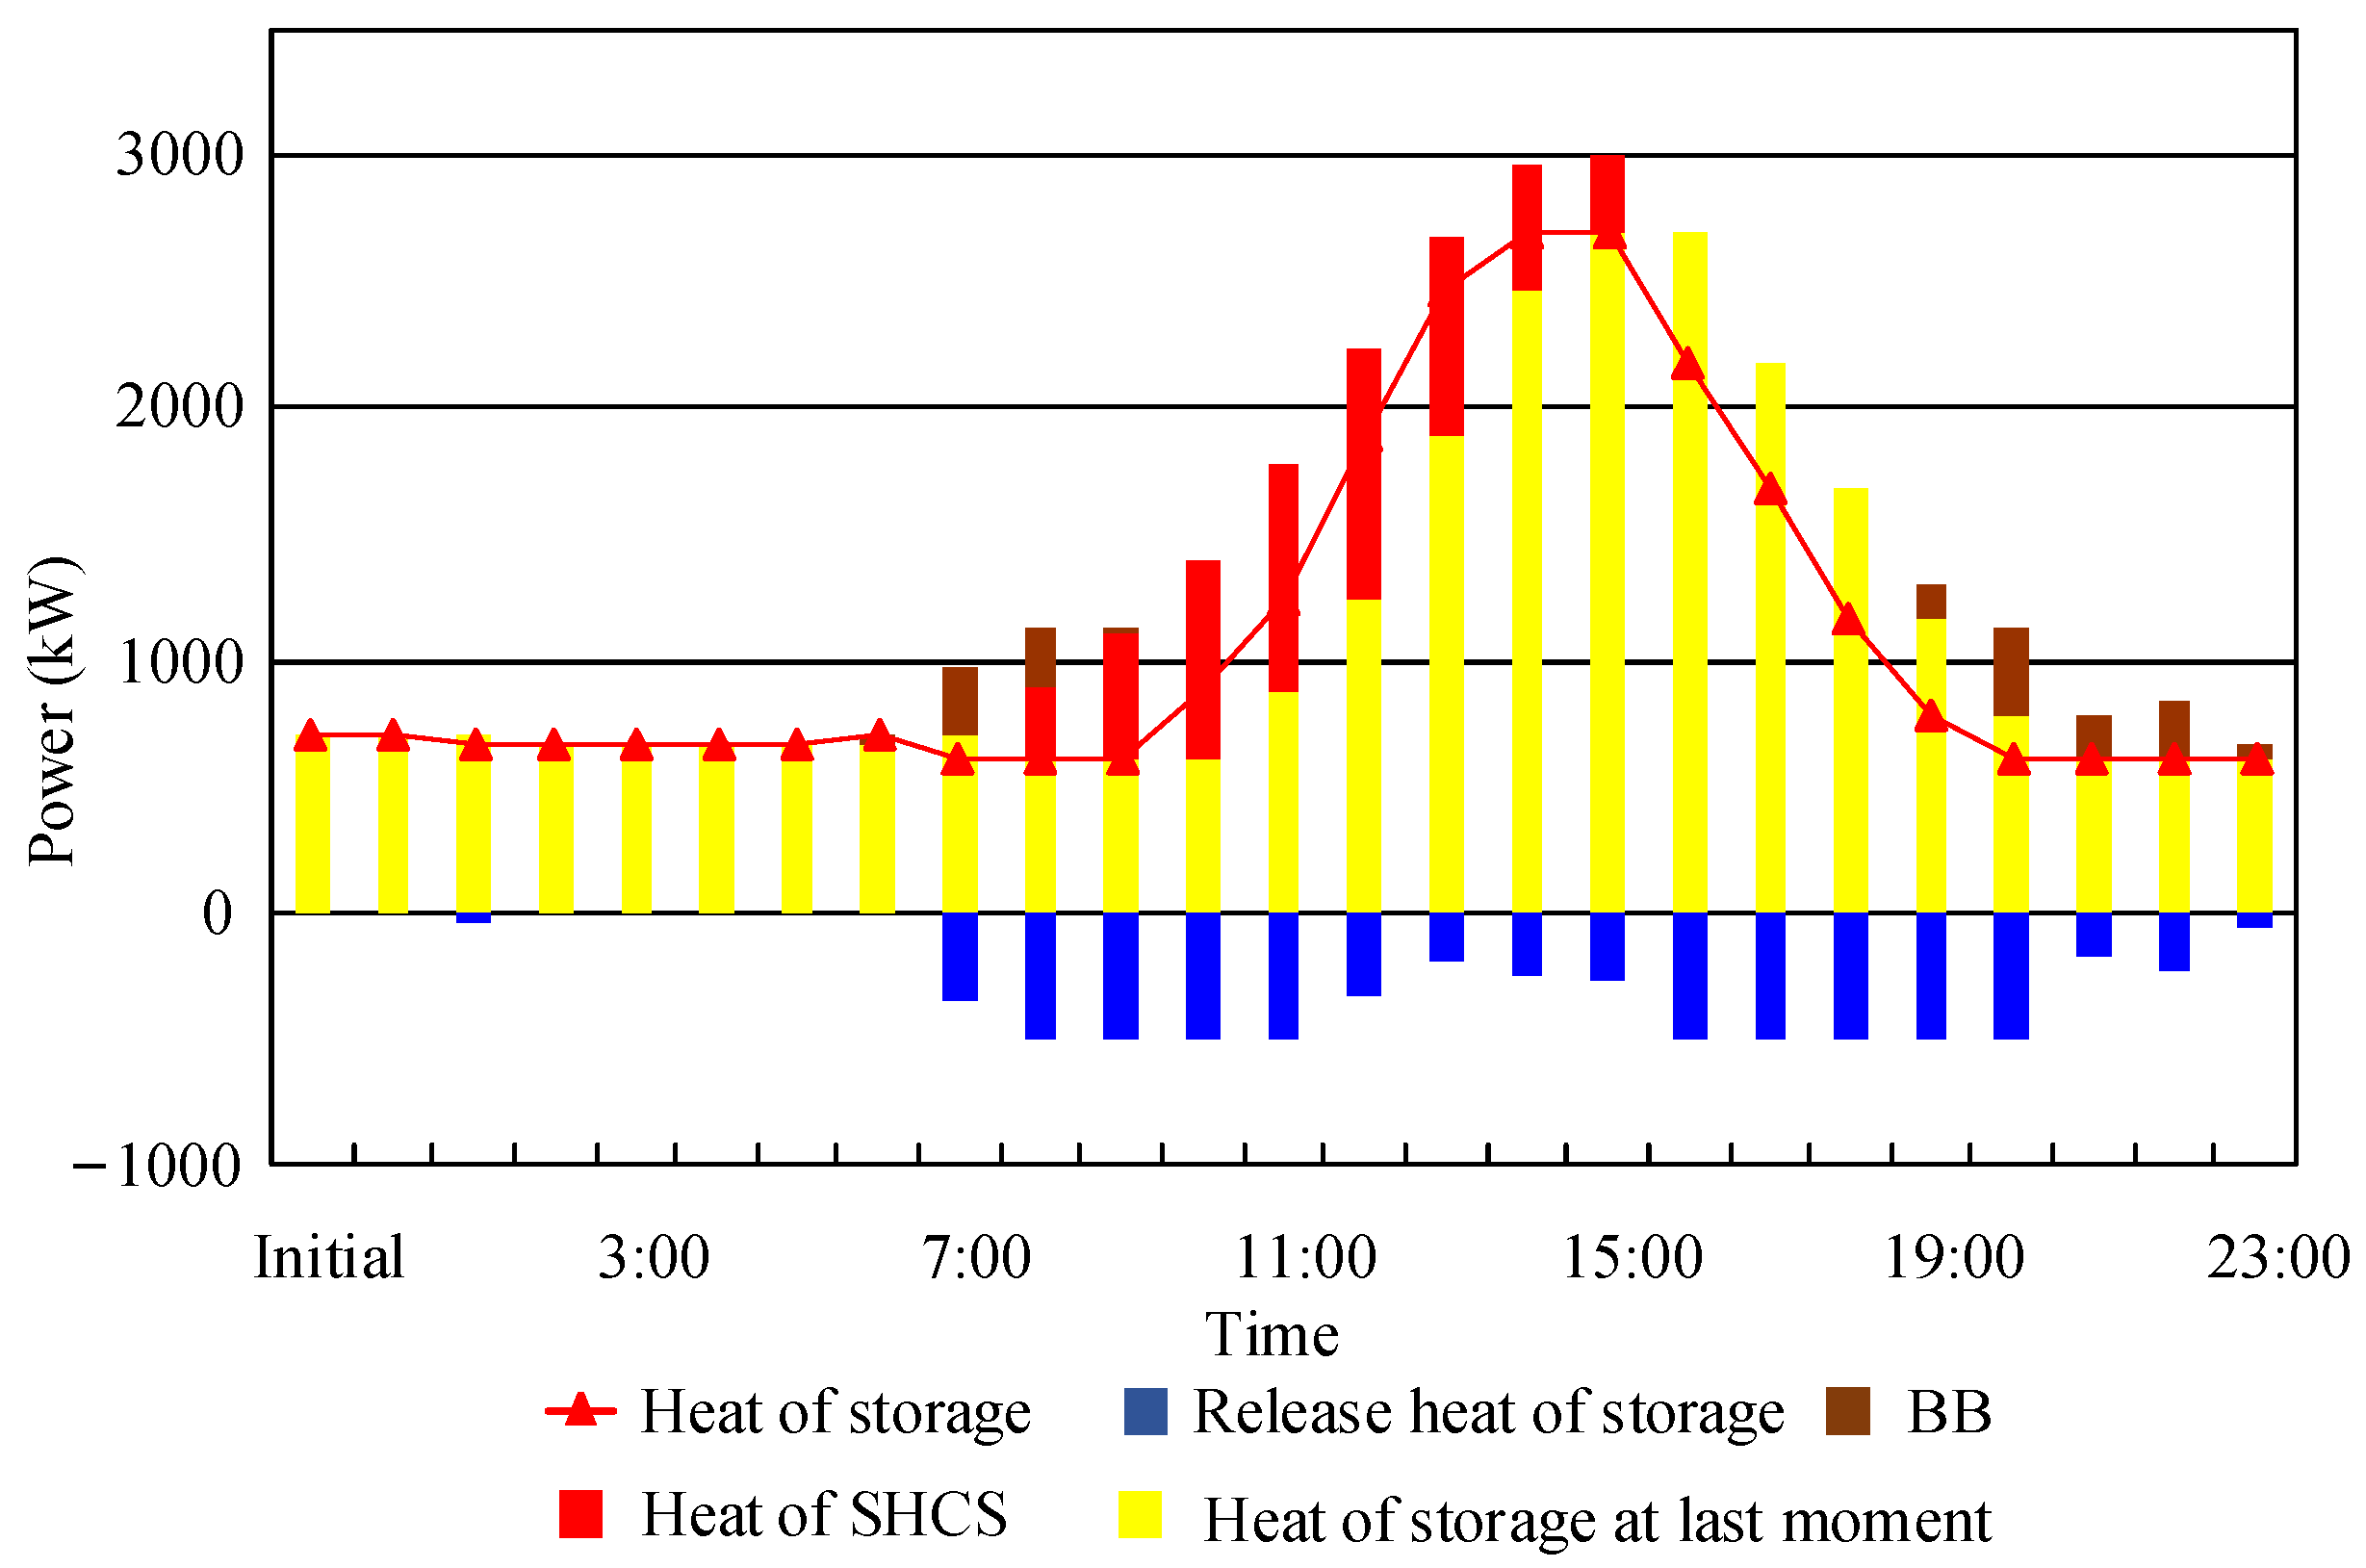
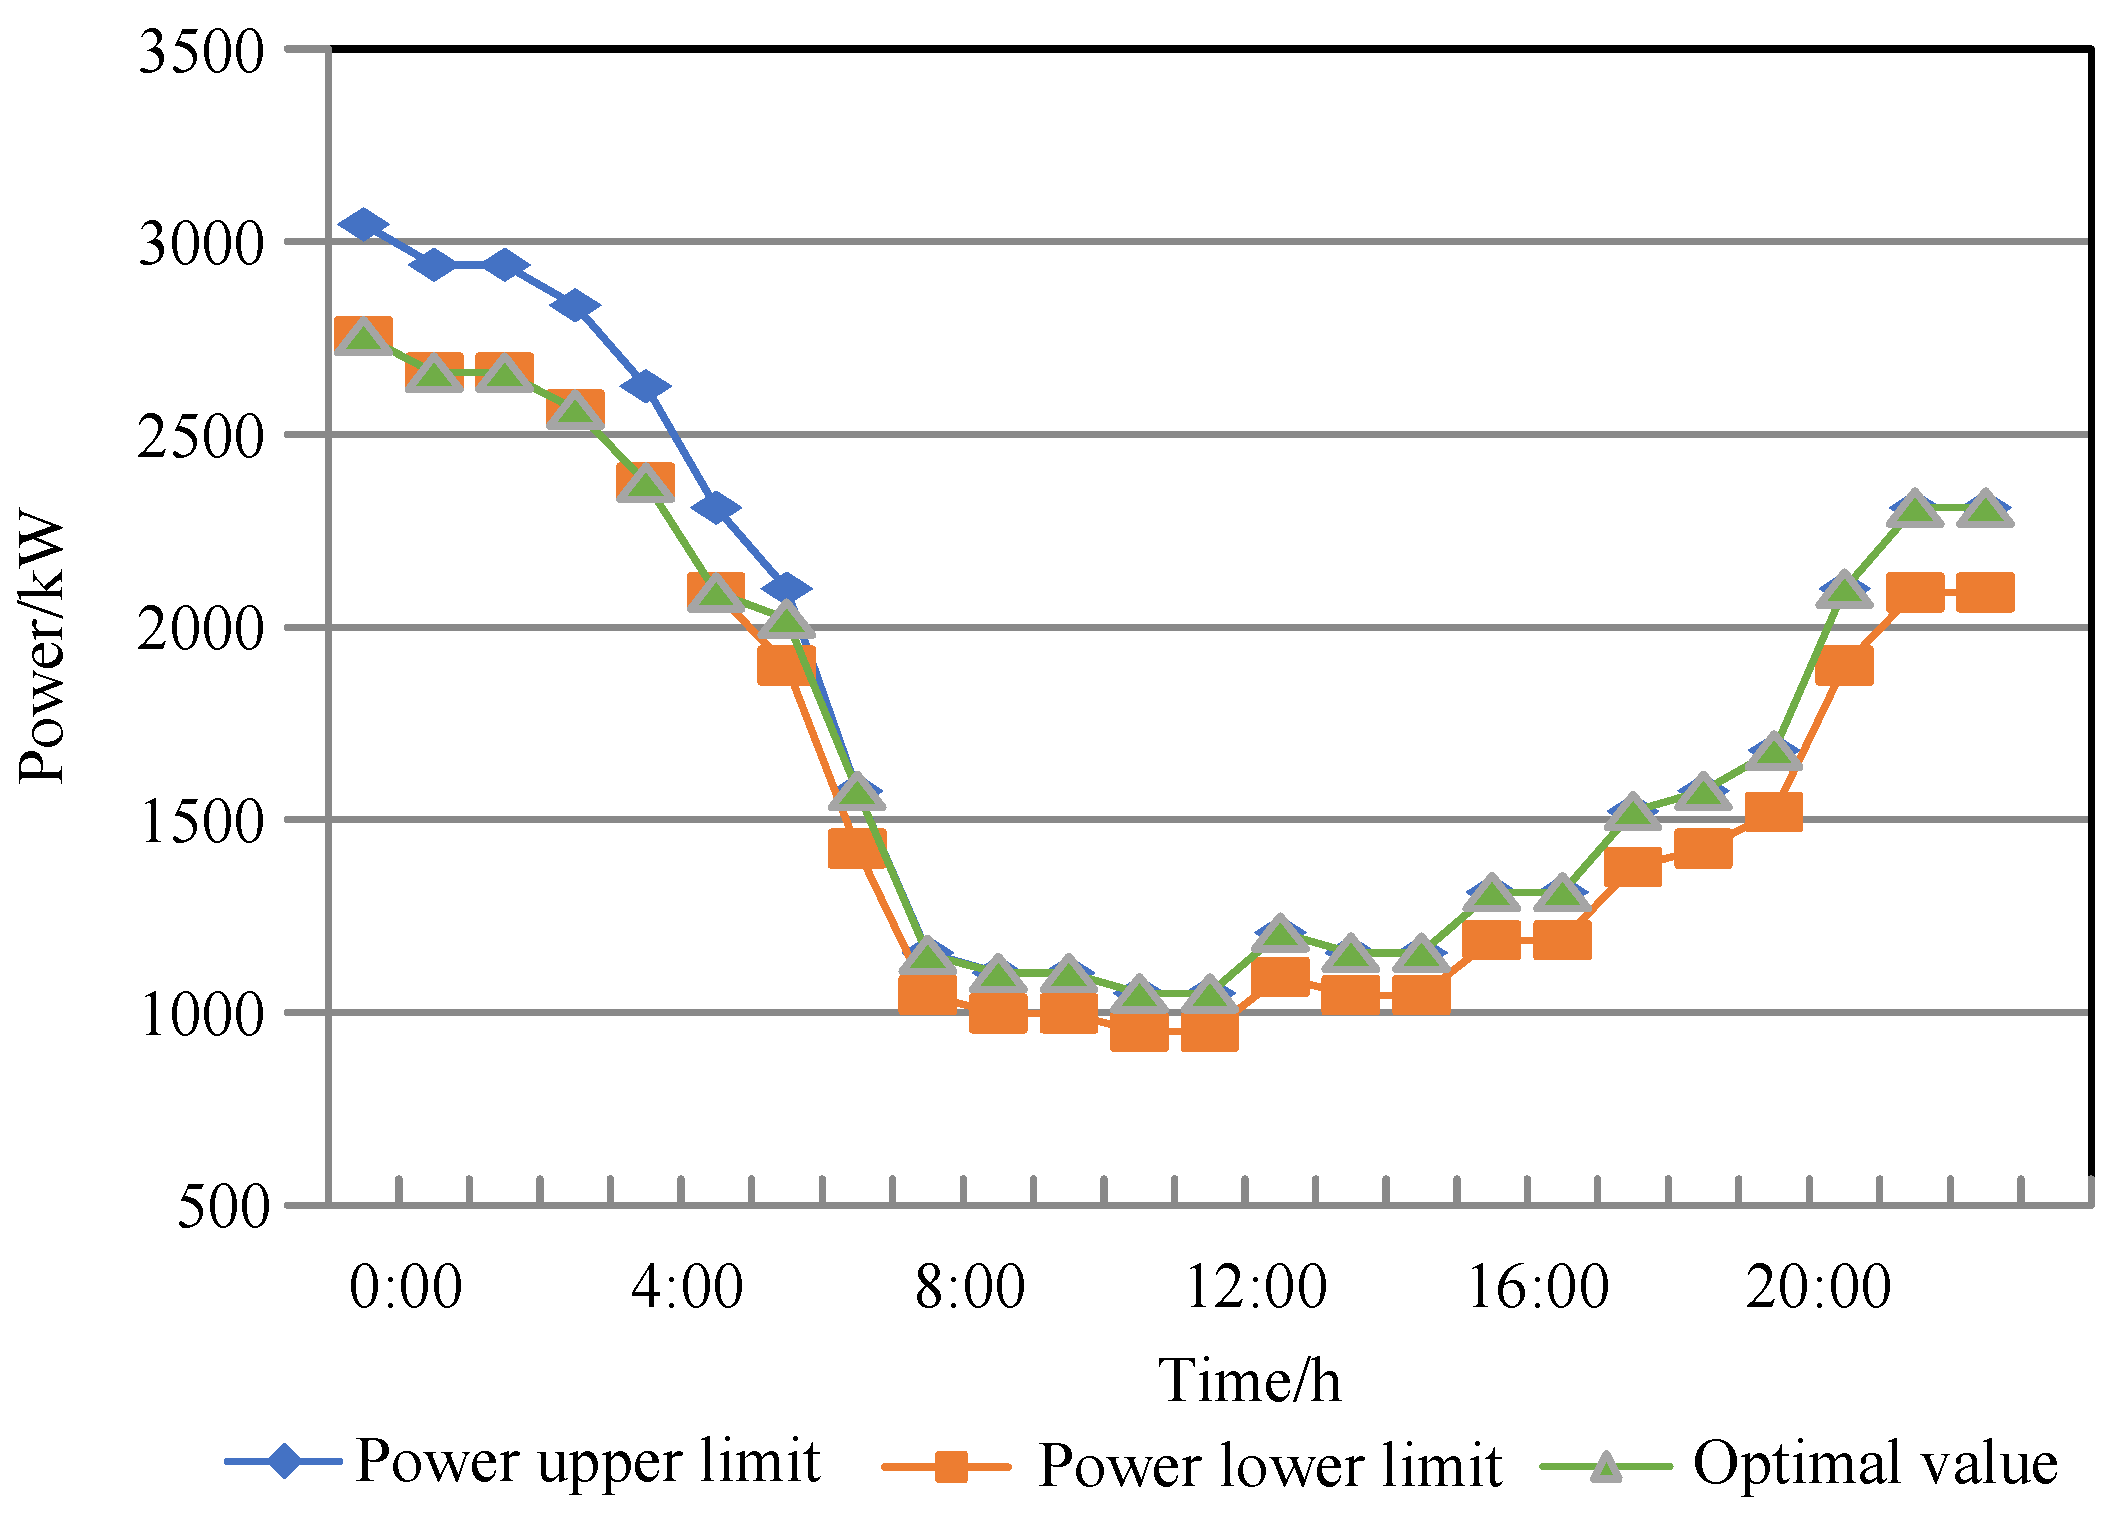
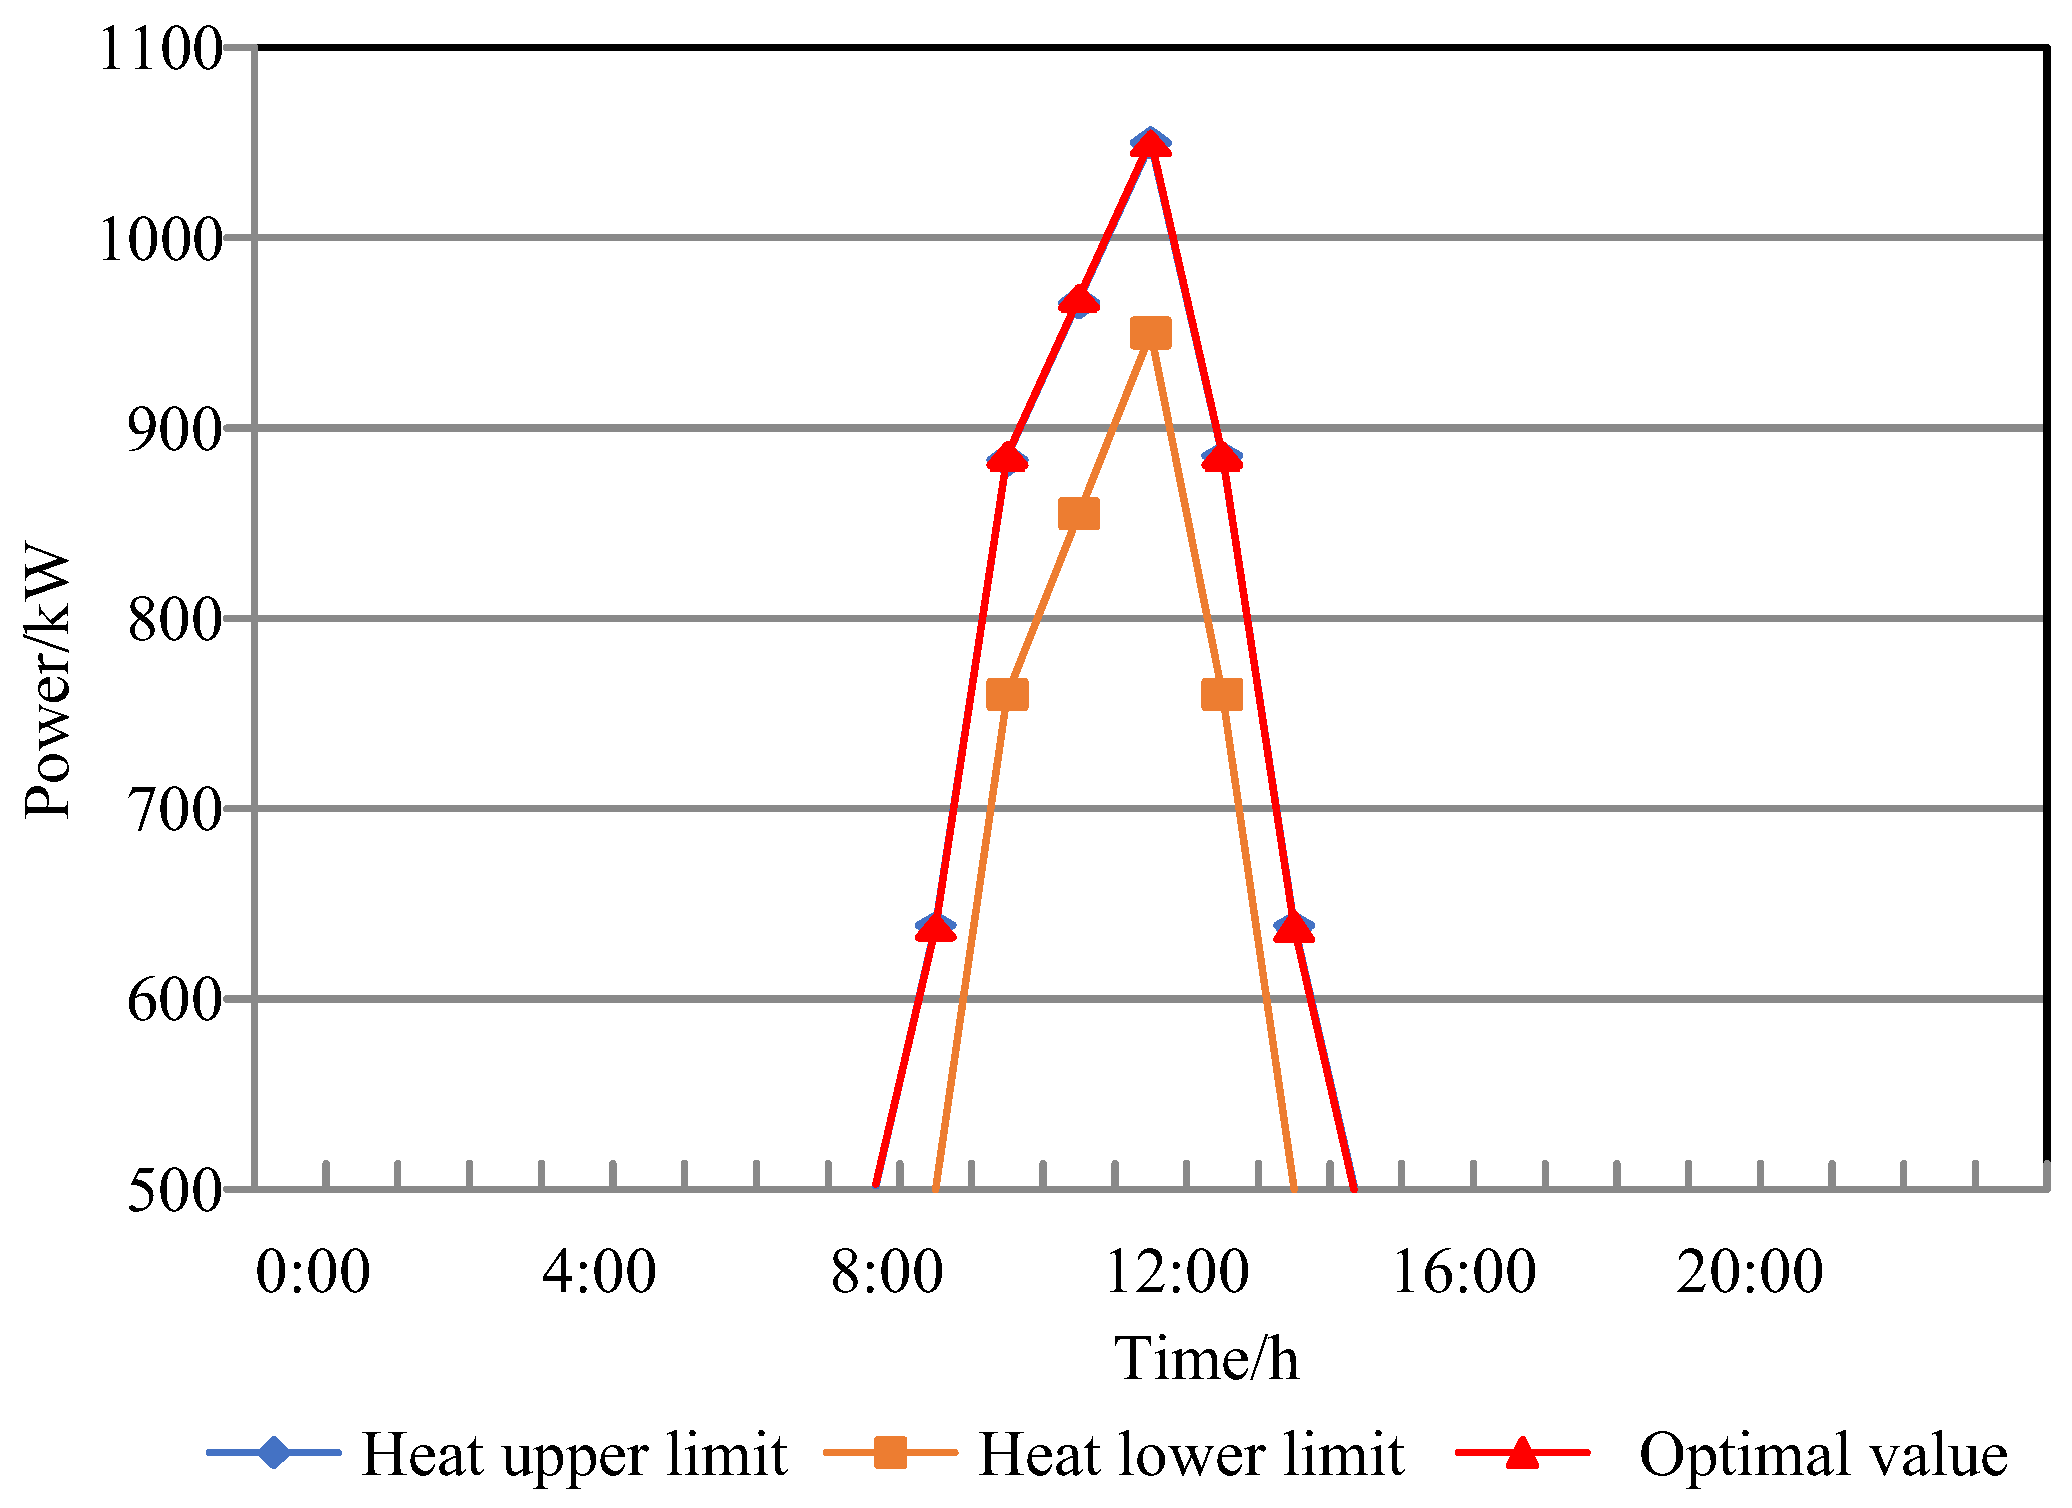
Figure 24, Figure 25 and Figure 26 show the optimal scheduling of Scenario 3 with the lowest total cost for the system when the fluctuation of renewable energy is 5%.
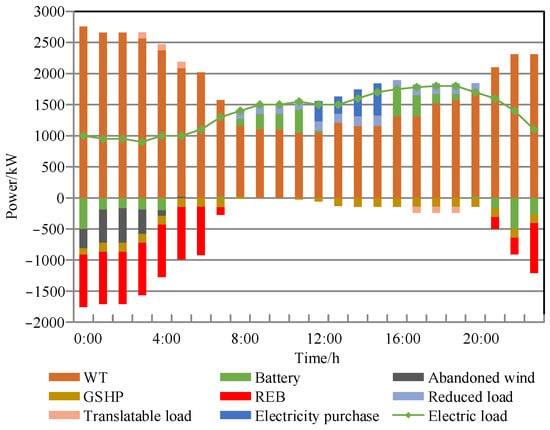
Figure 24.
Electric power balance diagram.
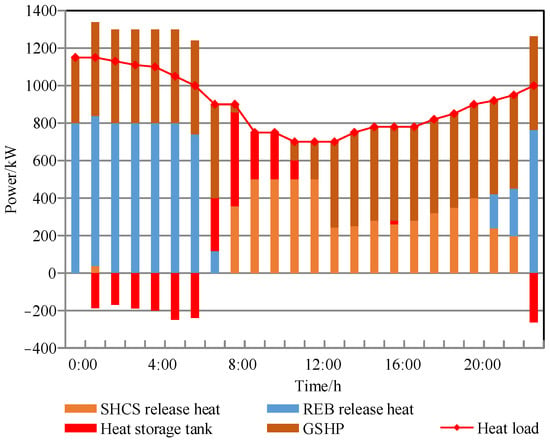
Figure 25.
Heat power balance diagram.
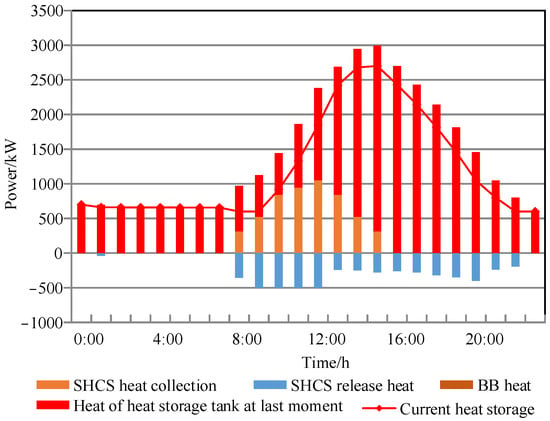
Figure 26.
SHCS heat power balance diagram.
As can be seen from the comparison between Table 6 and Figure 24, Figure 25 and Figure 26, the uncertainty of fluctuations in renewable energy will have an impact on the total cost. In the case of different fluctuations in renewable energy, there is a significant gap between the cost of purchasing electricity and the cost of abandoning wind. Because the fluctuation of renewable energy becomes larger and the range of data becomes wider, that is, it can meet the daily electricity demand at the same time, reducing the supply of wind power so as to achieve the low cost of purchasing electricity while abandoning the wind is also the lowest. It can be seen from Figure 24 that wind power generates too much electricity during the period from 0:00 to 5:00, so the interval minimum is selected to avoid excessive abandonment cost. In the following period of time, the wind power generation decreases and the load demand increases, so choose a larger value in the interval. It can be seen from Figure 25 that solar energy produces less heat and has sufficient heat storage capacity, so the maximum value of solar heat generation interval is selected. The gradual increase in operation and maintenance costs is due to the increase in the use of equipment of WT and SHCS, resulting in an increase in operation and maintenance costs. The lower limit of the compensation cost decreases with an increase in the fluctuation of new energy because of the fluctuation in wind power. By increasing the supply of wind power to reduce the amount of reduced load and translatable load to reduce the compensation cost, we can see the obvious reduction of the reduced load in Figure 24. The optimal lower limit of the fuel cost is 0 because of the increase in renewable energy supply, and the BB is no longer needed to replenish heat. It can be seen from Figure 26 that the output power of biomass boilers is 0. The optimal value of the fuel upper limit increases with the increase in new energy fluctuations because the supply of WT and SHCS becomes lower, which requires the BB to provide more heat.
Compared with that in Scenario 3, the capacity of the REB and batteries in Scenario 4 is larger. As can be seen from Figure 24, Figure 25 and Figure 26, in order to absorb more wind power, the electrothermal conversion rate of the REB is lower. Therefore, in the case of abundant wind power, the output of the REB in Scenario 4 increases obviously, while that of the ground source heat pump decreases obviously. The capacity of the energy storage equipment in Scenario 4 is larger, and Scenario 4 does not need to replenish the energy storage equipment in the normal period of electricity prices, and the energy stored by wind power can meet the energy demand during the peak period of electricity prices, so the power purchase cost of Scenario 4 is less than that of Scenario 3.
5. Conclusions
In this paper, firstly, a biomass boiler as an auxiliary heat source for solar heat collection systems is proposed. A day-ahead scheduling model of electric–thermal IES is constructed based on an MILP model, and an optimal scheduling method considering an energy-storage device and demand response is proposed, which is modeled and solved by Pyomo-GLPK. Three scenarios are set up. Scenario 3 contains energy storage and a flexible load. Compared with Scenario 1, the total cost of Scenario 3 is reduced by 51.5%, and the abandonment cost of wind energy is reduced by 43.3%. Compared with Scenario 2, the power load curve in Scenario 3 is smoother, and the optimization result is better. The use of a flexible load and energy storage can effectively reduce the cost and improve new energy consumption. Similarly, the optimal scheduling strategy proposed in this paper can effectively solve the problem of the uncertainty of new energy. On the basis of Scenario 3, by increasing the capacity of the energy-storage device, the wind power is completely absorbed, but the operation and maintenance cost is increased. Therefore, allocate the capacity of energy storage equipment reasonably according to the actual situation. The focus of this paper is the mutual cooperation between devices, ignoring the heat network transmission and the delay in user thermal perception. Therefore, on the basis of the model proposed in this paper, the impact of heat network transmission and user-perceived delay on system scheduling will become the focus of follow-up research.
Author Contributions
Conceptualization, C.G. and Z.Z.; methodology, C.G. and Z.Z.; software, C.G.; validation, Z.Z.; formal analysis, Z.Z.; investigation, C.G.; resources, P.W.; data curation, C.G.; writing—original draft preparation, C.G. and Z.Z.; writing—review and editing, C.G. and P.W.; visualization, C.G.; supervision, P.W.; project administration, P.W.; funding acquisition, P.W. All authors have read and agreed to the published version of the manuscript.
Funding
This work was supported by National Natural Science Foundation of China, grant number 12171135; Central Government Guides Local Science and Technology Development Fund Projects, grant number 216Z2103G; Science and Technology Research Project of Hebei Colleges and Universities, grant number CXY2023009; and the Natural Science Foundation of Hebei Province, grant number A2020201021.
Data Availability Statement
Not applicable.
Conflicts of Interest
The authors declare no conflict of interest.
Abbreviations
| Nomenclature | |
| Acronyms and abbreviations | |
| MILP | mixed integer linear programming |
| IES | integrated energy system |
| SHCS | solar heat collector system |
| GSHP | ground source heat pump |
| WT | wind turbine |
| REB | regenerative electric boiler |
| BB | biomass boiler |
| HE | heat exchanger |
| Parameters | |
| As | total area of the solar collector |
| Ain,t | 0 or 1 variable representing heat storage of REB |
| Aout,t | 0 or 1 variable representing heat release state of the REB |
| Ain1,t | 0 or 1 variables representing the charge status of the battery |
| Aout1,t | 0 or 1 variables representing the discharge status of the battery |
| Jt | average solar radiation in the t time period |
| f | solar energy guarantee rate |
| N | total number of energy equipment components |
| maximum electric power of the REB | |
| maximum heat storage power of the REB | |
| maximum heat release power of the REB | |
| maximum heat release of the SHCS | |
| maximum heat release of the BB | |
| maximum charge power of the battery | |
| maximum discharge power of the battery | |
| maximum heat storage of the REB | |
| minimum heat storage of the REB | |
| SSHCS,max | maximum heat storage of heat storage tank |
| SSHCS,min | minimum heat storage of heat storage tank |
| maximum capacity of battery | |
| minimum capacity of battery | |
| T | total scheduling time period |
| maximum increment of the BB heat | |
| minimum increment of the BB heat | |
| αt | reduction ratio within the scope of the agreement |
| upper limit of the reduce load | |
| βBB | calorific value of biomass solidified fuel |
| τ | starting time |
| λele | time-sharing electricity price |
| λBB | unit mass price of biomass fuel |
| λwind | abandonment penalty coefficient of wind turbine |
| λj,yw | unit operation and maintenance cost of energy equipment j |
| Variables | |
| Ccut | compensation cost of reduced load after scheduling |
| compensation price of unit power reduced load in the agreement | |
| Cshift | compensation cost of translatable load after scheduling |
| compensation price of unit power load translation in the agreement | |
| Cele | purchasing electricity cost |
| Cb | purchase cost of biomass fuel |
| Cwind | penalty cost of abandoning wind |
| Cyw | operation and maintenance cost of energy equipment |
| Cbc | flexible load compensation cost |
| copGSHP | heat efficiency ratio of GSHP |
| F | total operating cost of the system |
| Nt | 0 or 1 state variable to judge whether the load is reduced or not |
| mt | 0 or 1 state variable to judge whether the load is translating or not |
| QREB,t | heat generation power of the REB |
| heat storage of the regenerator of the REB | |
| heat release of the regenerator of the REB | |
| heat release of the SHCS in the t time period | |
| QBB,t | heat power of BB in the t time period |
| QGSHP,t | heat power of GSHP in the t time period |
| Qper,t | heat load required by users in the t time period |
| ηREB | conversion efficiency of the REB |
| ηloss,REB | heat loss coefficient of the heat storage part of the REB |
| ηREB,in | heat storage efficiency of the REB |
| ηREB,out | heat release efficiency of the REB |
| ηSHCS | average heat collection efficiency of solar collector |
| ηloss,pipe | heat loss rate of pipelines and heat-storage devices |
| ηBB | heat efficiency of BB |
| ηSHCS,in | heat storage efficiency of SHCS |
| ηSHCS,out | heat release efficiency of SHCS |
| ηB,in | charging efficiency of battery |
| ηB,out | discharge efficiency of battery |
| PREB,t | electric power of the REB |
| PBattery,t | output power of battery |
| input power of battery | |
| output power of battery | |
| Pper,t | electric power before optimization |
| electric power after load reduction | |
| translatable load power in the t time period | |
| Pshift | rated power of the translatable load |
| predicted power generation of WT | |
| Pwind,t | actual power consumption of WT |
| Pj,t | output power of equipment j |
| electricity load demand after optimization | |
| PBuy,t | electricity purchased from power grid |
| SREB,t | heat storage capacity of the REB |
| SSHCS,t | heat storage capacity of heat storage tank |
| SBattery,t | storage capacity of battery |
| ts | duration of the translatable load |
| WBB,t | fuel weight of BB |
References
- Xu, G.; Dong, H.; Xu, Z.; Bhattarai, N. China can reach carbon neutrality before 2050 by improving economic development quality. Energy 2022, 243, 123087. [Google Scholar] [CrossRef]
- Zhang, W.; Li, G.; Guo, F. Does carbon emissions trading promote green technology innovation in China? Appl. Energy 2022, 315, 119012. [Google Scholar] [CrossRef]
- Wang, P.; Zhang, Z.; Fu, L.; Ran, N. Optimal design of home energy management strategy based on refined load model. Energy 2021, 218, 119516. [Google Scholar] [CrossRef]
- Yang, X.; Chen, Z.; Huang, X.; Li, R.; Xu, S.; Yang, C. Robust capacity optimization methods for integrated energy systems considering demand response and thermal comfort. Energy 2021, 221, 119727. [Google Scholar] [CrossRef]
- Ullah, K.; Hafeez, G.; Khan, I.; Jan, S.; Javaid, N. A multiobjective energy optimization in smart grid with high penetration of renewable energy sources. Appl. Energy 2021, 299, 117104. [Google Scholar] [CrossRef]
- Albogamy, F.R.; Khan, S.A.; Hafeez, G.; Murawwat, S.; Khan, S.; Haider, S.I.; Basit, A.; Thoben, K.D. Realtime energy management and load scheduling with renewable energy integration in smart grid. Sustainability 2022, 14, 1792. [Google Scholar] [CrossRef]
- Renaldi, R.; Friedrich, D. Techno-economic analysis of a solar district heating system with seasonal thermal storage in the UK. Appl. Energy 2019, 236, 388–400. [Google Scholar] [CrossRef]
- Teichgraeber, H.; Brandt, A.R. Clustering methods to find representative periods for the optimization of energy systems: An initial framework and comparison. Appl. Energy 2019, 239, 1283–1293. [Google Scholar] [CrossRef]
- Yang, Y.; Li, Z.; Mandapaka, P.V.; Lo, E.Y. Risk-averse restoration of coupled power and water systems with small pumped-hydro storage and stochastic rooftop renewables. Appl. Energy 2023, 339, 120953. [Google Scholar] [CrossRef]
- Li, Z.; Wu, L.; Xu, Y.; Wang, L.; Yang, N. Distributed tri-layer risk-averse stochastic game approach for energy trading among multi-energy microgrids. Appl. Energy 2023, 331, 120282. [Google Scholar] [CrossRef]
- Li, J.; Li, X.; Zhang, N.; Zhang, Y.; Zhang, Z.; Lv, Q. An Optimal Dispatch Model of the Electricity-Heat Integrated Energy System Considering the Reserve Benefits of the Heat Storage. Power Syst. Technol. 2021, 129, 106826. [Google Scholar]
- Abdon, A.; Zhang, X.; Parra, D.; Patel, M.K.; Bauer, C.; Worlitschek, J. Techno-economic and environmental assessment of stationary electricity storage technologies for different time scales. Energy 2017, 139, 1173–1187. [Google Scholar] [CrossRef]
- Lu, Z.; Yang, Y.; Geng, L.; Pan, L.; He, L.; Li, X. Low-carbon Economic Dispatch of the Integrated Electrical and Heating Systems Based on Benders Decomposition. Proc. CSEE 2018, 38, 1922–1934. [Google Scholar]
- Yin, L.; Tao, M. Balanced broad learning prediction model for carbon emissions of integrated energy systems considering distributed ground source heat pump heat storage systems and carbon capture & storage. Appl. Energy 2023, 329, 120269. [Google Scholar]
- Peng, J.; Andreas, K.; Niu, Z.; Wang, J.; Liu, X.; Jivka, O. A flexible potential-flow model based high resolution spatiotemporal energy demand forecasting framework. Appl. Energy 2021, 299, 117321. [Google Scholar] [CrossRef]
- Yang, C.; Bu, S.; Fan, Y.; Wan, X.; Wang, R.; Aoife, F. Data-driven prediction and evaluation on future impact of energy transition policies in smart regions. Appl. Energy 2023, 332, 120523. [Google Scholar] [CrossRef]
- Zhou, D.; Sun, K.; Zheng, C.; Chen, X.; Zheng, W. A stochastic optimal dispatch method for integrated electrical-thermal energy system considering heat storage characteristics of heating system. Renew. Energy Resour. 2020, 38, 380–387. [Google Scholar]
- Ma, Q.; Wang, P. Underground solar energy storage via energy piles. Appl. Energy 2020, 261, 114361. [Google Scholar] [CrossRef]
- Ahmad, A.; Khizar, S.; Ghulam, H.; Sadia, M.; Sheraz, K.; Farrukh, A.K. Real-time energy optimization and scheduling of buildings integrated with renewable microgrid. Appl. Energy 2023, 335, 120640. [Google Scholar]
- Xie, Y.; Wang, S.; Zhang, G.; Fan, Y.; Carlos, F.; Frede, B. Optimized multi-hidden layer long short-term memory modeling and suboptimal fading extended Kalman filtering strategies for the synthetic state of charge estimation of lithium-ion batteries. Appl. Energy 2023, 336, 120866. [Google Scholar] [CrossRef]
- Peter, O.; Jesse, A.B.; Chien, C.; Praneet, N.C.; Vaishnavi, H.; Pranjal, S.; Alvin, B.K.; Jonathan, L.; Emmanuel, W.; Panos, Y.P. Micro Water-Energy-Food (MicroWEF) Nexus: A system design optimization framework for Integrated Natural Resource Conservation and Development (INRCD) projects at community scale. Appl. Energy 2023, 333, 120583. [Google Scholar]
- Gao, H.; Zhao, Y.; He, S.; Liu, J. Demand response management of community integrated energy system: A multi-energy retail package perspective. Appl. Energy 2023, 330, 120278. [Google Scholar] [CrossRef]
- Ye, H.; Jin, G.; Wang, F.; Ghadimi, N. High step-up interleaved dc/dc converter with high efficiency. Energy Sources Part A Recovery Util. Environ. Eff. 2020, 43, 1–20. [Google Scholar] [CrossRef]
- Yang, Z.; Ghadamyari, M.; Khorramdel, H.; Alizadeh, S.M.S.; Pirouzi, S.; Milani, M.; Banihashemi, F.; Ghadimi, N. Robust multi-objective optimal design of islanded hybrid system with renewable and diesel sources/stationary and mobile energy storage systems. Renew. Sustain. Energy Rev. 2021, 148, 111295. [Google Scholar] [CrossRef]
- Parsian, A.; Ramezani, M.; Ghadimi, N. A hybrid neural network-gray wolf optimization algorithm for melanoma detection. Biomed. Res. 2017, 28, 3408–3411. [Google Scholar]
- Mehrpooya, M.; Ghadimi, N.; Marefati, M.; Ghorbanian, S.A. Numerical investigation of a new combined energy system includes parabolic dish solar collector, Stirling engine and thermoelectric device. Int. J. Energy Res. 2021, 45, 16436–16455. [Google Scholar] [CrossRef]
- Dehghani, M.; Ghiasi, M.; Niknam, T.; Kavousi-Fard, A.; Shasadeghi, M.; Ghadimi, N.; Taghizadeh-Hesary, F. Blockchain-Based Securing of Data Exchange in a Power Transmission System Considering Congestion Management and Social Welfare. Sustainability 2021, 13, 90. [Google Scholar] [CrossRef]
- Wang, D.; Mo, Z.; Liu, Y.; Ren, Y.; Fan, J. Thermal performance analysis of large-scale flat plate solar collectors and regional applicability in China. Energy 2022, 238, 121931. [Google Scholar] [CrossRef]
- Sun, T.; Yang, L.; Jin, L.; Luo, Z.; Zhang, Y.; Liu, Y.; Wang, Z. A novel solar-assisted ground-source heat pump (SAGSHP) with seasonal heat-storage and heat cascade utilization: Field test and performance analysis. Sol. Energy 2020, 201, 362–372. [Google Scholar] [CrossRef]
- Zhu, Y.; Li, P.; Ruan, Z.; Yuan, Y. A model and thermal loss evaluation of a direct-absorption solar collector under the influence of radiation. Energy Convers. Manag. 2022, 251, 114933. [Google Scholar] [CrossRef]
- Machado, D.; Andrade, G.; Normey, J.; Bordons, C. Optimal operation of Concentrating Solar Collector fields using exergy-based hierarchical control. Energy 2022, 239, 122462. [Google Scholar] [CrossRef]
- Mehregan, M.; Abbasi, M.; Khalilian, P.; Hashemian, S.; Madadi, A. Energy, economic, environmental investigations and optimization of a combined cooling, heating and power system with hybrid prime mover of gas engine and flat plate solar collector. Energy Convers. Manag. 2022, 251, 115018. [Google Scholar] [CrossRef]
- Sethi, M.; Tripathi, R.; Pattnaik, B.; Kumar, S.; Khargotra, R.; Chand, S.; Thakur, A. Recent developments in design of evacuated tube solar collectors integrated with thermal energy storage: A review. Mater. Today Proc. 2021, 52, 1689–1696. [Google Scholar] [CrossRef]
- Nan, S.; Li, G.; Zhou, M.; Xia, Y. Real-time demand response of curtailable flexible load in smart residential community. Power Syst. Prot. Control 2019, 47, 42–50. [Google Scholar]
- Hemmati, R.; Mehrjerdi, H.; Bornapour, M. Hybrid hydrogen-battery storage to smooth solar energy volatility and energy arbitrage considering uncertain electrical-thermal loads. Renew. Energy 2020, 154, 1180–1187. [Google Scholar] [CrossRef]
- Mehrjerdi, H. Peer-to-peer home energy management incorporating hydrogen storage system and solar generating units. Renew. Energy 2020, 156, 183–192. [Google Scholar] [CrossRef]
- Zhou, Y.; Wang, J.; Dong, F.; Qin, Y.; Ma, Z.; Ma, Y.; Li, J. Novel flexibility evaluation of hybrid combined cooling, heating and power system with an improved operation strategy. Appl. Energy 2021, 300, 117358. [Google Scholar] [CrossRef]
- Yuan, M.; Sorknæs, P.; Lund, H.; Liang, Y. The bidding strategies of large-scale battery storage in 100% renewable smart energy systems. Appl. Energy 2022, 326, 119960. [Google Scholar] [CrossRef]
- Østergaard, P.A.; Werner, S.; Dyrelund, A.; Lund, H.; Arabkoohsar, A.; Sorknæs, P.; Gudmundsson, O.; Thorsen, J.E.; Mathiesen, B.V. The four generations of district cooling—A categorization of the development in district cooling from origin to future prospect. Energy 2022, 253, 124098. [Google Scholar] [CrossRef]
- Chang, M.; Lund, H.; Thellufsen, J.Z.; Østergaard, P.A. Perspectives on purpose-driven coupling of energy system models. Energy 2023, 265, 126335. [Google Scholar] [CrossRef]
- Ortiz, C.; Romano, M.C.; Valverde, J.M.; Binotti, M.; Chacartegui, R. Process integration of Calcium-Looping thermochemical energy storage system in concentrating solar power plants. Energy 2018, 155, 535–551. [Google Scholar] [CrossRef]
- Mousque, F.; Boix, M.; Montastruc, L.; Domenech, S.; Negny, S. Optimal design of Eco-Industrial parks with coupled energy networks addressing complexity bottleneck through an interdependence analysis. Comput. Chem. Eng. 2020, 138, 106859. [Google Scholar] [CrossRef]
- Takeshita, T.; Aki, H.; Kawajiri, K.; Ishida, M. Assessment of utilization of combined heat and power systems to provide grid flexibility alongside variable renewable energy systems. Energy 2021, 214, 118951. [Google Scholar] [CrossRef]
- Harder, N.; Qussous, R.; Weidlich, A. The cost of providing operational flexibility from distributed energy resources. Appl. Energy 2020, 279, 115784. [Google Scholar] [CrossRef]
- Huang, X.; Lu, P.; Luo, X.; Chen, J.; Yang, Z.; Liang, Y.; Wang, C.; Chen, Y. Synthesis and simultaneous MINLP optimization of heat exchanger network, steam Rankine cycle, and organic Rankine cycle. Energy 2020, 195, 116922. [Google Scholar] [CrossRef]
- Jing, R.; Wang, M.; Zhang, Z.; Wang, X.; Li, N.; Shah, N.; Zhao, Y. Distributed or centralized? Designing district-level urban energy systems by a hierarchical approach considering demand uncertainties. Appl. Energy 2019, 252, 113424. [Google Scholar] [CrossRef]
- Valenzuela-Venegas, G.; Henríquez-Henríquez, F.; Boix, M.; Montastruc, L.; Arenas-Araya, F.; Miranda-Perez, J.; Díaz-Alvarado, F.A. A resilience indicator for Eco-Industrial Parks. J. Clean. Prod. 2018, 174, 807–820. [Google Scholar] [CrossRef]
- Li, F.; Sun, B.; Zhang, C.; Zhang, L. Operation optimization for combined cooling, heating, and power system with condensation heat recovery. Appl. Energy 2018, 230, 305–316. [Google Scholar] [CrossRef]
- Xu, Z.; Sun, Y.; Xie, D.; Wang, J.; Zhong, Y. Optimal Configuration of Energy Storage for Integrated Region Energy System Considering Power/Thermal Flexible Load. Autom. Electr. Power Syst. 2020, 44, 53–59. [Google Scholar]
Disclaimer/Publisher’s Note: The statements, opinions and data contained in all publications are solely those of the individual author(s) and contributor(s) and not of MDPI and/or the editor(s). MDPI and/or the editor(s) disclaim responsibility for any injury to people or property resulting from any ideas, methods, instructions or products referred to in the content. |
© 2023 by the authors. Licensee MDPI, Basel, Switzerland. This article is an open access article distributed under the terms and conditions of the Creative Commons Attribution (CC BY) license (https://creativecommons.org/licenses/by/4.0/).

