Article

Hydrogen Production from Supercritical Water Gasification of Model Compounds of Crude Glycerol from Biodiesel Industries

Department of Chemical and Biological Engineering, University of Saskatchewan, Saskatoon, SK S7N 5A9, Canada
*
Author to whom correspondence should be addressed.
Energies 2023, 16(9), 3746; https://doi.org/10.3390/en16093746
Submission received: 21 March 2023 / Revised: 22 April 2023 / Accepted: 25 April 2023 / Published: 27 April 2023
(This article belongs to the Special Issue Advances in Sustainable Hydrogen Production)

Abstract

:
Biodiesel production through transesterification results in a large quantity of crude glycerol as a byproduct, the utilization of which is technically and economically challenging. Because of the ability to efficiently process wet feedstocks, supercritical water gasification (SCWG) is utilized in this study to convert crude glycerol into hydrogen-rich syngas. A significant challenge addressed through this study is the decomposition routes of different heterogeneous components of crude glycerol during SCWG. Pure glycerol, methanol and oleic acid were investigated for SCWG as the model compounds of crude glycerol. SCWG of model compounds at temperature, pressure, feedstock concentration and reaction time of 500 °C, 23–25 MPa, 10 wt% and 1 h, respectively, revealed methanol to exhibit the highest H2 yield of 7.7 mmol/g, followed by pure glycerol (4.4 mmol/g) and oleic acid (1.1 mmol/g). The effects of feedstock concentration from 30 wt% to 10 wt% increased H2 yield from all model compounds. Response surface methodology (RSM) was used to develop a response curve to visualize the interactive behavior and develop model equations for the prediction of H2-rich gas yields as a function of the composition of model compounds in the crude glycerol mixture. Predictive models showed a good agreement with experimental results, demonstrating high accuracy and robustness of the model. These findings demonstrated a strong potential of crude glycerol for SCWG to generate H2-rich syngas.

1. Introduction

Currently, fossil fuels are the main source of global energy supply, accounting for a share of nearly 84% [1]. An increasing trend in the extraction, processing and consumption of fossil fuels has also posed some environmental challenges. Consumption of fossil fuels contributes to greenhouse gas (GHG) emissions, which increase the Earth’s average temperature, leading to climate change, global warming, impacts on natural resources and abnormalities in weather patterns [2]. Owing to these adverse direct and indirect impacts of fossil fuels on the environment and ecosystems, renewable and alternative energy sources are a pressing need.
Biodiesel is a well-researched alternative fuel produced from bio-renewable sources for use in the transportation sector due to its compatibility with existing diesel engines [3]. Biodiesel can be produced by the transesterification of non-edible oils from oilseed crops and microalgae as well as waste cooking oils and animal fats [4]. The global biodiesel supply in 2021 was 0.8 million barrels per day (mb/d), which is expected to rise to 1.8 mb/d by 2045 [5]. In Canada, biodiesel production dramatically increased from 102 million liters in 2012 to 460 million liters in 2021, with a forecast of steady growth [6]. With the steady rise in the commercial production of biodiesel globally, several waste byproducts from the transesterification processes such as crude glycerol, methanol and alkali salts (as spent catalysts) are also obtained in large amounts that require expensive downstream processing for separation and purification [7].
The disposal of crude glycerol is challenging due to the high cost and negative environmental impact associated with it. Refining crude glycerol into value-added chemicals is also expensive and intricate due to the presence of impurities [8]. Fermentation of crude glycerol is also challenging due to the impurities acting as microbial growth inhibitors and the precipitation of soap resulting in the formation of bubbles, which limits the oxygen transfer and cell growth in microbial culture [9]. Incineration of crude glycerol is also not a feasible option due to a high auto-ignition temperature, high viscosity, low vapor pressure, low heating value and the presence of impurities and salts leading to emissions and corrosion [10]. Hence, the utilization of crude glycerol is a serious challenge for biodiesel industries, affecting their waste management, environmental impacts and economics. This also remains one of the main knowledge gaps in the existing literature on the value addition to crude glycerol.
Hydrothermal conversion technologies such as supercritical water gasification (SCWG) and reforming have shown some promising results for the valorization of crude glycerol into biofuels, especially syngas [11,12,13,14,15,16]. SCWG has the potential to efficiently convert crude glycerol and other complex wet feedstocks into value-added hydrogen-rich syngas without the need for pretreatment (i.e., purification or separation). SCWG uses water at its supercritical state with a temperature and pressure beyond water’s critical points i.e., 374 °C and 22.1 MPa [17]. Supercritical water (SCW) with dual properties of gases (for viscosity) and liquids (for density) serves as a non-polar solvent, medium and reactant during SCWG [18,19]. The SCWG process mainly produces H2 along with CO2, CO and CH4. Hydrogen is the cleanest source of alternative energy as its combustion produces heat energy (120–142 MJ/kg) and water. Thus, the renewed impetus of many countries to invest in the hydrogen economy to meet their energy demand has surged significantly. Approximately 90 Mt of H2 was produced globally in 2020, almost entirely from fossil fuels through large-scale commercial processes such as steam reforming of methane, which is a well-established industrial process but also generates massive levels of GHGs e.g., 900 Mt of CO2 in 2020 alone [20]. The ability of SCWG to produce green hydrogen could potentially decrease the over-dependency on fossil fuels, reduce carbon emissions and valorize underutilized feedstocks such as crude glycerol and organic wastes.
Although promising, it should be noted that the composition of crude glycerol can vary drastically depending on the source, which can have significant effects on H2 and other gas yields and the efficiency of SCWG. The rate of hydrothermal decomposition and reforming of individual components of crude glycerol can differ, and thereby significantly influence the overall SCWG process. As main knowledge gaps, it is important to investigate: (i) the behavior of each component of crude glycerol during SCWG and (ii) the interactions of process parameters i.e., temperature, pressure, reaction time, feedstock concentration and catalyst type and loading on gas yields and intensification of SCWG of crude glycerol. Hence, this study aims to fill these knowledge gaps by studying the SCWG behavior of model compounds of crude glycerol such as methanol and oleic acid and compare it with that of pure glycerol.
This study implements a design of experiments approach, which has not been previously reported, to comprehensively study the interactions within model compounds of crude glycerol during SCWG at varying concentrations. This study leads to the development of predictive model equations to ascertain the yields of H2, CH4, CO2 and total gases from SCWG of crude glycerol with a variety of compositions. The accuracy of these model equations was validated using a simulated crude glycerol feedstock based on an actual crude glycerol feedstock as a validation data point, which has not been examined and reported in the literature. The predicted thermodynamic results from the developed models and the actual experimental data obtained from the SCWG reactions of simulated crude glycerol were compared to test the robustness of developed predictive model equations, which is relevant for the industrial scale-up of the SCWG process. A detailed mechanism demonstrating different conversion pathways of crude glycerol constituents during SCWG is proposed, which is important to control the rate and progression of sub-reactions such as hydrolysis, decomposition, reforming and gasification.
Process optimization and gas yields depend on a multitude of factors such as the scale of operation and reactor type. Variations in these factors can result in differences in gas yields from the SCWG of a particular feedstock. Moreover, the interactive effects of process conditions such as temperature, reaction time and feed concentration are less understood. To gain more understanding in this area, the primary objective of this study was to investigate the interactive effects of model compounds of crude glycerol during SCWG. This can provide the basis to understand the underlying mechanisms of SCWG of crude glycerol and better optimize the feedstock blending. The experiment design used in this study investigates the effects of the composition of feedstock on the gas yields while keeping other variables (e.g., temperature, pressure and reaction time) constant.

2. Materials and Methods

2.1. Feedstock

Crude glycerol was procured from a Canadian biorefinery company located in British Columbia. High-purity glycerol (>99.5%), methanol (>99.8%) and oleic acid (>99%) were purchased from Fisher Scientific, Canada (Thermo Fisher Scientific, Mississauga, ON, Canada). Simulated crude glycerol was prepared using pure model compounds (i.e., glycerol, methanol and oleic acid) to mimic the composition of crude glycerol excluding ash and moisture content (Table 1).

2.2. Supercritical Water Gasification Experiments

All the SCWG experiments were carried out in a stainless steel (SS316) tubular batch reactor as represented in Figure 1. The reactor is 10 in long with an outer and inner diameter of 0.5 in and 0.37 in, respectively. Tubing and fittings were also made up of SS316 and purchased from Swagelok (Saskatoon, SK, Canada). The tubular reactor is enclosed inside an ATS Series 3210 furnace (Applied Test, Butler, PA, USA) connected to an ATS temperature controller. Other accessories of the reactor assembly include a K-type thermocouple, pressure gauge, pressure relief valve, check valves, 2 μm filters, a gas–liquid separating cylinder and a desiccator.
At a constant temperature of 500 °C, pressure range of 23–25 MPa and reaction time of 1 h, different feedstock concentrations (10–30 wt%) were examined for SCWG experiments. Precisely 1.1 g, 2.5 g and 4.3 g of a particular feedstock (i.e., pure glycerol, methanol and oleic acid) were mixed with a constant deionized water content of 10 mL and charged into the reactor. Before any experiment, the tubular reactor was purged with nitrogen to create an inert atmosphere and provide the initial pressure (10–15 MPa) required for the experimental runs. It should be noted that the reaction time is determined from the moment the reactor temperature approaches the desired temperature. Once the reaction is completed, the furnace was switched off and the hot volatiles from the tubular reactor were collected in the gas–liquid separating cylinder where the condensable liquids and the non-condensable gases were collected for further analysis.

2.3. Feedstock and Product Characterization

Ultimate analysis of feedstocks (i.e., crude glycerol, simulated crude glycerol, pure glycerol, methanol and oleic acid) was conducted by utilizing an Elementar Vario EL III CHNS analyzer purchased from Elementar Analysensysteme, Hanau, Germany. pH analysis of pure glycerol, simulated crude glycerol and crude glycerol was performed using a Thermo Scientific Elite PCTS pH meter purchased from Fisher Scientific Company, Ottawa, ON, Canada. Inductively coupled plasma (ICP) analysis of crude glycerol was performed for the identification of metallic compounds using a Sciex Elan 5000 ICP-MS (PerkinElmer, Inc., Waltham, MA, USA).
Gaseous products of SCWG experiments were analyzed using an Agilent 7820A gas chromatography (GC) instrument with nitrogen and helium carrier gases purchased from Agilent Technologies, Santa Clara, CA, USA. The GC is equipped with three packed and a capillary column along with one thermal conductivity detector and one flame ionization detector.
The “i” gas yield in (mmol/g) was determined using Equation (1):
Y i   ( m m o l / g ) = P r o d u c e d   m o l e s   o f   i   g a s   ( m m o l ) T o t a l   m a s s   o f   f e e d s t o c k   ( g )
H2 gasification efficiency (HGE) of gaseous products was calculated using Equation (2) [21]:
H G E   ( % ) = N u m b e r   o f   h y d r o g e n   a t o m s   i n   g a s   ( H 2 , C H 4 , C m H n ) N u m b e r   o f   h y d r o g e n   a t o m s   i n   f e e d s t o c k × 100
H2 selectivity (HS) of gaseous products was calculated using Equation (3) [22]:
H 2   s e l e c t i v i t y   ( % ) = H y d r o g e n   y i e l d   ( m m o l / g ) T o t a l g a s   y i e l d   ( m m o l / g ) × 100
Lower heating value (LHV) of gaseous products was calculated using Equation (4) [23]:
L H V k J N m 3 = 4.2 × ( 30.3 × C O + 25.8 × H 2 + 85.5 × C H 4 + 151.3 × C n H m )

2.4. Design of Experiments

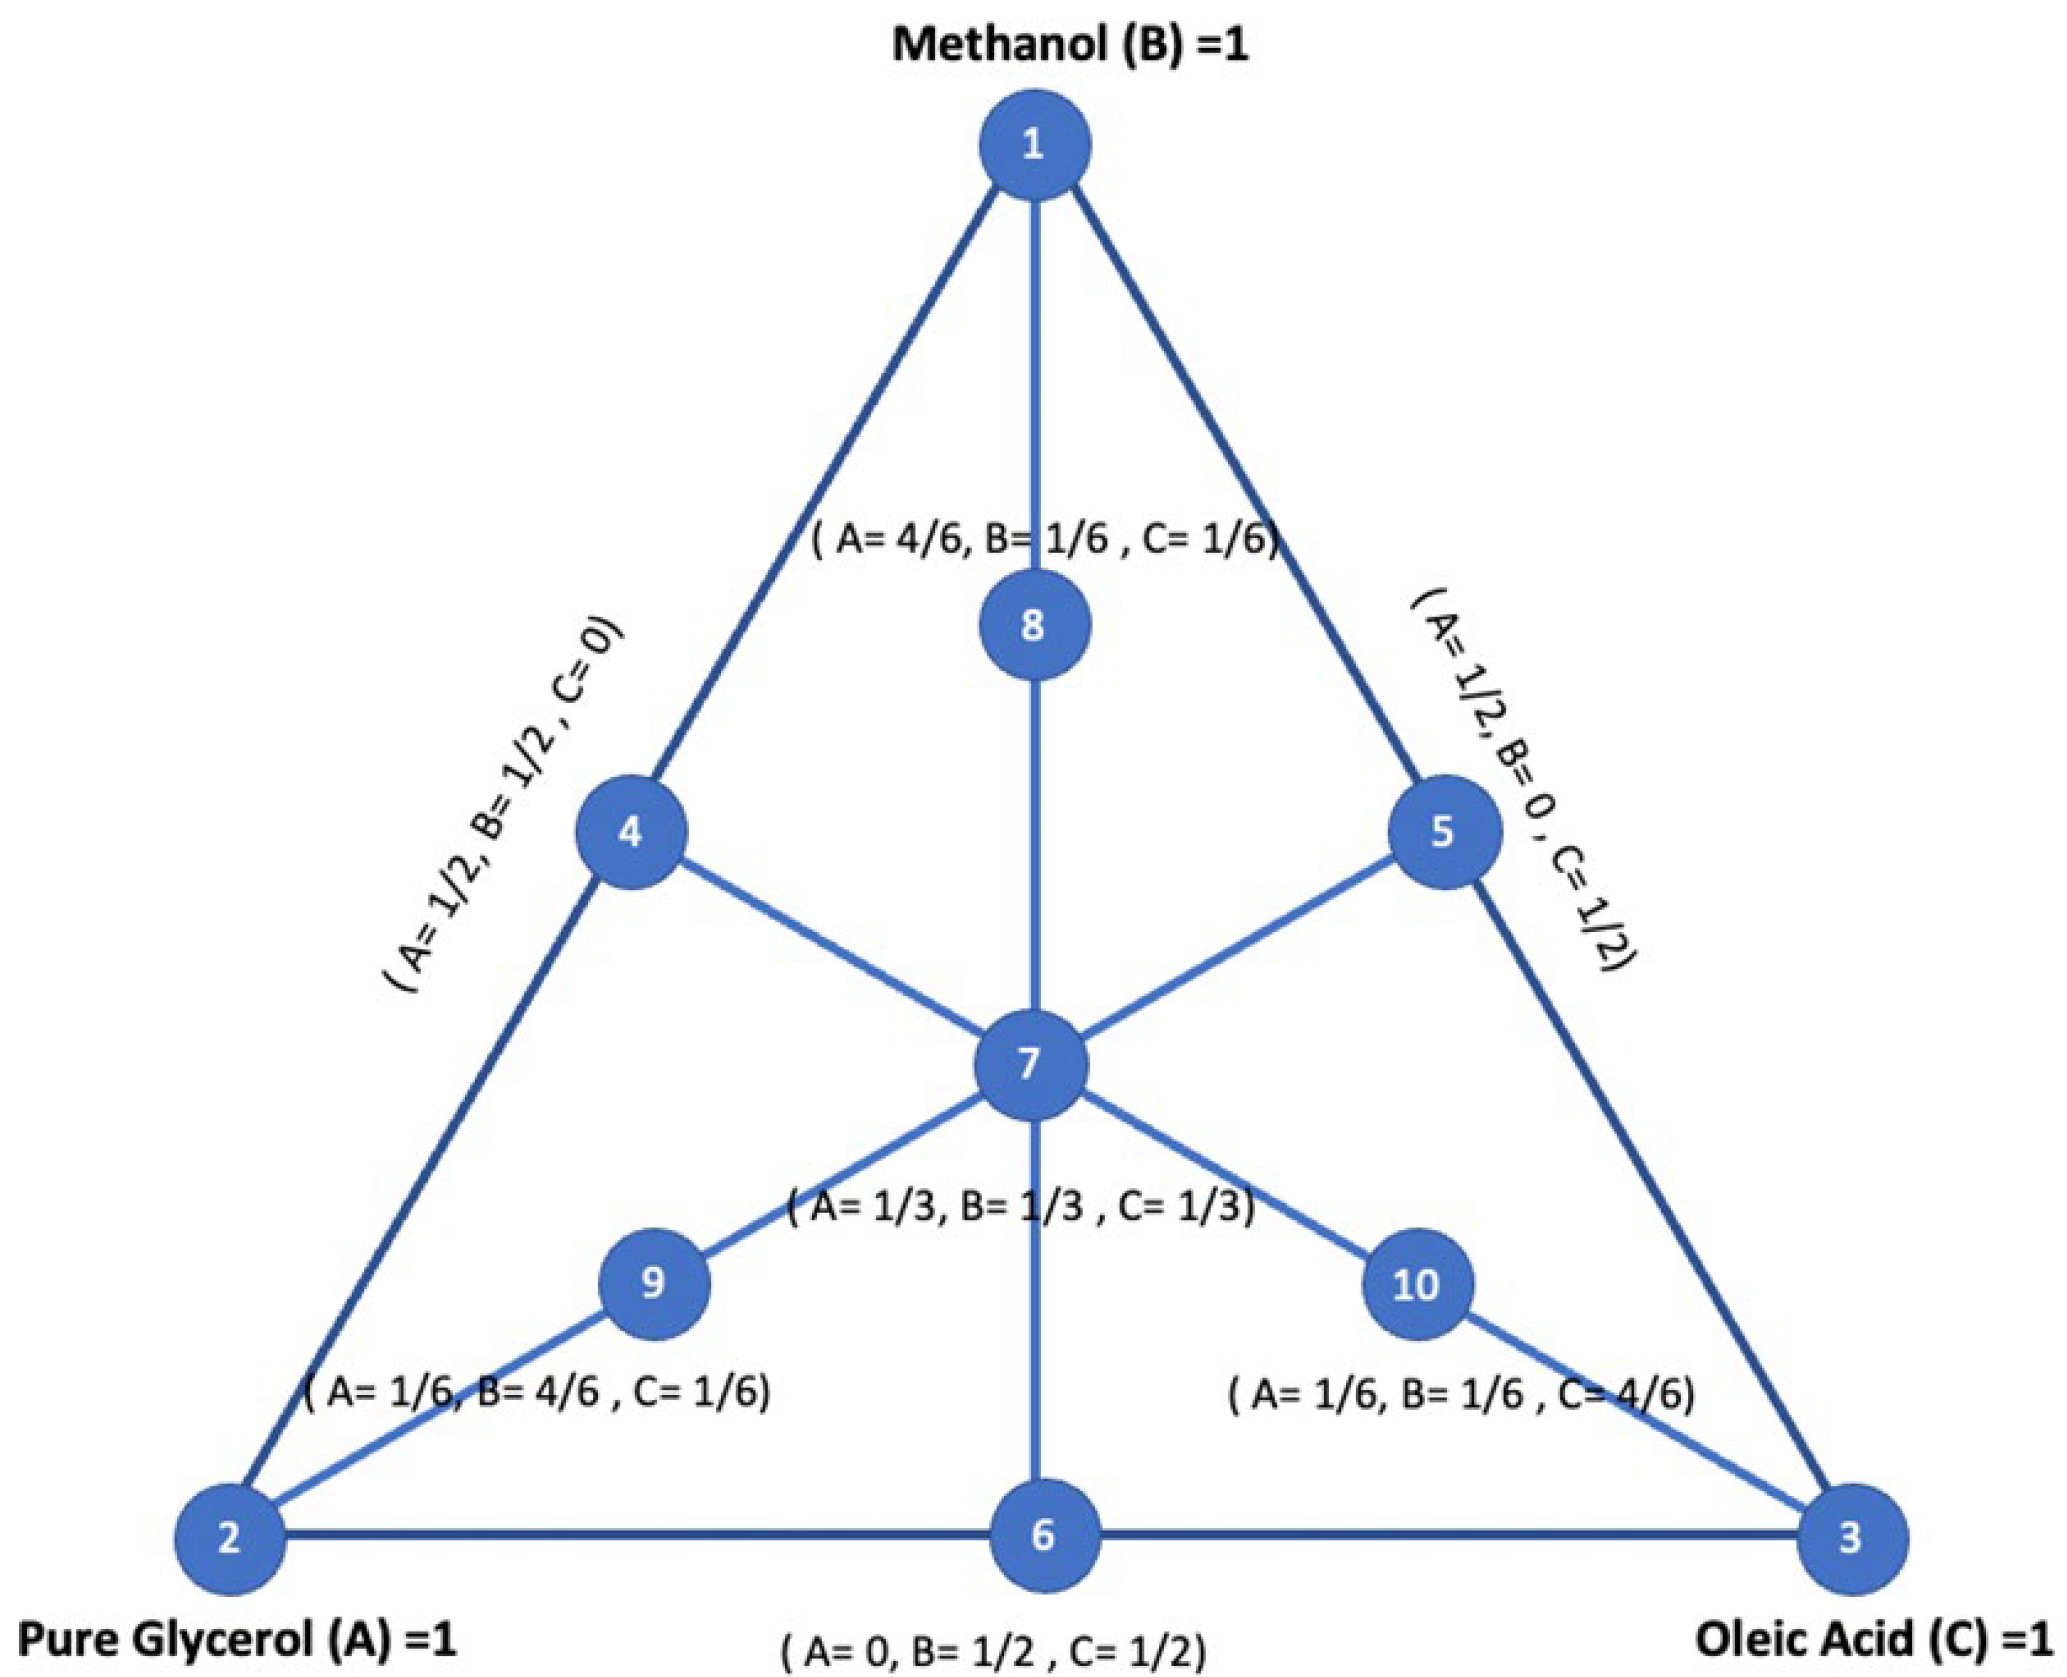
The response surface methodology (RSM) was used to design the experimental runs. In the RSM design, a first-order 2,3 simple lattice design, also commonly known as a mixture design, was selected. The 2,3 simple lattice designs are represented in Figure 2. The points at extreme vertices represent model compounds, whereas the midpoint of vertices represents binary mixtures of model compounds. The points at the altitude of the triangle represent ternary mixtures of model compounds. Mixture design is usually utilized to study the effects of different constituents of the mixture on a response variable. In this study, response variables are dependent on the relative quantity of constituents of the mixture irrespective of the quantity of the mixture. Thus, this is a powerful tool to investigate the effects of different compositions of crude glycerol (in terms of the model compounds) on the response variables.
In this study, the constituents of the mixture are pure glycerol, methanol and oleic acid. Weight fractions of these model compounds are the input variables or factors. Pure glycerol, methanol and oleic acid are represented by A, B and C, respectively, with a low and high level of each factor ranging from 0 to 1. The key feature of this design is that for all experiments, the sum of mass or volume fractions of all constituents must equate to unity, as shown in Equations (5) and (6):
0     i     1   ( where   i = A ,   B ,   or   C )   and   A C i = 1
A + B + C = 1
The response or output variables are yields of H2 (Y1), CH4 (Y2), total gas (Y3) and CO2 (Y4). Design Expert software was used to generate the model equations based on experimental results. The validity and fit of the models were performed using the analysis of variance (ANOVA) technique. The coefficient of determination (R2) and adjusted R2 values were used to test the goodness of fit of the experimental data to the regression model equations. R2 and adjusted R2 determine how much variation in the responses can be explained by the factors to test for fitness of the experimental data. ANOVA tables provide the sum of squares of model parameters which is also known as the sum of squares due to regression (SSR) and the sum of squares of residuals, which is commonly represented as SSE (sum of squares error). The sum of both SSE and SSR, i.e., the sum of squares total, is the difference between the experimental response value and the mean response value based on experimental data. It is also known as the total sum of squares, which represents the total variability of collected data. The significance of developed models and interaction terms was identified using the p-value. The 95% confidence interval and the conjugated p-value of 0.05 at a 95% confidence level were selected for analysis.
The 3D response curves were developed using these model equations to visualize the interactive effects of model compounds on each response. To test the accuracy of developed model equations, percentage error was used to quantify the prediction power of models (Equation (7)):
P e r c e n t a g e   e r r o r   ( % ) = P r e d i c t e d   v a l u e E x p e r i m e n t a l   v a l u e E x p e r i m e n t a l   v a l u e × 100

3. Results and Discussion

3.1. Feedstock Characterization

The chemical composition of feedstocks is presented in Table 1. As evident from Table 1, crude glycerol mostly contained glycerol followed by oleic acid with FAMEs and methanol. Elemental analysis showed that the carbon and hydrogen contents of both crude glycerol and simulated crude glycerol were similar and higher than those obtained for pure glycerol. The pH analysis revealed that the crude glycerol was more alkaline (pH 8.5) than simulated crude glycerol (pH 7.8). The ICP analysis of crude glycerol revealed the presence of alkali metals, particularly K and Na (Table 2). This explains the alkaline nature of crude glycerol. Potassium was the predominant metal followed by sodium present in crude glycerol, which indicates their use as catalysts during the transesterification process in biodiesel production [24].

3.2. SCWG of Model Compounds of Crude Glycerol

The selection of reaction conditions, i.e., a constant temperature and reaction time of 500 °C and 1 h, respectively, in our study was based on our previous studies on SCWG of liquid feedstocks and from the literature data. Youssef et al. [25] investigated a temperature range of 400–500 °C for SCWG of oleic acid and reported the highest H2 yield of 2 mmol/g at the reaction temperature of 500 °C, which was 5 times the hydrogen yield obtained at the reaction temperature of 400 °C. Pinkard et al. [26] also utilized similar reaction conditions of 500–560 °C for SCWG of methanol and ethanol and reported improved gasification efficiency and decomposition behavior of alcohols to permanent gases. In a study by Zhu et al. [27], higher carbon gasification efficiency (52.8%) and hydrogen gasification efficiency (25%) were reported from SCWG of glycerol compared to that of glucose (carbon gasification efficiency: 15.3% and hydrogen gasification efficiency: 6.7%) at 500 °C. High H2 yield from SCWG of glycerol, fatty acids and alcohols around 500 °C can be attributed to their enhanced hydrolysis with favored reforming and water–gas shift (WGS) reaction. Similarly, longer reaction times of 45–60 min can also enhance the WGS reaction, allowing sufficient duration for hydrolysis, reforming and decomposition of organic compounds to permanent gases [28,29,30].
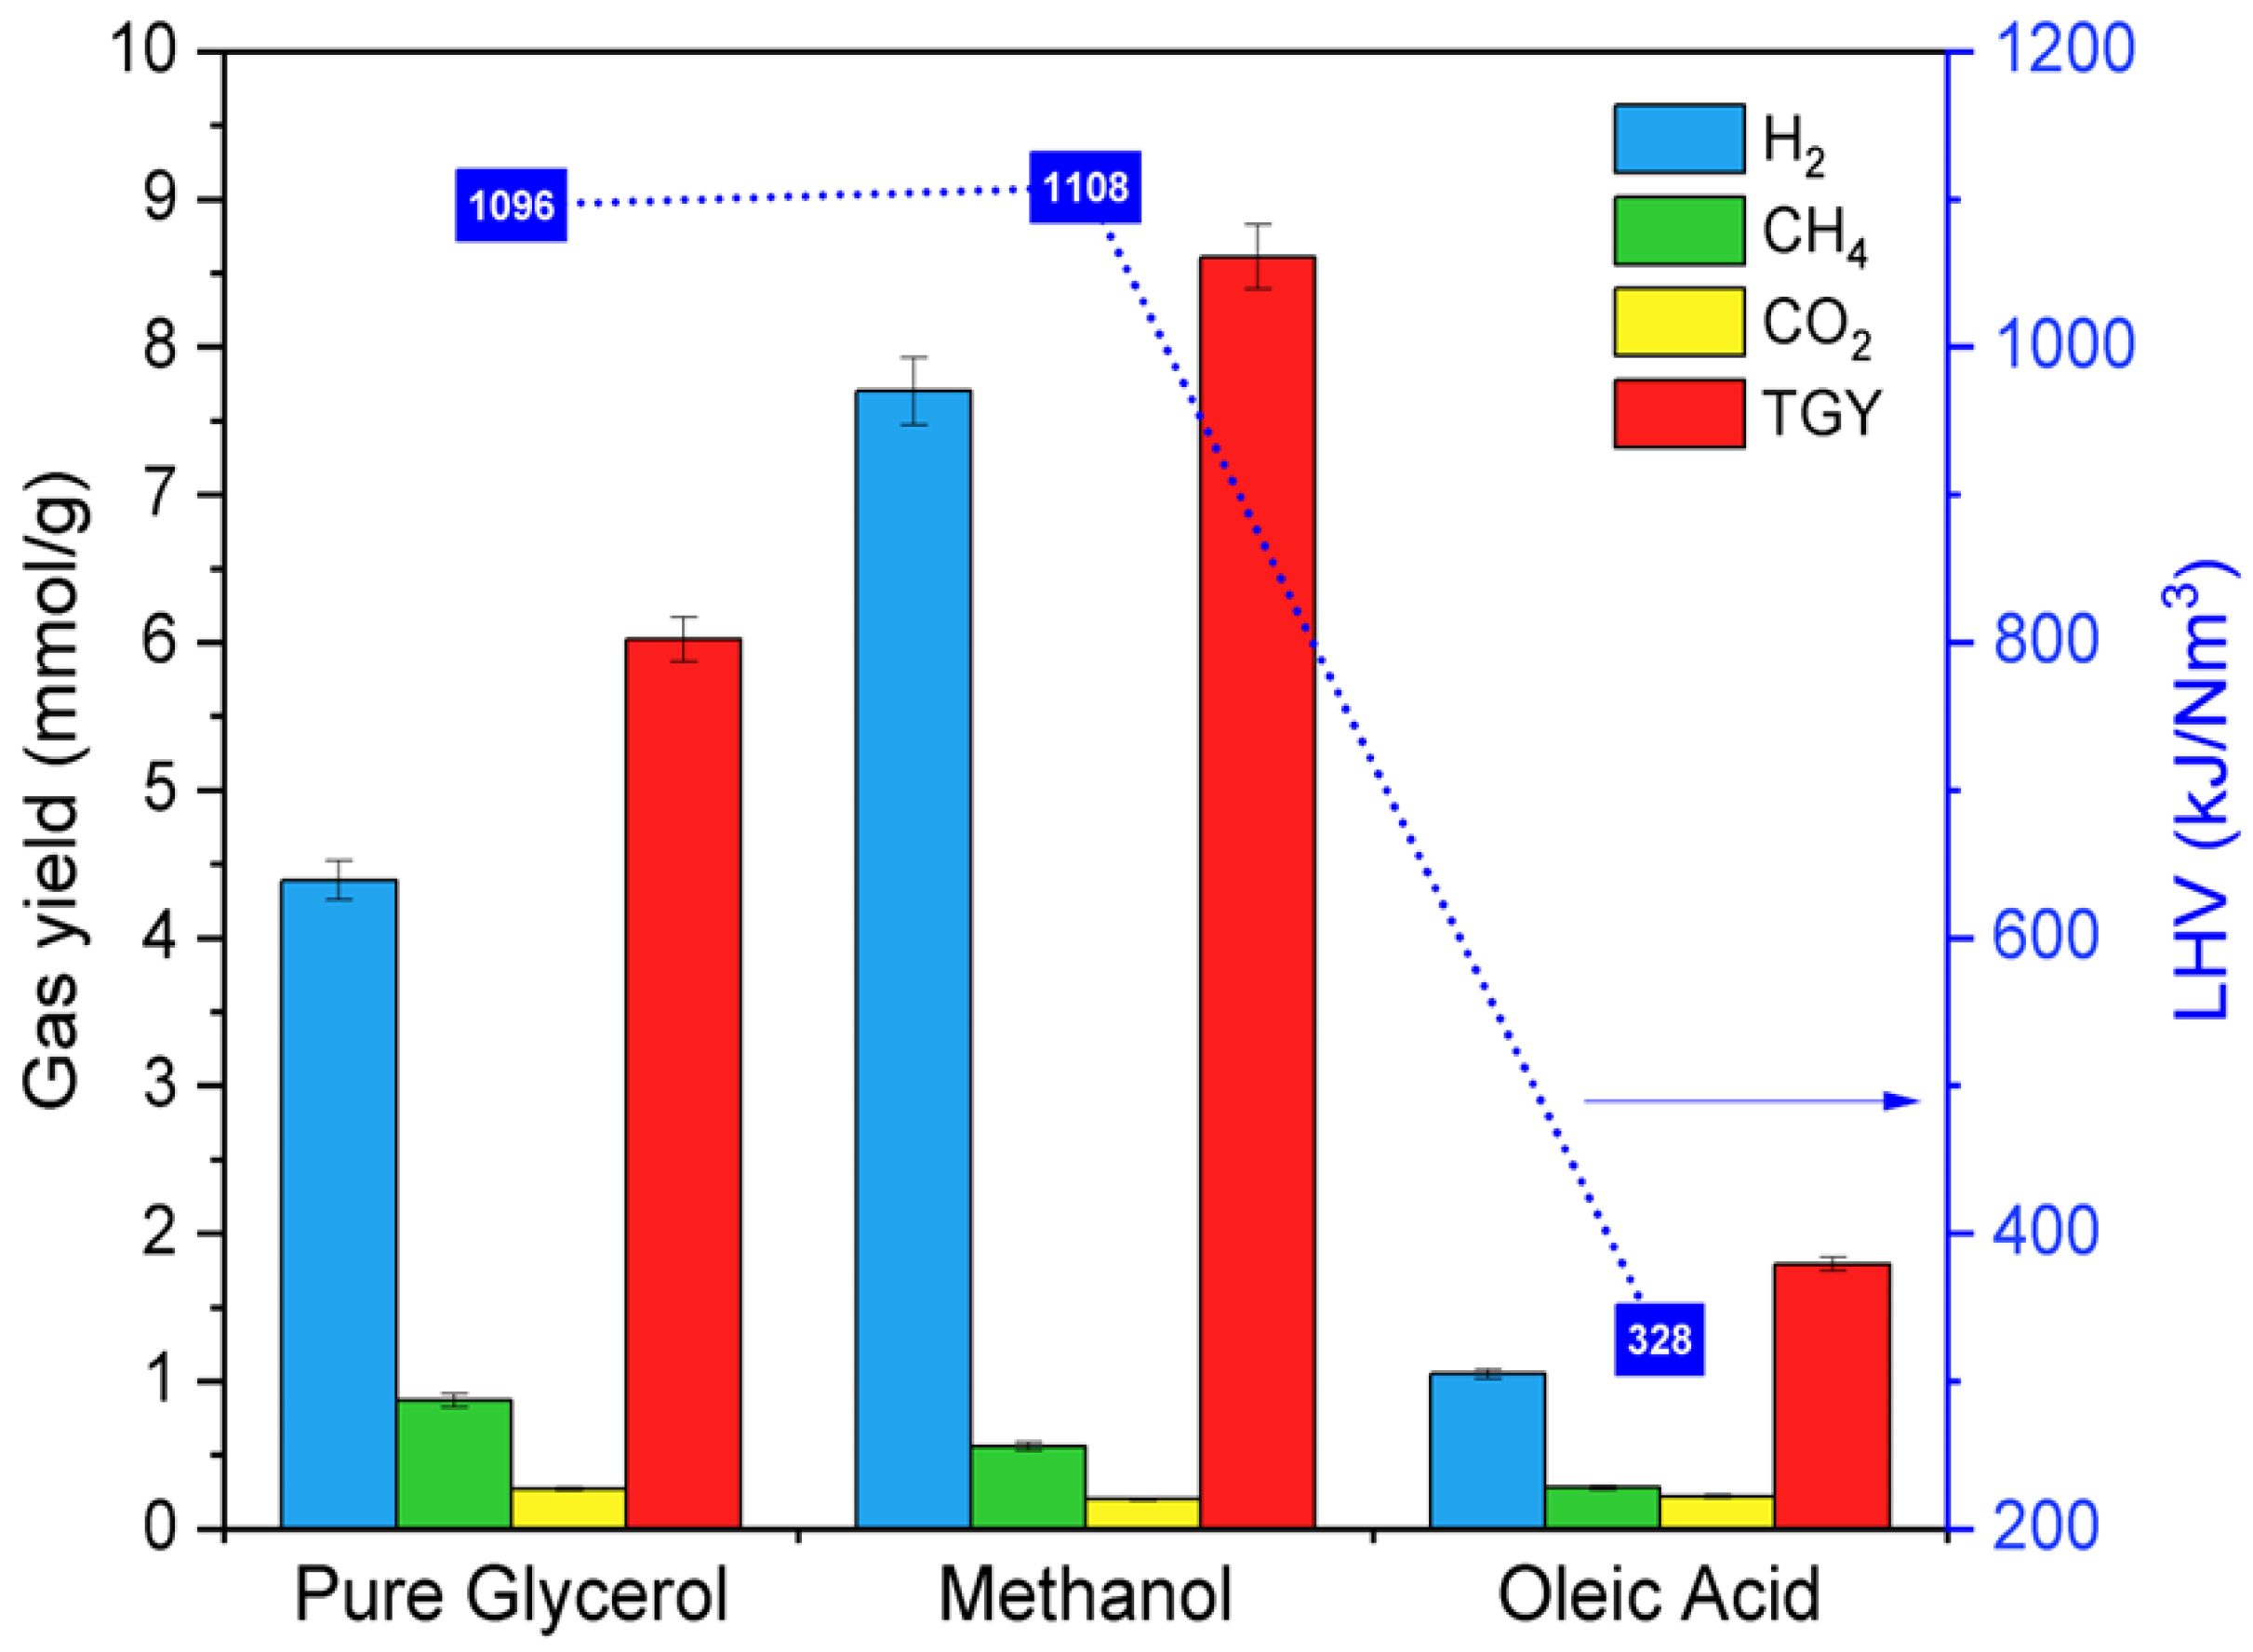
The overall mass balance for the SCWG reactions was in the range of 85–96 wt%. Mass balance could be prone to slight fluctuations due to certain complexities involved in product separation and collection. Several authors have reported mass balance in the ranges of 86–94 wt%, 86–92 wt% and 89–95 wt% from SCWG of lignin [31], bitumen [32] and canola hull pellets [33], respectively. A comparison of individual gas yields, total gas yield (TGY) and LHV of gas products obtained from SCWG of different model compounds of crude glycerol at temperature, pressure, feedstock concentration and reaction time of 500 °C, 23–25 MPa, 10 wt% and 1 h, respectively, is presented in Figure 3. Among different model compounds, methanol resulted in nearly 50% higher TGY as compared to pure glycerol and approximately 5 times more than that of oleic acid. This was due to the simple chemical structure of methanol compared to oleic acid and pure glycerol, which is relatively easy to gasify after bond cleavage. Oleic acid showed the lowest TGY due to its long-chain fatty acids, making it relatively difficult to gasify [34]. The lowest H2 yield from oleic acid was due to the formation of heavy and complex intermediate compounds from its reforming and decomposition, which are difficult to further convert into low molecular gaseous compounds [29]. The gas yields from the SCWG of oleic acid were significantly lower compared to that of pure glycerol and methanol, which also resulted in its relatively lower LHV (87 kJ/Nm3).
Methanol demonstrated the highest H2 yield of 7.7 mmol/g, followed by pure glycerol (4.4 mmol/g) and oleic acid (1.1 mmol/g) (Figure 3). This can be attributed to the highest number of hydrogen atoms per carbon atom (4) in the chemical formula of methanol (CH3OH) and the formation of simple intermediate compounds such as C1 from its reforming and hydrothermal decomposition. Methanol also demonstrated the highest H2 selectivity of 89.3% followed by glycerol (72.9%) and oleic acid (58.8%) (Table 3). This was in accordance with the decreasing order of the number of hydrogen atoms per carbon atom in the chemical formulae of model compounds. Methanol showed the highest LHV of 1079 kJ/Nm3, which was closely followed by glycerol with an LHV value of 1043 kJ/Nm3. Pure glycerol showed the highest CH4 yield of 0.87 mmol/g followed by methanol (0.56 mmol/g) and oleic acid (0.28 mmol/g). The high CH4 yield from pure glycerol was due to the enhancement of the methanation reaction during SCWG of glycerol. The CO2 yield also followed a similar trend with pure glycerol showing the highest CO2 yield of 0.27 mmol/g.
Among all model compounds, pure glycerol demonstrated the highest HGE of 16.7% followed by methanol (15.7%) and oleic acid (3.7%) (Table 3). Lower values of HGE may not necessarily translate into low efficacy of gasification as it not only depends on H2 yields but also the yields of CH4 and C2H6. The contribution of CH4 is twice and C2H6 is thrice that of H2 in calculating HGE. In addition, the molecular weight of CH4 (16 g/mol) is greater than that of H2 (1 g/mol) attributing to its greater contribution to HGE values (Equation (2)). The gas yields from SCWG of pure glycerol had relatively greater concentrations of CH4 than those from methanol. This led to a significantly higher HGE of pure glycerol compared to methanol despite the highest H2 yields and TGY. HGE values in this study are analogous to the literature, i.e., 5% HGE from SCWG of humic acid [35], 10–18% HGE from SCWG of oily wastewater [36] and 13–17% HGE from SCWG of dairy wastewater [37]. In contrast, SCWG of solid biomass produces a relatively higher amount of CH4 and C2+ gases, resulting in a higher HGE compared to that of liquid-based feedstocks as in this study [17,30]. Using catalysts can significantly enhance gasification efficiency by improving gas yields. Gong et al. [35] reported a nearly 12 times increase in gasification efficiency using Lewis acid catalysts for SCWG of humic acid due to enhancement of reforming, methanation and WGS reaction. Khorasani et al. [37] also reported a rise in gasification efficiency using formic acid as the catalyst in SCWG of dairy wastewater.
The high H2 yield obtained from all model compounds is attributed to the high reaction temperature of 500 °C, which promotes the hydrolysis of model compounds by favoring the reforming (Equation (8)) and WGS reaction (Equation (9)) of model compounds [38]. This is due to the endothermic nature of hydrolysis reactions favored at high temperatures. The reforming reaction produces mainly CO and H2. The resulting CO can then be converted via three routes, namely, WGS reaction, hydrogenation (Equation (10)) and methanation reaction (Equation (11)). Therefore, a trace amount of CO was obtained in this study due to its consumption in WGS, hydrogenation and the methanation reaction [39]. CO2 can also produce CH4 from the methanation reaction (Equation (12)). CO and CO2 can also produce carbonaceous tar through the Boudouard reaction (Equation (13)).
Reforming reaction: Organics + H2O → CO + H2
Water-gas shift reaction: CO + H2O ⇄ CO2 + H2
Hydrogenation reaction: CO + 2H2 ⇄ CH4 + 0.5O2
Methanation reaction of CO: CO + 3H2 ⇄ CH4 + H2O
Methanation reaction of CO2: CO2 + 4H2 ⇄ CH4 + 2H2O
Boudouard reaction: 2CO → C + CO2
Feedstock concentration is an important parameter that significantly influences the gas products from the SCWG process. SCWG of the three model compounds at varying feedstock concentrations of 10, 20 and 30 wt% was carried out at process conditions of 500 °C, 23–25 MPa and 1 h. A comparison of gas yields, TGY, H2 selectivity and LHV is shown in Table 4. Decreasing feedstock concentration from 30 wt% to 10 wt% increased the yields of H2 and CO2 from all the model compounds. In addition, CH4 yield decreased with decreasing feedstock concentration due to the higher intensity of reforming and WGS reactions [40]. The attenuation of the reforming reaction decreased the SCWG of model compounds resulting in lower TGY, whereas the diminution of the WGS reaction limited the conversion of CO into H2. When the feedstock concentration decreases, the concentration of water increases in the reaction mixture. This enhances the progression of reforming and WGS reaction leading to higher yields of H2. On the other hand, the methanation reaction is not primarily dependent on the water content of the feed. Hence, it was not promoted over WGS and reforming reactions, leading to lower CH4 yields at low feedstock concentrations [30]. In the case of oleic acid, TGY decreased by 7.4% and 3.6% with an increase in feedstock concentration from 10 wt% to 20 wt% and from 20 wt% to 30 wt%, respectively (Table 4). Reforming fatty acids is challenging, which is further amplified by an increased amount of oleic acid with less water content at high feedstock concentrations. The effects of increased feedstock concentration on H2 yield were most prominent with methanol as H2 yield decreased by 9.5% and 5.2% with an increase in feedstock concentration from 10 wt% to 20 wt% and 20 wt% to 30 wt%, respectively. Similarly, the effects of increased feedstock concentration on CO2 were highest with methanol as its yield decreased by 40% and with an increase in feedstock concentration from 10 wt% to 30 wt%. The highest effect of increased feedstock concentration in decreasing H2 and CO2 yields for methanol indicates the hindrance of the WGS reaction and promotion of methanation with higher CH4 yields. This was further confirmed by the increase in CH4 production from SCWG of methanol with an increase in feedstock concentration.
Pure glycerol showed a significant decrease in H2 selectivity with increased feedstock concentration. H2 selectivity decreased by 54.5% for pure glycerol followed by 48.2% for methanol and 32.9% for oleic acid with the increase in feedstock concentration from 10 wt% to 30 wt%. Methanol exhibited a higher drop in H2 yield compared to glycerol, which decreased TGY nearly twice as much compared to methanol. An increasing feedstock concentration amplified the LHV values of gaseous products because of the rise in the yields of CH4 at the expense of H2 yield. Methanol showed the highest increase in LHV with a value of 4.6% followed by oleic acid (4.1%) and pure glycerol (3.4%) with increasing feedstock concentration from 10 wt% to 30 wt%. It can be observed that the optimum feedstock concentration for achieving high yields of H2 and TGY while minimizing CH4 yield for all model compounds was 10 wt%. Therefore, 10 wt% feedstock concentration was selected as the standard feedstock concentration for further SCWG experiments.

3.3. SCWG of a Three-Component Mixture of Model Compounds of Glycerol

Experiments based on the 2,3 simple lattice design were conducted at a constant feedstock concentration of 10 wt% with a varying mixture of the model compounds of crude glycerol. Gas yields obtained from SCWG runs using the experimental design are presented in Table 5. The experimental data were subjected to polynomial regression to fit the data using Design Expert software, which generated the model equations. The accuracy and fit of these model equations and the significance of each variable in these equations were evaluated using ANOVA and are presented in Table 6. Model analysis suggested quadratic regression equations based on the significance of additional polynomial terms and the non-aliasing of models. These model equations for each response variable in terms of the factors investigated are represented below:
Y1 (H2 yield) = 4.40 A + 7.68 B + 1.06 C + 3.34 AB + 0.46 AC + 7.75 BC − 7.72 ABC
Y2 (CH4 yield) = 0.89 A + 0.57 B + 0.29 C + 0.58 AC + 0.31 BC − 1.59 ABC
Y4 (CO2 yield) = 0.30 A + 0.19 B + 0.21 C + 0.61 AB + 1.36 AC + 1.33 BC + 8.98 ABC
Y3 (TGY) = 6.11 A + 8.50 B + 1.73 C + 4.91 AB + 3.54 AC + 11.24 BC
As evident from Table 6, the model equation for H2 yield demonstrated a high R2 value of 0.9998 and an adjusted R2 of 0.9996, which confirms that the developed model equation is capable of explaining the variation in factors on H2 yield with 99.9% accuracy. The predicted R2 of 0.9972 was also in agreement with the adjusted R2. The p-value of the developed model was less than 0.0001, indicating the high significance of the model at a confidence level of 95%. The high F-value of 5191.5 was due to the low value of mean square error (0.002), also confirming the significance of the developed models.
For CH4 yield, the model equation showed a high R2 value of 0.9845, an adjusted R2 of 0.9748 and a p-value < 0.0001. This confirmed that the developed model equation was significant and can be used for the prediction of CH4 yield. Similarly, the TGY model equation showed R2 and adjusted R2 values higher than 0.9834 and 0.973, respectively. For CO2 yield prediction, the model equation showed a relatively low R2 value of 0.9586 and an adjusted R2 of 0.9231. However, the model equation had a p-value of 0.0002 and a high F-value of 101.6, suggesting the high significance of the model.
The p-values of model terms for each response are provided in Table 7. The H2 yields associated with AB (<0.0001), BC (<0.0001) and ABC (0.0002) were lower, indicating that these model terms significantly predict H2 yield. On the other hand, AC showed a borderline p-value of 0.0565. For CH4, the p-values associated with AC and BC were 0.0021 and 0.0433, respectively. Thus, these terms were used in the model. The ABC was considered despite its higher p-value. Since AB had a large p-value, it contributed significantly to predicting CH4 yields. To avoid introducing high variance (overfitting) into the model, the term AB was omitted. For CO2 yield, p-values for AB, AC, BC and ABC were lower than 0.05. Hence, all these polynomial terms were significant to include in our model. For TGY, p-values associated with AB and BC model terms were significantly lower than 0.05. For the AC term, the p-value (0.0543) was at the borderline of 0.05. However, further addition of the ABC term showed a p-value of 0.18. Hence, it was not included in the model equation.
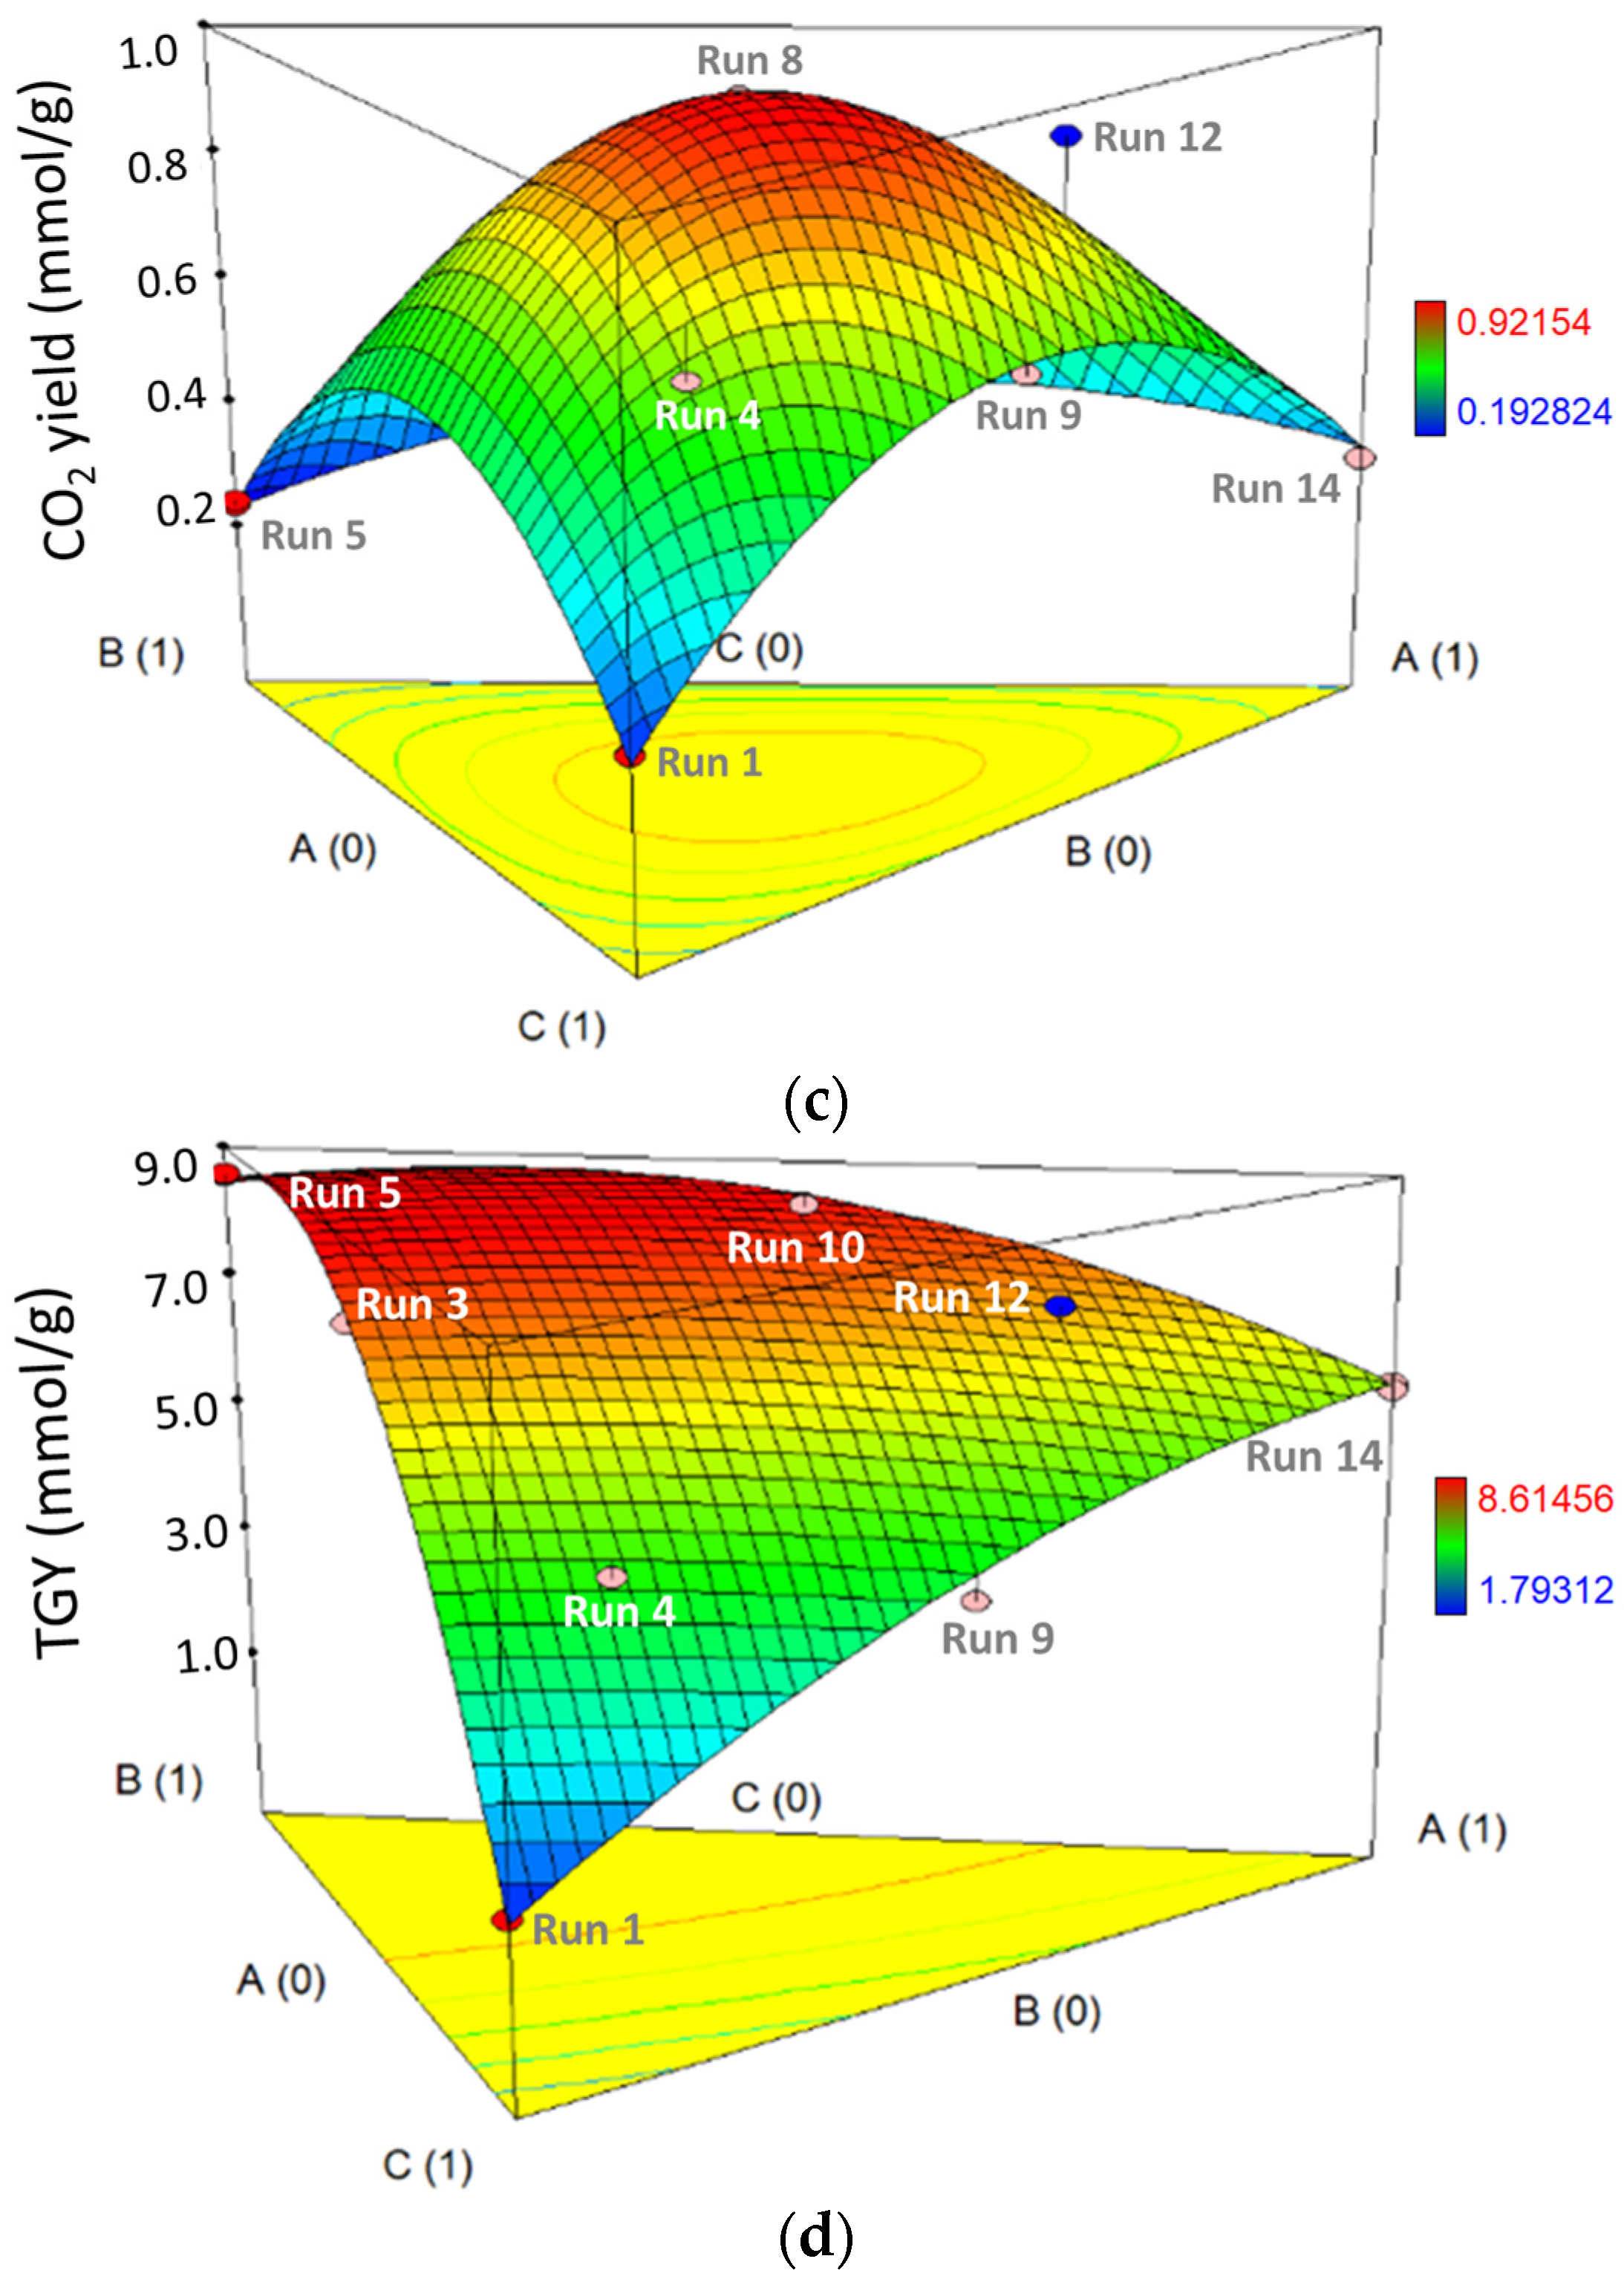
RSM curve and contour plots for each response as a function of the fraction of model compounds are presented in Figure 4. For the H2 yield response surface curve, it can be observed that H2 yield increased when the methanol concentration increased and reached its maxima of 7.8 mmol/g at the methanol vertex (A = 0, B = 1 and C = 0) (Figure 4a). This was also indicated by the high positive value of the coefficient of model term A. It can also be observed that the interaction of the two-model-compound mixtures had a positive impact on H2 yield as indicated by positive coefficients of AB, AC and BC terms. However, the interactive effect of oleic acid and glycerol with methanol decreased H2 yield at the minima of the oleic acid vertex (A = 0, B = 0 and C = 1). This was evident by the negative coefficient of the ABC interaction term. In general, a high absolute value of the coefficients of AB, BC and ABC represents a strong interactive influence of model compounds on H2 yield.
CH4 yield increased significantly with an increase in pure glycerol composition and reached its maxima at the glycerol vertex (A = 1, B = 0 and C = 0), also indicated by a high positive coefficient of A (Figure 4b). The two-model-compound mixtures had a positive interaction on CH4 yield, also confirmed by the positive coefficients of AC and BC terms. For three-model-compound mixtures, the interactive effects of methanol and oleic acid with glycerol significantly decreased the CH4 yield, which reached its minima at the oleic acid vertex (A = 0, B = 0 and C = 1). The negative interaction effects of the three-compound mixtures were significantly high, also observed from the highly negative coefficient of the ABC term. For CH4 yield, a significantly strong interaction among model compounds was observed due to the high absolute value of the coefficients of AC, BC and ABC terms.
It can be observed from Figure 4c that the interactive effects of the three-model-compound mixture had a quite large positive influence on CO2 yield. CO2 yield increased with rising feedstock concentrations of all three model compounds from their vertexes and reached its maxima of 0.93 mmol/g (A = 0.369, B = 0.368 and C = 0.363). This was also evident by the high positive coefficient of 8.98 associated with the ABC term, which is larger than the coefficients of A (0.30), B (0.19), C (0.21), AB (0.61), AC (1.36) and BC (1.33) terms. It can also be seen that the coefficients of the two-model-compound mixture were higher than the coefficients of single-model compounds. This was due to the enhanced CO2 formation with the gasification of the mixture of model compounds.
It is evident from Figure 4d that TGY increased with an increase in the methanol composition and achieved its maxima at the methanol vertex (A = 0, B = 1 and C = 0). It was also indicated by a high positive coefficient of model term B as compared to terms A and C in the model equation. The minimum of TGY was at the oleic acid vertex (A = 0, B = 0 and C = 1). The interactive effects of two-model-compound mixtures had a positive influence on TGY. This was also confirmed by the positive coefficient of AB, AC and BC model terms. The highest positive impact of the two-component mixture was with methanol and oleic acid mixtures, as indicated by its highest positive coefficient.
As evident from the RSM plots and model equations, it can be concluded that the model compounds of crude glycerol demonstrated a significant interaction during SCWG. These model equations can predict yields of SCWG of crude glycerol at a variety of compositions. The validity of our generated model equations was tested by predicting the experimental gas yield from the simulated crude glycerol by replicating the composition of a typical industrial crude glycerol and subjecting it to SCWG.

3.4. Validity of Model Equation with Simulated Crude Glycerol and Crude Glycerol

The prediction model was developed using the ash-free model compounds. In this study, the ash-free simulated crude glycerol was prepared using three model compounds, namely, pure glycerol, methanol and oleic acid. To test the robustness and reliability of the models, the percentage error in the prediction of gas yields was compared considering the difference between ash-free simulated crude glycerol and real crude glycerol containing ash.
Responses predicted by generated model equations for crude glycerol composition are presented in Table 8. The predicted gas yields (P) were compared with the experimental gas yields (ESCG) for the calculation of percentage error (e%SCG). It can be observed that the percentage error for H2 yield (0.14%) was significantly low. The positive sign associated with the percentage error shows that the experimental H2 yield was higher than the predicted yield. The high R2 value and low test percentage error values obtained for the model confirm that the model equation neither underfitted data (indicated by high R2) nor overfitted data (indicated by low percentage error).
For CH4 yield prediction, a percentage error of 1% was obtained which indicates that the prediction power of the developed model for CH4 was quite high. The percentage error also agreed well with the R2 value during model creation. This eliminates the possibility of overfitting and underfitting data. The positive value of percentage error showed that the predicted CH4 yield was lower than the experimental CH4 yield. For CO2 yield, the percentage error was somewhat high, with a value of 2.2%. However, this value was in accordance with its R2 value during model creation. For TGY, the percentage error of 3.4% was in line with its R2 value for model generation. A low percentage error between gas yields predicted by the model equation and experimental data validated the accuracy and correctness of developed model equations. Furthermore, the SCWG of crude glycerol was compared with results obtained from simulated crude glycerol to ascertain variations resulting from the complex nature of crude glycerol. On comparing experimental results of SCWG of crude glycerol (ERCG) with results of SCWG of simulated crude glycerol (ESCG), it can be observed that H2 yield from crude glycerol was 0.3% more than that from simulated crude glycerol.
A similar trend was observed where both CO2 yield and TGY were 0.1% and 0.2% more, respectively, from crude glycerol than from simulated crude glycerol. This was because crude glycerol contained some alkali metals, as confirmed by its ICP analysis (Table 2) and high pH of 8.5 (Table 1). Alkali salts used as catalysts in the transesterification process for biodiesel production rendered catalytic behavior during SCWG by enhancing reforming and WGS reactions [41]. This explains the higher yields of H2, CO2 and total gases. CO produced in reforming reaction forms a formate compound (HCOOK) with KOH catalyst. This formate compound in reaction with excess water produces H2 and CO2 [42]. Excess KOH also captures CO2, which shifts the equilibrium of the WGS reaction to the product side and further increases H2 production.
Crude glycerol produced significantly lower CH4 than simulated crude glycerol due to the attenuated methanation reaction resulting from the presence of KOH in crude glycerol [41]. Furthermore, the predicted gas yields from the developed model equation were compared with experimental data of crude glycerol. From Table 8, it is evident that the model equation quite accurately predicted the yields of H2, CH4, CO2 and total gases, with a percentage error (e%RCG) of 0.42%, −1.17%, 2.34% and 3.55%, respectively. Interestingly, for CH4 yield, the predicted yield was higher than the experimental value of crude glycerol, whereas the predicted yield was lower than the experimental value of simulated crude glycerol. Overall, the model equation demonstrated its robustness to accurately predict the gas yields from SCWG of crude glycerol. In summary, the model equation demonstrated not only high accuracy but also robustness for predicting the gas yield of crude glycerol. This work can be used to better optimize the blend of variations in crude glycerol to maximize H2 yield similar to crude oil blending in a petroleum refinery.
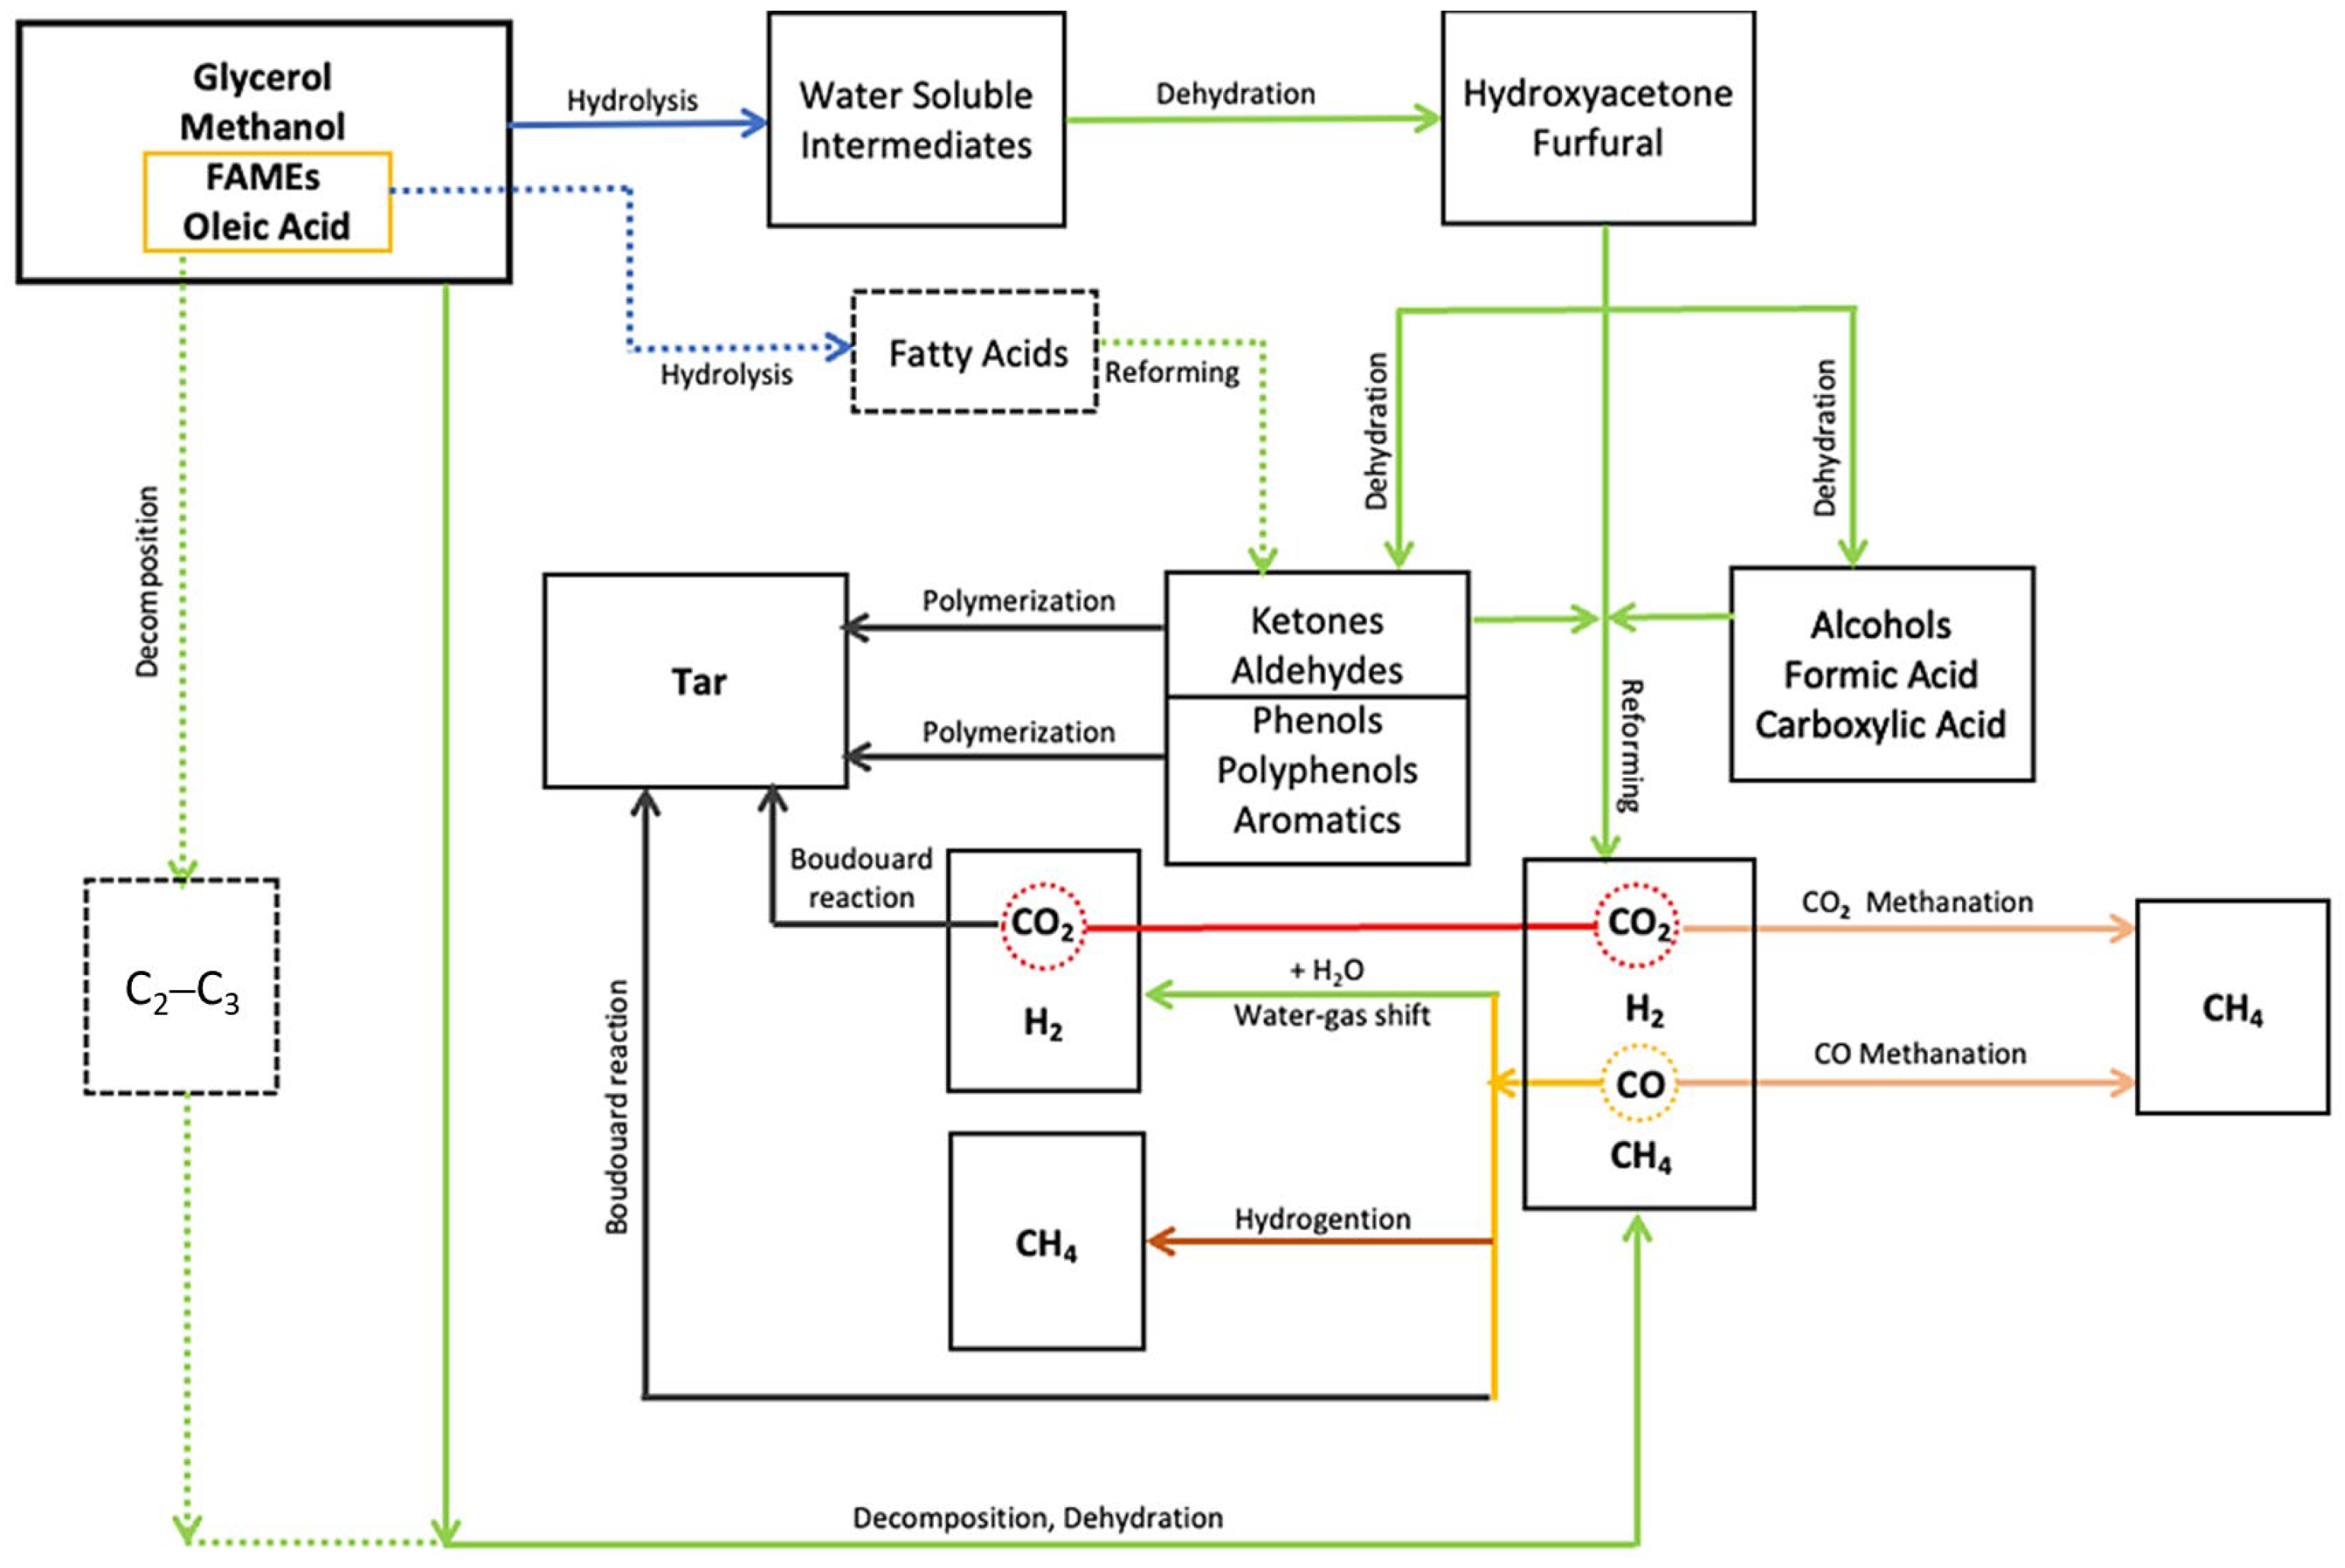
An understanding of these underlying reaction pathways, mechanisms and challenges is important for the industrial scale-up of the SCWG process. Hence, a detailed mechanism for the degradation of crude glycerol constituents during SCWG is proposed in Figure 5 based on the observations of this study and the reported literature [43,44,45]. The constituents of crude glycerol such as glycerol, methanol, oleic acid and FAMEs can undergo a hydrolysis reaction to produce water-soluble intermediates [45]. These intermediate form furfurals and hydroxy acetones [46]. These compounds further convert into ketones, organic acids, aldehydes and phenolics [47], along with gaseous products (e.g., CO2, H2, CH4 and CO) [28]. These intermediate compounds can also undergo polymerization at low temperatures and longer residence time to produce tar, which is an undesired product since it can clog the reactor lines leading to pressure drops and mass transfer limitations [48]. CO further undergoes the WGS reaction to produce more H2 and CO2 or produce CH4 via methanation and hydrogenation reactions [49]. CO2 can also produce CH4 via the methanation route. At high temperatures, model compounds directly decompose into CO2, H2, CH4 and CO.
It should be noted that a fraction of H2 in the gas phase can be contributed through water splitting during the SCWG process [50]. High temperatures and pressures beyond the critical point of water weaken the hydrogen bond and Van der Waals forces of SCW identified by the presence of anomalous hydrogen bond which is only present in SCW [51]. This helps the release of some hydrogen molecules from water into the gas phase, along with the hydrogen released from biomass hydrolysis, decomposition and reforming during SCWG. SCW also behaves as a reactant for a variety of elementary reactions of hydrolysis and other free-radical reactions [52]. The free-radical mechanisms dominate at supercritical conditions, which promote WGS reaction resulting in improved H2 production. This is due to SCW’s weak electrolytic properties and low dielectric constant, which reduces the ionic reactions while enhancing the free-radical reactions, thus contributing to H2 production [53,54].
Oleic acid and FAMEs follow additional pathways (represented by dotted lines) to form ketones, aldehydes and aromatics or directly decompose into C2–C3 hydrocarbons, which further convert into low-molecular weight gases [55]. In this study, at a SCWG temperature and reaction time of 500 °C and 1 h, respectively, the formation of char and tar was not observed. Char and tar usually occur because of secondary polymerization reactions during SCWG. However, at high reaction temperatures (≥500 °C), gasification and reforming of tar and char have been reported, which lowers their formation [56]. The formation of tar and char is not typically observed from SCWG of liquid feedstocks such as oil-based wastewater and alcohols [36]. In this study, the liquid effluent obtained after SCWG was translucent and less viscous, with no physical evidence of tar residues and char particles. Similarly, Xu et al. [21] reported that the liquid effluents from SCWG of glycerol and glycine were transparent and clear with no evidence of tar and char formation. Zhu et al. [27] reported that SCWG of glycerol at 500 °C led to no char formation compared to that of glucose, which resulted in char generation. Similarly, in a study by Yang et al. [15], no traces of tar and char were obtained from SCWG of pure glycerol and crude glycerol. Moreover, Youssef et al. [25] did not observe the formation of char and tar from SCWG of oleic acid at 500 °C. The major advantage of glycerol in SCWG is its high H2 production potential with lower chances of secondary polymerized material formation at higher temperatures [29]. Tar and char are formed at low reaction temperatures (300 °C), primarily in lignocellulosic feedstocks via direct decomposition [30].

4. Conclusions

SCWG of crude glycerol was studied using three predominant model compounds of crude glycerol, namely, pure glycerol, methanol and oleic acid. Primary comparative analysis of model compounds showed that methanol resulted in the highest H2 production of 7.7 mmol/g and total gas yield of 8.6 mmol/g, followed by pure glycerol and oleic acid. The highest CH4 yield of 0.87 mmol/g was obtained with pure glycerol, followed by methanol and oleic acid. The effects of increasing feedstock concentration from 10 wt% to 30 wt% resulted in a decrement in H2 and CO2 yields, whereas CH4 yield increased for all model compounds due to retardation of hydrolysis and WGS reactions. The 2,3 simple lattice design was used to study the interactive behavior of model compounds of crude glycerol during SCWG by model equations. ANOVA confirmed the significance of model terms and equations. Analysis of the generated RSM curve and model equations showed a strong interactive influence of the composition of model compounds in reaction mixtures on gas yields from SCWG of the model compound mixtures.
An increase in methanol concentration increased H2 yield and TGY. Similarly, increasing pure glycerol concentration increased CH4 yield. The model equation demonstrated a better accuracy to predict experimental gas yields of simulated crude based on crude glycerol composition. Furthermore, a comparison of SCWG of simulated crude glycerol and crude glycerol showed that the crude glycerol produced more H2 and a higher total gas yield as well as a lower yield of CH4. This was due to the enhanced hydrolysis and WGS reaction catalyzed by the residual alkali metals present in crude glycerol, which were previously used as catalysts in the transesterification reaction. The overall results indicate that crude glycerol can be a suitable substrate for SCWG to generate H2-rich syngas at moderate reaction conditions.

Author Contributions

Conceptualization, K.K. and A.K.D.; methodology, K.K., P.B. and S.N.; software, K.K., P.B., S.N. and A.K.D.; validation, K.K., P.B. and S.N.; formal analysis, K.K., P.B. and S.N.; investigation, K.K., P.B. and S.N.; resources, A.K.D.; data curation, K.K., P.B. and S.N.; writing—original draft preparation, K.K., P.B. and S.N.; writing—review and editing, K.K., P.B., S.N. and A.K.D.; visualization, K.K., P.B. and S.N.; supervision, A.K.D.; project administration, A.K.D.; funding acquisition, A.K.D. All authors have read and agreed to the published version of the manuscript.

Funding

The authors acknowledge the Natural Sciences and Engineering Research Council of Canada (NSERC) and Canada Research Chair (CRC) program for funding this research.

Data Availability Statement

Data available upon request.

Conflicts of Interest

The authors declare no conflict of interest.

References

  1. Rapier, R. Fossil Fuels Still Supply 84 Percent of World Energy—And Other Eye Openers from BP’s Annual Review, Forbes. Available online: https://www.forbes.com/sites/rrapier/2020/06/20/bp-review-new-highs-in-global-energy-consumption-and-carbon-emissions-in-2019/?sh=8dd42c166a16 (accessed on 2 March 2023).
  2. Nanda, S.; Reddy, S.N.; Mitra, S.K.; Kozinski, J.A. The progressive routes for carbon capture and sequestration. Energy Sci. Eng. 2016, 4, 99–122. [Google Scholar] [CrossRef]
  3. Gaur, A.; Dwivedi, G.; Baredar, P.; Jain, S. Influence of blending additives in biodiesel on physiochemical properties, engine performance, and emission characteristics. Fuel 2022, 321, 124072. [Google Scholar] [CrossRef]
  4. Rezania, S.; Oryani, B.; Park, J.; Hashemi, B.; Yadav, K.K.; Kwon, E.E.; Hur, J.; Cho, J. Review on transesterification of non-edible sources for biodiesel production with a focus on economic aspects, fuel properties and by-product applications. Energy Convers. Manag. 2019, 201, 112155. [Google Scholar] [CrossRef]
  5. Statista. Supply of Biodiesel Worldwide in 2021 with a Forecast from 2025 to 2045. Available online: https://www.statista.com/statistics/1364388/global-biodiesel-supply/ (accessed on 2 March 2023).
  6. Statista. Biodiesel Production in Canada from 2012 to 2021. Available online: https://www.statista.com/statistics/485400/total-biodiesel-canadian-production/ (accessed on 2 March 2023).
  7. Chozhavendhan, S.; Singh, M.V.P.; Fransila, B.; Kumar, R.P.; Devi, G.K. A review on influencing parameters of biodiesel production and purification processes. Curr. Res. Green Sustain. Chem. 2020, 1–2, 1–6. [Google Scholar] [CrossRef]
  8. Ningaraju, C.; Yatish, K.V.; Mithun, P.R.; Sakar, M.; Balakrishna, G. Simultaneous refining of biodiesel-derived crude glycerol and synthesis of value-added powdered catalysts for biodiesel production: A green chemistry approach for sustainable biodiesel industries. J. Clean. Prod. 2022, 363, 132448. [Google Scholar]
  9. Vivek, N.; Sindhu, R.; Madhavan, A.; Anju, A.J.; Castro, E.; Faraco, V.; Pandey, A.; Binod, P. Recent advances in the production of value added chemicals and lipids utilizing biodiesel industry generated crude glycerol as a substrate—Metabolic aspects, challenges and possibilities: An overview. Bioresour. Technol. 2017, 239, 507–517. [Google Scholar] [CrossRef]
  10. He, Q.S.; McNutt, J.; Yang, J. Utilization of the residual glycerol from biodiesel production for renewable energy generation. Renew. Sustain. Energy Rev. 2017, 71, 63–76. [Google Scholar] [CrossRef]
  11. Ortiz, F.J.G.; Ollero, P.; Serrera, A.; Sanz, A. Thermodynamic study of the supercritical water reforming of glycerol. Int. J. Hydrogen Energy 2011, 36, 8994–9013. [Google Scholar] [CrossRef]
  12. van Bennekom, J.G.; Venderbosch, R.H.; Assink, D.; Heeres, H.J. Reforming of methanol and glycerol in supercritical water. J. Supercrit. Fluids 2011, 58, 99–113. [Google Scholar] [CrossRef]
  13. Guo, S.; Guo, L.; Cao, C.; Yin, J.; Lu, Y.; Zhang, X. Hydrogen production from glycerol by supercritical water gasification in a continuous flow tubular reactor. Int. J. Hydrogen Energy 2012, 37, 5559–5568. [Google Scholar] [CrossRef]
  14. Guo, S.; Guo, L.; Yin, J.; Jin, H. Supercritical water gasification of glycerol: Intermediates and kinetics. J. Supercrit. Fluids 2013, 78, 95–102. [Google Scholar] [CrossRef]
  15. Yang, F.; Hanna, M.A.; Marx, D.B.; Sun, R. Optimization of hydrogen production from supercritical water gasification of crude glycerol—Byproduct of biodiesel production. Int. J. Energy Res. 2013, 37, 1600–1609. [Google Scholar] [CrossRef]
  16. Tapah, B.F.; Santos, R.C.D.; Leeke, G.A. Processing of glycerol under sub and supercritical water conditions. Renew. Energy 2014, 62, 353–361. [Google Scholar] [CrossRef]
  17. Okolie, J.A.; Nanda, S.; Dalai, A.K.; Berruti, F.; Kozinski, J.A. A review on subcritical and supercritical water gasification of biogenic, polymeric and petroleum wastes to hydrogen-rich synthesis gas. Renew. Sustain. Energy Rev. 2020, 119, 109546. [Google Scholar] [CrossRef]
  18. Okolie, J.A.; Rana, R.; Nanda, S.; Dalai, A.K.; Kozinski, J.A. Supercritical water gasification of biomass: A state-of-the-art review of process parameters, reaction mechanisms and catalysis. Sustain. Energy Fuels 2019, 3, 578–598. [Google Scholar] [CrossRef]
  19. Ferreira-Pinto, L.; Parizi, M.P.S.; de Araújo, P.C.C.; Zanette, A.F.; Cardozo-Filho, L. Experimental basic factors in the production of H2 via supercritical water gasification. Int. J. Hydrogen Energy 2019, 44, 25365–25383. [Google Scholar] [CrossRef]
  20. International Energy Agency (IEA). Global Hydrogen Review 2021. Available online: www.iea.org (accessed on 2 March 2023).
  21. Xu, D.; Wang, S.; Hu, X.; Chen, C.; Zhang, Q.; Gong, Y. Catalytic gasification of glycine and glycerol in supercritical water. Int. J. Hydrogen Energy 2009, 34, 5357–5364. [Google Scholar] [CrossRef]
  22. Yan, M.; Liu, Y.; Song, Y.; Xu, A.; Zhu, G.; Jiang, J.; Hantoko, D. Comprehensive Experimental Study on Energy Conversion of household kitchen waste via integrated hydrothermal carbonization and supercritical water gasification. Energy 2022, 242, 123054. [Google Scholar] [CrossRef]
  23. Liu, J.; Wang, D.; Yu, C.; Jiang, J.; Guo, M.; Hantoko, D.; Yan, M. A two-step process for energy-efficient conversion of food waste via supercritical water gasification: Process design, products analysis, and electricity evaluation. Sci. Total Environ. 2021, 752, 142331. [Google Scholar] [CrossRef]
  24. Supamathanon, N.; Boonserm, K.; Osakoo, N.; Wittayakun, J.; Prayoonpokarach, S.; Chanlek, N.; Dungkaew, W. Potassium supported on zeolite-geopolymer hybrid materials as a new solid base catalyst for transesterification of soybean oil. Renew. Energy 2023, 202, 1460–1469. [Google Scholar] [CrossRef]
  25. Youssef, E.A.; Nakhla, G.; Charpentier, P.A. Oleic acid gasification over supported metal catalysts in supercritical water: Hydrogen production and product distribution. Int. J. Hydrogen Energy 2011, 36, 4830–4842. [Google Scholar] [CrossRef]
  26. Pinkard, B.R.; Kramlich, J.C.; Novosselov, I.V. Gasification pathways and reaction mechanisms of primary alcohols in supercritical water. ACS Sustain. Chem. Eng. 2020, 8, 4598–4605. [Google Scholar] [CrossRef]
  27. Zhu, C.; Wang, R.; Jin, H.; Lian, X.; Guo, L.; Huang, J. Supercritical water gasification of glycerol and glucose in different reactors: The effect of metal wall. Int. J. Hydrogen Energy 2016, 41, 16002–16008. [Google Scholar] [CrossRef]
  28. Reddy, S.N.; Nanda, S.; Dalai, A.K.; Kozinski, J.A. Supercritical water gasification of biomass for hydrogen production. Int. J. Hydrogen Energy 2014, 39, 6912–6926. [Google Scholar] [CrossRef]
  29. Reddy, S.N.; Nanda, S.; Kozinski, J.A. Supercritical water gasification of glycerol and methanol mixtures as model waste residues from biodiesel refinery. Chem. Eng. Res. Des. 2016, 113, 17–27. [Google Scholar] [CrossRef]
  30. Correa, C.R.; Kruse, A. Supercritical water gasification of biomass for hydrogen production—Review. J. Supercrit. Fluids 2018, 133, 573–590. [Google Scholar] [CrossRef]
  31. Kang, K.; Azargohar, R.; Dalai, A.K.; Wang, H. Noncatalytic gasification of lignin in supercritical water using a batch reactor for hydrogen production: An Experimental and Modeling Study. Energy Fuels 2015, 29, 1776–1784. [Google Scholar] [CrossRef]
  32. Rana, R.; Nanda, S.; Kozinski, J.A.; Dalai, A.K. Investigating the applicability of Athabasca bitumen as a feedstock for hydrogen production through catalytic supercritical water gasification. J. Environ. Chem. Eng. 2018, 6, 182–189. [Google Scholar] [CrossRef]
  33. Sarker, T.R.; Nanda, S.; Dalai, A.K. Hydrogen-rich gas production from hydrothermal gasification of fuel pellets obtained from co-pelletization of agricultural residues. Int. J. Hydrogen Energy. 2022. [Google Scholar] [CrossRef]
  34. Dang, T.N.; Sahraei, O.A.; Olivier, A.; Iliuta, M.C. Effect of impurities on glycerol steam reforming over Ni-promoted metallurgical waste driven catalyst. Int. J. Hydrogen Energy 2022, 47, 4614–4630. [Google Scholar] [CrossRef]
  35. Gong, M.; Nanda, S.; Hunter, H.N.; Zhu, W.; Dalai, A.K.; Kozinski, J.A. Lewis acid catalyzed gasification of humic acid in supercritical water. Catal. Today 2017, 291, 13–23. [Google Scholar] [CrossRef]
  36. Zhiyong, Y.; Xiuyi, T. Hydrogen generation from oily wastewater via supercritical water gasification (SCWG). J. Ind. Eng. Chem. 2015, 23, 44–49. [Google Scholar] [CrossRef]
  37. Khorasani, R.; Khodaparasti, M.S.; Tavakoli, O. Hydrogen production from dairy wastewater using catalytic supercritical water gasification: Mechanism and reaction pathway. Int. J. Hydrogen Energy 2021, 46, 22368–22384. [Google Scholar] [CrossRef]
  38. Chen, J.; Fu, L.; Tian, M.; Kang, S.; Jiaqiang, E. Comparison and synergistic effect analysis on supercritical water gasification of waste thermoplastic plastics based on orthogonal experiments. Energy 2022, 261, 125104. [Google Scholar] [CrossRef]
  39. Zhu, C.; Guo, L.; Jin, H.; Huang, J.; Li, S.; Lian, X. Effects of reaction time and catalyst on gasification of glucose in supercritical water: Detailed reaction pathway and mechanisms. Int. J. Hydrogen Energy 2016, 41, 6630–6639. [Google Scholar] [CrossRef]
  40. Lee, C.S.; Conradie, A.V.; Lester, E. Review of supercritical water gasification with lignocellulosic real biomass as the feedstocks: Process parameters, biomass composition, Catalyst Development, reactor design and its challenges. Chem. Eng. J. 2021, 415, 128837. [Google Scholar] [CrossRef]
  41. Nanda, S.; Dalai, A.K.; Kozinski, J.A. Supercritical water gasification of timothy grass as an energy crop in the presence of alkali carbonate and hydroxide catalysts. Biomass Bioenergy 2016, 95, 378–387. [Google Scholar] [CrossRef]
  42. Zhang, H.W.; Zhu, W.; Gong, M.; Fan, Y. Influence of alkali catalysts on the supercritical water gasification of cyanobacteria. Fresenius Environ. Bull. 2016, 25, 2970–2976. [Google Scholar]
  43. Cengiz, N.Ü.; Yıldız, G.; Sert, M.; Gökkaya, D.S.; Sağlam, M.; Yüksel, M.; Ballice, L. Hydrothermal gasification of a biodiesel by-product crude glycerol in the presence of phosphate based catalysts. Int. J. Hydrogen Energy 2015, 40, 14806–14815. [Google Scholar] [CrossRef]
  44. Madenoğlu, T.G.; Sağlam, M.; Yüksel, M.; Ballice, L. Hydrothermal gasification of biomass model compounds (cellulose and lignin alkali) and model mixtures. J. Supercrit. Fluids 2016, 115, 79–85. [Google Scholar] [CrossRef]
  45. Štefanko, D.; Rusková, R.; Jelemenský, Ľ. Kinetic models of simple alcohols SCWG. Chem. Papers 2019, 74, 333–347. [Google Scholar] [CrossRef]
  46. Hu, Y.; Gong, M.; Xing, X.; Wang, H.; Zeng, Y.; Xu, C.C. Supercritical water gasification of biomass model compounds: A Review. Renew. Sustain. Energy Rev. 2020, 118, 109529. [Google Scholar] [CrossRef]
  47. Wei, N.; Xu, D.; Hao, B.; Guo, S.; Guo, Y.; Wang, S. Chemical reactions of organic compounds in supercritical water gasification and oxidation. Water Res. 2021, 190, 116634. [Google Scholar] [CrossRef] [PubMed]
  48. Kou, J.; Feng, H.; Wei, W.; Wang, G.; Sun, J.; Jin, H.; Guo, L. Study on the detailed reaction pathway and catalytic mechanism of a Ni/ZrO2 catalyst for supercritical water gasification of diesel oil. Fuel 2022, 312, 122849. [Google Scholar] [CrossRef]
  49. Bian, C.; Zhang, R.; Dong, L.; Bai, B.; Li, W.; Jin, H.; Cao, C. Hydrogen/methane production from supercritical water gasification of lignite coal with plastic waste blends. Energy Fuels 2020, 34, 11165–11174. [Google Scholar] [CrossRef]
  50. Sebastiani, D.; Parrinello, M. Ab-initio study of NMR chemical shifts of water under normal and supercritical conditions. ChemPhysChem 2002, 3, 675. [Google Scholar] [CrossRef] [PubMed]
  51. Matsumura, Y.; Minowa, T.; Potic, B.; Kersten, S.R.A.; Prins, W.; van Swaaij, W.P.M.; van de Beld, B.; Elliott, D.C.; Neuenschwander, G.G.; Kruse, A.; et al. Biomass gasification in near- and super-critical water: Status and prospects. Biomass Bioenergy 2005, 29, 269–292. [Google Scholar] [CrossRef]
  52. Akiya, N.; Savage, P.E. Roles of water for chemical reactions in high-temperature water. Chem. Rev. 2002, 102, 2725–2750. [Google Scholar] [CrossRef]
  53. Jarana, M.B.G.; Sánchez-Oneto, J.; Portela, J.R.; Nebot Sanz, E.; de la Ossa, E.J.M. Supercritical water gasification of industrial organic wastes. J. Supercrit. Fluids 2008, 46, 329–334. [Google Scholar] [CrossRef]
  54. Wang, Q.; Zhang, X.; Cui, D.; Bai, J.; Wang, Z.; Xu, F.; Wang, Z. Advances in supercritical water gasification of lignocellulosic biomass for hydrogen production. JAAP 2023, 170, 105934. [Google Scholar] [CrossRef]
  55. Liao, Z.; Wang, C.; Tang, X.; Wang, Y.; Lin, Z.; Ren, P.; Wang, L.; Xu, H.; Yang, J.; Cai, J. Product characterization of hydrothermal liquefaction and supercritical water gasification of water hyacinth. Environ. Eng. Sci. 2022, 39, 268–286. [Google Scholar] [CrossRef]
  56. Surjosatyo, A.; Anggriawan, M.B.; Hermawan, A.A.; Dafiqurrohman, H. Comparison between secondary thermal cracking methods and venturi scrubber filtering in order to reduce tar in biomass gasification. Energy Proc. 2019, 158, 749–754. [Google Scholar] [CrossRef]
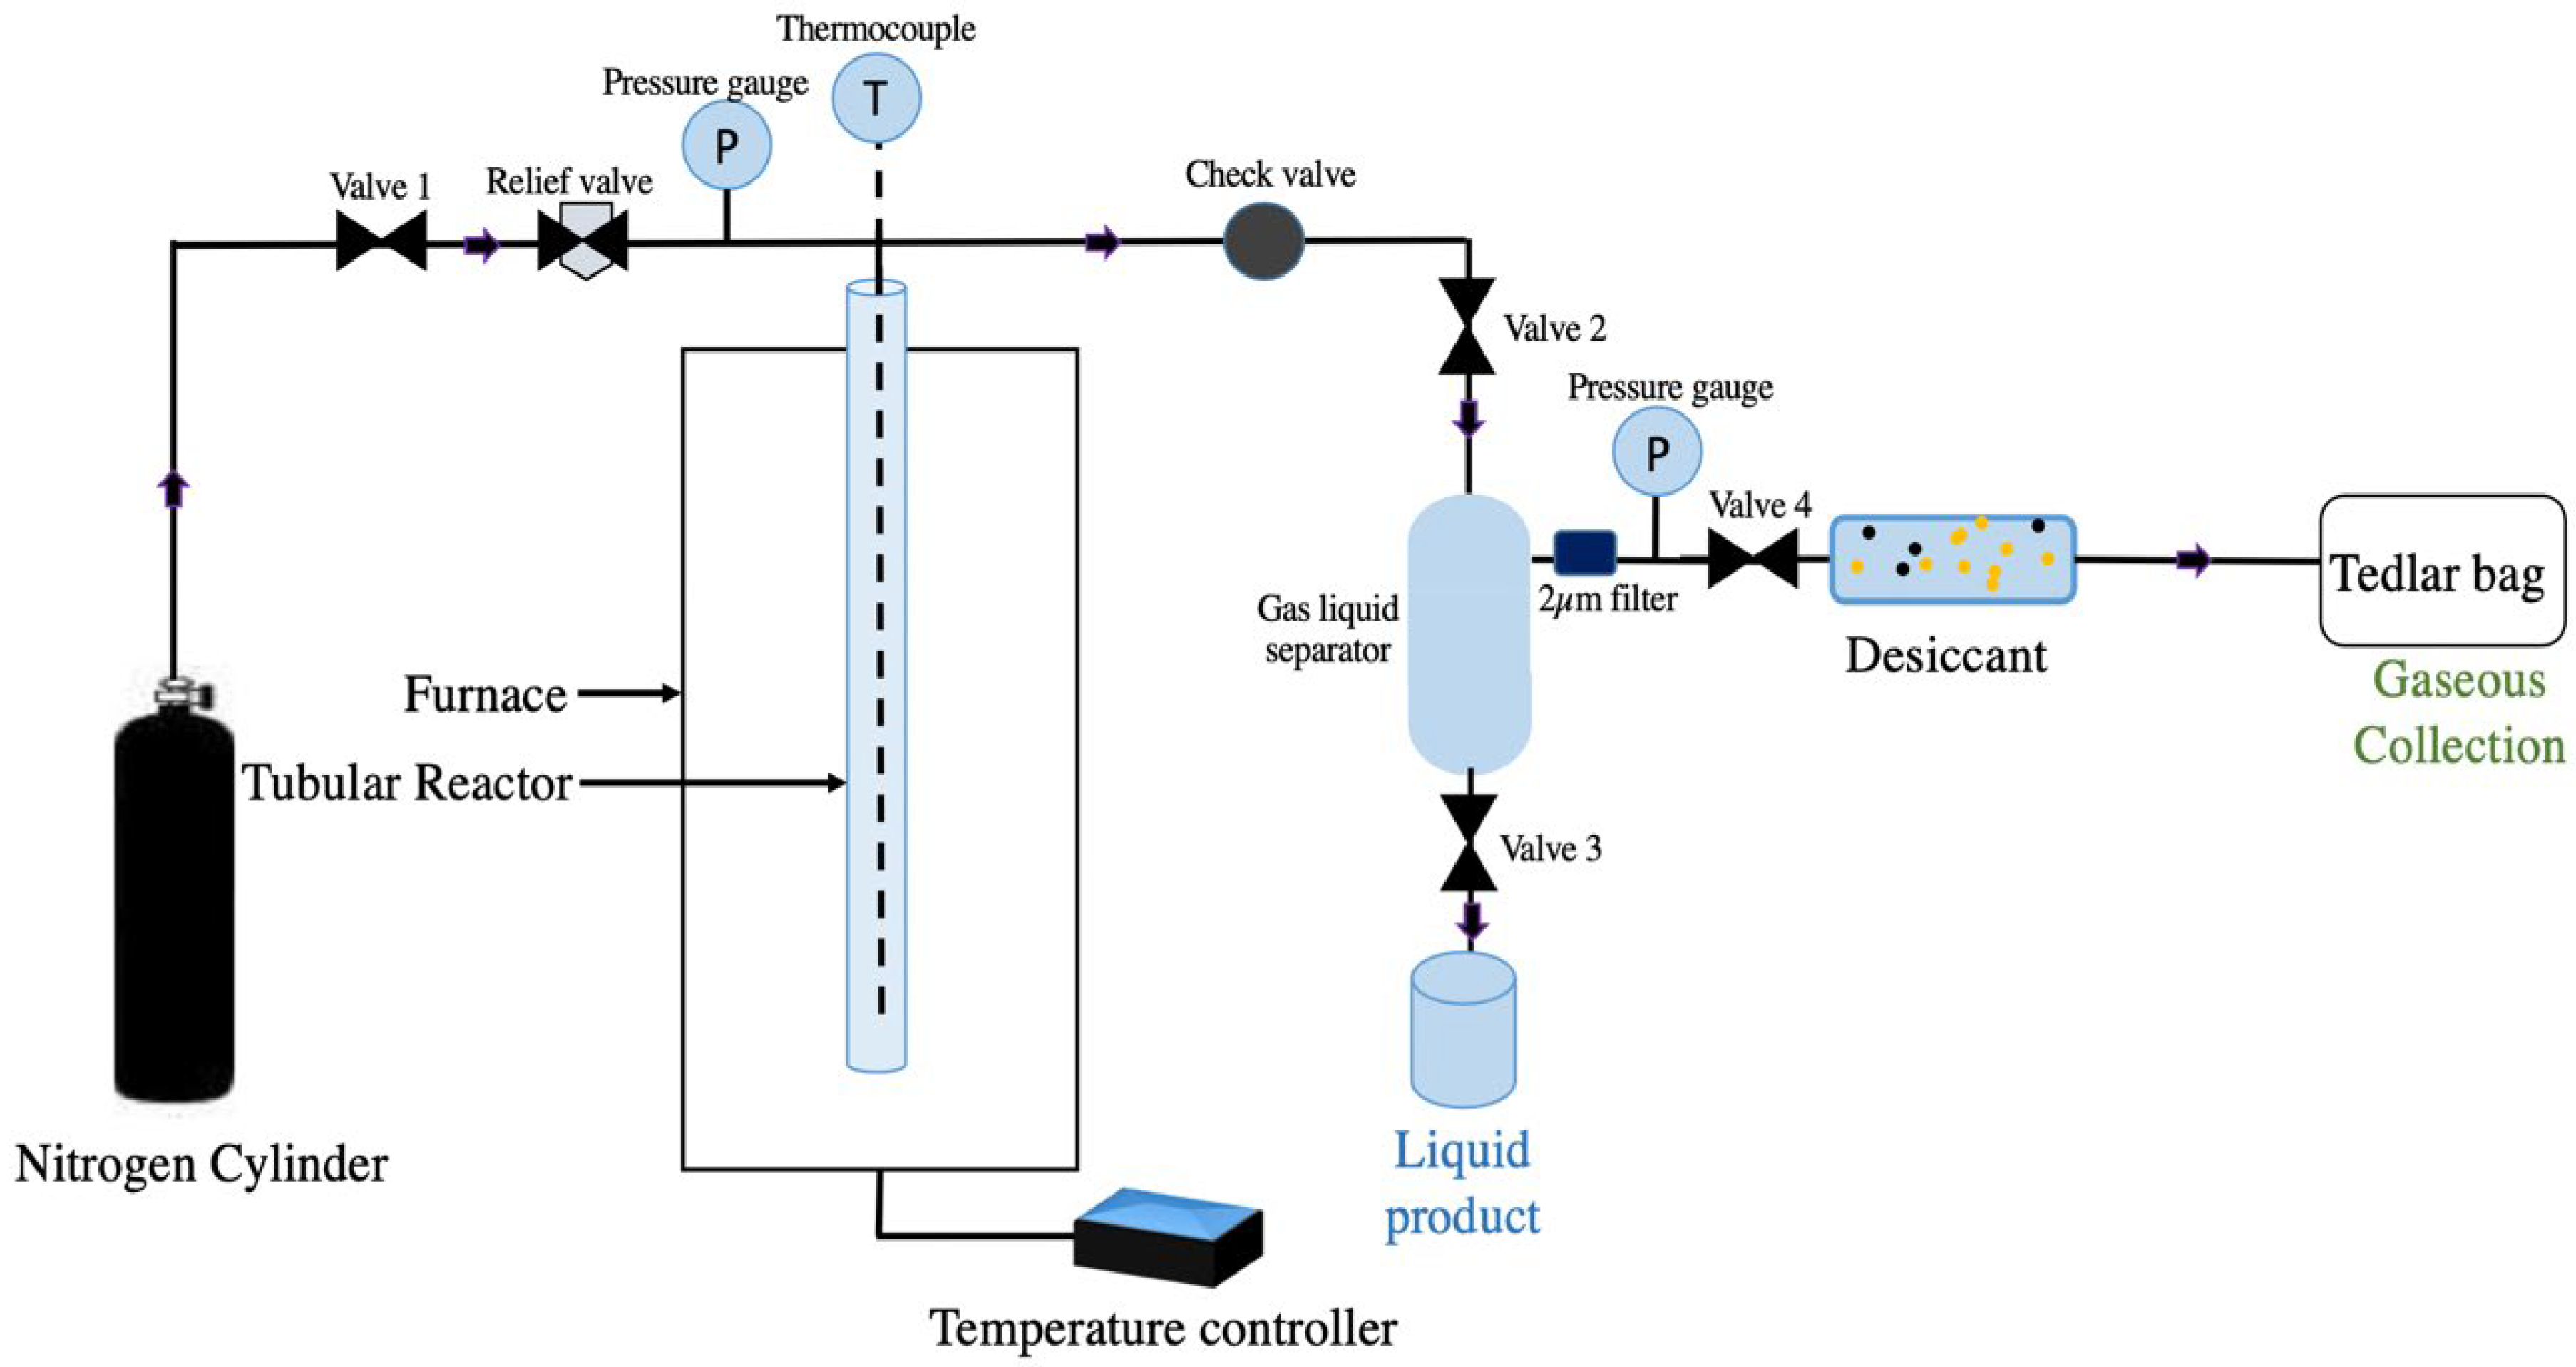
Figure 1. Schematics of SCWG reactor assembly.
Energies 16 03746 g001
Figure 2. Design of the 2,3 lattice with pure glycerol (A), methanol (B) and oleic acid (C).
Energies 16 03746 g002
Figure 3. Gas yields from SCWG of model compounds at 500 °C, 23–25 MPa, 10 wt% feedstock concentration and 1 h.
Energies 16 03746 g003
Figure 4. Interactive effects of model compounds: (a) H2 yield, (b) CH4 yield, (c) CO2 yield and (d) TGY at reaction conditions of 500 °C, 23–35 MPa, 10 wt% feedstock concentration and 1 h. (Note: A, B and C in the figure axes represent pure glycerol, methanol and oleic acid, respectively. Please refer to Table 5 for the conditions of experimental runs.)
Energies 16 03746 g004aEnergies 16 03746 g004b
Figure 5. Proposed mechanism of SCWG of crude glycerol and its model compounds.
Energies 16 03746 g005
Table 1. Typical composition of feedstocks.
Crude GlycerolSimulated Crude GlycerolPure GlycerolMethanolOleic Acid
Glycerol (wt%)41.944.7>99--
Methanol (wt%)20.221.5->99-
Oleic acid (wt%)31.733.8-->99
Ash (wt%)4.5----
Moisture (wt%)1.7----
Carbon (wt%)48.748.138.432.677.8
Hydrogen (wt%)9.89.79.111.812.7
Nitrogen (wt%)0.40.40.50.20.4
Sulfur (wt%)--0.1-0.1
Oxygen (wt%)36.641.851.955.49.1
pH value 8.57.87.08.19.2
Note: Oleic acid concentration in crude glycerol also includes fatty acid methyl esters (FAMEs).
Table 2. Major elements identified in crude glycerol through ICP analysis.
ElementConcentration (ppm)
K 5473
Na 117
Si 11.1
Ca 9.8
Fe 4.7
S 3.4
P 2.7
Mg 1.9
Cs 1.7
Li 1.3
Table 3. Total yields, LHV, HGE and HS of gas products from SCWG of model compounds at reaction conditions of 500 °C, 23–35 MPa, 10 wt% feedstock concentration and 1 h.
Model CompoundTotal Gas Yield (mmol/g)LHV (kJ/Nm3)HGE
(%)
HS
(%)
Pure glycerol6.02109616.772.9
Methanol8.61110815.789.4
Oleic acid1.793283.758.7
Table 4. Effect of feedstock concentration on SCWG of model compounds at reaction conditions of 500 °C, 23–35 MPa and 1 h.
Model CompoundFeedstock Concentration (wt%)H2 Yield (mmol/g)CH4 Yield (mmol/g)CO2 Yield (mmol/g)Total Gas Yield (mmol/g)LHV (kJ/Nm3)
Pure glycerol104.390.870.276.021096
204.111.010.215.831125
303.911.090.175.671132
Methanol107.700.560.208.611108
206.970.680.168.021133
306.610.790.127.771158
Oleic acid101.050.280.221.79328
200.980.310.191.66332
300.910.340.161.60341
Table 5. Experimental gas yields at reaction conditions of 500 °C, 23–35 MPa, 10 wt% feed concentration and 1 h.
Experimental RunFactor 1Factor 2Factor 3Response 1Response 2Response 3Response 4
Pure Glycerol (A)Methanol (B)Oleic Acid (C)H2 Yield (Y1) (mmol/g)CH4 Yield (Y2) (mmol/g)Total Gas Yield (Y3) (mmol/g)CO2 Yield (Y4) (mmol/g)
10011.050.281.790.22
20011.050.291.800.22
300.50.56.320.517.870.57
40.1670.1670.6673.660.535.130.62
50107.700.568.610.20
60107.690.568.600.19
70.1670.6670.1677.060.588.370.59
80.3330.3330.3335.370.598.361.22
90.500.52.820.724.440.57
100.50.506.880.758.390.38
110.50.506.890.758.400.38
120.6670.1670.1674.930.847.500.82
131004.400.876.100.27
141004.390.876.020.27
Table 6. ANOVA for model equations of SCWG of model compounds of crude glycerol.
H2 Yield CH4 YieldCO2 YieldTotal Gas Yield
Model
Sum of squares 66.20.50.775.4
Mean square error11.00.090.1215.1
Degree of freedom6565
F-value5191.5101.627.094.6
p-value <0.0001<0.00010.0002<0.0001
Residual
Sum of squares0.020.0070.031.27
Mean square error0.0020.0010.0040.16
Degree of freedom7878
Model prediction
R20.99980.98450.95860.9834
Adjusted R20.99960.97480.92310.9730
Predicted R20.99720.83270.53890.9517
Table 7. p-values of interactive model terms for each response variable.
ResponseH2
Yield
CH4
Yield
CO2
Yield
Total Gas Yield
AB<0.0001-0.03250.0056
BC<0.00010.04330.0026<0.0001
AC0.05650.00210.00230.0543
ABC0.00090.10540.0030-
Note: Pure glycerol (A), methanol (B) and oleic acid (C).
Table 8. Difference between predicted values versus experimental values at the experimental conditions of 500 °C, 23–35 MPa, 10 wt% feed concentration, 1 h and mixture condition of pure glycerol (A = 0.447), methanol (B = 0.215) and oleic acid (C = 0.338).
ResponsePredicted Values (P) (mmol/g)Experimental Yields from Simulated Crude Glycerol (ESCG) (mmol/g)Error Percentage (e%SCG)Experimental Yields from Crude Glycerol (ERCG) (mmol/g)Error Percentage
(e%RCG)
Difference (d%RCG-SCG)
H2 yield 4.684.690.144.700.420.28
CH4 yield0.680.681.00.67–1.17–2.15
CO2 yield0.900.922.240.922.350.11
Total gas yield6.977.213.367.233.560.21
Abbreviations: ESCG (experimental gas yields from simulated crude glycerol), e%SCG (error percentage in predicted gas yields from simulated crude glycerol), ERCG (experimental gas yields from crude glycerol), e%SCG (error percentage in predicted yields from crude glycerol), d%RCG-SCG (percentage difference between experimental gas yields of crude glycerol and simulated crude glycerol).
Disclaimer/Publisher’s Note: The statements, opinions and data contained in all publications are solely those of the individual author(s) and contributor(s) and not of MDPI and/or the editor(s). MDPI and/or the editor(s) disclaim responsibility for any injury to people or property resulting from any ideas, methods, instructions or products referred to in the content.