Article

Analysis of the Efficiency of Traction Drive Control Systems of Electric Locomotives with Asynchronous Traction Motors

by
Sergey Goolak
1,*,
Borys Liubarskyi
2,
Ievgen Riabov
2,
Vaidas Lukoševičius
3,*,
Artūras Keršys
3 and
Sigitas Kilikevičius
3
1
Department of Electromechanics and Rolling Stock of Railways, State University of Infrastructure and Technologies, Kyrylivska Str. 9, 04071 Kyiv, Ukraine
2
Department of Electrical Transport and Diesel Locomotive, National Technical University «Kharkiv Polytechnic Institute», Kyrpychova Str. 2, 61002 Kharkiv, Ukraine
3
Faculty of Mechanical Engineering and Design, Kaunas University of Technology, Studentų Str. 56, 51424 Kaunas, Lithuania
*
Authors to whom correspondence should be addressed.
Energies 2023, 16(9), 3689; https://doi.org/10.3390/en16093689
Submission received: 31 March 2023 / Revised: 21 April 2023 / Accepted: 24 April 2023 / Published: 25 April 2023
(This article belongs to the Special Issue Forecasting and Optimization in Transport Energy Management Systems)

Abstract

:
An analysis of the operating conditions of the traction drives of an electric rolling stock with asynchronous traction motors was conducted. In the process of operation, the electric traction drive with both direct torque control and vector control was found to possibly experience unstable modes, both in terms of power supply and load. The models of electric locomotive traction drives with asynchronous electric motors with either vector or direct torque control were adapted to account for the possible presence of the aforementioned operational factors. As a result of the modeling, the starting characteristics of the electric traction drives with different control systems were obtained both in the absence and in the presence of power supply and load disturbances. The following cases were investigated for the drive with vector and direct torque control in the absence of power supply and torque disturbances: drive output at the rated speed of rotation of the electric motor shaft; 10% reduction in the rated speed; 10% increase in the rated speed. The comparison of the results obtained has demonstrated that, at lower than nominal frequencies, the electric traction drive with direct torque control has higher accuracy in its regulation of the rotational speed and torque, lower power consumption from the power supply, lower torque overshooting, but a higher level of torque pulsations than the electric traction drive with vector control. Meanwhile, at higher than nominal frequencies, the vector control has higher accuracy in its regulation of the speed, lower torque overshooting, shorter duration of transient processes, and lower torque pulsations than the direct torque control. Moreover, as a result of the investigations, the traction drive with direct torque control has been found to be more resistant to power supply and load disturbances. The results of this work are applicable to the investigation of the influence of electric traction drive control methods on the energy efficiency of the traction drive of an electric locomotive with an alternating current (AC).

1. Introduction

Asynchronous electric motors with short-circuited rotors have been widely used as electric traction motors in contemporary rolling stock vehicles [1,2,3].
Systems with a scalar [4,5], vector [6,7,8], and direct torque control [9,10,11] are used as electric traction drive control systems for asynchronous traction motors.
The works focusing on the control systems of asynchronous electric motors in general purpose industrial-grade electric drives have shown that each of these systems has its advantages in the respective operating modes of the electric drive. For example, scalar control is applied at high rotational speeds of the electric motor shaft, while it would be more rational to apply vector and direct torque control at low rotational speeds of the motor shaft. In addition, the systems of a variable-frequency electric drive with scalar (volt/frequency) control allow one to perform speed regulation over a fairly wide range (up to 10:1). Nevertheless, in contrast to the vector and direct torque control systems, it is not possible to achieve a high quality of transient processes using scalar control systems. As a result, this leads to power loss and, in turn, to a decrease in the energy efficiency of this system compared to vector and direct torque control systems [12,13,14]. Due to this factor, it would be irrational to use the scalar control system for asynchronous electric motors in electric traction drives of an electric rolling stock.
Vector control systems and direct torque control systems have found the widest application as control systems for asynchronous electric motors in electric traction drives. The advantages and disadvantages of these control systems are explained in more detail in [15,16,17].
A vector system has the following advantages over a direct torque control system:
-
Faster dynamic response;
-
Lower torque pulsations.
-
The disadvantages of a vector control system include:
-
The complexity of the control system;
-
Lower energy efficiency at lower motor shaft rotational speeds;
-
Simultaneous control of motor torque and magnetic flux;
-
A more complex control system architecture.
An electric rolling stock can be conventionally classified by the nature of its operation as either mainline [18,19], urban [20,21], suburban [22,23], or quarry [24,25]. The choice of a control system that takes into account the operating conditions of an electric rolling stock is an important task during the design of an electric traction drive. Energy efficiency is the main criterion for the selection of control systems for all types of electric rolling stock. Mainline vehicles are operated mainly at high speeds; hence, the accuracy of speed control is used as an additional criterion. The rest of the electric rolling stock is operated under the conditions of frequent starting and braking of the electric traction motors. Therefore, an additional criterion for the selection of an electric traction drive control system is the accuracy of the torque control at low speeds.
During the operation of an electric rolling stock, the electric traction drive is constantly subjected to various disturbances caused by various operational factors [26,27]. These disturbances cause transient processes in the electric traction drive system for short periods of time. This, in turn, causes asymmetry in the stator current systems of the electric traction motors and asymmetry in the voltage system at the traction inverter output.
A non-stationary, non-deterministic process of voltage variation in the catenary network [27,28,29] causes voltage pulsations in the DC link. Moreover, these voltage pulsations are of a stochastic nature. Otherwise, operational factors result in the electric traction drive of the electric rolling stock being subjected to stochastic power supply disturbances.
A wheel slippage attempt of a single electric motor causes uneven current loading, which leads to the asymmetry of the traction currents [30,31] when several electric traction motors are fed from a single inverter. When a train is in motion, there is a constant change in the dynamics of both the electric rolling stock itself and the wagons [32,33,34]. Moreover, both the slippage attempt of one wheel pair and the constant change in train dynamics result in the constant change of the load on the shaft of the electric traction motors as a factor. Otherwise, operational factors result in constant torque disturbance for the electric traction drive of the electric rolling stock.
As a result of the above operational factors, which give rise to power supply and torque disturbances, it is necessary to consider the operational stability of the electric traction drive under the influence of these disturbances.
Thus, it is relevant to compare the characteristics of a vector system and the direct torque control of asynchronous electric motors of an electric traction drive, taking into account the nature of the operation and operational features of an electric rolling stock.
When investigating high-power electromechanical systems, it is reasonable to apply mathematical modeling methods [35,36,37]. This is primarily associated with the high costs of an investigation of a real-life system. Second, a preliminary computational investigation is required due to the insufficient research-based-knowledge of the stochastic processes of voltage changes in the catenary network and electrodynamic processes in the electric traction drive system during the wheel slippage attempt, as well as changes in the train dynamics. This is necessary to identify the features that can be investigated further during the simulation of the real-world system.
The objective of this work is to compare the traction parameters of an electric rolling stock with vector control and direct torque control, taking into account various operational factors.
To carry out this work, the following tasks were performed:
-
The operation of the vector control and direct torque control circuits is explained in Section 2;
-
In Section 3, the steady state starting characteristics in the absence and presence of disturbances in the inverter power system and torque on the motor shaft were obtained for the vector control and direct torque control schemes through simulation.
-
The results obtained are discussed in Section 4.
-
The conclusions are presented in Section 5.

2. Materials and Methods

The characteristics of the electric traction drive of an electric rolling stock with vector control and direct torque control of an asynchronous motor were investigated on the basis of their mathematical models. Simulation models of electric traction drive with different types of asynchronous electric motor control systems were implemented in the MATLAB/SIMULINK R2021b software environment. Investigating the starting characteristics of the electric traction drive included three experiments carried out in each of the simulation models. During the first experiment, the starting characteristics were obtained for both control systems of the electric traction drive, which operated without taking into account the supply voltage and torque disturbances. The disturbance in the electrical drive supply voltage was accounted for in the second experiment. The third experiment took into account the disturbance of the load torque of the electric drive.
An electric DC-3 (ДC-3) alternating current locomotive DC-3 (ДC-3) (produced in Ukraine) with an asynchronous electric traction motor was used as the object of the investigation. The technical characteristics of the electric locomotive are presented in Table 1 [20]. Asynchronous electric traction motors with a squirrel-cage rotor AD914U1 (AД914У1) are used on DC-3 (ДC-3) electric locomotives. The technical characteristics of the AD914U1 electric traction motor are given in Table 1 [38].
The data sheet parameters of the autonomous inverter included in the DC-3 (ДC-3) electric locomotive traction drive are provided in Table 2. In an autonomous voltage inverter, the 5SNA1200G450350 modules are used as the IGBT module. Their specifications are provided in Table 3 [39,40].
The remaining parameters required for the implementation of the electric traction drive simulation models, and derived from the calculations, are listed below.

3. Results of the Analysis of the Efficiency of Electric Traction Drive Control Systems for Rolling Stock with Asynchronous Electric Motors

3.1. Rationale for Selecting a Mathematical Model for the Electric Traction Motor

When selecting a mathematical model for an electric traction motor, the following implication must be taken into account. As determined above, the electric traction drive is affected by the supply voltage and torque disturbances on the motor shaft. These factors lead to short-term transient processes, which, in turn, lead to short-term asymmetrical modes in the power circuits of the electric traction drive. In [41], it is indicated that in the presence of asymmetry in the power supply system, the application of a mathematical model of the asynchronous motor in three-phase coordinates would be the most appropriate. This kind of model can be found in the investigation [38]. The model presented in [38] was implemented in the MATLAB software environment. The electrical part of the model was implemented using the SIMSCAPE library elements. This enables an investigation of the asymmetric modes in the presence of asymmetry in the power supply system. The magnetic and mechanical parts were implemented using the structural elements. The model provided in [38] was validated in the investigation [42]. For the model to work correctly under the conditions of a wheel slippage attempt, the magnetic losses in the motor steel are taken into account as a time function. A mathematical model considering the magnetic losses in the steel of an asynchronous electric motor can be found in [43]; this is the mathematical model proposed in the investigation [38], extended with a magnetic loss calculation unit. The application of the model given in [43] enabled the authors of the present paper to study the motor operation in the presence of asymmetry in the supply voltage system and to correctly account for the influence of losses caused by eddy currents and hysteresis losses on the electrodynamic processes in the asynchronous electric motor at a slippage attempt of one of the wheel pairs.

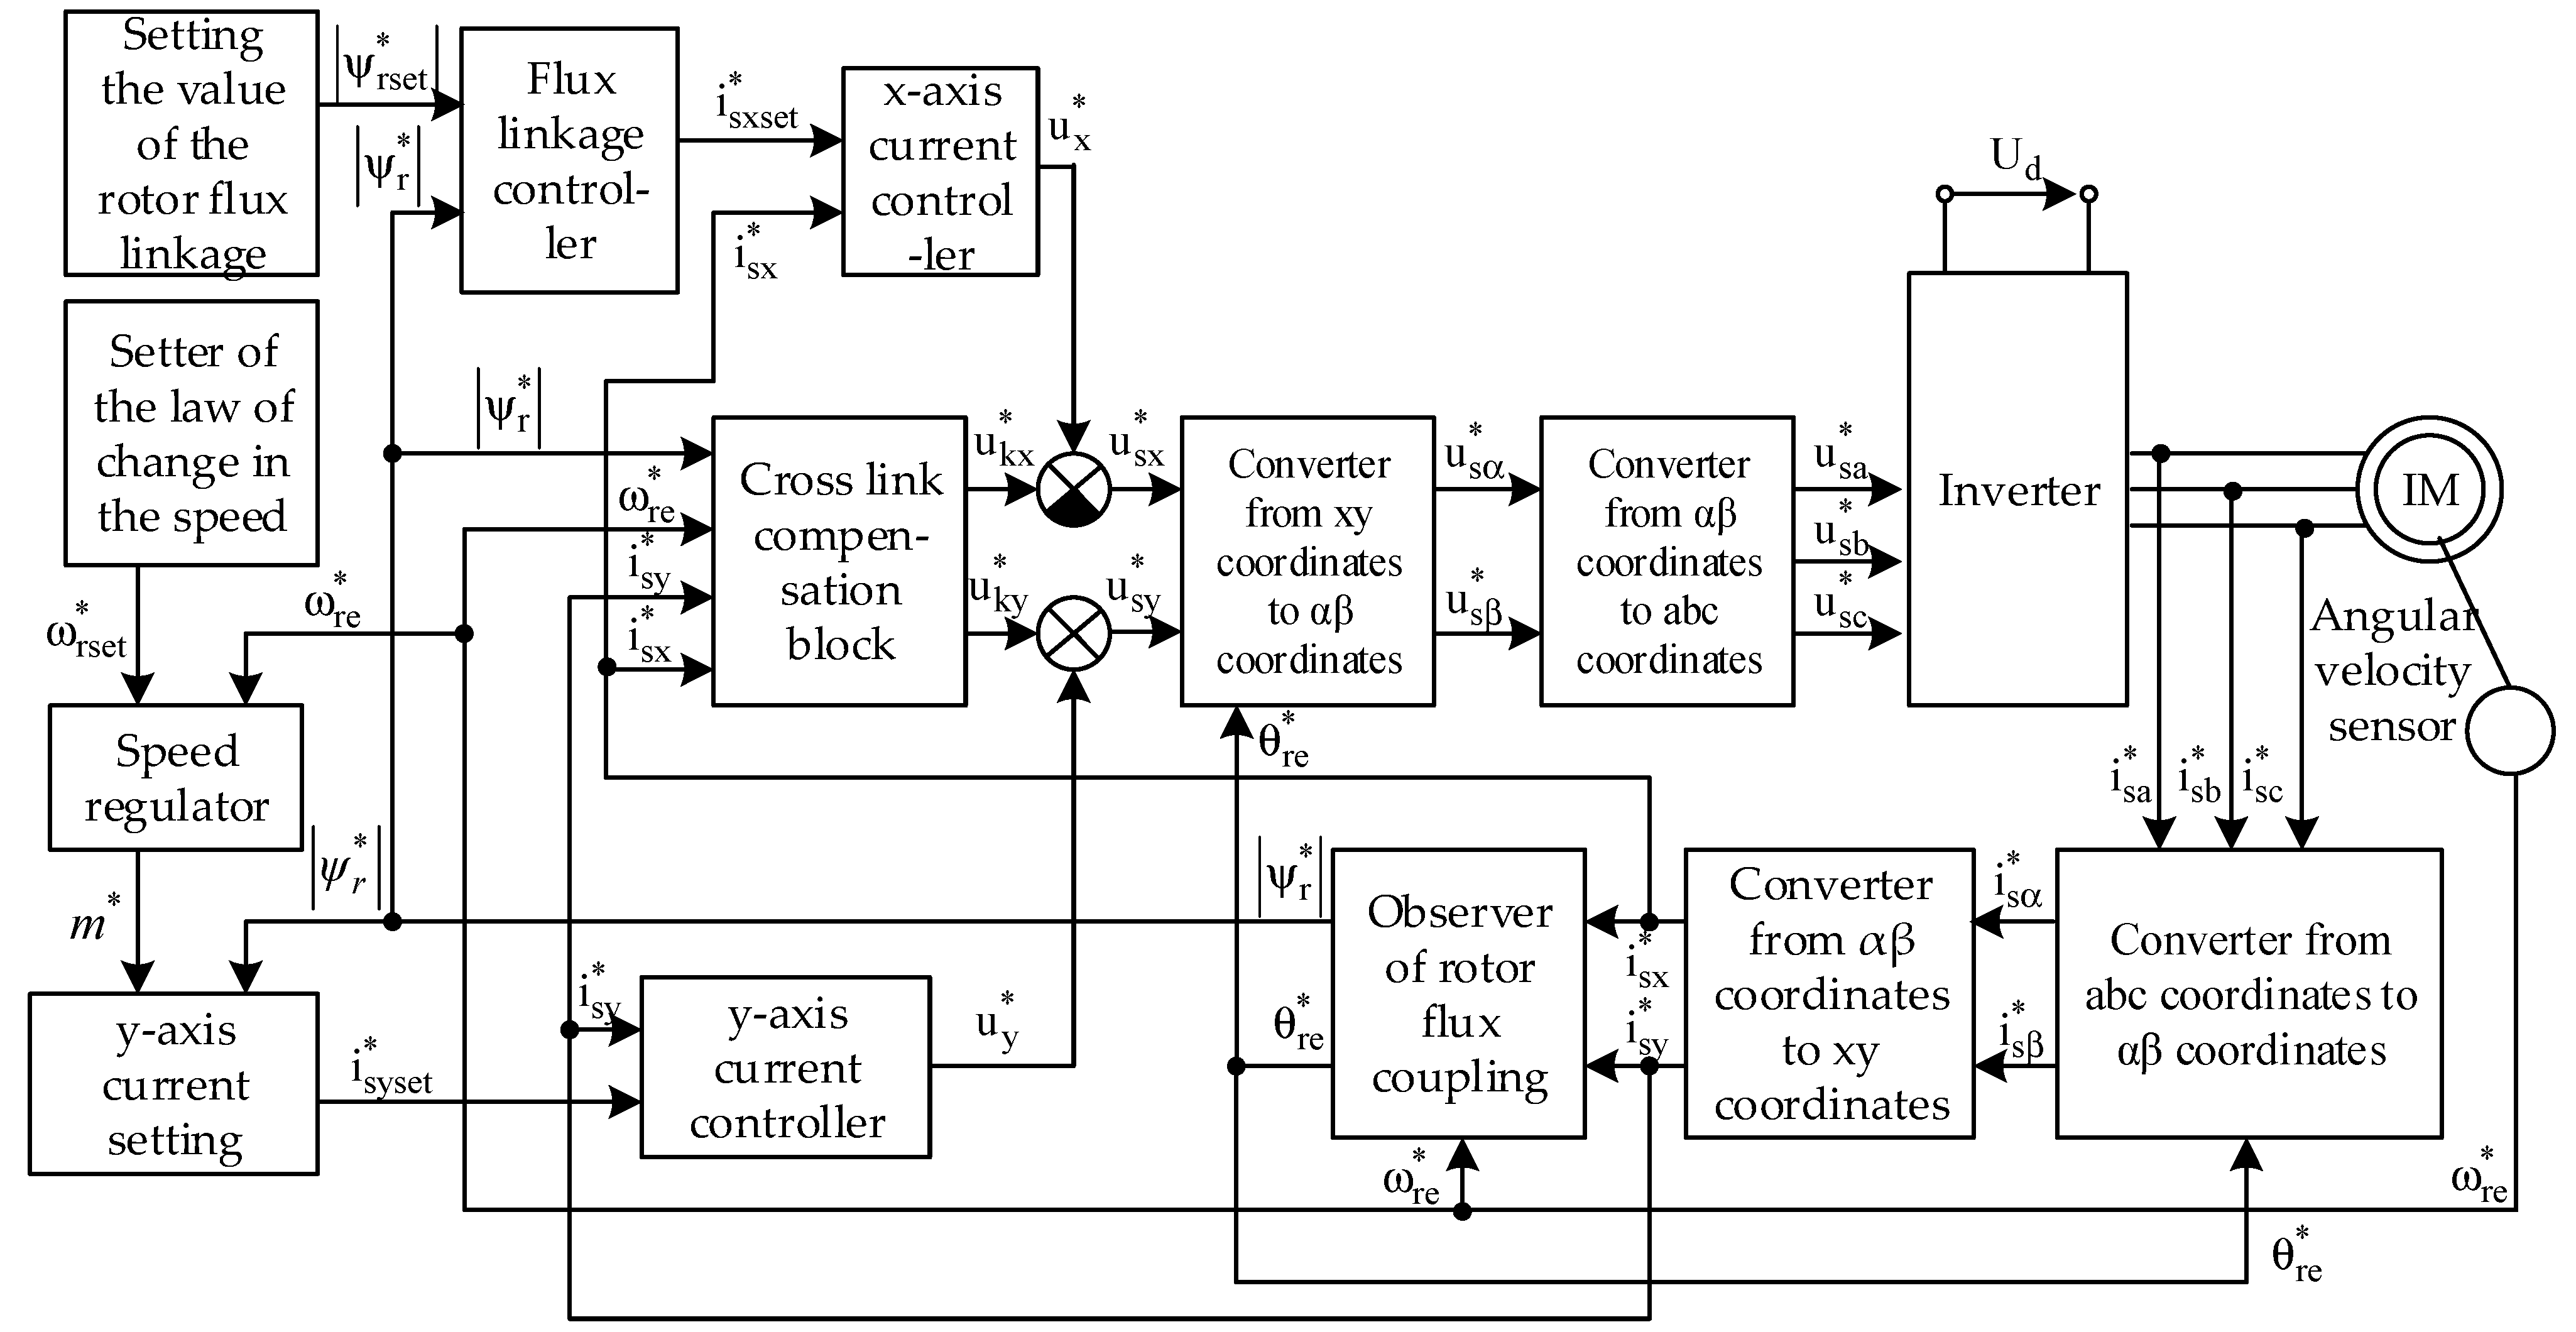
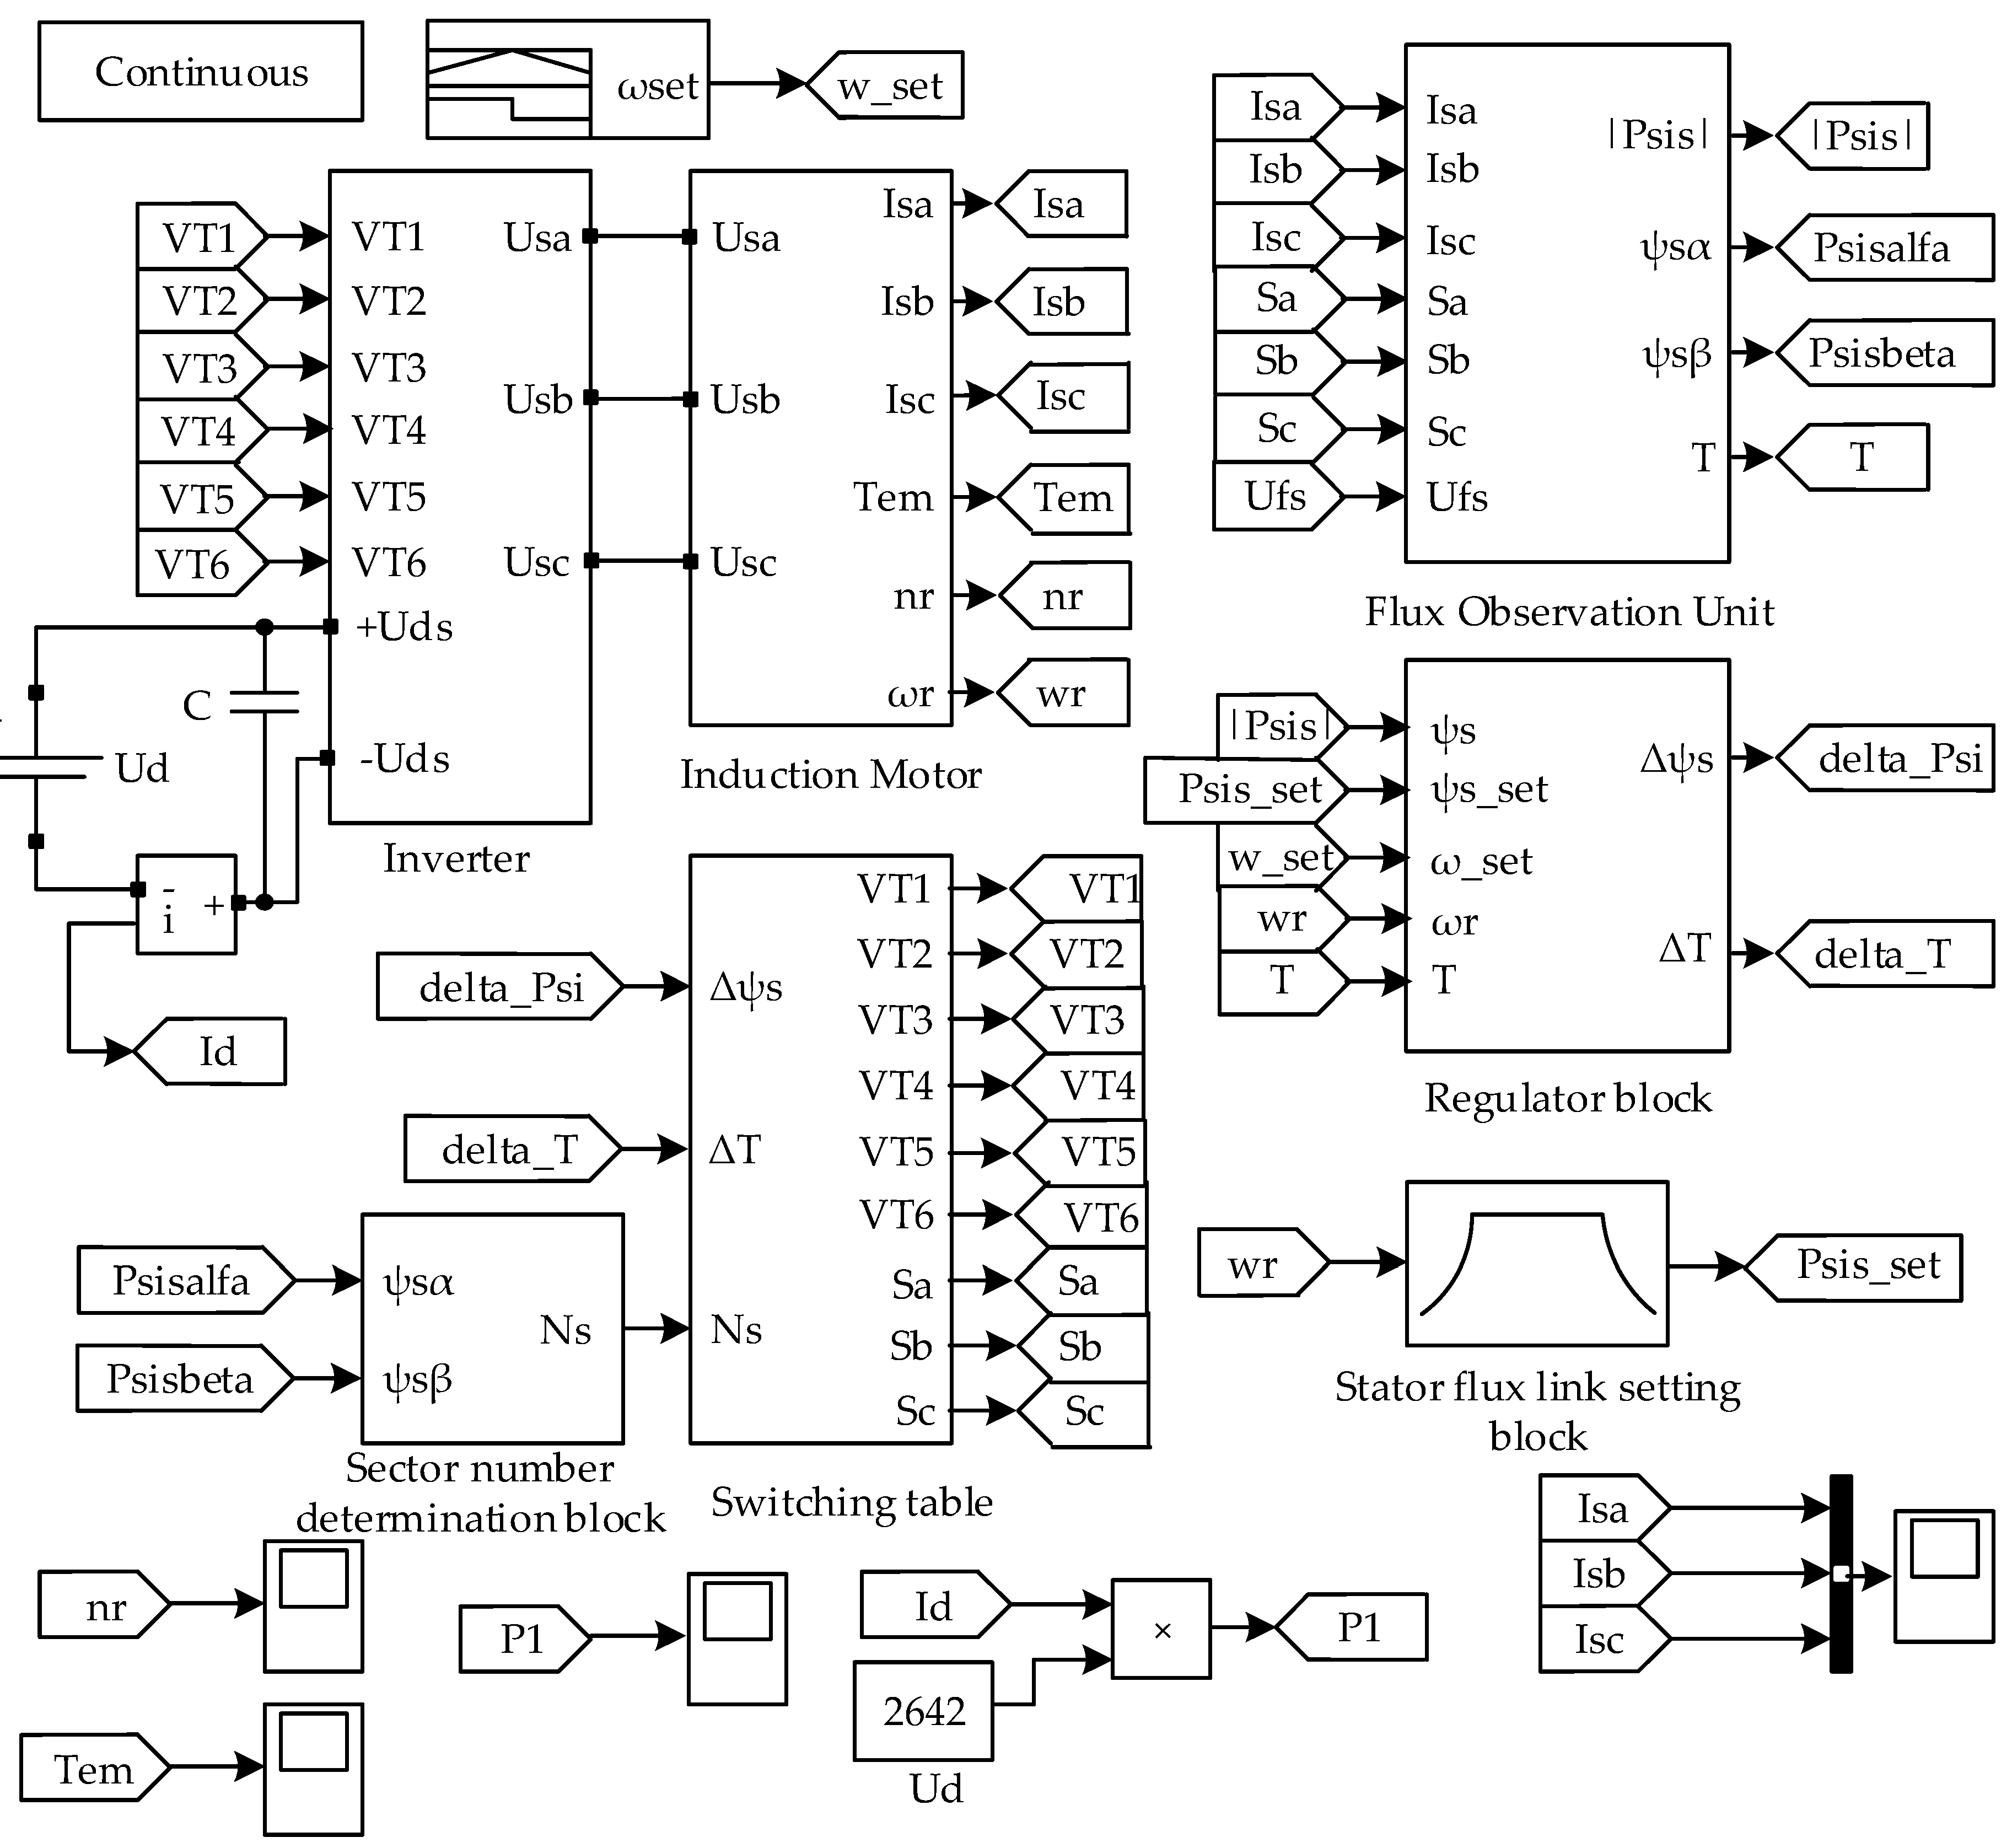
3.2. Adaptation of the Existing Vector Control and Direct Torque Control Models to the Objectives of the Investigations

Analysis of [44,45] suggests that the xy-coordinate control system based on the rotor flux linkage control (ψr) would be the most effective structure of the vector control system for the traction drive of an electric rolling stock (Figure 1).
The mathematical model of the vector control system in the xy-coordinates based on the flux linkage control (ψr) is provided in [14]; therefore, it was thought unnecessary to reproduce it in the present work. For higher precision in the determination of the parameters of the electric traction drive, the present study accounts for the saturation of the magnetic system of the asynchronous motor. The dependence of the main inductance of the asynchronous motor on the value of the magnetizing circuit flux linkage is provided in [38]. In the simulation model, this relationship is shown as a separate block with a relative inductance value output. Therefore, in further calculations, for the purpose of accounting for the saturation of the magnetic circuit of the motor, the following value of the main inductance was assumed to be equal to:
L μ = L μ * · L μ N ,
where LμN—the value of the main inductance of the asynchronous motor (Table 1); L μ * —the value of the magnetic circuit inductance as a function of the magnetic flux linkage of the asynchronous electric motor, expressed in relative units.
The simulation model of the implementation of the structural block diagram (Figure 1) made in the MATLAB software environment is presented in Figure 2.
The speed setting was arranged in the standard Simulink “Signal Builder” library block and was selected based on the analysis of torque and speed diagrams [38,41]. The analysis suggested that the duration of the transient process in the motor was 0.7 s. During this period, the torque pulsations on the electric motor shaft were higher by a factor larger than the nominal value. These processes last until the motor magnet system reaches the saturation mode. Therefore, for the magnetic biasing of the magnetic system of the electric motor, the supply voltage was fed to the stator windings within the time interval of 0 to 0.7 s, and the speed setter was not activated. This meant that the speed setting delay would switch on 0.7 s after the input of voltage to the motor. The delay time of the load feed, which is implemented as the “Step” block, is also 0.7 s. The asynchronous electric motor was implemented as the “Induction Motor” block, the control system as the “Control System” block and the calculation of the equivalent circuit parameters as the “Parameters” block. The autonomous voltage inverter was implemented in the block “Inverter”. The inverter scheme was selected with the block of PWM implementation [46,47,48]. As [38,43] propose a mathematical model of an asynchronous electric motor and [46,47,48] propose that of an autonomous voltage inverter, it was deemed unnecessary to provide these mathematical models in the present work. The parameters of the traction motor and autonomous voltage inverter required to implement the simulation model are provided in Table 1 and Table 2, respectively. In Figure 1, “Speed regulator”, “Flux linkage controller”, “x-axis current controller”, and “y-axis current controller” are the speed, flux linkage, x-axis and y-axis current controllers, respectively. The speed regulator was implemented as the P-controller, and the flux linkage, x-axis, and y-axis current controllers were implemented as the PI-controllers. The parameters of the aforementioned regulators are provided in [14], and the repeated provision of them in the present paper would be unnecessary.
During the investigation, in order to reduce the investigation time and, consequently, the amount of data to be processed, the assumption was made that the inverter input voltage, motor load, and motor moment of inertia were nominal. In this case, the nature of the processes that occur in the electric traction drive system did not change. The only change was in the transient processes and, consequently, in the amount of data processed. Hence, the following nominal data were set for the simulation model of an electric traction drive with a vector control system: the electric motor load (Tc); supply voltage of the autonomous voltage inverter (Ud); and moment of inertia (J), provided in Table 1 and Table 2, respectively. As the traction drive operated at the nominal moment of inertia, the divisible factor of the moment of inertia (kj) was equal to 1. Due to the fact that the maximum transistor switching frequency of the 5SNA1200G450350 module was 1200 Hz, the PWM sampling frequency was assumed to be fd = 11·fnom = 1171.8 Hz (fnom = 55.8 Hz—the nominal motor supply voltage frequency (Table 1)).
The structural block diagram of the direct torque control of the asynchronous electric motor is shown in Figure 3 [49,50]. A mathematical model for the direct torque control of an asynchronous electric motor is given in [49,50]; therefore, it would be unnecessary to repetitively provide it in the present work. The direct torque control was implemented in the MATLAB software environment and is shown in Figure 4. The blocks depicted in Figure 4 are explained below. The “Induction Motor” block incorporates the simulation model provided in [43]. The “Inverter” block implements the principal inverter circuit shown in [46,47,48]. As the electrical part of the asynchronous electric motor was made using the elements of the SIMSCAPE library of the MATLAB software environment, the “Inverter” block was implemented using the elements of the same library. The “Switching table” block implemented the functions of the switching table block [49,50]. The “Sector number determination block” block implemented an algorithm for determining the number of the sector containing the angle of the spatial vector of the stator flux linkages [49,50]. The “Flux Observation Unit” block implemented the calculations of the angle of the spatial vector of the stator flux linkages and motor torque.
The “Regulator block” implemented the speed, flux linkage, and torque controllers. The “Stator flux link setting block” was used to implement the field weakening mode to investigate the operation of the electric traction drive at motor shaft speeds higher than the nominal speed. At speeds lower than or equal to the nominal speed, the stator flux linkage was equal to the nominal value. At speeds greater than the nominal speed, the flux linkage was determined according to the formula:
ψ s = ψ snom · ω rnom ω r
where ψsnom—nominal value of the flux linkage of the electric motor stator: ωrnom—nominal angular rotational speed of the electric motor rotor; ωr—angular rotational speed of the electric motor rotor.
The nominal value of the rotational angular speed of the electric motor rotor was determined using the formula:
ω rnom = 2 · π · n rnom 60
where nrnom—nominal rotational speed of the motor shaft (Table 1).
The nominal flux linkage of the stator was determined using the formula:
ψ snom = U nom 2 · 2 · π · f nom
where Unom—nominal effective value of the phase voltage of the electric motor stator (Table 1); fnom—nominal value of the phase voltage frequency of the electric motor stator (Table 1).
In Figure 3, “Speed controller”, “Relay torque regulator”, and “Relay controller of flux” are the speed controller, relay torque regulator, and relay controller of flux, respectively. The speed controller was implemented as the P-controller, the relay torque regulator as the three-position relay, and the relay controller of flux as the two-position relay. The parameters of the mentioned regulators are provided in [49,50], and the repeated provision thereof in the present paper would be unnecessary.
During the investigation, in order to reduce the investigation time and, consequently, the amount of data to be processed, the assumption was made that the inverter input voltage, motor load, and motor moment of inertia were nominal. In this case, the nature of the processes occurring in the electric traction drive system did not change. The only change would be in the transient processes and, consequently, the amount of data processed. Hence, the following nominal data were set for the simulation model of an electric traction drive with direct torque control: the electric motor load (Tc); supply voltage of the autonomous voltage inverter (Ud); and moment of inertia of the motor (J), provided in Table 1 and Table 2, respectively. Given that the maximum transistor switching frequency of the 5SNA1200G450350 module was equal to fmax mod = 1200 Hz, the switching frequency of the relay of flux linkage and torque relay was assumed to be fmax = K·fnom < fmax mod 1171.8 Hz, where K was the maximum integer and fnom = 55.8 Hz was the nominal frequency of the motor supply voltage (Table 1).
In view of the purpose of the investigations, it was necessary to determine the power consumed by the drive from the mains. The electric traction drive with the asynchronous electric motor was powered from the power DC link, and that consumed from the main was determined by the product of the input current and the output voltage of the inverter. The calculation of the power consumed from the mains (P1) was implemented in the electric drive simulation models (Figure 2 and Figure 4). For this purpose, the “Current Measurement” element of the “Specialized Power System” library of the MATLAB software environment was included in the inverter power supply circuit. The “Current Measurement” elements enable the measurement of the inverter input current Id. Capacitor C was connected, in parallel, to the power supply Ud in order to provide a path for the reactive current in the inverter power supply circuit from the asynchronous motor. The capacitance of the capacitor was calculated using the formula:
C = U d 2 2 · π · f max · Q nom ,
where fmax—frequency of the higher harmonic component of the reactive current; Ud—supply voltage of the inverter; Qnom—nominal value of reactive power determined from the expression:
Q nom = P nom · tg φ nom ,
where φnom—nominal value of the phase difference between the stator phase voltage and stator current, corresponding to the nominal value of the power factor of the asynchronous electric motor (Table 1); P nom —nominal value of the electric motor (Table 1).
The capacitance value of the capacitor calculated using Formula (5) was 489 µF.

3.3. Modeling Results

Three experiments were conducted in order to compare the characteristics of the electric traction drive of an electric rolling stock with vector control and direct torque control of an asynchronous motor. During the first experiment, time diagrams of the phase currents, torque, rotational speed of the electric motor shaft, and power consumption were taken in the absence of any disturbances to the supply voltage and load of the electric motor. During the second experiment, time diagrams of the phase currents, torque, rotational speed of the electric motor shaft, and power consumption were taken in the presence of the disturbances to the supply voltage of the electric motor. During the third experiment, time diagrams of the phase currents, torque, rotational speed of the motor shaft, and power consumption were taken in the presence of disturbances to the electric motor load.

3.3.1. Modeling Results in the Absence of Disturbances

During this experiment, the following operational algorithm of the traction drive was implemented in the electric traction drive (Figure 2) using the “Signal Builder” speed setting:
-
Starting;
-
Development of the nominal value of the angular rotational speed of the electric motor shaft;
-
Operation at the nominal angular rotational speed of the electric motor;
-
10% reduction in the nominal value of the angular rotational speed of the electric motor shaft;
-
Operation at a reduced angular rotational speed of the electric motor;
-
10% increase in the nominal value of the angular rotational speed of the electric motor shaft;
-
Operation at an increased angular rotational speed of the electric motor.
In the absence of any additional restrictions, the acceleration time to the nominal operation after starting in the speed controller was assumed to be Δt = 3 s. In other words, the angular acceleration of the electric motor shaft was equal to:
ε = ω nom * t = 1 3 = 0.333 , 1 s 2
In Formula (7), the nominal value of angular speed was ω nom * = 1 .
The same acceleration was characteristic of the operation of the electric drive during the transition to a lower (acceleration with a negative sign) and higher (acceleration with a positive sign) angular speed of the motor shaft. As stated above, in the electric traction drive system with vector control, the time delay during motor starting was 0.7 s. The delay was absent in the direct-torque-controlled electric traction drive. The time diagram of the angular speed setter in the vector control system is shown in Figure 5a, and in the direct torque control system in Figure 5b.
The following were obtained during the experiment:
-
Time diagrams of the stator phase currents for the electric traction drive with vector control (Figure 6a) and with direct torque control (Figure 6b);
-
Time diagrams of the rotational speed of the electric drive shaft for the traction drive with vector control (Figure 7a) and with direct torque control (Figure 7b);
-
Time diagrams of the torque for the electric traction drive with vector control (Figure 8a) and with direct torque control (Figure 8b);
-
Power consumption (Figure 9).
From the time diagrams (Figure 6), the values of the stator currents are obtained in steady-state modes, which are recorded in Table 4. The steady-state values of the motor shaft speed (Figure 7) are recorded in Table 5. The torque values (Figure 8) for steady-state modes are entered into Table 5 and for transient modes into Table 6. The power consumption for steady-state modes (Figure 9) are recorded in Table 7. According to the torque diagrams (Figure 8), the times of the transients are determined, which are recorded in Table 8.
According to the efficiency results in Table 7, the values of the electric traction electric drive of the system with vector control and the system with direct torque control in the steady-state modes are calculated. The efficiency was calculated on the following considerations: in the steady-state mode, the efficiency is the ratio of the power transmitted to the motor shaft to the power consumed by the drive from the mains, i.e., the efficiency can be calculated using the formula:
Eff = P 2 P 1 ,
where P1—power consumed from the power supply; P2—power transferred to the load.
The power consumed by the power supply was determined using the formula:
P 1 = U d · I d ,
where Ud—voltage at the inverter input; Id—inverter input current.
The power transferred to the load was determined using the formula:
P 2 = T · ω r ,
where T—the torque; ωr—angular rotational speed of the motor shaft.
Both the vector control system and the direct torque control system have torque pulsations in the steady-state modes (Figure 8); therefore, the expressions for the average power consumed from the mains per period and the average power transferred to the motor shaft per period were used to calculate the efficiency. The period value was chosen to be equal to Tav = 1/fnom = 0.01792 s.
Based on the above, the average power consumed from the mains at time ti was determined using the formula:
P 1 i = 1 T av · t 1 1 t i U d i · I d i dt .
The average power transferred to the motor shaft at time ti was determined using the formula:
P 2 i = 1 T av · t 1 1 t i T i · ω r i dt .
The data for the steady-state modes are provided in Table 7.
The average torque value was calculated using the formula:
T av = T max + T min 2
where Tmax—maximum torque value (Table 6); Tmin—minimum torque value (Table 6).
The results of the calculations are recorded in Table 6. The torque pulsation factor was calculated using the formula [51]:
k pT i = T max i T min i 2 · T av i · 100 %
where Tmax—maximum torque value at the i-th segment of the time diagram (Table 6); Tmin—minimum torque value at the i-th segment of the time diagram (Table 6); Tav—average torque value at the i-th segment of the time diagram (Table 6).
The results provided in Table 5 were used to calculate the set parameter determination errors for the electric traction drive. The set parameter errors were calculated using the formula:
δ A , % = A A set A set · 100 %
where Aset—the set value of the parameter (Table 5); A—the value of the parameter determined as a result of the experiment (Table 5).
The calculation results are recorded in Table 5.
The torque overshoot was calculated using the formula:
σ Τ i = T pav i T av i T av i · 100 % , .
where Tpav(i)—average peak torque value at the i-th segment of the time diagram; Tav(i)—average torque value at the i-th segment of the time diagram (Table 8).
T pav = T pmax + T pmin 2
where Tpmax—maximum peak torque value (Table 8); Tpmin—minimum peak torque value (Table 8).
The results of the calculations are recorded in Table 8.

3.3.2. Modeling Results in the Presence of Power Supply Disturbances of the Electric Motor

During this experiment, the fact that the process of variation of the inverter input voltage was stochastic due to the circumstances discussed above was taken into account. The stochastic process of variation of the supply voltage in the simulation model was accounted for by introducing a “Signal Builder” block into the inverter power supply circuit. The output signal of the “Signal Builder” block was the Gaussian noise with an RMS deviation of 15.27 V and a maximum noise frequency of 55.8 Hz. The inverter supply voltage, in this case, was the sum of the output signal of the “Signal Builder” block and the DC link voltage. The time diagram of the inverter supply voltage is shown in Figure 10.
During this experiment, the following operational algorithm of the traction drive was implemented in the electric traction drive (Figure 2) using the “Signal Builder” speed setting:
-
Starting;
-
Development of the nominal value of the angular rotational speed of the electric motor shaft.
As in the previous experiment, the acceleration of the electric drive was assumed to be 0.333 rad/s2. In the vector-controlled electric traction drive system, the time delay during motor start was 0.7 s. The delay was absent in the direct-torque-controlled electric traction drive. The time diagram of the angular speed setter in the vector control system is shown in Figure 11a, and the direct torque control system in Figure 11b.
The following were obtained during the experiment:
-
Time diagrams of the stator phase currents for the electric traction drive with vector control (Figure 12a) and with direct torque control (Figure 12b);
-
Time diagrams of the rotational speed of the electric drive shaft for the electric traction drive with vector control (Figure 13a) and with direct torque control (Figure 13b);
-
Time diagrams of torque for the electric traction drive with vector control (Figure 14a) and with direct torque control (Figure 14b);
-
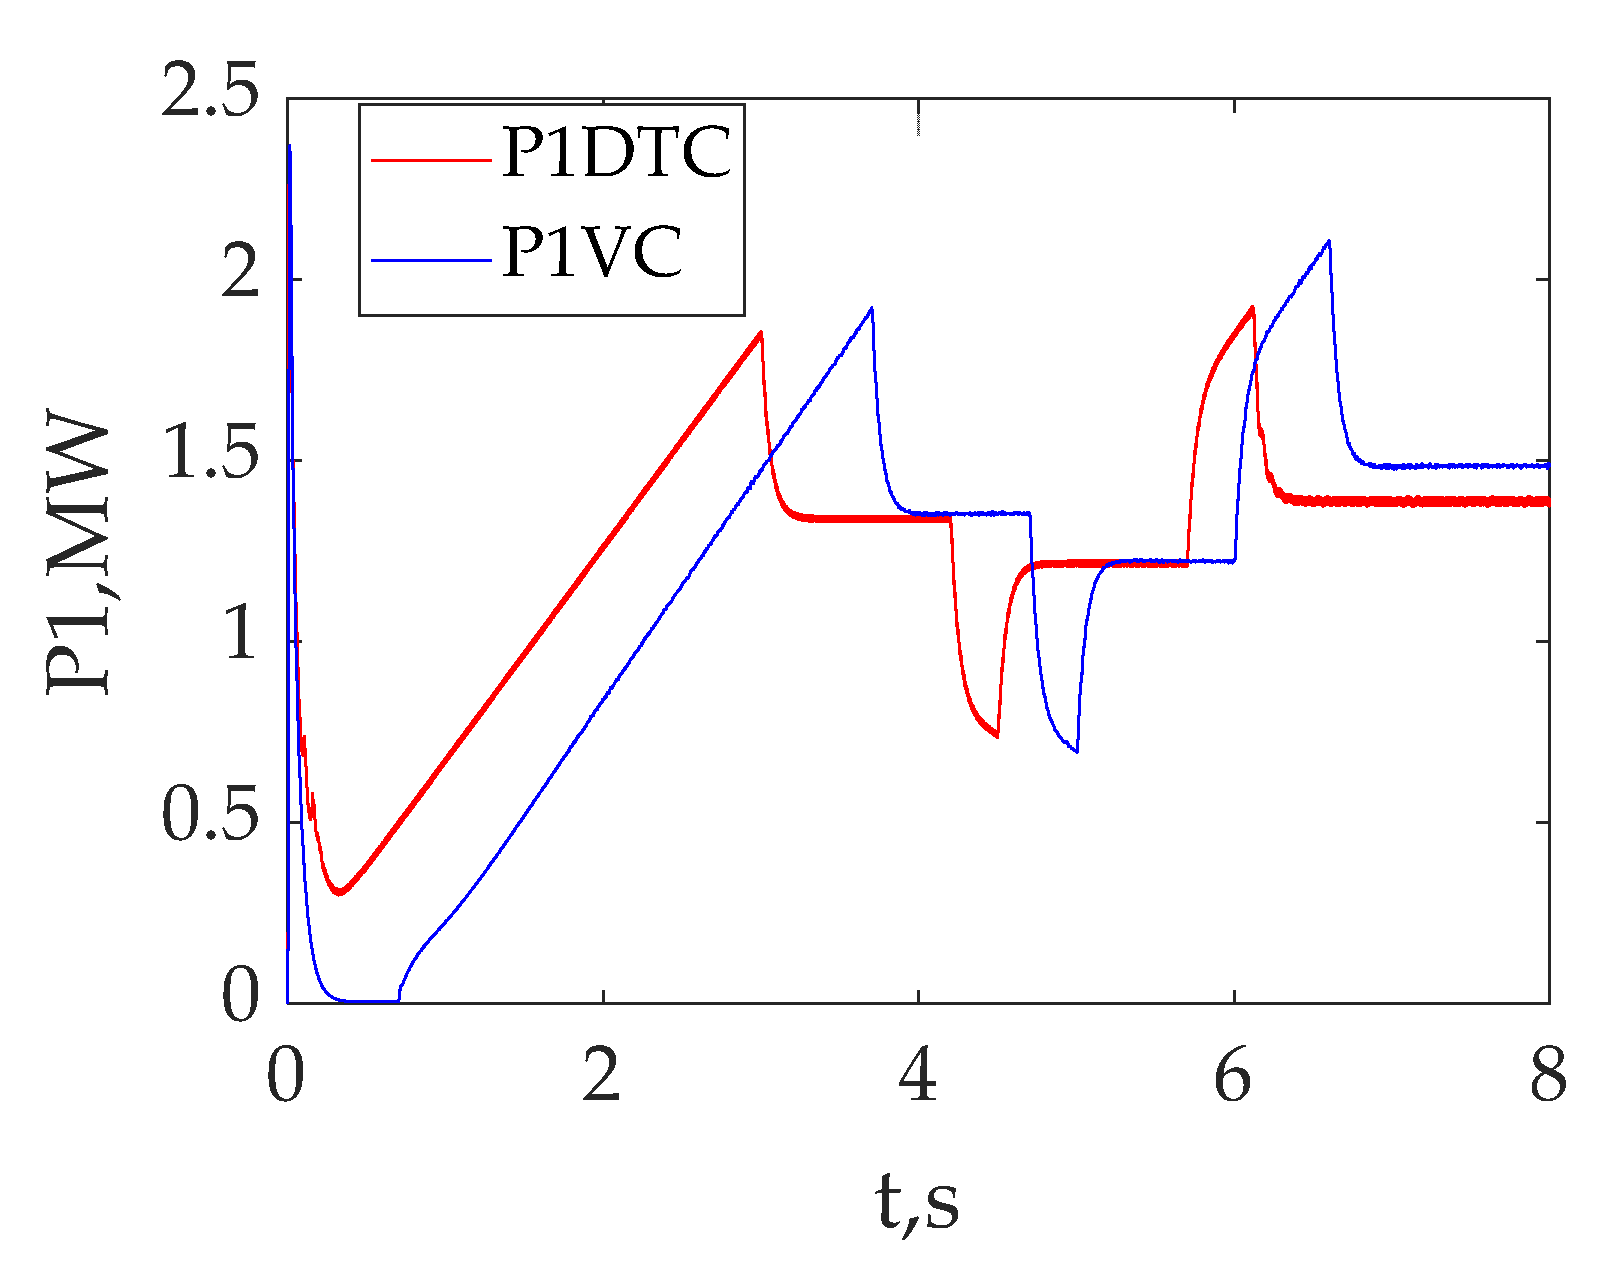
Power consumption (Figure 15).
The time diagrams of the phase values of the stator currents (Figure 12), the rotational speed of the electric motor shaft (Figure 13), torque (Figure 14), and power consumption (Figure 15) were used to obtain the corresponding parameters in the steady-state speed modes (Table 9).
As asymmetry of the phase currents could be observed in the drive with both control systems, the phase current unbalance factor was calculated using the formula [52,53]:
k imbI = I smax I smin I sA + I sB + I sC · 100 %
where Ismax—maximum instantaneous value of the first harmonic of the stator phase current (Table 9); Ismin—minimum instantaneous value of the first harmonic of the stator phase current (Table 9); IsA, IsB, IsC—instantaneous values of the first harmonics of the corresponding stator phase currents (Table 9).
The torque pulsation factor was calculated using Formula (14). The results are presented in Table 9.

3.3.3. Modeling Results in the Presence of Load Disturbances of the Electric Traction Motor

During this experiment, the fact that the process of variation of the load on the motor shaft was stochastic due to the circumstances discussed above was taken into account. The stochastic load variation process was accounted for in the simulation models (Figure 2 and Figure 4) through the replacement of the “Constant” element, simulating a constant load on the motor shaft, with the “Pulse Generator” element simulating a variable load on the motor shaft in the block of the calculation of the mechanical parameters of the asynchronous motor. The parameters of the “Pulse Generator” block were as follows:
-
The amplitude was equal to the nominal value of torque on the motor shaft—10,324 Nm;
-
The period was 0.1 s;
-
The pulse width was equal to 50% of the period.
For both the vector control system and the direct torque control system, there was a delay of 0.7 s in the application of load to the motor shaft, implemented in the “Step” block. The time diagram of the load variation on the motor shaft is shown in Figure 16.
The wheel slippage attempt leading to a stochastic load variation on the motor shaft mainly occurred at low rotational speeds of the motor. Due to this factor, the influence of the load variation on the starting characteristics at a high rotational speed of the motor shaft would be impractical. Therefore, the following operational algorithm of the electric traction drive was implemented using the “Signal Builder” speed setter:
-
Starting;
-
Development of 10% of the nominal value of the angular rotational speed of the electric motor shaft.
As in the previous experiment, the acceleration of the drive was assumed to be 0.333 rad/s2. In a vector-controlled electric traction drive system, the time delay during electric motor start-up was 0.7 s. The delay was absent in the direct-torque-controlled electric traction drive. The time diagram of the angular speed setter in the vector control system is shown in Figure 17a, and in the direct torque control system in Figure 17b.
The following were obtained during the experiment:
-
Time diagrams of the stator phase currents for the electric traction drive with vector control (Figure 18a) and with direct torque control (Figure 18b);
-
Time diagrams of the rotational speed of the electric drive shaft for the electric traction drive with vector control (Figure 19a) and with direct torque control (Figure 19b);
-
Time diagrams of the torque for the electric traction drive with vector control (Figure 20a) and with direct torque control (Figure 20b);
-
Power consumption (Figure 21).
The time diagrams of the phase values of the stator currents (Figure 18), rotational speed of the motor shaft (Figure 19), torque (Figure 20), and power consumption (Figure 21) were used to obtain the corresponding parameters in the steady-state speed modes (Table 10).
As asymmetry of the phase currents could be observed in the electric drive with vector control, the phase current unbalance factor was calculated using Equation (18). The results are presented in Table 10. The asymmetry of the phase currents was not observed in the drive with direct torque control.
As the electric traction drive was always in the mode of transient processes of the torque during load disturbances, it is beyond the scope of this paper to discuss torque pulsations in this case.
With the traction drive speed setter delivering the electric traction drive into the constant rotational speed mode of the electric motor shaft, the time diagrams (Figure 19) suggest the presence of instability in the rotational speed of the electric motor shaft in this mode for all types of drives. The speed instability coefficient was calculated using the formula:
k n . st . nr = n rmax n rmin 2 · n rav · 100 %
where nrmax—maximum value of the rotational speed of the electric motor shaft (Table 10); nrmax—minimum value of the rotational speed of the electric motor shaft (Table 10); nrav—average value of the rotational speed of the electric motor shaft.
The average value of the rotational speed of the electric motor shaft was calculated using the formula:
n rav = n rmax + n rmin 2
The results of the calculation of the average speed and the rotational speed instability coefficient of the motor shaft are provided in Table 10.
As there are constant transient processes in the electric traction drive system in the presence of supply and load disturbances, the quality of the transient processes was not tested for these modes.
Thus, the simulation results provided input for the comparison of the characteristics of the electric traction drive with vector and direct torque control for the following three cases:
-
Operation at nominal rotational speed of the electric motor shaft;
-
At reduced rotational speed;
-
At increased rotational speed of the electric motor shaft.
Results were obtained for comparison of the quality of transient processes in the following cases:
-
Development of the nominal rotational speed of the electric motor shaft;
-
Transitioning from the nominal rotational speed to a reduced rotational speed of the electric motor shaft;
-
Transitioning from a reduced rotational speed to an increased rotational speed of the electric motor shaft.
Results were also obtained for the comparison of the resistance to supply and load disturbances of the electric traction drive with vector and direct torque control.
A discussion of the obtained results is presented in the following section.

4. Discussion

The authors did not design any structural diagrams for either the vector control system or the direct torque control system during the study; nor did the authors have the aim of developing simulations of either the vector control system or the direct torque control system. The authors referred to the previously published work of other authors. The simulation models of the vector control system and direct torque control system were adapted by the authors for the purpose of performing the experiments specified in the research objective.
Validation of the simulation models of the systems with vector control and direct torque control had been carried out in other previous works and was therefore not conducted in this paper.
The following findings were obtained as a result of the comparative analysis of the stator phase current values of the electric traction drive with a vector control system (presented in Figure 6a and Table 4) versus the electric traction drive with a direct torque control system (presented in Figure 6b and Table 4) in the absence of power supply and load disturbances:
-
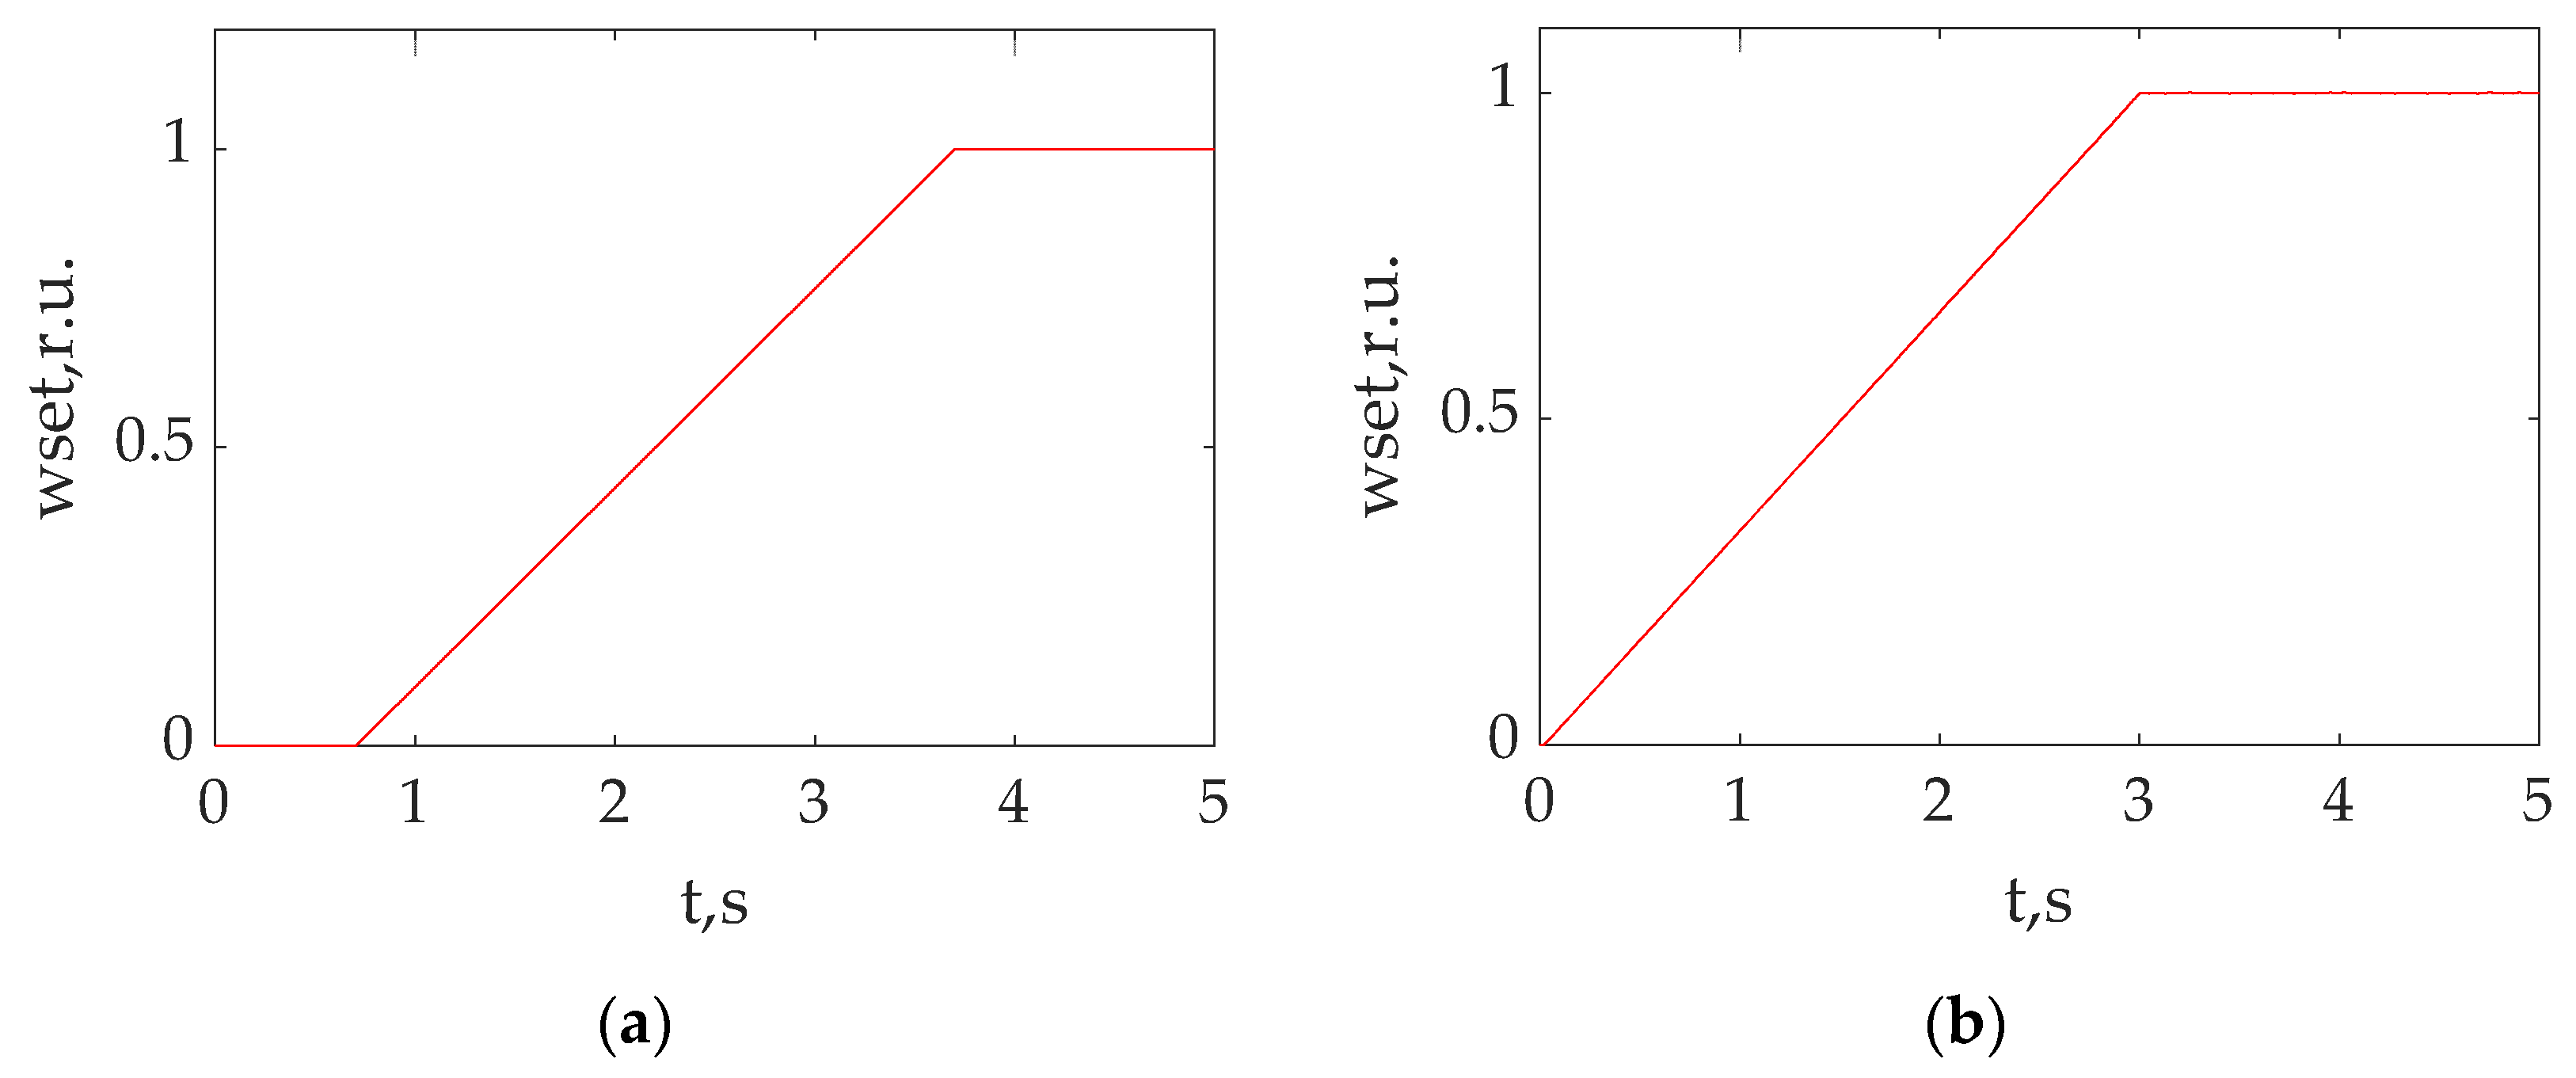
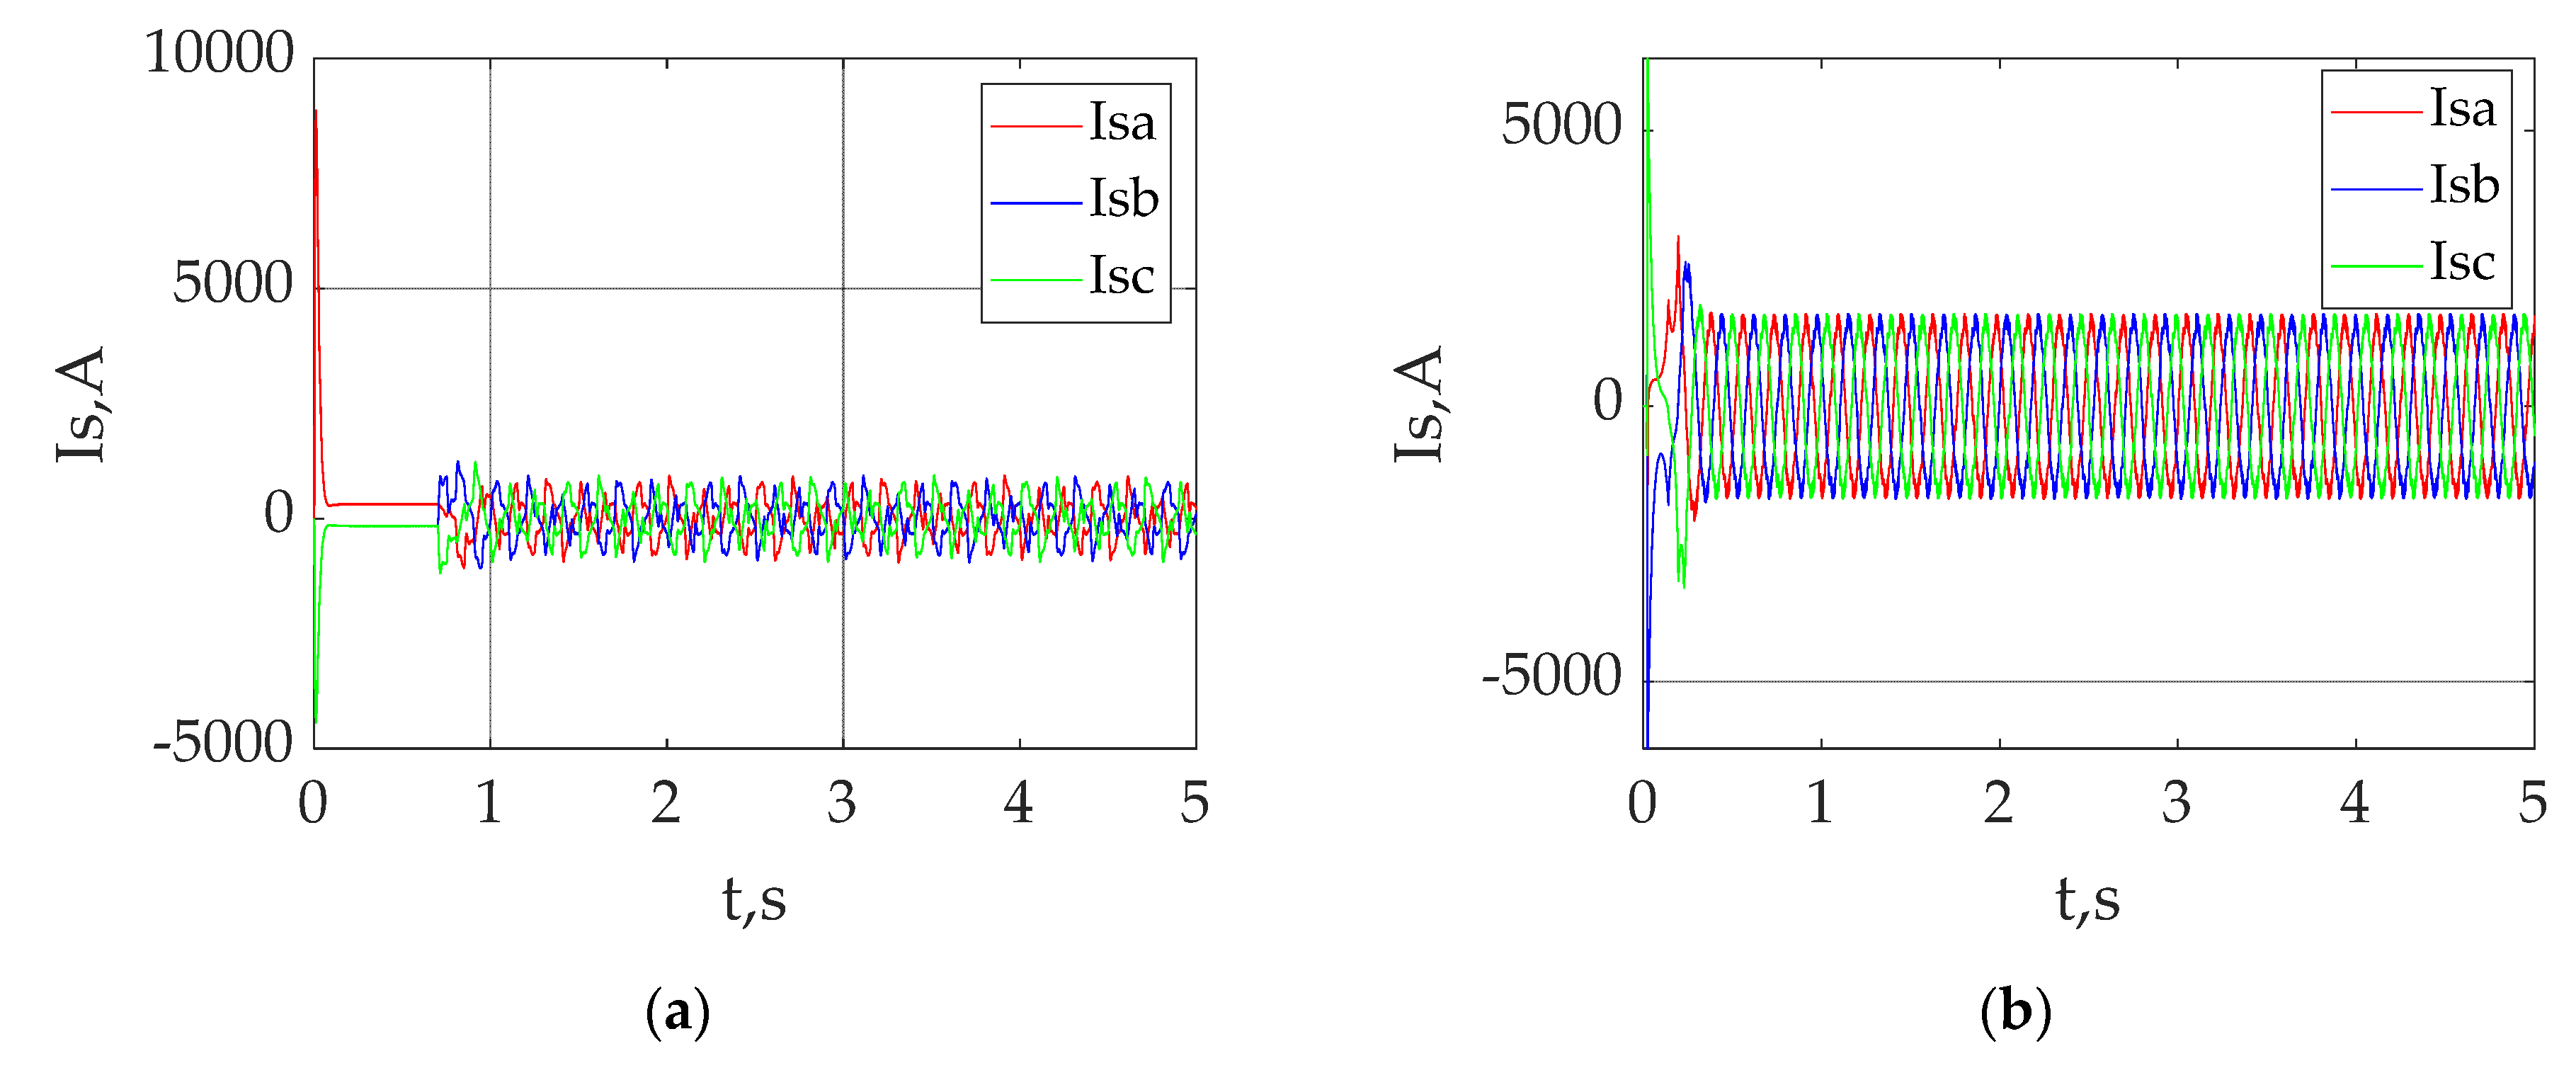
The phase current frequency is equal to zero at the starting moment and up to the moment of activation in the system with vector control, i.e., during this period, the traction motor acts as an electric direct current (DC) motor. This circumstance could be explained by the fact that the speed intensity setter is deactivated during this period. In the system with direct torque control, there is no time interval during which the asynchronous motor would act as an electric DC machine as, in direct torque control, the intensity setter is activated at the moment of voltage being supplied to the asynchronous motor;
-
Within the time interval after the activation of the speed intensity setter and up to the beginning of the nominal mode, as soon as the transient processes (Figure 6a) caused by the activation of the speed setter are complete, the stator phase currents remain constant, although higher than the nominal value. In the system with direct torque control, within the time interval after the activation of the speed intensity setter up to the beginning of the nominal mode, the phase current value is equal to the nominal value (Figure 6b). In the first case, the phase current frequency is equal to f = (ωset·ωrnom·pp)/2π, where ωset—frequency value in the speed intensity output, Ωnom—nominal value of the angular rotational speed of the motor shaft (3), number of pairs (Table 1);
-
Within the time interval corresponding to the nominal mode, the value of the stator currents is equal to the nominal value, and the phase current frequencies are also equal to the nominal value in the two control systems (Figure 6a), (Figure 6b). At the same time, the error in the determination of the phase currents, calculated according to Formula (15) on the basis of the data in Table 4, is lower than 1%;
-
Within the time interval corresponding to the transition from the nominal frequency to the lower frequency of the rotation of the motor shaft, the value of the stator phase currents is lower than the nominal value in the vector control (Figure 6a), while in the system with direct torque control, the values of the stator phase current are equal to the nominal value (Figure 6b). The frequency of the stator phase currents is equal to f = (ωset·ωrnom·pp)/2π;
-
At the beginning of the steady-state mode at a lower rotational speed, the values of the phase currents become equal to the nominal value in the two control systems (Table 4);
-
Within the time interval corresponding to the transition from a lower frequency down to the higher rotational speed of the motor shaft, the value of the stator phase currents is higher than the nominal value in the system with vector control (Figure 6a), while in the system with direct torque control, the stator phase current values are equal to the nominal value (Figure 6b). The frequency of the stator phase currents is equal to f = (ωset·ωrnom·pp)/2π;
-
At the beginning of the steady-state mode at a higher rotational speed, the values of the phase currents become equal to the nominal value in the two control systems (Table 4).
The character of the variation of the stator phase currents in the vector control (Figure 6a) corresponds to the character of the stator phase currents presented in works [6,7,8], which are dedicated to the investigation of the operation of the system with asynchronous motor vector control. The character of the variation of the stator phase currents in the direct torque control (Figure 6b) corresponds to the character of the stator phase currents presented in works [9,10,11], which are dedicated to the investigation of the operation of the system with an asynchronous motor and direct torque control of the asynchronous motor.
The following findings were obtained as a result of the comparative analysis of the rotational speed and torque values in the vector control systems (presented in Figure 7a; Figure 8a, respectively, and Table 5) versus the direct torque control system (presented in Figure 7b; Figure 8b, respectively, and Table 5) in the absence of power supply and load disturbances:
-
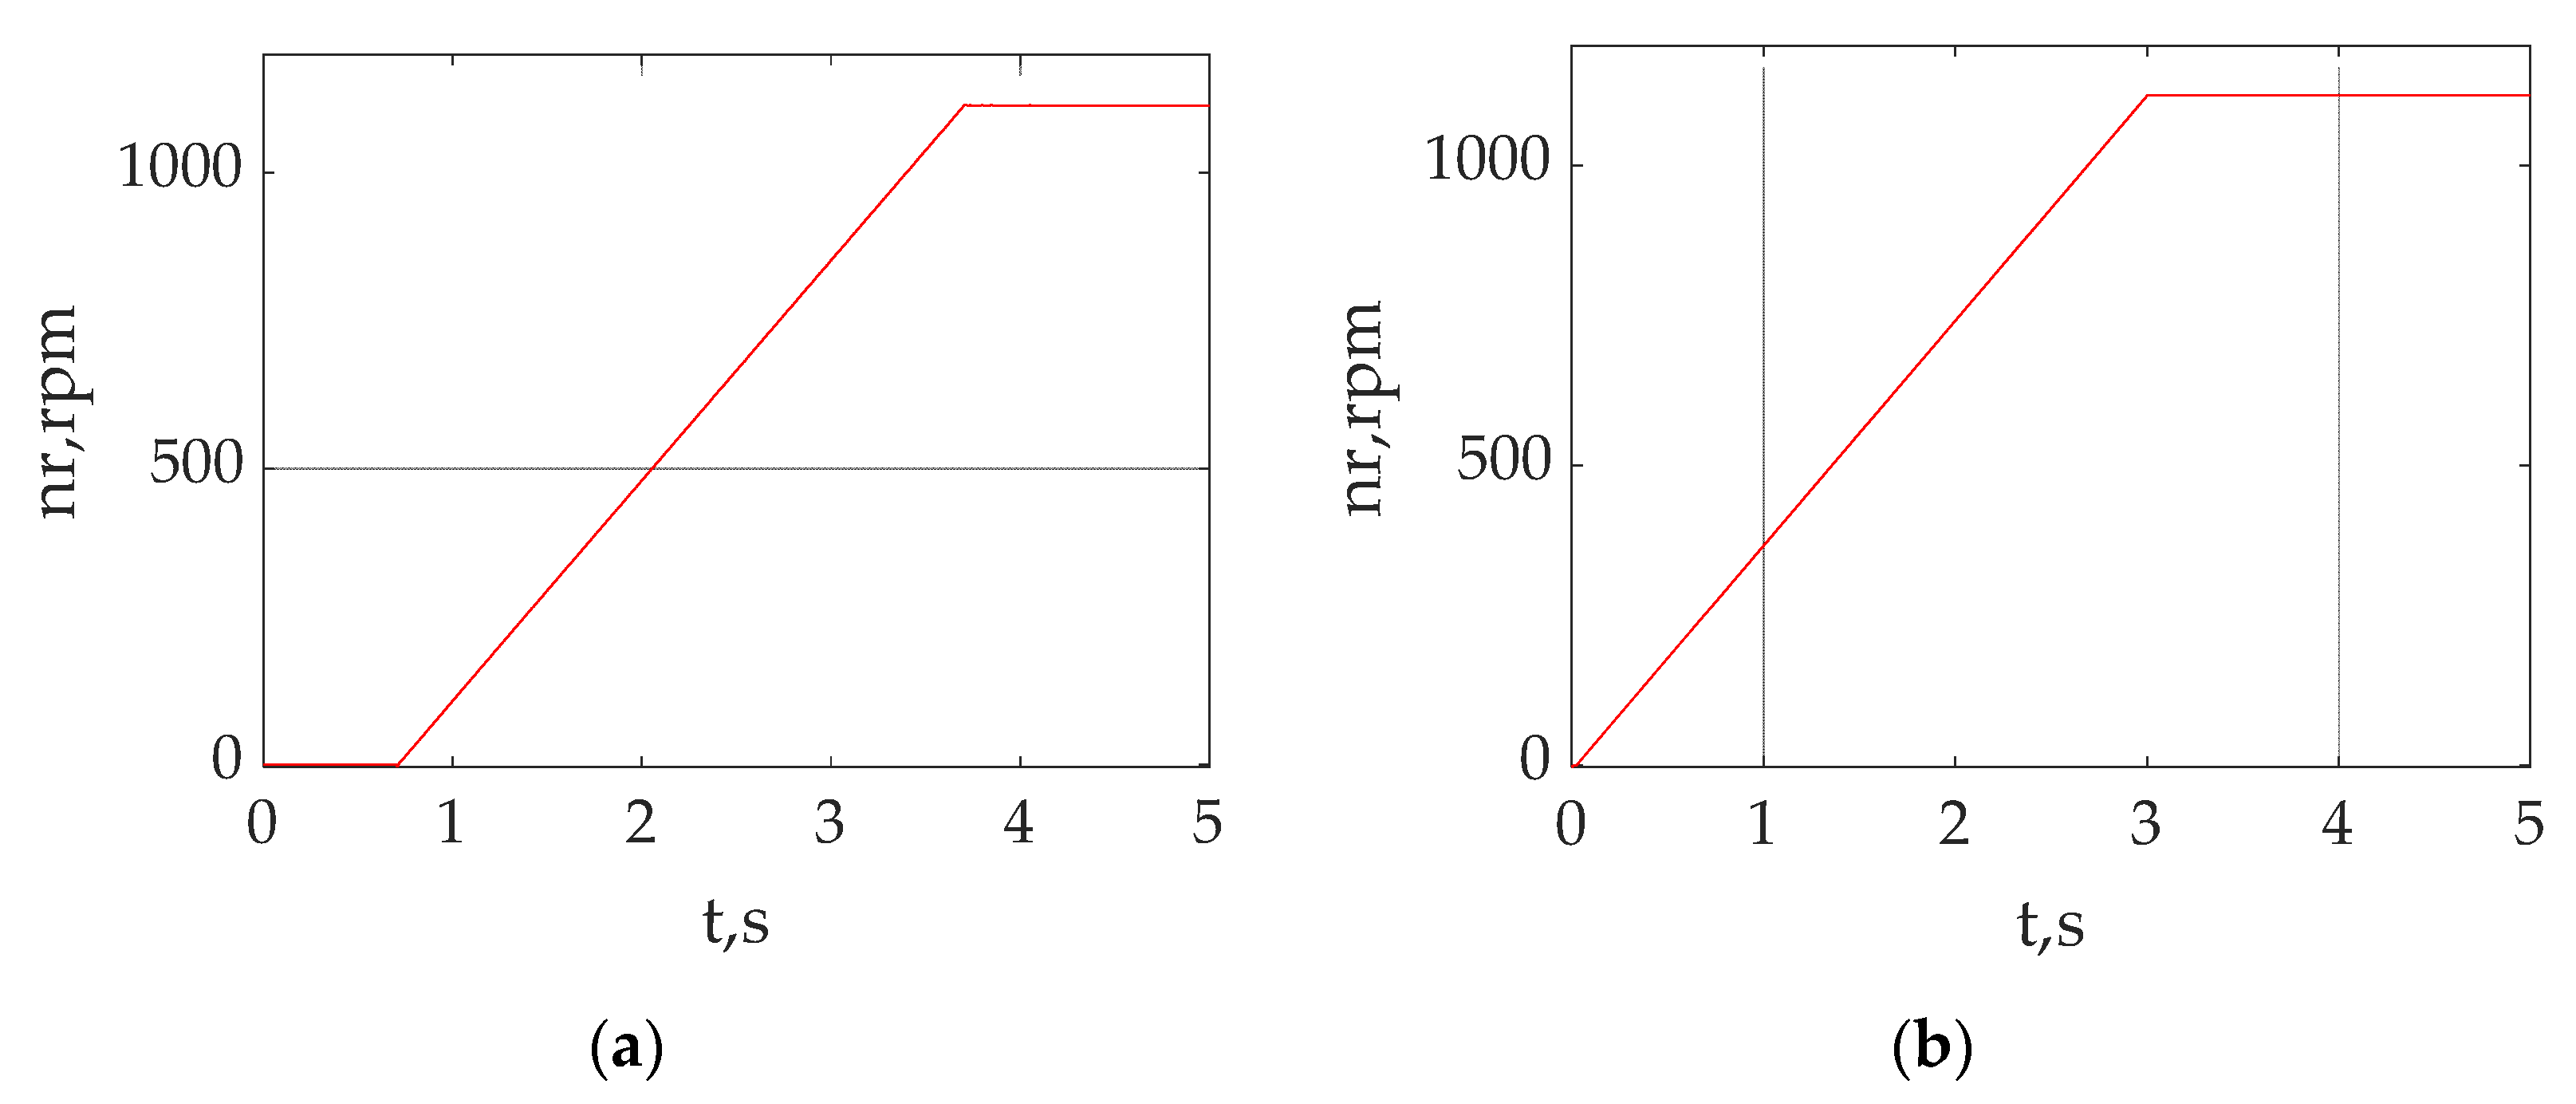
Within the interval up to the activation of the speed intensity setting in the direct torque control system, the rotational speed of the motor shaft and the torque are equal to zero (Figure 7a), i.e., the motor does not perform effectively within this interval. This interval is absent in the direct torque control system;
-
Within the interval corresponding to the nominal operation mode in the vector control system, the error in the determination of the rotational speed was 0.27%, and in the torque system, 1.13% (Table 5). The error in the determination of the rotational speed and torque in the direct torque control system is absent for this interval (Table 5);
-
Within the interval, corresponding to operation at a lower frequency in the vector control system, the error in the determination of the rotational speed was 0.3%, and in the torque system, 0.93% (Table 5). The error in the determination of the rotational speed and torque in the direct torque control system is absent for this interval (Table 5);
-
Within the interval corresponding to operation at a higher frequency in the vector control system, the error in the determination of the rotational speed was 0.33%, and in the torque system, 1.1% (Table 5). Within this interval, the error in determining the rotational speed in the direct torque control system was 5.68%, and in the torque, without error (Table 5).
The character of the variation of the rotational speed of the motor shaft (Figure 7a) and the vector control torque (Figure 8a) in the system corresponds to the character of the variation of these values presented in works [6,7,8], which are dedicated to the investigation of the operation of the system with asynchronous motor vector control. The character of variation of the rotational speed of the motor shaft (Figure 7b) and of the torque (Figure 8b) in the system with direct torque control corresponds to the character of the variation of these values presented in works [9,10,11], which are dedicated to the investigation of the operation of the system with the direct torque control of asynchronous motors.
The following findings were obtained as a result of the comparative analysis of the torque pulsation values in the vector control system (presented in Figure 8a and Table 6) versus the direct torque control system (presented in Figure 8b and Table 6) in the absence of power supply and load disturbances:
-
Within the interval corresponding to the nominal operating mode in the vector control system, the torque pulsation factor was 10.82% (Table 6). The torque pulsation factor in the direct torque control system was 19.23% for this interval (Table 6);
-
Within the interval corresponding to operation at a lower frequency in the vector control system, the torque pulsation factor was 8.62% (Table 6). The torque pulsation factor in the case of direct torque control was 12.31% for this interval (Table 6);
-
Within the interval corresponding to operation at a higher frequency in the vector control system, the torque pulsation factor was 10.46% (Table 6). The torque pulsation factor in the case of the direct torque control was 47.46% for this interval (Table 6).
The following findings were obtained as a result of the comparative analysis of the values of power consumption from the power supply and of efficiency in the vector control system versus the direct torque control system in the absence of the power supply and load disturbances in the steady-state modes, presented in Figure 9 and Table 7:
-
At the start moment and up to the activation in the vector control, the power consumed from the power supply was 5.883 kW and the efficiency was equal to zero (Table 7). This circumstance could be explained by the fact that, within this time period, the electric motor was not performing efficiently and the power consumed from the power supply was spent feeding the magnetic system of the electric motor. This interval is absent in the direct torque control system (Table 7);
-
Within the interval corresponding to the nominal operation mode in the vector control system, the power consumed from the power supply was 1352 kW, while the efficiency was 90% (Table 7). In the direct torque control system, the power consumed by the power supply was 1339 kW, and the efficiency was 89.6% for this interval (Table 7). Table 1 provides the traction motor efficiency value for the nominal mode, which is η = 95.5%. The drive efficiency was calculated during the investigations taking into account the losses in the traction motor and inverter. Therefore, the authors consider the obtained result to be correct;
-
Within the interval corresponding to operation at a higher frequency in the vector control system, the power consumed from the power supply was 1222 kW, while the efficiency was 89.5% (Table 7). In the direct torque control system, the power consumed from the power supply was 1216 kW and the efficiency was 88.7% for this interval (Table 7);
-
Within the interval corresponding to operation at a higher frequency in the vector control system, the power consumed from the power supply was 1489 kW, while the efficiency was 89.9% (Table 7). In the direct torque control system, the power consumed from the power supply was 1387 kW, and the efficiency was 89.8% for this interval (Table 7).
On one hand, the efficiency data for the modes other than the nominal mode are not available from the manufacturing firms. On the other hand, the aim of the investigation is to perform a qualitative, rather than quantitative, comparison of the parameters of the two control systems. The operation modes change continuously in the traction drive; therefore, to compare the efficiency of the two control systems, the authors have chosen steady-state modes with different rotational speeds of the motor shaft. In view of the above circumstances, the authors consider the results of the comparison of the efficiency values of both control systems at nominal rotational speeds of the motor shaft correct.
The conducted analysis of the characteristics of the vector control system and direct torque control in the absence of disturbances has allowed the authors to draw conclusions on the strengths and weaknesses of the two control systems, presented in Table 11.
The analysis of the results, presented in Table 11, led to the following conclusion. When designing an electric rolling stock with electric motors of the given series, it should be taken into account that an electric traction drive with direct torque control is more effective when operating at motor shaft rotational speeds lower than or equal to the nominal value, and the electric traction drive with a vector control system when operating at motor shaft rotational speeds higher than the nominal value.
The results of the analysis of the transient processes in the electric traction drive with a vector control system (Table 8) and with a direct torque control system (Table 8) in the absence of supply and load disturbances are provided in Table 12.
The analysis of the results, presented in Table 12, led to the following conclusion. The electric traction drive with direct torque control has a higher quality of transient processes at speeds lower or equal to the nominal rotational speed of the electric motor shaft. Meanwhile, the electric traction drive with vector control has a higher quality of transient processes at speeds higher than the nominal rotational speed of the electric motor shaft. The results of the analysis of the resistance of the electric traction drive with a vector control system and with a direct torque control system to the power supply disturbance (Table 9) and load disturbance (Table 10) are summarised in Table 13.
The analysis of the results presented in Table 13 led to the following conclusion. An electric traction drive with direct torque control is characterised by higher resistance to supply voltage and load disturbances than an electric traction drive with a vector control system.
There are some important caveats to the study that warrant mentioning:
  • The models of electric traction drives with vector and direct torque control do not account for the thermal processes that occur in the electric traction drive. Thermal processes lead to thermal noise, which affects the correct operation of both control systems.
  • Due to the lack of research-based-knowledge of the nature of the load variation during a single wheel pair slippage attempt and the lack of experimental data, the load variation for this mode was set as a sequence of rectangular pulses.
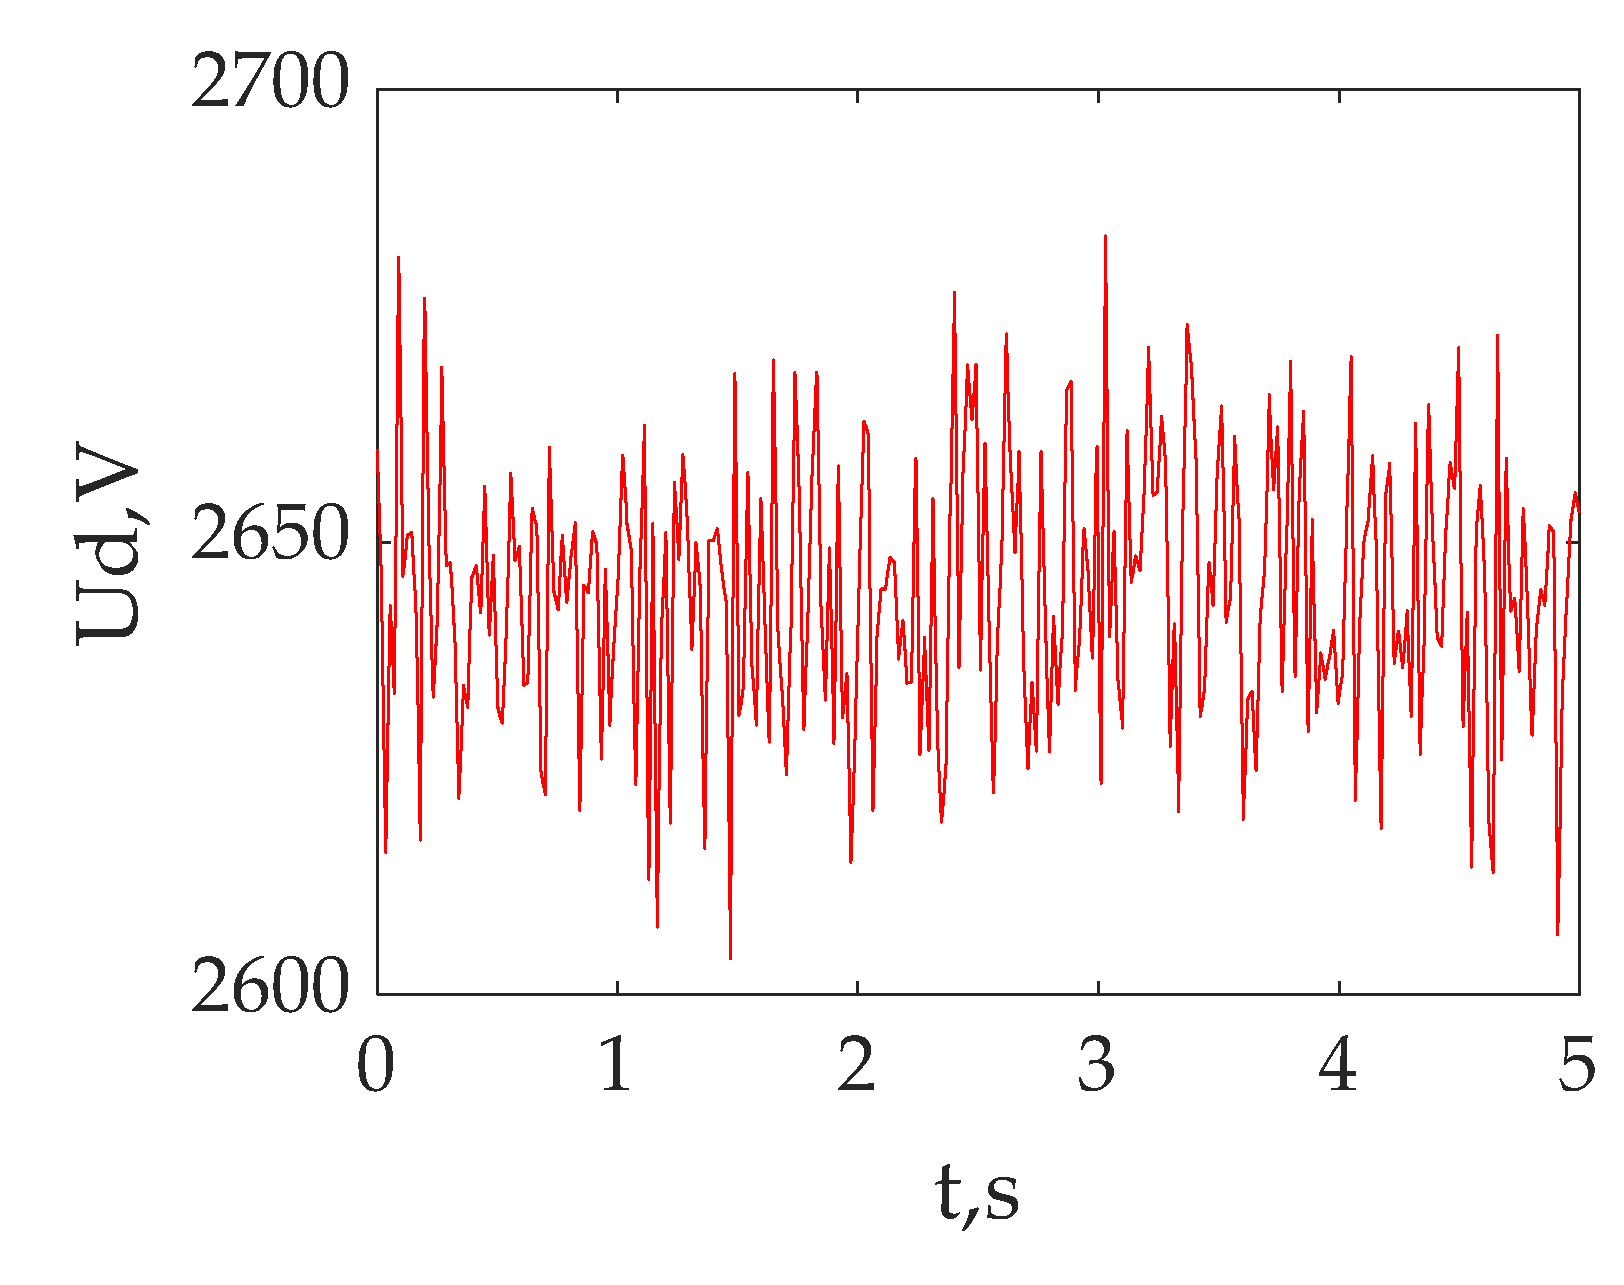
  • Due to the lack of research-based-knowledge of the nature of the DC-link voltage variation caused by the operating factors and a lack of experimental data, the voltage variation at the inverter input was taken into account by means of a Gaussian noise source.
  • Given that the weight of the locomotive and the weight of the train would result in a tenfold increase in the moment of inertia of the electric motor shaft, which in turn would result in significant amounts of calculation, it was assumed that the moment of inertia and load torque on the motor shaft were nominal. Although the character of the starting characteristics would not be affected by this factor, the transient time would be reduced.
These factors impose certain limitations on the use of the designed models. Additional investigations have been conducted in order to account for the above factors. However, the authors are aware of the difficulties in obtaining experimental data under the operating conditions of an electric locomotive.
Furthermore, for a more complete comparison of the traction characteristics with different control systems, research should be carried out on the operation of these systems in the electric braking mode.
Further research may be carried out with the purpose of optimising the control of the operation of the electric traction drive and improving the energy efficiency of the electric traction drive of an electric rolling stock.

5. Conclusions

  • The choice of a mathematical model of the electric traction motor was substantiated. It enables investigating the operation of an electric motor in the presence of asymmetric modes caused by transient processes in the traction electric drive.
  • The simulation models of the vector-controlled and direct-torque-controlled traction drives were adapted for the investigations accounting for the nature of substantiated operation of the electric rolling stock.
  • The starting characteristics for the electric traction drive with vector and direct torque control were obtained in the absence of voltage and torque disturbances and in the presence of voltage disturbance and torque disturbance.
  • The following has been determined:
    -
    At lower than nominal frequencies, the traction drive with direct torque control demonstrates a higher accuracy of the regulation of the rotational speed and torque, lower power consumption from the power supply, lower torque overshooting, but a higher level of torque pulsations than the traction drive with vector control;
    -
    At higher than nominal frequencies, vector control demonstrates a higher accuracy of the regulation of the speed, lower torque overshooting, shorter duration of transient processes, and lower torque pulsations than the direct torque control.
  • The presence of power supply disturbances was found to cause stator phase current unbalance, which is absent in the direct torque control.
  • In the presence of torque disturbances, the speed instability coefficient was found to be higher in the vector control than in the direct torque control; moreover, in this mode, the stator phase current unbalance is present.

Author Contributions

Conceptualisation, S.G., B.L. and I.R.; methodology, S.G., B.L. and I.R.; software, S.G., B.L. and I.R.; validation, S.G., B.L. and I.R.; formal analysis, S.G., B.L. and I.R.; resources, V.L., A.K. and S.K.; data curation, V.L., A.K. and S.K.; writing—original draft preparation, S.G., B.L. and I.R.; writing—review and editing, V.L., A.K. and S.K.; visualisation, S.G. and V.L.; supervision, S.G.; project administration, V.L. All authors have read and agreed to the published version of the manuscript.

Funding

This research received no external funding.

Institutional Review Board Statement

Not applicable.

Informed Consent Statement

Not applicable.

Data Availability Statement

Not applicable.

Conflicts of Interest

The authors declare no conflict of interest.

References

  1. Moaveni, B.; Rashidi Fathabadi, F.; Molavi, A. Fuzzy control system design for wheel slip prevention and tracking of desired speed profile in electric trains. Asian J. Control 2022, 24, 388–400. [Google Scholar] [CrossRef]
  2. Raluca-Cristina, N.; Ion, V.; Marian-Ştefan, N.; Sorin, E. Investigation of Idle Running and Short-Circuit Performance Improvement for an Asynchronous Traction Motor. In Proceedings of the 2019 International Conference on Electromechanical and Energy Systems (SIELMEN), Craiova, Romania, 9–11 October 2019; IEEE: Piscataway, NJ, USA, 2019; pp. 1–6. [Google Scholar] [CrossRef]
  3. Enache, S.; Vlad, I.; Enache, M.A. Aspects Regarding the Optimization of Cross Geometry in Traction Asynchronous Motors Using the Theory of Nonlinear Circuits. Energies 2022, 15, 6648. [Google Scholar] [CrossRef]
  4. Costa, C.A.; Nied, A.; Nogueira, F.G.; de Azambuja Turqueti, M.; Rossa, A.J.; Dezuo, T.J.M.; Barra, W. Robust Linear Parameter Varying Scalar Control Applied in High Performance Induction Motor Drives. IEEE Trans. Ind. Electron. 2020, 68, 10558–10568. [Google Scholar] [CrossRef]
  5. Hannan, M.A.; Ali, J.A.; Mohamed, A.; Hussain, A. Optimization techniques to enhance the performance of induction motor drives: A review. Renew. Sustain. Energy Rev. 2018, 81, 1611–1626. [Google Scholar] [CrossRef]
  6. Demircioglu, I.; Poyrazoglu, G. Induction motor Simulink implementation of the rotor flux oriented direct vector control method for electric vehicles. In Proceedings of the 2021 17th Conference on Electrical Machines, Drives and Power Systems (ELMA), Sofia, Bulgaria, 1–4 July 2021; IEEE: Piscataway, NJ, USA, 2021. [Google Scholar] [CrossRef]
  7. Raveendra, M.; Aswini, M. Speed Control of Induction Motors using PI Controllers. Int. J. Sci. Eng. Technol. Res. 2018, 7, 0361–0364. Available online: http://ijsetr.com/uploads/325614IJSETR16563-68.pdf (accessed on 15 December 2022).
  8. Raveendra, M.; Mounika, B. Speed Control of an Induction Motor using Fuzzy Logic Controller. Int. J. Sci. Eng. Technol. Res. 2018, 7, 0357–0360. Available online: http://ijsetr.com/uploads/254361IJSETR16562-67.pdf (accessed on 15 December 2022).
  9. Gundogdu, A.; Celikel, R.; Dandil, B.; Ata, F. FPGA in-the-loop implementation of direct torque control for induction motor. Automatika 2021, 62, 275–283. [Google Scholar] [CrossRef]
  10. Ferestade, I.; Ahmadian, M.; Molatefi, H.; Moaveni, B.; Bokaeian, V. Integrated sliding mode and direct torque controls for improving transient traction in high-speed trains. J. Vib. Control. 2021, 27, 629–650. [Google Scholar] [CrossRef]
  11. Bermúdez Guzmán, M.; Barrero, F.; Martín Torres, C.; Perales Esteve, M.Á. Performance Analysis of Direct Torque Controllers in Five-Phase Electrical Drives. Appl. Sci. 2021, 11, 11964. [Google Scholar] [CrossRef]
  12. Aktas, M.; Awaili, K.; Ehsani, M.; Arisoy, A. Direct torque control versus indirect field-oriented control of induction motors for electric vehicle applications. Eng. Sci. Technol. Int. J. 2020, 23, 1134–1143. [Google Scholar] [CrossRef]
  13. Karlovsky, P.; Lettl, J. Induction motor drive direct torque control and predictive torque control comparison based on switching pattern analysis. Energies 2018, 11, 1793. [Google Scholar] [CrossRef]
  14. Goolak, S.; Tkachenko, V.; Šťastniak, P.; Sapronova, S.; Liubarskyi, B. Analysis of Control Methods for the Traction Drive of an Alternating Current Electric Locomotive. Symmetry 2022, 14, 150. [Google Scholar] [CrossRef]
  15. Elgbaily, M.; Anayi, F.; Alshbib, M.M. A combined control scheme of direct torque control and field-oriented control algorithms for three-phase induction motor: Experimental validation. Mathematics 2022, 10, 3842. [Google Scholar] [CrossRef]
  16. Al-Mamoori, D.H.; Al-Tameemi, Z.H.; Jumaa, F.A.; Neda, O.M.; Al-Ghanimi, M.G. A Comparative Study of DTC-SVM and FOC-SVM Control Techniques of Induction Motor Drive. J. Eng. Appl. Sci. 2019, 14, 2135–2140. [Google Scholar] [CrossRef]
  17. Goolak, S.; Tkachenko, V.; Sapronova, S.; Lukoševičius, V.; Keršys, R.; Makaras, R.; Keršys, A.; Liubarskyi, B. Synthesis of the Current Controller of the Vector Control System for Asynchronous Traction Drive of Electric Locomotives. Energies 2022, 15, 2374. [Google Scholar] [CrossRef]
  18. Berdiev, U.; Burkhankhodzhaev, A.; Tuychieva, M.; Iksar, E.; Usmonov, K. Investigation of energy indicators with asymmetry of the voltage of the power source of mainline electric locomotives of alternating current. In Proceedings of the AIP Conference Proceedings, Volzhsky, Russia, 13–17 September 2021; AIP Publishing LLC: Melville, NY, USA, 2023; Volume 2552, p. 030018. [Google Scholar] [CrossRef]
  19. Ronanki, D. Overview of Rolling Stock. In Transportation Electrification: Breakthroughs in Electrified Vehicles, Aircraft, Rolling Stock, and Watercraft; Wiley-IEEE Press: New York, NY, USA, 2022; pp. 249–281. [Google Scholar] [CrossRef]
  20. Shavkun, V.; Pavlenko, T.; Kozlova, O. Development of Algorithmic Models for Research of Reliability Parameters of Trolleybus Traction Electric Motors in the Operation Process. EUREKA Phys. Eng. 2020, 1, 39–46. [Google Scholar] [CrossRef]
  21. Fedele, E.; Iannuzzi, D.; Del Pizzo, A. Onboard energy storage in rail transport: Review of real applications and techno-economic assessments. IET Electr. Syst. Transp. 2021, 11, 279–309. [Google Scholar] [CrossRef]
  22. Omelianenko, H.V.; Overianova, L.V.; Maslii, A.S. Geometric and electrophysical parameters of armature winding of electromechanical converter of inertial energy storage for suburban trains. Electr. Eng. Electromech. 2020, 1, 65–71. [Google Scholar] [CrossRef]
  23. Kobenkins, G.; Marinbahs, M.; Bizans, A.; Rilevs, N.; Burenin, V.; Sliskis, O. Carrying out of Strength Control of Mutual Loaded Traction Geared Motor Boxes as a Part of Industrial Tests. In Proceedings of the 2022 9th International Conference on Electrical and Electronics Engineering (ICEEE), Alanya, Turkey, 29–31 March 2022; IEEE: Piscataway, NJ, USA, 2022; pp. 185–189. [Google Scholar] [CrossRef]
  24. Riabov, I.; Kondratieva, L.; Overianova, L.; Goolak, S. Assessment of the On-Board Energy Storage Parameters of the Locomotive for Rail Quarry Transport. In TRANSBALTICA XIII: Transportation Science and Technology, Proceedings of the 13th International Conference TRANSBALTICA, Vilnius, Lithuania, 15–16 September 2022; Springer International Publishing: Midtown Manhattan, NY, USA, 2023; pp. 677–688. [Google Scholar] [CrossRef]
  25. Riabov, I.; Liubarskyi, B.; Overianova, L.; Goolak, S.; Kondratieva, L. Mathematical Model of the Electric Traction System of Quarry Railway Transport. In Proceedings of the 26th International Scientific Conference “Transport Means”, Kaunas, Lithuania, 5–7 October 2022; pp. 330–335. [Google Scholar] [CrossRef]
  26. Gorobchenko, O.; Nevedrov, O. Development of the structure of an intelligent locomotive DSS and assessment of its effectiveness. Arch. Transp. 2020, 56, 47–58. [Google Scholar] [CrossRef]
  27. Goolak, S.; Tkachenko, V.; Bureika, G.; Vaičiūnas, G. Method of spectral analysis of traction current of AC electric locomotives. Transport 2020, 35, 658–668. [Google Scholar] [CrossRef]
  28. Goolak, S.; Liubarskyi, B.; Sapronova, S.; Tkachenko, V.; Riabov, I. Determination of the Power Factor of Electric Rolling Stock of Alternating Current Consumption. In TRANSBALTICA XII: Transportation Science and Technology, Proceedings of the 12th International Conference TRANSBALTICA, Vilnius, Lithuania, 16–17 September 2021; Springer International Publishing: Midtown Manhattan, NY, USA, 2022; pp. 243–252. [Google Scholar] [CrossRef]
  29. Moore, T.; Schmid, F.; Tricoli, P. Voltage transient management for Alternating Current trains with vacuum circuit breakers. IET Electr. Syst. Transp. 2022, 12, 12034. [Google Scholar] [CrossRef]
  30. Gorobchenko, O.; Tkachenko, V. Statistical analysis of locomotives traction motors performance. MATEC Web Conf. 2019, 287, 04002. [Google Scholar] [CrossRef]
  31. Gorobchenko, O.; Fomin, O.; Fomin, V.; Kovalenko, V. Study of the influence of electric transmission parameters on the efficiency of freight rolling stock of direct current. East.-Eur. J. Enterp. Technol. 2018, 1, 60–67. [Google Scholar] [CrossRef]
  32. Lovskaya, A. Assessment of dynamic efforts to bodies of wagons at transportation with railway ferries. East.-Eur. J. Enterp. Technol. 2014, 3, 36–41. [Google Scholar] [CrossRef]
  33. Panchenko, S.; Gerlici, J.; Vatulia, G.; Lovska, A.; Pavliuchenkov, M.; Kravchenko, K. The Analysis of the Loading and the Strength of the FLAT RACK Removable Module with Viscoelastic Bonds in the Fittings. Appl. Sci. 2023, 13, 79. [Google Scholar] [CrossRef]
  34. Panchenko, S.; Vatulia, G.; Lovska, A.; Ravlyuk, V.; Elyazov, I.; Huseynov, I. Influence of structural solutions of an improved brake cylinder of a freight car of railway transport on its load in operation. EUREKA Phys. Eng. 2022, 6, 45–55. [Google Scholar] [CrossRef]
  35. Kalivoda, J.; Neduzha, L. Running Dynamics of Rail Vehicles. Energies 2022, 15, 5843. [Google Scholar] [CrossRef]
  36. Liu, B.; Bruni, S. Influence of individual wheel profiles on the assessment of running dynamics of a rail vehicle by numerical simulation: A case study. Veh. Syst. Dyn. 2022, 60, 2393–2412. [Google Scholar] [CrossRef]
  37. Klepikov, V.; Semikov, O. Modeling The Dynamic Processes of The Electric Drive of Electric Vehicle While Wheels are Slipping. In Proceedings of the 2020 IEEE Problems of Automated Electrodrive. Theory and Practice (PAEP), Kremenchuk, Ukraine, 21–25 September 2020; IEEE: Piscataway, NJ, USA, 2020; pp. 1–6. [Google Scholar] [CrossRef]
  38. Goolak, S.; Liubarskyi, B.; Sapronova, S.; Tkachenko, V.; Riabov, I.; Glebova, M. Improving a Model of the Induction Traction Motor Operation Involving Non-Symmetric Stator Windings. East.-Eur. J. Enterp. Technol. 2021, 4, 45–58. [Google Scholar] [CrossRef]
  39. Goolak, S.; Kyrychenko, M. Thermal Model of the Output Traction Converter of an Electric Locomotive with Induction Motors. Probl. Energeticii Reg. 2022, 3, 1–16. [Google Scholar] [CrossRef]
  40. Goolak, S.; Riabov, I.; Tkachenko, V.; Yeritsyan, B. The Determination of Power Losses in the Traction Electric Drive Converter of the Electric Locomotive. In Proceedings of the 26th International Scientific Conference “Transport Means”, Kaunas, Lithuania, 5–7 October 2022; pp. 487–492. [Google Scholar] [CrossRef]
  41. Goolak, S.; Liubarskyi, B.; Sapronova, S.; Tkachenko, V.; Riabov, I. Refined Model of Asynchronous Traction Electric Motor of Electric Locomotive. In Proceedings of the 25th International Scientific Conference “Transport Means”, Kaunas, Lithuania, 4–6 October 2021; pp. 455–460. [Google Scholar]
  42. Gubarevych, O.; Golubieva, S.; Melkonova, I. Comparison of the results of simulation modeling of an asynchronous electric motor with the calculated electrodynamic and energy characteristics. Przegląd Elektrotechniczny 2022, 98, 61–66. [Google Scholar] [CrossRef]
  43. Goolak, S.; Riabov, I.; Gorobchenko, O.; Yurchenko, V.; Nezlina, O. Improvement of the model of an asynchronous traction motor of an electric locomotive by taking into account power losses. Prz. Elektrotechnicznythis 2022, 98, 1–10. [Google Scholar] [CrossRef]
  44. Moulahoum, S.; Baghli, L.; Rezzoug, A.; Touhami, O. Sensorless Vector Control of a Saturated Induction Machine accounting for iron loss. Eur. J. Electr. Eng. EJEE Lavoisier 2008, 11, 511–543. [Google Scholar] [CrossRef]
  45. Fathy Abouzeid, A.; Guerrero, J.M.; Endemaño, A.; Muniategui, I.; Ortega, D.; Larrazabal, I.; Briz, F. Control strategies for induction motors in railway traction applications. Energies 2020, 13, 700. [Google Scholar] [CrossRef]
  46. Wang, B.; Chen, S.; Li, M. Research and application of traction converter for electric locomotive in heavy haul railway. In Proceedings of the 2022 IEEE 5th International Conference on Automation, Electronics and Electrical Engineering (AUTEEE), Shenyang, China, 18–20 November 2022; IEEE: Piscataway, NJ, USA, 2022; pp. 598–602. [Google Scholar] [CrossRef]
  47. Kumar, G.A.; Shankar, S.; Murthy, K. Design and control of autonomous hybrid wind solar system with DFIG supplying three-phase four-wire loads. Int. J. Renew. Energy Technol. 2021, 12, 269–299. [Google Scholar] [CrossRef]
  48. Bassey, O.; Chen, C.; Butler-Purry, K.L. Linear power flow formulations and optimal operation of three-phase autonomous droop-controlled Microgrids. Electr. Power Syst. Res. 2021, 196, 107231. [Google Scholar] [CrossRef]
  49. Ramu, S.K.; Irudayaraj, G.C.R.; Subramani, S.; Subramaniam, U. Broken rotor bar fault detection using Hilbert transform and neural networks applied to direct torque control of induction motor drive. IET Power Electron. 2020, 13, 3328–3338. [Google Scholar] [CrossRef]
  50. Mahfoud, S.; Derouich, A.; Iqbal, A.; El Ouanjli, N. ANT-colony optimization-direct torque control for a doubly fed induction motor: An experimental validation. Energy Rep. 2022, 8, 81–98. [Google Scholar] [CrossRef]
  51. Goolak, S.; Gubarevych, O.; Gorobchenko, O.; Nevedrov, O.; Kamchatna-Stepanova, K. Investigation of the influence of the quality of the power supply system on the characteristics of an asynchronous motor with a squirrel-cage rotor. Prz. Elektrotechnicznythis 2022, 98, 142–148. [Google Scholar] [CrossRef]
  52. Goolak, S.; Gerlici, J.; Gubarevych, O.; Lack, T.; Pustovetov, M. Imitation Modeling of an Inter-Turn Short Circuit of an Asynchronous Motor Stator Winding for Diagnostics of Auxiliary Electric Drives of Transport Infrastructure. Commun.-Sci. Lett. Univ. Zilina 2021, 23, C65–C74. [Google Scholar] [CrossRef]
  53. Gubarevych, O.; Goolak, S.; Daki, O.; Tryshyn, V. Investigation of Turn-To-Turn Closures of Stator Windings to Improve the Diagnostics System for Induction Motors. Probl. Energeticii Reg. 2021, 2, 10–24. [Google Scholar] [CrossRef]
Figure 1. Structural block diagram of the vector control system for an asynchronous electric motor.
Energies 16 03689 g001
Figure 2. Simulation model of the electric traction drive with vector control system.
Energies 16 03689 g002
Figure 3. Structural block scheme of direct torque control of the asynchronous electric motor.
Energies 16 03689 g003
Figure 4. Simulation model of the electric traction drive with direct torque control.
Energies 16 03689 g004
Figure 5. Time diagrams of the angular speed setter in the vector control system (a) and in the direct torque control system (b).
Energies 16 03689 g005
Figure 6. Time diagrams of phase currents of the stator in the absence of power supply and torque disturbances: the vector control system (a) and the direct torque control system (b).
Energies 16 03689 g006
Figure 7. Time diagrams of the rotational speed of the motor shaft in the absence of power supply and torque disturbances: the vector control system (a) and the direct torque control system (b).
Energies 16 03689 g007
Figure 8. Time diagrams of the torque in the absence of power supply and torque disturbances: the vector control system (a) and the direct torque control system (b).
Energies 16 03689 g008
Figure 9. Time diagrams of power consumption in the absence of power supply and torque disturbances: the vector control system (P1VC) and the direct torque control system (P1DTC).
Energies 16 03689 g009
Figure 10. Inverter supply voltage time diagram.
Energies 16 03689 g010
Figure 11. Time diagrams of the angular speed setter in the vector control system (a) and in the direct torque control system (b).
Energies 16 03689 g011
Figure 12. Time diagrams of phase currents of the stator in the presence of power supply disturbances: the vector control system (a) and the direct torque control system (b).
Energies 16 03689 g012
Figure 13. Time diagrams of the rotational speed of the motor shaft in the presence of power supply disturbances: the vector control system (a) and the direct torque control system (b).
Energies 16 03689 g013
Figure 14. Time diagrams of the torque in the presence of power supply disturbances: the vector control system (a) and the direct torque control system (b).
Energies 16 03689 g014
Figure 15. Time diagrams of power consumption in the presence of power supply disturbances: the vector control system (P1VC) and the direct torque control system (P1DTC).
Energies 16 03689 g015
Figure 16. Time diagram of load variation on the electric motor shaft.
Energies 16 03689 g016
Figure 17. Time diagrams of the angular speed setter in the vector control system (a) and in the direct torque control system (b).
Energies 16 03689 g017
Figure 18. Time diagrams of phase currents of the stator in the presence of load disturbances: the vector control system (a) and the direct torque control system (b).
Energies 16 03689 g018
Figure 19. Time diagrams of the rotational speed of the motor shaft in the presence of load disturbances: the vector control system (a) and the direct torque control system (b).
Energies 16 03689 g019
Figure 20. Time diagrams of the torque in the presence of load disturbances: the vector control system (a) and the direct torque control system (b).
Energies 16 03689 g020
Figure 21. Time diagrams of power consumption in the presence of load disturbances: the vector control system (P1VC) and the direct torque control system (P1DTC).
Energies 16 03689 g021
Table 1. Parameters of electric traction motor AD914U1 (AД914У1).
ParameterValue
Power P, kW.1200
Phase-to-phase RMS voltage Unom, V1870
RMS value Inom, A450
Nominal frequency of supply voltage fnom, Hz55.8
Number of phases n, pcs.3
Number of pole pairs pp3
Nominal rotational speed nrnom, rpm1110
Efficiency η,%95.5
Power factor cosφ, per unit0.88
Active resistance of the stator winding rs, Ω0.0226
Active resistance of the rotor winding reduced to the stator winding r′r, Ohm0.0261
Stator winding leakage inductance Lσs, Hn0.00065
Rotor winding leakage inductance reduced to the stator winding, L′σr, Hn0.00045
Total magnetizing circuit inductance LμN0.0194336
Moment of inertia of the motor J, kg·m273
Table 2. Data sheet parameters of the autonomous voltage inverter of the DC-3 (ДC-3) electric locomotive.
ParameterValue
Instantaneous value of phase voltage Unom, B1527
Instantaneous value of nominal phase voltage Inom, A450
IGBT module type: 5SNA1200G450350
Number of IGBT modules Nmodule, units6
Table 3. Data sheet parameters of IGBT module 5SNA1200G450350.
ParameterValue
Collector-emitter voltage VCES (VGE = 0 V), V4500
DC collector current IC (Tc = 85 °C), A1200
Peak collector current ICM (tp = 1 ms, Tc = 85 °C), A2400
Gate-emitter voltage VGES, VVGESmax = 20
VGESmin = 20
Total power dissipation Ptot (Tc = 25 °C, per switch (IGBT), W10,500
DC forward current IF, A1200
Peak forward current IFRM, A2400
Surge current IFSM (VR = 0 V, Tvj = 125 °C, tp = 10 ms, half-sinewave), A9000
Isolation voltage Visol (1 min, f = 50 Hz), V10,200
Transistor
Collector (-emitter) breakdown voltage V(BR)CES (VGE = 0 V, IC = 0 mA, Tvj = 25 °C), V4500
Collector-emitter saturation voltage VCEsat (IC = 1200 A, VGE = 15 V), V2.9(Tvj = 25 °C)
3.9(Tvj = 125 °C)
Gate leakage current IGES (VCE = 0 V, VGE = ±20 V, Tvj = 125 °C), nAIGESmax = 500
IGESmin = −500
Collector cut-off current ICES (VCE = 4500 V, VGE = 0 V), mA12(Tvj = 25 °C)
120(Tvj = 125 °C)
Gate-emitter threshold voltage VGE(TO) (IC = 240 mA, VCE = VGE, Tvj = 25 °C), VVGE(TO)max = 6.5
VGE(TO)min = 4.5
Input capacitance Cies (VCE = 25 V, VGE = 0 V, f = 1 MHz, Tvj = 25 °C), nF120
Output capacitance Coes (VCE = 25 V, VGE = 0 V, f = 1 MHz, Tvj = 25 °C), nF6.02
Reverse transfer capacitance Cres (VCE = 25 V, VGE = 0 V, f = 1 MHz, Tvj = 25 °C), nF2.58
Internal gate resistance RGint, Ω1.2
Module stray inductance LσCE, nH18
Resistance, terminal-chip RCC’+EE’, mΩ0.07(Tvj = 25 °C)
0.1(Tvj = 125 °C)
Diode
Forward voltage UF (IF = 1200 A), V3.7(Tvj = 25 °C)
4.0(Tvj = 125 °C)
Reverse recovery current Irr (VCC = 2800 V, IF = 1200 A, VGE = ±15 V, RG = 1.5 Ω, CGE = 220 nF, Ls = 150 nH inductive load), A1460(Tvj = 25 °C)
1600(Tvj = 125 °C)
tp—current peak duration time; Tc—case temperature; Tvj—junction temperature.
Table 4. Comparison of the stator current values of the electric traction drive with vector control versus electric traction drive with direct torque control at the steady-state inverter supply voltage and steady-state load on the motor shaft in steady-state operation modes.
ParameterControl System
VectorDirect Torque Control
Time Intervals, s
0–0.73.7–4.75.0–6.06.6–83.0–4.24.5–5.76.3–8.0
Instantaneous value of the first harmonic of the stator phase current Is(1), AIsa(1)317.4635.6631622.2636634.5638.8
Isb(1)−158.7635.6630622.2636634.5638.8
Isc(1)−158.7635.6630622.2636634.5638.8
Table 5. Comparison of the rotational speed values of the motor shaft and the torque values in electric traction drives with vector control versus electric traction drives with direct torque control at the steady-state inverter supply voltage and steady-state load on the motor shaft in steady-state operation modes.
ParameterSet ValueControl System
VectorDirect Torque Control
Time Intervals, s
0–0.73.7–4.75.0–6.06.6–83.0–4.24.5–5.76.3–8.0
ValueError δ, %ValueError δ, %ValueError δ, %ValueError δ, %ValueError δ, %ValueError δ, %ValueError δ, %
Rotational speed of the drive shaft nr, rpm11100-11130.2710020.312250.3311100998.701151.75.68
Average torque value Tav, N·m10,3240-10,4411.1310,4210.9310,4381.110,324010,324010,3240
Table 6. Comparison of the torque pulsation coefficient in electric traction drives with vector control versus electric traction drives with direct torque control at the steady-state inverter supply voltage and steady-state load on the motor shaft in steady-state operation modes.
ParameterControl System
VectorDirect Torque Control
Time Intervals, s
0–0.73.7–4.75.0–6.06.6–83.0–4.24.5–5.76.3–8.0
Maximum torque value Tmax, N·m011,58011,32011,53012,30911,59515,224
Minimum torque value Tmin, N·m0930295229346833990535424
Average torque value Tav, N·m010,44110,42110,43810,32410,32410,324
Torque pulsation factor kpT, %010.828.6210.4619.2312.3147.46
Table 7. Comparison of energy performance characteristics in electric traction drives with vector control versus electric traction drives with direct torque control at the steady-state inverter supply voltage and steady-state load on the motor shaft in steady-state operation modes.
ParameterControl System
VectorDirect Torque Control
Time Intervals, s
0–0.73.7–4.75.0–6.06.6–83.0–4.24.5–5.76.3–8.0
Power consumption P1s.s., kW5.883135212221489133912161387
Efficiency, %09089.589.989.688.789.8
Table 8. Comparison of quality indicators of the transient processes of the electric traction drive with vector control and direct torque control at steady-state inverter supply voltage and steady-state load on the motor shaft.
ParameterControl system
VectorDirect Torque Control
Time Intervals, s
3.65–4.04.5–5.76.6–6.83.0–3.24.5–4.76.3–6.5
Transient process time ttp, s0.1150.1110.1150.1150.1110.137
Maximum peak torque value Tpmax, N·m10,01011,57010,11011,57011,00016,770
Minimum peak torque value, Tpmax, N·m880210,5509568791410,5305668
Average peak torque value, Tavmax, N·m940611,0609839974210,76511,219
Torque overshoot σT, %9.9110.616.095.644.278.67
Table 9. Comparison of electric traction drive x characteristics with vector control and direct torque control in the presence of a power supply disturbance during steady-state speed operation.
ParameterControl System
VectorDirect Torque Control
Time Interval, s
0–0.73.7–5.03.0–5.0
Instantaneous value of the first harmonic of the stator phase current Is(1), AIsA = 314.8IsA = 702.0IsA = 636.36
IsB = −152.8IsB = 704.3IsB = 636.515
IsC = −152.8IsC = 703.6IsC = 636.412
Rotational speed of the drive shaft nr, rpm011141110.2
Maximum torque value Tmax, N·m011,91012,420
Minimum torque value Tmin, N·m093448252
Average torque value Tav, N·m010,62710,336
Power consumption P1, kW543813821343
Torque pulsation factor kpT, %012.0720.16
Stator phase current unbalance factor kimbI, %00.330.02
Table 10. Comparison of electric traction drive characteristics with vector control and direct torque control in the presence of a load disturbance during steady-state speed operation.
ParameterControl System
VectorDirect Torque Control
Time Interval
0–0.73.7–5.03.7–5.0
Instantaneous value of the first harmonic of the stator phase current Is(1), AIsA = 307.3IsA = 925.7IsA = 1676
IsB = −159.8IsB = 921.7IsB = 1676
IsC = −159.8IsC = 923.6IsC = 1676
Maximum rotational speed of the motor shaft nrmax, rpm0112.2112.4
Minimum rotational speed of the motor shaft nrmin, rpm0107.4111.7
Average value of rotational speed of the motor shaft nrav, rpm0109.8111.0
Maximum torque value Tmax, N·m010,81010,340
Minimum torque value Tmin, N·m000
Maximum power consumption P1rmax, kW5.915138.2240.1
Minimum power consumption P1rmin, kW5.91552.42136.7
Speed instability coefficient kn.st.nr, %02.190.63
Stator phase current unbalance factor kimbI, %00.230
Table 11. Comparative analysis of the characteristics of the electric traction drive with vector control and direct torque control systems in the steady-state modes in the absence of disturbances.
Comparison
Results
Control System
VectorDirect Torque Control
Nominal Mode
AdvantagesLower value of the pulsation coefficient
Higher efficiency value
Higher torque control accuracy
Higher speed control accuracy
Lower power consumption
DisadvantagesLower torque control accuracy
Lower speed control accuracy
Greater power consumption
Higher value of the pulsation coefficient
Lower efficiency value
Reduced Speed
AdvantagesLower value of the pulsation coefficient
Higher efficiency value
Higher torque control accuracy
Higher speed control accuracy
Lower power consumption
DisadvantagesLower torque control accuracy
Lower speed control accuracy
Greater power consumption
Higher value of the pulsation coefficient
Lower efficiency value
Increased Speed
AdvantagesLower value of the pulsation coefficient
Higher speed control accuracy
Higher torque control accuracy
Lower power consumption
DisadvantagesLower torque control accuracy
Greater power consumption
Higher value of the pulsation coefficient
Lower speed control accuracy
Table 12. Comparative analysis of the quality of transient processes in the electric traction drive with vector control and direct torque control in the absence of disturbances.
Comparison
Results
Control System
VectorDirect Torque Control
Nominal Mode
AdvantagesLower value of overshooting
DisadvantagesHigher value of overshooting
Reduced speed
AdvantagesLower value of overshooting
DisadvantagesHigher value of overshooting
Increased speed
AdvantagesLower value of overshootingShorter duration of transient processes
DisadvantagesHigher value of overshootingLonger duration of transient processes
Table 13. Comparative analysis of the quality of transient processes in the electric traction drive with vector control and direct torque control in the absence of disturbances.
Comparison
Results
Control System
VectorDirect Torque Control
Power Supply Disturbance
AdvantagesLower value of the torque pulsation coefficientHigher torque control accuracy
Higher speed control accuracy
Lower power consumption value
Lower value of phase current unbalance factor
DisadvantagesLower torque control accuracy
Lower speed control accuracy
Higher power consumption value
Higher value of phase current unbalance factor
Higher value of the torque pulsation coefficient
Load disturbance
AdvantagesLower power consumption valueLower value of speed instability coefficient
Lower value of phase current unbalance factor
DisadvantagesHigher value of speed instability coefficient
Higher value of phase current unbalance factor
Higher power consumption value
Disclaimer/Publisher’s Note: The statements, opinions and data contained in all publications are solely those of the individual author(s) and contributor(s) and not of MDPI and/or the editor(s). MDPI and/or the editor(s) disclaim responsibility for any injury to people or property resulting from any ideas, methods, instructions or products referred to in the content.

