Article

Smoke Formation during Combustion of Biofuel Blends in the Internal Combustion Compression Ignition Engine

1
Department of Automobile Engineering, Faculty of Transport Engineering, Vilnius Gediminas Technical University, J. Basanavičiaus Street 28, LT-03224 Vilnius, Lithuania
2
Department of Production Management, Faculty of Engineering Management, Bialystok University of Technology, Wiejska Street 45A, 15-351 Bialystok, Poland
3
Department of Production Computerisation and Robotisation, Faculty of Mechanical Engineering, Lublin University of Technology, Nadbystrzycka Street 36, 20-618 Lublin, Poland
4
Department of Production Engineering, Institute of Mechanical Engineering, Warsaw University of Life Sciences, Nowoursynowska Street 164, 02-787 Warsaw, Poland
*
Authors to whom correspondence should be addressed.
Energies 2023, 16(9), 3682; https://doi.org/10.3390/en16093682
Submission received: 3 April 2023 / Revised: 23 April 2023 / Accepted: 24 April 2023 / Published: 25 April 2023
(This article belongs to the Section I2: Energy and Combustion Science)

Abstract

:
The proposed changes to the legislation on diesel cars require intensification of work on the possibilities of reducing emissions of harmful substances into the atmosphere by these vehicles. The subject of experimental research included in the manuscript was the Skoda Octavia with a 1.9 TDI (turbocharged direct injection) compression ignition engine (type 1Z). Light absorption measurements of smokiness of the exhaust gases emitted after combustion of various biofuels (conventional diesel, pure hydrotreated vegetable oil, hydrotreated vegetable oil, biobutanol) and their blends with fossil diesel fuel were studied. The measured light absorption coefficient is the reciprocal of the thickness of the layer, after passing through which the light has a ten times lower intensity. Its unit is the reciprocal of the meter (1/m or m−1). The results obtained by means of a standard smokiness meter indicate that the use of biofuels or their blends, in general, reduces smoke formation.

1. Introduction

Emission of harmful exhaust gases is a subject that has accompanied us for years [1,2,3]. These efforts are particularly highlighted when the next state-of-the-environment reports are published. According to SNAP (Selected Nomenclature for sources of Air Pollution), eleven emission source categories are distinguished: combustion processes in the energy production and transformation sector, combustion processes in the municipal and residential sectors, combustion processes in industry, production processes, extraction and distribution of fossil fuels, use of solvents and other products, road transport, other vehicles and equipment, waste management, agriculture, and other emission and abatement sources [4]. However, to a large extent, policy makers focus primarily on the transport sector [5,6,7].
The transport sector is responsible for almost a quarter of all global greenhouse gas (GHG) emissions and is a major contributor to air pollution in urban areas [8,9]. Achieving climate neutrality for cars and their factories requires manufacturers to spend billions of dollars, great determination, and the ability to comprehensively analyse issues and impacts on sustainability [10,11,12]. Consistent action by producer groups brings tangible results in the form of millions of tonnes of carbon dioxide and other pollutants that do not reach the atmosphere. It is not only emissions from car exhaust pipes that have an impact on the environment [13,14,15]. Compounds released during tyre wear during driving are also harmful. Moreover, during braking, the brake discs emit solid particles; this can be eliminated by introducing an electrical component into the drive systems, permitting regenerative braking with an electric motor, which largely replaces the conventional braking system [16,17]. The issues of so-called secondary dusting are also important. A moving car blasts into the air what lies on the roadway: nitrogen oxides, carbon, benzene compounds, heavy metals, and aromatic hydrocarbons. Carbon dioxide and monoxide, nitrogen oxides, sulphur dioxide, and dust are also produced in the power plant production process necessary for steelworks and factories. Therefore, the way in which this energy is obtained is also crucial [18,19,20].
The operation of any internal combustion engine is associated with the emission of a certain amount of harmful substances [21,22]. Their maximum content in exhaust gases is determined by the relevant standards, which are set separately for petrol and diesel units [23,24].
Emission standards are the limits set by the European Union for the emission of harmful substances in the exhaust gases, which are imposed on new cars sold in the EU and the European Economic Area. The first Euro 1 standard was introduced in 1993 and the new Euro 7 emission standard is planned for early 2025. Each of the successive standards introduced lowered the limit value for emissions into the atmosphere. Information about the emission standard of the car is contained in the vehicle documents and visible on the sticker located in the door opening next to the driver’s seat. This is important not only from the point of view of environmental awareness, but also from the point of view of clean transport zones in cities [25,26].
Compression ignition engines differ, compared to spark ignition engines, in the way the mixture is prepared, its combustion, and the type of fuel used. The consequence of these differences is different values of the combustion parameters and different composition and concentration of the main components of the exhaust gas [27,28,29].
Currently, work on second-generation biofuels (e.g., cellulosic ethanol, biohydrogen, biomethanol) and third-generation biofuels (e.g., biofuels produced from algae and other micro-organisms) is continuing in many research centres around the world. One way to reduce the environmental impact of toxic components of exhaust gases is to use fuels of plant origin [30,31,32].
Studies of exhaust emissions, composition of engine exhaust gases, and level of smoke are the subject of many scientific papers. A review of the analysis of performance and emission characteristics of a diesel engine fuelled by different gaseous fuels and biofuels was carried out in [33]. Modification of diesel with oxide nanoparticles to investigate its effect on engine behaviour was the subject of research in [34]. A multi-objective optimisation test of performance, combustion, and emissions characteristics of a diesel engine fuelled with diesel, kerosene, and ethanol was the subject of research in [35].
Due to its specific physicochemical properties, butanol is listed among the potential successors of ethanol. Butanol is an alcohol that can be produced either by petrochemical processes or by biomass fermentation and, therefore, from renewable sources (biobutanol).
Butanol is found in the form of four isomers: n-butanol, sec-butanol, isobutanol, and tert-butanol, differing from each other in both the location of the hydroxyl group and the structure of the hydrocarbon chain (simple or branched). Isobutanol, due to its fairly high octane number, is a component of gasoline (the normative requirements allow its content in petrol up to 10% (v/v)). Tert-butanol is used as an additive to gasoline, increasing the octane number. N-butanol is used as an intermediate for organic synthesis, an additive for oils, and a raw material for the production of solvents and co-solvents. This isomer is also most commonly used for testing applications in compression ignition engines. The advantage of butanol is the ability to use blends with petroleum fuels with a higher alcohol content (up to 40%) without engine modification [33,34,35].
Among the fuels on which laboratory tests are ongoing is HVO (hydrogenated vegetable oil). HVO emits 90% less carbon dioxide, 30% less particulate matter, and 9% less nitric oxide compared to conventional diesel. The basis for its production is waste of vegetable origin, such as leftovers of vegetables and fruits or even expired margarine. HVO can be sold as pure HVO100 or blended with conventional diesel in various proportions, e.g., HVO30, HVO50, etc. In pure form, it reduces CO2 emissions by approx. 90% [36,37].
As a result of a technical fault or exploitation, the engine of a car may emit an above-average amount of harmful substances. Detecting deviations from the standards adopted in this area is the task of vehicle inspection stations, which are currently obliged to check exhaust emissions during the periodic technical inspection. Depending on the type of drive unit, not only the measurement methods and measuring equipment but also the measured parameters are different.
Gasoline cars use a high-precision analyser to measure carbon monoxide (CO), carbon dioxide (CO2), oxygen (O2), and hydrocarbons (CH), as well as to calculate the lambda coefficient (λ) for the composition of the fuel–air mixture that burns in the cylinders.
In the case of cars equipped with compression ignition engines, a device named an opacimeter is used to measure the so-called light absorption coefficient. During the periodical technical inspection, exhaust smoke control shall be carried out by means of a free acceleration test, which is reduced to measuring the maximum smoke occurring during free acceleration of the engine from idle speed to maximum speed. The smoke that occurs during the free acceleration test is assumed to be comparable to the smoke at the highest engine torque.
Nitrogen oxides (NOx) and particulate matter (PM) are the main toxic components in the exhaust gas of compression ignition engines. Particulate matter (PM) emissions are specific to compression ignition engines and result from the properties of the fuel used, the combustion process, and the formation of a combustible mixture. The measurement of the correctness of the combustion process in a compression ignition engine is the smoke of the exhaust gases. Exhaust smoke is the result of the presence of particulate matter (mainly black smoke), hydrocarbons (blue smoke), and water vapour (white smoke). The exhaust smoke measurement for diagnostic purposes shall be carried out with the vehicle stationary, with the gear lever in the neutral position, while the engine is running in free gear using the free acceleration method. The parking brake should be engaged. The setting of the fuel dose adjustment screw of the injection pump shall be as recommended by the manufacturer.
One of the fundamental issues in assessing air quality is the concentration of particulate matter. Particulate matter is a term generally used for a type of air pollution consisting of a complex of different mixtures of suspended particles that vary in size, composition, and location of formation. The basic distribution of particulate matter results from their aerodynamic diameter, which allowed the determination of two main groups: PM2.5 and PM10 (particulate matter) for diameters smaller than 2.5 μm and 10 μm, respectively. PN is the particle number (PN).
All exhaust components from complete and incomplete combustion of motor fuels shall be transparent and colourless. Incorrect combustion of the mixture is evidenced by the emission of opaque exhaust gases of a specified colour into the environment by the engine in operation. Exhaust gases become discoloured as a result of incomplete combustion of fuel. The products of such combustion are coal in the form of fine soot particles and unburned hydrocarbons and water vapour condensing in the exhaust pipe. Soot is not present in pure form. It absorbs large quantities of hydrocarbons and is, therefore, a very toxic component of exhaust gases, mainly in compression ignition engines. The colour of the exhaust gases and the degree of their blackening allow to determine with a high probability the type of underwriting and the degree of engine wear [38,39,40].
The aim of the study, the results of which are presented in the manuscript, was to analyse the exhaust smoke and the concentration of particulate matter (PM) emitted by a diesel vehicle. The subject of the research was the Skoda Octavia with a 1.9 TDI (turbocharged direct injection) compression ignition engine (type 1Z) powered by 5 different fuels and their mixtures: conventional diesel (labelled as D100), pure hydrotreated vegetable oil (labelled as HVO100), hydrotreated vegetable oil and biobutanol mixtures (95/5, 90/10, and 80/20 (% vol/% vol)), and blends (labelled as HVOB5, HVOB10, and HVOB20). For better lubricity, castor oil (accounting for 5% of biobutanol volume) was added as an additive to biobutanol blends. Experimental tests were carried out using the MAHA LPS 2000 test stand and with the ROSS-TECH VCDS vehicle diagnostic device.
For many years, the authors of this manuscript have been studying the application of very different compositions of fuel mixtures (Petrol 95, ethanol, methanol, DME, CNG, LPG, diesel FAME, rapeseed oil butanol), taking into account both engine type and vehicle type [41,42,43,44,45]. The tests carried out are laboratory tests performed on measuring stations and tests performed using computer simulations (based on hourly fuel consumption characteristics, g/kWh). For studies based on computer simulations, the author’s computational tools are based on neural networks, and the results of the studies must always be analysed in the context of laboratory studies. Taking into account the very broad context of the research carried out in the context of the composition of fuel mixtures, the vehicle brand is taken into account. This is relevant in the context of driving tests, where the emissions of pollutants from the vehicle into the atmosphere are analysed in the context of permissible limits (taking into account additional vehicle equipment, e.g., air conditioning, heated seats). In addition, not only exhaust emissions but also water vapour emissions from the vehicle’s exhaust system are analysed in the data presented by the authors.

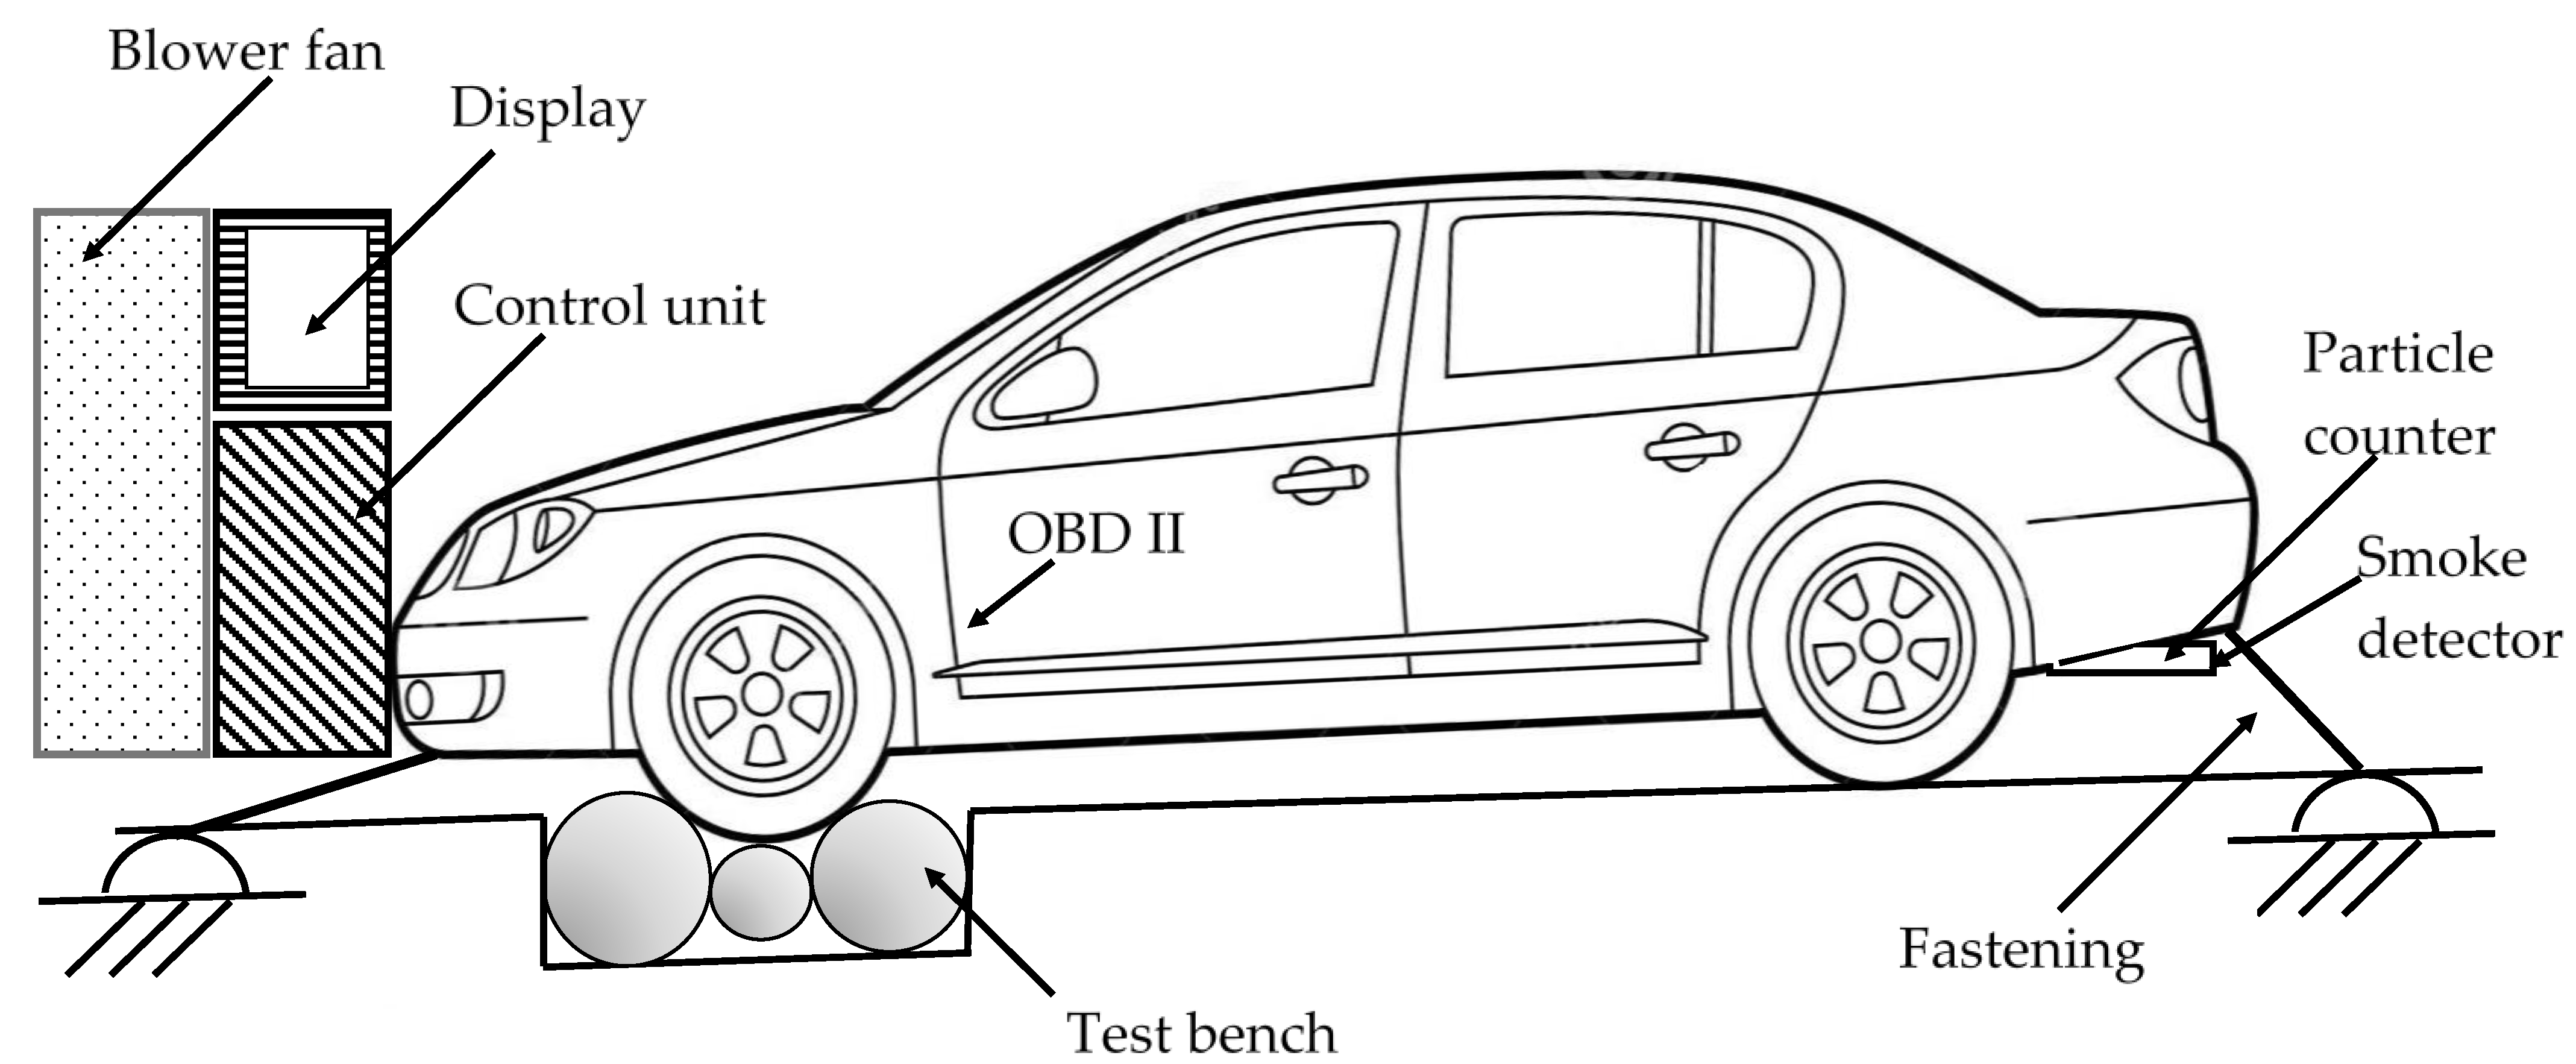
2. Materials and Methods
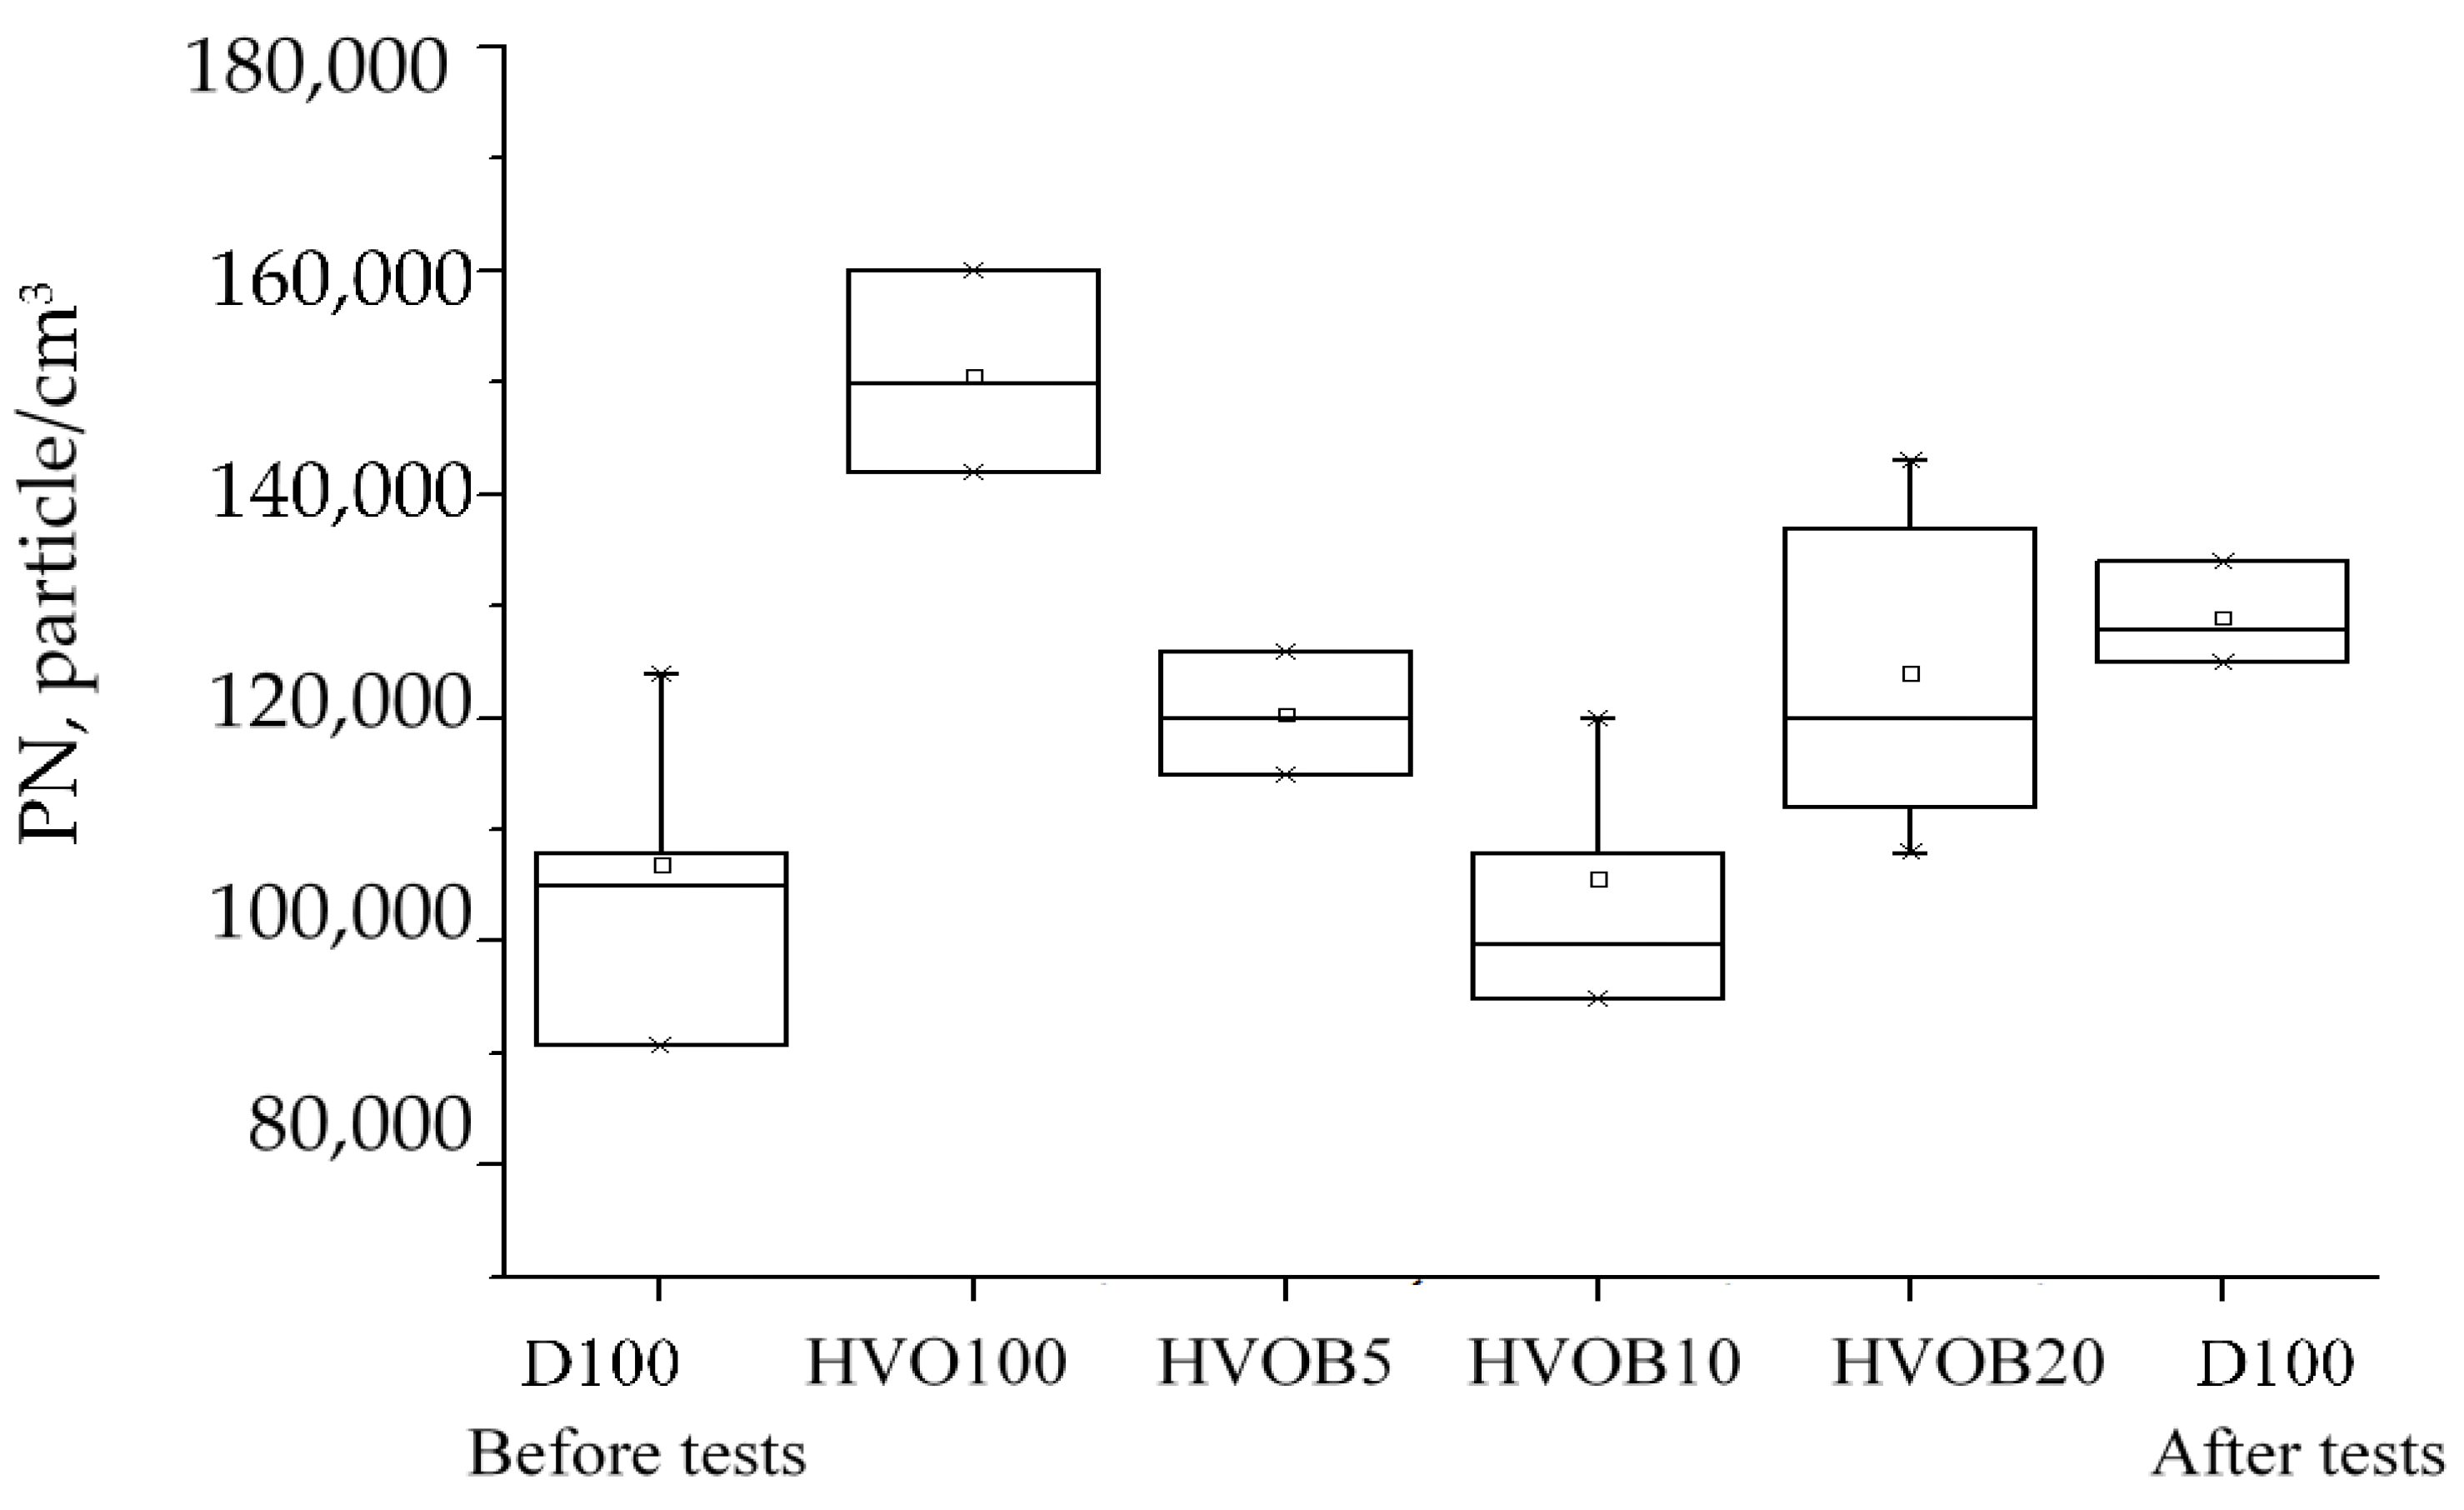
Tests were conducted using the Skoda Octavia with a 1.9 TDI (turbocharged direct injection) compression ignition engine (type 1Z), with 4 cylinders, 1896 cm3 displacement TDI (type—1Z) compression ignition engine. Maximum power of engine: 66 kW at 4000 rpm. Maximum torque: 182 Nm at 1900 rpm. Detailed technical data of the 1.9 TDI engine are listed in Table 1 [46].
Using computerized vehicle test bench, MAHA LPS 2000 (Table 2) was established testing vehicle engines’ (Skoda Octavia with 1.9 TDI diesel, type 1Z) torque and power (Figure 1).
Vehicle test bench has options to make measurements using any gear, with selected load or calculated driving resistance. The load for vehicle is generated by an electromagnetic brake which converts the mechanical energy of the engine transmitted to the wheels into thermal energy and radiates it outwards. Vehicle load bench technical parameters are listed in Table 2.
During experimental tests, car diagnostic device ROSS-TECH VCDS was used, in addition to device scan data using OBDII connection from electronic control unit (ECU) to measure the following: fuel consumption, turbocharger pressure, fuel injection timing. Data from the car diagnostic device ROSS-TECH VCDS were recorded at ~2.5 s interval [48,49,50].
Analysing engine ECU (electronic control unit) data, we observed that recorded data points are sent in separate blocks and are not exactly synchronized in time (engine speed (rpm), cyclic fuel quantity (mg/cycl), cyclic air mass (mg/cycl), fuel injection timing (°BTDC), turbocharger pressure (mbar), or fuel injection timing (mg/cycl).
Experimental tests were carried out three times using vehicle test bench MAHA LPS 2000. Engine external speed characteristic was measured using the ECU data recorded by the car diagnostic device ROSS-TECH VCDS.
Emission of diesel cars is estimated using two different methods: measuring exhaust gas smoke and particle matter (PM) concentration. Smoke measured with a smoke detector CET2200C, which determines light absorption coefficient, showing how much light is emitted by the light installed in the meter source, is absorbed by the smoke emitted from the vehicle. Smoke meter measurement limits are 0–99.99 m−1 and accuracy is 0.01 m−1.
Particulate matter (PN) emissions from vehicles equipped with particulate filters are very low. Particulate number measurements in the exhaust gas are carried out on diluted (PEMS, portable emissions measurement systems) or solid exhaust gas. Particles with a nominal diameter of 23 nm to 2.5 μm shall be measured. PEMS measures raw exhaust gases with all related challenges (e.g., condensation, instrument wear). The legal basis for the analysis of PNs are: UN/ECE Global Technical Regulation No. 15; UNECE Regulation No. 83; Regulation (EC) No. 715/2007—EC 692/2008 [51,52,53].
Before each measurement is checked, engine is warmed up to normal operating temperature. The exhaust system is accelerated at least three times from the minimum idle speed to the limiter limited speed. The smoke of the exhaust gas measured when the engine is allowed to accelerate, free from load, from minimum idle speed to the limiter limited speed. Before each free acceleration cycle, the engine and turbocharger must be running at steady minimum idle speeds not less than 15 s. Each free acceleration, the cycle starts quickly and consistently so that the fuel injection operates at maximum efficiency. During the free acceleration cycle, before the accelerator pedal is released, the engine must reach the speed limit frequency.
The concentration of particle matters in the exhaust gas was measured immediately after measuring the smoke, with the engine running at idle speed, using the PM concentration counter P-Trak ultrafine particle counter 8525. The technical parameters of the PM counter are presented in Table 3.
The PM counter only detects very fine PM (particles with an aerodynamic diameter of 0.02–1 μm). In the device, we installed a pump, data processing equipment, a cartridge containing isopropanol, and a telescopic probe. In the cassette, the required level of isopropanol must be maintained. This technical fluid ensures the detection of the smallest microscopic particles. PM increases significantly when it flows through isopropanol.
Experimental tests were carried out using 5 different fuels and blends: conventional diesel (labelled as D100), pure hydrotreated vegetable oil (labelled as HVO100), hydrotreated vegetable oil and biobutanol mixtures (95/5, 90/10, and 80/20 (% vol/% vol)), and blends (labelled as HVOB5, HVOB10, and HVOB20). For better lubricity, castor oil (accounting for 5% of biobutanol volume) was added as an additive to biobutanol blends. Properties of pure fuels were analysed and are presented in Table 4 and Table 5.
Because the use of biobutanol deteriorates the lubrication properties of the fuel mixture, it is necessary to use certain specialized fuel additives or a fuel component that provides lubrication. Because the use of specialized additives is expensive and requires special compatibility studies, castor oil was chosen as a cheap lubricating alternative.
All physicochemical fuel parameters have been verified on the basis of data found in the literature and fuel characteristics provided by their manufacturer [54,55,56,57,58,59,60].

3. Results

The results obtained during the study allow us to justify the perspectives of second-generation biofuels, taking into account the amount of smokiness and PN. When examining the smokiness values (Figure 2), its decrease is noticeable compared to standard diesel.
The information shown in Figure 2, Figure 3, Figure 4 and Figure 5 is visually complementary. Its purpose is to show the differences in the fuel mixtures analysed.
The smokiness values tended to be highest when using standard diesel (in this comparison, for the time being we will use the data from D100 Before Tests). Using second-generation biodiesel HVO100 as fuel reduced smokiness by 40%. This was because of the better combustion process of HVO 100 due to the additional oxygen contained in it. With the addition of biobutanol, smokiness reduction trends increased even more. As the concentration of biobutanol in HVO fuel increases, a significant decrease in smokiness trends can be seen (comparing the HVOB20 mixtures with HVO100 (36%) and with D100 (60%)). This was due to the oxygen present in biobutanol, which further initiated the improvement of the combustion process; this was also observed in other works by the authors. A small addition of biobutanol (up to 5%) had no significant effect on the smoke values. Another interesting effect occurred when measuring smokiness using diesel after tests with biofuel blends. The use of biofuel mixtures promotes the cleaning of the exhaust system with the reduction of smog emissions, and the effect when fueling diesel (D100 After Tests) compared to D100 Before Tests reached 18%.
Such smoke values show a sufficient motivation to use biofuels from an environmental point of view. However, if we examine the smoke dispersion values obtained during the tests (Figure 3), it can be stated that only a higher amount of biobutanol (up to 20% HVOB20 mixture) reduces the smoke dispersion limits (quartile range was 0.3 m−1).
Both the D100 Before Tests and HVO100, HVOB5, and HVOB10 generated a similar quartile field of results, which reached 0.4–0.1 m−1. Such a spread of smokiness is acceptable when evaluating real steady car test conditions. After the biofuel tests using diesel again (D100 After Tests), the dispersion of the results was the highest and reached 0.19 m−1. Such scattering allows us to say that although the exhaust system is cleaned, this effect causes the reduction of smogginess to decrease very quickly, leading us to believe that during further exploitation it will return to the original values of diesel smogginess (D100 Before Tests).
Examining the total concentration of PN (range 0.02 to 1 µm) shows a different result than when examining smokiness. The highest PN value was observed with HVO 100 fuel. This can be explained by the better volatility properties of these fuels, as these fuels have a smaller weight fraction compared to diesel. However, the concentration of PN decreased with the use of biobutanol. Such a decrease can raise two main hypotheses. The first would be that biobutanol changes the physical properties of HVO during chemical reactions, allowing the formation of derivatives of a heavier fraction. Another hypothesis would be that the measuring device cannot register smaller particles and they are eliminated from the scoreboard. Seemingly, cardinal hypotheses allow us to assume the possibility of using biobutanol as a reactive fuel additive. It is volatile and evaporates well, but its density is closer to that of HVO fuel, allowing for the formation of stable mixtures that do not tend to stratify compared to ethanol or other alcohols.
The second hypothesis is supported by the fact that the dispersion of the HVOB20 results is the highest and reaches 35,000 particles/cm3 (Figure 4). However, when using diesel and biofuel mixtures, such a greater difference was not observed (15,000–30,000 particle/cm3).
It is likely that increasing the biobutanol concentration would increase the dispersion of PNs and it could be argued that very small particles are generated using alcohols as biofuel additives.

4. Discussion

The results show that using biofuel mixtures (HVO with biobutanol) can reduce smokiness. This is very relevant, according to the currently valid legal acts of the Republic of Lithuania, which state that a vehicle cannot be driven if the smoke limits are exceeded. These provisions are particularly relevant for older diesel cars (starting with EURO 4 and below). After the entry into force of the new EURO 6B and expected EURO 7 standards, the particle concentration itself (which can also be expressed through PM or smokiness) and the actual PN will both be important. The introduction of this provision should limit the emissions of ultrafine particles that can already occur with leaner fuel mixtures. In our case, it becomes very important to identify correlational dependencies between smokiness and PN indicators. They allow the identification of individual fuel blends that reduce smog but may generate large amounts of PN. The correlations between smoke and PN may differ when using different biofuel blends, so it is important to identify and demonstrate them (Figure 6).
In order to analyse the value of the standard deviation, in the context of the change in the distribution of parameters, to assess the reliability of statistical data, Table 6 presents the results for the Shapiro–Wilk normality test and the compliance of the statistical data curve with the descriptive characteristics of the curve (Kolmogorov–Smirnov normality test). These parameters are interesting for correct data processing and show how exactly the exponential curve fits the statistical curve of the experimental data. The results obtained show that the data were processed correctly (smoke and PN data were significantly drawn from a normally distributed population at the level of 0.05). The authors believe that the purpose of this study is not to show how statistical data processing is performed, but rather to analyse and interpret the results.
In research practice, it is very often the case that due to the high cost of the analysis (the cost of the experiment conducted on the test bench) there is a need to verify the consistency of the data distribution with the normal distribution for a small sample size. In this case, the tests were repeated 3 times (p-value: 0.345).
Among the many tests verifying the compatibility of empirical and theoretical distributions, the focus was on the Shapiro–Wilk compatibility test. This test is considered to be one of the strongest tests for normal distribution, especially when testing “small numbers” samples. The test is used to verify the hypothesis that the distribution of the tested random variable is in accordance with the normal distribution.
In the case of the test used, the zero hypothesis indicates the normal distribution of the tested characteristic. For a p-value below 0.05, we reject this hypothesis in favour of an alternative one. However, taking into account the p-value—which is, nonetheless, different from 0—the median value very close to the mean, and considering the skewness and excess coefficient to be insignificantly different from 0, we can conclude, with some caution, that the distribution of smoke measurements is close to normal [61].
The manuscript uses elements of descriptive statistics as a method of summarizing data in a valid and meaningful way. In this way, it was shown that good and appropriate measurement is important not only for the data, but also for the statistical methods used to test hypotheses. For continuous data, normality testing is very important, because based on the state of normality, measures of central tendency, dispersion, and the choice of parametric/nonparametric test are decided. In the literature, there are various methods of testing normality. Most literature sources indicate that for a small sample size (n < 50), the Shapiro–Wilk test should be used, as it has greater power to detect non-normality and is the most popular and widely used method.
When our sample size (n) is at least 50, any other methods (Kolmogorov–Smirnov test, skewness, kurtosis, value from skewness and kurtosis, histogram, box plot, P-P plot, Q-Q plot, and SD with respect to the mean) can be used to test the normality of continuous data.
In addition, the two-sample Kolmogorov–Smirnov test was used in the manuscript. This test is used to check whether two basic one-dimensional probability distributions differ. Again, the larger the sample sizes, the more sensitive the minimum limit. It should be noted that the two-sample test evaluates whether the two data samples are from the same distribution. It does not determine what the common distribution is (e.g., whether it is normal or not). The disadvantage of the one-dimensional Kolmogorov–Smirnov test is that it is not very strong, as it was designed to be sensitive to all possible types of differences between the two distribution functions [62].
It is known from statistical theory that there is direct dependence, very strong, strong, medium, weak, very weak, and no correlation. The visualization of these relationships indicates that the strongest correlations are with D100 Before Tests, HVOB5, and HVOB20 (the closest in form to linear dependence), and the least smoke and PN parameters are correlated with HVO100, HVOB10, and D100 After Tests fuels. To identify the strength of the correlation relations, a comparison of the Pearson correlation coefficients by absolute value is applied using different fuel mixtures (Figure 7).
When comparing according to Pearson correlation coefficients, a strong correlation dependence was identified. Very close correlation values were observed between D100 Before Tests, HVOB5, and HVOB20, while HVO100 fuel showed a somewhat smaller, but still strong, correlation dependence. Moderate correlation dependence was observed with HVOB10 fuel and weak correlation dependence with D100 after testing. Based on this, the following generalisations can be made:
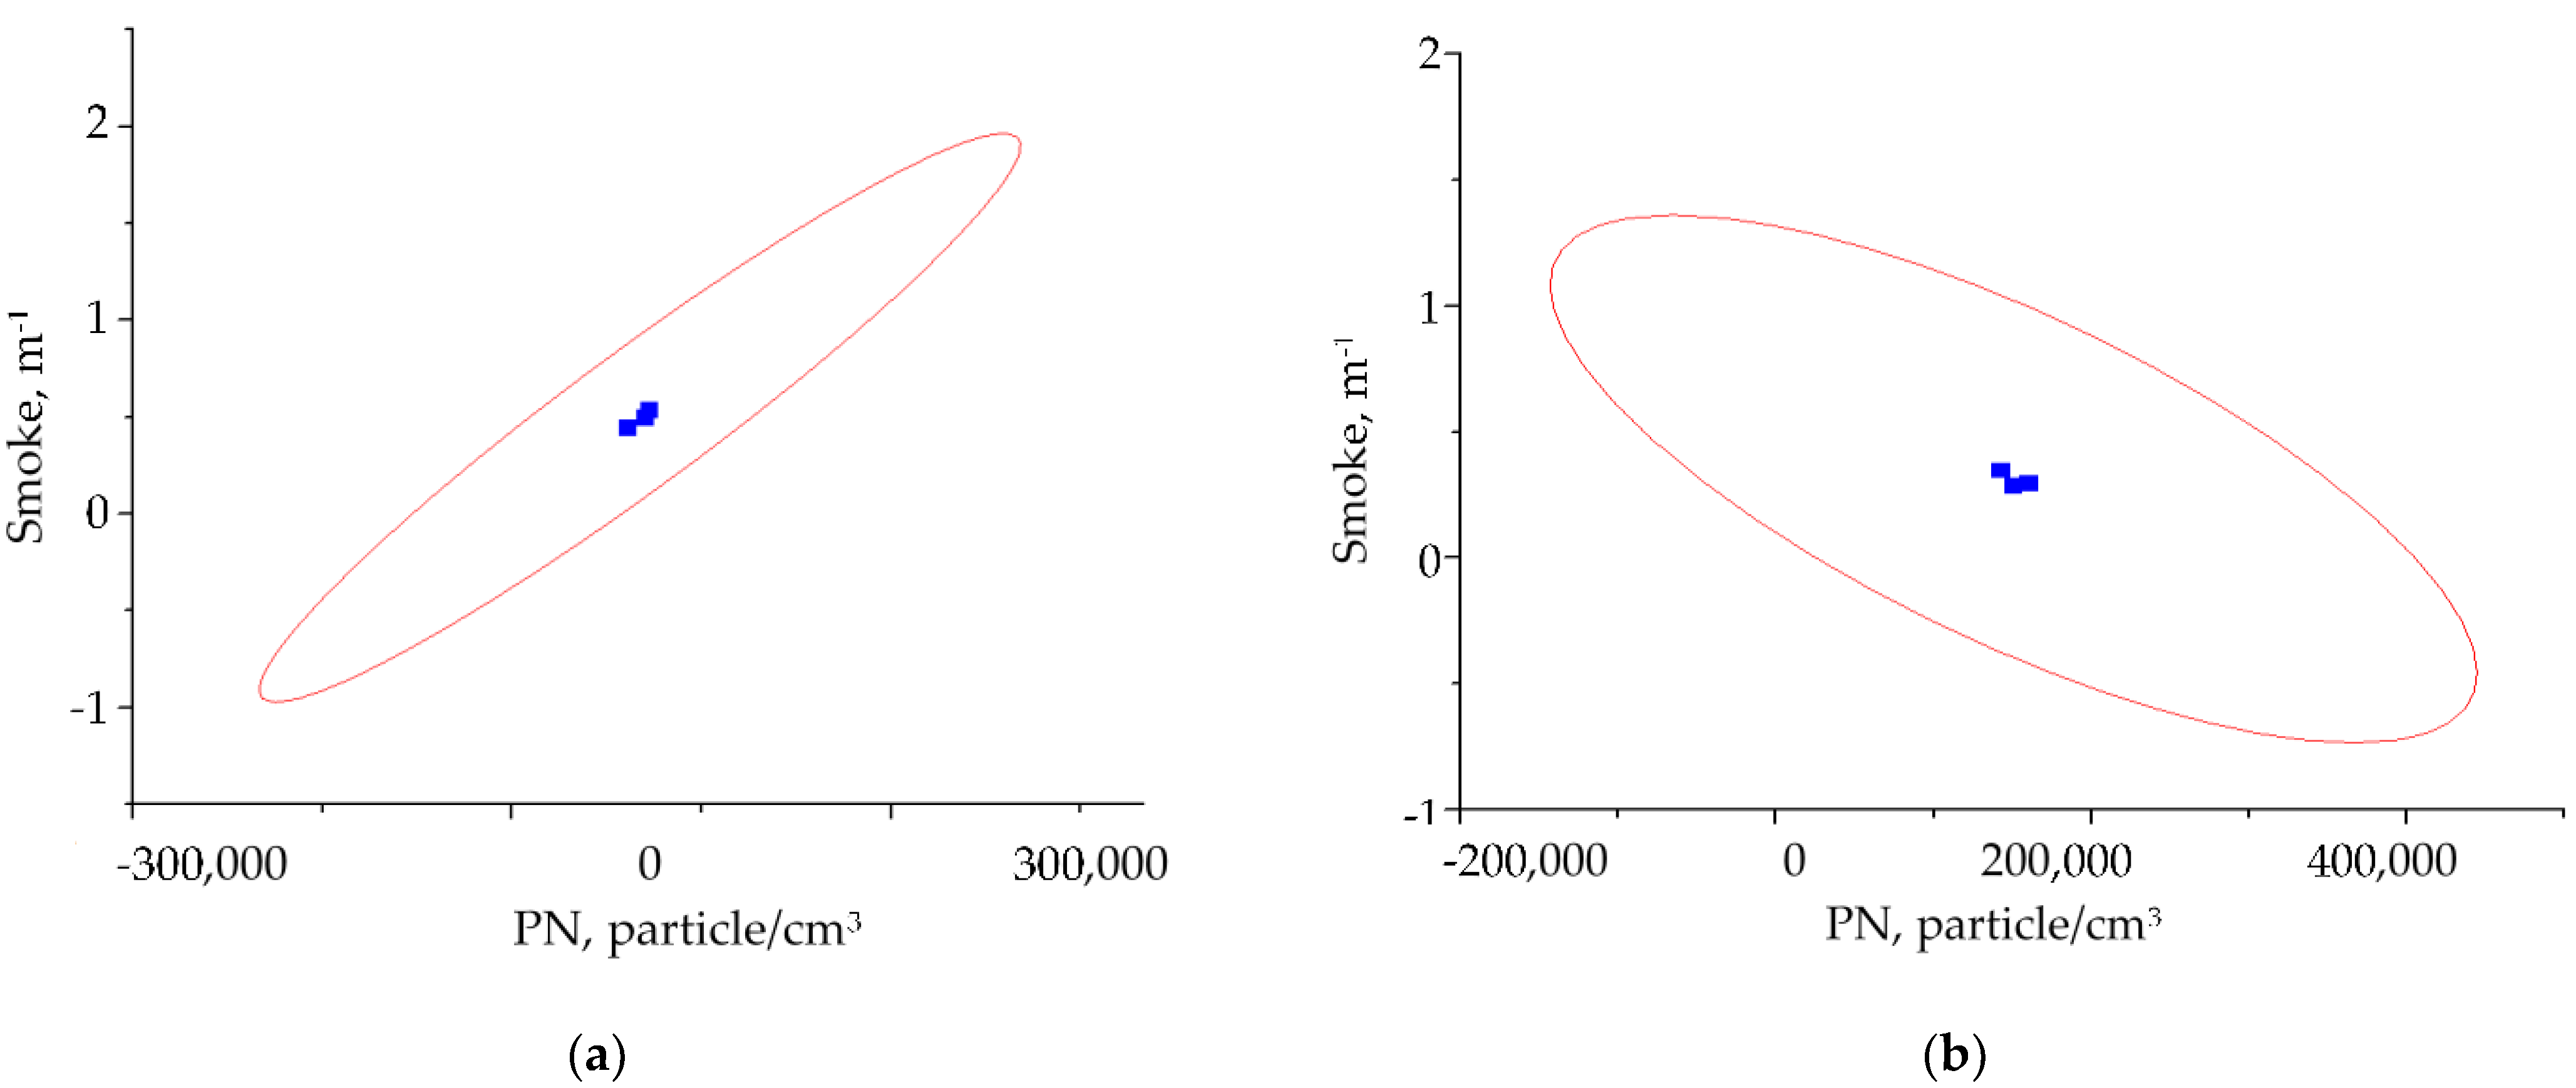
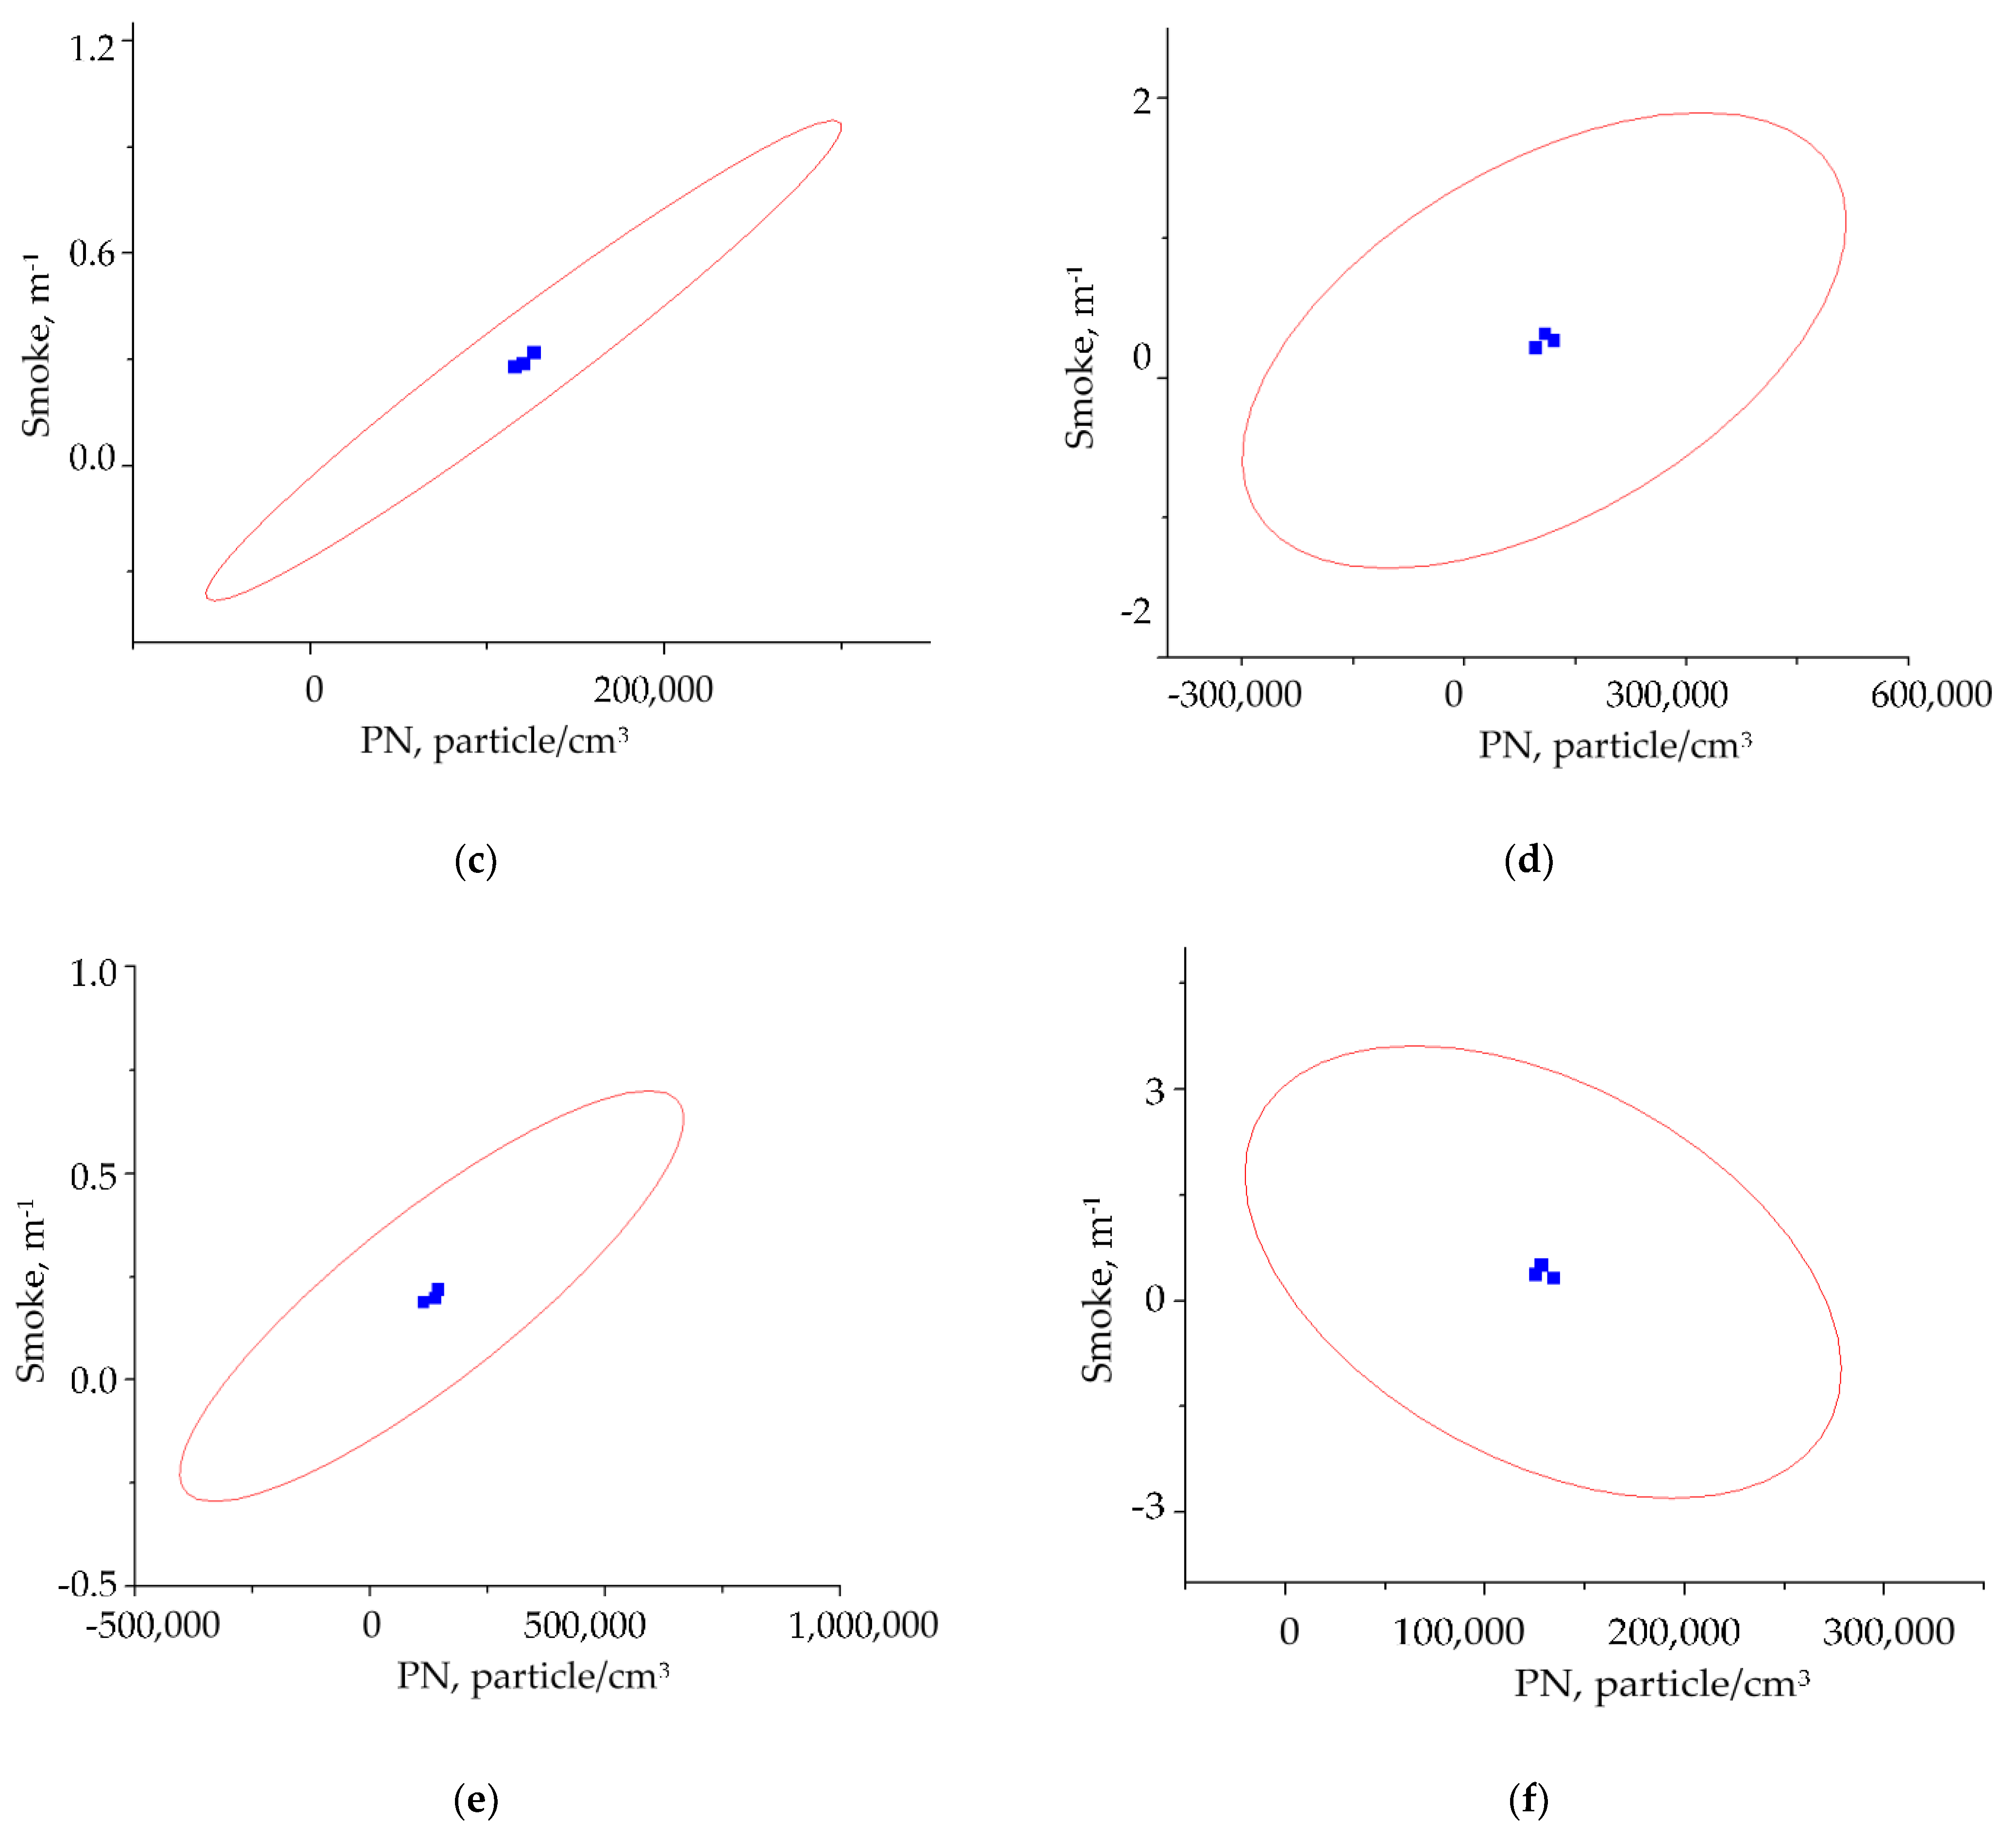
  • Increasing biobutanol concentration does not affect the strength of the correlation between smokiness and PN indicators;
  • After the use of biofuels, when resupplying diesel to the engine, the correlation dependence between smokiness and PN decreased by 45% when evaluating the values of the Pearson correlation coefficient and changed from a very strong dependence to a weak dependence of the smokiness and PN indicators, according to the Pearson correlation coefficient.
Currently designed car engines with compression ignition are modern units equipped with state-of-the-art power and control systems. Despite the use of state-of-the-art technological, design, and electronic control, the challenge for the designers of modern compression ignition engines is to meet stringent exhaust toxicity requirements, e.g., emissions of nitrogen oxides, NOx, PM. This limits the further development of automotive compression ignition engines and their maximum performance, especially those with low displacement.
An important problem for engines is the emission of particulate matter (PM), which, due to its hygroscopicity and low density relative to air, is a serious environmental hazard. For this reason, PM emissions have been the most severely reduced in recent years, compared to other toxic components of exhaust gases. It is not only the mass emission of PM, but also the total particle number (N), that have been reduced. The main component of particulate matter and its carrier is soot, formed by the thermal cracking of higher diesel hydrocarbons oxidized in rich flame zones, mainly in oxygen-deficient conditions.
One way to reduce PM emissions may be by adding oxygen compounds to diesel, using a light fuel, e.g., diesel/biobutanol blends.

Author Contributions

Conceptualization, G.V., J.M., O.O., A.R., A.Ś. and K.T.; methodology, G.V., J.M., O.O., A.R. and K.T.; software, G.V., J.M., O.O., A.R. and A.Ś.; validation, G.V., J.M., A.R. and K.T.; formal analysis, G.V., J.M., O.O., A.R. and K.T.; investigation, G.V., J.M., O.O., A.R. and A.Ś.; data curation, G.V., J.M., O.O., A.R., A.Ś. and K.T.; writing—original draft preparation, G.V., J.M.; O.O., A.R., A.Ś. and K.T.; writing—review and editing, G.V., J.M., O.O., A.R., A.Ś. and K.T.; visualization, G.V., J.M., O.O., A.R. and K.T.; supervision, G.V., J.M., O.O., A.R. and K.T. All authors have read and agreed to the published version of the manuscript.

Funding

The research leading to these results has received funding from the commissioned task entitled “VIA CARPATIA Universities of Technology Network named after the President of the Republic of Poland Lech Kaczyński”, contract no. MEiN/2022/DPI/2577, action entitled “In the neighborhood—inter-university research internships and study visits”.

Data Availability Statement

The study did not report any data.

Conflicts of Interest

The authors declare no conflict of interest.

References

  1. Zhao, X.; Ke, Y.; Zuo, J.; Xiong, W.; Wu, P. Evaluation of sustainable transport research in 2000–2019. J. Clean. Prod. 2020, 256, 120404. [Google Scholar] [CrossRef]
  2. Govender, P.; Sivakumar, V. Application of k-means and hierarchical clustering techniques for analysis of air pollution: A review (1980–2019). Atmos. Pollut. Res. 2020, 11, 40–56. [Google Scholar] [CrossRef]
  3. Puricelli, S.; Cardellini, G.; Casadei, S.; Faedo, D.; Van den Oever, A.E.M.; Grosso, M. A review on biofuels for light-duty vehicles in Europe. Renew. Sustain. Energy Rev. 2020, 137, 110398. [Google Scholar] [CrossRef]
  4. SNAP Nomenclature. Available online: https://en.eustat.eus/documentos/elem_13173/definicion.html (accessed on 2 April 2023).
  5. Kiba-Janiak, M. EU cities’ potentials for formulation and implementation of sustainable urban freight transport strategic plans. Transp. Res. Procedia 2019, 39, 150–159. [Google Scholar] [CrossRef]
  6. André, M.; Joumard, R.; Vidon, R.; Tassel, P.; Perret, P. Real-world European driving cycles, for measuring pollutant emissions from high- and low-powered cars. Atmos. Environ. 2006, 40, 5944–5953. [Google Scholar] [CrossRef]
  7. Tilt, B. China’s air pollution crisis: Science and policy perspectives. Environ. Sci. Policy 2019, 92, 275–280. [Google Scholar] [CrossRef]
  8. Sarkan, B.; Skrucany, T.; Semanova, S.; Madlenak, R.; Kuranc, A.; Sejkorova, M.; Caban, J. Vehicle coast-down method as a tool for calculating total resistance for the purposes of type-approval fuel consumption. Sci. J. Sil. Univ. Technol. Ser. Transp. 2018, 98, 161–172. [Google Scholar]
  9. Hasan, M.; Abedin, M.Z.; Amin, M.B.; Nekmahmud, M.; Oláh, J. Sustainable biofuel economy: A mapping through bibliometric research. J. Environ. Manag. 2023, 336, 117644. [Google Scholar] [CrossRef]
  10. Bracco, S. Effectiveness of EU biofuels sustainability criteria in the context of land acquisitions in Africa. Renew. Sustain. Energy Rev. 2015, 50, 130–143. [Google Scholar] [CrossRef]
  11. Robaina, M.; Neves, A. Complete decomposition analysis of CO2 emissions intensity in the transport sector in Europe. Res. Transp. Econ. 2021, 90, 101074. [Google Scholar] [CrossRef]
  12. Kumar, V.; Saluja, R.K. The effect of operating parameters on performance and emissions of DI diesel engine fuelled with Jatropha biodiesel. Fuel 2020, 278, 118256. [Google Scholar] [CrossRef]
  13. Singh, D.; Sharma, D.; Soni, S.L.; Inda, C.S.; Sharma, S.; Sharma, P.K.; Jhalani, A. A comprehensive review of physicochemical properties, production process, performance and emissions characteristics of 2nd generation biodiesel feedstock: Jatropha curcas. Fuel 2021, 285, 119110. [Google Scholar] [CrossRef]
  14. Cheikh, K.; Sary, A.; Khaled, L.; Abdelkrim, L.; Mohand, T. Experimental Assessment of Performance and Emissions Maps for Biodiesel Fueled Compression Ignition Engine. Appl. Energy 2016, 161, 320–329. [Google Scholar] [CrossRef]
  15. Atabani, A.E.; Silitonga, A.S.; Ong, H.C.; Mahlia, T.M.I.; Masjuki, H.H.; Badruddin, I.A.; Fayaz, H. Non-edible vegetable oils: A critical evaluation of oil extraction, fatty acid compositions, biodiesel production, characteristics, engine performance and emissions production. Renew. Sustain. Energy Rev. 2013, 18, 211–245. [Google Scholar] [CrossRef]
  16. Milojevic, S.; Savić, S.; Marić, D.; Stopka, O.; Krstić, B.; Stoja, B. Correlation between Emission and Combustion Characteristics with the Compression Ratio and Fuel Injection Timing in Tribologically Optimized Diesel Engine. Teh. Vjesn. 2022, 29, 1210–1219. [Google Scholar]
  17. Uneven Tyre Tread Wear—Causes and Effects. Available online: https://intercars.pl/blog/kola/nietypowe-zuzycie-bieznika-przyczyny-i-skutki/ (accessed on 2 April 2023).
  18. Adamczyk, J.; Dzikuć, M. The analysis of suppositions included in the Polish Energetic Policy using the LCA technique—Poland case study. Renew. Sustain. Energy Rev. 2014, 39, 42–50. [Google Scholar] [CrossRef]
  19. Brodny, J.; Tutak, M. Analysis of the diversity in emissions of selected gaseous and particulate pollutants in the European Union countries. J. Environ. Manag. 2019, 231, 582–595. [Google Scholar] [CrossRef]
  20. Tucki, K.; Orynycz, O.; Wasiak, A.; Świć, A.; Dybaś, W. Capacity Market Implementation in Poland: Analysis of a Survey on Consequences for the Electricity Market and for Energy Management. Energies 2019, 12, 839. [Google Scholar] [CrossRef]
  21. Łagowski, P. The Effect of Biofuel on the Emission of Exhaust Gas from an Engine with the Common Rail System. Arch. Automot. Eng. Arch. Motoryz. 2020, 90, 33–44. [Google Scholar] [CrossRef]
  22. Šarkan, B.; Stopka, O. Quantification of road vehicle performance parameters under laboratory conditions. Adv. Sci. Technol. Res. J. 2018, 12, 16–23. [Google Scholar] [CrossRef]
  23. European Climate Law. Available online: https://ec.europa.eu/clima/eu-action/european-green-deal/european-climate-law_en (accessed on 2 April 2023).
  24. Stattman, S.L.; Gupta, A.; Partzsch, L.; Oosterveer, P. Toward Sustainable Biofuels in the European Union? Lessons from a Decade of Hybrid Biofuel Governance. Sustainability 2018, 10, 4111. [Google Scholar] [CrossRef]
  25. Fact Sheets on the European Union. Energy Policy: General Principles. Available online: https://www.europarl.europa.eu/factsheets/en/sheet/68/energy-policy-general-principles (accessed on 2 April 2023).
  26. Gao, J.; Chen, H.; Li, Y.; Chen, J.; Zhang, Y.; Dave, K.; Huang, Y. Fuel consumption and exhaust emissions of diesel vehicles in worldwide harmonized light vehicles test cycles and their sensitivities to eco-driving factors. Energy Convers. Manag. 2019, 196, 605–613. [Google Scholar] [CrossRef]
  27. Slavin, V.; Shuba, Y.; Caban, J.; Matijosius, J.; Rimkus, A.; Korpach, A.; Gutarevych, S. The Performance of a Car with Various Engine Power Systems—Part I. LOGI—Sci. J. Transp. Logist. 2022, 13, 130–140. [Google Scholar] [CrossRef]
  28. Slavin, V.; Shuba, Y.; Caban, J.; Matijosius, J.; Rimkus, A.; Korpach, A.; Gutarevych, S. The Performance of a Car with Various Engine Power Systems—Part II. LOGI—Sci. J. Transp. Logist. 2022, 13, 141–151. [Google Scholar] [CrossRef]
  29. Skrúcaný, T.; Stopková, M.; Stopka, O.; Kalašová, A.; Ovčiarik, P. User’s determination of a proper method for quantifying fuel consumption of a passenger car with compression ignition engine in specific operation conditions. Open Eng. 2021, 11, 151–160. [Google Scholar] [CrossRef]
  30. Simsek, S.; Uslu, S. Determination of a diesel engine operating parameters powered with canola, safflower and waste vegetable oil based biodiesel combination using response surface methodology (RSM). Fuel 2020, 270, 117496. [Google Scholar] [CrossRef]
  31. Ponte, S.; Daugbjerg, C. Biofuel sustainability and the formation of transnational hybrid governance. Environ. Politics 2015, 24, 96–114. [Google Scholar]
  32. Wasiak, A. Modeling Energetic Efficiency of Biofuels Production. Green Energy and Technology, 1st ed.; Springer Nature Switzerland: Cham, Switzerland, 2018; pp. 29–47. ISBN 978-3-319-98430-8. [Google Scholar] [CrossRef]
  33. Saxena, M.R.; Maurya, R.K.; Mishra, P. Assessment of performance, combustion and emissions characteristics of methanol-diesel dual-fuel compression ignition engine: A review. J. Traffic Transp. Eng. 2021, 8, 638–680. [Google Scholar] [CrossRef]
  34. Upendra, R.; Nageswara, R.; Ağbulut, U.; Suat, S.; Asif, A.; Tikendra, N. Modifying diesel fuel with nanoparticles of zinc oxide to investigate its influences on engine behaviors. Fuel 2023, 345, 128196. [Google Scholar] [CrossRef]
  35. Subrata, B.; Abhishek, P.; Rajsekhar, P.; Subrata, K.G. Performance, combustion and emission characteristics of a diesel engine fueled with diesel-kerosene-ethanol: A multi-objective optimization study. Energy 2020, 211, 118305. [Google Scholar] [CrossRef]
  36. Tsai, T.Y.; Lo, Y.C.; Dong, C.D.; Nagarajan, D.; Chang, J.S.; Lee, D.J. Biobutanol production from lignocellulosic biomass using immobilized Clostridium acetobutylicum. Appl. Energy 2020, 277, 115531. [Google Scholar] [CrossRef]
  37. Bharathiraja, B.; Jayamuthunagai, J.; Sudharsanaa, T.; Bharghavi, A.; Praveenkumar, R.; Chakravarthy, M.; Yuvaraj, D. Biobutanol—An impending biofuel for future: A review on upstream and downstream processing tecniques. Renew. Sustain. Energy Rev. 2017, 68, 788–807. [Google Scholar] [CrossRef]
  38. Goga, G.; Chauhan, B.S.; Mahla, S.K.; Cho, H.M. Performance and emission characteristics of diesel engine fueled with rice bran biodiesel and n-butanol. Energy Rep. 2019, 5, 78–83. [Google Scholar] [CrossRef]
  39. Singer, A.; Schröder, O.; Pabst, C.; Munack, A.; Bünger, J.; Ruck, W.; Krahl, J. Aging studies of biodiesel and HVO and their testing as neat fuel and blends for exhaust emissions in heavy-duty engines and passenger cars. Fuel 2015, 153, 595–603. [Google Scholar] [CrossRef]
  40. Bortel, I.; Vávra, J.; Takáts, M. Effect of HVO fuel mixtures on emissions and performance of a passenger car size diesel engine. Renew. Energy 2019, 140, 680–691. [Google Scholar] [CrossRef]
  41. Tucki, K.; Mruk, R.; Orynycz, O.; Gola, A. The Effects of Pressure and Temperature on the Process of Auto-Ignition and Combustion of Rape Oil and Its Mixtures. Sustainability 2019, 11, 3451. [Google Scholar] [CrossRef]
  42. Tucki, K.; Orynycz, O.; Wasiak, A.; Świć, A.; Mieszkalski, L.; Mruk, R.; Gola, A.; Słoma, J.; Botwińska, K.; Gawron, J. A Computer Tool Using OpenModelica for Modelling CO2 Emissions in Driving Tests. Energies 2022, 15, 995. [Google Scholar] [CrossRef]
  43. Tucki, K. A Computer Tool for Modelling CO2 Emissions in Driving Cycles for Spark Ignition Engines Powered by Biofuels. Energies 2021, 14, 1400. [Google Scholar] [CrossRef]
  44. Tucki, K. A Computer Tool for Modelling CO2 Emissions in Driving Tests for Vehicles with Diesel Engines. Energies 2021, 14, 266. [Google Scholar] [CrossRef]
  45. Shepel, O.; Matijošius, J.; Rimkus, A.; Orynycz, O.; Tucki, K.; Świć, A. Combustion, Ecological, and Energetic Indicators for Mixtures of Hydrotreated Vegetable Oil (HVO) with Duck Fat Applied as Fuel in a Compression Ignition Engine. Energies 2022, 15, 7892. [Google Scholar] [CrossRef]
  46. Abed, K.A.; El Morsi, A.K.; Sayed, M.M.; El Shaib, A.A.; Gad, M.S. Effect of waste cooking-oil biodiesel on performance and exhaust emissions of a diesel engine. Egypt. J. Pet. 2018, 27, 985–989. [Google Scholar] [CrossRef]
  47. Kanthasamy, P.; Selvan, V.A.M.; Shanmugam, P. Investigation on the performance, emissions and combustion characteristics of CRDI engine fuelled with tallow methyl ester biodiesel blends with exhaust gas recirculation. J. Therm. Anal. Calorim. 2020, 141, 2325–2333. [Google Scholar] [CrossRef]
  48. Emiroglu, A.O.; Keskin, A.; Sen, M. Experimental investigation of the effects of turkey rendering fat biodiesel on combustion, performance and exhaust emissions of a diesel engine. Fuel 2018, 216, 266–273. [Google Scholar] [CrossRef]
  49. Specifications for Skoda Octavia 1.9 TDI Generation 1Z. Available online: https://www.car.info/en-se/skoda/octavia/1z-19-tdi-dct6-24107173/specs (accessed on 2 April 2023).
  50. Emission, Function and Performance Dynamometers. Available online: https://www.maha.ru/upload/iblock/a8e/a8e11397fb2b2f09876572eb316514b5.pdf (accessed on 2 April 2023).
  51. United Nations Global Technical Regulation No. 15—UNECE. Available online: https://unece.org/sites/default/files/2021-01/ECE-TRANS-180a15am6e.pdf (accessed on 22 April 2023).
  52. Regulation No 83 of the Economic Commission for Europe of the United Nations (UN/ECE)—Uniform Provisions Concerning the Approval of Vehicles with Regard to the Emission of Pollutants According to Engine Fuel Requirements. Available online: https://op.europa.eu/en/publication-detail/-/publication/2f8f0ce5-66fb-4a38-ae68-558ae1b04a5f/language-en (accessed on 22 April 2023).
  53. Commission Regulation (EC) No 692/2008 of 18 July 2008 Implementing and Amending Regulation (EC) No 715/2007 of the European Parliament and of the Council on Type-Approval of Motor Vehicles with Respect to Emissions from Light Passenger and Commercial Vehicles (Euro 5 and Euro 6) and on Access to Vehicle Repair and Maintenance Information (Text with EEA relevance). Available online: https://eur-lex.europa.eu/legal-content/EN/TXT/?uri=CELEX:32008R0692 (accessed on 22 April 2023).
  54. OBDI/OBDII Diagnostic Interfaces. Available online: https://smartmoto.pl/pol_m_Diagnostyka_Interfejsy-diagnostyczne_Interfejsy-OBDI-OBDII-1561535.html (accessed on 2 April 2023).
  55. ECU Explained. Available online: https://www.ecutesting.com/categories/ecu-explained/ (accessed on 2 April 2023).
  56. ROSS-TECH VCDS. Available online: https://www.ross-tech.com/vcds/tour/logging.php (accessed on 2 April 2023).
  57. Wang, T.; Lin, B. Fuel consumption in road transport: A comparative study of China and OECD countries. J. Clean. Prod. 2019, 206, 156–170. [Google Scholar] [CrossRef]
  58. Ballesteros, M.; Manzanares, P. Chapter Three—Liquid Biofuels. In The Role of Bioenergy in the Bioeconomy, 1st ed.; Lago, C., Caldés, N., Lechón, Y., Eds.; Academic Press: Waltham, MA, USA, 2019; pp. 113–144. [Google Scholar]
  59. Kordylewski, W. Combustion and Fuels, 5th ed.; Oficyna Wydawnicza Politechniki Wrocławskiej: Wrocław, Polska, 2008; pp. 10–470. ISBN 978-83-7493-378-0. [Google Scholar]
  60. Baczewski, K.; Kałdoński, T. Fuels for Compression-Ignition Engines, 2nd ed.; Wydawnictwa Komunikacji i Łączności: Warszawa, Polska, 2017; pp. 50–210. [Google Scholar]
  61. STATISTICA Electronic Manual. Available online: https://www.scribd.com/document/321061529/STATISTICA-Electronic-Manual# (accessed on 22 April 2023).
  62. Two-Sample Kolmogorov-Smirnov Test. Available online: https://real-statistics.com/non-parametric-tests/goodness-of-fit-tests/two-sample-kolmogorov-smirnov-test/ (accessed on 22 April 2023).
Figure 1. Laboratory test equipment.
Energies 16 03682 g001
Figure 2. Smoke readings using different biofuel blends.
Energies 16 03682 g002
Figure 3. Scattering of smoke readings using different biofuel blends.
Energies 16 03682 g003
Figure 4. PN readings using various biofuel blends.
Energies 16 03682 g004
Figure 5. Scattering of PN readings using different biofuel blends.
Energies 16 03682 g005
Figure 6. Correlation between smokiness and PN parameters using different fuels: (a) D100 Before Tests; (b) HVO100; (c) HVOB5; (d) HVOB10; (e) HVOB20; (f) D100 After Tests.
Energies 16 03682 g006aEnergies 16 03682 g006b
Figure 7. Comparison of Pearson correlation coefficients using different fuels.
Energies 16 03682 g007
Table 1. The main parameters of the test engine (1.9 TDI type: 1Z) [46].
ParameterValue
Engine type—number of cylindersInline 4
Engine codeALH
Fuel typeDiesel
Engine alignment Transverse
Engine displacement 1896 cm3
Bore × stroke 79.5 × 95.5 mm
Number of valves 8 valves
Aspiration Turbo
Maximum power66 kW (4000 rpm)
Maximum torque210 Nm (1900 rpm)
Drive wheels FWD
Piston diameter, mm79.5 mm
Piston stroke, mm95.5 mm
Compression ratio19.5
Displacement1896 cm3
Number of cylinders4/OHC
Fuel injectionDirect (single)
Nozzle typeHole-type
Nozzle opening pressure190 bar
Nozzle and holder assemblyTwo-spring
Cooling system typeLiquid cooling
Transmission gearbox—number of Speeds 5-speed manual
Table 2. The main parameters of vehicle load bench (MAHA LPS 2000) [47].
ParameterValue
Load equipmentElectromagnetic brake
Rate adjustment limits260
Maximum measuring load6 kN (attractive force)
Maximum break power, kW260
Measurement error±2
Table 3. PM concentration counter P-Trak parameters.
ParameterValue
Concentration range0–500,000 pcs/cm3
Aerodynamic PM diameter range0.02–1 μm
Temperature range−40–70 °C
Intake air flowapproximately 100 cm3/min
Device memory470 points
Type of alcohol used100% isopropanol
Table 4. Properties of 100% pure diesel, hydrotreated vegetable oil, biobutanol, and castor oil [54,55,56,57,58,59,60].
ParameterDieselHydrotreated Vegetable OilBiobutanolCastor Oil
Density at 15 °C, kg/m3835.2779.1810.0964.4
Element composition:
(% mass): Carbon
86.5084.8065.0073.80
Hydrogen13.4015.3013.5511.50
Oxygen0.00.021.5014.85
Stoichiometric AFR14.7915.1811.3011.91
Cetane number51701828
Lower heating value, MJ/kg43.0944.933.343.1
Lower heating value, MJ/l36.9034.1026.7139.81
Purity,%N/AN/A99.5100
Manufacturer, countryOrlean Lietuva,
Lithuania
Neste,
Finland
Carl Roth GmbH,
Germany
Biochemlit,
Lithuania
Table 5. Properties of fuel mixtures.
PropertiesHVOB5HVOB10HVOB20
Density at 15° C, kg/m3780.5782.4786.4
Element composition: (% mass): carbon83.4582.5580.58
Hydrogen15.3215.2515.03
Oxygen1.112.214.41
Stoichiometric AFR14.9914.7714.38
Cetane number67.364.759.3
Lower heating value, MJ/kg43.5542.9841.88
Lower heating value, MJ/L33.9833.6432.93
Table 6. Comparison results of standard deviation, Shapiro–Wilk normality test, and Kolmogorov–Smirnov normality test using different fuels.
Fuel BlendsD100 before TestsD100 after TestsHVO100HVO5HVO10HVO20
ParameterStandard Deviation
Smoke, m−10.045090.098490.032150.020820.050.01528
PN, particle/cm313,658.544334582.575699018.499515507.5705510,940.4448415,378.5565
Shapiro–Wilk Normality Test
Smoke, m−10.99590.930410.870970.9230810.96429
PN, particle/cm30.977110.964290.99590.997250.957830.90727
Kolmogorov–Smirnov Normality Test
Smoke, m−10.196130.286330.327520.292280.174680.25304
PN, particle/cm30.218630.253040.196130.19080.205150.20261
Disclaimer/Publisher’s Note: The statements, opinions and data contained in all publications are solely those of the individual author(s) and contributor(s) and not of MDPI and/or the editor(s). MDPI and/or the editor(s) disclaim responsibility for any injury to people or property resulting from any ideas, methods, instructions or products referred to in the content.

