Article

Investigation of Optimal Temperature for Thermal Catalytic Conversion of Marine Biomass for Recovery of Higher-Added-Value Energy Products

by
Justas Eimontas
*,
Adolfas Jančauskas
,
Kęstutis Zakarauskas
,
Nerijus Striūgas
and
Lina Vorotinskienė
Laboratory of Combustion Processes, Lithuanian Energy Institute, LT-44403 Kaunas, Lithuania
*
Author to whom correspondence should be addressed.
Energies 2023, 16(8), 3457; https://doi.org/10.3390/en16083457
Submission received: 22 March 2023 / Revised: 11 April 2023 / Accepted: 12 April 2023 / Published: 14 April 2023
(This article belongs to the Special Issue Biomass and Biofuel for Renewable Energy)

Abstract

:
The eutrophication process, caused by the uncollected seaweed and macroalgae, is a relevant and ongoing ecological issue. In case this biomass is collected from the seashores, it could be used as a potential feedstock for recovery of higher-added-value energy products. This paper aims to investigate the seaweed perspective of uses as a potential feedstock in the slow-pyrolysis process, using microthermal analysis combined with Fourier transform infrared spectrometry and experiments at the laboratory scale at different temperatures with two different types of zeolite catalysts. The primary investigation was performed using a micro-thermal analyser, and the results revealed that seaweed thermally decomposes in two stages, at 250 and 700 °C, while the catalyst slightly decreased the activation energy required for the process, lowering the temperatures of decomposition. Experiments on a laboratory scale showed that the most common compounds in the gaseous phase are CnHm, H2, CO, and CO2. Nevertheless, the most abundant liquid fraction derivatives are substituted phenolic compounds, pyridine, benzoic acid, naphthalene, d-glucopyranose, and d-allose. Furthermore, the catalyst decreased the amount of higher molecular mass compounds, converting them to toluene (71%), which makes this technology more attractive from the recovery of higher-added-value products point of view.

Graphical Abstract

1. Introduction

Most of the world’s energy production is made from finite fossil fuel resources. Renewable energy sources meet only just 10.9% of the global primary energy consumption [1]. In order to reduce global warming and fulfil the European Union’s commitment to reduce greenhouse gas (GHG) emissions by 40% by 2030, the uses of fossil fuel must be drastically reduced [2]. For this reason, biomass for energy production is receiving increased attention, primarily because it is considered a carbon-neutral and sustainable fuel [3,4,5]. At the same time, the Baltic Sea is known to be the most polluted and affected sea by eutrophication [6,7,8] caused by intensive agricultural production and excess fertilisation with a discharge of inorganic plant nutrients such as ammonia, nitrogen, and phosphorous [9]. This process accelerates the growth of micro- and macroalgae [10]. For example, in the 20-year period since 1997, wet biomass in the Baltic sea, including Furcellaria lumbricalis macroalgae, increased from approximately 80 to 180 thousand tons [9] and the growth area expanded by 70%. This uncontrollable growth of biomass blocks the sunlight and causes anoxia which makes certain zones unhabitable for marine fauna [10,11]. Some recent studies suggest that the development of seaweed may be a silver bullet for absorption and storage of the global carbon footprint [12]. Unfortunately, the newest findings [13] show that the seaweed’s ability to capture CO2 is overestimated, and this solution is still under discussion. Commercial seaweed cultivation for the recycling of nutrients is also considered, but this process is still under development and far from an industrial scale [9]. Consequently, energy production from renewable marine resources should be considered more.
One of the most promising marine biomass thermal conversion technologies is catalytic pyrolysis because it is a cost-effective and eco-friendly approach [3,14]. Several experimental studies have used seaweed as a feedstock for pyrolysis and the production of a different state of products [4,5,14,15,16,17,18]. Cao B. et al. and Yuan C. et al. conducted complex research of three-phase products, i.e., bio-oil, bio-char, and non-condensable gas yields and composition under the effect of catalyst pyrolysis [4,15]. Cao B. et al. investigated the catalytic effect of co-pyrolysis of the seaweed polysaccharides and cellulose in a fixed bed reactor [4]. The author extracted polysaccharides from E. clathrate and S. fusiforme seaweeds and created a 10:1 ratio mixture with a ZSM-5 catalyst. Pyrolytic products were studied with Fourier transform infrared spectroscopy (FTIR) and gas chromatography/mass spectrometry (GC/MS). Results of bio-oil, bio-char, and non-condensable gas yields showed that in the presence of ZSM-5 catalyst, bio-oil yield was increased from 6.96% to 27.52% depending on the feedstock composition. The highest yield improvement was reached by using polysaccharide of Enteromorpha clathrate seaweed. This was achieved by reducing bio-char and non-condensable gas yields. The author also concluded that the ZSM-5 catalyst increases the content of furans, ketones, aldehydes, and phenols but decreases undesirable acids, N-containing compounds, sugars, and hydrocarbons in the seaweed bio-oil. Processed seaweed polysaccharide catalytic pyrolysis was also investigated by the other authors. Yuan C. et al. investigated the effect of catalyst and the seaweed feedstock ratios on pyrolysis process by changing the catalyst ratio [15]. Gradual increase in Mg-Ce-ZSM-5 from 1:0 (with no catalyst) to 1:5 changed the ratio of bio-oil and gas yield from approximately 54% to 41%, and from 33% to 48%, respectively, while the char content during pyrolysis remained relatively the same. The author managed to convert dominant furan, aldehyde, and ketone compositions into 89.35% of hydrocarbons under optimum temperature and L-rhamnose monohydrate with Mg–Ce/ZSM-5 catalyst ratio conditions. Jiang D. et al. conducted a fast pyrolysis (550 °C) of microalgae (Enteromorpha clathrate) sulphated polysaccharide [14] to determine the bio-oil composition with and without ZSM-5 catalyst. A molecular sieve catalyst was mixed with feedstock at the ratio of 10:1. Authors Py–GC/MS analysis suggested seven reaction pathways on catalytic pyrolysis of sulphated polysaccharide. By applying the catalyst, the bio-oil quality was improved by enhanced de-carbonylation, dehydration, and desulfurisation reactions.
Analysis of previous experimental studies mostly focused on chemically pretreated seaweed samples by improving their characteristic into more uniform and pyrolysis-suitable compounds, e.g., polysaccharides, sulphated polysaccharides, and L-rhamnose monohydrate. However, heavy pretreatment reduces economic feasibility and results in a struggle for implementation on an industrial scale. The minority of the experimental studies extended research by conducting a comparison of different kinds of catalysts. Hu Y et al. conducted a complex research by creating different thermal treatment atmospheres by using ZSM-5 and MCM-41 for the pyrolysis process [5]. Nitrogen and hydrogen atmospheres were created in order to evaluate the effect of different gases on pyrolysis product composition. Enteromorpha clathrate algae biomass was mixed with a different catalyst at the same ratio of 10:1. GC/MS analysis revealed that the effect of the ZSM-5 catalyst was superior compared to MCM-41 in the matter of bio-oil yield production, and the value reached up to 51.48%. The same study determined that the H2 gas atmosphere also increases bio-oil yield by hydrogen radical reaction with the volatile intermediates and dehydration reactions. Unfortunately, there is a lack of other research showing different catalyst applications for catalytic pyrolysis. For example, promising results were obtained with Y-zeolite (Y-type) catalysts. Nawaz et al. studied this catalyst effect on the terrestrial biomass—Sesbania bispinosa [19]. Research indicated that Y-zeolite enhances bio-oil quality. A comparison of bio-oil GC/MS analysis of thermal and catalytic pyrolysis revealed that the Y-zeolite catalyst (1:9) could increase the hydrocarbon content by 8.2%. Moreover, Y-zeolite also reduces the content of the undesirable bio-oil products, such as acids, by 2.7%. However, this enhancement is compromised with the yield of the bio-oil, which was reduced. This study shows that the Y-type catalyst is a promising material to upgrade the liquid fraction of pyrolysis into the higher added value products. This study is dedicated to the untreated marine biomass (Furcellaria Lumbricalis) seaweed catalytic pyrolysis by using a different kind of catalyst, i.e., ZSM-5 and Y-zeolite. To the best of the authors’ knowledge, this study is the first experimental research when Furcellaria Lumbricalis seaweed is converted into three-phase valuable products using different ZSM-5 and Y-type zeolite catalysts under three different maximum temperatures (500, 700, and 900 °C). There is a lack of the scientific investigations where Y-zeolite would be used for marine biomass pyrolysis. Because of this reason, the study, including research under comparable conditions, enriches the research carried out so far. In this study, the physicochemical properties of the collected Baltic seaweed are investigated. A vertical tube reactor was used to pyrolyse marine biomass under different conditions, i.e., types of catalyst and temperature. Online gas analysis equipment was used to determine a gas composition. Further analysis was used to determine bio-char, bio-oil, and bio-gas yield, physical, and chemical properties.

2. Materials and Methods

2.1. Material Characterisation

The seaweed for this investigation was collected in Melnrage Beach, Klaipeda Municipality, followed by a washing procedure to remove abrasive particles and sand. After that, the feedstock was dried, crushed, milled, and characterised. Generally, pretreatment is used to reduce the size and to increase the contact between the surfaces and the heat flux, thus improving heat transfer and leading to the faster decomposition using different thermochemical treatments [20]. The size of the particle is <250 µm, and it was selected based on the TGA equipment manufacturer and other authors’ results [21] to obtain the most appropriate and sufficient results. It was determined that the higher the particle size was used, the higher the activation energy was required because of the heat transfer limitation [22].
The chemical analysis of the waste seaweed samples was performed using Fourier transform infrared spectrometry (FTIR). Moreover, the elemental analysis was carried out to investigate nitrogen (N), sulphur (S), carbon (C), and hydrogen (H) content in the samples using the Flash 2000 CHNS analyser. In addition, the calorific value was measured by an IKA C5000 calorimeter based on ISO 18125:2017 standard method. Finally, proximate analysis was carried out using ISO 18123:2023 for the volatile content, ISO 18122:2022 for the ash content, and EN 14774-1:2009 for the moisture content standard methods.

2.2. Thermal and Chemical Analysis at the Small Scale (TGA-FTIR-GC/MS)

The primary investigation of the feedstock was performed using Netzsch Jupiter STA 449 F3 (Germany) thermal gravimetric analyser to study the prominent decomposition peaks of the material. The maximum temperature of the sample was set to 900 °C with heating rate of 20 °C/min. The selection of the heating rate was made based on the other author’s publications. The researchers use different heating rates to identify the differences between formed product yields [23] or temperatures at maximum decomposition areas [24]. As it was determined, the increase in heating value increases the temperature at the maximum decomposition peak, while the biochar yield is also increased. Moreover, the most common investigated low-heating rates range between 5–50 °C/min, so for investigation purposes, 20 °C/min was selected. Moreover, the sample mass ranges between 20–30 mg, while the carrier gas flow was set to be 60 mL/min. To investigate the catalyst influence for the products formation, commercial molecular sieves were used with Y-type series zeolite and ZSM-5 (C38) catalyst in a ratio with a feedstock of 1:1. The ratio for the catalytical uses was selected based on the previous author’s manuscripts related with catalytical biomass utilisation [14]. It was assumed that the highest hydrocarbon formation could be achieved using a 1:1 feedstock–catalyst ratio in order to contribute to the higher value energy products recovery. The main parameters of the catalyst are provided in Table 1.
The evaluation of gaseous product composition was performed using Fourier transform infrared spectroscopy (FTIR) (Bruker Tensor 27) and gas chromatograph with quadrupole mass spectrometer detector (GC/MS) (Agilent 7890A/MS-5975C) combined with the thermogravimetric analyser. Released gasses from the TGA pass through the pipeline to the heated FTIR cell, which side is covered with the internal KBr and external ZnSe aperture and reaches the MCT (mercury cadmium telluride) detector for the investigation of functional groups in the emitted gasses. The scanning time of all wavelengths is 32 times, while the wavelength interval is from 700 to 4000 cm−1. The resolution of the detector is 4 cm−1. The TGA-GC/MS analysis was performed to investigate the main compounds at the highest decomposition peaks (based on TGA-DTG curves). The determination of the compounds was performed in accordance with NIST database. For the derivative separation, HP-5Ms column with 5%-phenyl-methylpolysiloxane filling, 0.25 mm inner diameter, and 30 m length, has been used.

2.3. Pyrolysis Experiments at the Laboratory Scale Bench

The thermal decomposition experiments of SWDs at laboratory scale was performed using a Lithuanian Energy Instituteconstructed test rig in ambient nitrogen (N2) at a flow rate of 1 L/min. The bench consists of three main segments: (1) a thermo-conversion reactor, (2) a gaseous product purification and liquid products collection part, (3) a primary gaseous product investigation device and collection system. Moreover, there are two additional depots for the tars and condensable gasses collection, while the formed char remains in the feedstock decomposition chamber. The principal scheme is depicted in Figure 1.
The experiments start with the loading procedure into the first segment, where 100 g of the sample is placed into the unheated reactor. The pyrolysis chamber deoxygenation procedure starts by the purging of N2 gasses, and it takes 10 min to create an inert ambient in the reactor [25]. After this process, main thermal conversion procedure was processed at the constant 20 °C/min heating rate up to the three maximum temperatures: 500, 700, and 900 °C. Emitted gaseous products pass through the metal sieves, which are on the bottom of the reactor, and reach the second segment: the gaseous product purification and liquid product collection system. This segment consists of 6 heated and cooled flasks filled with 75 mL of isopropanol.
Gaseous products which pass through the isopropanol are forwarded into the third segment: the gaseous product collection and analysis part. This part consists of an online gas investigation device (VISIT 03H) and “Tedlar” gas bags for the GC analysis. Throughout the experiment, the concentration of CH4, CO2, N2, O2, H2, and CO in the gaseous phase products was monitored and quantified by the VISIT 03H. Moreover, at the maximum reactors temperature, the heater was abruptly stopped, and a cooling process to reach ambient temperature had begun, leading to the extraction of the residuals.
The liquid, gaseous, and solid products obtained at different temperatures during the pyrolysis process were analysed using FTIR (for solid residual) (Bruker Tensor 27, Berlyn, Germany), GC/MS (for liquid products) (Agilent 7890A, Waldbronn, Germany) and GC/TCD (for gaseous products) (Agilent 7890A, Germany).

3. Results

3.1. Feedstock Characterisation

The feedstock characterisation was performed by the ultimate and proximate analysis, and the results are depicted in Table 2. It was assumed that the highest part of the elements belongs to carbon with the value of 46.93 wt.%, while the amount of hydrogen, nitrogen, and sulphur reaches 4.73, 4.13, and 5.13 wt.%, respectively. Based on the C, H, N, S, and ash content, the amount of oxygen was calculated based on the following Equation (1) [26].
O 2 = 100 C H N S Cl Ash ,
The highest part of the total products could be assigned to the volatile matter, with a value of 58.30 wt.%, while the amount of fixed carbon and ash reaches 32.23 and 8.87 wt.%, respectively. The chemically bonded content of the moisture in the dry basis was evaluated by the additional heating process, and its value reach 0.55 wt.%. More or less similar tendencies were also observed by the other authors, confirming our result’s reliability and reproducibility [27,28].
The analysis of the functional groups in the raw seaweed feedstock was analysed by the FTIR measurement device, and the spectra are depicted in Figure 2. It was assumed that the seaweed has a peak in the range 2900–3000 cm−1, which shows aliphatic hydrocarbons are present. Moreover, C=C stretching was observed at 1300–1500 cm−1, and overlapping C-H group bending was observed at 600–1100 cm−1.
Analysis of the raw seaweed FTIR analysis was proved by the other authors who obtained similar tendencies with a different species of this type of feedstock [29].

3.2. TGA-DTG-FTIR Analysis of the Seaweed Sample

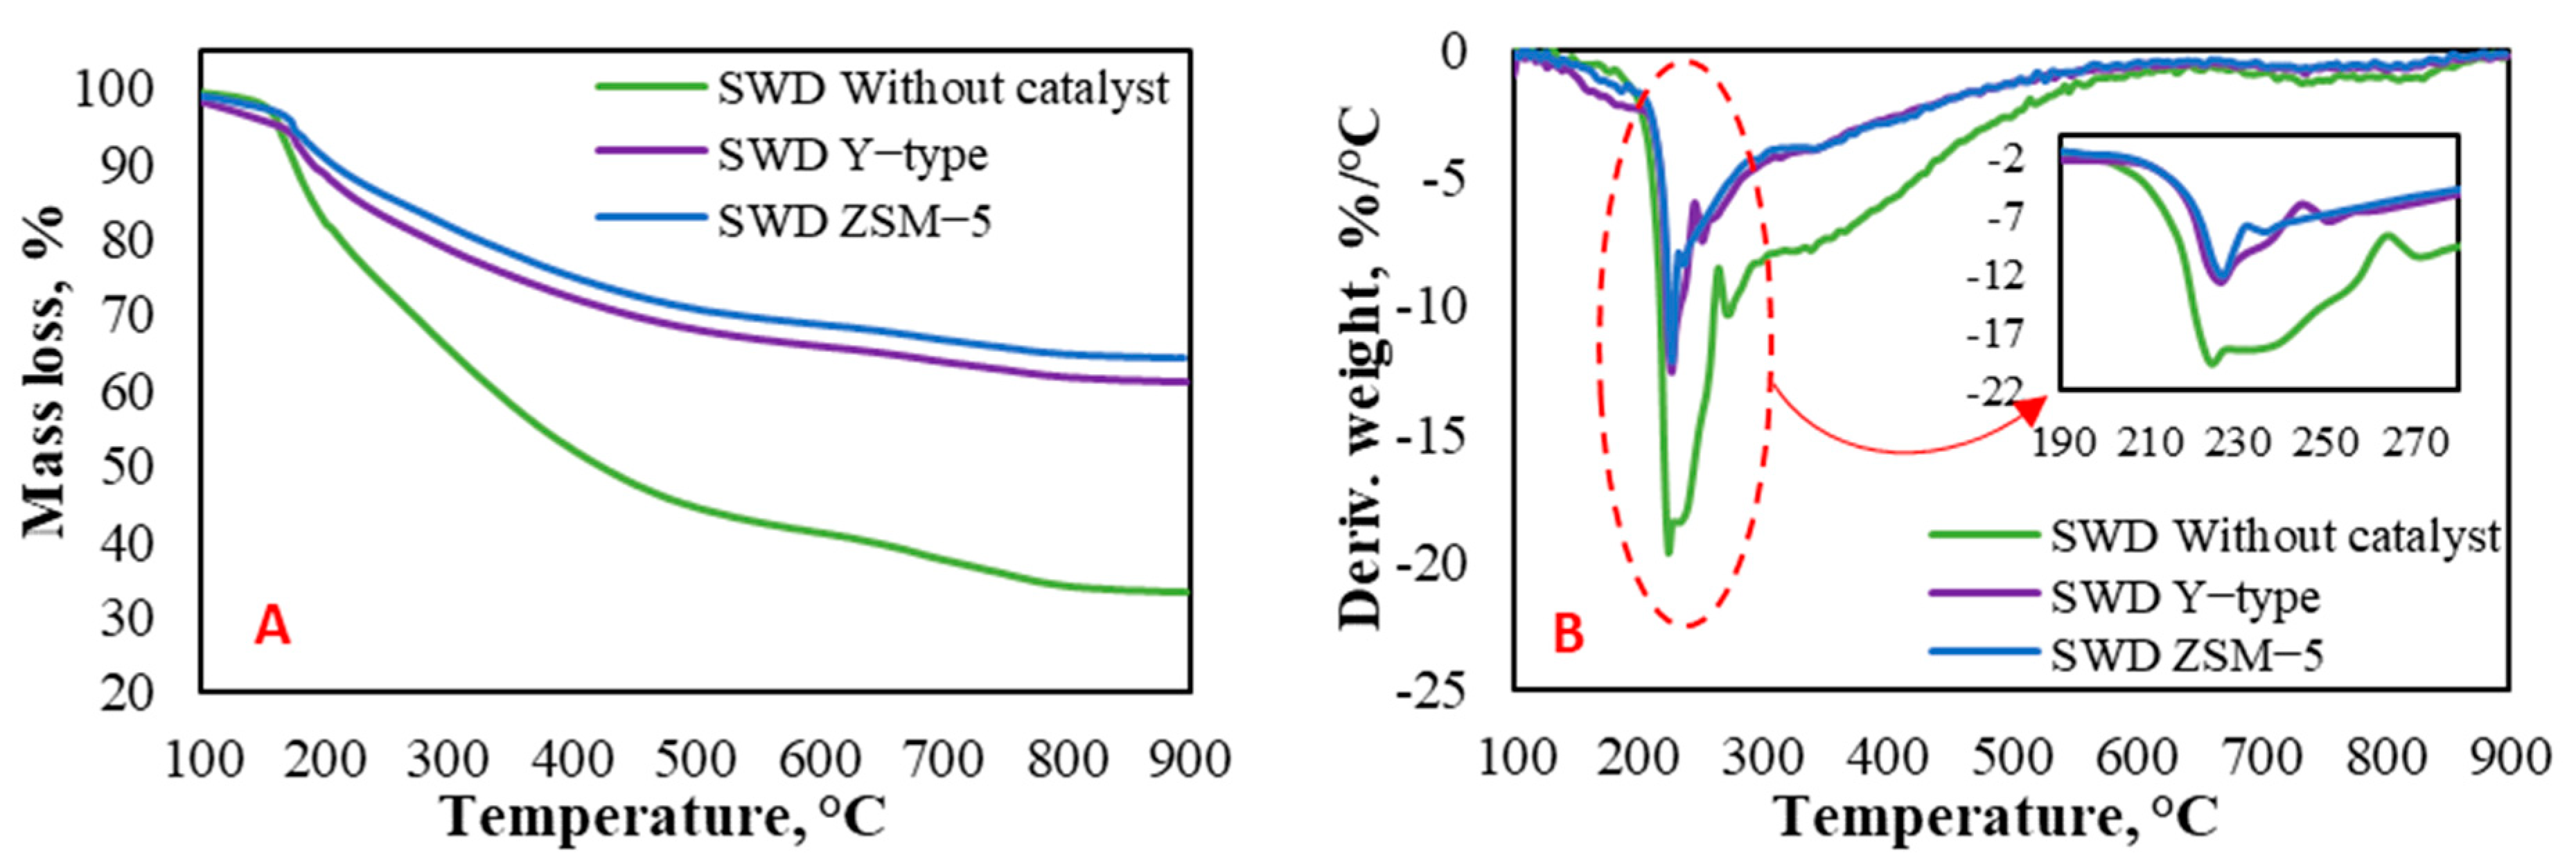
Primary thermal decomposition of the selected feedstock was performed using Netzsch F3 Jupiter 449 thermal analyser with and without catalyst at the small scale (~20–30 mg of the feedstock), and the results are presented in Figure 3. It was assumed that seaweed decomposes at two stages, around 230–270 °C and 700 °C. The first peak represents 1,4-β-glycosydic bond thermal decomposition in the cellulose and hemicellulose [30]. As can be seen from the DTG (Figure 3B) curve, the main degradation area is also divided into two peaks which show different material decomposition: the first peak represents the decay of hemicellulose at 230 °C, while the disintegration of cellulose was observed at 270 °C [31]. The catalyst incorporation into the system decreased the maximum cellulose decomposition temperature to 235 °C and 240 °C with ZSM-5 and Y-type catalysts, respectively, leading to the decrease in activation energy of the whole system [32]. The second peak, which was observed around 700 °C, could be assigned to lignin, inorganic derivatives [33], and residual [34] thermal decomposition into the feedstock.
Lignin has an aromatic polymeric matrix with a three-dimensional bond-link between the atoms in the alkyl-benzene structure [35]. Moreover, it has a three different types (S, H, and G), leading to different thermal stability and mechanical properties [36]. For the reason that it has a more robust aromatic matrix, which needs more energy to decompose the bonds between the atoms, it degrades at a higher temperature in comparison with hemicellulose and cellulose [37]. Thermal decomposition of the feedstock was not substantially affected by the catalyst. These results correlate with other authors’ results about the seaweed thermal decomposition without any catalyst [38] and over ZSM-5 [15], while the literature about this feedstock decomposition over Y-type catalyst is rare.
As can be seen from Figure 3A, the thermal resistance for the decomposition process increased by the catalyst incorporation into the system. This observation could be explained by the zeolite catalyst’s inability to decompose in this temperature region (40–900 °C), leading to the increase in residual mass in comparison with the raw seaweed sample [39]. For that reason, these results could be recalculated by deducting the amount of inserted catalyst. The results show that the additional amount of catalyst did not change the residual mass, which values reaching 33.36 wt.% with the seaweed sample, 33.14 wt.% with the seaweed-ZSM-5, and 33.11 wt.% with the seaweed/Y-type system.
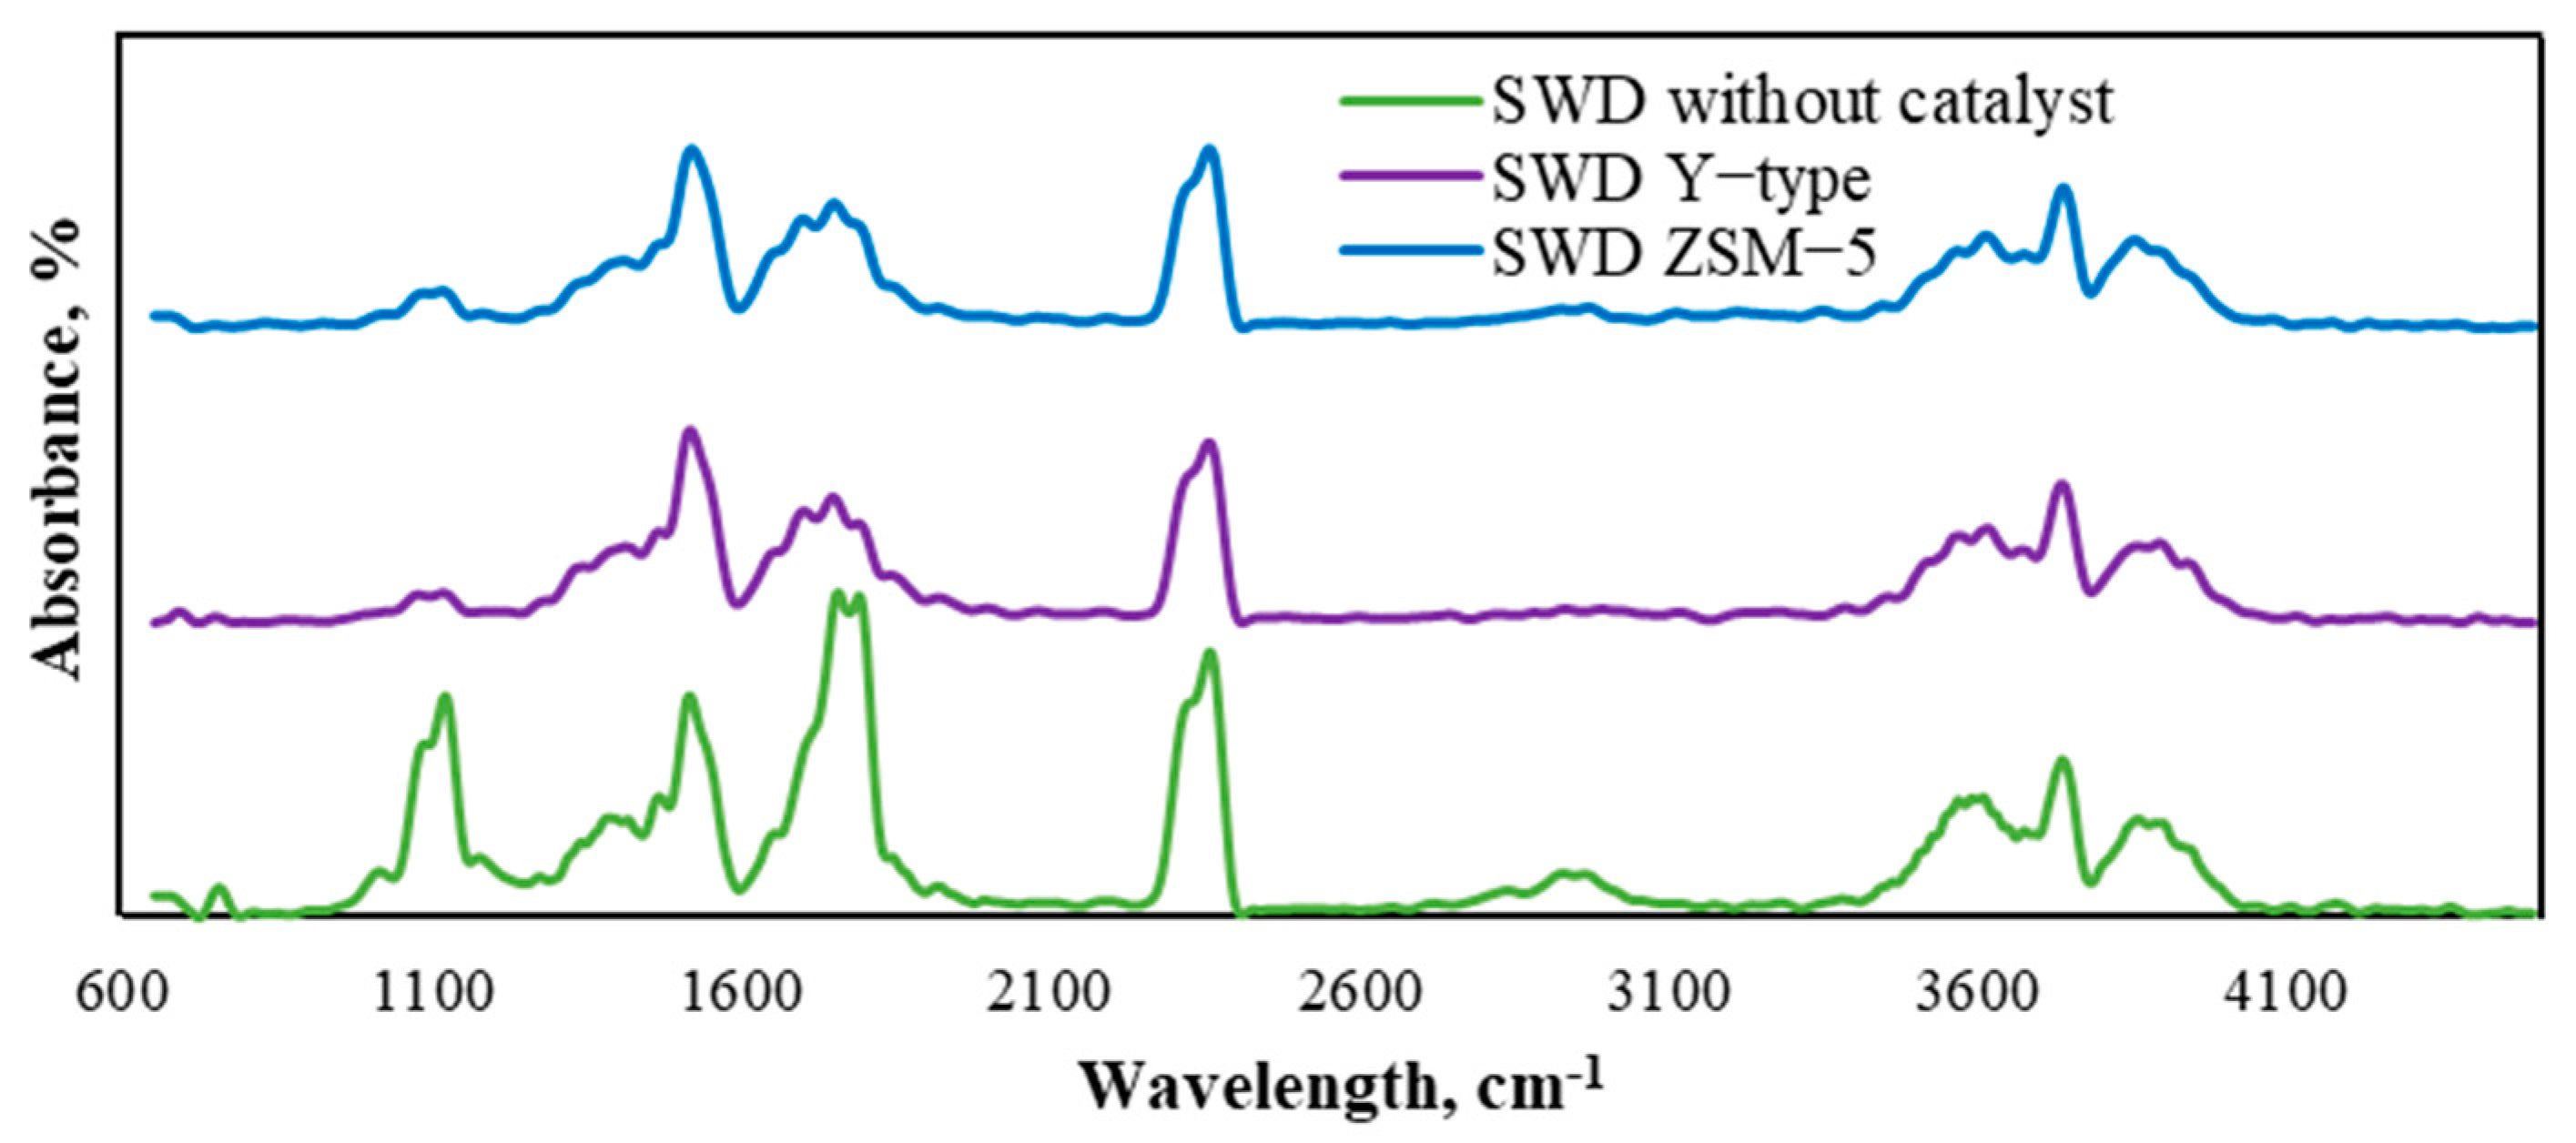
In order to investigate functional groups distribution into the gaseous phase of volatile fraction, a combined TGA-FTIR system has been used, and the results are depicted in Figure 4. It was assumed that the main functional groups in the volatile fraction are in the wavelength range of 800–4000 cm−1. The peak around 3000 cm−1 shows aliphatic and aromatic hydrocarbons present in the sample without a catalyst [40]. As can be seen, the catalyst completely decreased the number of formed hydrocarbons into the volatile fraction. Moreover, a sharp peak around 850–1200 cm−1 represents and confirms aromatic hydrocarbons present, and its intensity was significantly decreased by the catalyst, confirming the fact that the incorporation of the catalyst reduces the amount of aromatic and aliphatic carbon-based derivatives [41]. The sharp peak at 2300 cm−1 shows C=O bond oscillations present, which is a typical place for carbon dioxide (CO2) [42]. High-intensity peak at 1700 cm−1 represents the carbonylic C=O group present, which shows aldehyde and ketones present.
Added catalyst into the system slightly decreased the intensity of this peak, affecting the double-bonded π- and σ-electronic cloud, influencing the destruction of mentioned C=O, C-C, and C-H bond between the atoms [43]. Three peaks at 3400–3600 and 3800 cm−1 represent amine (N-H) and alcohol (O-H) functional groups. However, these peaks were not affected by the catalyst, leading to the fact that the zeolite catalyst did not influence the heteroatoms bonds in the biomass volatile matter structure.

3.3. Pyrolysis at Laboratory Scale Experimental Bench

The pyrolysis experiments at the laboratory-scale mini-plant were performed with a Lithuanian Energy Institutedesigned and constructed bench at three different temperatures (500, 700, and 900 °C) with two different zeolite catalysts (Y-type and ZSM-5). During this process, three different types of products (gasses, liquids, and solids) were obtained and analysed based on GC/TCD, GC/MS, and FTIR methods, and the results are presented in the sections below.

3.3.1. Pyrolysis Temperature Influence Analysis for Gas Composition during the Whole Process

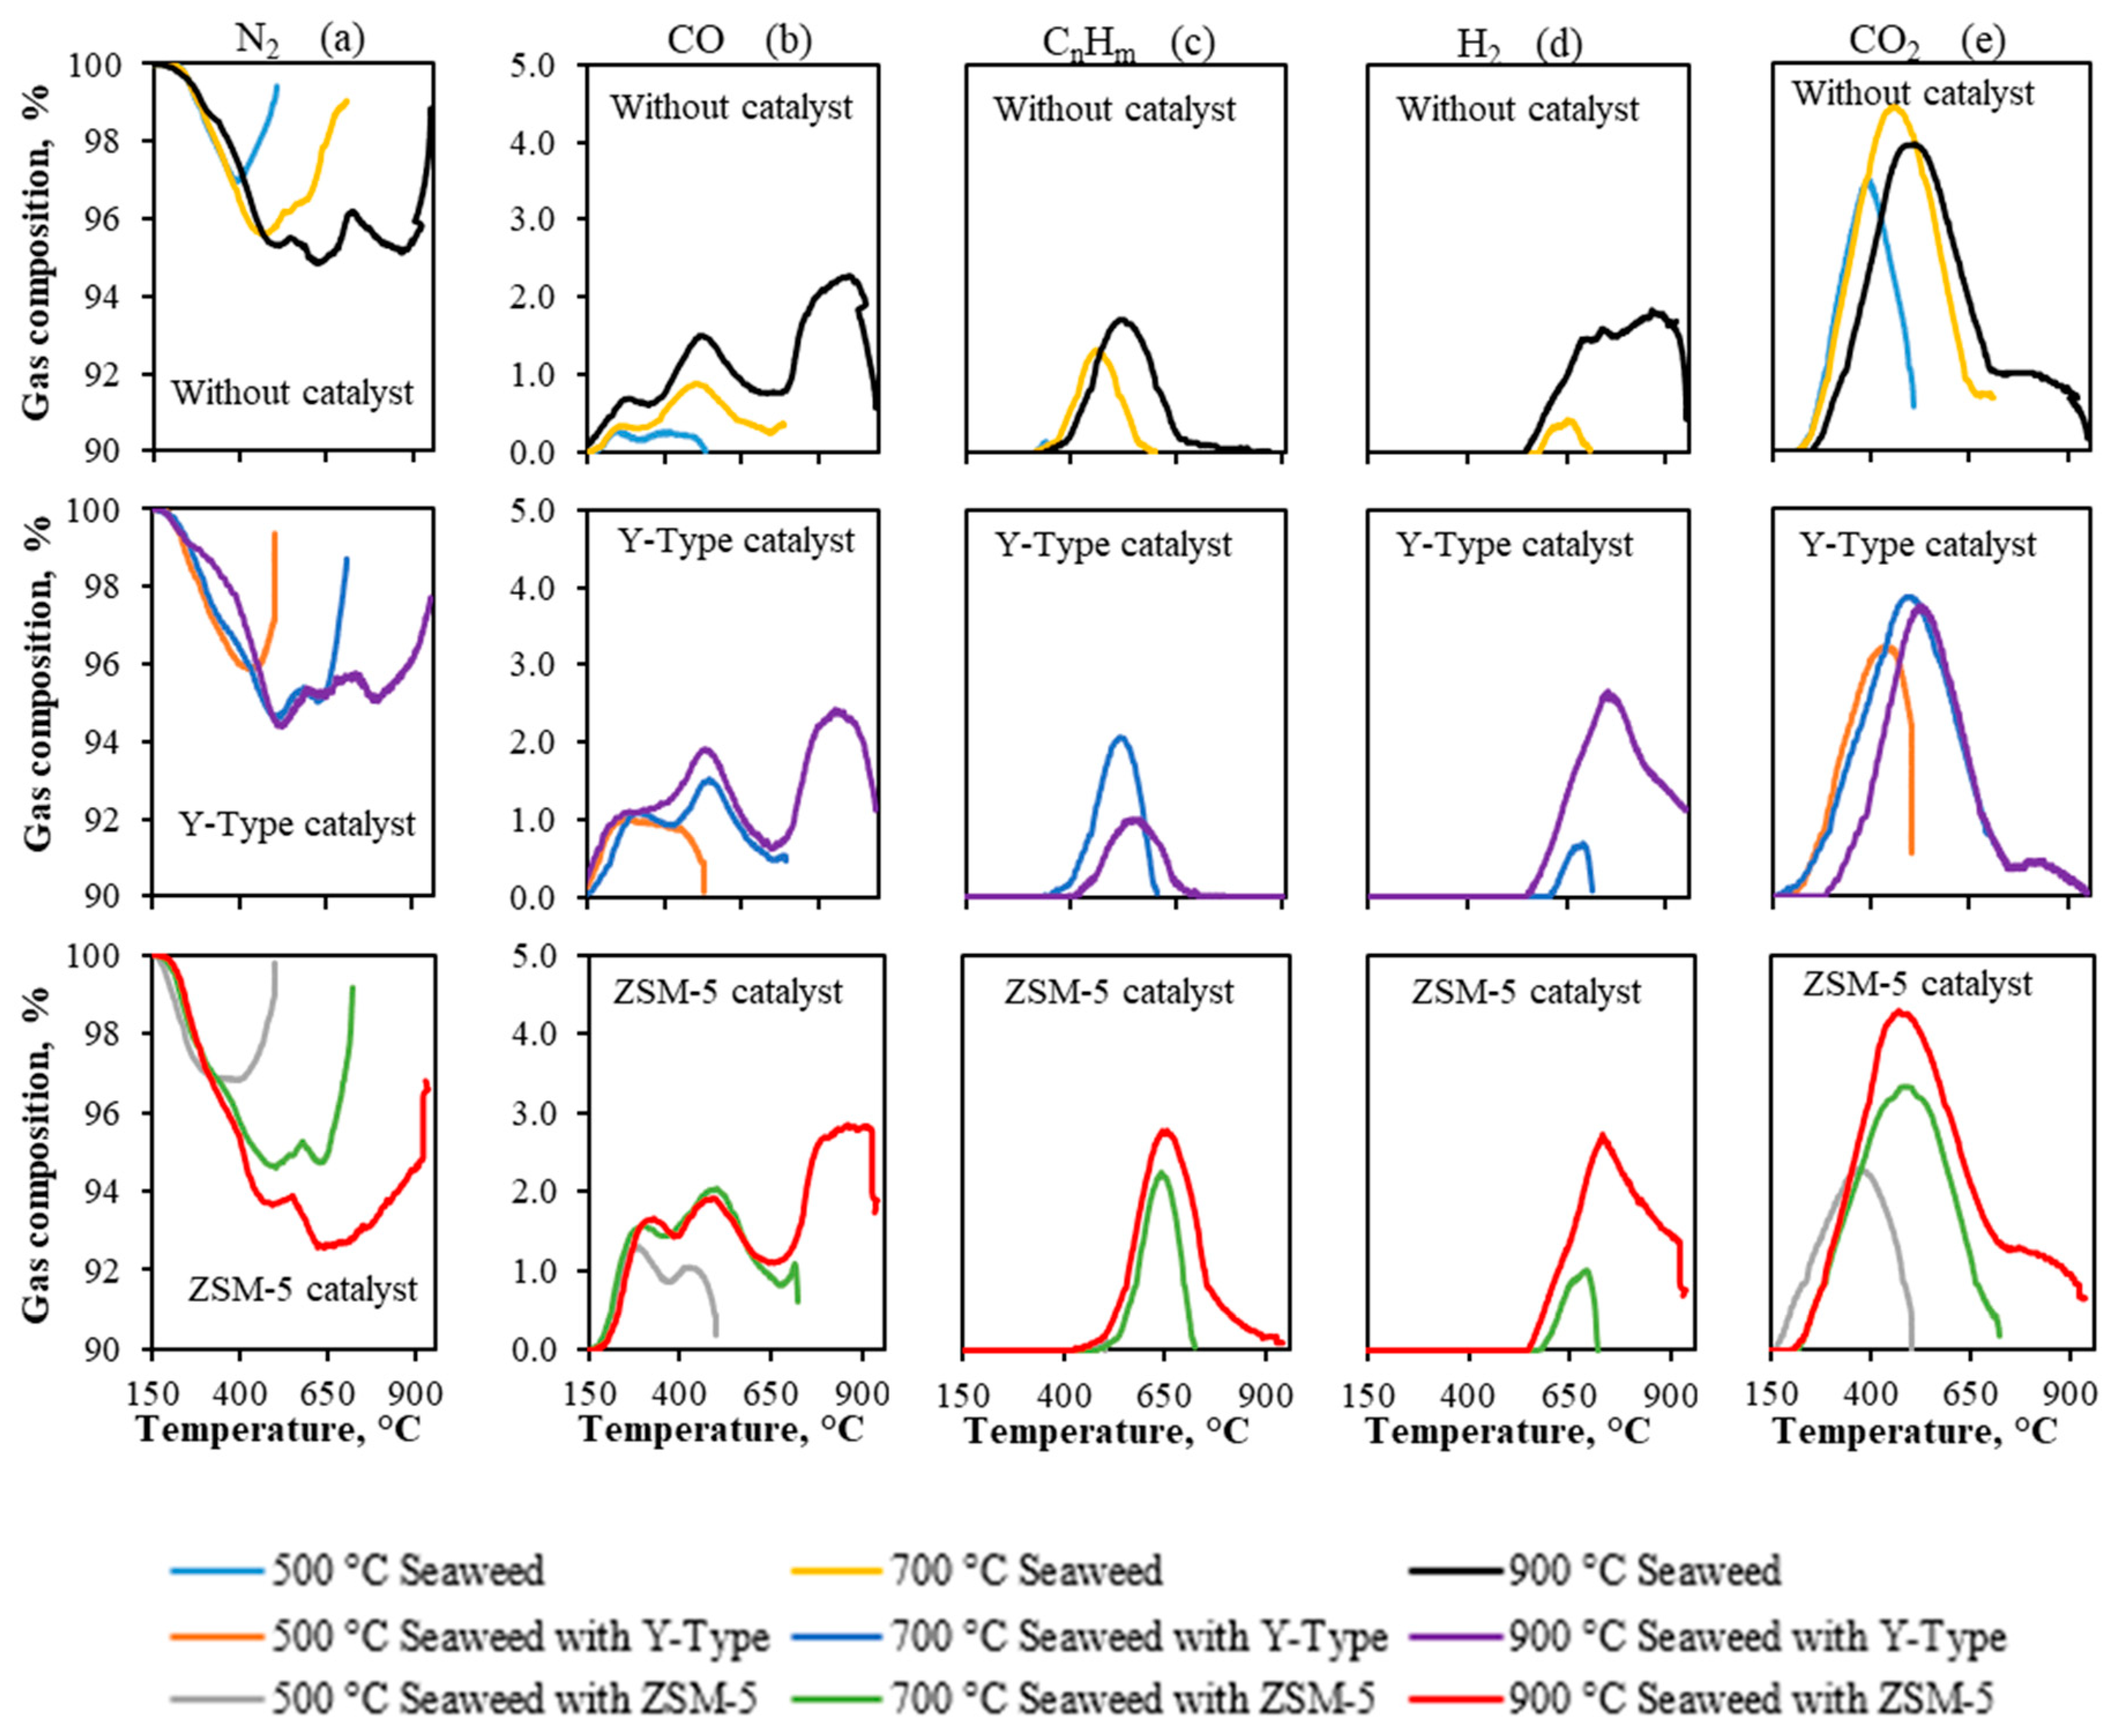
Formed gaseous products were measured by two different techniques, which were widely described in the methodology part (Section 2.3), and the results are presented in Figure 5. The online measurement technique was used for the primary gaseous pyrolysis product investigation during the whole decomposition process as a function of thermal treatment and various catalyst combinations. The most common non-condensable gaseous products from the seaweed sample are methane (CH4), hydrogen (H2), carbon dioxide (CO2) and monoxide (CO), and some other light-structure hydrocarbons, such as C2H6, C2H2, C2H4, etc. [44]. As can be seen from the results (Figure 5), the reaction starts around 150 °C and continues until the maximum temperatures (500, 700, and 900 °C). Moreover, this reaction was conducted in an N2 atmosphere without any oxygen present in the reactor, ensuring the typical pyrolysis atmosphere and conditions [45] (Figure 5a).
In order to investigate the synergetic effect of temperature and catalyst for the pyrolysis process, the maximum temperature influence must be explained. The experiments were conducted up to the maximum 500, 700, and 900 °C temperatures, showing the tendencies of the formed volatile non-condensable products. Figure 5a shows that the amount of N2 starts to decrease, when the temperature reaches 150 °C, indicating the beginning of the products formation. The first increase (Figure 5b–e) of the temperature significantly affected the formation of gasses: the amount of CO2 increased from 2.6 to 3.5 vol.%, CO from 0.4 to 0.9 vol.%, CnHm from 0.5 to 1.2 vol.%, and H2 from 0 (at 500 °C) to 0.4 vol.% (at 700 °C). The second increase (700–900 °C) also changed the composition of the formed gaseous phase: the amount of CO2 decreased from 3.5 to 3.1 vol.%, while the CO increased from 0.9 to 1.2 vol.%, CnHm from 1.2 to 1.5 vol.%, and H2 from 0.4 to 1.7 vol.%.
The decrease in CO2 could be explained by the carbon dioxide’s ability to react with a hydrogen molecule, leading to the formation of CnHm derivatives, thus resulting in the increase in the amount of these compounds. Moreover, the changes in the emission zones may be explained by the heterogeneous composition of the feedstock: cellulose, hemicellulose, and lignin have different decomposition regions, influencing gradual degradation based on temperature, and thus the emissions of the volatile products have changed [46]. It was assumed that during the pyrolysis process, the amorphous zone into the feedstock decomposes first, and the crystalline part must consume substantial heat energy to break the hydrogen bond network to decompose the crystalline structure [47]. After the reaction, moisture evolves at the low temperature (around 200 °C), feedstock undergoes the cleavage of inter- and intramolecular bonds between hydrogen around 280–300 °C [48]. Based on the investigation, it was assumed that temperature slightly affects the composition of formed volatile fraction and increases the amount of valuable flammable gasses (H2 and CnHm), resulting in the degradation of the remaining organic derivatives from the residuals [49].
The catalytic effect for the gaseous product composition is presented in Figure 5. As it was assumed, the number of flammable gasses was slightly increased by adding both types of catalysts. At 700 °C, ZSM-5 and Y-type catalysts increased the value of H2 up to 0.9 and 0.6 vol.%, respectively, while the amount of CnHm was increased to 2.1 and 2.0 vol.%. Moreover, at 900 °C, the catalyst increased the amount of H2 up to 2.6 (ZSM-5) and 2.5 vol.% (Y-type), while the amount of CnHm was increased up to 2.8 (ZSM-5) and 2.3 vol.% (Y-type). Catalyst significantly decreased the maximum emission peaks of the H2 from 880 to 740–750 °C with both types of the catalyst, which requires less activation energy to release the hydrogen from the feedstock. The catalyst’s working mechanism could provide an explanation for these tendencies: higher molecular mass compounds were decomposed and converted into the smaller derivatives on the catalyst active sites, revealing H2, which could react with CO2 carbon atoms forming light linear aliphatic hydrocarbons [50]. All in all, catalysts affect the reaction mechanism and volatile product formation during the seaweed pyrolysis process, leading to the increased formation of valuable flammable products.
It must be assumed that online gas composition measurement equipment uses infrared (IR) cells for the hydrocarbon’s measurements. This indicates that around 3000 cm−1, captured oscillations could not be identified as CH4 or C2H6, but based on the literature review, there is the high possibility of forming these derivatives. To investigate the possible structures of the light hydrocarbons, a GC/MS device was used, and the results are presented in the next Section 3.3.2.

3.3.2. Pyrolysis Gaseous Product Analysis by the GC/MS

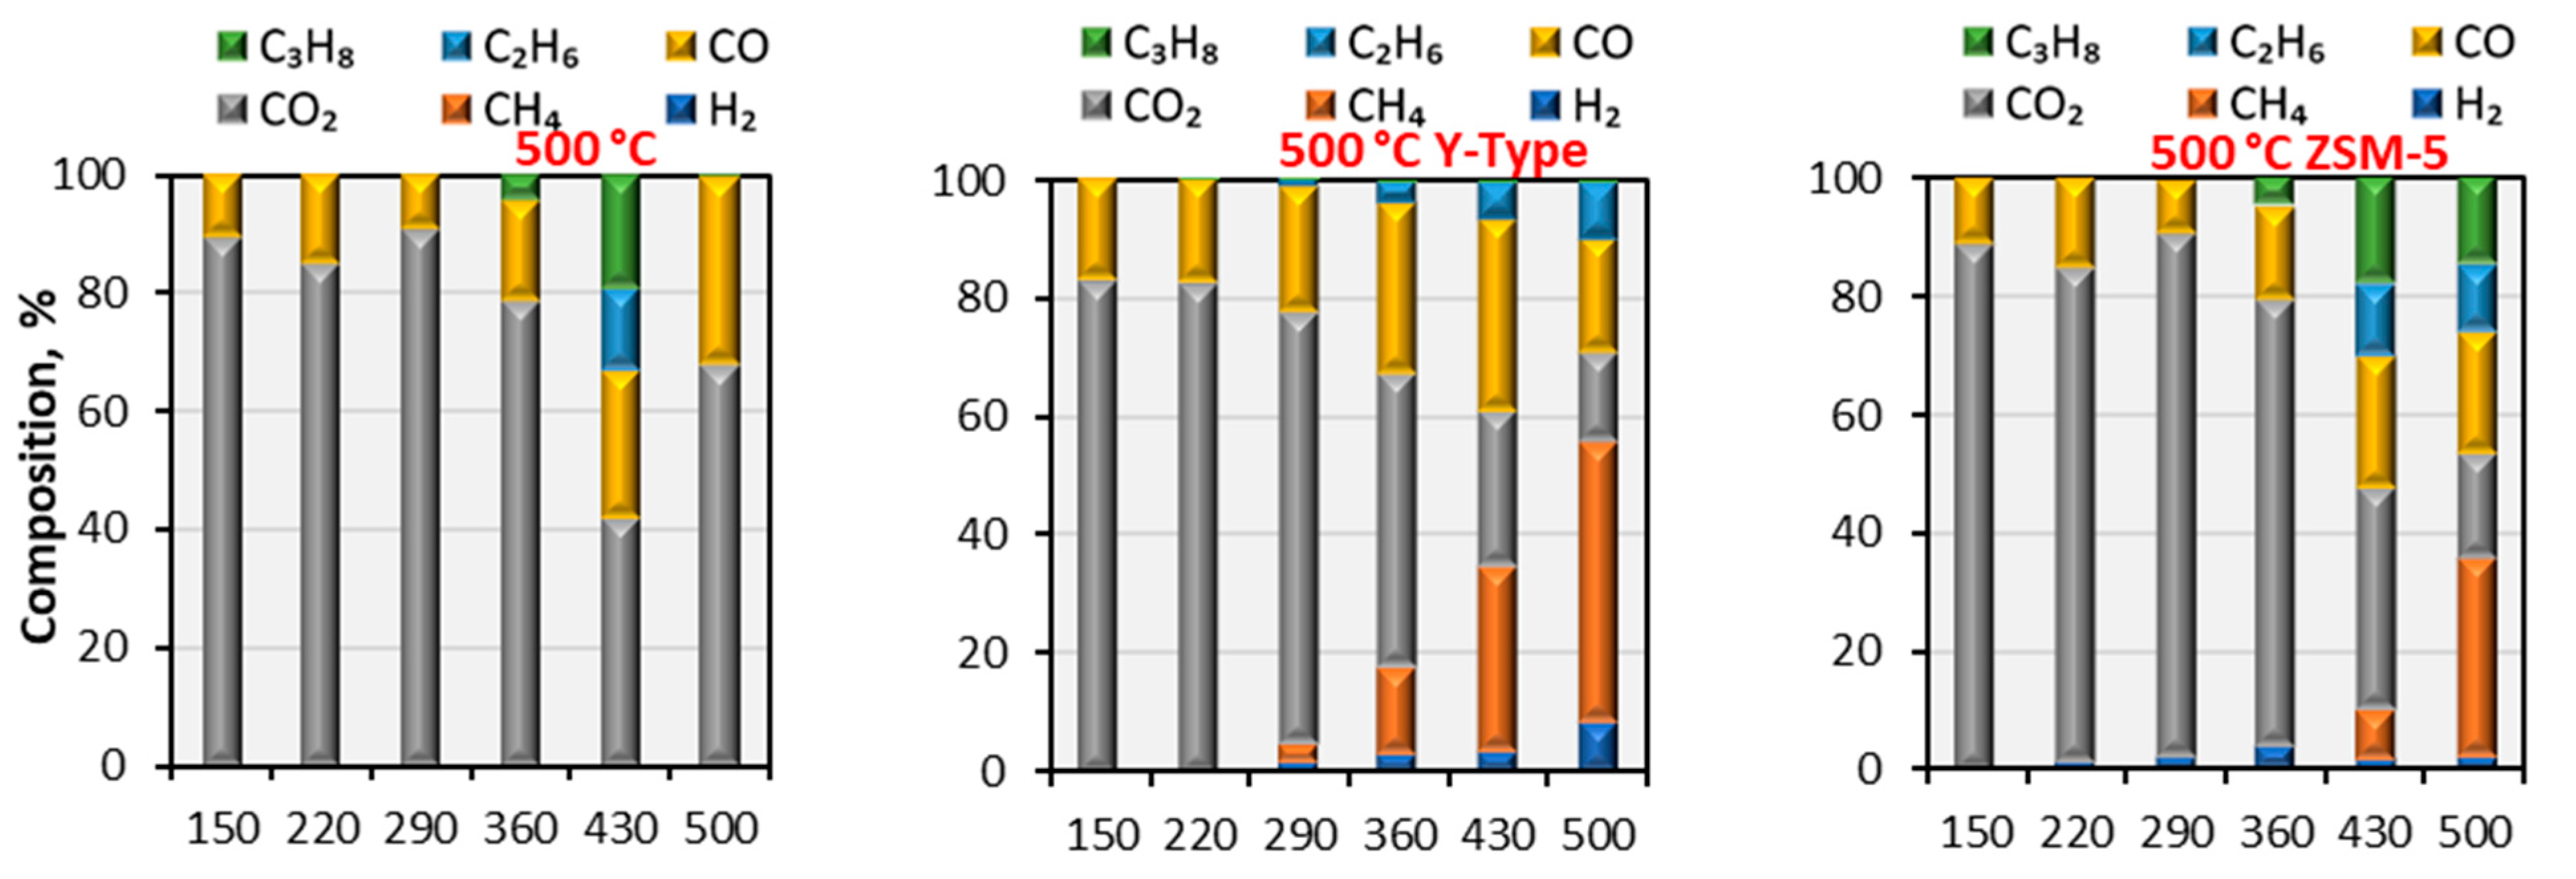
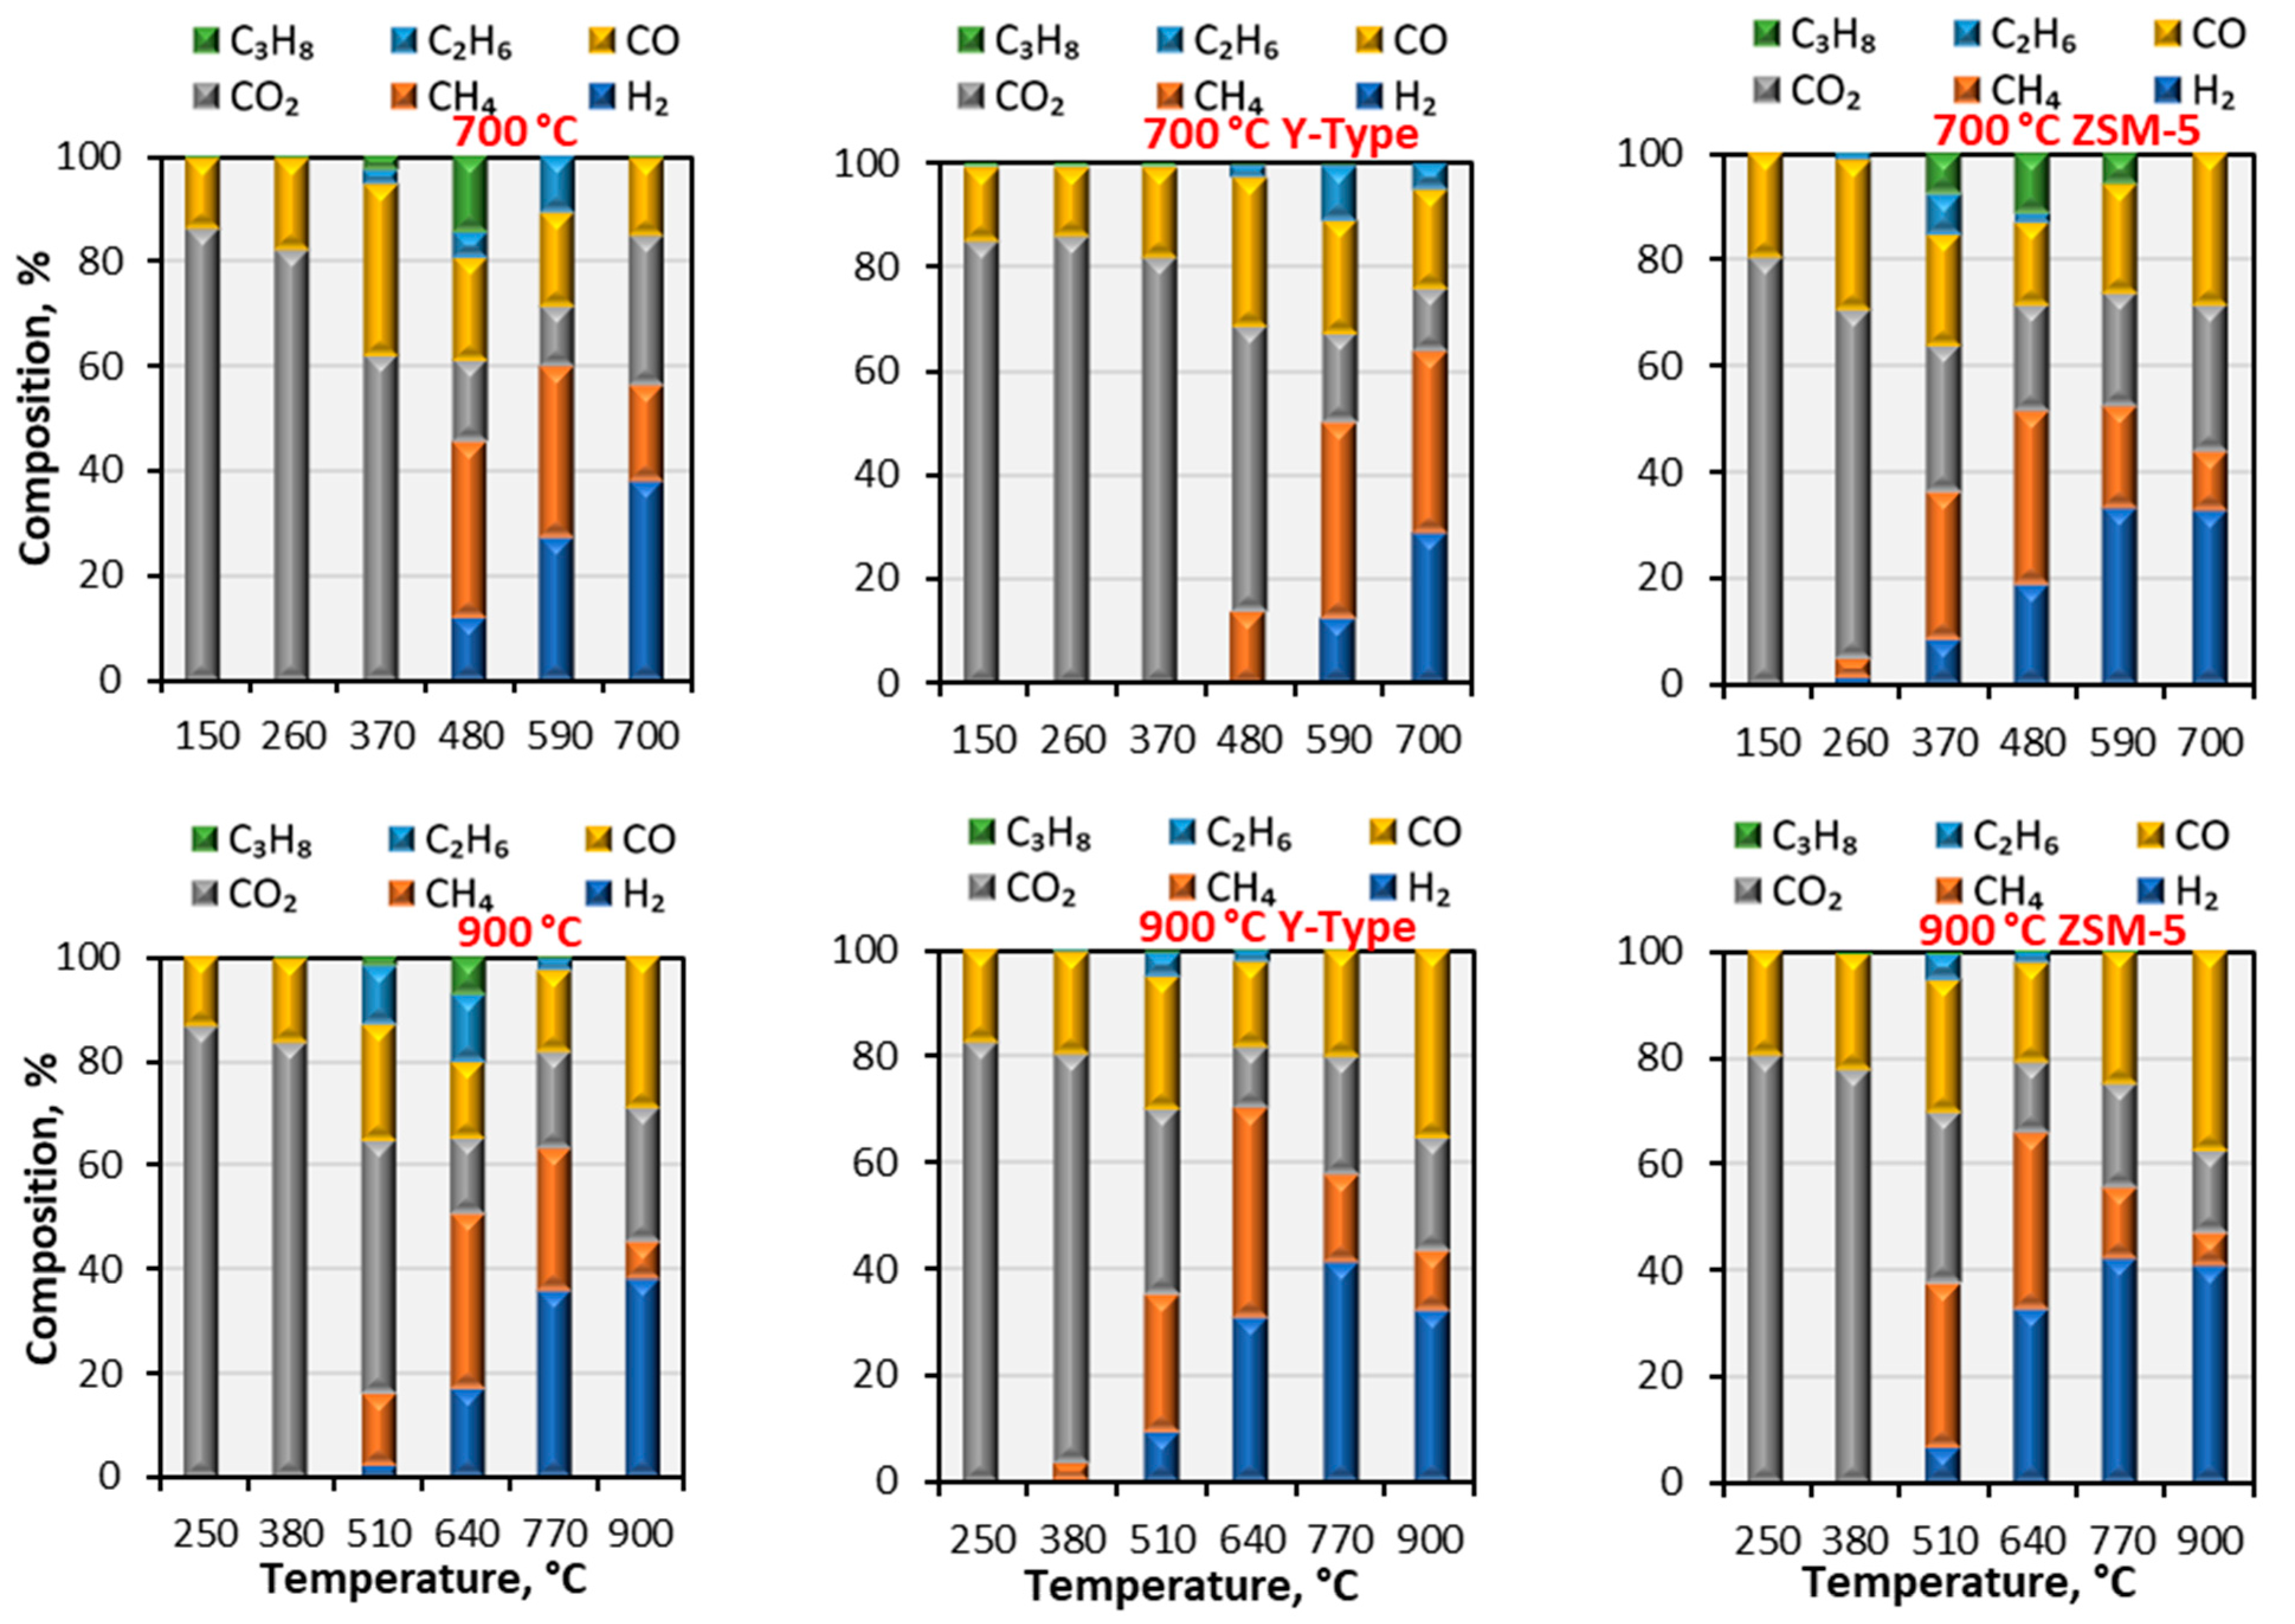
The gaseous product composition for the precise chemical derivatives determination was performed using a gas chromatograph with a thermal conductivity detector (GC/TCD). The results without balance N2 carrier gas are presented in Figure 6. For the gaseous products collection and storage used portable gasses flow sampler and six to seven “Tedlar” bags for each experiment. Based on the main decomposition profiles derived from the TGA results, the sampling procedure was carried out throughout the whole pyrolysis process, particularly in the main degradation regions prior to and after the reaction.
As shown, pyrolysis at the lowest temperature (500 °C) forces the emission of CO2 and CO, with some footprints of C2H6 and C3H8. Increased temperatures revealed the formation of H2, which could be explained by the insufficient temperature (500 °C) to decompose hydrocarbons and release hydrogen [51]. This effect was observed at the higher temperature, and the amount of H2 reached 37 and 39 vol.% at 700 and 900 °C, respectively. Additionally, the results demonstrate that at lower temperatures, CO2 and CO concentrations were high; however, as the temperature rose, flammable gas concentrations increased. These findings are consistent with those of the online measurement device and published research [51].
Insertion of the catalyst substantially affected the composition of the formed gasses. It was determined that at the lower temperature region, ZSM-5 catalyst starts to generate CH4 molecules, while the Y-zeolite catalyst forces substances with a larger molecular mass conversion into methane, and the amount of CH4 reaches 47 vol.%. As the temperature increased, the amount of H2 significantly increased up to 32 and 42 vol.% with ZSM-5 catalyst at 700 and 900 °C, respectively. The catalytic thermal reaction mechanism resulted in a slight decrease in the quantity of other light hydrocarbons. Additionally, the Y-type catalyst increased methane production to 40 and 38 vol.%, respectively, at 700 and 900 °C.
Based on the investigation by the GC/MS, the light hydrocarbons, such as C3H8 and C2H6, were mixed with CH4, giving discrepancies in the infrared (IR) gas cell in the instantaneous measurement device, and this analysis complements the whole vision of the formed gaseous phase products.

3.3.3. Liquid Product Analysis by the GC/MS

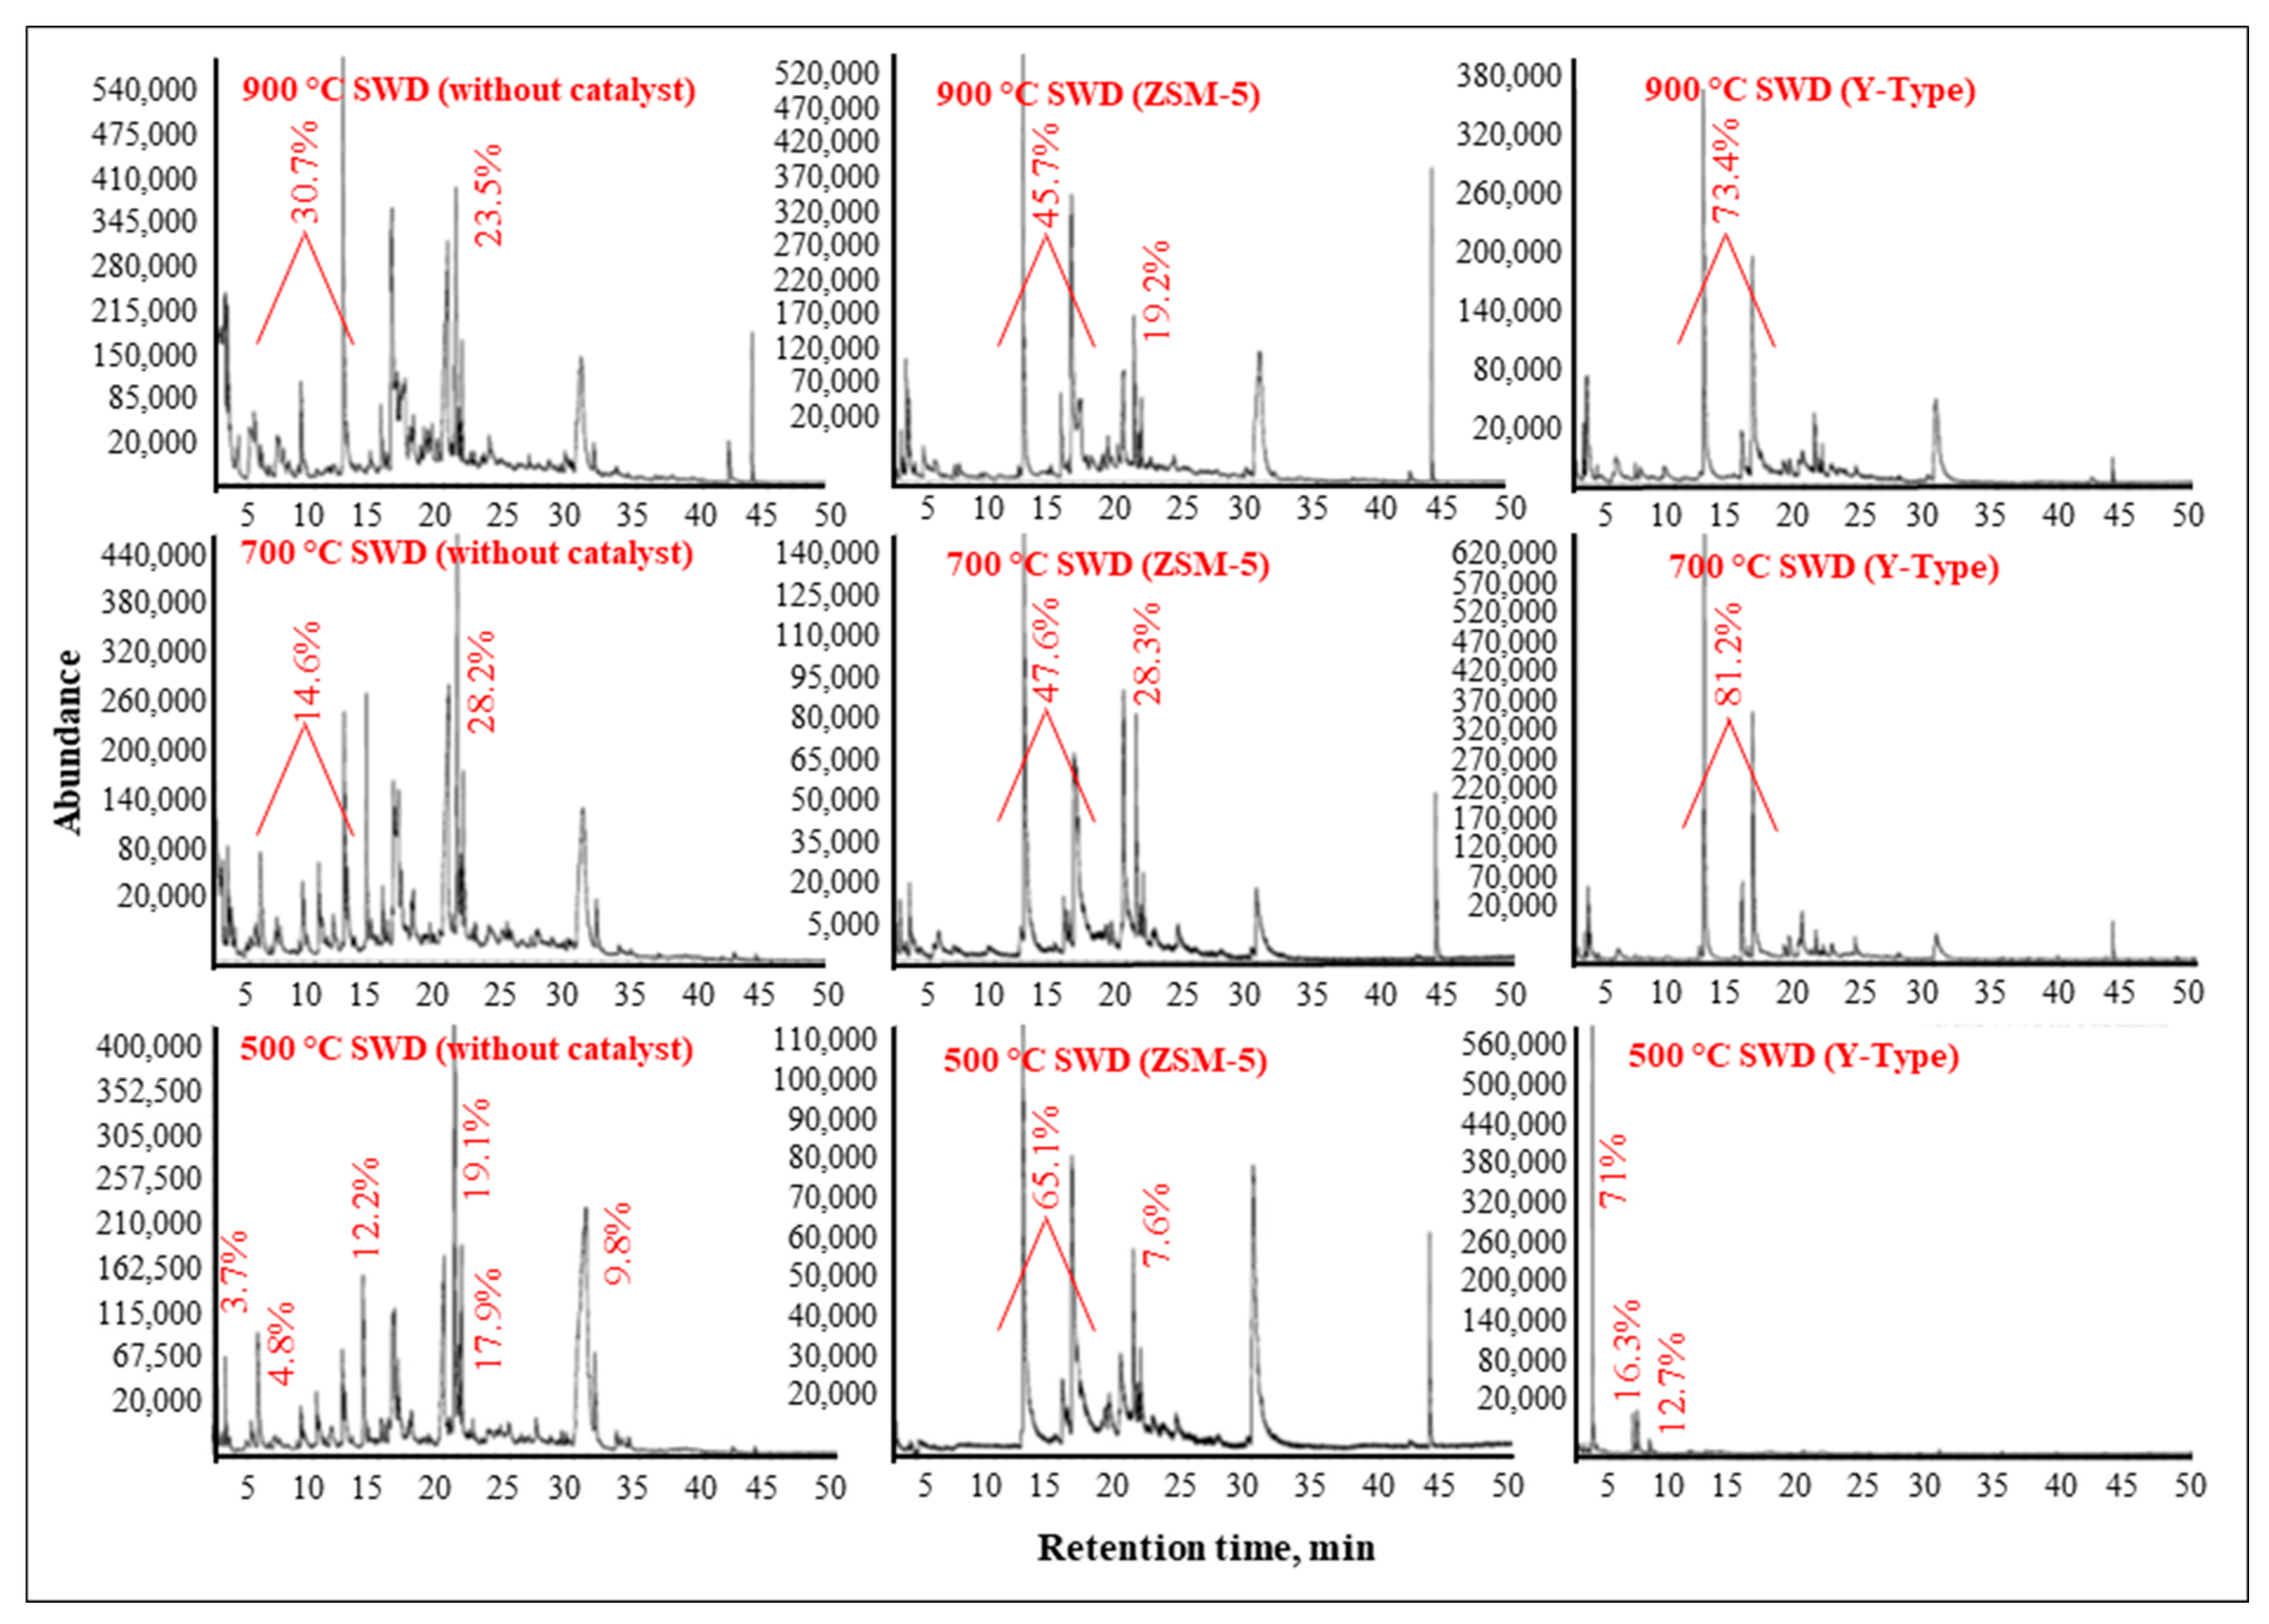
The liquid fraction from the seaweed sample was obtained during the pyrolysis process at the three different maximum temperatures (500, 700, and 900 °C), using two different zeolite catalysts. The composition evaluation was performed using a GC/MS system. The results are depicted in Figure 7. As shown, all seaweed sample batches (with and without catalyst) contain a certain amount of the hydrocarbon fraction with varying compositional and peak area variations. The most common compounds in the liquid fraction at the lowest temperature (500 °C) are variously substituted phenolic compounds (4.8), pyridine (3.7%), benzoic acid (19.1), naphthalene (12.2), d-glucopyranose (17.9%), and d-allose (9.8%). Increases in the temperature significantly boosted the amount of phenolic compounds and benzoic acid up to 14.6 and 28.2% at 700 °C, respectively, and 30.7% and 23.5% at 900 °C. This effect could be explained by the insufficient temperature for higher molecular mass compounds decomposition at the lowest temperature [50]. After the increase in the temperature, higher molecular mass compounds were converted into the lower molecular mass derivatives based on the higher-level energy required to make a conversion and decomposition. Moreover, based on the ultimate analysis it is clear, that the feedstock contains a high amount of oxygen (30.16 wt.%), leading to the fact that benzoic acid formation at the higher temperature is very likely.
The amount of phenolic compounds is significantly increased by the ZSM-5 catalyst, and the value reaches 65.1% at 500 °C, 47.6% at 700 °C, and 45.7% at 900 °C. Moreover, the amount of pyridine remained barely changed, while the amount of benzoic acid reached 7.6, 28.3, and 19.2% at 500, 700, and 900 °C, respectively. Most of the higher molecular mass compounds were decomposed and converted into the lower molecular mass derivatives by the depolymerisation and catalyst ring-opening reactions: the influence of active sites for the reaction mechanism forces the bonds between polycyclic C-C atoms to decompose, leading to the ring opening and regrouping reactions, and thus the formation of aliphatic and single-ring liquid products formation was processed [52].
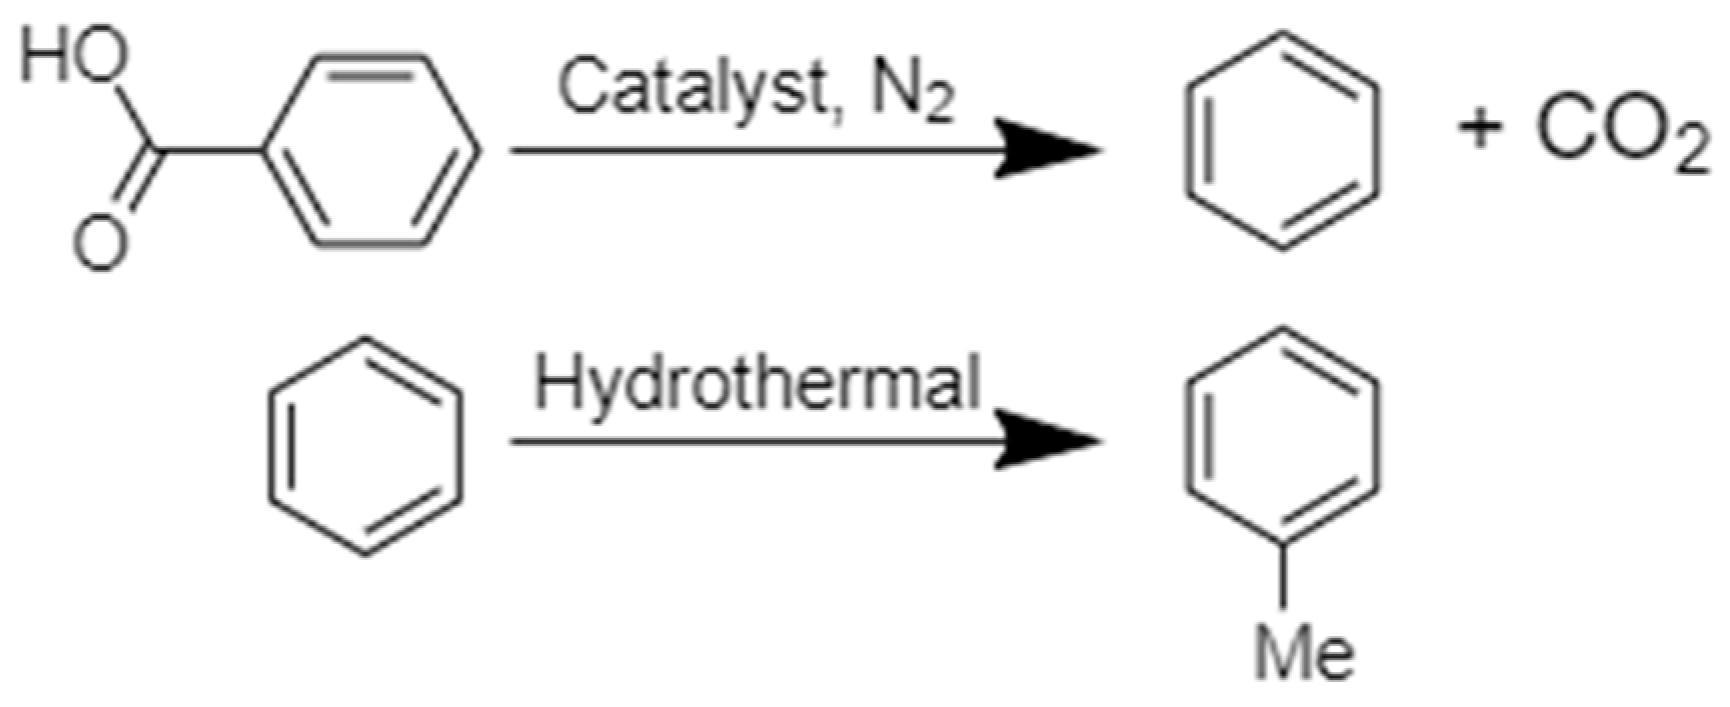
Adding Y-type zeolite catalyst into the system also affects the formation of the main products: the amount of phenolic compounds at 700 °C reaches 81.2%, while at 900 °C it reaches 73.4%. An interesting effect has occurred with the Y-type catalyst at 500 °C: most of the products were converted into toluene (71%), ethylbenzene (12.7%), and p-xylene (16.3%). The synergistic effect of catalyst and temperature may account for it, where the benzoic acid under the hydrothermal and catalytic conditions is converted into benzene (based on the reactions in the Figure 8), and the benzene is converted into the three main benzene-based products [53].
All in all, the synergetic effect of the catalysts and different temperatures significantly affect the liquid phase products recovery. This analysis reveals the potential and possibility to recover valuable chemicals from the waste biomass, contributing to the creation of a circular economy. Moreover, the possibility of recovering toluene in high amounts leads to the fact that this technology could be involved in the chemical industry as a solvent production technique, while the recovered phenolic compounds may be used in the medical [54], pharmaceutical [55], and dye industries [56], among others.

3.3.4. Solid Product Analysis by the FTIR

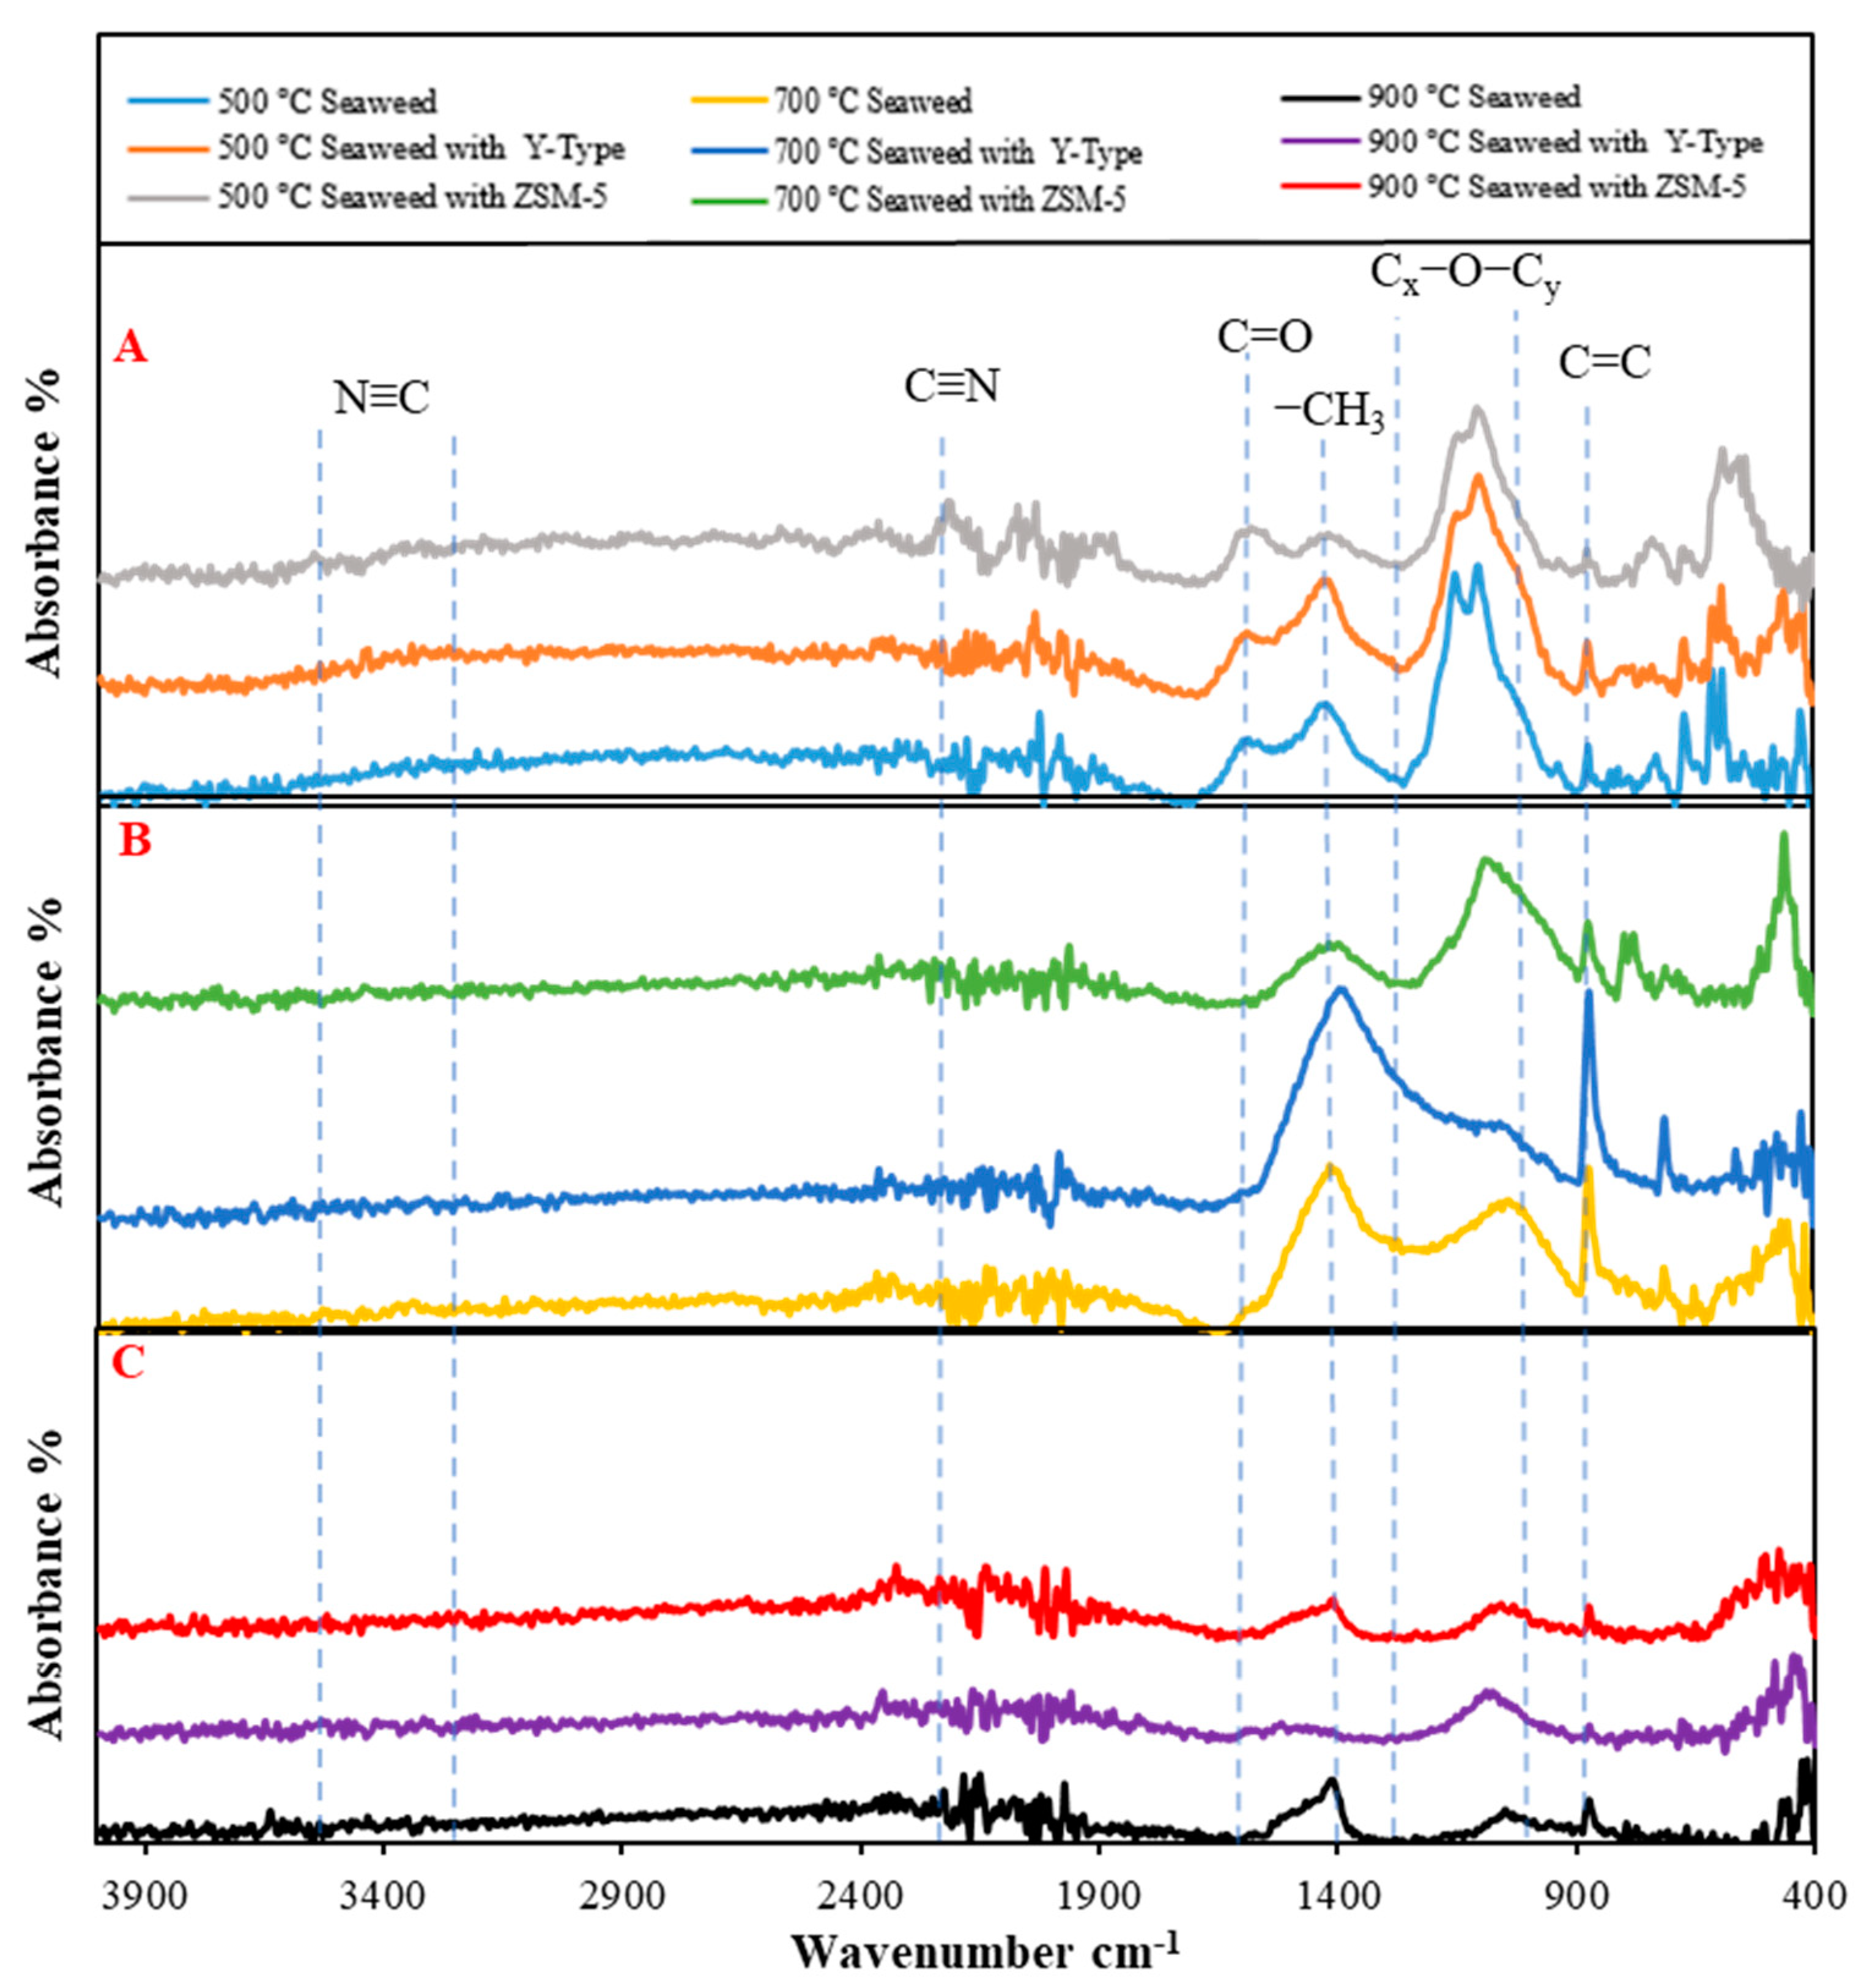
Chemical bond and functional group analysis of pyrolysed seaweed carbon residues at different pyrolysis temperatures with Y-type and ZSM-5 catalysts was conducted using Bruker Tensor 27 during ATR-FTIR analysis, and the results are presented in Figure 9. The recorded spectra cover the 4000–650 cm−1 wavenumber range. The FTIR spectroscope scan resolution and time were set at 4 cm−1 and 32 s, respectively.
According to the obtained data, in the wavelength range of 4000–1800 nm, the spectrum is continuous with negligible peaks. Primary and secondary amines can cause intense peaks at 3500–3300 cm−1; however, there are no such peaks is the analysed spectrum, leading to the possibility of suggesting the presence of tertiary amines.
The low-intensity peak at 1700 cm−1 indicates carbonyl groups (C=O bonds) and suggests the presence of ketones, whereas peaks at the 1630–1600 cm−1 range indicate C=C bonds, which represent α, β-unsaturated ketones.
Peaks in the 1300–1000 cm−1 range represent ethers (Cx-O-Cy) or other volatile compounds, i.e., alcohols. However, the presence of alcohols should also be indicated by the peaks at 3600 cm−1, which are absent in this spectrum. The same notion can be applied to the peaks observed at the 1150–1100 cm−1 range—they can represent C-N bonds, ethers, or secondary or tertiary alcohols together. The latter is more likely due to alcohol-indicating peaks at higher wavenumbers. Peaks observed at the 700–400 cm−1 range can be attributed to alkyl halide compounds, but for conclusive identification, there should also be noticeable a fluorides peak, which is absent. In the same wavelength range, peaks can also indicate the presence of chlorides, bromides, and iodides.
The peaks obtained with and without catalysts are rather similar, with the exception of peaks observed at ~2200 cm−1 during pyrolysis under 500 °C with ZSM-5 catalyst, indicating the presence of nitrile (C≡N) groups. Normally such peaks are more intense; however, here they are weak, indicating only trace quantities of nitrile group compounds. Analysis of pyrolysis conducted under 700 °C with no catalyst described by a notable peak at 1400 cm−1. This peak indicates methyl groups or primary amides. To be more specific, these functional group of compounds need corroborating peaks, which are absent. Peaks at ~850 cm−1 can represent a 1,2-C=C bond.

3.3.5. The Yields of the Recovered Pyrolysis Products

The calculation of the mass balance was performed to investigate the conversion efficiency at different temperatures using two different zeolite catalysts. The primary feedstock mass and final quantity of pyrolysis products—liquids, gases, and solids—were used to evaluate it (Table 3).
As shown in Table 3, the tendencies are typical for pyrolysis decomposition: the decrease in the temperature leads to the increase in the liquid and solid product formation, and vice versa with the gaseous phase products.
Moreover, the catalyst increases the amount of liquid phase products, and it could be explained by the catalytical process mechanism: Aldehydes, acids, and ethers are prevented from forming by the Y-zeolite, which encourages the formation of light aromatic compounds. On the other hand, the ZSM-5 catalyst increases the amount of aromatic products and affects the amount of oxygenates used in deoxygenation reactions [57]. These results correlate with other authors results of biomass pyrolysis under ZSM-5 catalyst [5], showing the process’s reproducibility and reliability.

3.3.6. A Comparison between Temperature and Catalyst Influence for the Product Formation

Analysis of seaweed pyrolysis gas (Figure 5) has shown that catalytic pyrolysis has a higher impact on the combustible gas content compared with conventional thermal pyrolysis. The temperature rises from 500 to 900 °C increased the combustible gas content. Nevertheless, the highest quantities of H2, CO, and CnHm were only 1.5%, 1.5%, and 1.8%, respectively. Insertion of the ZSM-5 catalyst improved the gas composition and showed the highest efficiency. ZSM-5 increased combustible gas concentrations by 2.7% for H2, 2.9% for CO, and 2.8% for CnHm. However, the Y-type catalyst did not perform so well. When tested under the same conditions, the maximum gas concentration for H2 was 2.3%; for CO, 2.2%; and for CnHm, 2.3%. Liquid product analysis by the GC/MS showed two dominant compounds in tar composition—phenolic compounds and benzoic acid. Without a catalyst, the amount of phenolic compound and benzoic acid increased along with temperature rise and reached its highest value 30.7% and 28.2%. By adding both catalysts, this tendency became inverse—the highest values were reached at the lowest pyrolysis temperature, with ZSM-5 and Y-type phenolic compounds increased to 81.2%, and 65.1%, respectively. FTIR spectra of solid products indicate that both temperature and feedstock have a significant influence on solid product composition. Temperature increase to the highest temperature of 900 °C significantly reduced FTIR spectra intensities, and spectra differences between feedstock composition were insignificant. The only difference was the missing spectra peak at the 1630–1600 cm−1 range for Y-type, indicating that this catalyst efficiently reduces the α- and β-unsaturated ketones at this temperature. At lower temperatures, the intensities between spectra are more distinct and show more relation to catalysts. At 700 °C, the ZSM-5 significantly reduces unsaturated ketones, while Y-type reduces C-N bonds, ethers, and secondary or tertiary alcohols together. At 500 °C, FTIR analysis demonstrates low catalyst influence on solid products. In a comparison of three-phase amounts, it is clear that under created experimental conditions, the temperature has a higher impact on product yields. The highest yield of gaseous products (47.44%) was determined without catalysts and under 900 °C. At the same time, the same test sample produced the lowest quantity of solid (18.27%) and liquid (34.30%) products. Nevertheless, feedstock with ZSM-5 feedstock outperformed the temperature influence and showed 34.66% gaseous product results at 500 °C compared with feedstock without catalyst (32.51%).

4. Conclusions

In this paper, the investigation of seaweed pyrolysis under three temperatures (500, 700, and 900 °C) and two zeolite catalysts (Y-type and ZSM-5) was performed and described.
The feedstock thermal decomposition in the micro-scale revealed that seaweed decomposes in two stages: the first one occurred approximately at 250 °C and could be assigned to cellulose and hemicellulose 1,4-β-glycosydic bonds thermal decomposition, while the second one at 700 °C belongs to the lignin aromatic matrix, inorganic compounds, and residual degradation. Catalyst slightly decreased the decomposition temperature leading to the fact that the catalytical pyrolysis over ZSM-5 and Y-type zeolites requires less activation energy to start the process. O–H, C=O, N–H, and C–H are the most common functional groups for aromatic and aliphatic hydrocarbons, aldehydes/ketones, amines, and alcohols. Gaseous product analysis after the experiments at the laboratory scale showed that the most common compounds in the gaseous phase are CnHm, H2, CO, and CO2. Investigation under different temperatures revealed that the highest amount of valuable gaseous products was obtained at 900 °C, while the catalyst slightly increased the amount of H2 up to 2.6 vol.% (ZSM-5) and 2.5 vol.% (Y-type) and CnHm up to 2.8 vol.% (ZSM-5) and 2.3 vol.% (Y-type).
Investigation of liquid products showed that the increase in the temperature significantly increases the number of phenolic compounds and benzoic acid, and the values reach 14.6 and 28.2% at 700 °C and 30.7%, along with 23.5% at 900 °C, respectively. ZSM-5 catalyst boosted the formation of phenolic derivatives up to 65.1% at 500 °C, 47.6% at 700 °C, and 45.7% at 900 °C, while the amount of benzoic acid reached 7.6, 28.3, and 19.2% at 500, 700, and 900 °C, respectively. Y-type catalyst at the lowest temperature initiates the formation of toluene (71%), ethylbenzene (12.7%), and p-xylene (16.3%), while the amount of phenolic compounds reaches 81.2% at 700 °C and 73.4% at 900 °C.
The tendencies of obtained pyrolysis product yields showed that decrease in the temperature increases the number of solid products up to 47.2 wt.%, and the total amount of the liquid products reach 20.2 wt.%, decreasing the gaseous phase compound formation. Catalyst slightly increases the number of tars, and the maximum value reaches 25.9 wt.% at 500 °C.
The investigation which was presented in this manuscript shows the tendency that seaweed is a potential feedstock for the recovery higher-added-value energy products using the pyrolysis process. Moreover, the synergetic effect between catalyst and temperature helps this technique to offer seaweed as a promising feedstock for the recovery of phenolic compounds and solvent (toluene).

Author Contributions

J.E.: conceptualisation, data curation, formal analysis, investigation, methodology, resources, software, supervision, writing—original draft, writing—review & editing. A.J.: conceptualisation, data curation, formal analysis, investigation, methodology, writing—original draft. N.S.: conceptualisation, data curation, formal analysis, investigation. K.Z.: data curation, investigation, methodology, formal analysis. L.V.: data curation, investigation, methodology, conceptualisation. All authors have read and agreed to the published version of the manuscript.

Funding

This research received no external funding.

Data Availability Statement

Not applicable.

Conflicts of Interest

The authors declare no conflict of interest.

References

  1. Kober, T.; Schiffer, H.W.; Densing, M.; Panos, E. Global Energy Perspectives to 2060—WEC’s World Energy Scenarios 2019. Energy Strateg. Rev. 2020, 31, 100523. [Google Scholar] [CrossRef]
  2. The European Parliament and the Council of the European Union Regulation (EU) 2019/943 of the European Parliament and of the Council of 5 June 2019 on the Internal Market for Electricity. Off. J. Eur. Union 2019, 62, 54–191.
  3. Srivastava, R.K.; Shetti, N.P.; Reddy, K.R.; Kwon, E.E.; Nadagouda, M.N.; Aminabhavi, T.M. Biomass Utilization and Production of Biofuels from Carbon Neutral Materials. Environ. Pollut. 2021, 276, 116731. [Google Scholar] [CrossRef]
  4. Cao, B.; Xia, Z.; Wang, S.; Abomohra, A.E.F.; Cai, N.; Hu, Y.; Yuan, C.; Qian, L.; Liu, L.; Liu, X.; et al. A Study on Catalytic Co-Pyrolysis of Cellulose with Seaweeds Polysaccharides over ZSM-5: Towards High-Quality Biofuel Production. J. Anal. Appl. Pyrolysis 2018, 134, 526–535. [Google Scholar] [CrossRef]
  5. Hu, Y.; Li, J.; Wang, S.; Xu, L.; Barati, B.; Cao, B.; Wang, H.; Xie, K.; Wang, Q. Catalytic Fast Hydropyrolysis of Seaweed Biomass with Different Zeolite Catalysts to Produce High-Grade Bio-Oil. Process Saf. Environ. Prot. 2021, 146, 69–76. [Google Scholar] [CrossRef]
  6. Atangana Njock, P.G.; Zhou, A.; Yin, Z.; Shen, S.L. Integrated Risk Assessment Approach for Eutrophication in Coastal Waters: Case of Baltic Sea. J. Clean. Prod. 2023, 387, 135673. [Google Scholar] [CrossRef]
  7. Vigouroux, G.; Kari, E.; Beltrán-Abaunza, J.M.; Uotila, P.; Yuan, D.; Destouni, G. Trend Correlations for Coastal Eutrophication and Its Main Local and Whole-Sea Drivers—Application to the Baltic Sea. Sci. Total Environ. 2021, 779, 146367. [Google Scholar] [CrossRef]
  8. Kotta, J.; Futter, M.; Kaasik, A.; Liversage, K.; Rätsep, M.; Barboza, F.R.; Bergström, L.; Bergström, P.; Bobsien, I.; Díaz, E.; et al. Cleaning up Seas Using Blue Growth Initiatives: Mussel Farming for Eutrophication Control in the Baltic Sea. Sci. Total Environ. 2020, 709, 136144. [Google Scholar] [CrossRef]
  9. Weinberger, F.; Paalme, T.; Wikström, S.A. Seaweed Resources of the Baltic Sea, Kattegat and German and Danish North Sea Coasts. Bot. Mar. 2020, 63, 61–72. [Google Scholar] [CrossRef] [Green Version]
  10. Lowery, C.M.; Leckie, R.M.; Bryant, R.; Elderbak, K.; Parker, A.; Polyak, D.E.; Schmidt, M.; Snoeyenbos-West, O.; Sterzinar, E. The Late Cretaceous Western Interior Seaway as a Model for Oxygenation Change in Epicontinental Restricted Basins. Earth-Sci. Rev. 2018, 177, 545–564. [Google Scholar] [CrossRef] [Green Version]
  11. Syrpas, M.; Bukauskaitė, J.; Paškauskas, R.; Bašinskienė, L.; Venskutonis, P.R. Recovery of Lipophilic Products from Wild Cyanobacteria (Aphanizomenon Flos-Aquae) Isolated from the Curonian Lagoon by Means of Supercritical Carbon Dioxide Extraction. Algal Res. 2018, 35, 10–21. [Google Scholar] [CrossRef]
  12. Froehlich, H.E.; Afflerbach, J.C.; Frazier, M.; Halpern, B.S. Blue Growth Potential to Mitigate Climate Change through Seaweed Offsetting. Curr. Biol. 2019, 29, 3087–3093.e3. [Google Scholar] [CrossRef] [PubMed]
  13. Gallagher, J.B.; Shelamoff, V.; Layton, C. Seaweed Ecosystems May Not Mitigate CO2emissions. ICES J. Mar. Sci. 2022, 79, 585–592. [Google Scholar] [CrossRef]
  14. Jiang, D.; Xia, Z.; Wang, S.; Li, H.; Gong, X.; Yuan, C.; El-Fatah Abomohra, A.; Cao, B.; Hu, X.; He, Z.; et al. Mechanism Research on Catalytic Pyrolysis of Sulfated Polysaccharide Using ZSM-5 Catalysts by Py-GC/MS and Density Functional Theory Studies. J. Anal. Appl. Pyrolysis 2019, 143, 104680. [Google Scholar] [CrossRef]
  15. Yuan, C.; Jiang, D.; Wang, S.; Barati, B.; Gong, X.; Cao, B.; Zhang, R.P.; Zhang, C.; Odey, E.A. Study on Catalytic Pyrolysis Mechanism of Seaweed Polysaccharide Monomer. Combust. Flame 2020, 218, 1–11. [Google Scholar] [CrossRef]
  16. Chen, W.; Yang, H.; Chen, Y.; Xia, M.; Chen, X.; Chen, H. Transformation of Nitrogen and Evolution of N-Containing Species during Algae Pyrolysis. Environ. Sci. Technol. 2017, 51, 6570–6579. [Google Scholar] [CrossRef]
  17. Ye, N.; Li, D.; Chen, L.; Zhang, X.; Xu, D. Comparative Studies of the Pyrolytic and Kinetic Characteristics of Maize Straw and the Seaweed Ulva Pertusa. PLoS ONE 2010, 5, e12641. [Google Scholar] [CrossRef]
  18. Aboulkas, A.; Hammani, H.; El Achaby, M.; Bilal, E.; Barakat, A.; El harfi, K. Valorization of Algal Waste via Pyrolysis in a Fixed-Bed Reactor: Production and Characterization of Bio-Oil and Bio-Char. Bioresour. Technol. 2017, 243, 400–408. [Google Scholar] [CrossRef]
  19. Nawaz, A.; Kumar, P. Thermocatalytic Pyrolysis of Sesbania bispinosa Biomass over Y-Zeolite Catalyst towards Clean Fuel and Valuable Chemicals. Energy 2023, 263, 125684. [Google Scholar] [CrossRef]
  20. Yousef, S.; Eimontas, J.; Striūgas, N.; Abdelnaby, M.A. Influence of Carbon Black Filler on Pyrolysis Kinetic Behaviour and TG-FTIR-GC–MS Analysis of Glass Fibre Reinforced Polymer Composites. Energy 2021, 233, 121167. [Google Scholar] [CrossRef]
  21. Gözke, G.; Açıkalın, K. Pyrolysis Characteristics and Kinetics of Sour Cherry Stalk and Flesh via Thermogravimetric Analysis Using Isoconversional Methods. J. Therm. Anal. Calorim. 2021, 146, 893–910. [Google Scholar] [CrossRef]
  22. Brems, A.; Baeyens, J.; Beerlandt, J.; Dewil, R. Thermogravimetric Pyrolysis of Waste Polyethylene-Terephthalate and Polystyrene: A Critical Assessment of Kinetics Modelling. Resour. Conserv. Recycl. 2011, 55, 772–781. [Google Scholar] [CrossRef]
  23. Torres-Sciancalepore, R.; Asensio, D.; Nassini, D.; Fernandez, A.; Rodriguez, R.; Fouga, G.; Mazza, G. Assessment of the Behavior of Rosa Rubiginosa Seed Waste during Slow Pyrolysis Process towards Complete Recovery: Kinetic Modeling and Product Analysis. Energy Convers. Manag. 2022, 272, 116340. [Google Scholar] [CrossRef]
  24. Wang, S.; Jiang, X.M.; Wang, N.; Yu, L.J.; Li, Z.; He, P.M. Research on Pyrolysis Characteristics of Seaweed. Energy Fuels 2007, 21, 3723–3729. [Google Scholar] [CrossRef]
  25. Yousef, S.; Eimontas, J.; Stasiulaitiene, I.; Zakarauskas, K.; Striūgas, N. Pyrolysis of All Layers of Surgical Mask Waste as a Mixture and Its Life-Cycle Assessment. Sustain. Prod. Consum. 2022, 32, 519–531. [Google Scholar] [CrossRef]
  26. ASTM E870-82; Standard Test Methods for Analysis of Wood Fuels. ASTM International: West Conshohocken, PA, USA, 2011. [CrossRef]
  27. Premarathna, A.D.; Tuvikene, R.; Fernando, P.H.P.; Adhikari, R.; Perera, M.C.N.; Ranahewa, T.H.; Howlader, M.M.; Wangchuk, P.; Jayasooriya, A.P.; Rajapakse, R.P.V.J. Comparative Analysis of Proximate Compositions, Mineral and Functional Chemical Groups of 15 Different Seaweed Species. Sci. Rep. 2022, 12, 19610. [Google Scholar] [CrossRef]
  28. Liu, Z.; Yang, W.; Xu, W.; Liu, Y. Removal of Elemental Mercury by Bio-Chars Derived from Seaweed Impregnated with Potassium Iodine. Chem. Eng. J. 2018, 339, 468–478. [Google Scholar] [CrossRef]
  29. Meenakshi, S.; Umayaparvathi, S.; Arumugam, M.; Balasubramanian, T. In Vitro Antioxidant Properties and FTIR Analysis of Two Seaweeds of Gulf of Mannar. Asian Pac. J. Trop. Biomed. 2011, 1, S66–S70. [Google Scholar] [CrossRef]
  30. Burhenne, L.; Messmer, J.; Aicher, T.; Laborie, M.P. The Effect of the Biomass Components Lignin, Cellulose and Hemicellulose on TGA and Fixed Bed Pyrolysis. J. Anal. Appl. Pyrolysis 2013, 101, 177–184. [Google Scholar] [CrossRef]
  31. Waters, C.L.; Janupala, R.R.; Mallinson, R.G.; Lobban, L.L. Staged Thermal Fractionation for Segregation of Lignin and Cellulose Pyrolysis Products: An Experimental Study of Residence Time and Temperature Effects. J. Anal. Appl. Pyrolysis 2017, 126, 380–389. [Google Scholar] [CrossRef]
  32. Yousef, S.; Kiminaitė, I.; Eimontas, J.; Striūgas, N.; Abdelnaby, M.A. Recovery of Phenol and Acetic Acid from Glass Fibre Reinforced Thermoplastic Resin Using Catalytic Pyrolysis Process on ZSM-5 Zeolite Catalyst and Its Kinetic Behaviour. Thermochim. Acta 2022, 715, 179293. [Google Scholar] [CrossRef]
  33. Khan, N.; Sudhakar, K.; Mamat, R. Thermogravimetric Analysis of Marine Macroalgae Waste Biomass as Bio-Renewable Fuel. J. Chem. 2022, 2022, 9. [Google Scholar] [CrossRef]
  34. Sanchez-Silva, L.; López-González, D.; Villaseñor, J.; Sánchez, P.; Valverde, J.L. Thermogravimetric-Mass Spectrometric Analysis of Lignocellulosic and Marine Biomass Pyrolysis. Bioresour. Technol. 2012, 109, 163–172. [Google Scholar] [CrossRef] [PubMed]
  35. Pandey, M.P.; Kim, C.S. Lignin Depolymerization and Conversion: A Review of Thermochemical Methods. Chem. Eng. Technol. 2011, 34, 29–41. [Google Scholar] [CrossRef]
  36. Yang, H.; Yan, R.; Chen, H.; Lee, D.H.; Zheng, C. Characteristics of Hemicellulose, Cellulose and Lignin Pyrolysis. Fuel 2007, 86, 1781–1788. [Google Scholar] [CrossRef]
  37. Gani, A.; Naruse, I. Effect of Cellulose and Lignin Content on Pyrolysis and Combustion Characteristics for Several Types of Biomass. Renew. Energy 2007, 32, 649–661. [Google Scholar] [CrossRef]
  38. Kumar, A.; Jindal, M.; Rawat, S.; Kumar, J.; Sripadi, P.; Yang, B.; Thallada, B. Upgradation of Sugarcane Bagasse Lignin: Fractionation to Cyclic Alcohols Production. Catal. Today 2023, 408, 182–193. [Google Scholar] [CrossRef]
  39. Eimontas, J.; Striūgas, N.; Abdelnaby, M.A.; Yousef, S. Catalytic Pyrolysis Kinetic Behavior and TG-FTIR-GC–MS Analysis of Metallized Food Packaging Plastics with Different Concentrations of ZSM-5 Zeolite Catalyst. Polymers 2021, 13, 702. [Google Scholar] [CrossRef]
  40. Wang, S.; Wang, Q.; Hu, Y.M.; Xu, S.N.; He, Z.X.; Ji, H.S. Study on the Synergistic Co-Pyrolysis Behaviors of Mixed Rice Husk and Two Types of Seaweed by a Combined TG-FTIR Technique. J. Anal. Appl. Pyrolysis 2015, 114, 109–118. [Google Scholar] [CrossRef]
  41. Zhao, C.; Jiang, E.; Chen, A. Volatile Production from Pyrolysis of Cellulose, Hemicellulose and Lignin. J. Energy Inst. 2017, 90, 902–913. [Google Scholar] [CrossRef]
  42. Eimontas, J.; Striūgas, N.; Zakarauskas, K.; Navickas, K.; Venslauskas, K. Synergetic Approach for Energy Recovery from Coastal Wastes Based on Combination of Biological and Thermal Treatment. Environ. Technol. 2021, 43, 2755–2770. [Google Scholar] [CrossRef] [PubMed]
  43. Acomb, J.C.; Wu, C.; Williams, P.T. The Use of Different Metal Catalysts for the Simultaneous Production of Carbon Nanotubes and Hydrogen from Pyrolysis of Plastic Feedstocks. Appl. Catal. B Environ. 2016, 180, 497–510. [Google Scholar] [CrossRef] [Green Version]
  44. Ma, Z.; Gao, N.; Xie, L.; Li, A. Study of the Fast Pyrolysis of Oilfield Sludge with Solid Heat Carrier in a Rotary Kiln for Pyrolytic Oil Production. J. Anal. Appl. Pyrolysis 2014, 105, 183–190. [Google Scholar] [CrossRef]
  45. Su, B.; Han, W.; He, H.; Jin, H.; Yang, S.; Zhang, X. Mechanism and Experimental Validation of a Thermochemical Energy Conversion Process by Utilization of Biogas Chemical Energy. Energy Convers. Manag. 2020, 214, 112827. [Google Scholar] [CrossRef]
  46. Ng, H.M.; Saidi, N.M.; Omar, F.S.; Ramesh, K.; Ramesh, S.; Bashir, S. Thermogravimetric Analysis of Polymers. In Encyclopedia of Polymer Science and Technology; Wiley: Hoboken, NJ, USA, 2018. [Google Scholar]
  47. Lin, H.; Wang, S.; Zhang, L.; Ru, B.; Zhou, J.; Luo, Z. Structural Evolution of Chars from Biomass Components Pyrolysis in a Xenon Lamp Radiation Reactor. Chin. J. Chem. Eng. 2017, 25, 232–237. [Google Scholar] [CrossRef]
  48. Xin, S.; Yang, H.; Chen, Y.; Yang, M.; Chen, L.; Wang, X.; Chen, H. Chemical Structure Evolution of Char during the Pyrolysis of Cellulose. J. Anal. Appl. Pyrolysis 2015, 116, 263–271. [Google Scholar] [CrossRef]
  49. Zhang, Y.; Ji, G.; Chen, C.; Wang, Y.; Wang, W.; Li, A. Liquid Oils Produced from Pyrolysis of Plastic Wastes with Heat Carrier in Rotary Kiln. Fuel Process. Technol. 2020, 206, 106455. [Google Scholar] [CrossRef]
  50. Eimontas, J.; Yousef, S.; Striūgas, N.; Abdelnaby, M.A. Catalytic Pyrolysis Kinetic Behaviour and TG-FTIR-GC–MS Analysis of Waste Fishing Nets over ZSM-5 Zeolite Catalyst for Caprolactam Recovery. Renew. Energy 2021, 179, 1385–1403. [Google Scholar] [CrossRef]
  51. Mumbach, G.D.; Alves, J.L.F.; Da Silva, J.C.G.; De Sena, R.F.; Marangoni, C.; Machado, R.A.F.; Bolzan, A. Thermal Investigation of Plastic Solid Waste Pyrolysis via the Deconvolution Technique Using the Asymmetric Double Sigmoidal Function: Determination of the Kinetic Triplet, Thermodynamic Parameters, Thermal Lifetime and Pyrolytic Oil Composition for Clean. Energy Convers. Manag. 2019, 200, 112031. [Google Scholar] [CrossRef]
  52. Miao, P.; Li, K.; Fan, J.; Xu, N.; Zhu, X.; Li, C. Efficient Ring-Opening Reaction of Tetralin over Nanosized ZSM-5 Zeolite: Effect of SiO2/Al2O3 Ratio and Reaction Condition. Energy Fuels 2019, 33, 9480–9490. [Google Scholar] [CrossRef]
  53. Chen, L.; Cui, W.; Li, J.; Wang, H.; Dong, X.; Chen, P.; Zhou, Y.; Dong, F. The High Selectivity for Benzoic Acid Formation on Ca2Sb2O7 Enables Efficient and Stable Toluene Mineralization. Appl. Catal. B Environ. 2020, 271, 118948. [Google Scholar] [CrossRef]
  54. Bento, C.; Gonçalves, A.C.; Jesus, F.; Simões, M.; Silva, L.R. Phenolic Compounds: Sources, Properties and Applications. In Bioactive Compounds: Sources, Properties and Applications; Nova Science Pub Inc.: Hauppauge, NY, USA, 2017; ISBN 9781536124248. [Google Scholar]
  55. Shahidi, F.; Ambigaipalan, P. Phenolics and Polyphenolics in Foods, Beverages and Spices: Antioxidant Activity and Health Effects—A Review. J. Funct. Foods 2015. [CrossRef]
  56. Novais, C.; Pereira, C.; Molina, A.K.; Liberal, Â.; Dias, M.I.; Añibarro-Ortega, M.; Alves, M.J.; Calhelha, R.C.; Ferreira, I.C.F.R.; Barros, L. Bioactive and Nutritional Potential of Medicinal and Aromatic Plant (Map) Seasoning Mixtures. Molecules 2021, 26, 1587. [Google Scholar] [CrossRef] [PubMed]
  57. Nakaji, Y.; Tamura, M.; Miyaoka, S.; Kumagai, S.; Tanji, M.; Nakagawa, Y.; Yoshioka, T.; Tomishige, K. Low-Temperature Catalytic Upgrading of Waste Polyolefinic Plastics into Liquid Fuels and Waxes. Appl. Catal. B Environ. 2021, 285, 119805. [Google Scholar] [CrossRef]
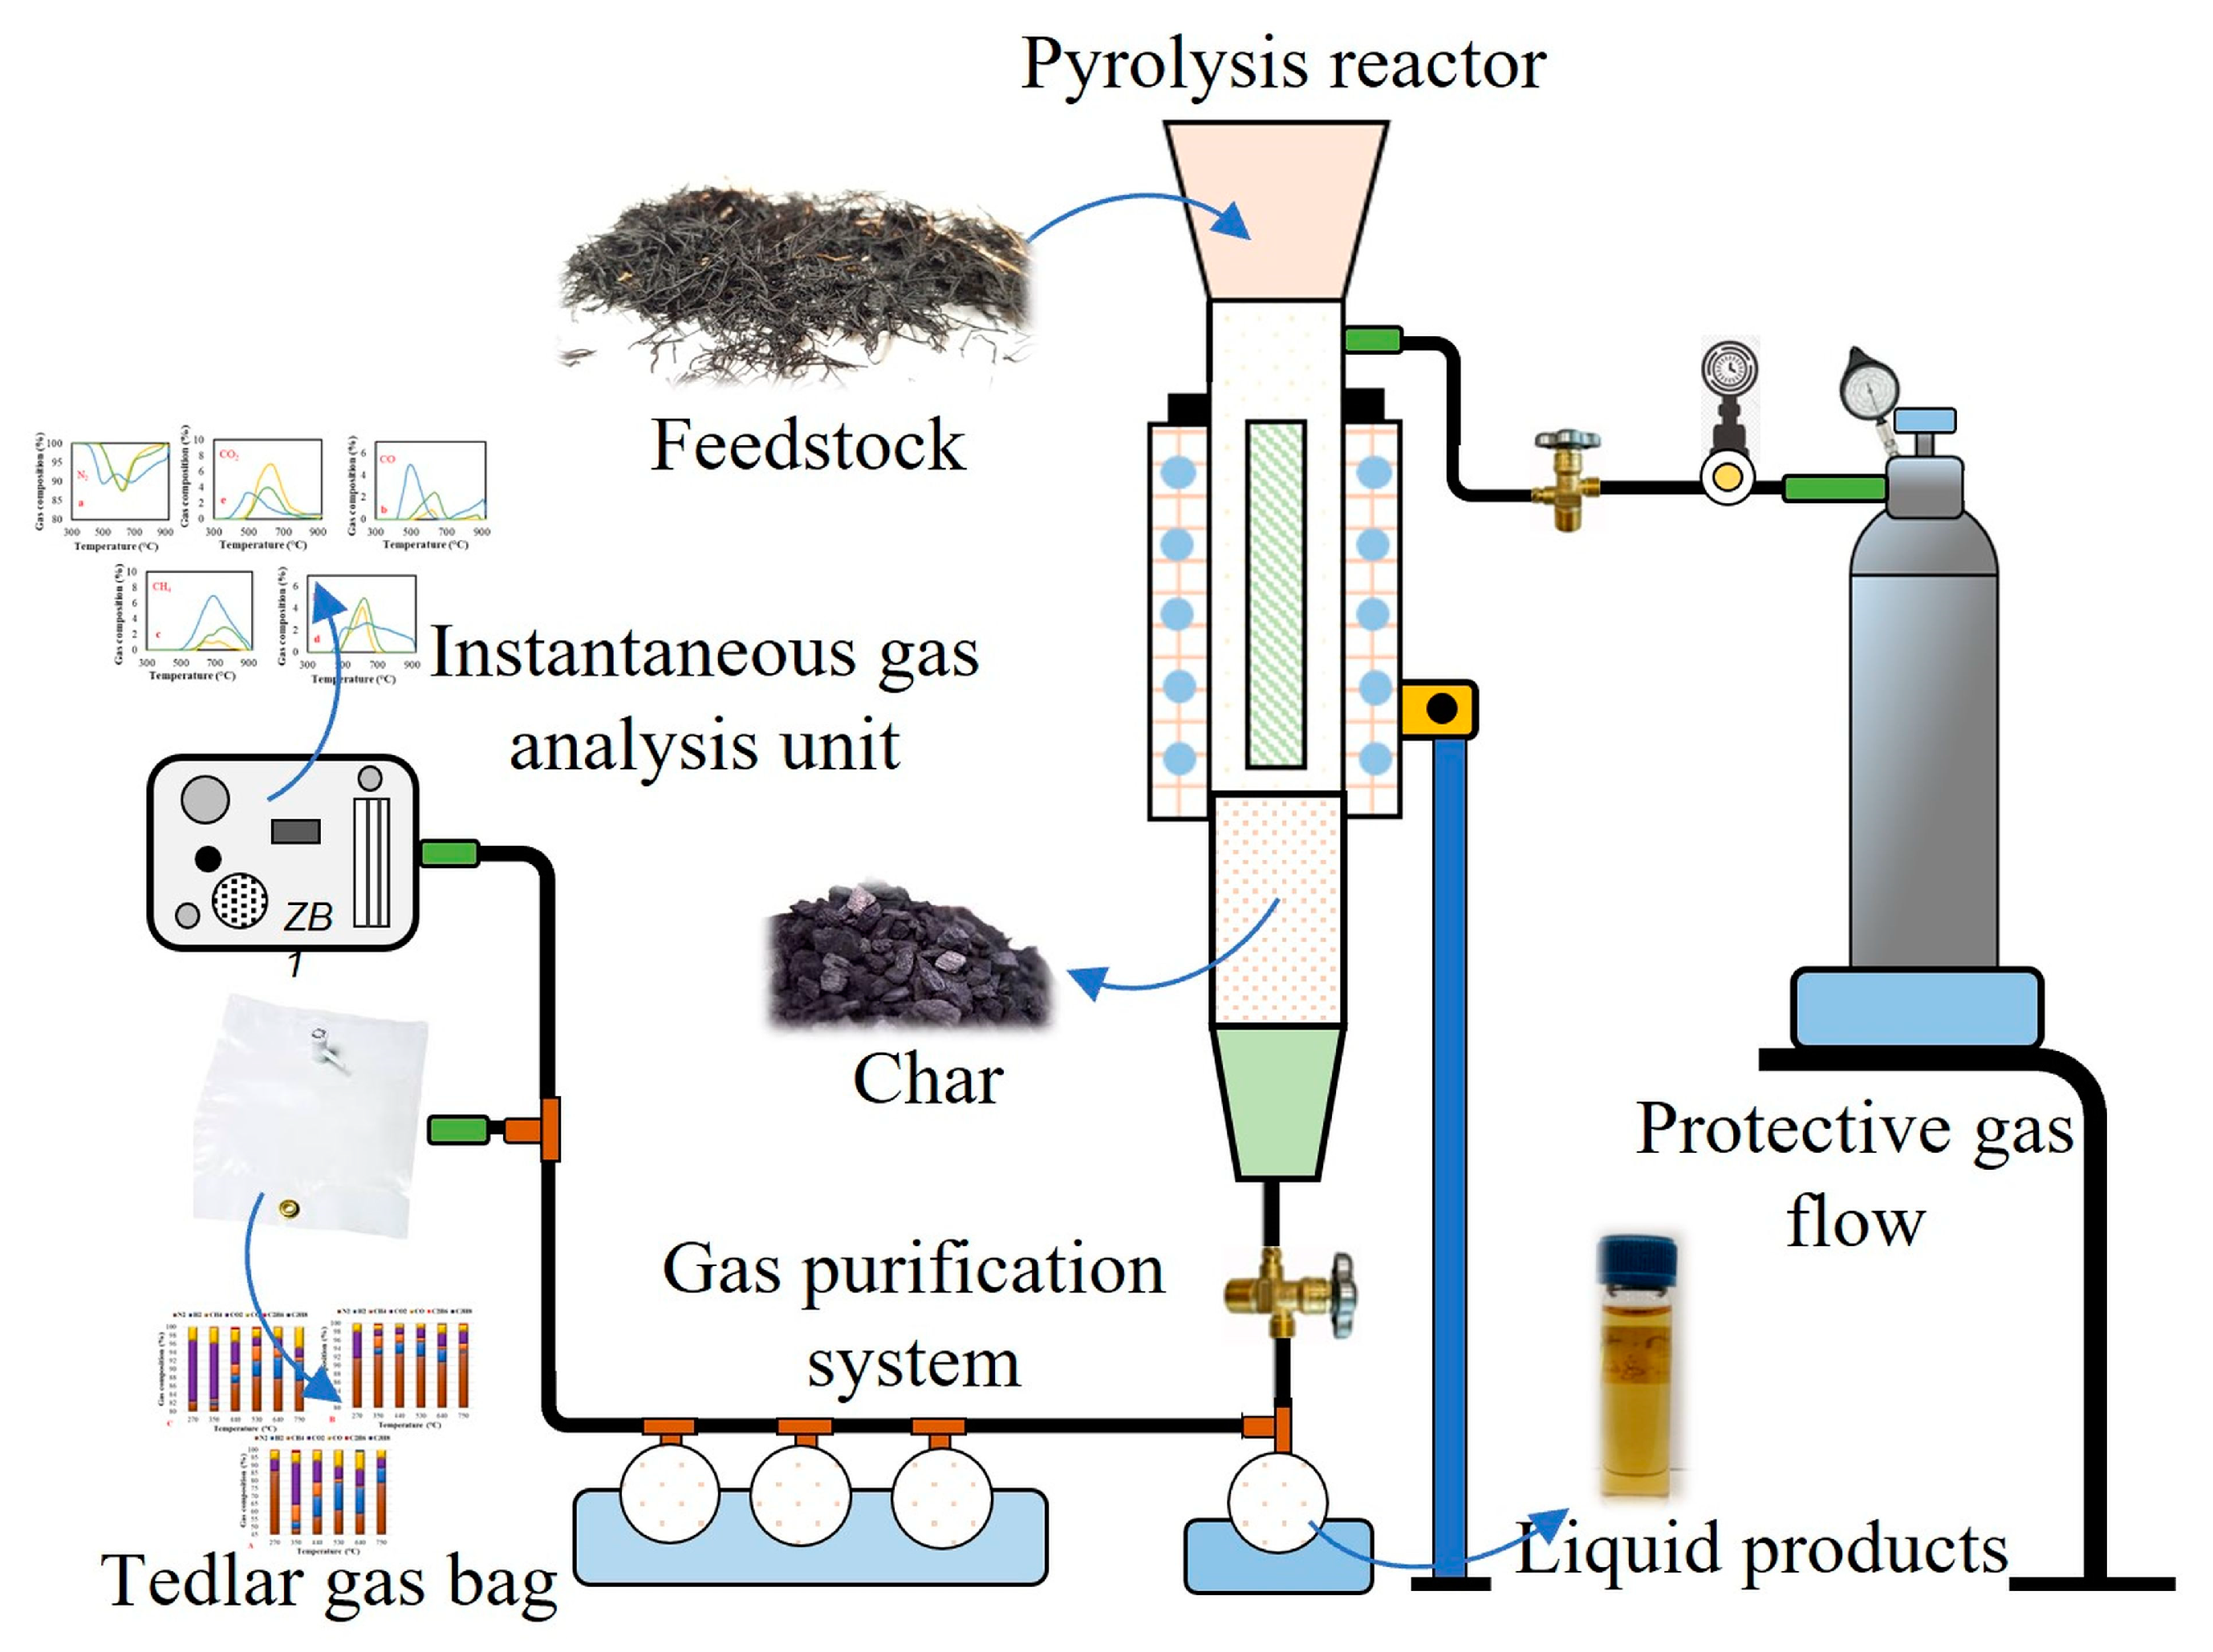
Figure 1. Laboratory-scale pyrolysis plant used for the conversion.
Energies 16 03457 g001
Figure 2. FTIR spectra of the investigated seaweed feedstock.
Energies 16 03457 g002
Figure 3. TGA (A) and DTG (B) curves of the seaweed sample.
Energies 16 03457 g003
Figure 4. Functional group analysis curves from the TGA-FTIR system.
Energies 16 03457 g004
Figure 5. Gaseous product composition during the entire process.
Energies 16 03457 g005
Figure 6. Gaseous product analysis by GC/MS.
Energies 16 03457 g006aEnergies 16 03457 g006b
Figure 7. Liquid product analysis by the GC/MS.
Energies 16 03457 g007
Figure 8. Reactions to convert benzoic acid to toluene.
Energies 16 03457 g008
Figure 9. FTIR spectra of solid products by seaweed pyrolysis. (AC) Pyrolysis temperatures of 500 °C, 700 °C, and 900 °C, respectively.
Energies 16 03457 g009
Table 1. ZSM-5 and Y-Type properties.
ZSM-5Y-Type
SiO2/Al2O3SiO2/Al2O3
Molar ratio—38Molar ratio—>5
Specific surface area—≥250 m2/gSpecific surface area—≥578 m2/g
Pore volume (≥0.25 mL/g)Unit cell size (<2.453 nm)
Dimension (Φ2 × 2–10 mm)Particle size distribution D50 (<6 µm)
Bulk density (0.72 kg/L)Bulk density (0.68 kg/L)
Crushing strength (≥98 N/cm2)Crushing strength (≥142 N/cm2)
Table 2. Sample characterisation.
Parameter, d.b.Seaweed
Carbon, wt.%46.93 ± 0.05
Hydrogen, wt.%4.73 ± 0.06
Nitrogen, wt.%4.13 ± 0.14
Oxygen, wt.% (diff.)30.16 ± 0.51
Chloride, wt.%0.05 ± 0.01
Sulphur, wt.%5.13 ± 0.23
Volatiles, wt.%58.30 ± 0.19
Ashes, wt.%8.87 ± 0.04
Moisture, wt.%0.55 ± 0.01
Fixed carbon, wt.%32.23 ± 0.15
LHV, MJ/kg16.51 ± 0.07
Table 3. Yields of the formed pyrolysis products.
SampleLiquids, wt.%Gasses, wt.%Solids, wt.%
Seaweed 500 °C20.2232.5147.27
Seaweed 700 °C19.3342.4538.22
Seaweed 900 °C18.2747.4434.30
Seaweed 500 °C ZSM-524.0434.6641.30
Seaweed 700 °C ZSM-521.9739.7238.31
Seaweed 900 °C ZSM-519.8145.5534.64
Seaweed 500 °C Y-Type25.8729.6244.51
Seaweed 700 °C Y-Type22.2139.1938.60
Seaweed 900 °C Y-Type20.5344.2235.25
Disclaimer/Publisher’s Note: The statements, opinions and data contained in all publications are solely those of the individual author(s) and contributor(s) and not of MDPI and/or the editor(s). MDPI and/or the editor(s) disclaim responsibility for any injury to people or property resulting from any ideas, methods, instructions or products referred to in the content.