1. Introduction
The unconventional resources addressed in this study include a midcontinent shallow heavy oil, an Asphalt Ridge tar sand oil, three mid-continent oil shales, and a Piceance Basin oil shale. The commonality in these unconventional resources is that a high temperature superheat steam represents a potential method of surface or in situ recovery.
The heavy oil sample studied was from Grassy Creek, Missouri. The formation depth varied from 100′–200′. There are a number of similar small oil accumulations of this type in eastern Kansas and western Missouri. In several of these fields, conventional steam flood has been attempted, without economic success. Only two field operations in the area enjoyed economic success and this stimulation utilized a superheat steam with CO
2 [
1]. The API gravity of oils in this area ranged between 10–13. Because of the shallow depth and the limitations on injection pressure, the saturated steam temperature will be 150–180 °C, which is correlated with a heated oil viscosity [
2], higher than 10 cp, which does not provide good relative mobility, as connate water occurs with the oil. Superheat steam does not have this temperature limitation and connate water can be vaporized to expel pore-trapped oil.
Tar sands are defined as oils of API 10 degrees or lower. Globally, the largest tar sand deposits are found in Canada (primarily in Alberta), Venezuela, and several countries in the Middle East. The majority of U.S. tar sand resources are located in eastern Utah, with an estimated 12 billion–19 billion barrels of reserves [
3], and Asphalt Ridge is included in this region. Depending on the specific oil, a temperature of around 260 °C or higher is needed for economic oil production within the reservoir.
Shale is a sedimentary rock and is the most abundant rock form. It consists of fine grain particles of mainly clay, quartz, feldspar, and iron oxides, as well as other lesser components. Oil shale represents a huge hydrocarbon resource that has only recently been exploited, mainly due to the difficulty of extraction. However, with higher oil prices, and the advent of horizontal drilling and fracking, more shale oil is coming into production. Commercial oil shale contains from around 15–25% organic matter. Many countries throughout the world enjoy large deposits of oil shale, but among the largest are in the Green River Formation in western Colorado, Southern Wyoming, and eastern Utah. In fact, it is estimated that the amount of recoverable oil from this formation exceeds the proven global conventional crude oil reserves [
4].
The origin of oil contained in oil shale is primarily algae and plankton, but other sources can contribute to an oil origin. While the total oil contained in shale is huge, only a fraction of the resource is considered economically recoverable, as API gravity can be quite low, and is sometimes even negative. Factors that influence economics include oil saturation, depth, permeability of formation, value of product, and distance to refining and marketing. In consideration of the current elevated price of oil, it is reasonable to consider methods of extraction that could be feasible. One of the primary extraction methods is to mine the deposits and carry out processing on the surface. Techniques include solvent extraction and heat extraction. There have been considerable efforts to extract the oil in-situ, so that the cost of mining and spent shale disposal can be avoided. However, because of the typically low permeability of shales, in situ processes have not been highly successful. If a solvent is injected, then solvent recovery is a problem. If steam heat is injected, then the liquid fraction of saturated steam wets solid particles and forms a meniscus between the fine grains, which inhibits injection. Recent attempts at recovery have utilized thermal conduction to heat the formation so that oil can be released from mineral matter. This approach entails drilling on a very tight spacing of ~20′.
A DOE contract examined the injection of superheated steam into Piceance Basin oil shale [
5,
6]; the idea of this was that the leach zone was suitable for superheat steam injection. The project included both laboratory and field testing. Laboratory results indicated that oil quality improved with a higher temperature superheated steam, and a longer “soaking” time. Field experiments were plagued by a poor equipment performance and the difficulty in delivering high volumes of superheated steam downhole.
A laboratory study examined the modeling of in situ retorting of oil shale by super-heated steam injection [
7] based on a large-scale surface retort and laboratory autoclave studies. From the autoclave studies of Green River Formation shale subject to flowing superheated steam, at temperatures above 371 °C, the oil was found to crack, with the off-gas composition being mainly methane, followed by ethane and hydrogen. This study also indicated that residue liquids tended to be lower molecular weight hydrocarbons compared with the original oil.
This previous work supports the approach of in situ recovery by the injection of superheated steam, where condensation does not occur near wellbore, so that a larger volume can be heated to initiate huff-and-puff production. This approach leads to further exploration of oil shale pyrolysis, where both heated liquids and lighter hydrocarbon gases, as a consequence of pyrolysis, can be expected. Thus, it is the objective of the current effort to examine the gases produced and the temperature at which these gases evolve. It is recognized that this laboratory approach does not accurately mimic in situ conditions, in that pyrolysis testing was conducted at atmospheric pressure instead of downhole injection pressure. From pyrolysis studies of biomass, it has been observed that pressure reduces the required pyrolysis temperatures and also reduces PAH formation [
8,
9]. Therefore, the setting for the present study is a preliminary look at what might be expected from unconventional oil resource stimulation via superheated steam.
From previous work, it was found that the mass spectrometer used included an ionizing prechamber, which had the effect of breaking down some of the lighter alkane hydrocarbon gases to produce hydrogen, preceding MS, thus indicating a false reading. Consequently, for the present work, hydrogen was quantified by gas chromatography. The hydrocarbon alkanes are simply indicated by the number of carbons in the chain, i.e., C1−C6. The false hydrogen reading became apparent in a previous study of Grassy Creek oil [
10], which is the reason the oil was re-tested utilizing gas chromatography for hydrogen measurement, and the results are shown here.
In summary, it is the purpose of this work, to show the potential application of superheated steam for the recovery of oil from unconventional resources, and to additionally address the potential for the off gases to be useful for either boiler fuel, or for the recovery of valuable by products with a significant market value, i.e., hydrogen.
2. Experimental Details
Seven samples were obtained from various sources, including crude oil (Grassy Creek), tar sands (Asphalt Ridge), and oil shale (Pennsylvanian, Woodford, Chattanooga, (two samples), and the Piceance Basin). The crude oil, tar sand, and shale samples were subjected to pyrolysis under humid carbon dioxide to qualitatively determine the hydrocarbon off-gas species (via mass spectrometry (MS)), and to provide a semi-quantitative measure of the hydrogen produced (via gas chromatography (GC)). Additionally, the Grassy Creek oil testing was initially carried out in argon purge to identify when pyrolysis began and the off-gas composition, and to compare the results to humid carbon dioxide purge gas. This purge gas was chosen for most of the tests as this choice was consistent with a direct contact superheater utilizing oxygen as the oxidizer.
Thermal analysis was conducted using an STA 409 CD from Netzsch Instruments (Selb, Germany). The instrument simultaneously measured a thermogravimetric (TG) signal and a differential scanning calorimetric (DSC) signal while heating the sample in a controlled gaseous environment. Samples of between 20 and 40 mg were loaded into alumina cups ca. 6 mm outer diameter and volume ca. 80 micro-liters. A mass spectrometer (MS, Hiden Analytical HPR-20, Warrington UK) was connected into the vent line downstream of the thermal analyzer furnace via a heated capillary in order to detect the gases that evolved from the samples. For experiments under humid carbon dioxide, carbon dioxide gas was flowed at 90 mL/min through a saturator filled with deionized water, and maintained at 25 °C prior to entering the thermal analyzer. An additional stream of dry argon (10 mL/min) was passed through the instrument to prevent moisture from passing into the electronics. Once the gas flows had stabilized, experiments were started at 25 °C, and the sample was heated at 10 °C/min to 500 °C, then held at 500 °C for 8 h. Runs conducted under dry argon used ultra-high purity argon, which was passed through the thermal analyzer at 100 mL/min. The experiments were started at 25 °C, and the sample was heated at 10 °C/min to 1000 °C. Some TG, differential thermal analysis (DTA), and MS analyses were carried out under 100 mL/min dry helium flow (ultra-high purity) using an STA 409CD with built-in mass spectrometer (“Skimmer” instrument from Netzsch Instruments, Selb, Germany). Experiments started at 25 °C, and the sample was heated at 10 °C/min to 500 °C.
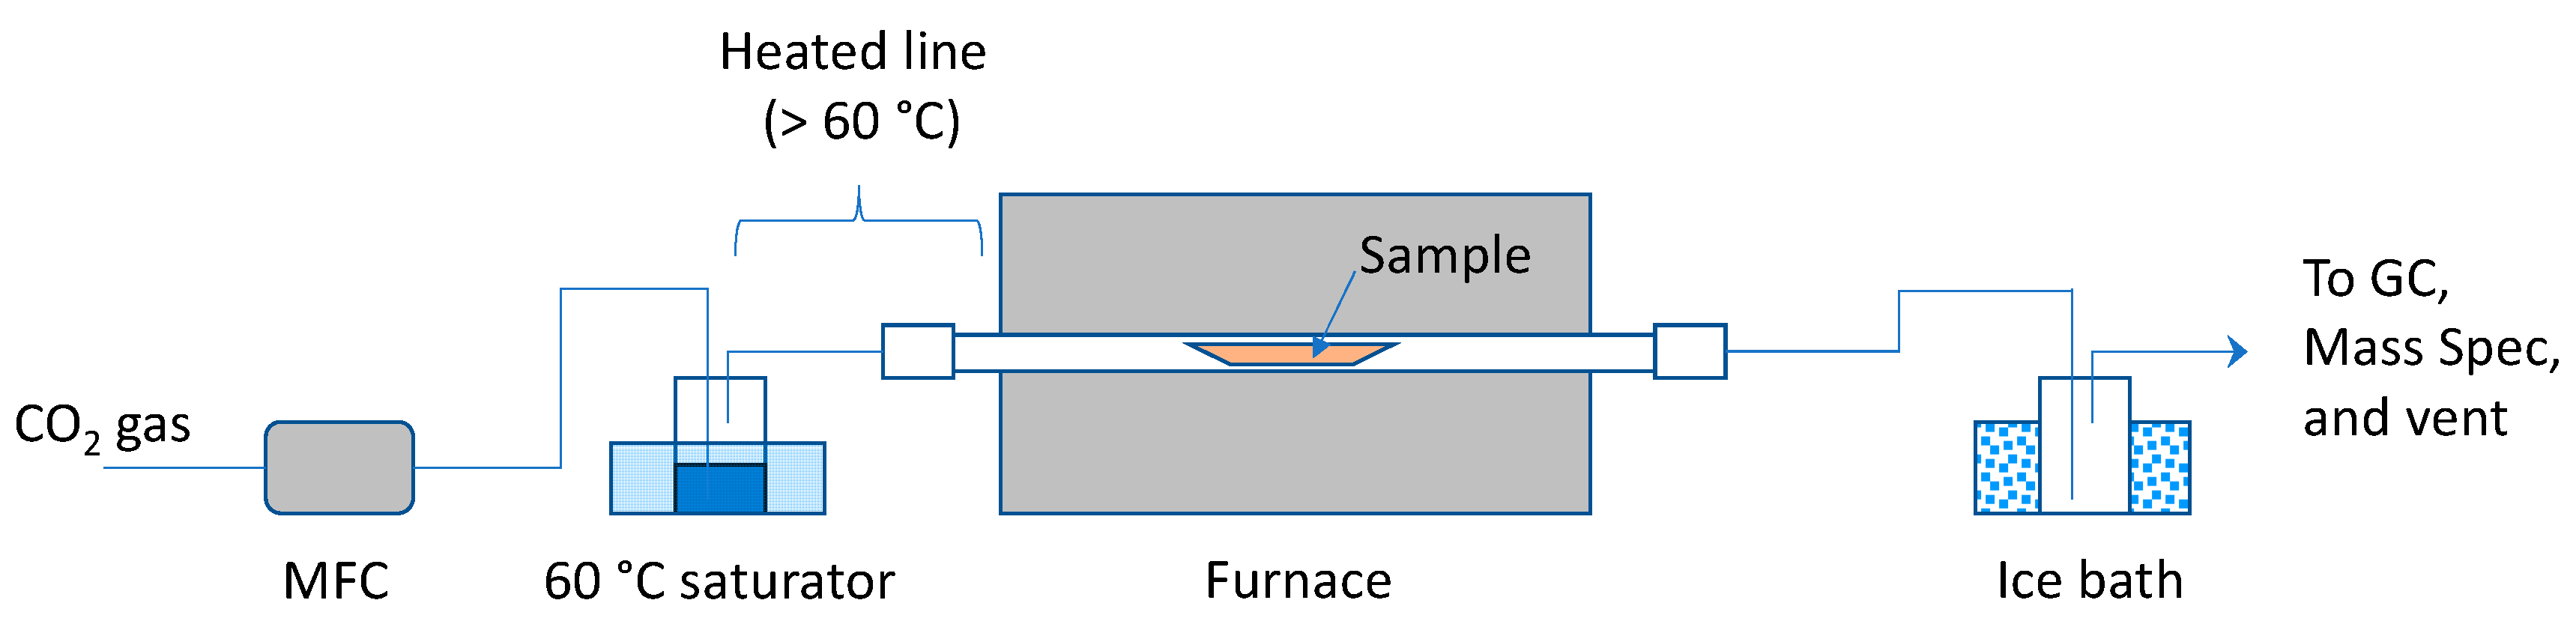
The experimental setup for larger scale pyrolysis in a tube furnace is illustrated in
Figure 1. Carbon dioxide (UHP grade) was fed via a mass flow controller (MFC) at 75 mL/min (sccm) CO
2, which was passed through a sparger containing H
2O and was maintained at 60 °C. Humid CO
2 passed through a quartz glass tube containing the sample within a furnace. The exiting gas passed through a chilled vessel to knock out the majority of water vapor. The gas composition was monitored by MS and GC (Agilent 3000A micro-GC, Santa Clara, CA, USA). The entire system operated at ambient pressure. For the control experiments, CO
2 was replaced by argon, with the saturator bypassed in one experiment with Grassy Creek oil. For all of the experiments, the furnace temperature increased from 25 °C to 500 °C at a rate of 5 °C/min, and it was held at 500 °C for 3 h. This temperature plateau was chosen as higher temperatures in field operations entailed higher strength injection tubulars at an additional cost and limited availability.
3. Results and Discussion
For the following results, it can be noted that the Grassy Creek and Asphalt ridge oils did not contain solids, whereas the shale oils were contained within the shale matrix.
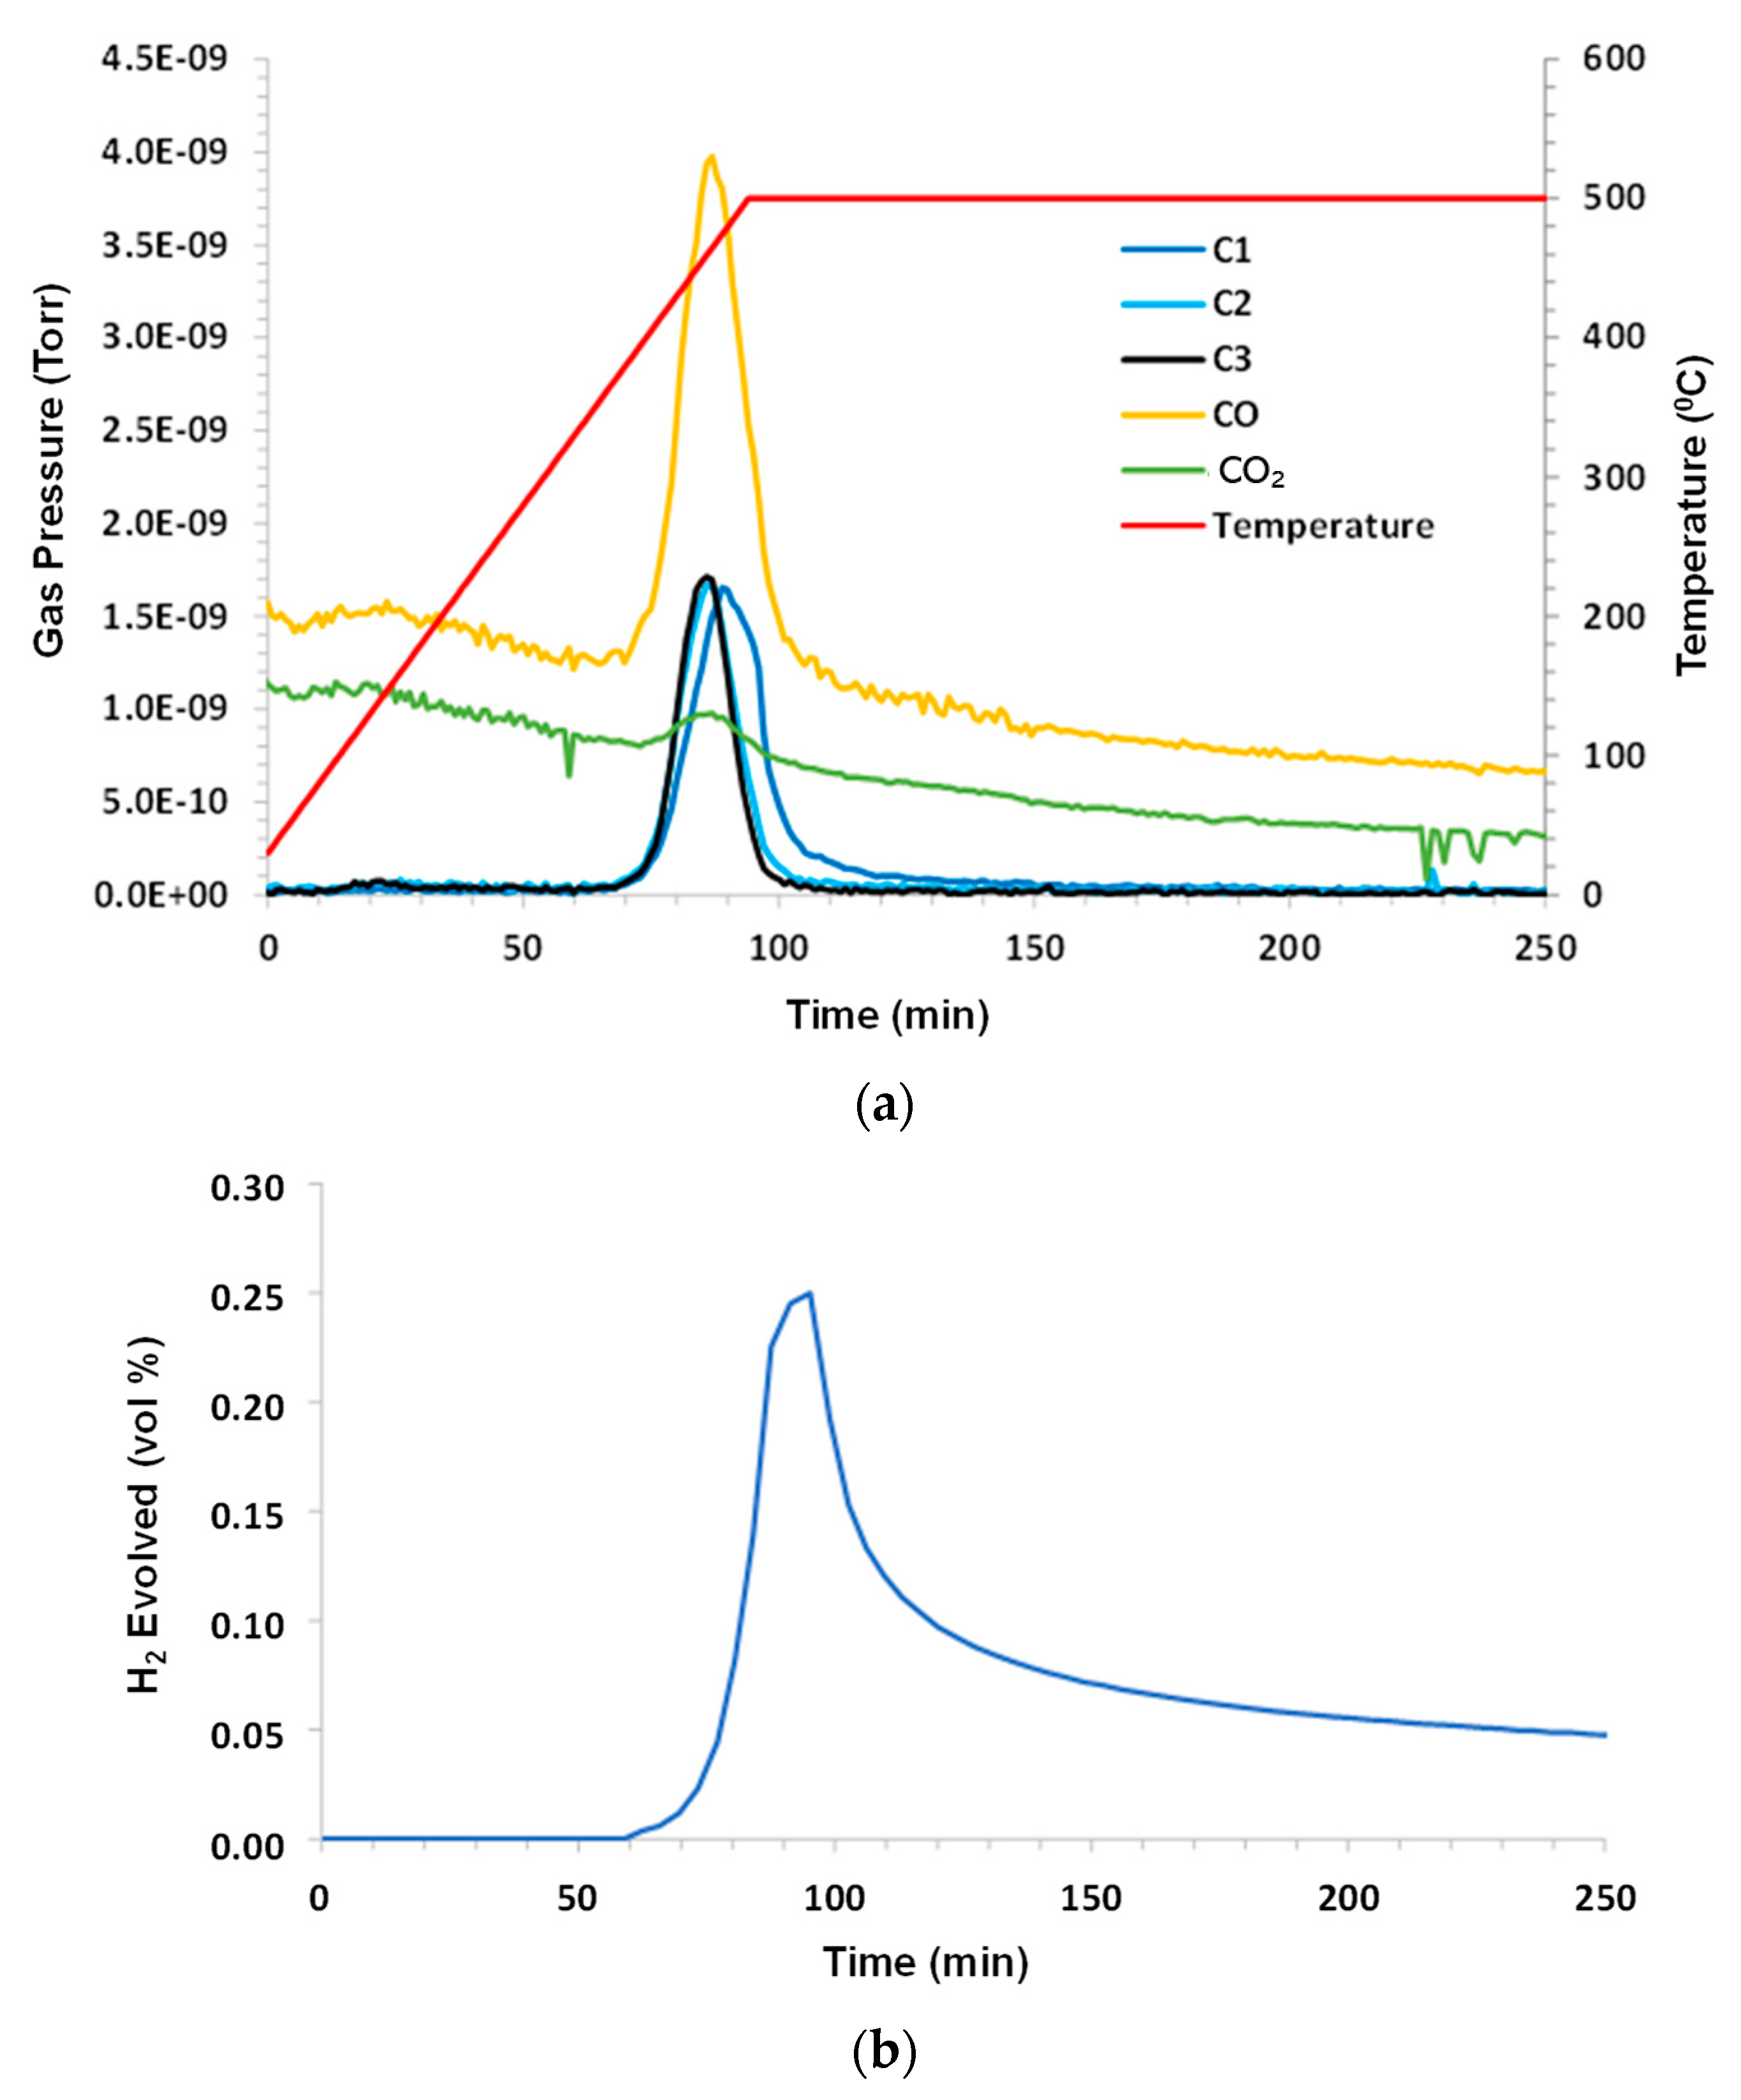
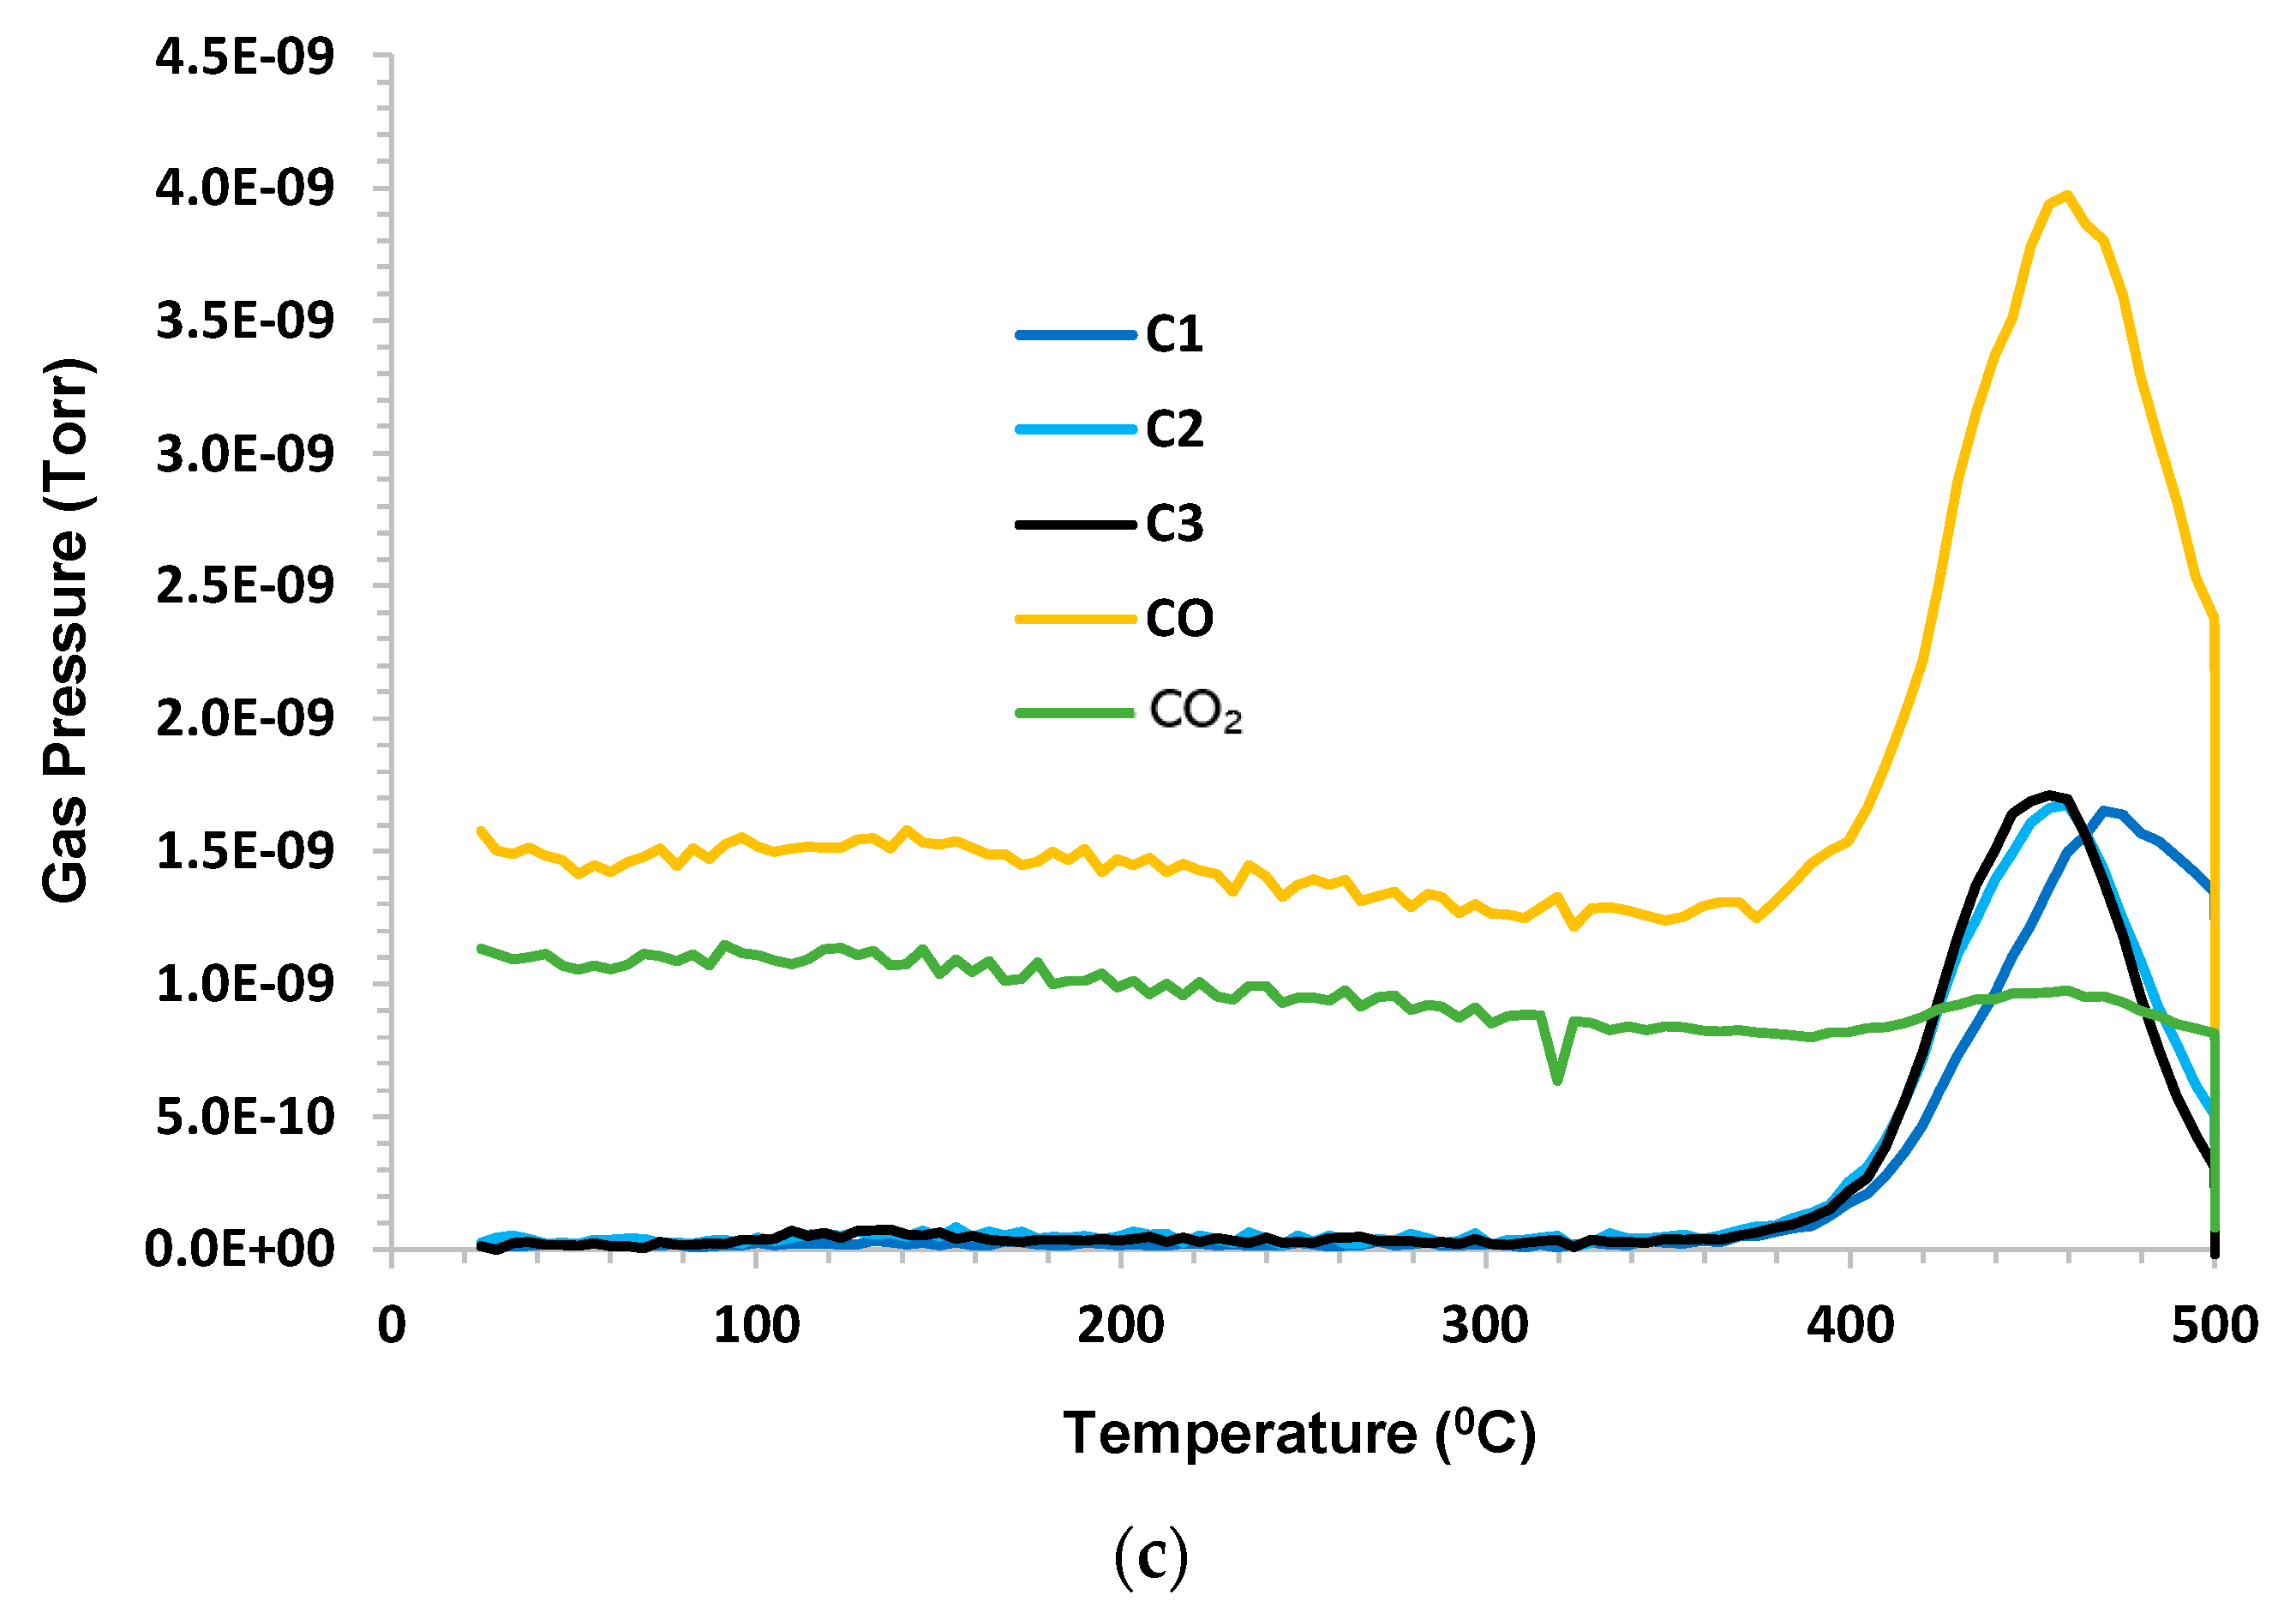
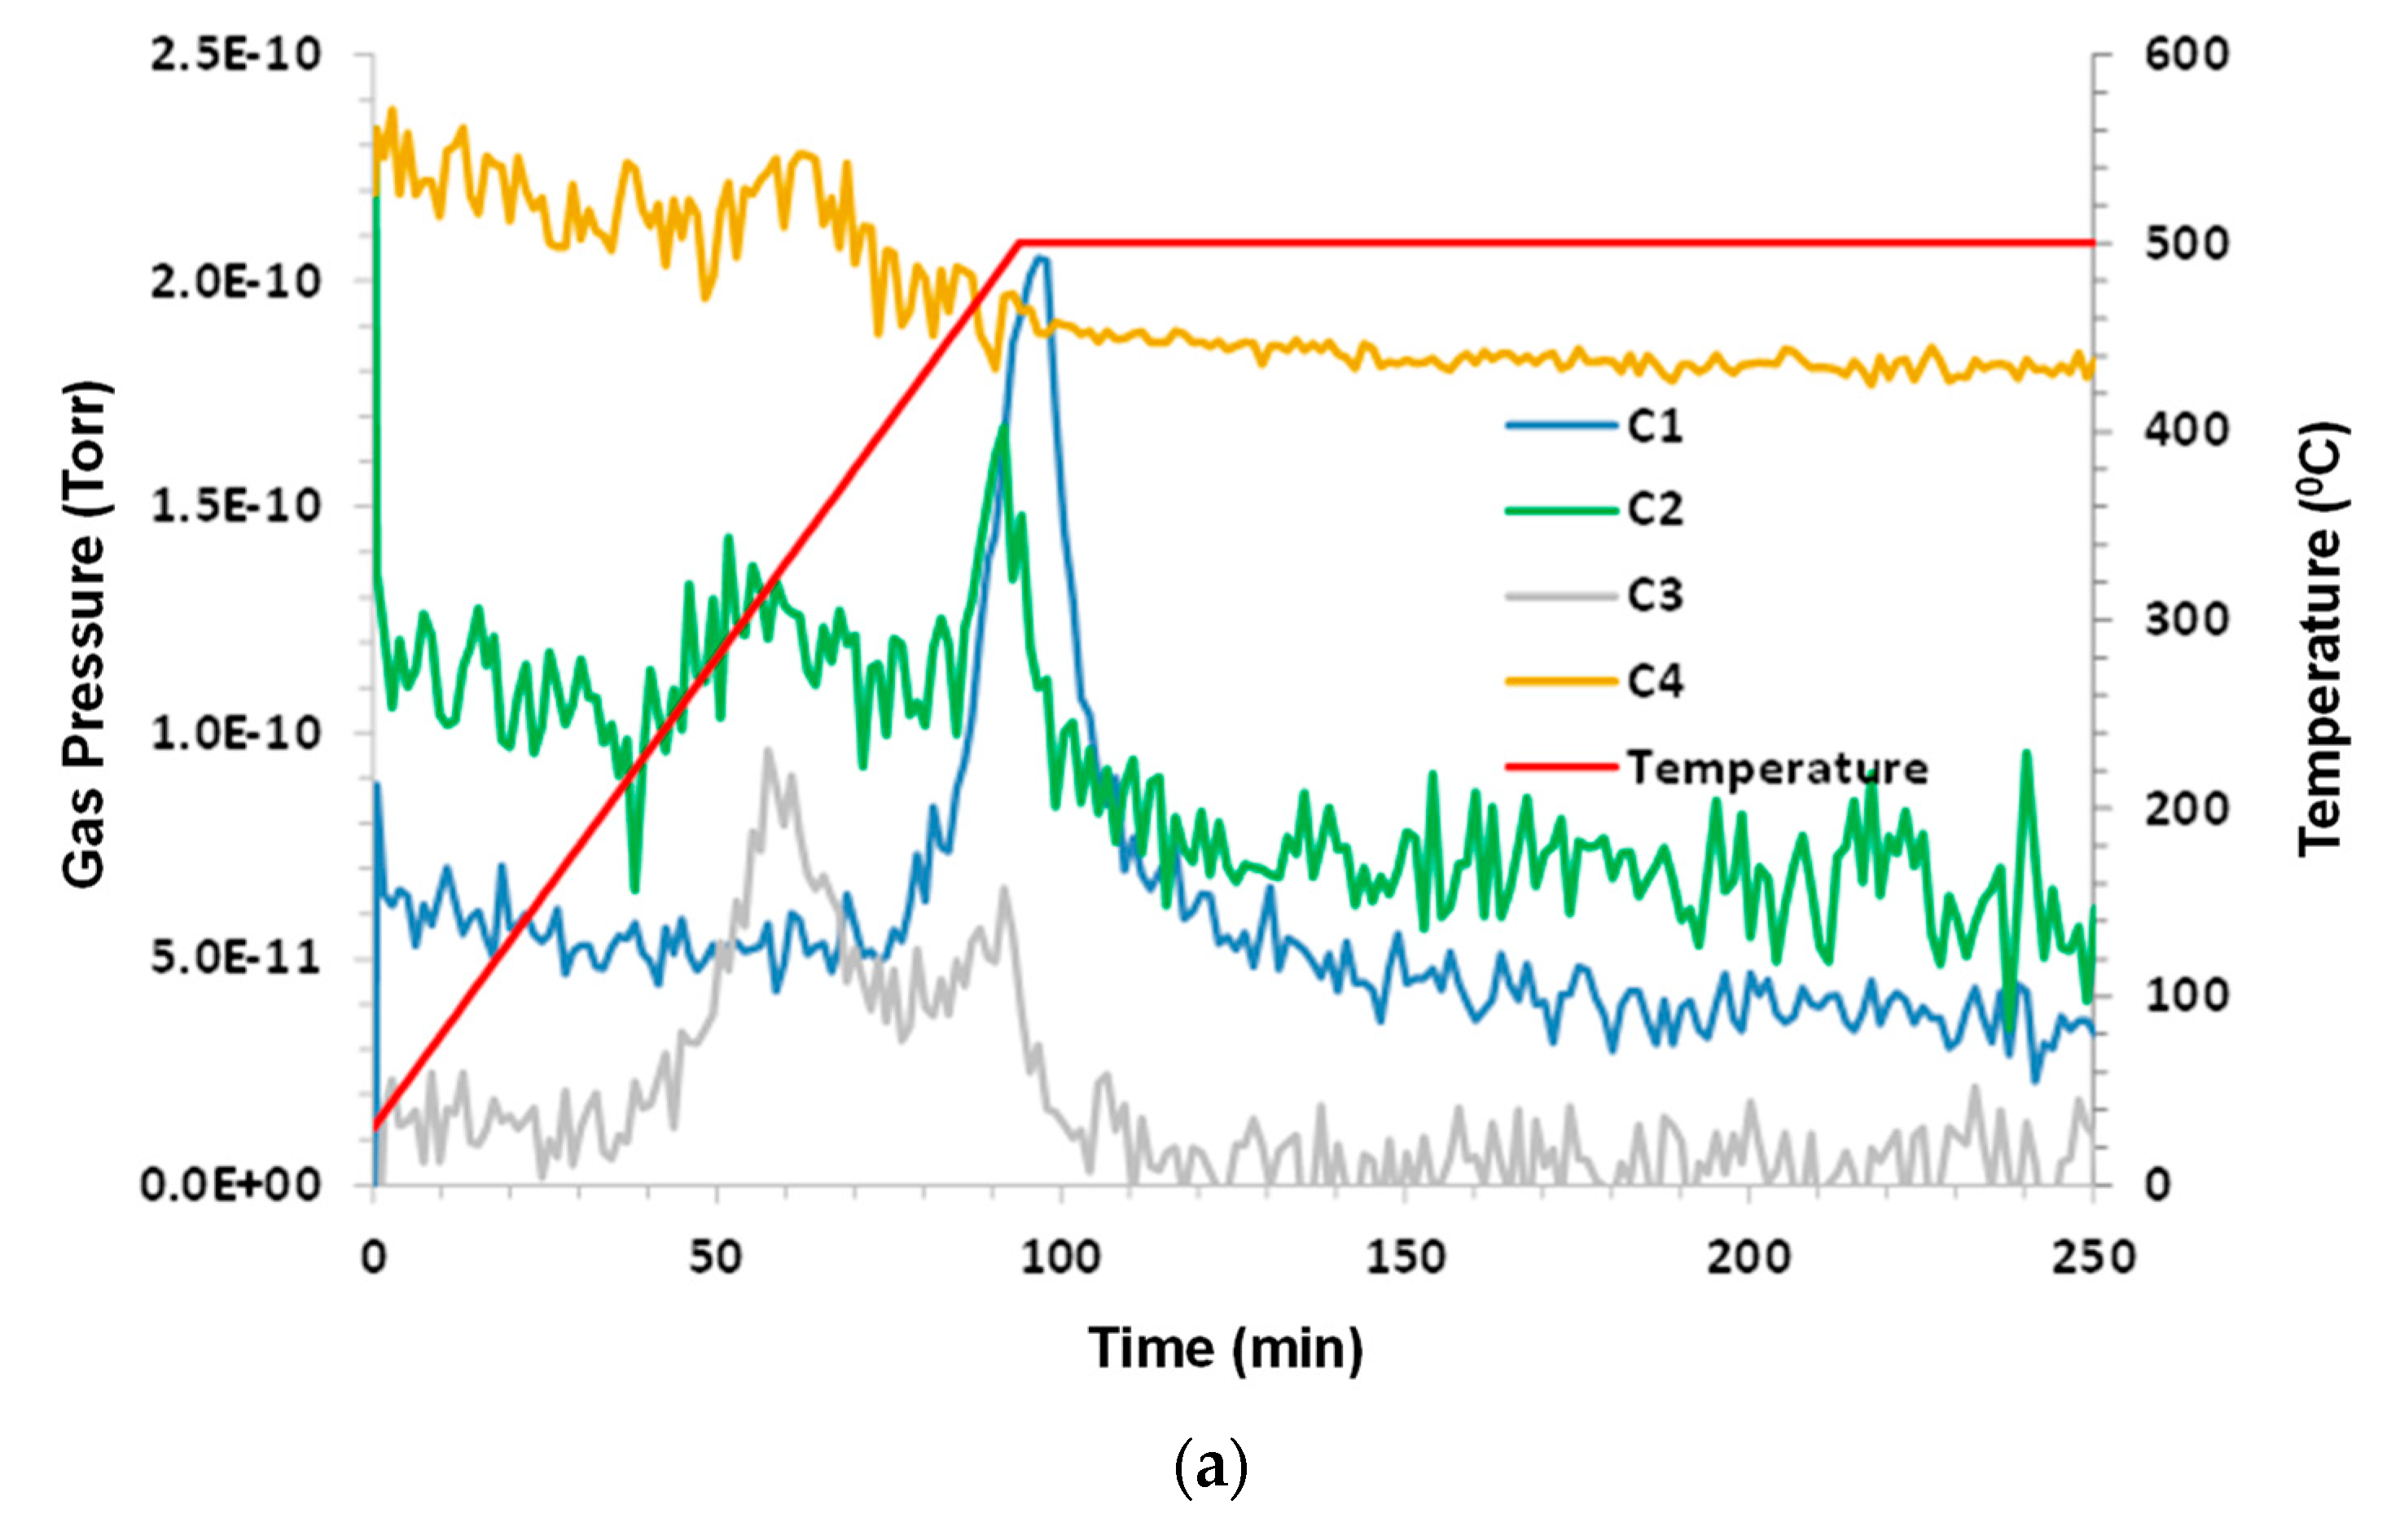
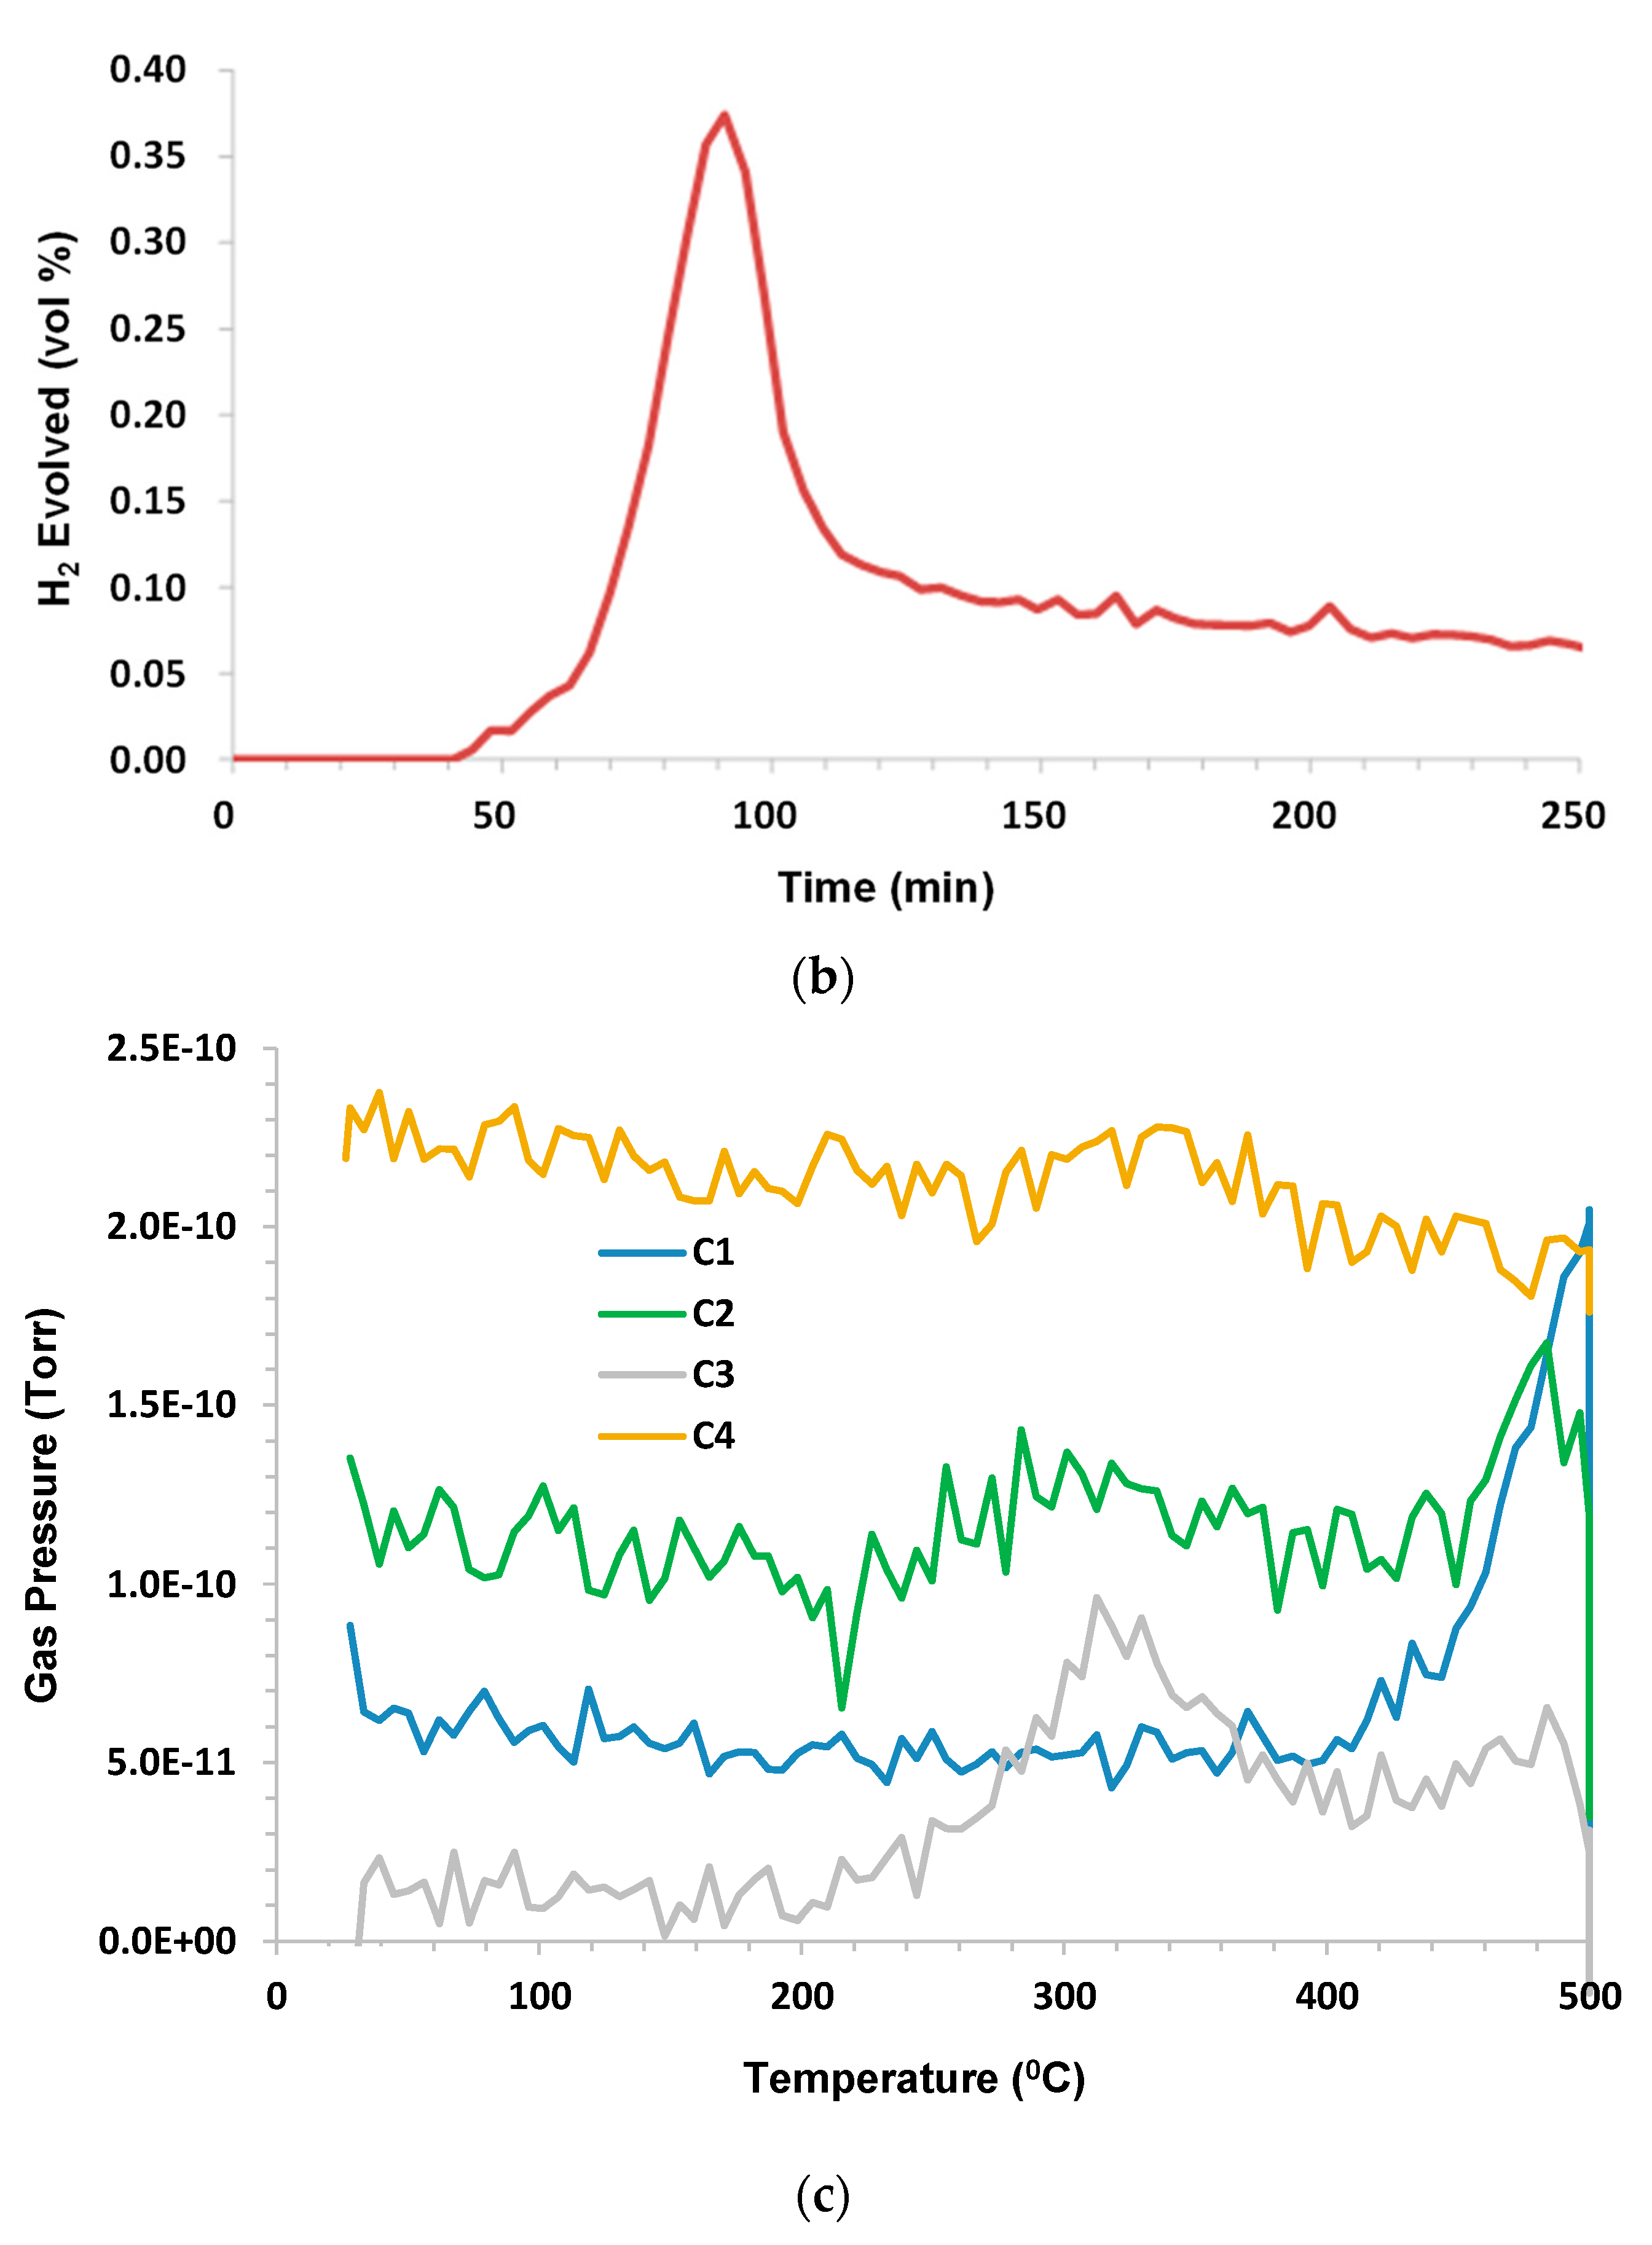
3.1. Grassy Creek with Argon Purge
A control experiment used dry argon purge gas at a flow rate 140 sccm (standard cubic centimeters per minute). The sample mass was 1.68 g. Under inert pyrolysis conditions, C1–C3 hydrocarbons evolved at T > 360 °C (higher hydrocarbons were not monitored). C1 lagged behind C2 and C3. A small amount of CO
2 and a significant amount of CO were noted. H
2O (not shown) exhibited a similar peak to CO. The hydrogen evolution peak mirrored the other species and remained elevated during 500 °C hold. The results are shown in
Figure 2a–c.
When looking closely at these figures, it is interesting to note that the hydrogen production profile mimics the profiles for C1, C2, and C3, although there is a slight delay in the C1 peak. It can be speculated that the C-H bond strength is higher for C1 than for C2 and C3, and these may be the source of hydrogen that is produced. As both CO2 and CO appear in products and because argon is pure, it can be presumed that the oxygen source is either that which is sourced from atomic oxygen attachment to a produced crude oil chain, or from the solubility of oxygen into crude oil when it has been exposed to air or from the decomposition of carbon dioxide or water as a result of the MS ionizing prechamber.
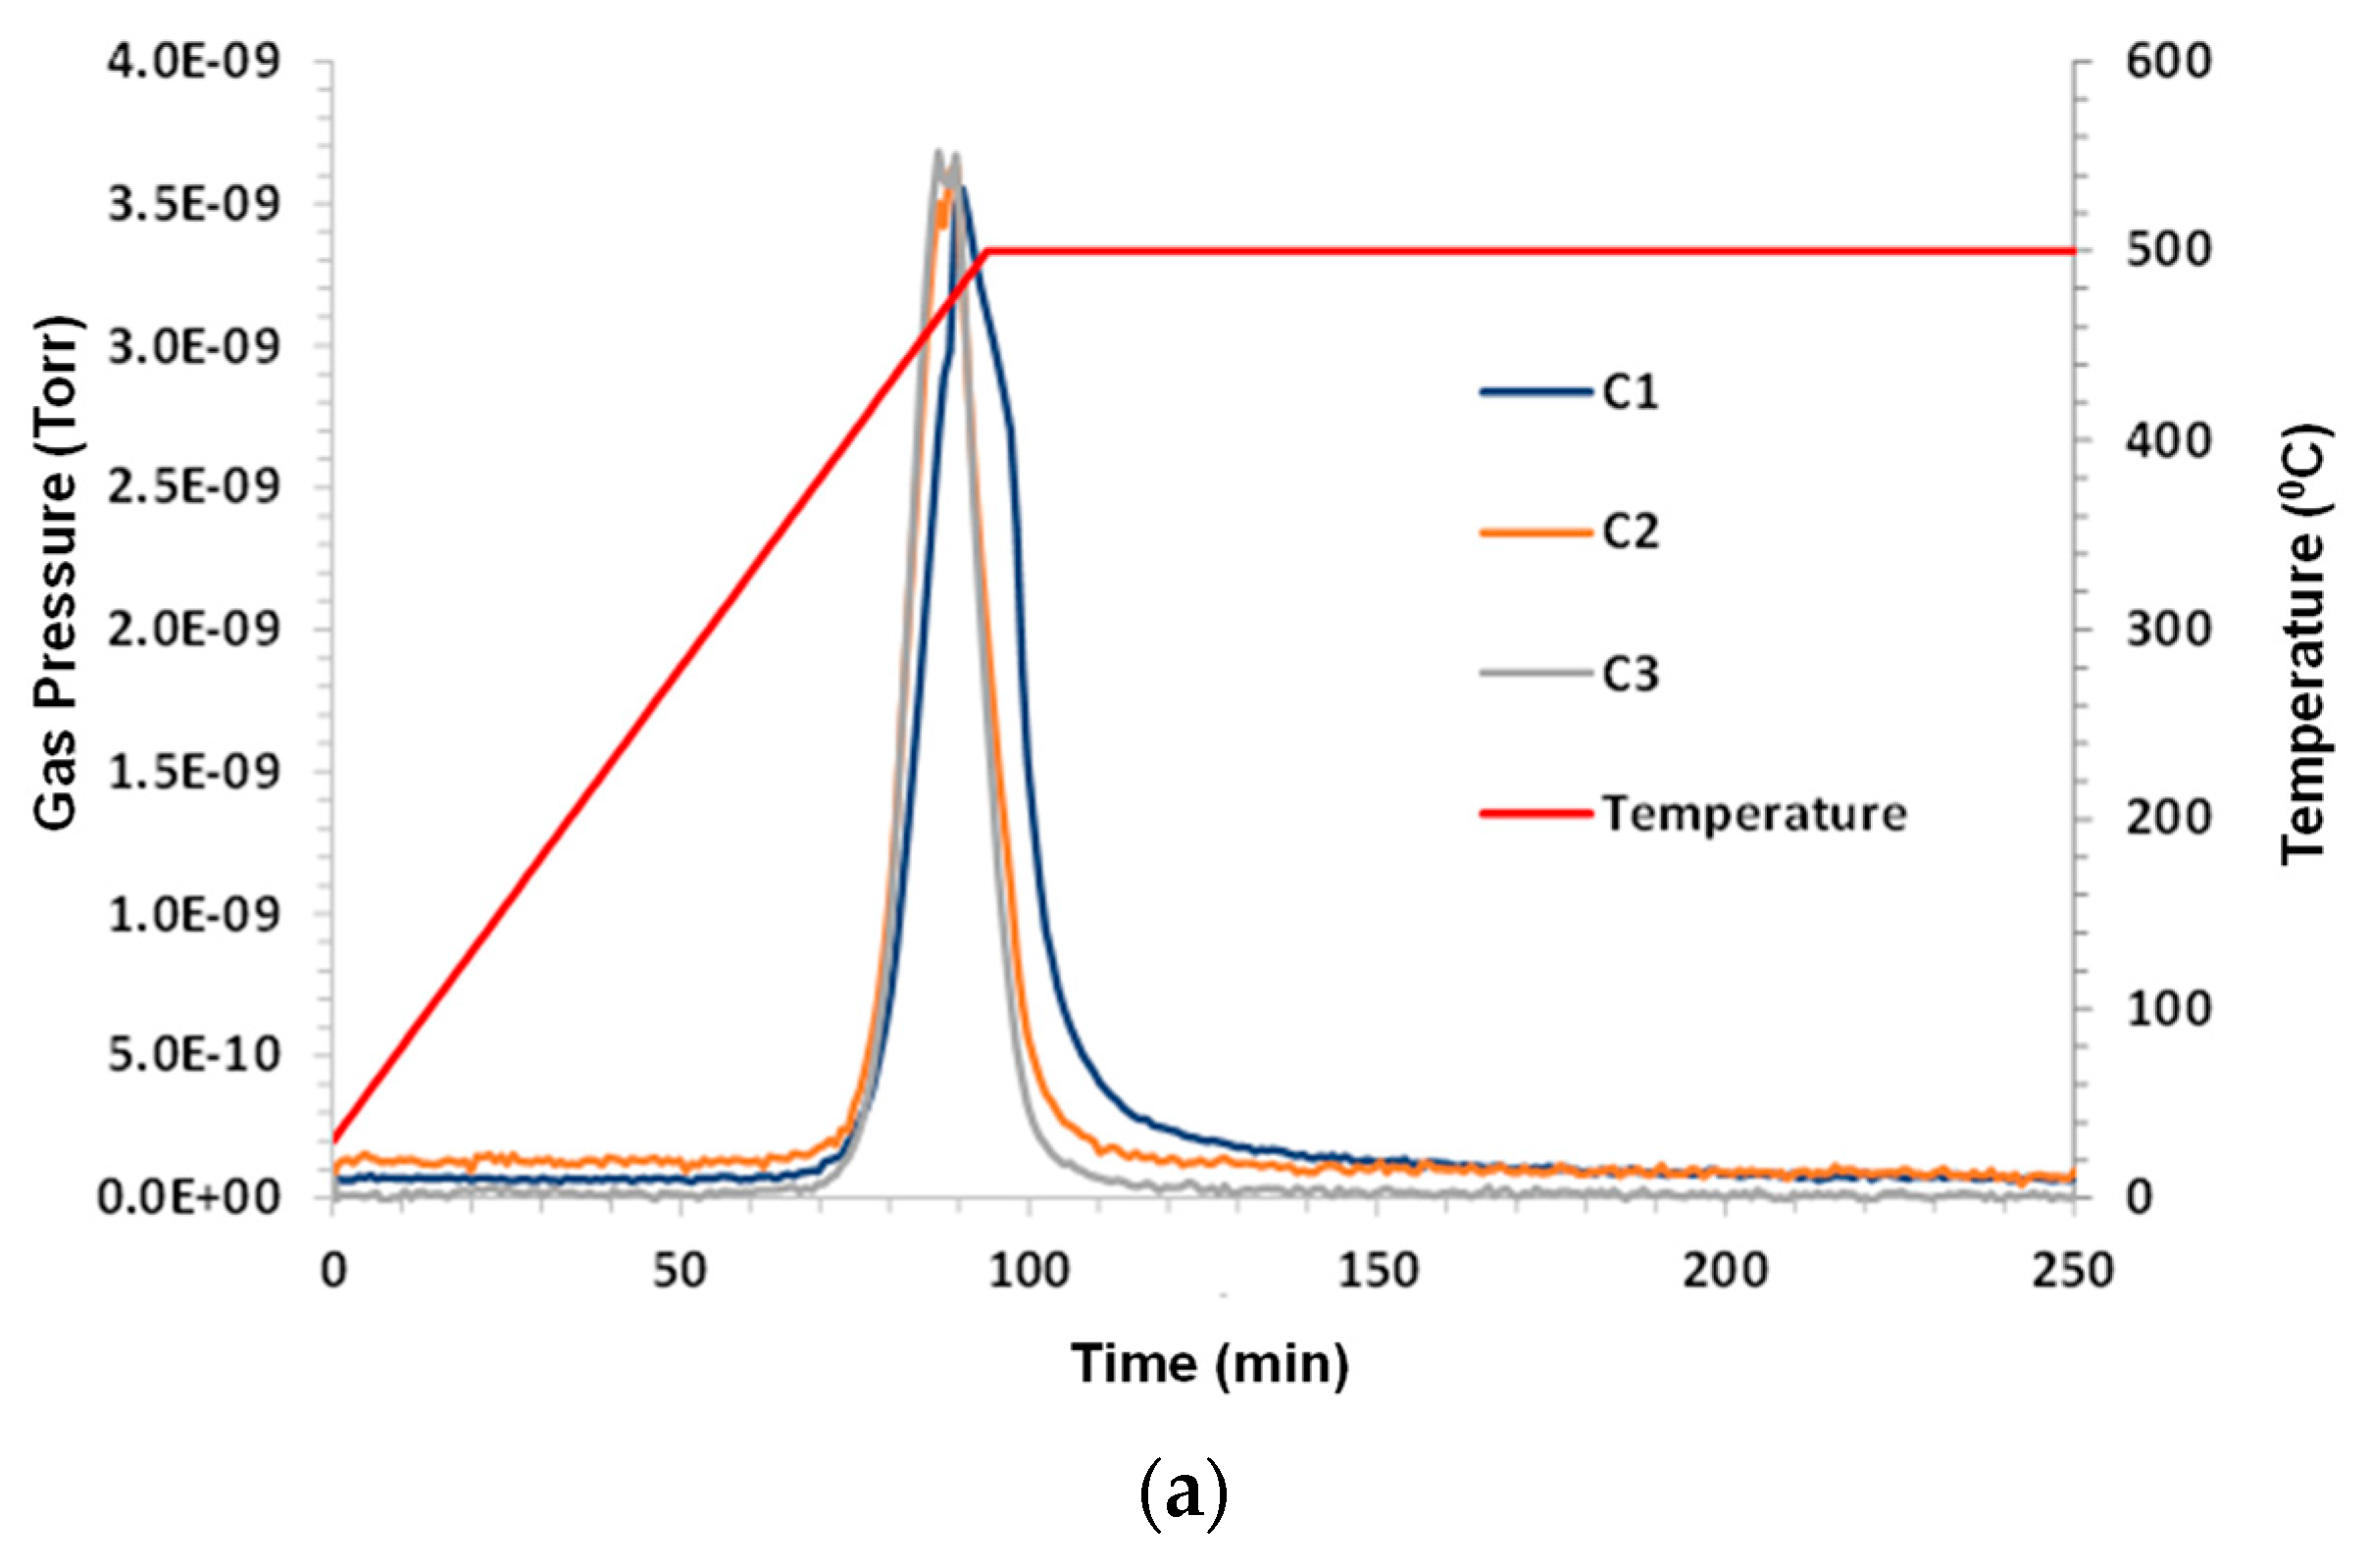
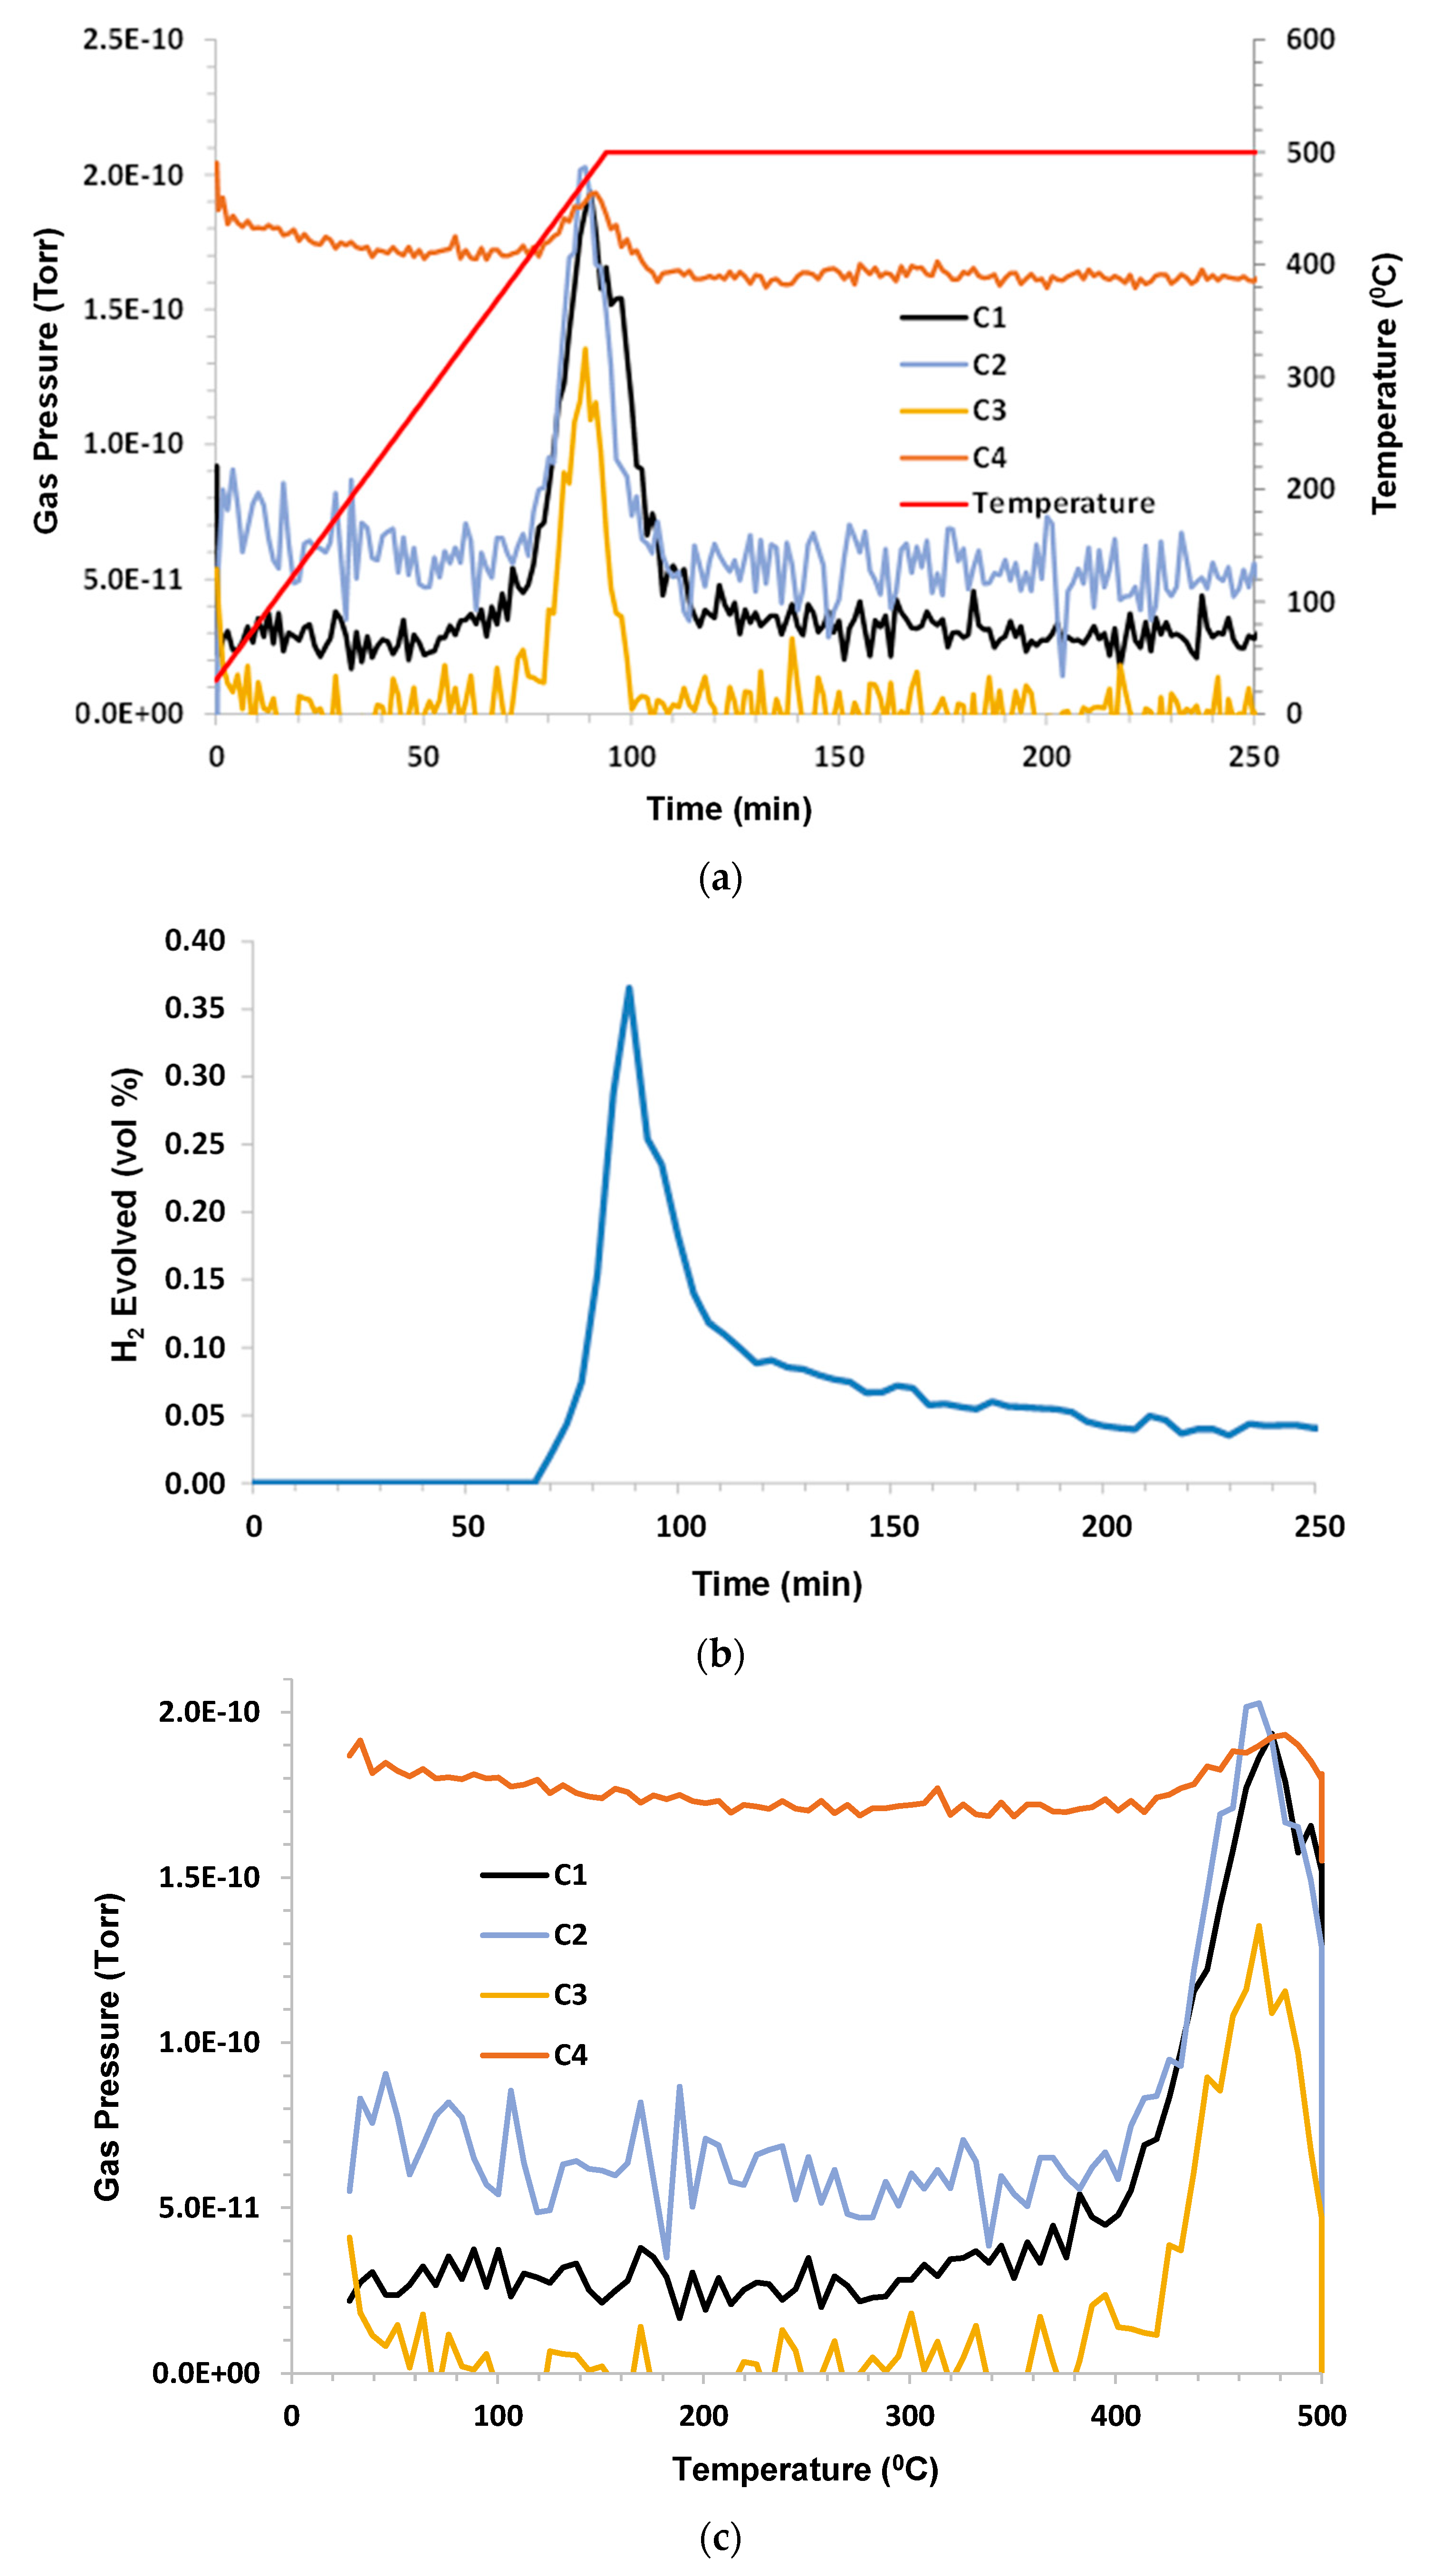
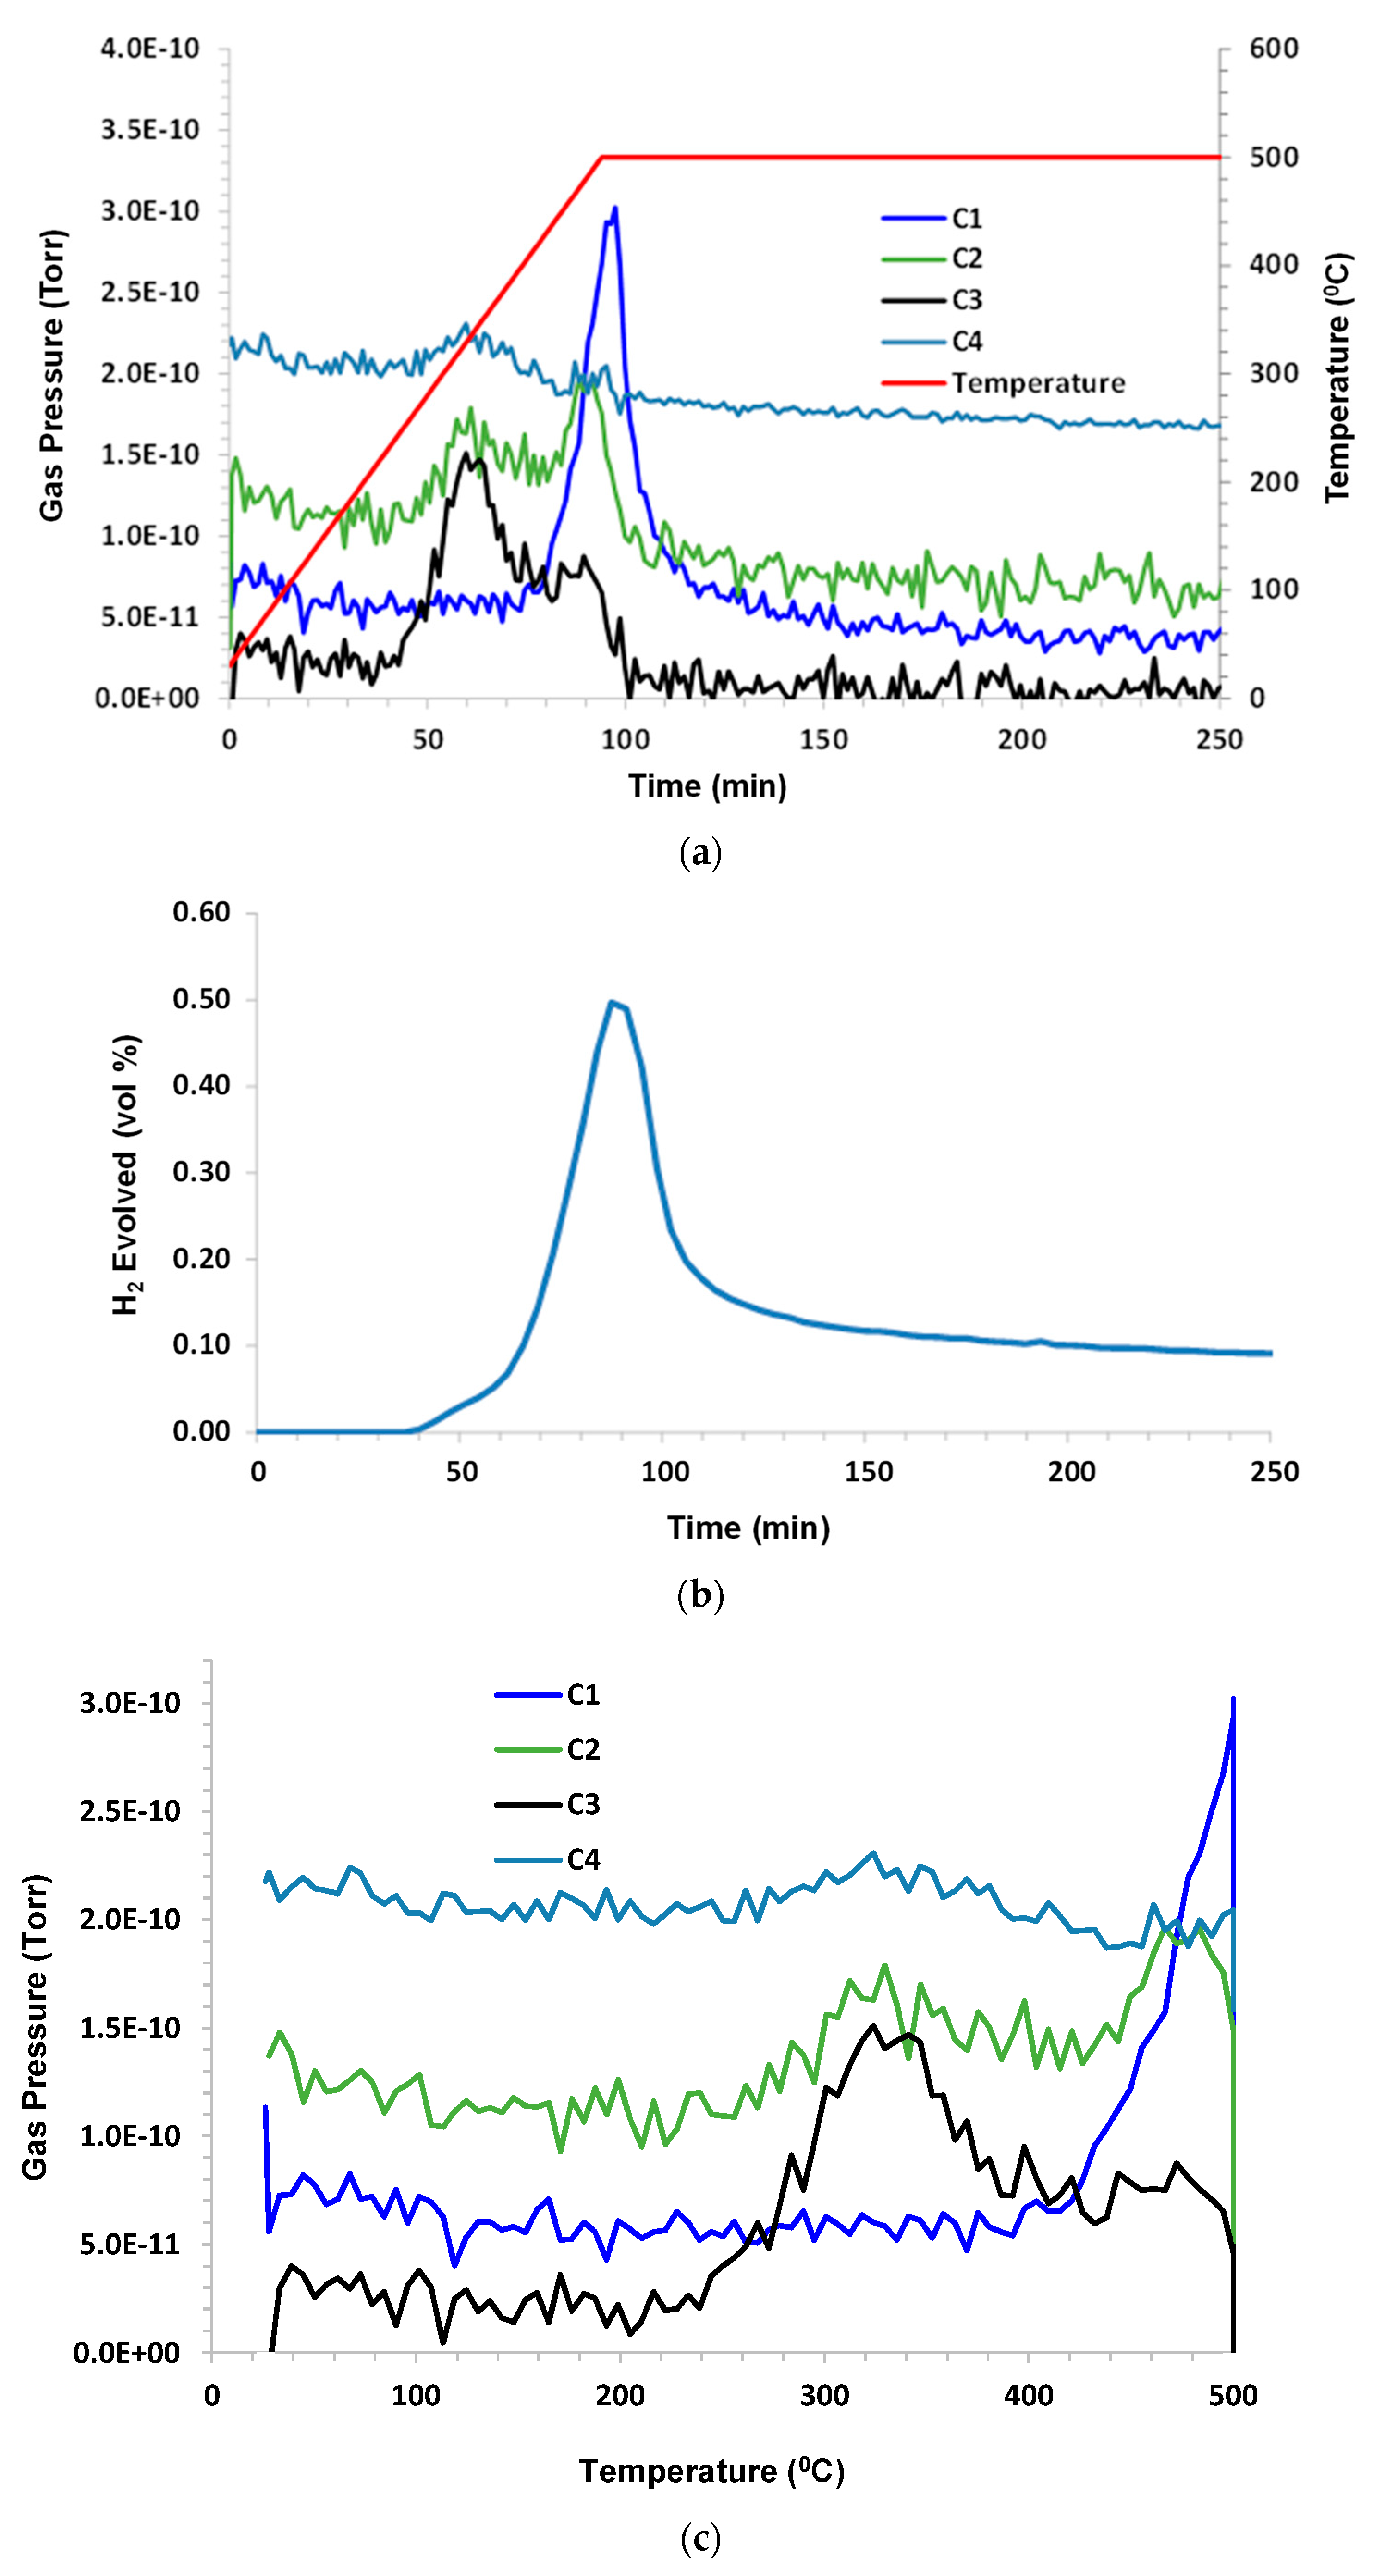
3.2. Grassy Creek with Humid CO2 Purge
In this test, humid CO
2 (dew point 60 °C) at a flow rate of 75 sccm (dry) was the purge gas, and the sample mass was 1.83 g. Under humid CO
2 pyrolysis conditions, C1–C3 hydrocarbon evolution was similar to the argon test; C1 lagged behind C2 and C3. Higher hydrocarbons, CO, CO
2, and H
2O were not monitored. The hydrogen evolution peak mirrored other species, and remained elevated during 500 °C hold. The results are presented in
Figure 3a–c.
The observation that hydrogen remained elevated during the 500 °C isothermal hold, while C1–C3 production diminished, may indicate that the hydrogen source was higher hydrocarbon cracking in the residual sample. In the comparison of the Grassy Creek oil results for argon and humid CO2, there appeared to be little difference. Based on this observation, the remainder of the testing was performed with humid CO2 purge.
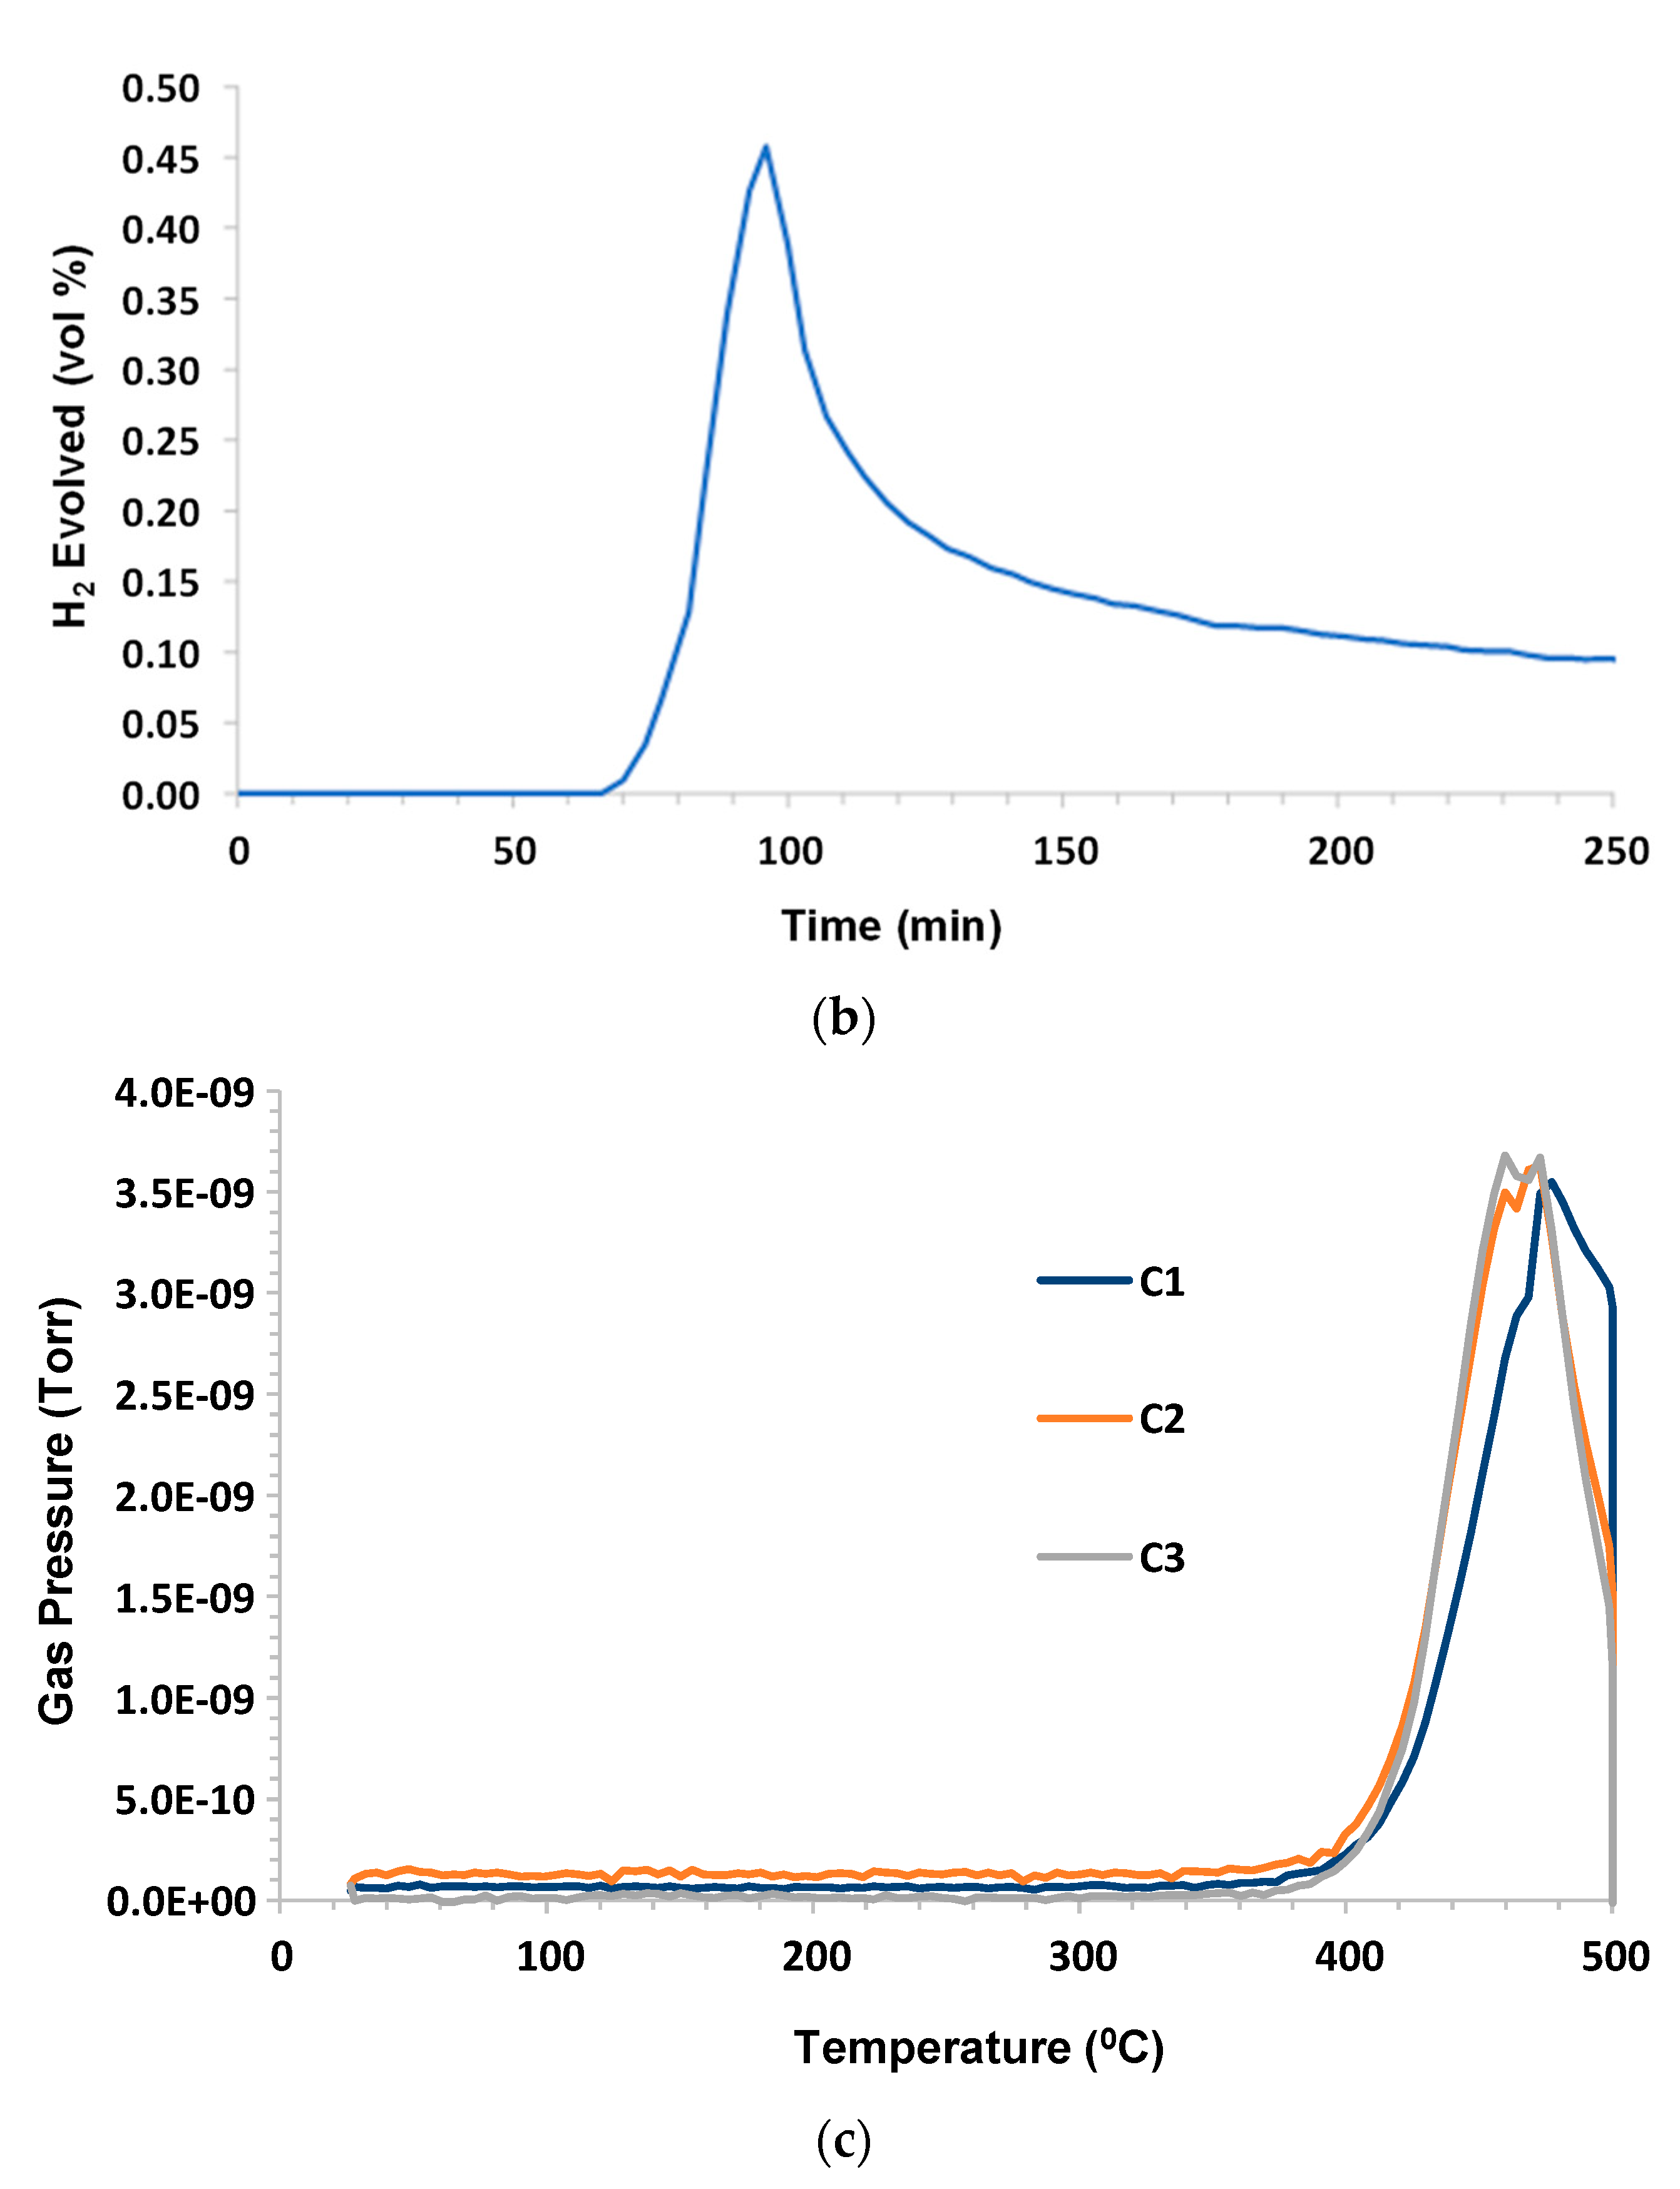
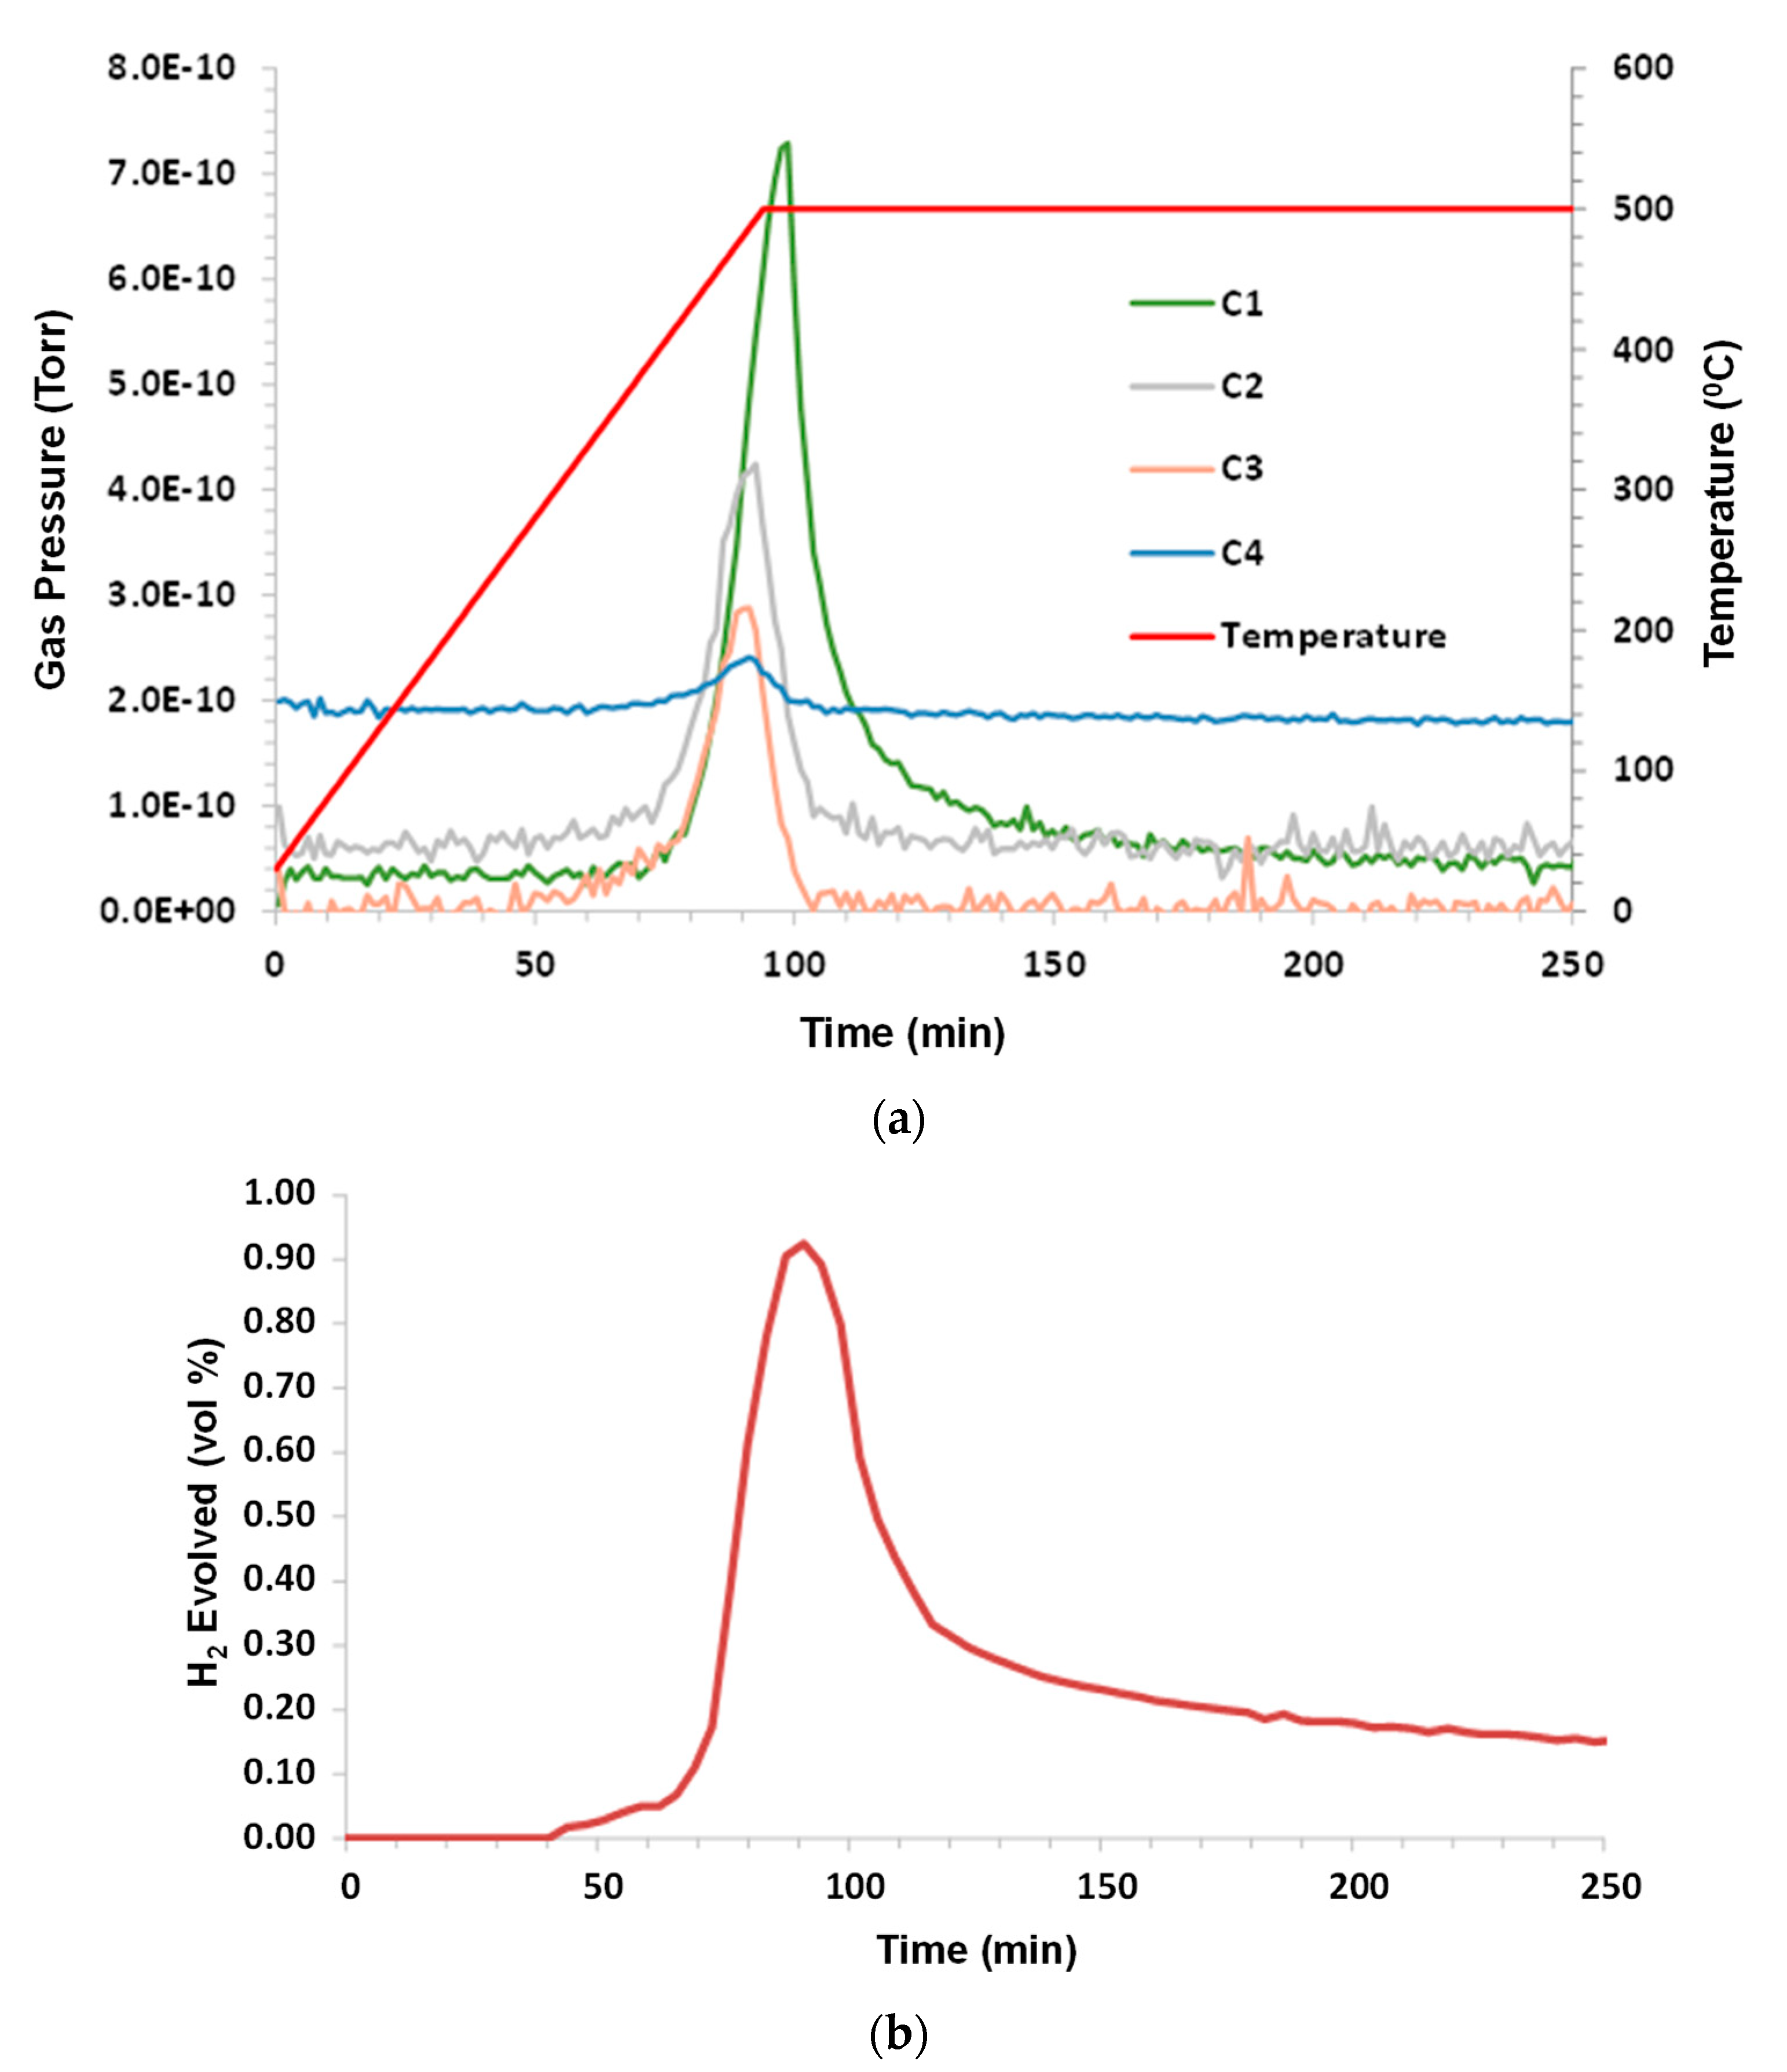
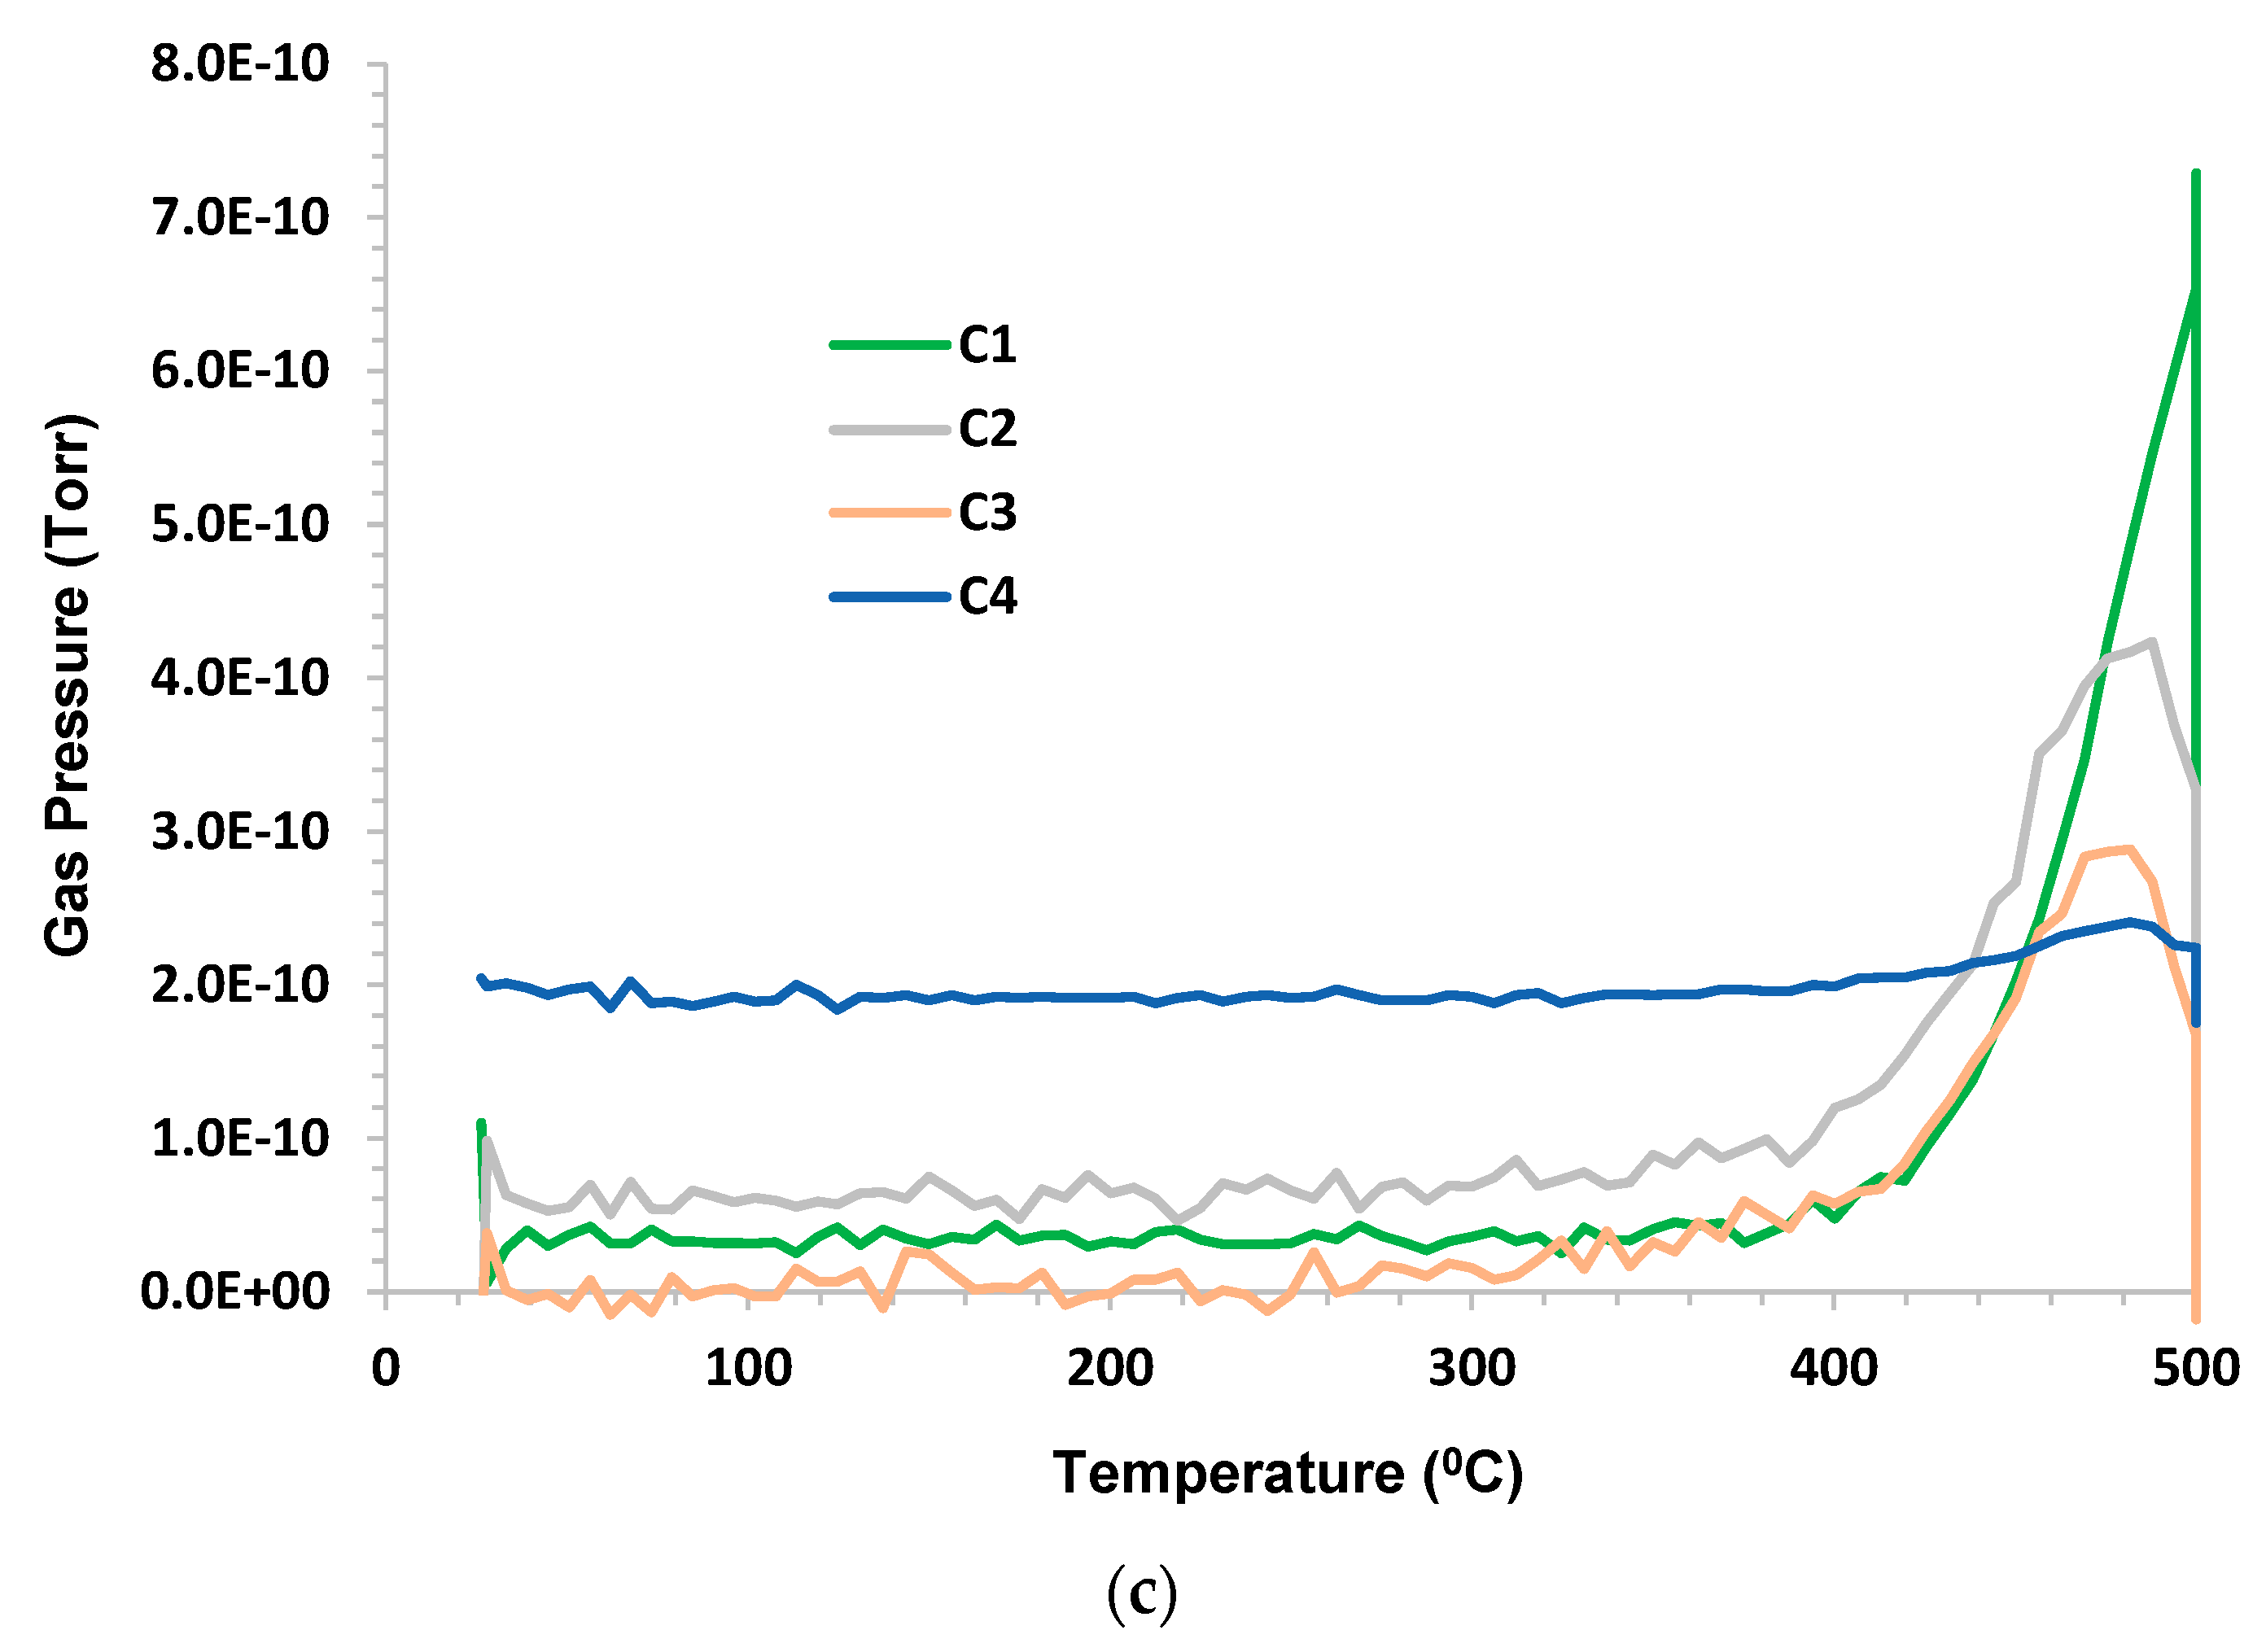
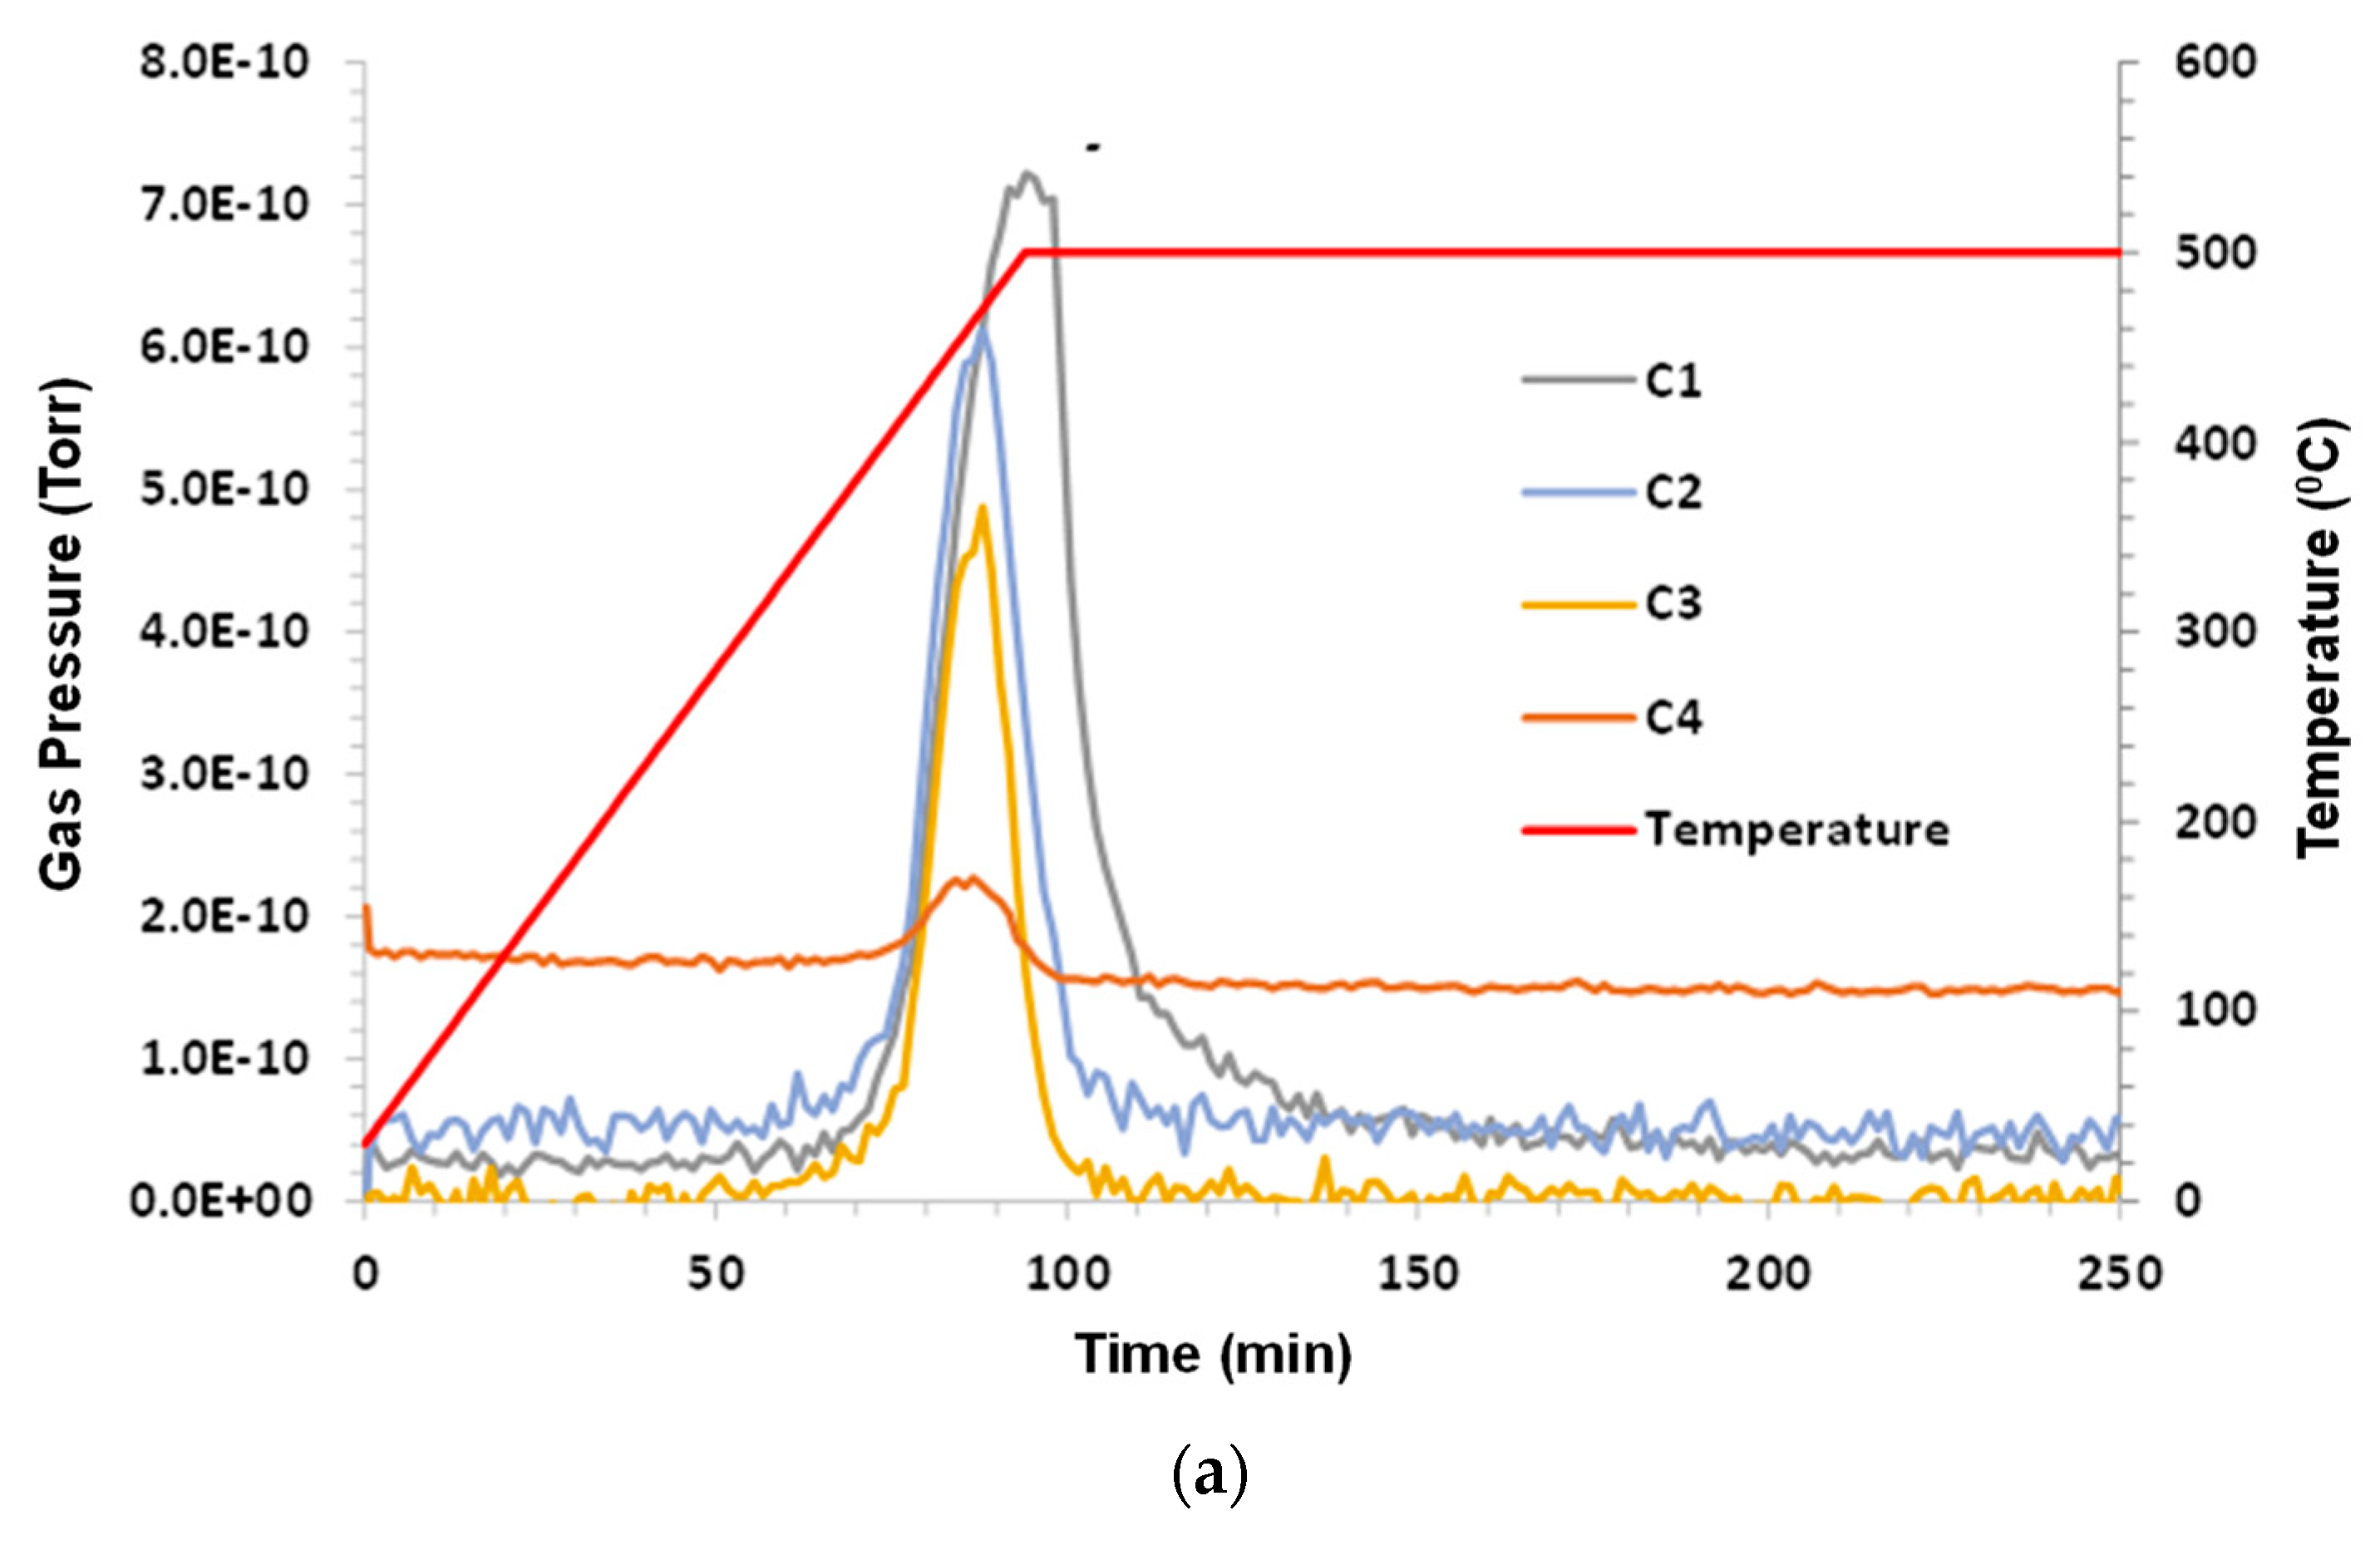
3.3. Asphalt Ridge Tar Sands
Humid CO
2 (dew point 60 °C) at a flow rate 75 sccm (dry) was the purge gas. The sample mass was 2.13 g; C1–C6, and benzene were monitored. C1–C4 production began at ~380 °C and all of the hydrocarbons peaked at ~475 °C. The H
2 evolution peak mirrored the hydrocarbon peak and remained elevated during the 500 °C hold. C5, C6, and benzene were below the limit of detection (LOD). The results are presented in
Figure 4a–c.
The high apparent butane reading shown in
Figure 4a,c is a consequence of the mass of the molecular fragment being analyzed by the MS (
m/
z = 43) being adjacent to the mass of carbon dioxide (CO
2,
m/
z = 44). Because CO
2 is present in vast excess, the signal can “spill over” to the adjacent mass values during measurement. Peaks in the C4 signal, however, are real as the CO
2 background signal is a constant. The same argument holds for the apparent elevated ethane readings, as here, the molecular fragment analyzed was
m/
z = 27, adjacent to the
m/
z = 28 of carbon monoxide (CO), the major fragmentation product of CO
2 in the mass spectrometer environment. Following this same argument, the C1 signal, using
m/
z = 15 (for CH
3 fragment, which remains slightly elevated above baseline) was adjacent to
m/
z = 16 for molecular oxygen, another fragmentation product of CO
2 and CO. However, it can be observed that elevated C1, C2, and C4 were indicated during the 500 °C hold. This implies that some pyrolysis of the remaining sample residue continued to occur, thus producing these lighter components in addition to hydrogen.
3.4. Chattanooga Shale—Sample 1
Humid CO
2 (dew point 60 °C) at a flow rate 75 sccm (dry) was the purge. The sample mass was 2.78 g; C1–C6 and benzene were monitored. C2–C4 hydrocarbons were released around 400 °C. Methane appeared to be a consequence of pyrolysis for T > 400 °C. Propane occurrence appeared to be partly due to desorption at low temperatures and from pyrolysis at higher temperatures. The H
2 evolution peak mirrored C1 with a small tail at lower temperatures and remained elevated during 500 °C hold. C5, C6, and benzene occurrence were below the limit of detection (LOD).
Figure 5a–c shows the results.
There appeared to be a peak in propane production at 300 °C. As previously noted, the peak in methane production appeared to lag the peak in ethane. This may be a consequence of the further breakdown of C2 and C3 to produce C1 and hydrogen. This argument may imply that unsaturated hydrocarbons were formed, which provided the source of hydrogen.
3.5. Chattanooga Shale—Sample 2
Humid CO
2 (dew point 60 °C) at a flow rate 75 sccm (dry) was the purge gas. The sample mass was 4.75 g. The results were consistent with first run on this sample. A greater signal-to-noise ratio was noticed due to the increased sample size. The results are shown in
Figure 6a–c.
Again, it can be noted that C1 production appears to lag behind C2. When looking at
Figure 6b, the peaks in ethane and propane occur at around 300 °C, which is a much lower temperature than the peak in methane of around 500 °C.
3.6. Woodford Shale
Humid CO
2 (dew point 60 °C) at a flow rate 75 sccm (dry) was the purge gas. Sample mass was 2.84 g; C1–C6 and benzene were monitored. C3 hydrocarbon release began shortly above 300 °C. C1–C2 began at ~380 °C; C1 lagged behind C2–C4. The H
2 evolution peak mirrored hydrocarbons with a small tail on the low temperature side, and remained elevated during 500 °C hold. C5, C6, and benzene were below the limit of detection (LOD). The results are presented in
Figure 7a–c.
When examining this shale, an interesting observation can be made. This is, that the pyrolysis temperature and composition were slightly dependent on the sample source, as this pyrolysis onset was slightly lower than that which was observed for the other shales. For example, for Chattanooga shale, pyrolysis did not appear until a temperature around 400 °C was reached, but for the Woodford shale, onset began at around 380 °C.
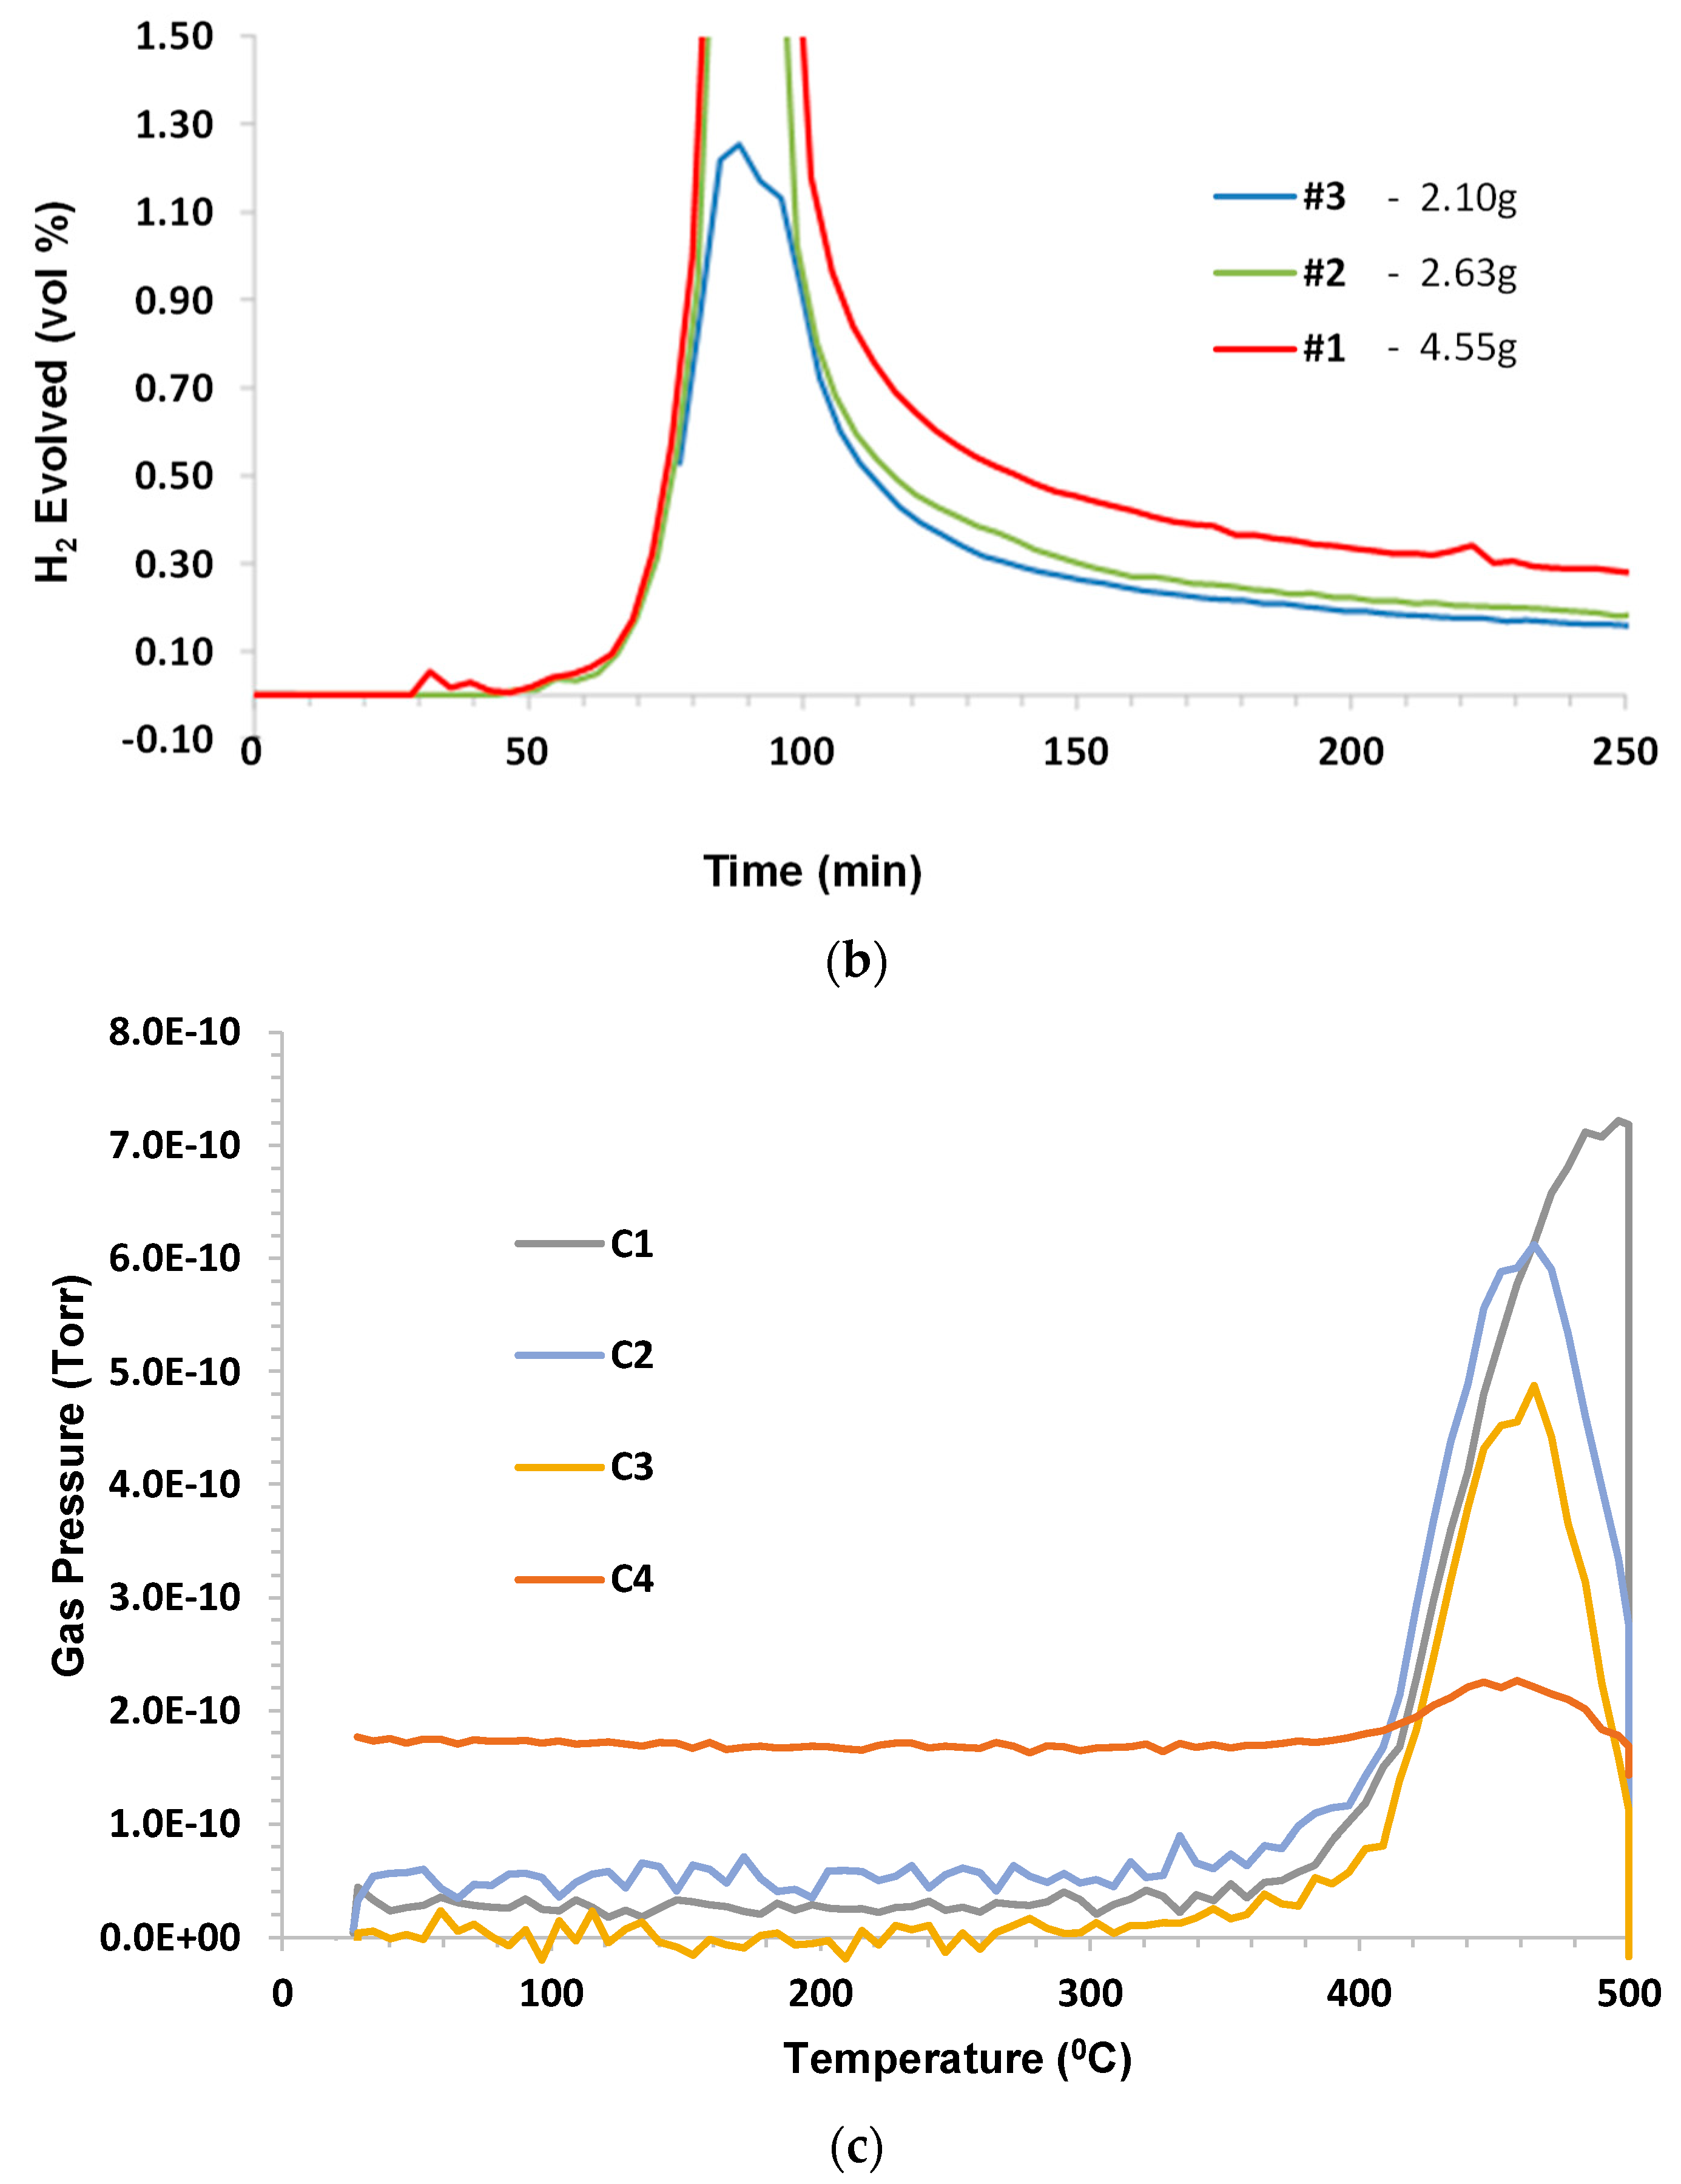
3.7. Pennsylvanian Shale
Humid CO
2 (dew point 60 °C) at a flow rate of 75 sccm (dry) was the purge gas. The sample mass was 2.63 g; C1–C6 and benzene were monitored. C1–C4 hydrocarbon release began ~360 °C. C1 peaked after C2–C4. The H
2 evolution peak mirrored the hydrocarbons, and remained elevated during 500 °C hold. For runs 1 and 2, H
2 levels saturated the detector so the sample mass was reduced for run 3. C5, C6, and benzene were below the limit of detection (LOD). The results are presented in
Figure 8a–c.
These results indicate an even lower temperature for pyrolysis onset, i.e., 360 °C. It appears that the Pennsylvanian formation shale was a prolific hydrogen producer. Hence, if hydrogen production and recovery is a component of business development, then this source should be considered.
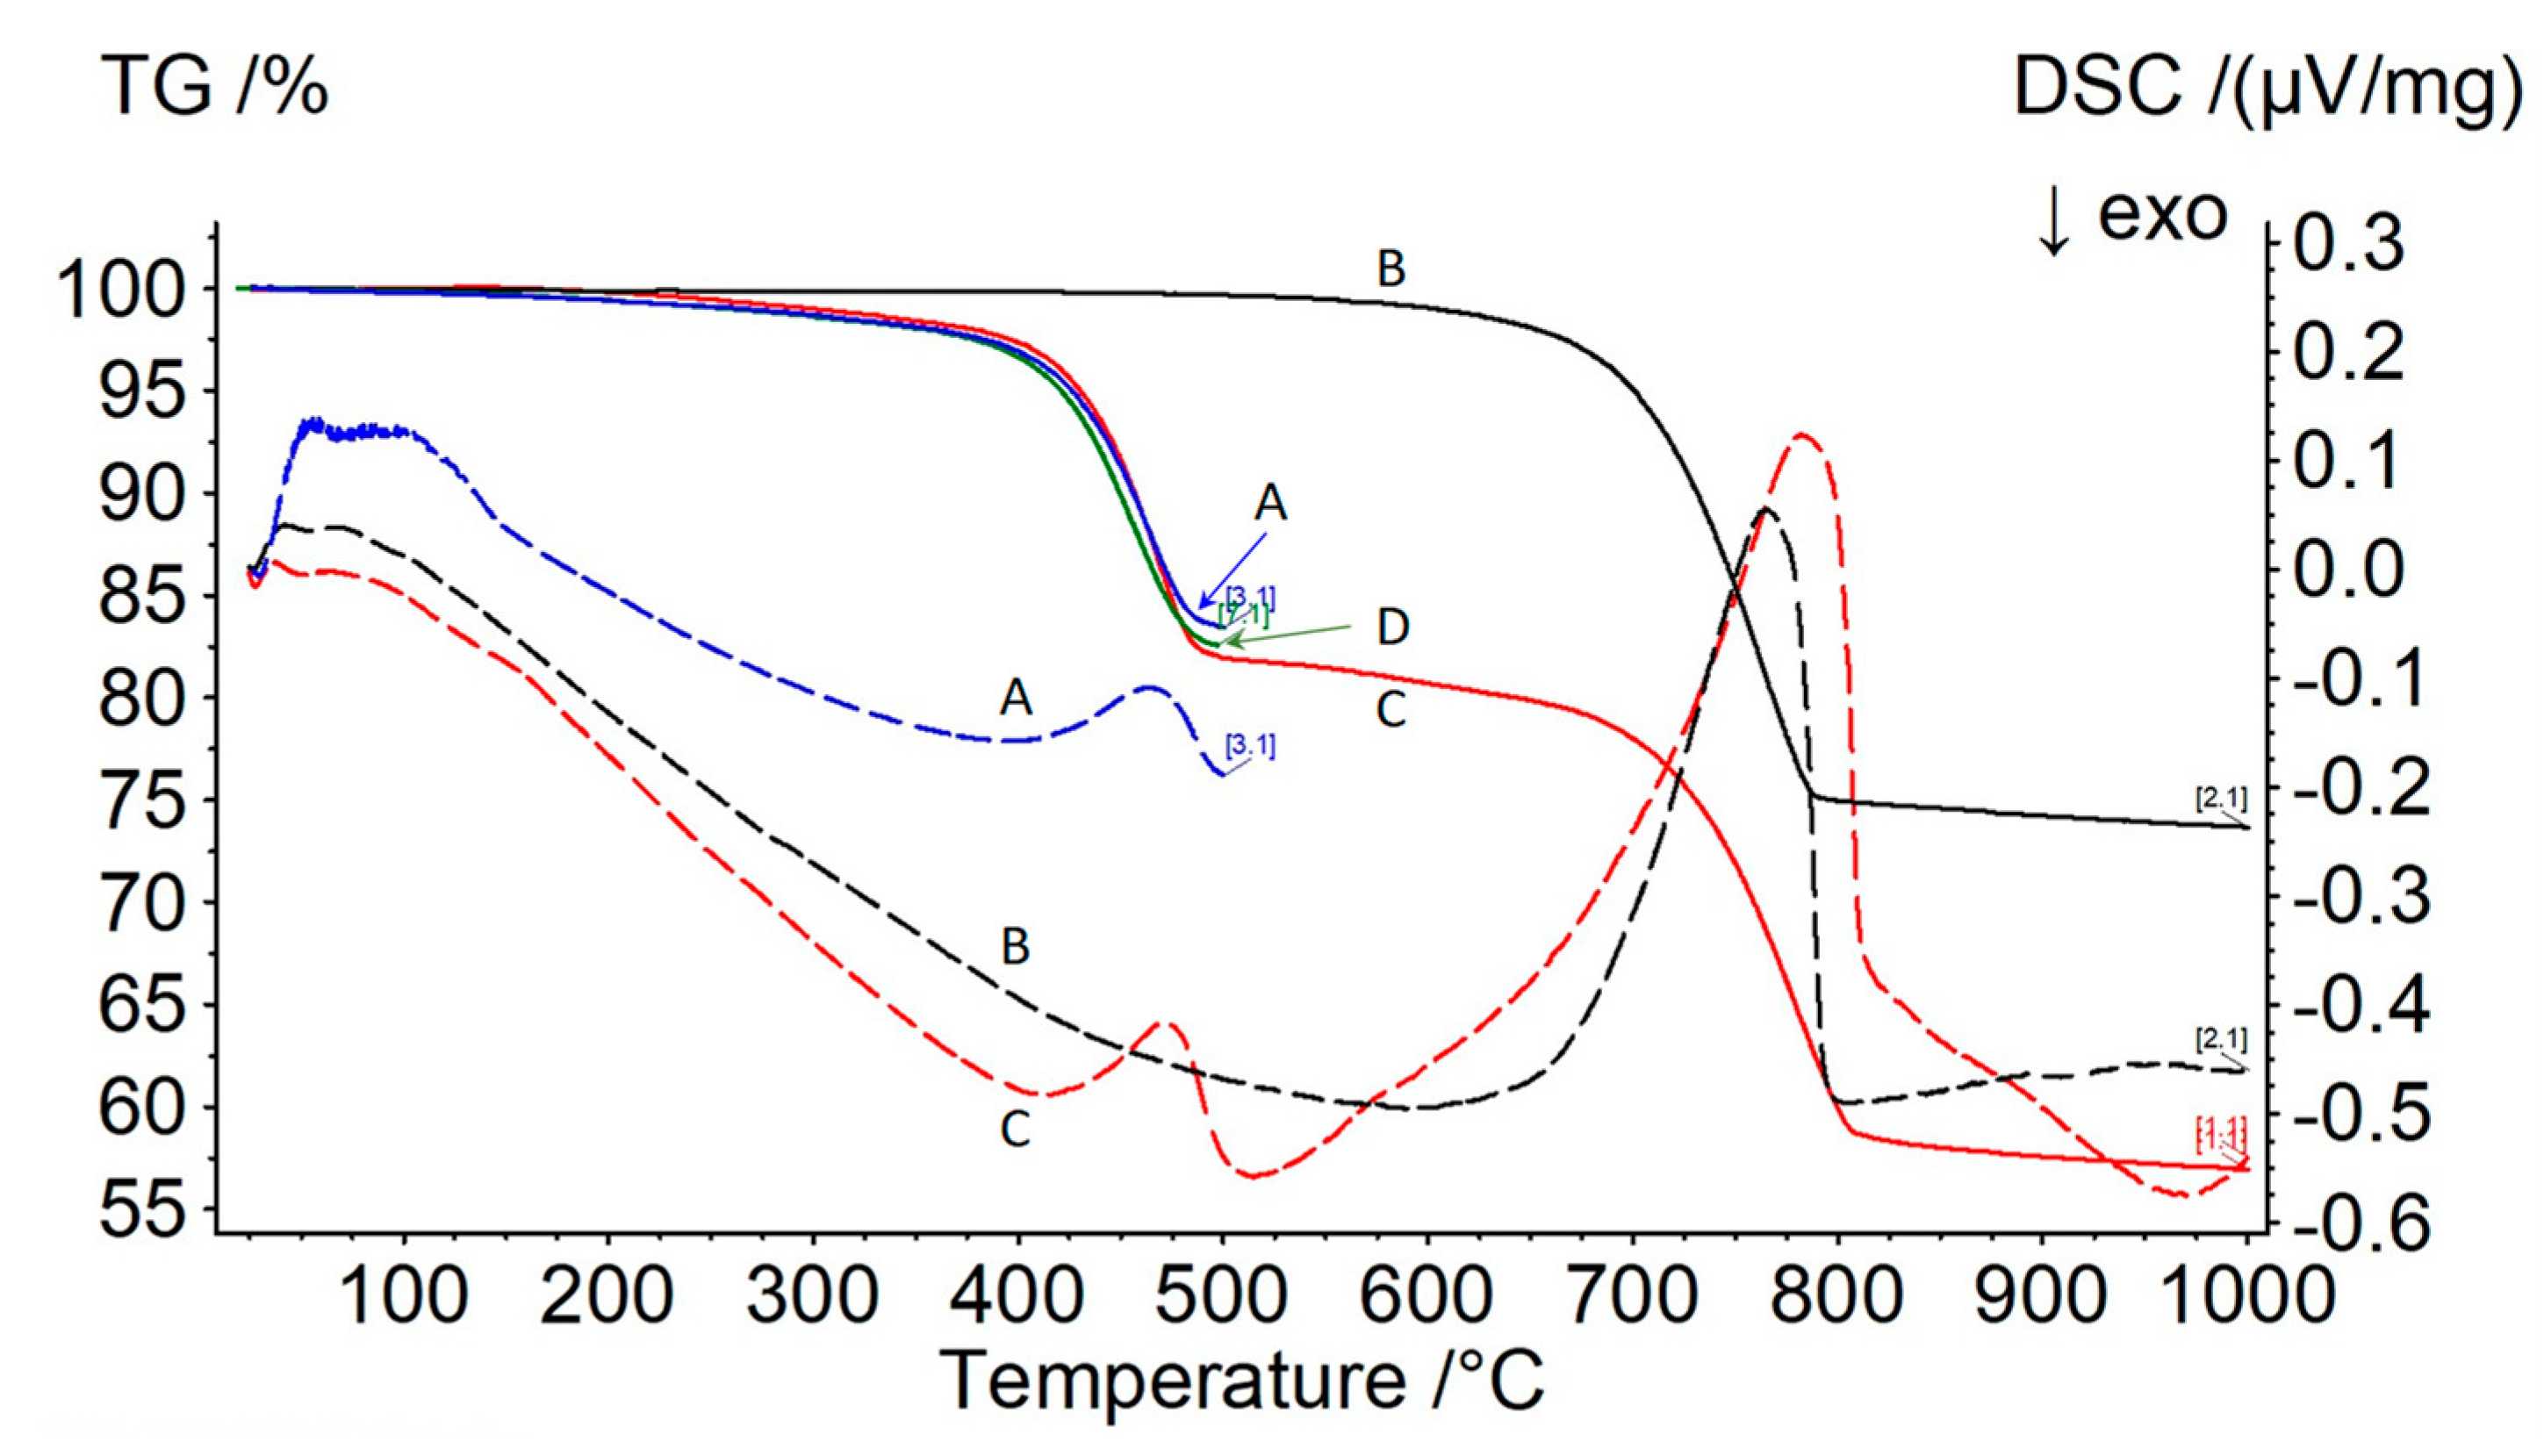
3.8. Piceance Basin Oil Shale
In a separate series of tests involving shale from the Piceance Basin, near Rifle, Colorado, the following results were obtained. The sample was subjected to pyrolysis conditions (humid carbon dioxide to 500 °C) and subsequently heated under dry argon to 1000 °C (see
Figure 9, curves A and B, respectively). The intention was to measure the pyrolysis gases being released in run A using mass spectrometry, but the data were not useable. The original data for the sample being decomposed under dry argon were overlaid for reference. Another attempt was made to determine pyrolysis gas evolution using the “skimmer” instrument, but it was constrained to using dry inert gas only (in this case, helium). The TGA data are shown in
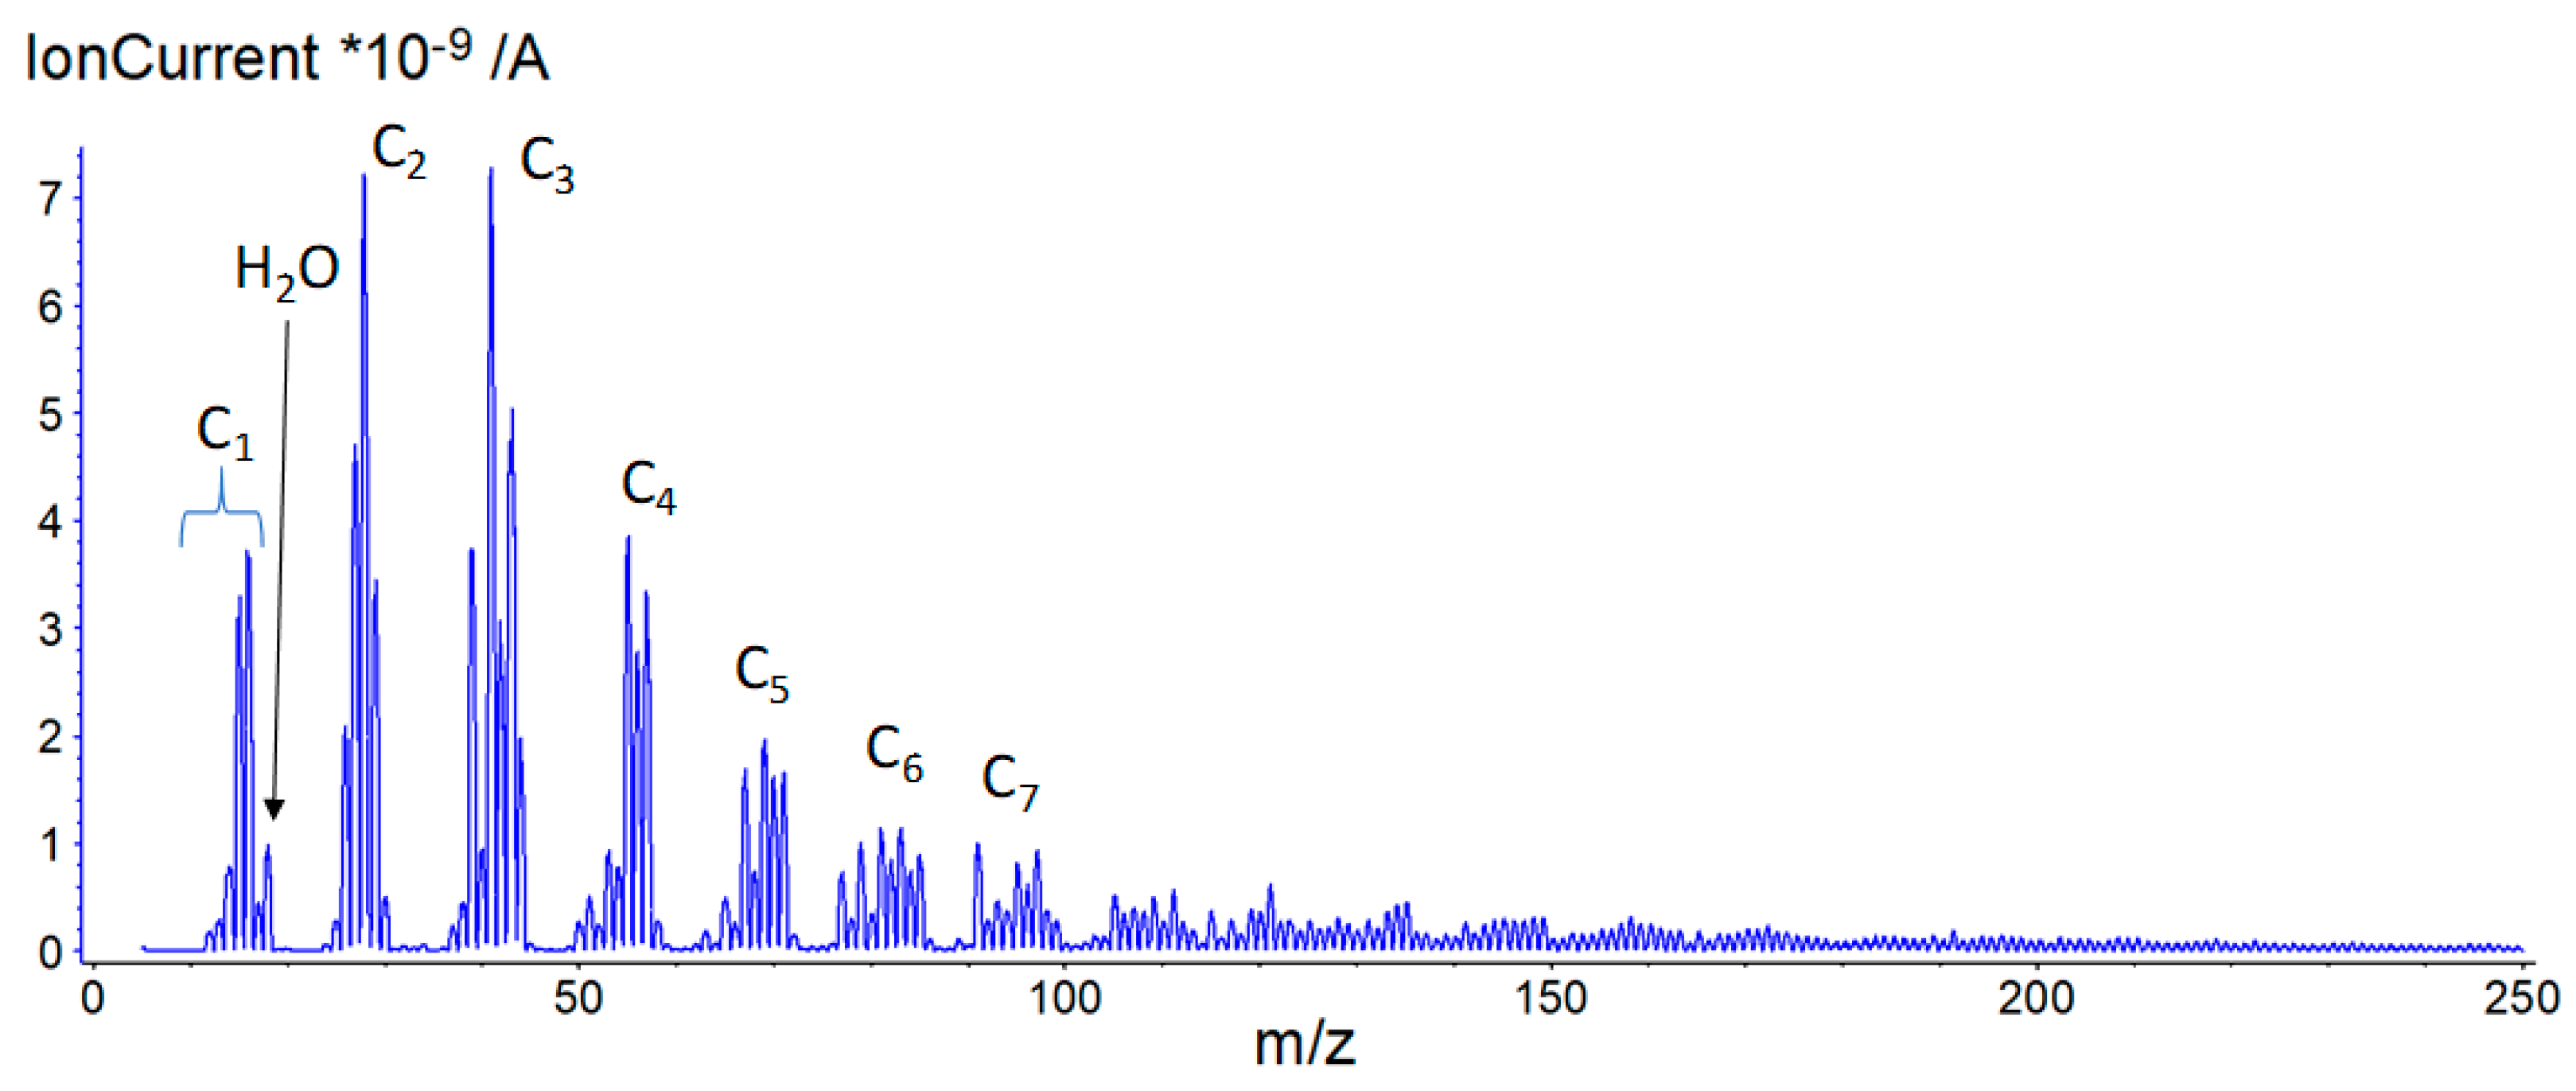
Figure 9, curve D, while a snapshot of the mass spectrometer data recorded at 466 °C is given in
Figure 10.
In the mass spectrometer plot, groups of peaks associated with specific hydrocarbon chain lengths are indicated, e.g., C3 included multiple fragment species containing three carbon atoms (C3Hx). A broad envelope of species existed at a low concentration above C7 and up to approx. mass number (m/z) 220. No other species were detected up to m/z 400.
For this sample, off gas production was not monitored for composition due to sampling difficulties, so the interpretation of
Figure 9 is somewhat speculative. It can be observed from the TGA trace of a virgin sample that mass loss begins at a temperature as low as 250 °C. Based on previous test results, it can be speculated that this represents sample evaporation, which was confirmed by the DSC trace. The strong endotherm at 750 °C was attributed to decomposition of calcium carbonate, which was contained in the solid fraction of sample. The TGA confirmed that only around 15% of the sample was oil; the balance was shale.
Figure 9 also confirms that there were no differences in results if the purge gas was helium instead of humid carbon dioxide.
4. Conclusions
A first comment is that the measured evolved gas pressures may appear very low. This is because the purge gas overwhelmed the composition and the remaining gases were a very small fraction of the total flow. A comparison of the figures shows some interesting agreements and differences. However, first, the Grassy Creek oil in argon shows a significant amount of CO and CO2.These gases were not monitored when humid CO2 was used as the purge gas because, obviously, CO2 would be the dominant gas species.
It can be observed that for all the samples, pyrolysis did not begin until a temperature of 350–500 °C was reached. Thus, it can be concluded that this order of temperature is required for the decomposition of heavy oil into lighter components. This observation was consistent with prior work [
8] that examined the pyrolysis of various oils and found that oils that do not evaporate before a temperature greater than 300 °C is reached, pyrolysis proceeds and the off gases consist of hydrogen and lighter alkanes.
For both the Grassy Creek and Asphalt Ridge oil samples, methane is the dominant pyrolysis gas, following hydrogen. However, for the shale samples, the heavier hydrocarbons sometimes appear to be the dominant species. However, there should be skepticism in this result. It may be that the heavier gases are in solution in the “as received” samples, whereas lighter gases escaped upon exposure to the atmosphere. Therefore, the appearance of butane in the off gases should be discounted as an early pyrolysis product. The two Chattanooga shale samples returned similar results, which can be taken as an indication of repetitive outcome.
To add evidence that methane and hydrogen can be expected as a pyrolysis product of alkane heating, the NASA CEA Code [
11] was used to determine the theoretical decomposition that results from heating a heavy alkane to 500 °C at normal ambient pressure in a purge gas of humid carbon dioxide. The results indicate that both hydrogen and methane will be produced. Through the use of a semi-permeable membrane [
12], it would be possible to separate the hydrogen from the gas stream, which would be a value-added byproduct.
For the field pilot tests in Grassy Creek, where superheated steam was injected at temperatures up to 450 °C, casing gases at surrounding wells have been observed to be flammable; this is in spite of this oil being “dead”, i.e., absent solution gas. This observation provides field evidence that high temperatures will decompose heavy oil and produce gases that can potentially be used to fire a conventional boiler as a precursor to the superheater. While previous field attempts to utilize superheated steam for enhanced oil recovery have experienced operational difficulties, the technique employed at Grassy Creek was much simpler and did not have similar problems.
An added point with regard to injecting steam with flue gases is that flue gases can potentially augment production by providing reservoir pressurization, or can be detrimental if the reservoir is of very low permeability, and fractures have not been artificially created.


