Abstract
The increased voltage loading of transformers has led to research on improving transformers’ lifespans to meet demand. Insulation oil acts as cooling medium that can significantly affect the performance of a transformer. This paper discusses an experimental study on the influences of the doping of carbon nanotube (CNT) particles and magnetic fields on the electrical properties of mineral oil (MO). An analysis of electrical properties was conducted using AC breakdown tests, Tan Delta tests, Raman measurements, and simultaneous thermal analysis. Proper preparation was considered before starting the analysis of the electrical properties. The AC breakdown voltages before and after modification were measured. The experiment results indicated that the AC breakdown of mineral oil with a suitable amount of carbon nanotube particles (0.005 g/L) and a suitable magnetic field (0.45 T) gives the highest breakdown voltage. It was found that the proper treatment of nanofluid also greatly influences breakdown voltage. Additionally, Raman measurements analyzed the physical changes in the samples. From the results obtained, the addition of carbon nanotubes and the magnetic field of mineral oil leads to an improved performance of the transformer.
1. Introduction
Recently, electricity demand has been drastically increasing due to economic development and an increase in the population. This has caused an increase in demand for a longer transformer lifespan. The reliable and efficient operation of an electrical power transformer depends on its insulation characteristics, as they constitute a major portion of the causes of transformer failure. Insulating oil plays a crucial role in a power transformer’s lifespan as it performs both the insulation and the coolant functions. Since 1892, petroleum-based oil, which is mineral oil, has been used as a primary insulating medium [1]. The benefits obtained from its properties, such as good aging behavior, low viscosity, ready availability, and low cost, are why it is used more commonly than other types of oil [2]. Despite having many advantages, mineral oil also has its weaknesses, such as being highly flammable and non-renewable [3]. An alternative to improve transformer oil is through the dispersion of nanomaterials in the transformer oil that helps develop new types of insulating nanofluids [4,5]. Nanofluids are good insulators due to their nanoscale dimensions and wide range of classes; they also have relatively large surface areas, which improves their heat transfer ability and the stability of suspensions [6]. According to research conducted on the addition of nanoparticles, AC breakdown voltage increases slightly more than with the use of mineral oil alone [7,8]. Research presented by Naddaf and Heris states that a nanofluid using multi-wall carbon nanotubes causes an increase in electrical conductivity as the concentration volume increases [9,10]. In addition to enhancing the electrical properties of mineral oil through the addition of carbon nanotube particles, proper preparation also needs to be considered, as it can influence conductivity [11]. The presence of polar particles, such as sludge, sediments, varnish, water molecules, and resin, causes the insulating properties to deteriorate. Results from an experiment by Jian et al. which used dry and wet mineral oil show that the impurity bridge grows faster in wet mineral oil as the strength of the electrical field accelerates the occurrence of this phenomenon [12]. According to research, moisture in the oil reduces its insulating ability at high loads and in high-temperature periods and leads to dielectric breakdown due to the oil absorbing the moisture [13]. Hafizi et al. carried out an experiment on the improper dispersion of nanoparticles in transformer oil that cause sedimentation and observed that proper treatment samples show positive heat transfer properties [14]. The presence of a magnetic field in a breakdown voltage test has also been studied in [15], and this study revealed that the breakdown voltage increases with the presence of a magnetic field. The higher breakdown voltage due to the presence of a magnetic field in the transformer oil might be because the extension of the net space charge zone at the streamer tip is delayed and thus slows the movement of negatively charged nanoparticles. The net space charge zone is inhibited by the generated streamer’s propagation of electric field propagation waves in transformer oil [16]. In this study, the electrical properties of mineral oil and the patterns of nanofluids were analyzed using various tests which included the application of different magnetic fields.
2. Materials and Methods
2.1. Flow Chart
In this study, a variety of activities were implemented. Details of the processes are included in Figure 1 and relate to the overall study conducted in the laboratory.
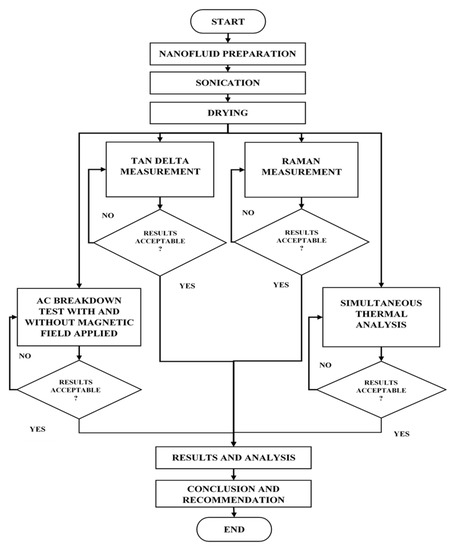
Figure 1.
Flow chart of the overall experiment.
2.2. Preparation of Nanofluid
This study involved different treatments and concentrations of CNTs using mineral oil with specifications as listed in Table 1 below.

Table 1.
Specifications of mineral oil used.
The first process is filtration, which is performed three times. Seven samples of mineral oil underwent a filtering process using a Piston Pump FB 70155. Both sides were connected to a Nalgene Rapid-Flow Sterile Disposable Filter Unit with a PES Membrane that creates a vacuum in the filter. The next step in the preparation of the nanofluid is weighing carbon nanotube particles using a Digital Measuring Instrument Weight and a spatula with a certain weight, as shown in Table 2.
Table 2.
Concentration of nanofluid used.
One approach to achieve the homogeneous dispersion and stable suspension of fine particles is by applying plasma treatment on the nanofluid through stirring and sonication [14]. The stirring process was carried out by stirring carbon nanotube particles with mineral oil by using Magnetic Stirrer MR Hei-Tec for 30 min at 520 rpm. In the same way, carbon nanotube particles and mineral oil underwent a sonication process using a Qsonica Sonicator. In addition to that, the samples were dried utilizing a VO200 Memmert vacuum oven to dry the nanofluid at the temperature of 60° for 24 h. Thereafter, the nanofluid was inserted inside the bottle and the lid was kept tightly closed to prevent moisture from entering.
2.3. AC Breakdown Test
The AC breakdown voltage test was conducted according to the IEC 60156 standard using the BAUR DTA 100 c tester. First, 400 mL of nanofluid was carefully inserted inside the test vessels to prevent the formation of any gas bubbles and mixed for two minutes after each breakdown using the magnetic stirrer. Testing data were collected for five cycles (six measurements every cycle) at 2 min intervals between every measurement. The distance between the electrode in the test vessels was set to be 2.5 mm using the NO 15 SM thickness gauge. The test was conducted using a mushroom-shaped electrode with an applied frequency of 50 Hz. The process was then repeated with the addition of magnetic fields of 0.35 T and 0.45 T, which were attached to both outer parts of the test vessels, as in Figure 2.
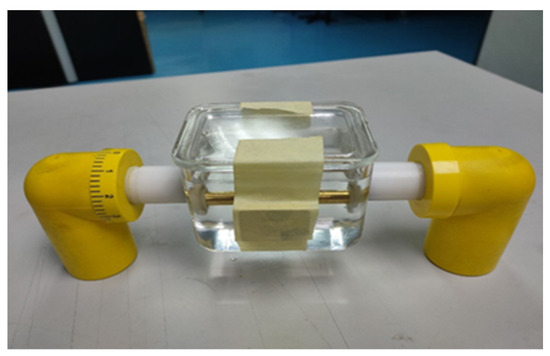
Figure 2.
Test vessel with magnet.
2.4. Tan Delta Test
A combination of automatic oil test cell heaters AOCH-06 and ADTR-2 K Plus was used to measure the mineral oil’s tan delta, permittivity, and resistivity. The cell electrode was designed with a spherical bottom made with stainless-steel 316 with Teflon spacers and consisted of three terminal configurations with 90 mm × 195 mm dimensions. Automatic oil test cell heater AOCH-06 was used to heat the oil test cell. Fifteen milliliters of each fluid was used inside the test cell. The temperature was set to 30 °C with an increment of 20 °C until reaching 90 °C and then reduced with a decrement of 20 °C until reaching 30 °C.
2.5. Raman Measurement
The next testing is Raman measurement, which characterizes the materials and the crystal structure or crystallinity of samples. Generally, the Renishaw Raman instrument consists of an inVia confocal Raman microscope and Renishaw’s WiRE version 5.2 software for analysis and data acquisition and control of Raman data, which offers users data processing and analysis options, and other accessories which are adaptable to the Raman system to suit the user’s requirement. The settings for the experiment were set using 785 nm laser excitation sources with 1200 lines/mm grating at 10 s exposure time and 1% laser power.
2.6. Simultaneous Thermal Analysis
The samples’ heat flow was tested using Simultaneous Thermal Analyzer (STA) 8000 instruments at temperatures of 30 °C to 120 °C increasing at a rate of 2 °C/min using nitrogen gas. Only a small weight of samples is required, which is around 10 to 50 mg. To start, the sample pan was cleaned using acetone before inserting the mineral oil with or without nanoparticles. The STA 8000 was connected to a personal computer equipped with Pyris software version 8.0 to observe the data collected by the STA 8000.
3. Results
3.1. AC Breakdown Performance
The AC breakdown voltage (BDV), also known as the dielectric strength of an insulator, is a test used to measure the tolerance of the insulation oil towards electrical stress. Once the electrical breakdown occurs, this shows that the current has flowed through an insulator, causing it to be conductive. In insulation, electrical breakdown must not occur, as it would cause an electrical spark or short circuit. In this study, the AC breakdown voltage test was conducted from three perspectives: different treatments, CNT concentrations, and different magnetic fields applied.
Figure 3 shows the average AC breakdown voltage of the samples without CNT concentration with different magnetic field strengths applied. Through further investigation of Figure 3 and the data obtained, the BDV value of pure mineral oil (MO) ranges from 20.72 kV to 25.36 kV, and after undergoing the filtering process (filter MO), it ranges from 26.46 kV to 33.14 kV. Meanwhile, the filtering and heating processes result in the MO having BDV values ranging from 28.08 kV to 36.54 kV. This indicates that pure MO from the factory may contain many foreign particles and absorbs moisture as it is exposed to the factory’s surrounding environment. Proper preparation of MO, such as through the filtering and drying processes, helps reduce the amount of foreign particles and moisture in the MO. Reducing the amount of foreign particles and moisture results in increasing the average value of the AC breakdown voltage.
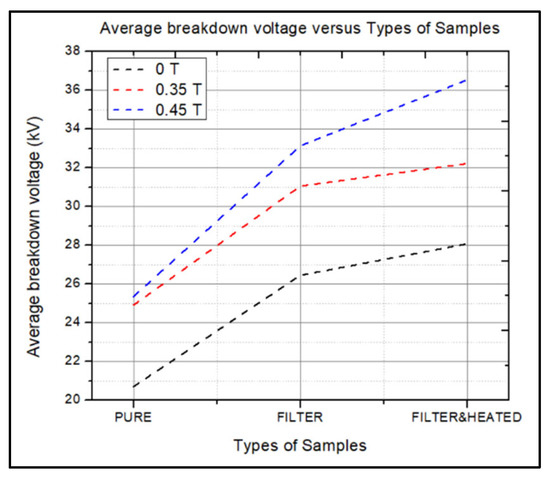
Figure 3.
Line graph of AC breakdown voltage without the presence of CNT and different strengths of magnetic fields applied.
Figure 4 shows the average AC breakdown voltage for different types of samples and different magnetic fields applied. Table 3 shows the average value of the breakdown voltage with and without nanoparticles and with the addition of a magnetic field. From Table 3, the average AC breakdown voltage without a magnetic field applied increased from pure MO (20.72 kV) to 0.005 g/L (40.1 kV) and then started to decrease from 0.01 g/L (39.98 kV) to 0.03 g/L (32.18 kV). The breakdown in the insulation process involves the ionization of electrons, which causes the current to flow through the insulation oil. This indication explains how dispersing CNTs in MO helps in trapping the electrons transporting them in a delocalized manner. This is due to the fast-moving electron from the high electric field region being converted to a slower electron as it is trapped in the CNTs’ shallow traps [17]. The trapping process can occur many times, causing the electron to move slower, thus decreasing the expansion speed of the streamers. An excessive amount of CNTs can lead to a reduction in the AC breakdown voltage, as it becomes an unwanted particle. The accumulation of CNTs increases and leads to aggregation, causing a bridge between two electrodes to form and leading to a breakdown [18]. Therefore, an appropriate amount of CNTs helps to improve the electrical properties of MO. On top of that, magnetic field strength also helps improve the electrical properties of MO. From data taken at 0.45 T, the breakdown voltage of the 0.005 g/L sample is 58.9 kV; meanwhile, at 0.35 T, the value is 50.72 kV. According to J. Lee, nanoparticles in MO do not hold together and are dispersed well due to the presence of a magnetic field. Nevertheless, there are still many factors regarding the involvement of magnetic field strength that are still unknown.
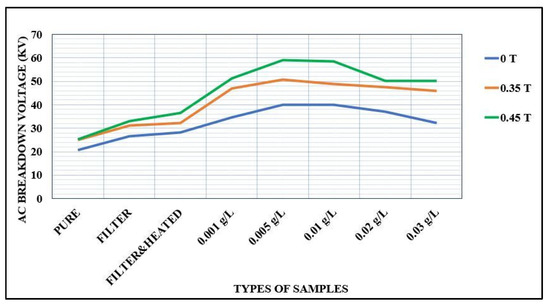
Figure 4.
Average breakdown voltages of samples with and without CNT concentrations and different magnetic fields applied.
Table 3.
Average breakdown voltage of different types of samples and magnetic field strengths.
3.2. Weibull Percentage
Figure 5, Figure 6 and Figure 7 show the AC breakdown voltage values of different samples with magnetic fields using Weibull Probabilities of 1 %, 50 %, and 90 %. The 1 % probability is known to be the riskiest level of breakdown voltage to occur, while the 50 % probability is known as the nominal voltage and the 90 % probability is the highest probability that the breakdown voltage may occur during operation.
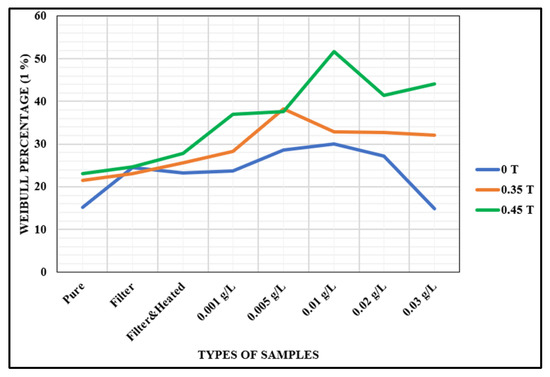
Figure 5.
Weibull percentage of 1 % of breakdown voltage.
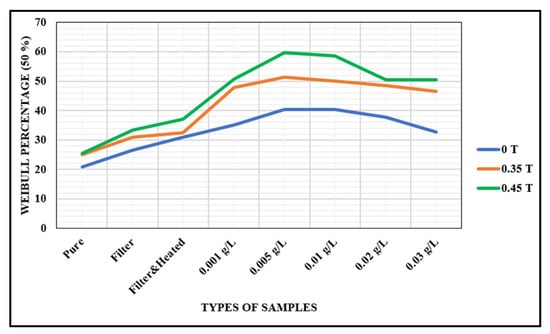
Figure 6.
Weibull percentage of 50 % of breakdown voltage.
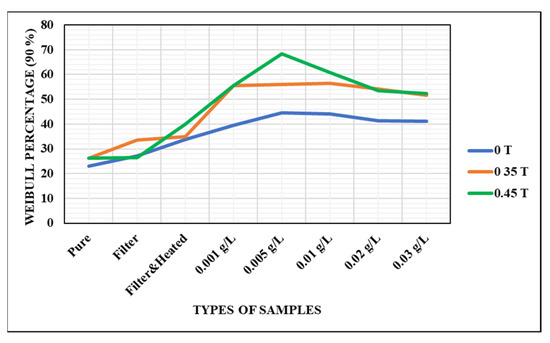
Figure 7.
Weibull percentage of 90 % of breakdown voltage.
From Figure 5, for pure MO, filtered MO, and filtered plus heated MO, the breakdown voltage value does not follow a pattern, even with the increasing of magnetic fields. This is probably due to the large distribution gap in the sample data taken. Expanding the measurement taken for each sample may help reduce the gap since the Weibull Probability differs from the data’s quality. This paper will focus on the 50 % probability since it is the standard value used by the industry in designing transformers. Contrarily, 0.005 g/L of nanofluid with a 0.45 T magnetic field has the highest breakdown voltage for the 50 % and 90 % Weibull Probabilities.
3.3. Tan Delta
Tan delta is known to be a dissipation factor or loss angle correlated to the purely capacitive current (90°) and total current that flows in insulation.
From the pattern shown in Figure 8, pure MO has the highest dissipation factor value for each temperature taken and the lowest dissipation factor value is the 0.005 g/L sample. As the temperature rises, the dissipation factor value also rises, which applies to all types of samples For example, the dissipation factor for pure MO at 30 °C is 0.00354, increasing to 0.00849 at 90 °C, as in Table 4.
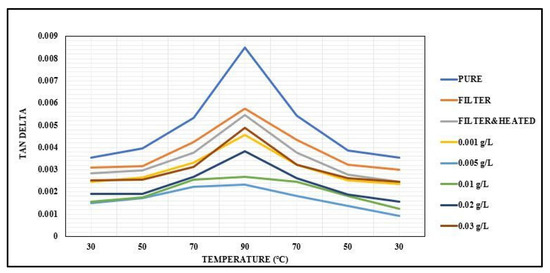
Figure 8.
Dissipation factors of different types of samples.
Table 4.
Dissipation factor values of different types of samples with temperature increasing from 30 °C to 90 °C and falling to 30 °C.
When the value of the dissipation factor is smaller, it shows that the resistive current is also smaller, which indicates that the insulator is highly resistive. Highly resistive components make good insulators, and samples of 0.005 g/L are suitable to serve as insulators. Pure MO has the highest dissipation factor, and the cause of large dissipation factor values may perhaps be that pure MO is contaminated with foreign particles and moisture, which causes the resistive current to increase. As the samples undergo the filtering and drying processes, the value of dissipation decreases as the contamination is reduced. The graph pattern shows that the data increase and decrease linearly.
3.4. Permittivity
Permittivity is related to how easily a material can become polarized by the imposition of an electric field on an insulator.
Figure 9 shows the graph of the permittivity of different types of samples. From the data obtained, at 30 °C to 90 °C, the permittivity values decrease, and from 90 °C to 30 °C, the permittivity values increase. As the temperature increases, the polar molecules’ movement is more elastic, causing the dipole moments to move and vibrate away from their place, which contributes to decreasing permittivity. Elastic collision among the particles cause ionization to occur, which will lead to a breakdown. The value of permittivity reduces with the rising temperature; however, only a small change in the value of permittivity takes place.
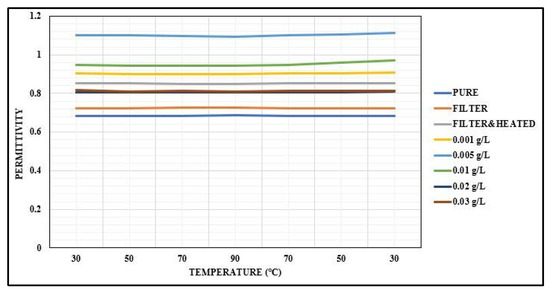
Figure 9.
Permittivity value of different types of samples.
From Table 5, pure MO has the lowest relative permittivity value, and the 0.005 g/L concentration has the highest permittivity value. High permittivity occurs due to the presence of an applied external electric field, causing the molecule to align itself and produce its own electric field and resist the external electric field. This means that high permittivity causes the ability to store more energy in the material, which causes more charged particles. The higher value of permittivity signifies a greater charge accumulation capacity of dielectric materials [19]. According to Kaizheng et al., the increase in the number of particles that have higher conductivity is attributed to the combined effect of the enhancement of the distortion of the electric field and the electron capture caused by the particles [20]. The value of permittivity reduces with the rising temperature; however, only a small change in the value of permittivity takes place. A low value of permittivity causes a small effect on polarization. An increase in thermal vibration due to temperature makes conduction occur rapidly, as it enhances electron scattering rather than affecting the electron–atom interaction, reducing the polarization [21].
Table 5.
Value of relative permittivity of different types of samples with temperature increasing from 30 °C to 90 °C and falling to 30 °C.
3.5. Resistivity
Resistivity is used to measure the resistance of a given size of a specific material to the conduction of electricity. A high resistivity value indicates the minimal presence of charged particles and contamination, while the lower the resistivity, the more readily the material permits the flow of electric charges.
As noted from the graph pattern in Figure 10, the resistivity decreases with the increase in time. As the temperature increases, the particles vibrate more easily and vigorously. The increase in temperature causes the conductivity to increase as the particles moves vigorously and collide with each other, causing ionization. Apart from that, high temperatures also lead to the degradation of the samples. It is observed that the 0.005 g/L sample has the highest resistivity value and pure MO has the lowest resistivity value, as shown in Table 6. The decrease in resistivity is mostly due to the presence of contamination and moisture. Contamination consists of polar molecules, which allows the charged particle to crossover more easily, which then leads to a breakdown [22].
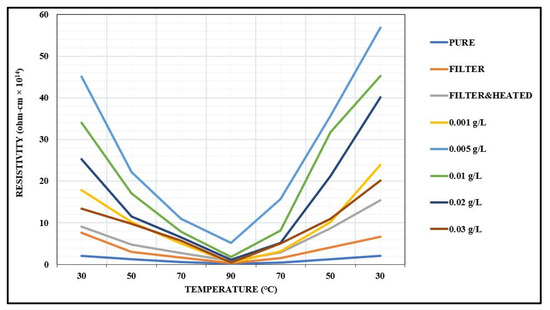
Figure 10.
Resistivity values of different types of samples.
Table 6.
Resistivity (ohm-cm × 1014) value of different type of samples with temperature increasing from 30 °C to 90 °C and falling to 30 °C.
3.6. Simultaneous Thermal Analysis
Testing the heat transfer capability in a transformer is important to maintain the internal temperature of the transformer. Simultaneous thermal analysis is used to analyze the small change in sample weight and the heat flow in real-time measurement.
Figure 11 shows the heat flow of different types of samples with increasing temperature. From the data taken, the 0.005 g/L sample has the highest heat flow, which means that it has the capability to absorb and transfer heat effectively. The addition of nanoparticles helps to enhance the thermal conductivity of MO. At a room temperature of 30 °C, the thermal conductivity continues to increase until it reaches 35 °C at which point the thermal conductivity started to decrease. This is probably due to the contamination that exists in the MO that acts negatively towards thermal conductivity. A high efficiency in transferring heat helps maintain the stability of the system and prevent overload. Pure MO has the lowest heat flow, showing low efficiency in heat transfer and absorption. The electrical properties of the samples affect the thermal conductivity: as the electrical properties reduce, the thermal conductivity will decrease. The thermal energy that comes from the transformer’s core or winding is absorbed by the transformer oil and is then passed to the surroundings or the cooling vent of the transformer. The cooling system in the transformer is essential to its efficient operation and to prevent any disaster from arising.
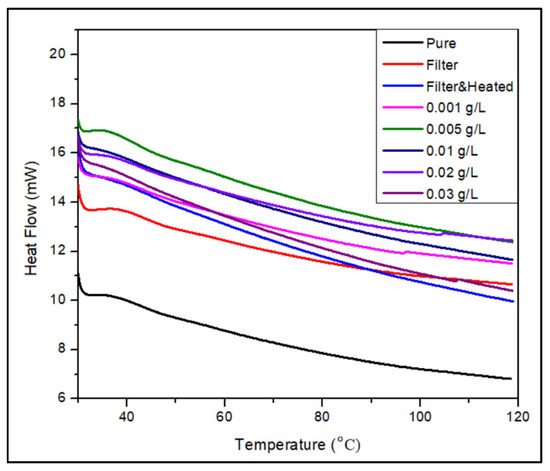
Figure 11.
Heat flow of different types of samples.
3.7. Raman Measurement
Raman measurements are used to characterize, extract, and analyze the special features of the bonding structure of samples by focusing the Raman spectrometer on the inelastic scattering of light.
Figure 12 shows the Raman spectra of different types of samples from 500 cm−1 to 3500 cm−1. The Raman spectra of the MO are characterized by taking the first-order region at 1400 cm−1 to 1600 cm−1 and the second-order region at 2800 cm−1 to 3000 cm−1. The first-order region of the Raman spectra is studied in this analysis, which contains the D-band and G-band.
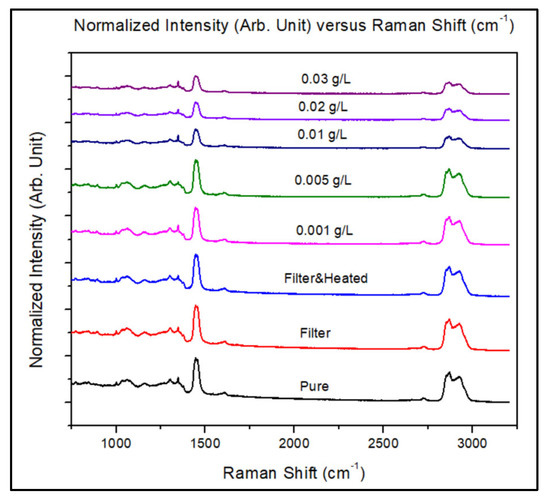
Figure 12.
Raman spectra of different types of samples.
Figure 13 shows the Raman spectrum of pure MO at the first-order region as a reference since each sample has an almost similar peak and pattern describing the chemical structure. The D-band (graphite) is referred to as a disordered band that originates from structural defects which exist in the first-order region around 1350 cm−1. Meanwhile, the G-band (graphite) is a prominent band that exist in the first-order region around 1450 cm−1. The shape of the Raman spectrum is identical and no additional peak exists, which concludes that the CNT molecules do not disrupt the structural behavior of MO [23].
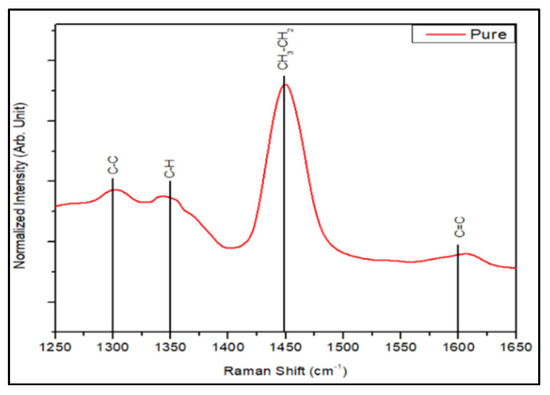
Figure 13.
Raman spectrum of pure MO in the first-order region.
The characteristic of disorder in structure can be seen by using the peak intensity ratio, as shown in Table 7. Pure MO has the highest intensity ratio of 0.4855, which indicates the presence of high disorder in the samples, while the lowest intensity ratio is from the 0.005 g/L sample, with the value of 0.3889. This shows that the higher the value of the intensity ratio, the lower the breakdown voltage. The D-peak with the highest value of intensity verifies the presence of oxygen functional groups in the samples. Furthermore, a large reflection of the structural distribution indicates that the structure crystallinity is reduced or damaged. By reflecting the structural distribution, the 0.005 g/L sample has the lowest intensity, which suggests the structure of the molecule is stable and is believed to have good electrical properties.
Table 7.
Intensity ratio of D-peak to G-peak of different types of samples.
4. Discussion
The action of dispersing the CNT nanoparticles in MO assists in trapping the electron in the CNTs’ shallow traps and converting fast-moving electrons to slow-moving ones, thus decreasing the electron avalanche process. However, the results from the 0.01 g/L, 0.02 g/L, and 0.03 g/L samples show that the dielectric strength decreases, indicating that excessive CNT reduces the AC breakdown voltage due to the formation of a bridge between the two electrodes. The increase in magnetic field strength helps in dispersing the CNT nanoparticles well. However, there are still a few things that are still unknown, such as the suspension patterns of the nanoparticles.
The discussion of the tan delta, permittivity, and resistivity values will focus on a temperature of 30 °C since it is the minimum operating temperature of a transformer. It is found that the 0.005 g/L concentration sample fulfils the properties of a good insulator, which are a low dissipation factor, a high permittivity, and a high resistivity. This is due to the presence of a suitable amount of CNTs in the MO, which helps in electron trapping and prevents the flow of charges. Referring to the Raman spectrum, the lowest intensity ratio from the 0.005 g/L sample indicates the molecules’ structures are stable and have better electrical properties than other samples. Moreover, the heat flow is also high in the 0.005 g/L sample, which shows it can absorb and transfer heat efficiently. The addition of nanoparticles helps enhance the thermal conductivity of the MO. It can be concluded that the addition of CNT nanoparticles and a magnetic field facilitates the improvement in the mineral oil’s performance as an insulator in the transformer. In addition, the proper preparation of samples helps to reduce the amount of unwanted particles and moisture in the MO.
Further addition of variables can be carried out to obtain more relevant results in determining and understanding the best insulation oil. In future work, investigation on how the path of the external magnetic field changes the dielectric features of transformer oil-based nanofluids can be improved. In addition, the interpretation of Raman data can be improved by using mathematical methods such as partial least squares regression (PLS). Further study can also be conducted using aging MO to identify how much aging affects its electrical properties compared to the unused MO. On top of that, further investigation on the chemical properties and physical properties helps obtain a better understanding of how the nanofluid can be improved.
5. Conclusions
Based on the experiment that has been carried out, the electrical properties of MO have been systematically studied. Improvement in MO’s properties in terms of AC breakdown has been implemented using various treatments, CNT nanoparticle concentrations, and magnetic field strengths. The measurement of parameters of concern related to the dielectric strength, tan delta, resistivity, permittivity, Raman spectra, and heat flow contributed to explaining the AC breakdown behavior. From the data obtained, it can be concluded that the 0.005 g/L concentration nanofluid samples are the best option for insulation oil as they fulfilled all the criteria of the electrical property parameters. Additionally, the addition of a magnetic field strength of 0.45 T with a sample concentration of 0.005 g/L is the most effective in enhancing the electrical properties.
Author Contributions
Investigation, S.A.A.F.; resources and validation, M.F.M.D., A.M.I., J.W., N.H.I. and W.F.H.W.Z.; writing—review and editing, S.A.A.F. and M.F.M.D. All authors have read and agreed to the published version of the manuscript.
Funding
This work is supported in part by the Fundamental Research Grant Scheme (FRGS/1/2019/STG07/UPNM/02/7) from the Ministry of Higher Education Malaysia.
Data Availability Statement
Not applicable.
Acknowledgments
Acknowledgement is given to the Faculty of Engineering, National Defence University of Malaysia for providing support in equipment and materials used to perform this research.
Conflicts of Interest
The authors declare that there are no conflict of interest regarding the publication of this paper.
References
- Mahanta, D.K.; Laskar, S. Electrical insulating liquid: A review. J. Adv. Dielectr. 2017, 7, 1730001. [Google Scholar] [CrossRef]
- Wang, X.; Tang, C.; Huang, B.; Hao, J.; Chen, G. Review of research progress on the electrical properties and modification of mineral insulating oils used in power transformers. Energies 2018, 11, 487. [Google Scholar] [CrossRef]
- Jacob, J.; Preetha, P.; Krishnan, S.T. Review on natural ester and nanofluids as an environmental friendly alternative to transformer mineral oil. IET Nanodielectr. 2020, 3, 33–43. [Google Scholar] [CrossRef]
- Lv, Y.; Zhou, Y.; Li, C.; Wang, Q.; Qi, B. Recent progress in nanofluids based on transformer oil: Preparation and electrical insulation properties. IEEE Electr. Insul. Mag. 2014, 30, 23–32. [Google Scholar] [CrossRef]
- Suhaimi, N.S.; Din, M.F.; Rahman, A.R.A.; Hamid, M.H.A.; Amin, N.A.M.; Zamri, W.F.H.W.; Wang, J. Optimum electrical and dielectric performance of multi-walled carbon nanotubes doped disposed transformer oil. Energies 2020, 13, 3181. [Google Scholar] [CrossRef]
- Yu, W.; Xie, H. A review on nanofluids: Preparation, stability mechanisms, and applications. J. Nanomater. 2011, 2012, 1–17. [Google Scholar] [CrossRef]
- Muangpratoom, P.; Pattanadech, N. Dielectric breakdown strength of mineral oil based nanofluids. In Proceedings of the International Conference on Condition Monitoring and Diagnosis (CMD), Xi’an, China, 25–28 September 2016; pp. 266–269. [Google Scholar] [CrossRef]
- Minea, A.A. A review on electrical conductivity of nanoparticle-enhanced fluids. Nanomaterials 2019, 9, 1592. [Google Scholar] [CrossRef]
- Naddaf, A.; Heris, S.Z. Experimental study on thermal conductivity and electrical conductivity of diesel oil-based nanofluids of graphene nanoplatelets and carbon nanotubes. Int. Commun. Heat Mass Transf. 2018, 95, 116–122. [Google Scholar] [CrossRef]
- Wong, K.V.; De Leon, O. Applications of nanofluids: Current and future. Adv. Mech. Eng. 2010, 2, 519659. [Google Scholar] [CrossRef]
- Suhaimi, S.N.; Rahman, A.R.A.; Din, M.F.M.; Hassan, M.Z.; Ishak, M.T.; Jusoh, M.T.B. A Review on Oil-Based Nanofluid as Next-Generation Insulation for Transformer Application. J. Nanomater. 2020, 2020, 2061343. [Google Scholar] [CrossRef]
- Hao, J.; Dan, M.I.N.; Liao, R. Effect of Moisture on Particles Accumulation and Oil Breakdown Characteristics in Mineral Oil and Natural Ester Under Non-Uniform DC Electrical Field. IEEE Access 2019, 7, 101785–101794. [Google Scholar] [CrossRef]
- Paper, W. The Effect of Moisture on the Breakdown Voltage of Transformer Oil. Vaisala 2011, 1, 1–4. [Google Scholar]
- Ahmad, M.H.; Arief, Y.Z.; Awang, N.A.; Ahmad, A. Characteristics of Mineral Oil-based Nanofluids for Power Transformer Characteristics of Mineral Oil-based Nanofluids for Power Transformer Application. Int. J. Electr. Comput. Eng. (IJECE) 2017, 7, 1530–1537. [Google Scholar] [CrossRef]
- Lee, J.C.; Seo, H.S.; Kim, Y.J. The increased dielectric breakdown voltage of transformer oil-based nanofluids by an external magnetic field. Int. J. Therm. Sci. 2012, 62, 29–33. [Google Scholar] [CrossRef]
- Lee, J.C.; Kim, W.Y. Experimental Study on the Dielectric Breakdown Voltage of the Insulating Oil Mixed with Magnetic Nanoparticles. Phys. Procedia 2012, 32, 327–334. [Google Scholar] [CrossRef]
- Korobeynikov, S.M.; Ridel, A.V. Electrical Properties of Transformer Oil with the Addition of Extremely Low Concentrations of Carbon Nanotubes. IEEE Trans. Dielectr. Electr. Insul. 2021, 28, 1643–1651. [Google Scholar] [CrossRef]
- Nazari, M.; Rasoulifard, M.H.; Hosseini, H. Dielectric breakdown strength of magnetic nanofluid based on insulation oil after impulse test. J. Magn. Magn. Mater. 2016, 399, 1–4. [Google Scholar] [CrossRef]
- Hussain, R.; Member, G.S. Dielectric Performance of Magneto-Nanofluids for Advancing Oil-Immersed Power Transformer. IEEE Access 2020, 8, 163316–163328. [Google Scholar] [CrossRef]
- Wang, K.; Wang, F.; Li, J.; Zhao, Q.; Wen, G.; Zhang, T. Effect of Metal Particles on the Electrical Properties of Mineral and Natural Ester Oils. IEEE Trans. Dielectr. Electr. Insul. 2018, 25, 1621–1627. [Google Scholar] [CrossRef]
- Yang, W.; Chung, D.D.L. Effect of temperature on the electrical conduction and dielectric behavior of solder. J. Mater. Sci. Mater. Electron. 2021, 32, 6511–6519. [Google Scholar] [CrossRef]
- Zhang, Y.; Tao, X.; Pan, C.; Tang, J. Role of Air Bubbles in the Breakdown of Flowing Transformer Oil. IEEE Trans. Dielectr. Electr. Insul. 2020, 27, 1752–1760. [Google Scholar] [CrossRef]
- Batakliev, T.; Petrova-Doycheva, I.; Angelov, V.; Georgiev, V.; Ivanov, E.; Kotsilkova, R.; Casa, M.; Cirillo, C.; Adami, R.; Sarno, M.; et al. Effects of graphene nanoplatelets and multiwall carbon nanotubes on the structure and mechanical properties of Poly(lactic acid) composites: A comparative study. Appl. Sci. 2019, 9, 469. [Google Scholar] [CrossRef]
Disclaimer/Publisher’s Note: The statements, opinions and data contained in all publications are solely those of the individual author(s) and contributor(s) and not of MDPI and/or the editor(s). MDPI and/or the editor(s) disclaim responsibility for any injury to people or property resulting from any ideas, methods, instructions or products referred to in the content. |
© 2023 by the authors. Licensee MDPI, Basel, Switzerland. This article is an open access article distributed under the terms and conditions of the Creative Commons Attribution (CC BY) license (https://creativecommons.org/licenses/by/4.0/).