Article

Enhancement of Microgrid Frequency Stability Based on the Combined Power-to-Hydrogen-to-Power Technology under High Penetration Renewable Units

by
Abdel-Raheem Youssef
1,
Mohamad Mallah
1,
Abdelfatah Ali
1,2,*,
Mostafa F. Shaaban
2 and
Essam E. M. Mohamed
1
1
Department of Electrical Engineering, South Valley University, Qena 83523, Egypt
2
Department of Electrical Engineering, American University of Sharjah, Sharjah 26666, United Arab Emirates
*
Author to whom correspondence should be addressed.
Energies 2023, 16(8), 3377; https://doi.org/10.3390/en16083377
Submission received: 21 February 2023 / Revised: 20 March 2023 / Accepted: 22 March 2023 / Published: 12 April 2023
(This article belongs to the Special Issue Modern Energy Storage Technologies towards Decarbonized Power Systems)

Abstract

:
Recently, with the large-scale integration of renewable energy sources into microgrid ( μ Gs ) power electronics, distributed energy systems have gained popularity. However, low inertia reduces system frequency stability and anti-disturbance capabilities, exposing power quality to intermittency and uncertainty in photovoltaics or wind turbines. To ensure system stability, the virtual inertia control (VIC) is presented. This paper proposes two solutions to overcome the low inertia problem and the surplus in capacities resulting from renewable energy sources. The first solution employs superconducting magnetic energy storage (SMES), which can be deemed as an efficient solution for damping the frequency oscillations. Therefore, in this work, SMES that is managed by a simple proportional-integral-derivative controller (PID) controller is utilized to overcome the low inertia. In the second solution, the hydrogen storage system is employed to maintain the stability of the microgrid by storing surplus power generated by renewable energy sources (RESs). Power-to-Power is a method of storing excess renewable energy as chemical energy in the form of hydrogen. Hydrogen can be utilized locally or delivered to a consumption node. The proposed μ G operation demonstrates that the integration of the photovoltaics (PVs), wind turbines (WTs), diesel engine generator (DEG), electrolyzer, micro gas turbine ( μ GT ) , and SMES is adequate to fulfill the load requirements under transient operating circumstances such as a low and high PV output power as well as to adapt to sudden changes in the load demand. The effectiveness of the proposed schemes is confirmed using real irradiance data (Benban City, Egypt) using a MATLAB/SIMULINK environment.

1. Introduction

Recently, producing electrical power from renewable energy resources has become an imperative and a promising means of green electrical power generation because of the decline in traditional fossil energy reserves [1]. Worldwide, the integration of renewable energy sources (RESs) into conventional electricity grids is expanding quickly. While decentralizing the production of bulk power plants, the RESs and distributed generators ( DGs ) may increase variations and disturbances due to the changing nature and uncertainties of RESs. For eliminating the limitations of interconnecting RESs/DGs to the grid, a microgrid ( μ Gs ) has been suggested as a suitable infrastructure [2]. Moreover, the reduced-order H controller significantly boosts the microgrid frequency control performance when compared to the best PI-based virtual inertia controller, increasing microgrid stability and resilience. With the increase in penetration levels of RESs, and due to the electrical connection of RESs to electric power grids or μG, the total inertia of the system is decreased, which reduces the overall system inertia and causes high-frequency fluctuations, which are considered indicative of the stability of the electrical power system [3,4].
The virtual emulation of the behavior of the synchronous generator (VSG) into μ Gs is a viable approach for enhancing system inertia, stability, and resilience. A virtual inertia control (VIC) has been proposed to address these issues in highly invasive renewable energy systems [5,6]. The VIC is regarded as a special form of VSG implementation, where the prime mover’s movement is simulated to provide frequency stability. To increase the set point of active power and the islanded μ Gs frequency stability, the virtual inertia control is applied based on the function of the Rate of Change of Frequency (RoCoF) [7,8]. For the steady performance of μ Gs , the balance between demand and supply in real-time is a vital step in order for the frequency to remain constantly in its acceptable range. Furthermore, the energy storage units may act as a load or as a power source to minimize frequency variations [9,10,11,12]. The VIC technology is based on the RoCoF, where the active power absorbed from or injected into the storage device is proportionate to the RoCoF where active power is emulated from energy storage systems (ESS) commensurate with the frequency deviation. The VIC technology prepares the microgrid to deal with expected disturbances, such as a loss in generation units, large frequency and voltage fluctuations, faults, and forced load shedding [13].
Many control technologies have been executed based on the VIC to maintain the stability of the μ G frequency [2,14,15,16,17,18]. In [14], the derivative controller is applied to enhance the stability of an interconnected power system frequency. To enhance the frequency stability and performance of interconnected systems with significant RESs penetration, a novel application of virtual inertia control-based derivative control approaches is presented in this work. The fuzzy logic control has been proposed as a VIC technique to enhance an isolated microgrid frequency stability [2,16]. The model predictive control (MPC) is developed for the implementation of the VIC to withstand the RESs’ high penetration levels in an isolated μ G [17]. The VIC based on the frequency response estimation method is developed to improve the power system stability [18]. The author in [19] develops the VIC based on different technologies to enhance an isolated μ Gs inertia and frequency stability.
The energy storage system (ESS) has been in existence for a long time and has been utilized in many forms and applications. Energy storage devices are included in the power system to raise stability and reliability as well as to make wider use of RESs a reality; the ESS can convert RESs from non-dispatchable power resources into a dispatchable electrical power source [20]. The energy storage application can be divided into three categories: mechanical, electrical, and chemical energy storages, as listed in [21]. There are many types of electrical energy storage devices, such as batteries, flywheels, supercapacitors, and superconducting magnetic energy storage (SMES), as listed in [22]. The SMES has been introduced previously in a variety of applications, increasing system efficiency overall in the presence of RESs. The study examined the implementation of a SMES and battery hybrid energy storage system in a small-scale off-grid wind power system. SMES and batteries were successfully hybridized to create a stable and quick-responding hybrid energy storage system to reduce wind power variations and balance the supply and demand for power [23].
Hydrogen energy is generally considered the most possible environmentally friendly energy source in the twenty-first century [24]. It has received international interest because of its clean, pollution-free features, efficient storage and transportation, and high consumption rate [25,26]. A hydrogen energy storage system (HESS) is a chemical storage technique that converts chemical energy to electrical energy [24,27]. Hydrogen ( H 2 ) storage has been shown to be an appropriate choice as a chemical energy storage system in μGs [28,29,30]. Hydrogen energy solutions have recently been considered in several areas, mainly power applications. In [31,32], an energy management method for an isolated μG with a hydrogen production and storage system is provided. Technical feasibility and stability can be improved under disturbances, including low-voltage ride-through (LVRT) capacity and oscillation mitigation concerns after incorporating the ESS in the wind turbine systems [9]. The application of hydrogen energy in tramways by fuel cells is described in [33], which may significantly increase system flexibility and minimize environmental pollution. During low load demand, H 2 may be produced on-site, employing excess electricity from RESs [34]. The produced H 2 can be stored in an H 2 cylinder and used by a fuel cell (FC) to generate power when the load demand is higher than the RES production [35]. The extra generated power from RESs, such as wind power (WP) or photovoltaic (PV) modules, is applied to an electrolyzer. There are several types of electrolyzers in the market, such as alkaline water electrolyzers (AWEs) [36], proton exchange membrane electrolyzers (PEMEs) [37], and solid oxide electrolyzers (SOECs) [38].
Water electrolysis has been demonstrated to be an effective method for producing H 2 in μ Gs [39]. Hydrogen is an energy carrier that can be produced by splitting water molecules into hydrogen and oxygen molecules in an electrolyzer. The process is known as electrolysis, and the chemical processes that occur require electricity as an energy source. Following that, the generated hydrogen can be kept until it is further transported to fulfill end-use energy demands. According to the observations of the prior research, a hydrogen energy system can provide more load flexibility and long and short-term energy storage while simultaneously posing new problems to μ G control.
Remote areas face many challenges, such as sudden changes in loads, as well as sudden changes in weather conditions and radiation. Moreover, the presence of renewable energy sources, such as solar energy, reduces the inertia of the system. It is vital to utilize the enormous potential of supplying frequency management and regulating electricity to ensure safety. As a result, substantial research has been conducted to produce more effective frequency controllers for μ Gs . The following contributions are made by this paper:
  • Proposing a new VSG method based on the SMES system to improve the frequency stability of ultra-low-inertia power grids while accounting for high levels of RES penetration.
  • The suggested virtual controller (PI controller) is a composite of a virtual primary and virtual secondary controller.
  • The solar power stations were divided into several small stations to restore stability of the μG at a high penetration level of RES and low load demand.
  • Employing HESS to utilize the whole power generated from RES without power curtailment.
The rest of the paper is organized as follows: Section 2 introduces the modeling and structure of the studied μ G T ; Section 3 presents the proposed VIC technology; and Section 4 introduces a comparison of two solutions to overcome μ G T disorders. The work is concluded in Section 5.

2. System Dynamics of an Isolated Microgrid

To illustrate the control strategy presented in this work, a hybrid μ G with hydrogen and battery storage is constructed as depicted in Figure 1. The investigated system is divided into five parts: DEG, RESs, HESS, SMES, and loads [40]. To simulate system operation and control, the hybrid μ G is investigated in Figure 1 and is modeled using MATLAB Simulink. The studied μ G here consists of three sections. The first is the generation and load section; the generation can be represented by the DEG, PVs, and WTs, while the second is the storage section, which contains a hydrogen storage system that consists of AWEs, a hydrogen storage tank, and μ G T . The efficiency of the AWEs is 54% and the efficiency of the micro-gas turbine is 40%. Hence, the round efficiency of the HESS is 21.6%. The third and last is the virtual inertia control section, which contains SMES and PID control. The μ G is fed by a DEG with 950 kW, 1256 kW of photovoltaic arrays, 41 units with each unit producing 30.6 kW and 591.3 kW of wind power, and 30 units with each unit produces 19.7 kW. The energy storage is accomplished via SMES and HESSs including electrolyzers, H 2 tanks, and a μ GT as another energy storage and domestic load, with a maximum value of 950 kW [41].

2.1. Deisel Engine Generator (DEG)

The diesel engine generator (DEG) is used as a backup source if renewable energy sources and a storage system are insufficient to fulfill the load power requirements. Several studies on DEG modeling have been conducted [42,43]. Figure 2 depicts a model of a prime mover and governor for the DEG. The DEG may be represented by the first-order conversion function stated in Equation (1).
G D E G ( s ) = 1 T D E G S + 1
where T D E G represents the overall DEG time constant taking in mind the governor time constant, generator time constant, and inertia delay time constant, which can be calculated as [44].
T D E G   = J ω n 2 S n
where ω n is the rated angular velocity and J is the moment of inertia ;   S n is the apparent power (VA).

2.2. Photovoltaic System
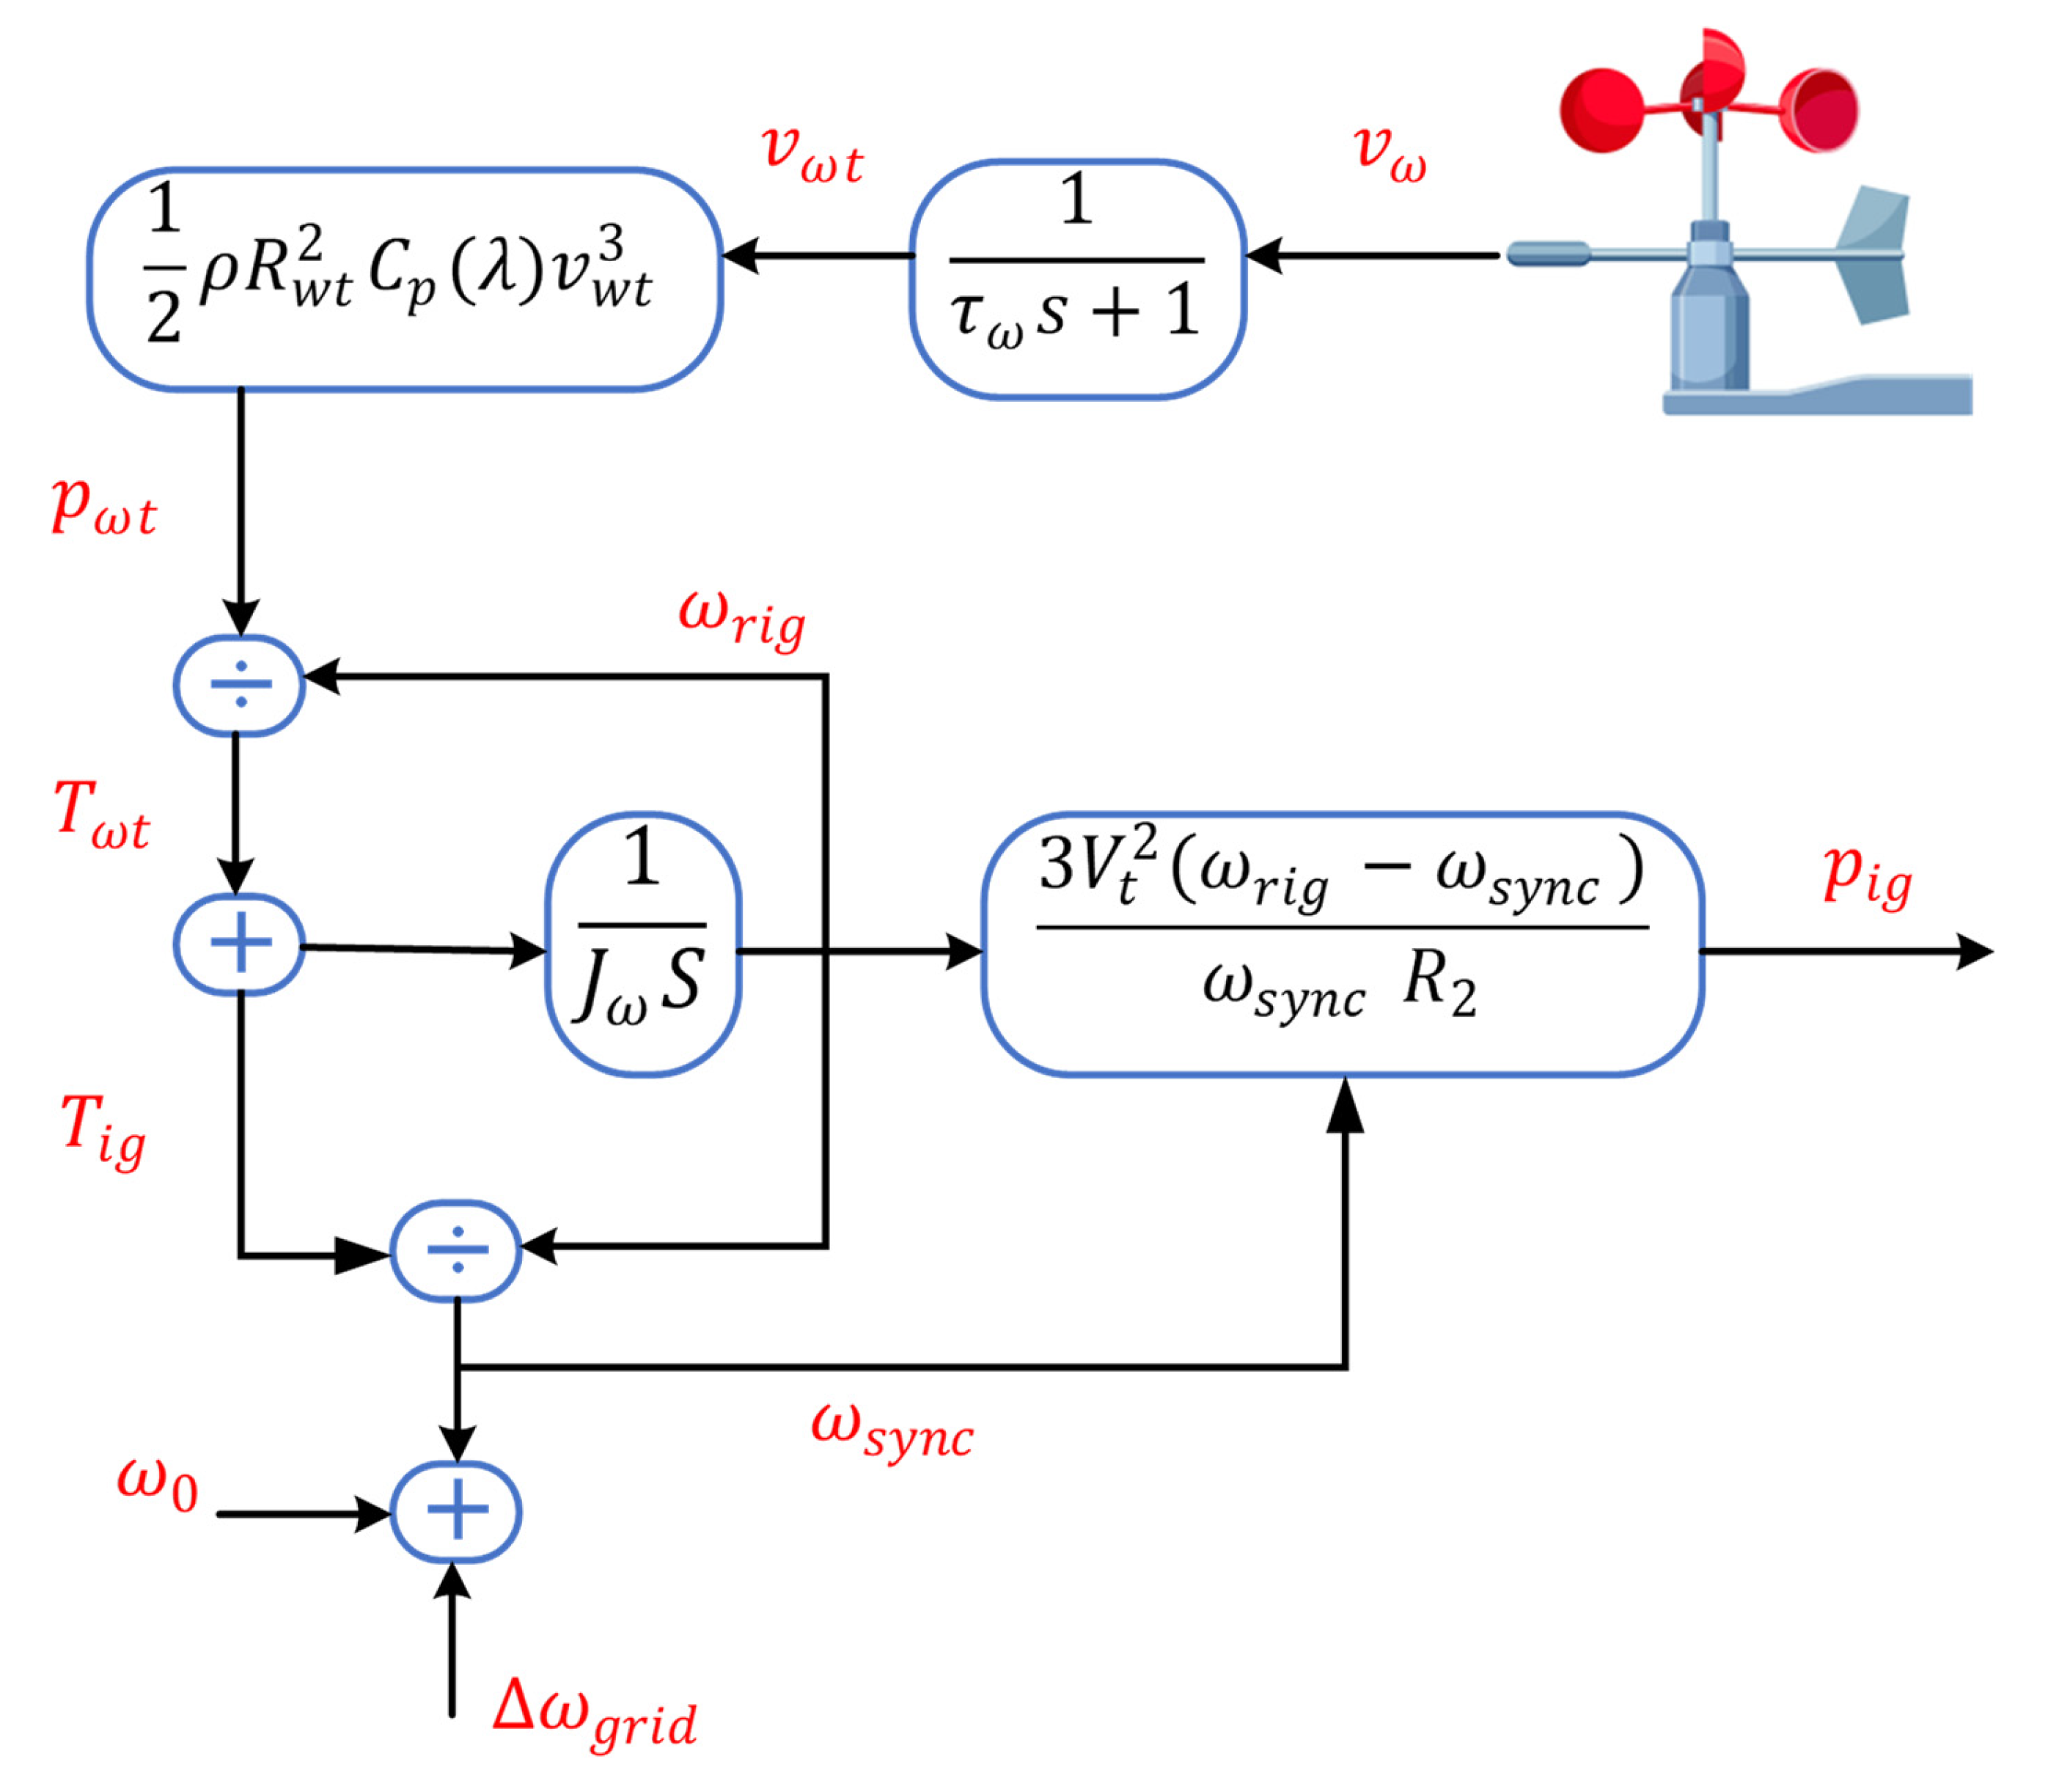
The solar irradiance model, as depicted in Figure 3, is given using the following equation,
P P V = δ × S × ×   ( 1 0.005 ( T A + 25 ) )
where δ is defined as the photovoltaic array conversion efficiency and always ranges from 9% to 12%; S is the panel area in m 2 , ∅ is the solar radiation; T A is the ambient temperature in degrees Celsius.

2.3. Wind Turbines

For the WTG system, the following equation was often employed to compute the mechanical power output of wind turbines. The wind turbine output mechanical power can be expressed as:
P w t = 0.5 π     R 2     ρ     C p ( λ )   υ w 3
where ρ is the density of air ( kg / m 3 ) ,   R is the radius of the blade ( m 2 ), υ w is the wind speed ( m / s ) , and C p   is the power coefficient defined as a function of the tip speed ratio [45]. The wind turbine is coupled with the induction generator (IG) through the gearbox, as shown in Figure 4.

2.4. Process Model of HESS

Hydrogen is an energy carrier that can be produced by splitting water molecules into hydrogen and oxygen molecules in an electrolyzer. The process is known as electrolysis, and the chemical process requires electricity as an energy source. Following that, the generated hydrogen is kept until it is further transformed to fulfill end-use energy demands.
If the end-use requirement is electricity, the conversion can be carried out using a fuel cell, which combines hydrogen molecules with oxygen to generate water and energy. Hence, the conversion of power-to-power through HESS comprises three parts:
  • Hydrogen production: electrolysis converts electrical energy to chemical energy.
  • Hydrogen storage: refers to the chemical energy storage of hydrogen in a H 2 tank.
  • Electricity generation: chemical energy converted to electrical energy via a μ G T [9].
Thus, HESS is classified into three separate subsystems. This section delves deeper into the technology of these subsystems.

2.4.1. Hydrogen Production—Electrolyzer

Several types of electrolyzers may be classified by the kind of electrolyte, operating temperature, and used charge carrier. The most commonly used techniques are the proton exchange membrane electrolyzer (PEMEL), alkaline electrolyzer (AEL), and solid oxide electrolyzer (SOEL). The AELs are used in this article because they are the most mature electrolyzer technologies in the market, with lower investment costs and greater efficiency than the PEMEL and SOEL [24]. The electrolyzer runs in the current mode and the electrolyzer operating voltage is given as [46], the designed AWE is shown in Figure 5, and the parameters have been listed in Table A4.
The total power consumed by one group of the electrolyzers is as follows [47].
D c p o w e r = U e l e × I e l e × n c e l l
where I e l e is the current flow through one group is and n cell is the number of cells in one group. The electrolyzer operates in current mode. The operating voltage of an electrolyzer is given using [48].
U e l e = V r e v 0 + ( r 1 + r 2 × T E a E ) I e l e + s × log [ ( t 1 + t 2 T E + t 3 T E 2 a E ) I e l e + 1 ]
where T E is the operating temperature of the electrolyzer, r 1 and r 2 are parameters related to the internal resistance of the electrolyzer, in which r 2 reflects the change in internal resistance with temperature. s ,   t 1 ,   t 2 , and t 3 are related to overvoltage caused by the polarization of electrodes and electrolytes. t 2 and t 3 reflect the over-voltage with the change in temperature. r 1 ,   r 2 ,   t 1 ,   t 2 , and t 3 are all empirical parameters, which can be measured via experiments. The reversible open circuit voltage V r e v 0 reflects the minimum potential between electrodes when every single electrolytic monomer is electrolyzing water. The hydrogen flow rate ( Q H 2 ) can be calculated using:
Q H 2 = { ( I e l e / a E ) 2 f 1 + ( I e l e / a E ) 2 } ( 1 n × F )

2.4.2. Micro GAS Turbines

The μ G T is a generation means that converts the chemical energy that is stored in the form of hydrogen into electrical power. Chemical energy, unlike batteries, is not contained in the device, so the conversion process requires a constant supply of fuel, as shown in Figure 6. The main μ G T components are the compressor, combustion chamber, turbine, and generator. There are additional parts to enhance the μ G T   performance, such as a recuperator, in which the cooled air is exchanged with the hot gas [49], an economizer heat exchanger, which heats the water with exhaust gas having left the recuperator, and an evaporative cooler, which mixes the water with compressed air [50].
The μ G T fuel mass flow rate ( m f r ) can be calculated as follows [41]:
m f r = 0.001174 × exp   ( 0.00005343 × n )
where n is the μ G T speed, the μ G T generated active power can be calculated as follows:
P μ G T = m f r × μ G T e f f × L H V
where   μ G T e f f is the μ G T efficiency and L H V is the lower heating value.

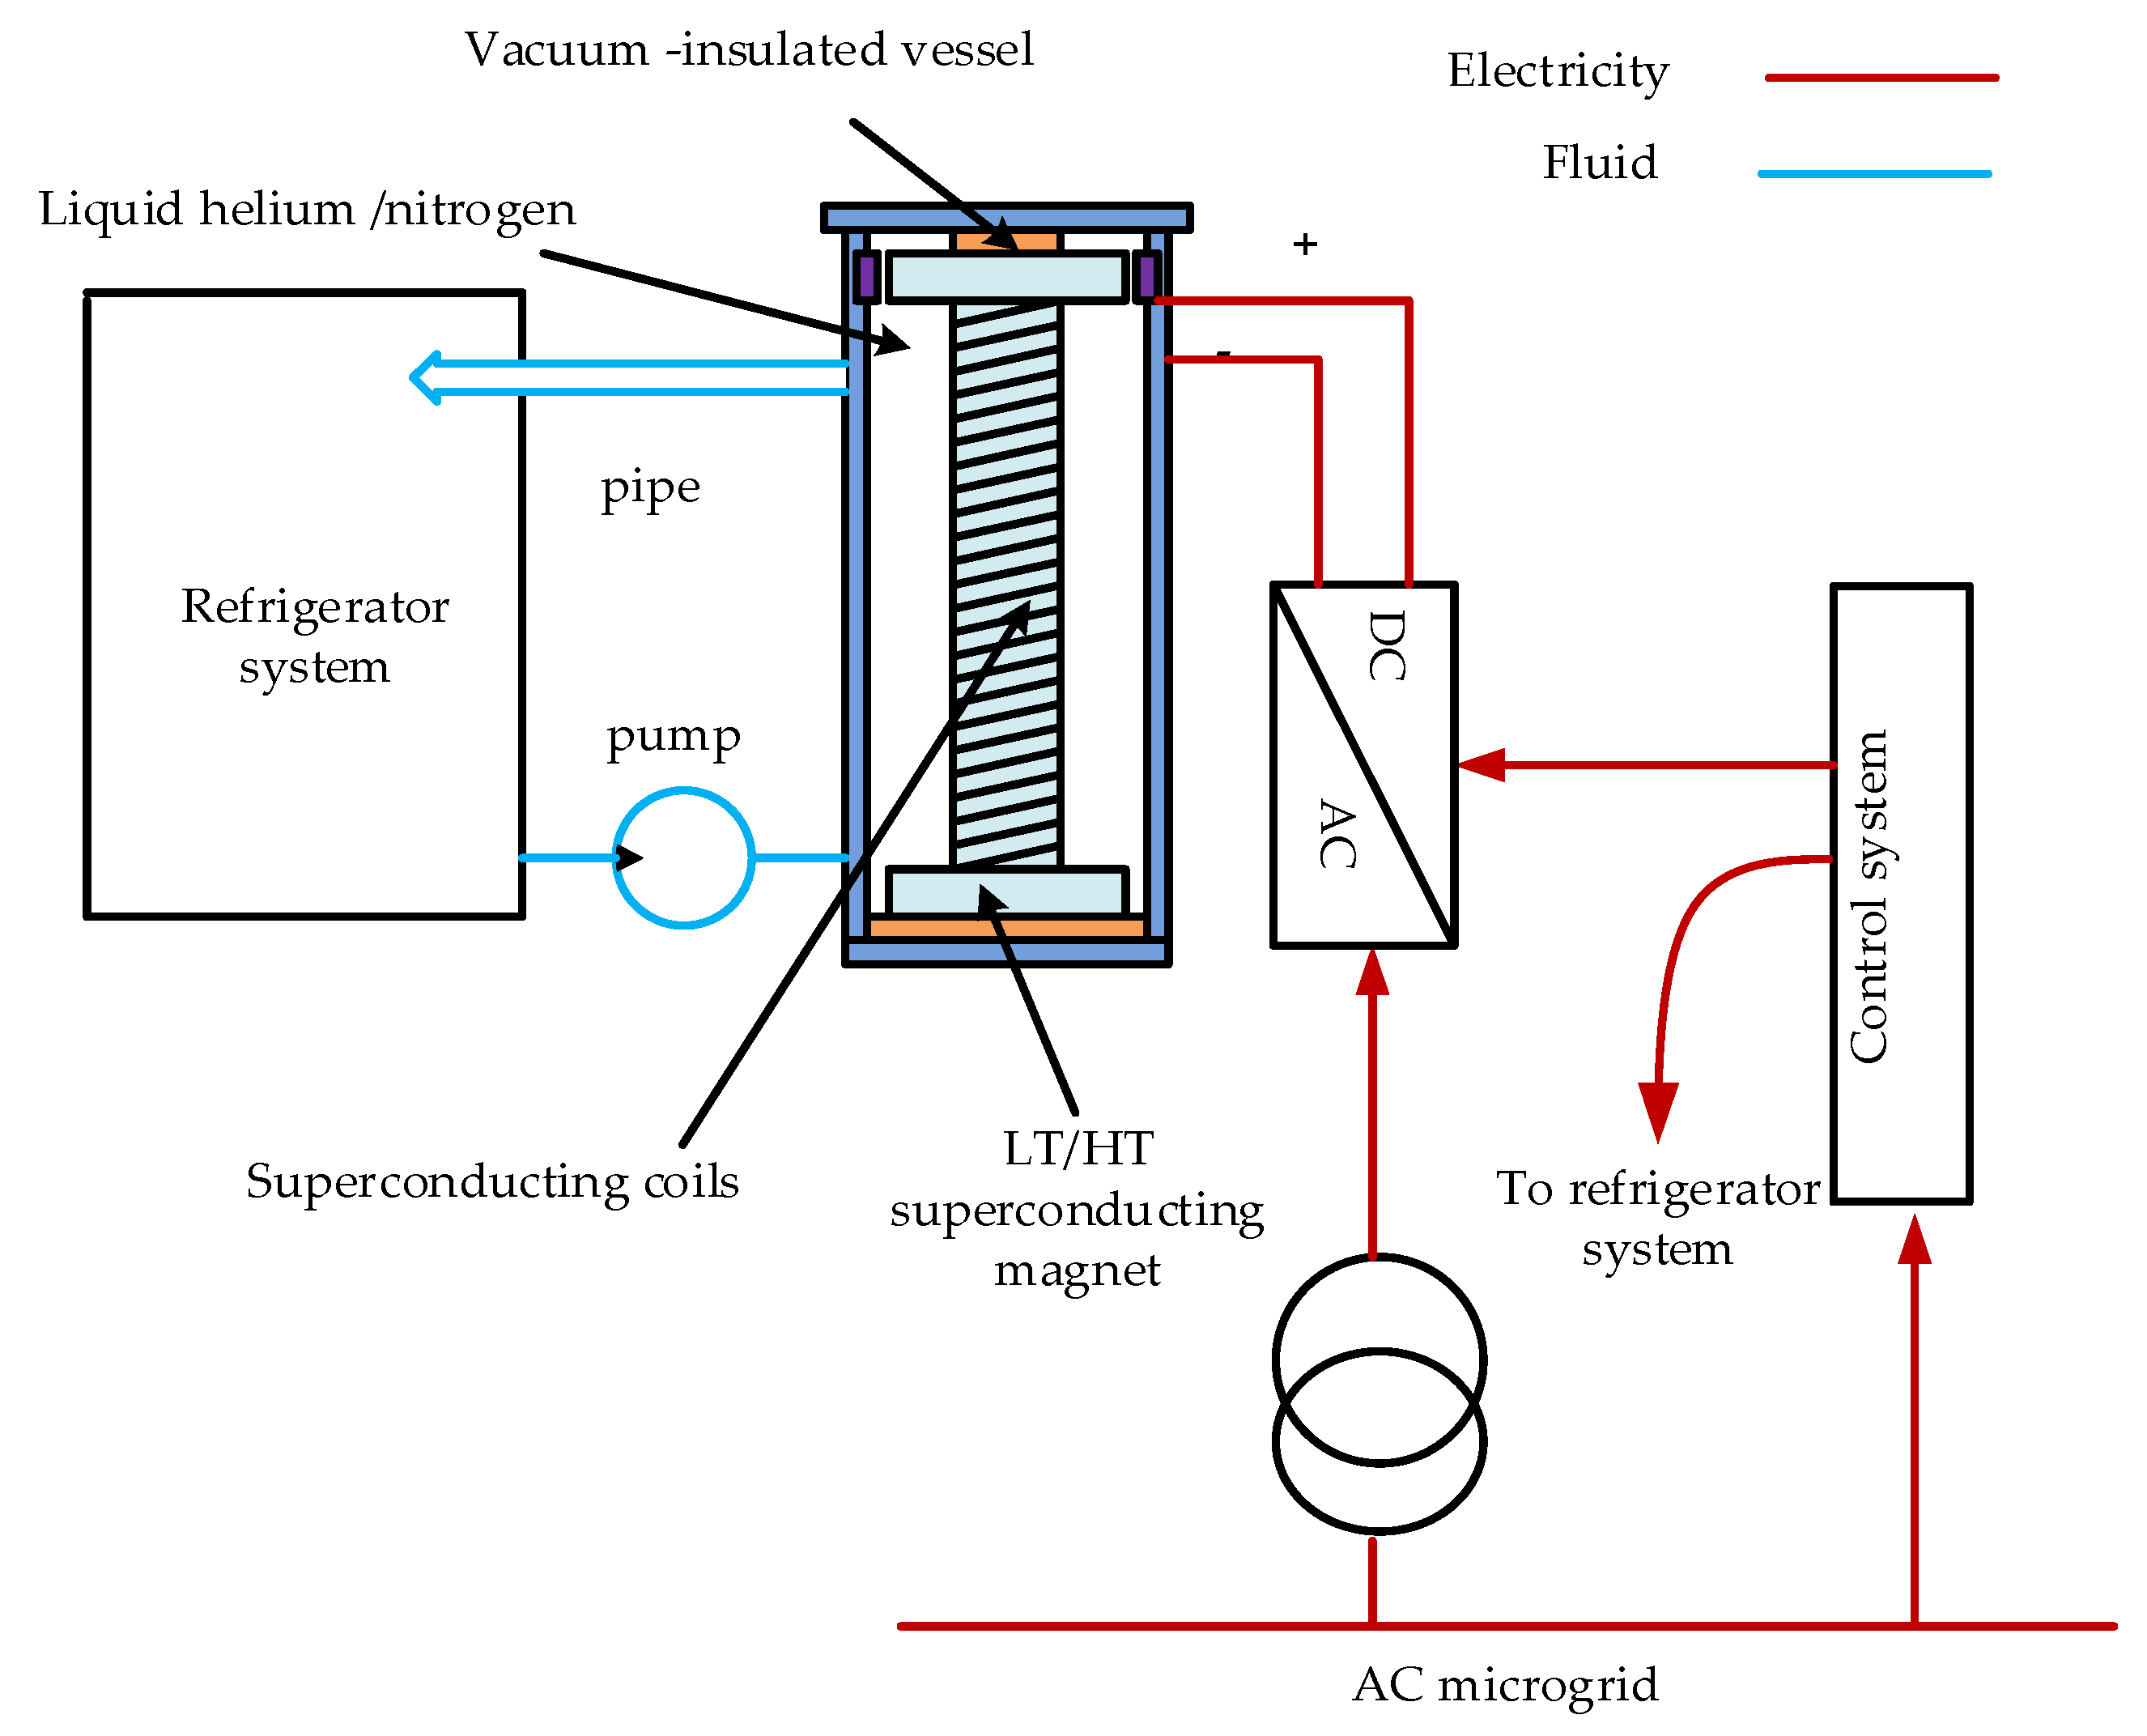
2.5. Design of VIC Based on the SMES Device

The VIC part consists of two main segments [51]: the first is the SMES and the other is the control system. The control system manages the SMES by using a PID controller [52,53]. The block diagram of the SMES is shown in Figure 7.

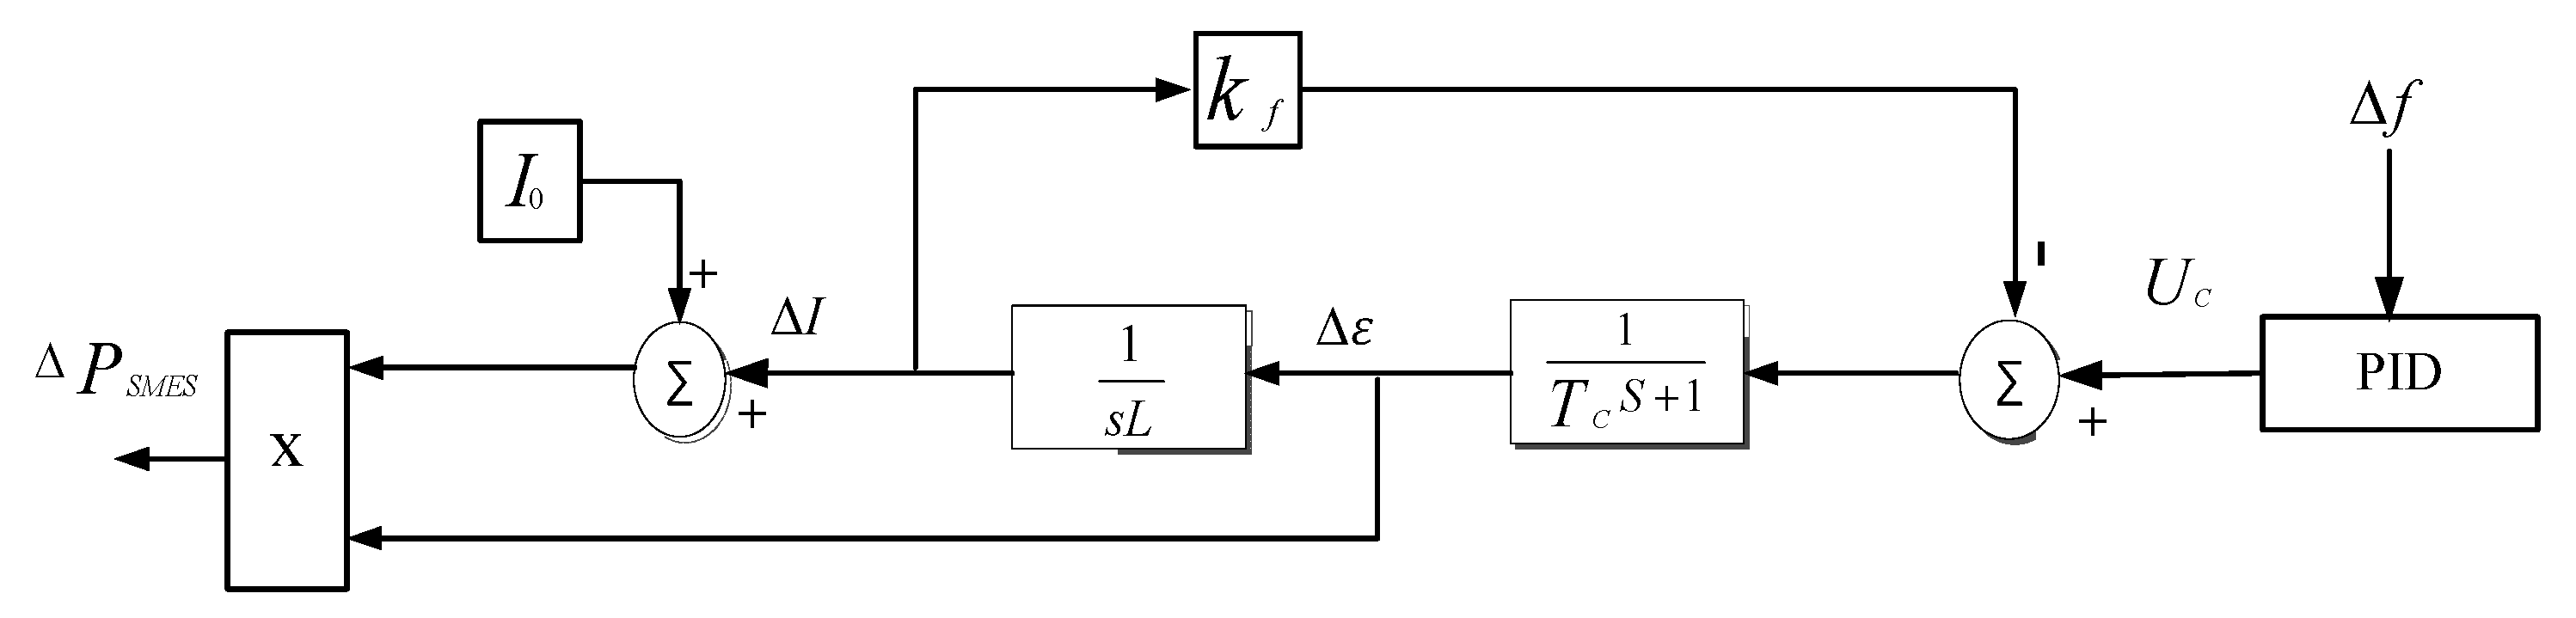
Mathematical Model of SMES Device

The magnetic coil, which is made of a special superconducting material with nearly zero resistance, is the central component of the SMES system [54]. As long as the SMES coil is kept superconducting, a zero-energy loss can be guaranteed, resulting in high efficiency. By immersing the SMES coil in a helium vessel, it should be cooled to the superconducting temperature [54]. Figure 8 illustrates the SMES construction [54].
The stored energy ( E S ) in the superconducting coil can be calculated from:
E S = 0.5 × L I 0 2
where L is the coil inductance.
The rated power P S M E S of the superconducting coil can be described using the following equations:
P S M E S = d E S d t =   LI 0 2 × dI 0 dt
The change in SMES output power can be calculated from:
Δ P S M E S   = Δ ε × ( Δ I + I 0 )
where Δε the gradual change in the SMES inductor applied voltage and can be calculated as follows:
Δ ε = 1 T C s + 1 × ( U C + k f     Δ I )
where k f is the inductor current deviation feedback gain and ΔI is the SMES inductor current deviation and can be calculated using:
Δ I = Δ ε s L

3. Virtual Inertia Control System

In conventional power systems, the kinetic energy ( E k ) inherent in the rotational mass, including spinning loads, represents the inertia power response, and can be calculated as follows [55]:
E k = 1 2 j ω 2
where j is the moment of inertia of the power system in ( kgm 2 ) and ω is the angular frequency deviation in ( rad / s ) . The power system inertia constant ( H ) can be calculated using [56]:
H = E k S
where S , is the rated apparent power. The relationship between frequency and active power in a μ G is as follows:
H d f d t = P D G P l o a d D × Δ f
where H is the μ G inertia coefficient, P D G is the sum of the D G s ' output active power, P l o a d is the sum of the needed loads, D   is the μ G damping coefficient, and Δf is the frequency deviation.
The SMES system is used to provide virtual inertia for μG due to its quick response characteristic. As a result, the overall frequency characteristic of the μG can be described as:
H × d f d t = P D G P l o a d     P S M E S D × Δ f
According to the previous equation, adding an SMES system to the μ G improves the inertia and damping of the μ G . The μ G can obtain a robust frequency characteristic by selecting the appropriate coefficient.

4. Results and Discussions

The simulation results of the isolated µG have been carried out using MATLAB/Simulink®. To validate the robustness and effectiveness of the proposed solutions. Three severe test scenarios are implemented to examine the μG frequency response and robustness using the provided control strategy. The μ G   system depicted in Figure 1 is used as a test system to demonstrate the effectiveness of the suggested control scheme. To examine the performance of the isolated AC grid, the high penetration level of the RES and sudden load change are considered as presented in Figure 9. All system parameters are presented in Appendix A.

4.1. Studied Scenarios

Scenario 1: VIC is enhanced with SMES managed by the PID control.
In this scenario, the μ G system is depicted in Figure 1 is employed to evaluate the effectiveness of the suggested control technique. The VIC depends on the SMES only in this case. The hydrogen storage system has not been considered. This scenario is divided into two sub-scenarios.
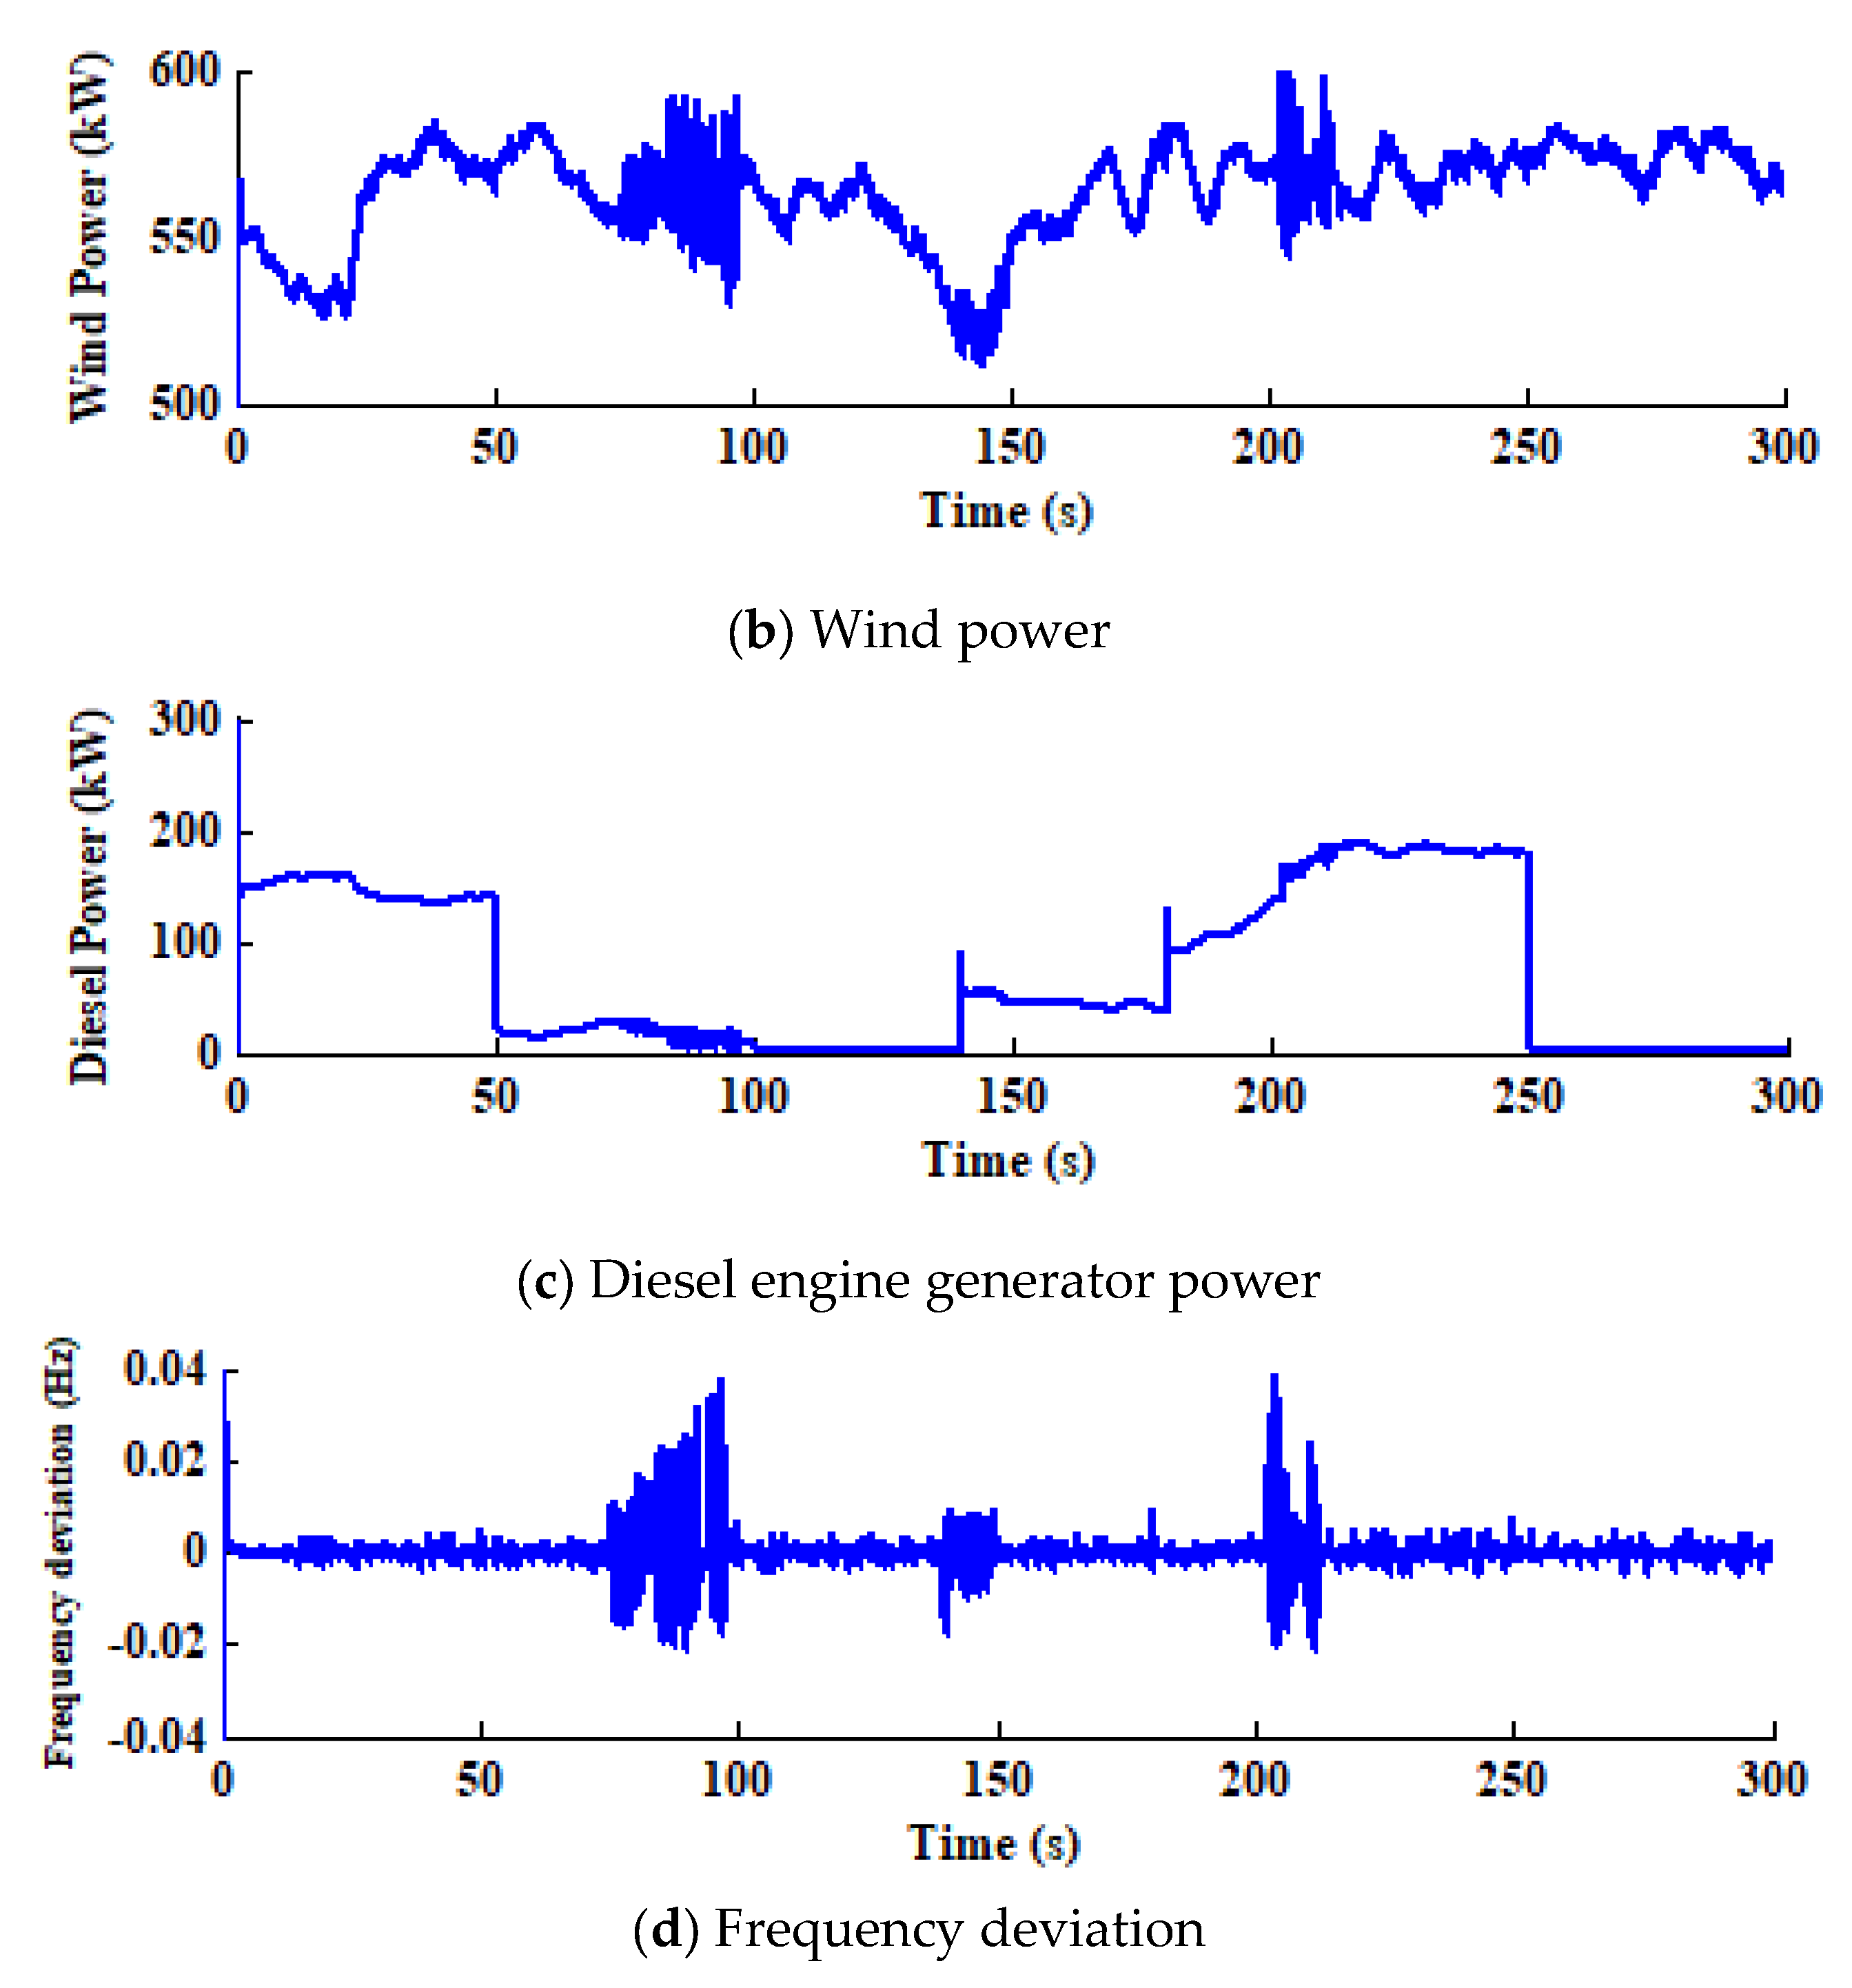
Scenario 1A: in this sub-scenario, the wind farm operates as a single station. Additionally, the PV generation system is controlled with load variation. Figure 9 shows the simulation results for scenario 1 under the high penetration level of the RES. The load demand profile changes with an average value of 689 kW, and the load demand values during different durations are as follows: 850 kW at 0 ≤ t ≤ 50 s, 610 kW at 50 ≤ t ≤ 100 s, 402.4 kW at 100 ≤ t ≤ 140 s, 730 kW at 140 ≤ t ≤ 180 s, 934 kW at 180 ≤ t ≤ 250 s, and 462.5 kW at 250 ≤ t ≤ 300 s, as shown in Figure 9a. The real irradiance profile for 24 h is acquired from Benban-Aswan, as illustrated in Figure 9b. In Figure 9c, the wind speed profile varies, with an average speed of 8 m/s under a turbulence intensity ratio of 20%. During the period 0 ≤ t ≤ 75 s, the amount of energy generated from the PV power stations is zero, as shown in Figure 9d. Moreover, the power generated from the diesel and the wind power station feeds the load, as illustrated in Figure 10e,f. So, the frequency deviation is zero, as shown in Figure 9g. During the period 75 ≤ t ≤ 212.5 s, this period represents the operating period of the PV power stations from 6 am to 5 pm. The amount of energy generated from solar power stations increases gradually, as shown in Figure 9d. However, when the amount of generation from solar power plants increases, the μ G   loses its frequency balance due to the low load demand and the large production of energy generated from PV power plants at t = 100 s. The deviation reaches 3 Hz, as depicted in Figure 9g. As a result, the power extracted from the wind power, the PV station, and the DEG reaches zero.
Scenario 1B: To eliminate the blackout of the G , the solar power station is divided into several identical groups. Several groups are turned on or off according to the SMES storage capacity and load requirements. The load demand profile, wind speed profile, and solar irradiance profile are shown in Figure 9a–c. Figure 10 shows the simulation results for scenario 1B under the high penetration level of the RES. In this scenario, during the period 0 ≤ t ≤ 75 s, the amount of electricity produced by solar power plants is zero, as depicted in Figure 10a. Moreover, to maintain the stability of the microgrid and to keep the amount of change in frequency always at zero, as depicted in Figure 10d, a portion of the solar energy system is used to power loads, while another portion is isolated to ensure microgrid stability, as shown in Figure 10a. The electricity generated by the diesel and wind power stations feeds the load, as illustrated in Figure 10b.
Figure 10. The simulation results for scenario 1B under the high penetration level of the RES.
Energies 16 03377 g010aEnergies 16 03377 g010b
Scenario 2: μ G with a hydrogen storage system and SMES managed by the PID control.
In this scenario, to maintain the stability of the microgrid and withstand the challenges of the uncertain photovoltaic system, the hydrogen storage system is considered. The load demand profile, wind speed profile, and solar irradiance profile are shown in Figure 9a–c. Figure 11 shows the simulation results for scenario 2. In this scenario, the used solar energy stations continue to work without interruption during the period from 6 am to 5 pm, as shown in Figure 11a. Moreover, Figure 11b illustrates that the wind power plants are operating at full capacity all the time. As a result, the reliance on diesel energy is reduced, as shown in Figure 11c. During the period of operating the solar power stations at full capacity, the electrolyzer works to produce quantities of hydrogen and store them to maintain the stability of the network. Figure 11d shows the amount of energy consumed by the electrolyzer during a high penetration level of the RES. The amount of hydrogen produced by the electrolyzer during its operation period is shown in Figure 11e. If there is no power generated from the solar power stations, the micro-gas turbines operate to meet part of the load requirements, as shown in Figure 11f. In this scenario, it can be seen that the change in frequency is very small in this scenario, as shown in Figure 11g. It is worth mentioning that the maximum frequency deviation, in this case, is kept within ±0.02 Hz.

4.2. Comparative Study

To verify the maximum benefit from the production of solar power plants, we note the amount of energy generated in the different operating conditions. Figure 12a illustrates the extracted power from PV modules in different scenarios. It can be seen that the hydrogen storage system allowed us to extract the largest possible energy from solar stations for capacities of up to 1000 kW, compared to 150 kW in the case of the operating part of the solar power stations in scenario 1. Moreover, the hydrogen storage system kept microgrid balance and small changes in frequency, as shown in Figure 12b.

5. Conclusions

The high penetration of renewable energy-based units in the microgrid is not without challenges. One of these challenges relates to entity management during times when the system is experiencing significant overcapacity. To address the problem, this paper suggested utilizing two different solutions. Firstly, the solar power station is separated into various groups that are identical. Several groups are activated or deactivated based on the SMES storage capacity and load needs. The second solution consists of a hydrogen storage system being used to preserve the large capacities generated by solar power plants. The outcomes of the scenario involving hydrogen storage technology indicate that the micro-grid is a feasible new solution for rural places with rich renewable resources. This technology offers wider application potential as a viable option for providing access to clean energy and reducing carbon emissions. By separating solar power groups step by step according to the loading demand, they can restore their stability, continuity, and low-frequency deviation with a maximum value near (0.0366 Hz) at PV power (34.29 kW); by then applying hydrogen energy storage, the frequency deviation can be reduced from (0.0366) to (0.02). Moreover, it can be observed that the hydrogen storage system enabled us to extract the most energy possible from solar stations with capacities of up to 1000 kW, compared to 150 kW in the event of running only a portion of the solar power stations.

Author Contributions

Conceptualization, A.-R.Y., A.A., M.F.S. and E.E.M.M.; Methodology, M.M. and A.A.; Software, M.M.; Validation, A.-R.Y., A.A. and E.E.M.M.; Investigation, M.F.S.; Resources, A.-R.Y. and E.E.M.M.; Data curation, M.M.; Writing—original draft, M.M.; Writing—review & editing, A.-R.Y., A.A. and E.E.M.M.; Visualization, M.M.; Supervision, M.F.S.; Project administration, E.E.M.M.; Funding acquisition, M.F.S. All authors have read and agreed to the published version of the manuscript.

Funding

The work in this paper was supported, in part, by fund #FRG20-L-E112 and the Open Access Program from the American University of Sharjah. This paper represents the opinions of the author(s) and does not mean to represent the position or opinions of the American University of Sharjah.

Data Availability Statement

Not applicable.

Conflicts of Interest

The authors declare no conflict of interest.

Appendix A. System Parameters

Table A1. Performance factor coefficients [26].
The coefficients C1 to C5 C 1 = 0.76 C 2 = 125
C 3 = 6.94 C 4 = 16.5
C 5 = 0.002
Table A2. Diesel engine parameters [29].
k p = 500
k I = 30
k D = 0.1
R = 3
T D E G = 2
Rated power P D E G = 925   kW
Table A3. Wind system parameters [31].
Rated power P = 20   kW
Pole pairs number n p = 2
Moment of inertia J w = 1.2   kg · m 2
Table A4. Alkaline water electrolyzer constants [36].
r 1   = 3.53856 ×   10 4 t 3   = 3.41025 ×   10 3
r 2   = −3.0215 ×   10 6 T E   = 100
a E   = 0.45N = 2
t 1 = 5.13093 n c e l l   = 300
t 2   = −2.40447 ×   10 2 s = 0.22369
Table A5. Micro-gas turbine constant [37].
P r P r e f k p k i D t u r t 1 t 2 t 3 k t H D g L M
250 kW 111.080.03100.13.01.08.220.11.2
Table A6. SMES model parameters [38].
k f I 0 T C L k p k I k D
0.0010.4 kA0.003 s0.03 H12.108540.09080.614

References

  1. Zhou, D.; Al-Durra, A.; Zhang, K.; Ravey, A.; Gao, F. A robust prognostic indicator for renewable energy technologies: A novel error correction grey prediction model. IEEE Trans. Ind. Electron. 2019, 66, 9312–9325. [Google Scholar] [CrossRef]
  2. Kerdphol, T.; Rahman, F.S.; Mitani, Y.; Watanabe, M.; Küfeoǧlu, S.K. Robust virtual inertia control of an islanded microgrid considering high penetration of renewable energy. IEEE Access 2017, 6, 625–636. [Google Scholar] [CrossRef]
  3. Frack, P.F.; Mercado, P.E.; Molina, M.G. Extending the VISMA concept to improve the frequency stability in microgrids. In Proceedings of the 2015 18th International Conference on Intelligent System Application to Power Systems (ISAP), Porto, Portugal, 11–16 September 2015; pp. 1–6. [Google Scholar]
  4. Babahajiani, P.; Shafiee, Q.; Bevrani, H. Intelligent demand response contribution in frequency control of multi-area power systems. IEEE Trans. Smart Grid 2016, 9, 1282–1291. [Google Scholar] [CrossRef]
  5. Huang, L.; Xin, H.; Wang, Z. Damping low-frequency oscillations through VSC-HVDC stations operated as virtual synchronous machines. IEEE Trans. Power Electron. 2018, 34, 5803–5818. [Google Scholar] [CrossRef]
  6. Samanta, S.; Mishra, J.P.; Roy, B.K. Implementation of a virtual inertia control for inertia enhancement of a dc microgrid under both grid connected and isolated operation. Comput. Electr. Eng. 2019, 76, 283–298. [Google Scholar] [CrossRef]
  7. Hirase, Y.; Abe, K.; Sugimoto, K.; Sakimoto, K.; Bevrani, H.; Ise, T. A novel control approach for virtual synchronous generators to suppress frequency and voltage fluctuations in microgrids. Appl. Energy 2018, 210, 699–710. [Google Scholar] [CrossRef]
  8. Shi, R.; Zhang, X.; Hu, C.; Xu, H.; Gu, J.; Cao, W. Self-tuning virtual synchronous generator control for improving frequency stability in autonomous photovoltaic-diesel microgrids. J. Mod. Power Syst. Clean Energy 2018, 6, 482–494. [Google Scholar] [CrossRef] [Green Version]
  9. Díaz-González, F.; Sumper, A.; Gomis-Bellmunt, O.; Villafáfila-Robles, R. A review of energy storage technologies for wind power applications. Renew. Sustain. Energy Rev. 2012, 16, 2154–2171. [Google Scholar] [CrossRef]
  10. Shim, J.W.; Cho, Y.; Kim, S.-J.; Min, S.W.; Hur, K. Synergistic control of SMES and battery energy storage for enabling dispatchability of renewable energy sources. IEEE Trans. Appl. Supercond. 2013, 23, 5701205. [Google Scholar] [CrossRef]
  11. Onar, O.; Uzunoglu, M.; Alam, M. Dynamic modeling, design and simulation of a wind/fuel cell/ultra-capacitor-based hybrid power generation system. J. Power Sources 2006, 161, 707–722. [Google Scholar] [CrossRef]
  12. Jing, W.; Lai, C.H.; Wong, W.S.; Wong, M.D. Dynamic power allocation of battery-supercapacitor hybrid energy storage for standalone PV microgrid applications. Sustain. Energy Technol. Assess. 2017, 22, 55–64. [Google Scholar] [CrossRef]
  13. Aristidou, P.; Valverde, G.; Van Cutsem, T. Contribution of distribution network control to voltage stability: A case study. IEEE Trans. Smart Grid 2015, 8, 106–116. [Google Scholar] [CrossRef] [Green Version]
  14. Kerdphol, T.; Rahman, F.S.; Mitani, Y. Virtual inertia control application to enhance frequency stability of interconnected power systems with high renewable energy penetration. Energies 2018, 11, 981. [Google Scholar] [CrossRef] [Green Version]
  15. Mentesidi, K.; Garde, R.; Aguado, M.; Rikos, E. Implementation of a fuzzy logic controller for virtual inertia emulation. In Proceedings of the 2015 International Symposium on Smart Electric Distribution Systems and Technologies (EDST), Vienna, Austria, 8–11 September 2015; pp. 606–611. [Google Scholar]
  16. Hu, Y.; Wei, W.; Peng, Y.; Lei, J. Fuzzy virtual inertia control for virtual synchronous generator. In Proceedings of the 2016 35th Chinese Control Conference (CCC), Chengdu, China, 27–29 July 2016; pp. 8523–8527. [Google Scholar]
  17. Kerdphol, T.; Rahman, F.S.; Mitani, Y.; Hongesombut, K.; Küfeoğlu, S. Virtual inertia control-based model predictive control for microgrid frequency stabilization considering high renewable energy integration. Sustainability 2017, 9, 773. [Google Scholar] [CrossRef] [Green Version]
  18. Yan, R.; Saha, T.K. Frequency response estimation method for high wind penetration considering wind turbine frequency support functions. IET Renew. Power Gener. 2015, 9, 775–782. [Google Scholar] [CrossRef]
  19. Skiparev, V.; Machlev, R.; Chowdhury, N.R.; Levron, Y.; Petlenkov, E.; Belikov, J. Virtual inertia control methods in islanded microgrids. Energies 2021, 14, 1562. [Google Scholar] [CrossRef]
  20. Baxter, R.; Energy Storage in Today’s Power Market. Commodities 2002. Available online: http://www.energystoragecouncil.org (accessed on 20 March 2023).
  21. Dunn, B.; Kamath, H.; Tarascon, J.-M. Electrical energy storage for the grid: A battery of choices. Science. 2011, 334, 928–935. [Google Scholar] [CrossRef] [Green Version]
  22. Koohi-Fayegh, S.; Rosen, M.A. A review of energy storage types, applications and recent developments. J. Energy Storage 2020, 27, 101047. [Google Scholar] [CrossRef]
  23. Li, J.; Gee, A.M.; Zhang, M.; Yuan, W. Analysis of battery lifetime extension in a SMES-battery hybrid energy storage system using a novel battery lifetime model. Energy 2015, 86, 175–185. [Google Scholar] [CrossRef] [Green Version]
  24. Yang, H.; Li, Q.; Zhao, S.; Chen, W.; Liu, H. A hierarchical self-regulation control for economic operation of AC/DC hybrid microgrid with hydrogen energy storage system. IEEE Access 2019, 7, 89330–89341. [Google Scholar] [CrossRef]
  25. Liu, J.; Luo, W.; Yang, X.; Wu, L. Robust model-based fault diagnosis for PEM fuel cell air-feed system. IEEE Trans. Ind. Electron. 2016, 63, 3261–3270. [Google Scholar] [CrossRef] [Green Version]
  26. Li, Q.; Chen, W.; Liu, Z.; Li, M.; Ma, L. Development of energy management system based on a power sharing strategy for a fuel cell-battery-supercapacitor hybrid tramway. J. Power Sources 2015, 279, 267–280. [Google Scholar] [CrossRef]
  27. Fan, X.; Wang, X.; Yuan, W.; Li, C.M. Diethylenetriamine-Mediated Self-Assembly of Three-Dimensional Hierarchical Nanoporous CoP Nanoflowers/Pristine Graphene Interconnected Networks as Efficient Electrocatalysts toward Hydrogen Evolution. Sustain. Energy Fuels 2017, 1, 2172–2180. [Google Scholar] [CrossRef]
  28. Zhao, M.; Yuan, W.; Li, C.M. Controlled Self-Assembly of Ni Foam Supported Poly(Ethyleneimine)/Reduced Graphene Oxide Three-Dimensional Composite Electrodes with Remarkable Synergistic Effects for Efficient Oxygen Evolution. J. Mater. Chem. A 2017, 5, 1201–1210. [Google Scholar] [CrossRef]
  29. Yuan, J.; Li, C.; Li, T.; Jing, M.; Yuan, W.; Li, C.M. Remarkably Promoted Photoelectrochemical Water Oxidation on TiO2 Nanowire Arrays via Polymer-Mediated Self-Assembly of CoOx Nanoparticles. Sol. Energy Mater. Sol. Cells 2020, 207, 110349. [Google Scholar] [CrossRef]
  30. Garcia-Torres, F.; Bordons, C. Optimal economical schedule of hydrogen-based microgrids with hybrid storage using model predictive control. IEEE Trans. Ind. Electron. 2015, 62, 5195–5207. [Google Scholar] [CrossRef]
  31. You, S.; Hu, J.; Zong, Y.; Lin, J. Value assessment of hydrogen-based electrical energy storage in view of electricity spot market. J. Mod. Power Syst. Clean Energy 2016, 4, 626–635. [Google Scholar] [CrossRef] [Green Version]
  32. Cau, G.; Cocco, D.; Petrollese, M.; Kær, S.K.; Milan, C. Energy management strategy based on short-term generation scheduling for a renewable microgrid using a hydrogen storage system. Energy Convers. Manag. 2014, 87, 820–831. [Google Scholar] [CrossRef]
  33. Li, Q.; Wang, T.; Dai, C.; Chen, W.; Ma, L. Power management strategy based on adaptive droop control for a fuel cell-battery-supercapacitor hybrid tramway. IEEE Trans. Veh. Technol. 2017, 67, 5658–5670. [Google Scholar] [CrossRef]
  34. Mohamed, B.; Ali, B.; Ahmed, B.; Ahmed, B.; Salah, L.; Rachid, D. Study of hydrogen production by solar energy as tool of storing and utilization renewable energy for the desert areas. Int. J. Hydrogen Energy 2016, 41, 20788–20806. [Google Scholar] [CrossRef]
  35. Von Colbe, J.B.; Ares, J.-R.; Barale, J.; Baricco, M.; Buckley, C.; Capurso, G.; Gallandat, N.; Grant, D.M.; Guzik, M.N.; Jacob, I.; et al. Application of hydrides in hydrogen storage and compression: Achievements, outlook and perspectives. Int. J. Hydrogen Energy 2019, 44, 7780–7808. [Google Scholar] [CrossRef]
  36. Escamilla, A.; Sánchez, D.; García-Rodríguez, L. Assessment of power-to-power renewable energy storage based on the smart integration of hydrogen and micro gas turbine technologies. Int. J. Hydrogen Energy 2022, 47, 17505–17525. [Google Scholar] [CrossRef]
  37. Moazeni, F.; Khazaei, J. Electrochemical optimization and small-signal analysis of grid-connected polymer electrolyte membrane (PEM) fuel cells for renewable energy integration. Renew. Energy 2020, 155, 848–861. [Google Scholar] [CrossRef]
  38. Fragiacomo, P.; De, L.G.; Corigliano, O. Intermediate temperature solid oxide fuel cell/electrolyzer towards future large-scale production. Procedia Manuf. 2020, 42, 259–266. [Google Scholar] [CrossRef]
  39. Ursua, A.; Gandia, L.M.; Sanchis, P. Hydrogen production from water electrolysis: Current status and future trends. Proc. IEEE. 2011, 100, 410–426. [Google Scholar] [CrossRef]
  40. Khooban, M.H.; Niknam, T.; Blaabjerg, F.; Dragičević, T. A new load frequency control strategy for micro-grids with considering electrical vehicles. Electr. Power Syst. Res. 2017, 143, 585–598. [Google Scholar] [CrossRef] [Green Version]
  41. Ali, H.; Magdy, G.; Li, B.; Shabib, G.; Elbaset, A.A.; Xu, D.; Mitani, Y. A new frequency control strategy in an islanded microgrid using virtual inertia control-based coefficient diagram method. IEEE Access 2019, 7, 16979–16990. [Google Scholar] [CrossRef]
  42. Peng, F.Z.; Li, Y.W.; Tolbert, L.M. Control and protection of power electronics interfaced distributed generation systems in a customer-driven microgrid. In Proceedings of the 2009 IEEE Power & Energy Society General Meeting, Calgary, AB, Canada, 26–30 July 2009; pp. 1–8. [Google Scholar]
  43. Willis, H.L.; Scott, W.G. Distributed Power Generation: Planning and Evaluation; Marcel Dekker, Inc.: New York, NY, USA, 2000. [Google Scholar]
  44. Asif, M.; Iqbal, M. Diesel consumption in a high penetration remote hybrid power system with a pumped hydro and battery storage. In Proceedings of the 2013 IEEE Electrical Power & Energy Conference, Halifax, NS, Canada, 21–23 August 2013; pp. 1–6. [Google Scholar]
  45. Torres, M.; Lopes, L.A. An optimal virtual inertia controller to support frequency regulation in autonomous diesel power systems with high penetration of renewables. In Proceedings of the International Conference on Renewable Energies and Power Quality (ICREPQ 11), Las Palmas de Gran Canaria, Spain, 13–15 April 2011; pp. 13–15. [Google Scholar]
  46. Ulleberg, Ø. Modeling of advanced alkaline electrolyzers: A system simulation approach. Int. J. Hydrogen Energy 2003, 28, 21–33. [Google Scholar] [CrossRef]
  47. Martinez, D.; Zamora, R. MATLAB simscape model of an alkaline electrolyser and its simulation with a directly coupled PV module. Int. J. Renew. Energy Res. 2018, 8, 552–560. [Google Scholar]
  48. Jang, D.; Cho, H.-S.; Kang, S. Numerical modeling and analysis of the effect of pressure on the performance of an alkaline water electrolysis system. Appl. Energy 2021, 287, 116554. [Google Scholar] [CrossRef]
  49. Kim, M.J.; Kim, J.H.; Kim, T.S. Program development and simulation of dynamic operation of micro gas turbines. Appl. Therm. Eng. 2016, 108, 122–130. [Google Scholar] [CrossRef]
  50. Reale, F.; Sannino, R. Water and steam injection in micro gas turbine supplied by hydrogen enriched fuels: Numerical investigation and performance analysis. Int. J. Hydrogen Energy 2021, 46, 24366–24381. [Google Scholar] [CrossRef]
  51. Said, S.M.; Aly, M.; Hartmann, B.; Mohamed, E.A. Coordinated fuzzy logic-based virtual inertia controller and frequency relay scheme for reliable operation of low-inertia power system. IET Renew. Power Gener. 2021, 15, 1286–1300. [Google Scholar] [CrossRef]
  52. Othman, A.M.; El-Fergany, A.A. Adaptive virtual-inertia control and chicken swarm optimizer for frequency stability in power-grids penetrated by renewable energy sources. Neural Comput. Appl. 2021, 33, 2905–2918. [Google Scholar] [CrossRef]
  53. Alam, M.S.; Alotaibi, M.A.; Alam, M.A.; Hossain, M.A.; Shafiullah, M.; Al-Ismail, F.S.; Rashid, U.M.M.; Abido, M.A. High-level renewable energy integrated system frequency control with SMES-based optimized fractional order controller. Electronics 2021, 10, 511. [Google Scholar] [CrossRef]
  54. Colmenar-Santos, A.; Molina-Ibáñez, E.-L.; Rosales-Asensio, E.; López-Rey, Á. Technical approach for the inclusion of superconducting magnetic energy storage in a smart city. Energy 2018, 158, 1080–1091. [Google Scholar] [CrossRef]
  55. Li, D.; Zhu, Q.; Lin, S.; Bian, X. A self-adaptive inertia and damping combination control of VSG to support frequency stability. IEEE Trans. Energy Convers. 2016, 32, 397–398. [Google Scholar] [CrossRef]
  56. Sockeel, N.; Gafford, J.; Papari, B.; Mazzola, M. Virtual inertia emulator-based model predictive control for grid frequency regulation considering high penetration of inverter-based energy storage system. IEEE Trans. Sustain. Energy 2020, 11, 2932–2939. [Google Scholar] [CrossRef]
Figure 1. The studied microgrid.
Energies 16 03377 g001
Figure 2. The model of the prime mover.
Energies 16 03377 g002
Figure 3. The solar irradiance model.
Energies 16 03377 g003
Figure 4. Wind turbine model [42].
Energies 16 03377 g004
Figure 5. The alkaline water electrolyzer schematic diagram [1].
Energies 16 03377 g005
Figure 6. Schematic diagram of micro-gas turbine [2].
Energies 16 03377 g006
Figure 7. Block diagram of SMES.
Energies 16 03377 g007
Figure 8. The SMES construction [3].
Energies 16 03377 g008
Figure 9. The simulation results for scenario 1 under high penetration level of RES.
Energies 16 03377 g009aEnergies 16 03377 g009b
Figure 11. The simulation results for scenario 2.
Energies 16 03377 g011aEnergies 16 03377 g011b
Figure 12. The simulation results for the comparative study.
Energies 16 03377 g012
Disclaimer/Publisher’s Note: The statements, opinions and data contained in all publications are solely those of the individual author(s) and contributor(s) and not of MDPI and/or the editor(s). MDPI and/or the editor(s) disclaim responsibility for any injury to people or property resulting from any ideas, methods, instructions or products referred to in the content.

