Article

Reliability Testing of Wind Farm Devices Based on the Mean Time to Failures

1
Department of Energy, Faculty of Mechanical Engineering, Technical University of Koszalin, 15–17 Raclawicka St., 75-620 Koszalin, Poland
2
Doctoral School, Technical University of Koszalin, 2 Sniadeckich St., 75-620 Koszalin, Poland
3
Faculty of Electronic, Military University of Technology of Warsaw, 2 Urbanowicza St., 00-908 Warsaw, Poland
4
Division of Transport Telecommunications, Faculty of Transport, Warsaw University of Technology, 00-661 Warszawa, Poland
*
Authors to whom correspondence should be addressed.
Energies 2023, 16(6), 2827; https://doi.org/10.3390/en16062827
Submission received: 22 January 2023 / Revised: 14 March 2023 / Accepted: 16 March 2023 / Published: 18 March 2023

Abstract

:
Nowadays, one of the main sources of renewable energy is wind energy; therefore, a wind farm’s electricity system must be effective. As a result, wind farm (WF) equipment must continuously operate without failure or damage. To achieve this, it is necessary to regularly monitor and assess the reliability of WF systems at every point of their “life”, including design, implementation, and continued use. Three key goals are presented in the article. First, a theory of fundamental theoretical quantities that can be used in reliability and maintenance analysis is presented. The second is to put forth a theoretical reliability link between mean time to failure and WF system fitness probability (Mean Time to Failures (MTTF—Mean time between failures. MTTF = t1 + t2 + … + tn/m, where: m—the number of all failures at time T, ti—i—ty time to failure)). The third goal is to analyze the time to failure as a function of service life and to assess the dependability of the WF under consideration as a function of service life. The three-state model of the WF operation process presented in the research serves as the foundation for the analytical analysis of WF reliability. The probability of fitness (Po(t)) of the WF system and the mean time to failure were calculated based on the analytical quantities denoting this model (MTTF). The WF owner can make the best choice regarding the proper WF renewal actions with the help of knowledge of these current dependability values for an in-service WF system.

1. Introduction

Modern technical facilities, especially PE equipment, are so complicated that managing (controlling) their operations call for a unique strategy. Additionally, these facilities aim to create new management structures and increase the capacity of the base for technical facility maintenance and repair. The aforementioned issues are now becoming difficult tasks that call for logical decision-making. This applies to technical military equipment, energy systems, medical systems, other systems, and perhaps many more. Thus, the operations of technical facilities should be geared toward keeping the highest level of technical efficiency for as long as possible.
The article discusses the issue of a simulation assessment of Wind Farm (WF) equipment reliability during operation. This article’s use of Mean Time to Failures distinguishes it from similar works (MTTF). A significant cognitive challenge is understanding how complicated technical items operate, such as the wind farm’s equipment and wind turbines (WTG) and electrical subsystems (Main PowerPoint). For WF users and owners, this issue is especially significant. The issue of how to carry out organizational and technical renewal tasks inside the WF equipment maintenance system must be addressed. Only a carefully planned system for WF renewal will allow for the best utilization of these facilities. Such research activities lead to creating trustworthy and suitable plans and policies for the management of PE facilities. The research has not taken a complete Mean Time To Failure (MTTF) approach to the problems listed above.
In the literature on reliability, it is described as the ability of an object to carry out specific tasks while maintaining the values of established performance indicators within specific bounds over time that correspond to specific modes and conditions of use, maintenance, repair, storage, and transportation. It is a quality that persists over time. Since the concepts of reliability and quality are closely related, issues with quality management are directly reflected in both concepts. A product’s reliability is an observable quality that can be assessed. The words “failure”, “probability of failure-free operation”, “failure rate”, etc., are introduced to measure reliability. Among the fundamental ideas in reliability, the theory is failure rate and reliability. The writers of the works [1,2,3,4,5] also state that reliability is understood as a product’s capacity to perform for an extended period of time. A complete or partial loss of product performance is referred to as a technical object’s refusal to operate. In their book Reliability, American authors D. Lloyd and M. Lipov state: “Reliability affects cost, time, and psychologically—in the form of inconvenience and, in some situations, also poses a threat to the safety of individuals and the country.” The costs of unreliability include both the cost of a unit that does not work and the cost of any equipment that goes wrong, wears out, or is destroyed.
Numerous reliability measures or numerical traits for evaluating reliability are documented in the literature. For instance, according to its service life, a product’s readiness factor, for instance, determines how likely it is that it will function at certain or random periods. It refers to the period of time when a product covered by a manufacturer’s warranty continues to meet the consumer’s expectations for quality, which is why this period is also known as the product’s “guaranteed life”.
Reliability theory is described in publications [6,7,8,9,10] as a branch of study based on probability and statistics that, like statistical quality control, can be broadly divided into three categories: “reliability mathematics”, “reliability engineering”, and “reliability management.” The focus of this article is reliability, and “dependability mathematics” is a tool and a language for explaining reliability. The term “reliability engineering” refers to a career that involves the design, development, testing, and verification of reliable systems, such as DNV GL, which is registered with the biggest classification society in the world and a classification society that has received worldwide accreditation. Each onshore and offshore substation is covered by DNG-ST-0145 [11].
Some studies [12,13,14] propose a novel method for evaluating the dependability of repairable technological objects: measuring time parameters (damage and repair times) on an actual working procedure. Damage times can be different based on a Weibull distribution, which is made up of a cumulative distribution function and a probability density function. One study [15] describes new methods for quantitative reliability assessment called Failure Modes and Effects Analysis (FMEA). This approach is a helpful tool for the quantitative assessment of reliability design [16]. When a distribution system causes a load point to shut down, the FMEA method is based on the reliability parameters and system architecture of the components of the distribution system. The FMEA method is based on the reliability parameters of distribution system components and system architecture and calculates system reliability indices based on the annual reliability index (λ), mean time to repair (MTTR), and mean time between failures (MTBF). This method produces a system dependability index that can be used in decision-making.
According to the literature [17,18,19,20,21,22,23], a power distribution system is made up of numerous pieces of electrical equipment, and any one of them failing can result in power outages. If a system is made up of several interconnected pieces, any one of them failing will result in the failure of the entire system [24,25,26]. The frequency of system outages and the anticipated length of outages per year, or the number of hours of outages per year under normal operation, are the two ways that reliability is most frequently described. Using commercial reliability software, overall system reliability indices for any node in the system are calculated to investigate the sensitivity of these indices to changes in parameters. Information is collected on instantaneous and continuous system downtime, component failures, and downtime rates. Using these results, the most reliable and cost-effective way to design an electrical system can be chosen.
The majority of work on the dependability of technical facilities [27,28,29,30] adopts a traditional reliability-focused approach. All departments can be successfully integrated to identify the causes of failure, effectively improve performance, and serve as the strategic basis for safety, availability, and operational economics in “reliability management” so reliability programs can successfully achieve their goals.
The articles by Nakagawa, Pokoradi, and others [31,32,33,34,35,36] discuss the problems with modeling the procedure of operating technical facilities. This study offers a mathematical strategy for simulating this process. The issue of a quality assessment of such a structured maintenance process is discussed in the essay. The study provides a simulation test program for that goal. The research program includes a characterization of the models of the operation processes of technical facilities, the establishment of test input data, which provides the quantities of the operation time of a technical object, being the summary duration time of the regeneration (repairs), and the use of the object. It also includes the determination of the indices of a qualitative assessment of the regeneration of the object in the operation process. The simulation tests on the effects of the operation process on the reclamation of a technical facility in an intelligent system, including an artificial neural network, are used as an example to support the findings of the study.
Operational analysis is required since the dependability is described in the studies by Dyduch, Epstein et al., and Siergiejczyk et al. [37,38,39,40,41,42,43,44,45,46,47,48,49]. They provide dependability and an operational study of intricate technical and non-technical facilities in their lectures, such as power systems in transportation telematics systems (PSSs in TTDs). The article presents various power supply system solutions, including PSS in a TTD, from primary and secondary sources. The bulletin lists and describes several solutions that are employed in power systems. The relationships that indicate the plausibility of the other system in a fully working state, in a security emergency, and in a state of a safety emergency can then be determined. A qualitative examination of PSS in TTD was conducted, and the quality ratio for supply continuity was evaluated. This index enables “Continuity Quality Of Power Supply” (the CQoPS) to show how it is dependent on more than just reliability to provide a high-quality supply. The example uses three observations that each have an impact on quality to demonstrate how to compute the CQoPS factor for both the primary and backup supply. Other public facilities can make use of the principles offered for qualitative and reliability-operational modeling of PSS (including those classified as crucial infrastructure).
Research methods based on the usage of the Kolmogorov–Chapman equation are used by researchers on the issues of the dependability and quality of the operation of systems and complex technical objects in the majority of publications [50]. These techniques are described in [51]. These studies employ the availability coefficient (Kg(t)) as a qualitative measure of the operating process. Another useful strategy for making this assessment could be to convert the calculated value of the readiness function or coefficient Kg(t) into a measure of the likelihood that the object being tested will be in a fit or functional state. The use of new functions developed by the authors for assessing reliability issues and the operation process of systems and complex technical objects, such as (Fc(t)): the quality of a qualitative assessment of the facility’s operation process and (Fch(t)): the absorption function of the operation process constitutes the innovation of our article and the topic covered herein. In this article, these two variables are only used to judge the reliability of the technological systems and facilities.
The issues raised in our essay will be resolved in the manner that follows. In the second part of the paper, potential equipment reliability numbers for the Wind Farm (WF) will be given. These numbers can be used to make operational decisions or judge how well the procedure for updating operational characteristics works. The difficulties of employing Kolgomorov–Chapman equations to simulate the use and functioning of wind farm equipment will be discussed in the third section of the essay. The article’s main research section is part four. In the fourth part, both the size of the Mean Time Between Failures (MTBF) and an analysis of it will be used to look at the quality of the operation-renewal process of wind farm equipment.

2. Reliability of a Technical Object after Its Regeneration in a Maintenance System

After regeneration (restoring its operating qualities) in a maintenance system using data from an artificial neural network, a technical object performs its tasks (the required function), as well as a “new” object would have once it had been put to use. The structure of a maintenance system must be designed in an appropriate (logical) manner in order to satisfy these objectives. The author’s publications [51] present, among other things, the theoretical underpinnings and applications that are used to build the best possible structures of maintenance systems for technical objects referred to as “continuous operation objects.” The operational and dependability features of those technological objects that were formed in maintenance systems and that work under unique circumstances, such as a finite amount of time for the execution of preventative operations, etc., call for constant recognition to be maximized. Durability is a characteristic that describes how well most technical objects can do their jobs.
Definition 1. 
The ability of a technological object (τ) to be employed continuously during operation is referred to as durability. The rate of aging and wear has a direct impact on an object’s durability [52,53,54,55,56,57,58,59]. The parameters of the environment in which these technical items are found during their operation determine the speed of these processes, which often occur in technical objects (use). The duration from the time the object was first used and the point at which it ceased to fulfill its intended function is the durability dimension as a measure that describes the object’s operational attributes (the tasks assigned to it). This time, a continuous random variable (τ) that accepts values between (0, ∞) is used. The strength of an object’s structural (or functional) components determines how long it will last. The durability of the item after regeneration is not poorer than the durability of a “new” object that has only been used when trivalent logic is used in the diagnosing process and when the object is regenerated so as to be found in a condition incomplete use. A similar quality is the longevity of items in the same class or category. It is agreed that the same distribution of the random variable (τ) may be used to describe the durability of objects that are members of the same population (class of objects). The distribution of the random variable (τ) operating characteristics, including its durability and reliability.
The chance of carrying out a predefined task in a given amount of time under a given set of circumstances is known as reliability. The reliability (durability) function of an object in a maintenance system (R(t)), which was provided in the following manner, is an artificial neural network that provides the fundamental characteristics to describe the operational and reliability properties of a technical object after regeneration in a maintenance system built on the basis of data from an artificial neural network:
R t = P ( τ t )
where: R(t)—the function of an object following regeneration in a maintenance system that is reliable (durable), t—the duration of an object’s use, τ—a technical object’s durability is considered to be good when there is a sufficient amount of time between the emergence of a fault and the state of incomplete operation.
Definition 2. 
The durability of an object is one of the reliability attributes specified by the function of reliability (durability) of an object that was developed in a maintenance system (R(t)) using data from an artificial neural network. This is the likelihood that a technical object’s (Fc(t)) operational (reliability) quality, as stated using the time (τ), will be equal to or greater than the moment (t). A unit represents the likelihood that a “fresh” object or one that has undergone a complete regeneration will be used in a maintenance system. Then, we say that a technical object is doing its job to the best of its ability.
The quantity of the function of the object’s unfitness can be expressed in the form shown below if the density function of the object’s fitness for use, f(τ), is to be used to describe the operational aspects of the object:
F t = 0 t f τ d t
The likelihood of carrying out a predefined function in a given amount of time under a given set of circumstances is what reliability is defined as. The following is an expression for the reliability function:
d R t R t = λ t d t
Including from 0 to t gives:
1 R t 1 R t d R t = 0 t λ t d t
Since R(t) = 1 at t = 0, can be written as:
l n R t = 0 t λ t d t
Therefore, the reliability function can be rewritten as:
R ( t ) = e x p 0 t λ t d t
then the failure’s probability density function f(t) can be expressed as:
f t = λ e λ t = λ R ( t )
The most fundamental mathematical representation of reliability, known as the exponential distribution, is dependency (6). In reliability engineering, the most common function is the reliability function, which shows how likely it is that a project will run well for a certain amount of time.
The functions of damage density and damage intensity are of major importance for many research topics because they indicate the regional peculiarities of the object’s use over the course of its “life” (t). They speak of the likelihood that things will be either unsuitable or fit in the time range between <0 and t>, respectively.

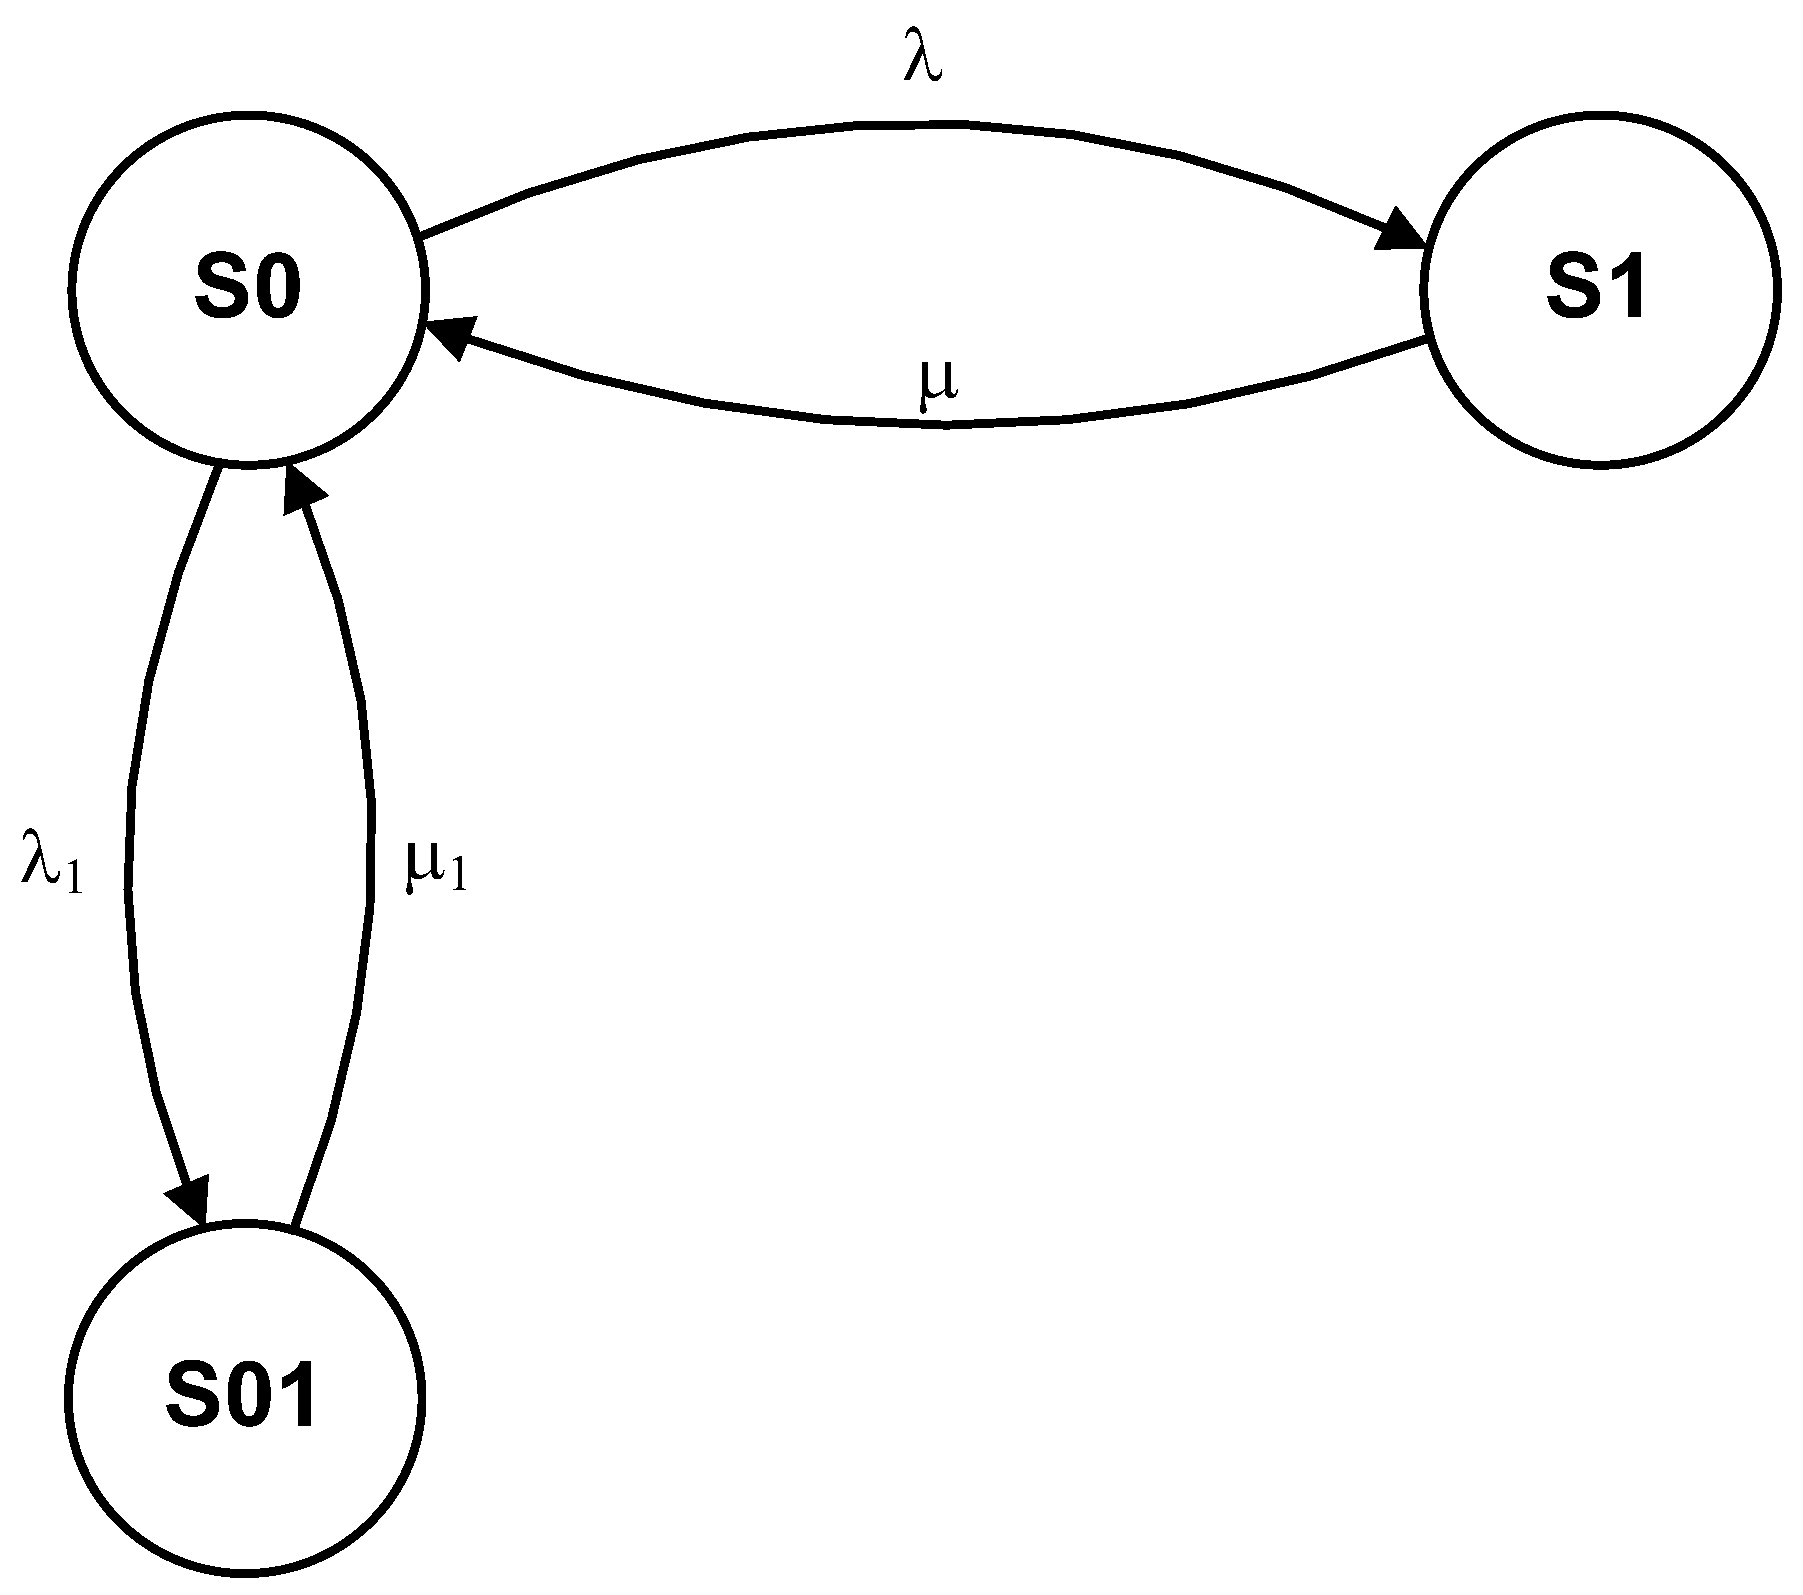
3. Three-State Operational Process Model of Wind Farm Devices

Any complicated technical object has multiple processes, each of which is made up of a subset of the service condition and a subset of the service state. The relationship between the transitions between the stages emphasized in the operating process of the object under investigation is difficult to articulate. A detailed investigation and understanding of the real operation process of the wind farm equipment are required for the determination of data for simulation tests. The most challenging work in the operation of each facility is to develop a model of the structure of the facility’s operation process in its chosen form (analytical or graphic). By evaluating the built facility operation process and figuring out how the different operating states relate to each other, one can produce specific dependability values that describe this model.
This work demonstrated that a three-state model accurately describes the operation of wind farm equipment. So, for the WF research that was not waterproof, a three-state model was used to explain how it worked.
The object can be in one of the following states, as shown by an analysis of the methods used to change the states of the object according to the model in Figure 1:
  • S0—using the technical tool,
  • S1—preventative maintenance,
  • S01—unplanned upkeep: S0 with intensity μ in the fit condition.
In the model, the relationships between states imply (Figure 1):
  • λ—Interpretation of the system’s intensity of transition from state S0 to state S1,
  • μ—Only interpretations of the system’s intensity of transition from state S1 to state S0 and from state S01 to state S0,
  • λ1—The intensity of the system’s transition from state S0 to state S01,
  • μ1—A calculation of how much the system has changed from S01 to S0.
In order to conduct a qualitative analysis of how the wind farm device works, the following assumptions were made about how the structure is put together:
State S0—this is the condition in which the WF equipment is producing power effectively. In the state (S0), the WF equipment system is fully functional technically. Such a state exists only when the WF objective function is satisfied, and the WF energy efficiency is 100%. Figure 1 depicts the operating model. When a fault or damage occurs in the WF, the WF changes its state to damage intensity (λ) and displays (S1).
State S1 is the condition in which WF equipment is being used inefficiently. The WF power system’s efficiency in the state (S1) is critically low—below 100%. The required function of the WF system is only partially (partially) accomplished, making it fundamentally inoperative (S1). WF equipment that is in the state of S1 must undergo repairs and have any existing faults fixed. If malfunctions were the cause of the transfer to this state, then WF would shift to the state with the intensity of repairs (µ) once the defects and malfunctions have been fixed (S0).

4. Reliability Testing of Wind Farm Devices Based on the Mean Time to Failures

4.1. Reliability Testing of Wind Farm Devices

When various operational and reliability data changed, it was possible to swiftly determine the values of indicators representing the states of the investigated WF system. For the analysis, the level of repairs and damage to the installations, as shown in Table 1, was taken into account.
Using Equation (10), the information in Table 1 and the chance that the tested system will stay in each of its many operating states for an exponential distribution, the following probabilities can be found:
  • One year was allotted for the testing of the railroad video monitoring system:
    t = 8760 (h)
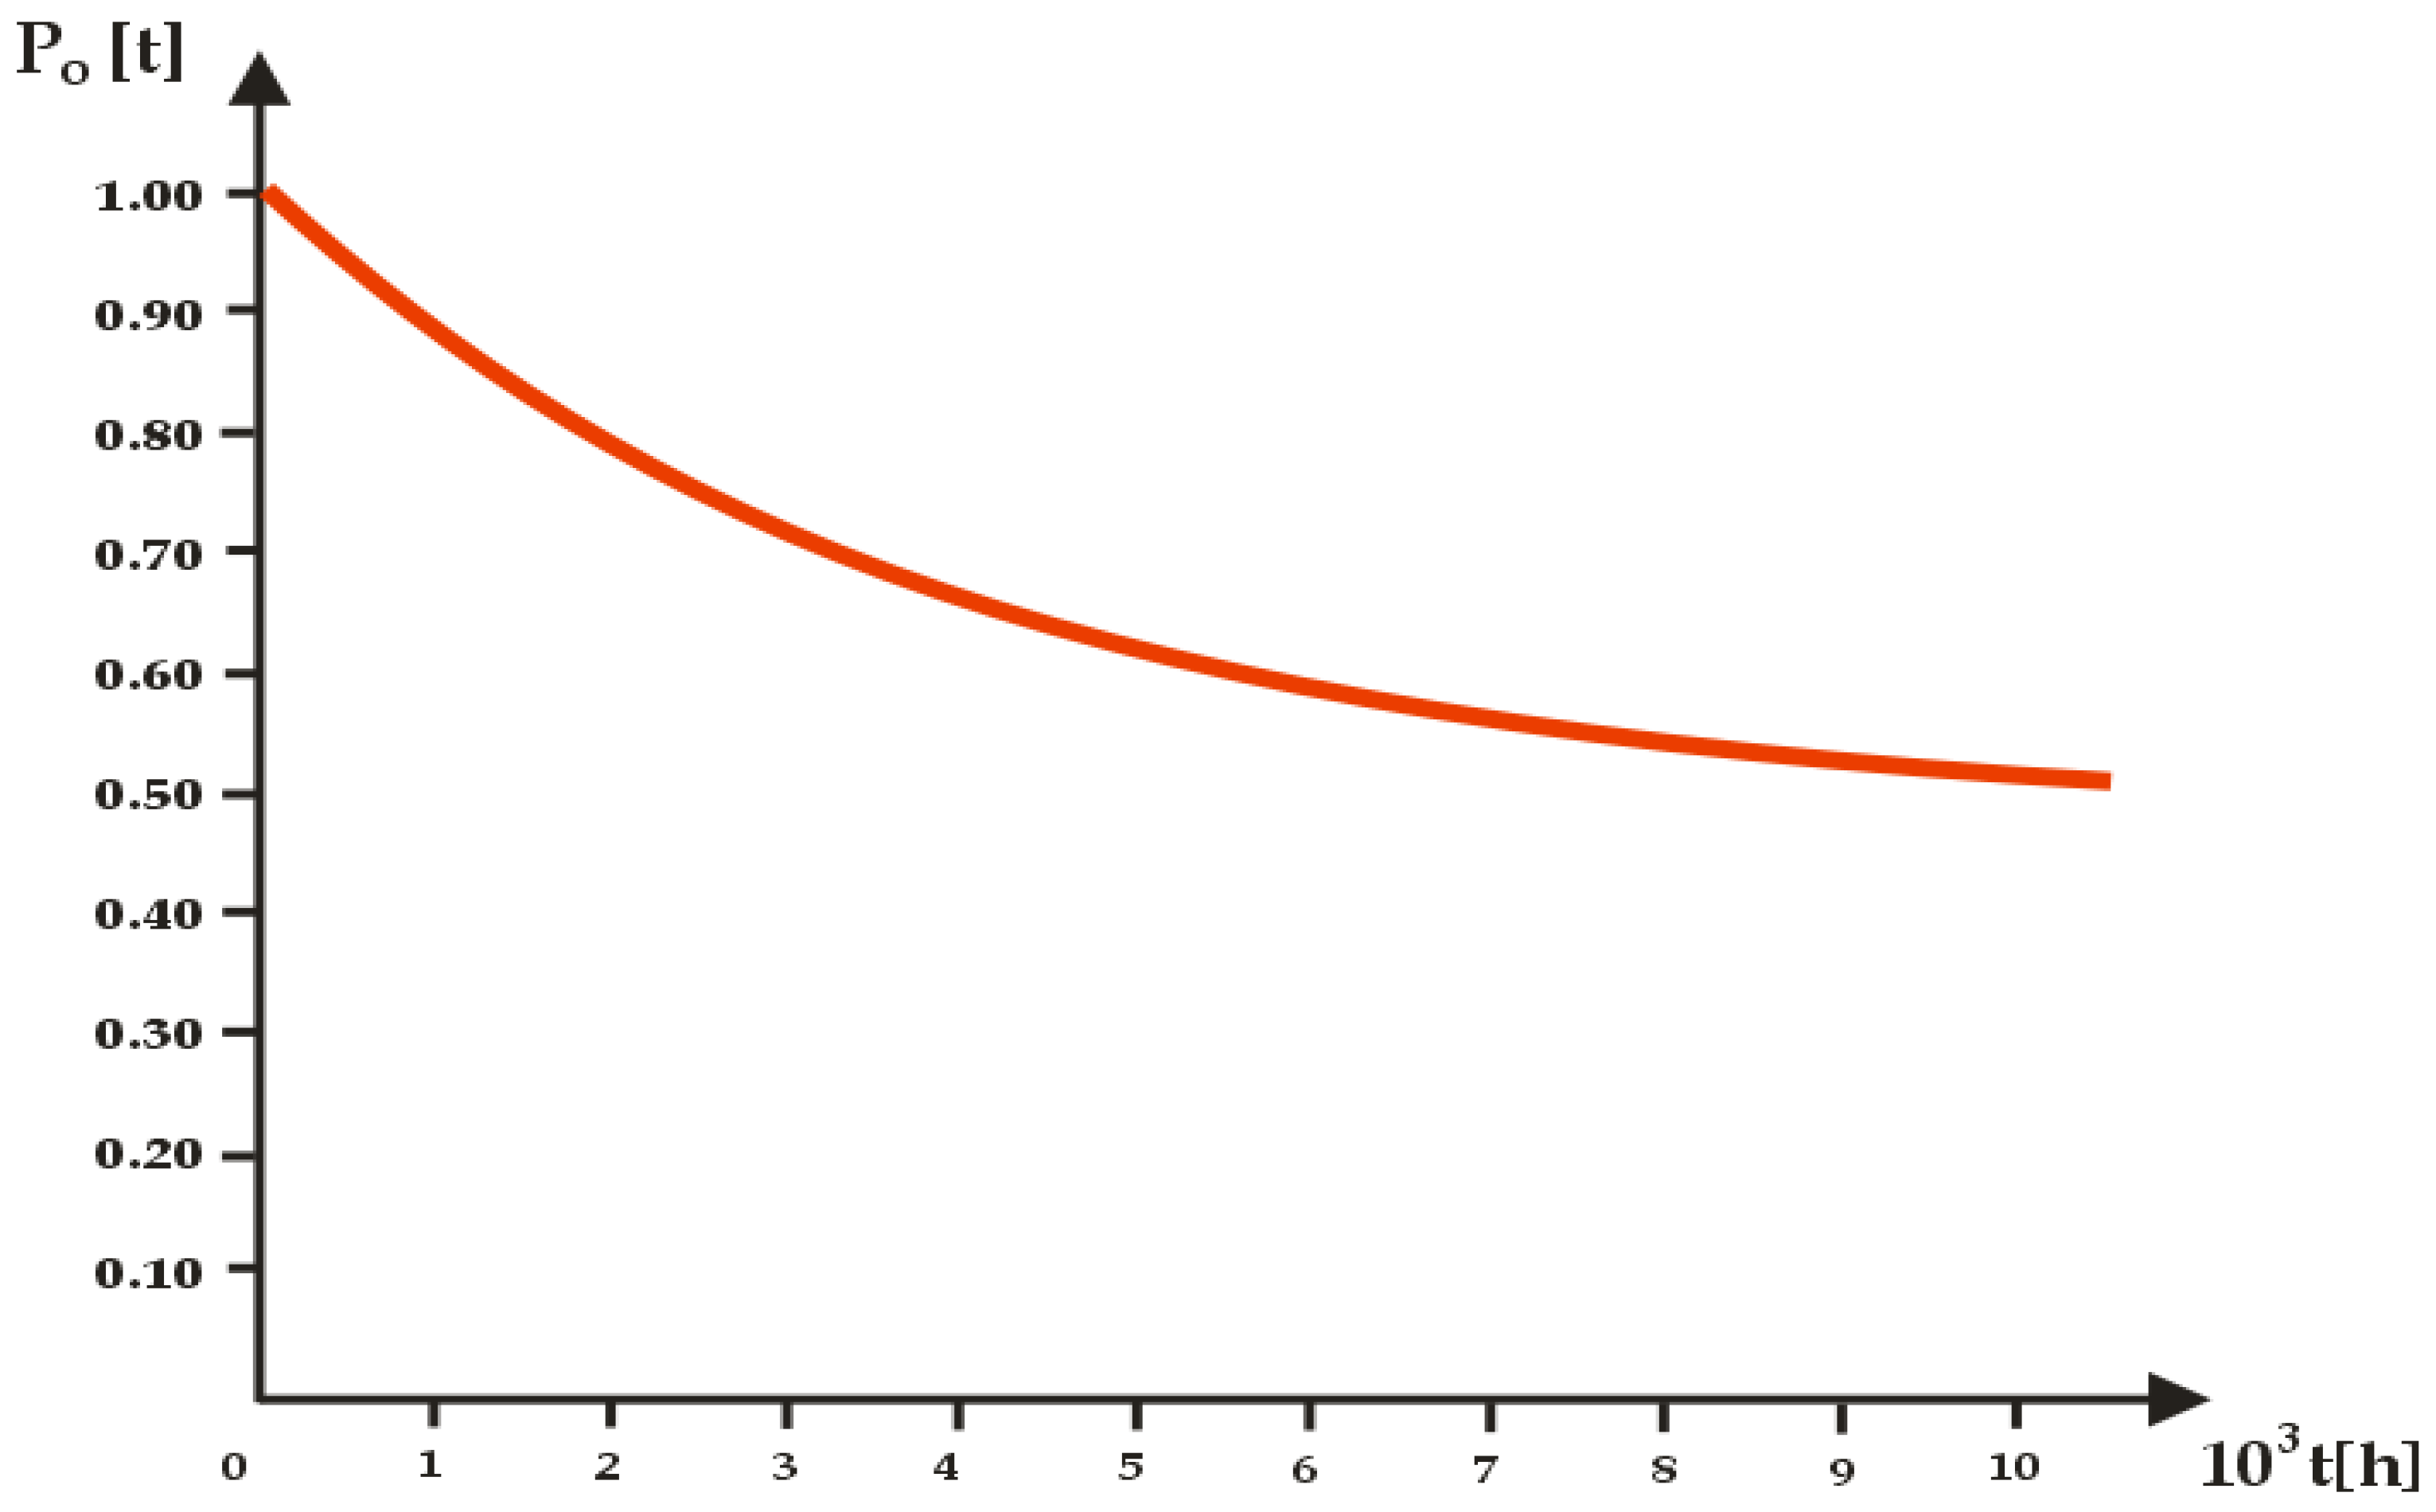
  • There is a probability that the evaluated video surveillance system will continue to function properly in S1 condition for a year:
    P 0 t = 0.9983192
For the simulation study, the relationship 6 was used. On this basis, the relationship R(t) was calculated, which is practically the probability ( P 0 t ) of fitness of the wind farm equipment in its operation process. For the adopted input data for simulation studies contained in Table 1, the value of ( P 0 t ) was determined (Figure 2) for t = 8760 [h].

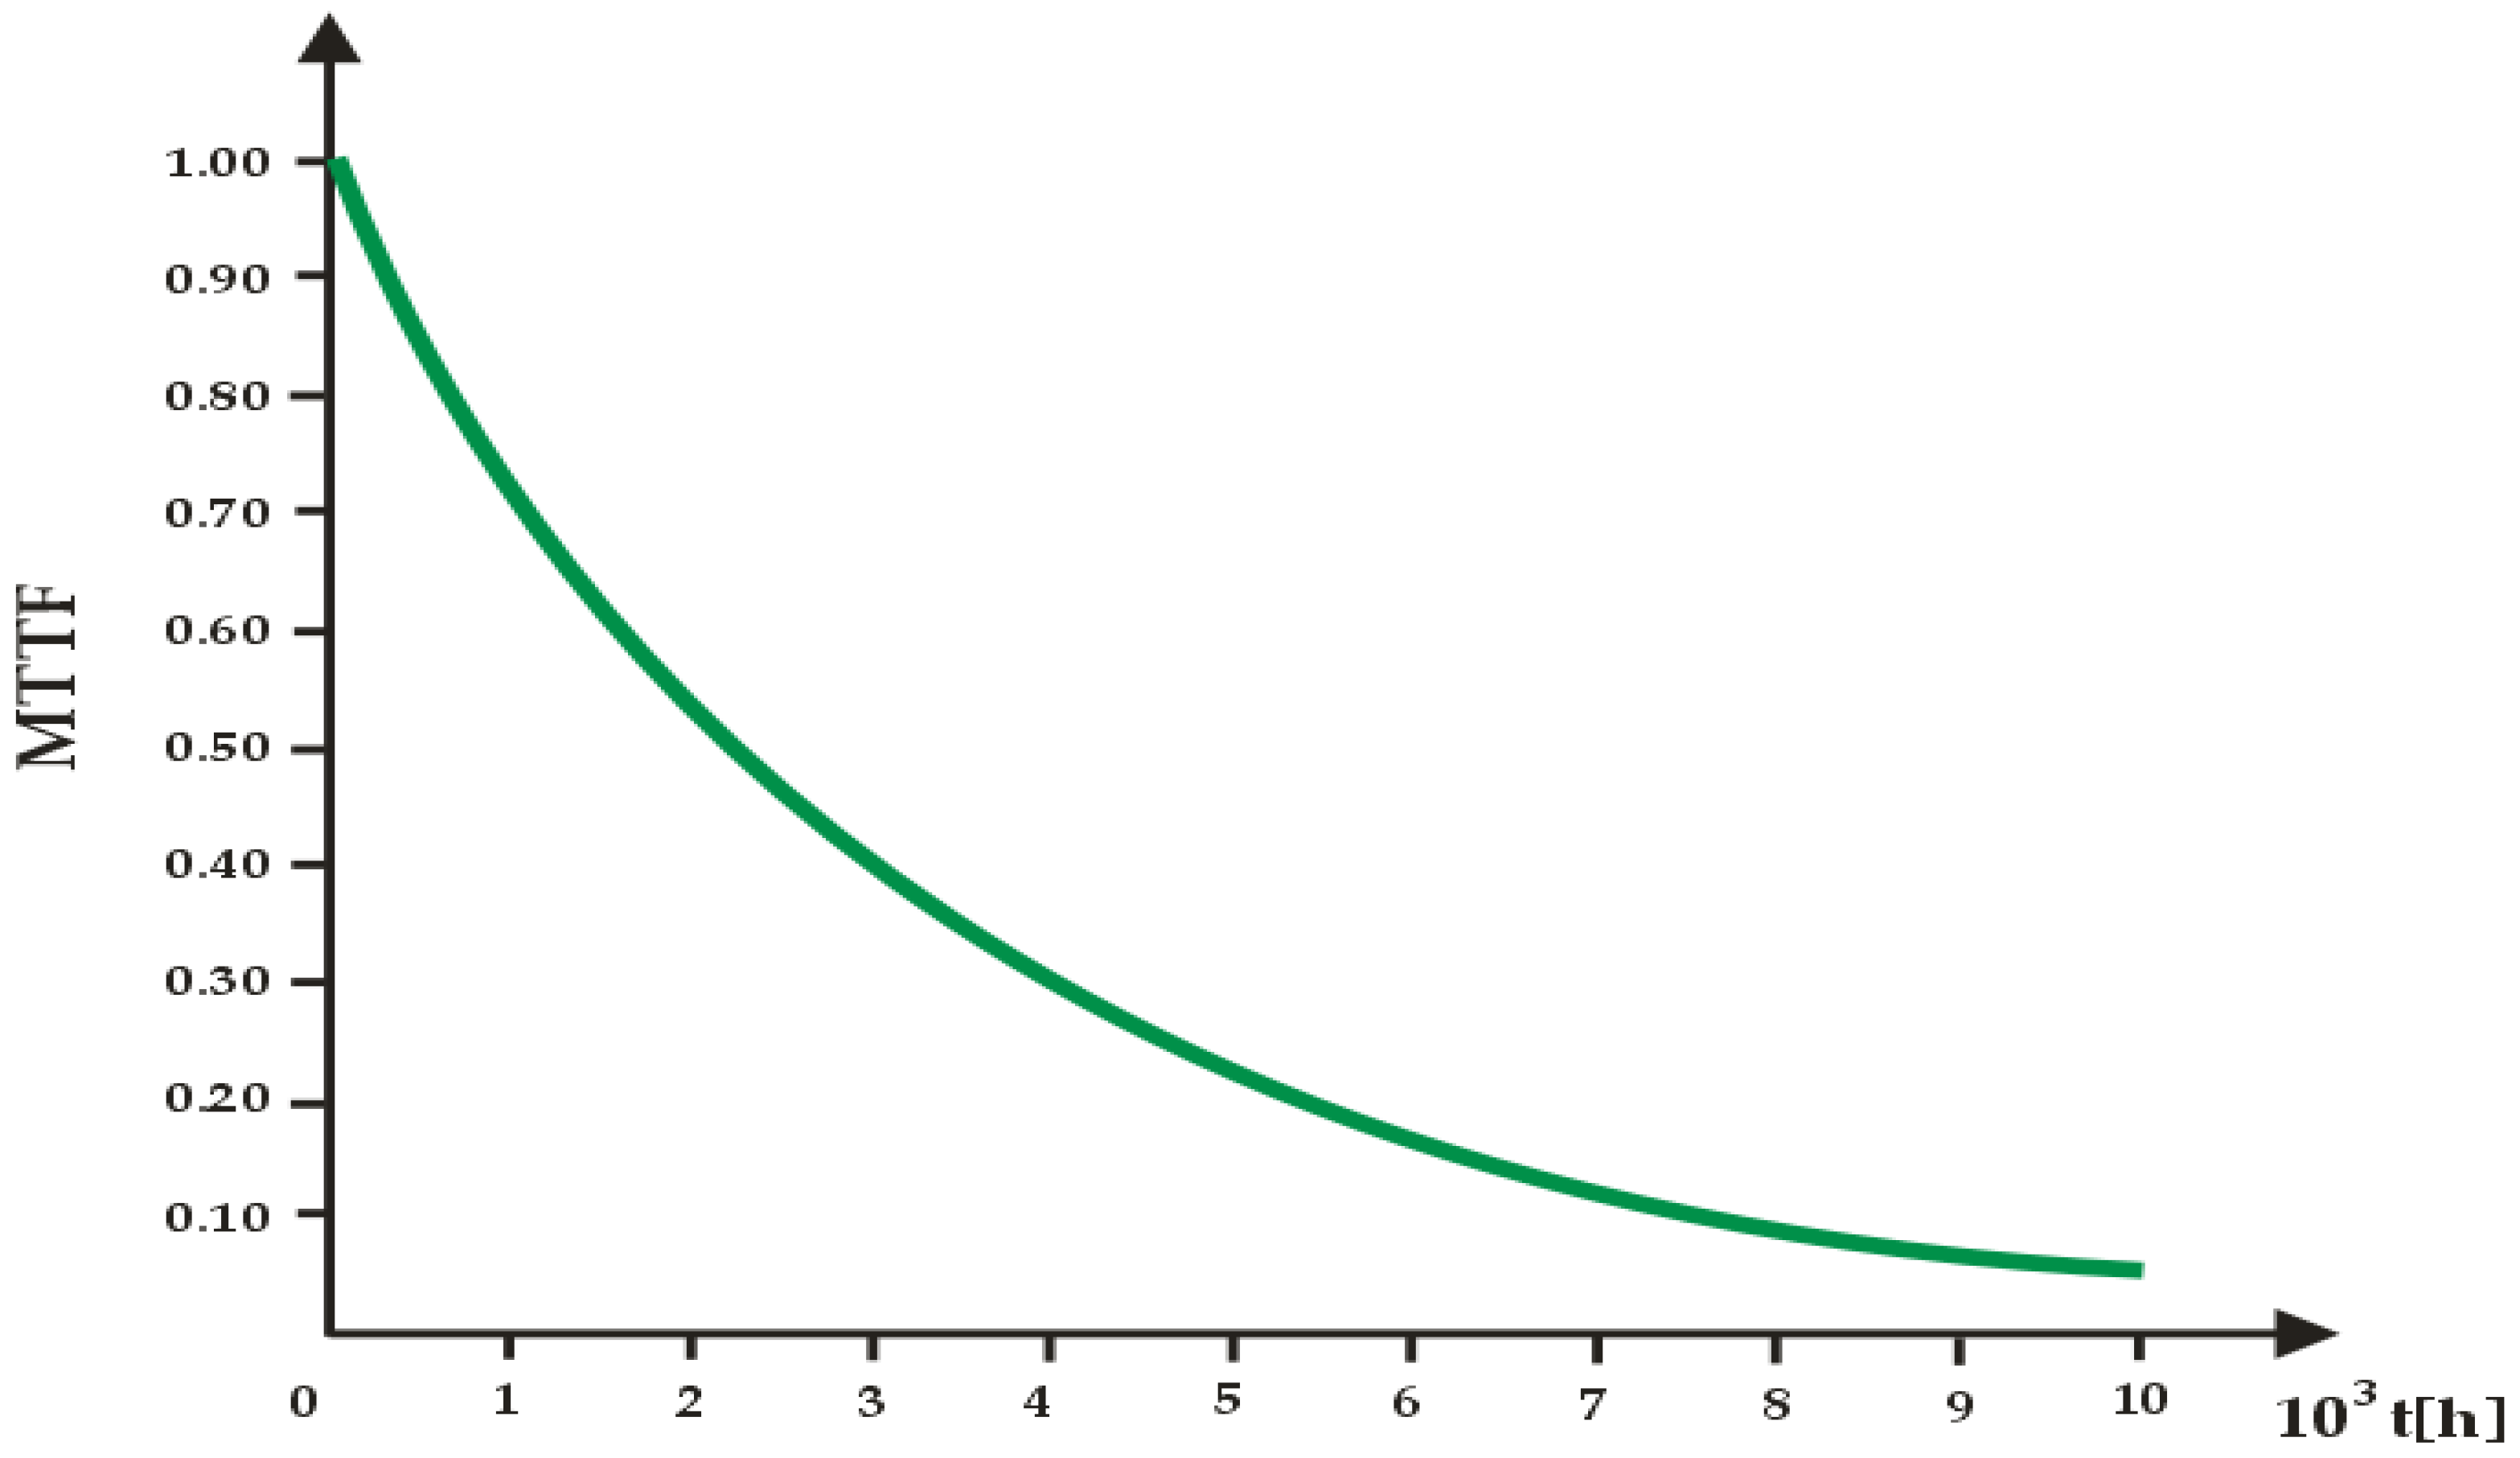
4.2. Reliability Testing of Wind Farm Devices Based on the Mean Time to Failures

The average uptime is a number that can be used to measure how reliable a technical facility is.
Definition 3. 
The period of time between the completion of a technical object’s repair (renewal) and the moment (t) of the next damage is known as the average time of failure-free functioning of a technical item (failure). The size of the relationship shows how long a technological object works without breaking down, on average:
MTTF = i = 1 k P i ( t ) i = 1 k ( P i ( t ) j = 1 k λ i , j )
where:
  • Pi—the likelihood that the system is functioning properly.
  • λi,j—is the speed at which a system changes from being fit to being unfit.
The reliability function and the time-to-failure probability density function based on the duration of the complete time interval of the equipment’s operation can be defined as the time-to-failure distribution function in the studies detailed in the works. A common instantaneous failure rate function can be obtained by combining the reliability probability function and the time-to-failure probability density function. The MTTF and MTBF factors are applied to the expression of MTTF and MTBF, respectively, depending on whether the system failure is repairable or unrepairable. In other words, it is typically considered that a broken system can be fixed when employing MTBF. MTTF is frequently utilized if a flawed system cannot be rectified. Formulas for the parameters used to derive dependability theory, which is explained in the subsections of Section 2, can be used to make graphs that show how the relationships work.

5. Discussion

Reliability probability (Po(t)) and MTTF factor are the focus of the article’s research on the WF system’s reliability quantities. The two studied quantities (availability) affect how reliable technical facilities are and how ready they are for use.
Reliability is the primary factor included in the majority of studies on the operations of complicated technical objects that are given in the literature. In the literature, dependability and probability are frequently used interchangeably. The definitions given in Section 2 of the article clarify the distinction between these quantities. The reliability function of complicated technological items is the best way to tell if a PE system can still do its job after being used for a long enough time in the operation process.
The use of MTTF time to assess the dependability of WF in time, which is the yearly cycle of WF operation, where “one annual duty cycle is equal to 1 year of operation of WF equipment”, is novel in this article compared to earlier works on reliability testing of technical facilities. Therefore, the average number of [h] in a year of WF equipment operating is 8000. The dependability of the WF system (Ro(t) = 0.81764) is evident from the study of the acquired WF reliability data presented in the figure for the WF use period equal to (12 duty cycle = 4000 [h]). Additionally, assuming the dependability of (Po(t) = 0.81764), it can be deduced that 80% of the jobs needed by the WF system are realized. On the other hand, the reliability of the WF system is (Po(t) = 0.717864) for a WF lifespan equal to (1 WF duty cycle = 8000 [h]). It can be said that the utility features of the WF in the form of electricity production are good for the reliability value (Po(t) = 0.677864). (at a rate of 71%). These amounts are vastly different from the WF system’s capacity for producing power, which has a maximum level of dependability like a brand-new WF system that has just started operating. With knowledge of the WF system’s calculated reliability value for a specific period of use, the WF user can take the necessary actions to improve the WF’s utility attributes or reliability. A particular operational approach must be used in order to keep the technical state of WF equipment at all times during operation at a high degree of reliability.
MTTF was the second reliability metric for the WF system that was examined (Mean Time to Failure). Many publications regard the size of the MTTF as a fundamental indicator of WF system reliability. According to published research, the more reliable the technical system is, the greater the MTTF time value. Publishing the MTTF time with an equal sign between it and the so-called “service life (time)”—the approximate number of operational hours after which a system breakdown occurs—is a common but unfounded assumption. However, it is common to say that an MTTF factor with a value of many hours shows that the system can run continuously for a long time, which is not entirely true.
The dependability study of the WF system utilizing MTTF time is another novel aspect of this article compared to earlier works. As a result of variations in the length of time (t = <0; 8000 [h]) that the WF system was used, the investigation of MTTF time magnitude was conducted. In terms of how it affects how well the WF system works, the MTTF value is of a size that very accurately shows any changes (actions) in technical, organizational, SERV system application, service personnel training, spare parts availability, and other areas.
The reliability research findings for the WF system are represented visually in Figure 3 as MTTF time. As the operating time (t) grows, the values of the MTTF coefficient drop, as can be seen from the examination of the reliability information in the figure. The graph in Figure 3 demonstrates that the MTTF coefficient is equal to 0.8567 for a value of time (t = 1000 [h]). Practically speaking, this coefficient’s value means that the WF system will run faultlessly for 856.7 [h] for a WF running duration of (t = 1000 [h]). However, the value of the factor (MTTF = 0.41987) for a value of time (t) equal to (1/2 of the yearly duty cycle, t = 4000 [h]). According to this scenario, the WF system will function faultlessly for 419.87 [h] for a WF consumption period equal to (t = ½ of the WF’s yearly operation cycle = 4000 [h]).
According to the WF system’s reliability studies, the dependability probability (Po(t)) and MTTF value include important information for managing the process of enhancing the use of the system’s efficiency at each moment. According to the study’s findings, the most effective methods for replacing wind farm equipment are those in which the WF system is used for an extended period of time without experiencing any problems (damage). Therefore, it can be inferred that a strategy for updating WF systems that reduces the expense of implementing the procedure for maintaining or updating operational features is successful (reduces WF downtime). Continuous repair cost reduction is necessary to maintain the serviceability or operational readiness of WFs. The reduction in the time required to refresh these devices is closely correlated with the WF repair costs. The findings of this study suggest that employing a SERV system in this procedure can shorten the time needed for WF renewal. As a result, the SERV system can significantly shorten the time it takes to replace WF equipment. The SERV system organizes the process of replacing WF equipment so that only the necessary parts of the WF system are replaced, and even then, only to a certain extent.
This article presents the problem of assessing the reliability of an engineering system already in the design phase. Engineers in this project use empirical values or performance factor data of materials and equipment from various suppliers [60]. Knowledge of these quantities is the basis for conducting reliability assessments of a subsystem or the entire system. In general, the reliability of a wind farm during commissioning can meet specifications. However, equipment failures, system malfunctions or other unforeseen circumstances are inevitable during the extended warranty period. In addition to the immediate loss of electricity sales, it is difficult to estimate the loss of the wind farm brand due to the reduced reliability of the wind farm. On the other hand, offshore wind farms, for example, require higher reliability but have lower maintenance costs compared to onshore wind farms. For this reason, the wind farm project team should conduct more on-site maintenance scenarios for different wind farm environments to further improve the maintenance rate.

6. Conclusions

Wind farm equipment (onshore and offshore) is a complex technical facility that operates continuously. If WF equipment is not operating usefully, then it may be damaged or be in a state of operational readiness for operation. Maintaining the technical condition of these facilities at a good level of their operational characteristics requires the use of an effective operational strategy. The policy for renewing (maintaining the state of fitness) wind farm equipment consists of continuous improvement. The main essence of this strategy for operating a WF is to organize its renewal in such a way as to minimize the cost of implementing the renewal of operating characteristics with the greatest possible efficiency. Reducing the cost of the repair process is directly related to reducing the duration of the process of renewing these devices. The problem of minimizing the cost of the process of renewal of operating characteristics is constantly in the literature. The development of a proper and rational policy for the process of servicing wind farm equipment is a costly and difficult task to implement.
The reliability study of the WF system using the adopted MTTF time makes this article unique compared to other studies. The duration of the MTTF time was examined in the paper as a function of variations in the WF system’s operating time (t). The study covered variations in service time up to one yearly cycle of WF operation, or time (t = 8740 [h]), which was used as the unit of analysis.
Future studies by the authors in this field will focus on figuring out how reliable wind power systems are depending on their current operating conditions (damage times, repair times, and others). On the foundation of this work, future research will examine how artificial intelligence (SERV system) might support and anticipate preventive approaches. Future studies are anticipated to facilitate effective restoration organization by reducing the frequency of maintenance, early replacement of damaged parts at ideal times, and operating and renewal costs.

Author Contributions

Conceptualization, S.D.; methodology, software, validation, and formal analysis, M.W.; investigation, K.Z.; resources, J.P.; data curation, M.S.; writing—original draft preparation, A.O.; writing—review and editing, Z.B.; visualization, M.W.; supervision, project administration, and funding acquisition, S.D. and M.S. All authors have read and agreed to the published version of the manuscript.

Funding

This research received no external funding.

Data Availability Statement

The data presented in this article are available at the request of the corresponding author.

Conflicts of Interest

The authors declare no conflict of interest.

Nomenclature

F(t)The cumulative distribution function of the time to failure
f(t)The probability density function of the time to failure
λ(t)Instantaneous failure rate function
R(t)Reliability function
MTBFMean time between failure
MTTFMean time to failure
MTTRMean time to repair
M(τ)Maintainability function
Kg(t) or KgThe average value of availability function or factor Kg
FcThe quality function of the object’s operation process
FchFunction of the object operation process
λDamage intensity
tThe time of operation process
μRepair intensity
λ1Intensity of type I inspections
μ1Type I operational maintenance intensity
λ2Intensity of type II inspections
μ2Type II operational maintenance intensity
P0Probability of the system being in state S0
P1Probability of the system being in state S1
P01Probability of the system being in state S01
P10Probability of the system being in state S10
WPPESWind power plant expert system

References

  1. Duer, S. Assessment of the Operation Process of Wind Power Plant’s Equipment with the Use of an Artificial Neural Network. Energies 2020, 13, 2437. [Google Scholar] [CrossRef]
  2. Duer, S.; Paś, J.; Hapka, A.; Duer, R.; Ostrowski, M.; Woźniak, M. Assessment of the Reliability of Wind Farm Devices in the Operation Process. Energies 2022, 15, 3860. [Google Scholar] [CrossRef]
  3. Cholda, P. Reliability, survivability, and quality of large-scale telecommunication systems. IEEE Commun. Mag. 2004, 42, 8–10. [Google Scholar] [CrossRef]
  4. US Department of Defense. MIL-HDBK-189: Reliability Growth Management. Washington, 13 February 1981. [Google Scholar]
  5. Lewis, E.E. Introduction to Reliability Engineering; John Wiley & Sons, Inc.: New York, NY, USA, 15 November 1995; pp. 143–190. [Google Scholar]
  6. Zhang, Z.-X. Principle and Application of Reliability; Chinese Society for Quality: Beijing, China, 1979; pp. 18–30. [Google Scholar]
  7. Wang, Y.; Gao, X.; Cai, Y.; Yang, M.; Li, S.; Li, Y. Reliability Evaluation for Aviation Electric Power System in Consideration of Uncertainty. Energies 2020, 13, 1175. [Google Scholar] [CrossRef] [Green Version]
  8. Jose, V.T.; Vicente, D.-C.; Xi, Y. Reliability and Maintenance Management Analysis on Offshore Wind Turbines (OWTs). Energies 2021, 14, 7662. [Google Scholar] [CrossRef]
  9. Carlo, F.D. Reliability and Maintainability in Operations Management. In Operations Management; InTech: Vienna, Austria, 2013; Volume 1, p. 32. [Google Scholar]
  10. Pham, H.; Ram, M. Safety and Reliability Modeling and Its Applications; Elsevier: Cambridge, MA, USA, 12 August 2021; pp. 43–90. [Google Scholar]
  11. DNVGL-ST-0145: Offshore Substations. April 2016. Available online: https://brandcentral.dnv.com/fr/gallery/10651/oth-ers/d0fc2af0882c4070a8aaf30b4eb76457_hi.pdf (accessed on 18 January 2022).
  12. Wang, Q.; He, Z.; Lin, S.; Liu, Y. Availability and Maintenance Modeling for GIS Equipment Served in High-Speed Railway Under Incomplete Maintenance. IEEE Trans. Power Deliv. 2018, 33, 2143–2151. [Google Scholar] [CrossRef]
  13. Duer, S.; Paś, J.; Stawowy, M.; Hapka, A.; Duer, R.; Ostrowski, M.; Woźniak, M. Reliability testing of Wind Power Plant Devices with the Use of the Wind Power Plant Expert System. Energies 2022, 15, 3583. [Google Scholar] [CrossRef]
  14. Zahedi, A. A comprehensive review of operational analysis of wind turbines. In Proceedings of the Australasian Universities Power Engineering Conference (AUPEC), Wollongong, NSW, Australia, 27–30 September 2015. [Google Scholar]
  15. Ye, X.; Veeramachaneni, K.; Yan, Y.; Osadciw, L.A. Unsupervised learning and fusion for failure detection in wind turbines. In Proceedings of the 2009 12th International Conference on Information Fusion, Seattle, WA, USA, 6–9 July 2009. [Google Scholar]
  16. Shah, A.U.A.; Christian, R.; Kim, J.; Kim, J.; Park, J.; Kang, H.G. Dynamic Probabilistic Risk Assessment Based Response Surface Approach for FLEX and Accident Tolerant Fuels for Medium Break LOCA Spectrum. Energies 2021, 14, 2490. [Google Scholar] [CrossRef]
  17. Abo-Khalil, A.G.; Alghamdi, A.I.; Tlili, A.; Eltamaly, A.M. Current Controller Design for DFIG-based 426 Wind Turbines Using State Feedback Control. IET Renew. Power Gener. 2019, 13, 1938–1949. [Google Scholar] [CrossRef]
  18. Eltamaly, A.M. Modeling of wind turbine driving permanent magnet generator with maximum power 383point tracking system. J. King Saud Univ.-Eng. Sci. 2007, 19, 223–236. [Google Scholar]
  19. Andalib, C.; Liang, X.; Zhang, H. Fuzzy-Secondary-Controller-Based Virtual Synchronous Generator 386 Control Scheme for Interfacing Inverters of Renewable Distributed Generation in Microgrids. IEEE Trans. Ind. Appl. 2018, 54, 1047–1061. [Google Scholar] [CrossRef]
  20. Buchannan, B.; Shortliffe, E. Rule—Based Expert Systems; Addison—Wesley Publishing Company: London, UK; Amsterdam, The Netherlands; Don Mills, ON, Canada; Sydney, Australia, 1985; p. 387. [Google Scholar]
  21. Badrzadeh, B.; Gupta, M.; Singh, N.; Petersson, A.; Max, L.; Høgdahl, M. Power system harmonic analysis in wind power plants-Part I: Study methodology and techniques. In Proceedings of the IEEE Industry Applications Society Annual Meeting, Las Vegas, NV, USA, 7–11 October 2012; pp. 1–11. [Google Scholar]
  22. Kunjumuhammed, L.P.; Pal, B.C.; Oates, C.; Dyke, K.L. Electrical oscillations in wind farm systems: Analysis and insight based on detailed modeling. IEEE Trans. Sustain. Energy 2016, 7, 51–62. [Google Scholar] [CrossRef] [Green Version]
  23. Waterman, D. A Guide to Export Systems; Addison—Wesley Publishing Company: Boston, MA, USA, 1986. [Google Scholar]
  24. Gong, X.; Kuenzel, S.; Pal, B.C. Optimal Wind Farm Cabling. IEEE Trans. Sustain. Energy 2018, 9, 1126–1136. [Google Scholar] [CrossRef]
  25. Abdelghany, M.; Ahmad, W.; Tahar, S.T. Event Tree Reliability Analysis of Electrical Power Generation Network using Formal Techniques. In Proceedings of the 2020 IEEE Electric Power and Energy Conference (EPEC), Edmonton, AB, Canada, 9–10 November 2020. [Google Scholar]
  26. Pogaku, N.; Prodanovic, M.; Green, T.C. Modeling, analysis and testing of autonomous operation of an inverter-based microgrid. IEEE Trans. Power Electron. 2007, 22, 613–625. [Google Scholar] [CrossRef] [Green Version]
  27. Shahanaghi, K.; Babaei, H.; Bakhsha, A. A Chance Constrained Model for a Two Units Series Critical System Suffering From Continuous Deterioration. Int. J. Ind. Eng. Prod. Res. 2009, 20, 69–75. [Google Scholar]
  28. Sun, J. Impedance-based stability criterion for grid-connected inverters. IEEE Trans. Power Electron. 2011, 26, 3075–3078. [Google Scholar] [CrossRef]
  29. Hayer-Roth, F.; Waterman, D.; Lenat, D. Building Expert Systems; Addison—Wesley Publishing Company: Boston, MA, USA, 1983; p. 321. [Google Scholar]
  30. Das, M.K.; Panja, S.C.; Chowdhury, S.; Chowdhury, S.P.; Elombo, A.I. Expert-based FMEA of wind turbine system. In Proceedings of the 2011 IEEE International Conference on Industrial Engineering and Engineering Management, Singapore, 6–9 December 2011. [Google Scholar]
  31. Rahimi, T.; Jahan, H.K.; Blaabjerg, B.; Bahman, A.S.; Hosseini, S.H. Fuzzy-Logic-Based Mean Time to Failure (MTTF) Analysis of Interleaved Dc-Dc Converters Equipped with Redundant-Switch Configuration. Appl. Sci. 2019, 9, 88. [Google Scholar] [CrossRef] [Green Version]
  32. Nakagawa, T. Maintenance Theory of Reliability; Springer: London, UK, 2005. [Google Scholar]
  33. Nakagawa, T.; Ito, K. Optimal inspection policies for a storage system with degradation at periodic tests. Math. Comput. Model. 2000, 31, 191–195. [Google Scholar]
  34. Pokoradi, L. Logical Tree of Mathematical Modeling. Theory Appl. Math. Comput. Sci. 2015, 5, 20–28. [Google Scholar]
  35. Dempster, A.P. Upper and lower probabilities induced by a multi-valued mapping. Ann. Math. Stat. 1967, 38, 325–339. [Google Scholar] [CrossRef]
  36. Epstein, B.; Weissman, I. Mathematical Models for Systems Reliability; CRC Press/Taylor & Francis Group: Boca Raton, FL, USA, 2008. [Google Scholar]
  37. Duer, S.; Scaticailov, S.; Pas, J.; Duer, R.; Bernatowicz, D. Taking decisions in the diagnostic intelligent systems on the basis information from an artificial neural network. In Proceedings of the 22nd International Conference On Innovative Manufacturing Engineering And Energy—IManE&E 2018, Book Series MATEC Web of Conferences, Chişinău, Moldova, 31 May–2 June 2018; Volume 178, p. 07003. [Google Scholar] [CrossRef]
  38. Siergiejczyk, M.; Paś, J.; Rosiński, A. Issue of reliability–exploitation evaluation of electronic transport systems used in the railway environment with consideration of electromagnetic interference. IET Intell. Transp. Syst. 2016, 10, 587–593. [Google Scholar] [CrossRef]
  39. Krzykowski, M.; Pas, J.; Rosinski, A. Assessment of the level of reliability of power supplies of the objects of critical Infrastructure. IOP Conf. Ser. Earth Environ. Sci. 2019, 214, 012018. [Google Scholar] [CrossRef]
  40. Rychlicki, M.; Kasprzyk, Z.; Rosiński, A. Analysis of Accuracy and Reliability of Different Types of GPS Receivers. Sensors 2020, 20, 6498. [Google Scholar] [CrossRef] [PubMed]
  41. Stawowy, M.; Rosinski, A.; Pas, J.; Klimczak, T. Method of Estimating Uncertainty as a Way to Evaluate Continuity Quality of Power Supply in Hospital Devices. Energies 2021, 14, 486. [Google Scholar] [CrossRef]
  42. Siergiejczyk, M.; Rosiński, A. Analysis of power supply maintenance in transport telematics system. Solid State Phenom. 2014, 210, 14–19. [Google Scholar] [CrossRef]
  43. Stawowy, M.; Olchowik, W.; Rosiński, A.; Dąbrowski, T. The Analysis and Modelling of the Quality of Information Acquired from Weather Station Sensors. Remote Sens. 2021, 13, 693. [Google Scholar] [CrossRef]
  44. Dziula, P.; Pas, J. Low Frequency Electromagnetic Interferences Impact on Transport Security Systems Used in Wide Transport Areas. TransNav-Int. J. Mar. Navig. Saf. Sea Transp. 2018, 12, 251–258. [Google Scholar] [CrossRef] [Green Version]
  45. Zajkowski, K. Settlement of reactive power compensation in the light of white certificates. In E3S Web of Conferences 19, UNSP 01037; EDP Sciences: Les Ulis, France, 2017. [Google Scholar] [CrossRef] [Green Version]
  46. Zajkowski, K. The method of solution of equations with coefficients that contain measurement errors, using artificial neural network. Neural Comput. Appl. 2012, 24, 431–439. [Google Scholar] [CrossRef] [Green Version]
  47. Zajkowski, K. Two-stage reactive compensation in a three-phase four-wire systems at no sinusoidal periodic waveforms. Electr. Power Syst. Res. 2020, 184, 106296. [Google Scholar] [CrossRef]
  48. Duer, S. Diagnostic system with an artificial neural network in diagnostics of an analogue technical object. Neural Comput. Appl. 2010, 19, 55–60. [Google Scholar] [CrossRef]
  49. Duer, S. Modelling of the operation process of repairable technical objects with the use information from an artificial neural network. Expert Syst. Appl. 2011, 38, 5867–5878. [Google Scholar] [CrossRef]
  50. Duer, S. Diagnostic system for the diagnosis of a reparable technical object, with the use of an artificial neural network of RBF type. Neural Comput. Appl. 2010, 19, 691–700. [Google Scholar] [CrossRef]
  51. Duer, S. Investigation of the operation process of a repairable technical object in an expert servicing system with an artificial neural network. Neural Comput. Appl. 2010, 19, 767–774. [Google Scholar] [CrossRef]
  52. Gupta, M.M.; Jin, L.; Homma, N. Static and Dynamic Neural Networks, from Fundamentals to Advanced Theory; John Wiley and Sons, Inc.: Hoboken, NJ, USA, 2003; p. 718. [Google Scholar]
  53. Tang, L.; Liu, J.; Rong, A.; Yang, Z. Modeling and genetic algorithm solution for the slab stack shuffling problem when implementing steel rolling schedules. Int. J. Prod. Res. 2002, 40, 272–276. [Google Scholar] [CrossRef]
  54. Mathirajan, M.; Chandru, V.; Sivakumar, A.I. Heuristic algorithms for scheduling heat-treatment furnaces of steel casting industries. Sadahanant 2007, 32, 111–119. [Google Scholar] [CrossRef] [Green Version]
  55. Tipping, P.G. Understanding and Mitigating Ageing in Nuclear Power Plants. Textstream, 26 October 2010; 732–794. [Google Scholar]
  56. Lienig, J.; Bruemmer, H. Fundamentals of Electronic Systems Design; Springer: Springe, Germany, 2017; pp. 45–73. [Google Scholar]
  57. Bedkowski, L.; Dabrowski, T. Basic of the Maintenance Theory p. 2; Publishing House of WAT: Warsaw, Poland, 2006; p. 187. [Google Scholar]
  58. Talley, L.D.; Pickard, G.L.; Swift, J.H. Descriptive Physical Oceanography; Elsevier: Cambridge, MA, USA, 2011; pp. 147–186. [Google Scholar]
  59. Dhillon, B.S. Applied Reliability and Quality, Fundamentals, Methods, and Procedures; Springer: London, UK, 2006; p. 186. [Google Scholar]
  60. Chung, I.-H. Exploring the influence of the parameters’ relationship between reliability and maintainability for assessing the conceptual design of offshore wind farm engineering. Energies 2022, 15, 5610. [Google Scholar] [CrossRef]
Figure 1. An illustration of how to operate the machinery at a wind farm.
Energies 16 02827 g001
Figure 2. Graph of changes in the probability of the analyzed values of the WFD system remaining for a period of 1 year—own study.
Energies 16 02827 g002
Figure 3. Relationship between MTTF and maintenance M.
Energies 16 02827 g003
Table 1. Metrics for system dependability.
ParameterValue [1/h]
λ0.00001
λ10.00002
μ0.0208
μ10.0416
Disclaimer/Publisher’s Note: The statements, opinions and data contained in all publications are solely those of the individual author(s) and contributor(s) and not of MDPI and/or the editor(s). MDPI and/or the editor(s) disclaim responsibility for any injury to people or property resulting from any ideas, methods, instructions or products referred to in the content.

