Abstract
The article discusses the use of a catalyst inside the cylinder, the task of which is to reduce exhaust emissions from a diesel engine. The catalyst (platinum) applied to the glow plugs provided an additional method of exhaust aftertreatment. Due to their usage, especially in urban driving, passenger cars are characterized by small mileage between individual trips, so they often operate from a cold engine start and work at a low engine temperature, which leads to reduced catalytic reactor efficiency. For this reason, the efficiency of the internal catalyst was tested in relation to the efficiency of the external reactor. This efficiency was determined based on exhaust emission measurements (before and after the catalytic reactor) in two stages: stage 1: idling of a hot engine, and stage 2: simulation of the NEDC test (valid for the selected test object). The tests were carried out on an engine dynamometer, where the traffic conditions from the type-approval test carried out on a chassis dynamometer could be replicated. The tests were carried out on a Euro 4 1.3 JTD MultiJet diesel engine. The results (measurement of carbon monoxide, hydrocarbons, and the number of particles) related to the assessment of the effect the catalyst in the cylinder were discussed. The obtained catalytic reactor efficiency results, regardless of the type of research, indicated that it achieved the highest efficiency in reducing the concentration of hydrocarbons, and the lowest—in relation to the number of solid particles (as that is not its primary function). It is particularly significant that the in-cylinder catalytic converter was most efficient during the cold engine start, which happens frequently in urban driving. The efficiency of the diesel oxidation catalytic reactor (DOC) during the engine start-up and warm-up phases with the use of standard glow plugs reached values of 31.3%, 34.1% and 14.3%, respectively, for carbon monoxide, hydrocarbons and the particle number. On the other hand, the determined efficiency of the DOC in a setup with the modified glow plugs was 28.9%, 35.7% and 12.5%, respectively. The proposed solution can be used to improve the combustion quality in internal combustion engines used in hybrid vehicles, which are characterized by frequent engine starts and stops. In addition, it is possible to use such a solution retroactively in traditional vehicles powered by an internal combustion engine, which could result in an improvement in their emission class through what is called retrofitting.
1. Introduction and Research Goals
The rapid technological development that is currently taking place is a reflection of existential needs and a way to satiate human curiosity. Exceptional progress over the last 100 years has been observed in the global automotive industry, which is one of the most dynamically operating branches of the global economy.
The European Union has been paying extra attention to the issues of environmental protection for many years. The market success of a given technical object or product is increasingly more often determined by its overall low environmental impact. Transport as a system, along with means of transport, belong to the sector of the economy that generates a lot of environmental pollution. In the last century, the primary source of propulsion was, and still is, the internal combustion engine. An important element observed in recent years in the development of transport systems, however, is the return to the concept of an electric car.
Especially for electric and plug-in hybrid vehicles, the so-called trailed emissions should be taken into account. The entire cycle of energy conversion, i.e., from source to wheel (also called well to wheel), should be taken into account. Currently, fuel consumption from the distributor to the wheel (tank to wheel) is commonly defined, whereas the cycle from the source of extraction to the distributor (well to tank) is usually omitted.
In addition, in the European Union (EU-27), the average CO2 emission generated in the production of 1 kWh of electricity is about 230 g, and in Poland it is 700 g CO2/kWh [1]. Therefore, electric vehicles by themselves cannot be considered zero emission.
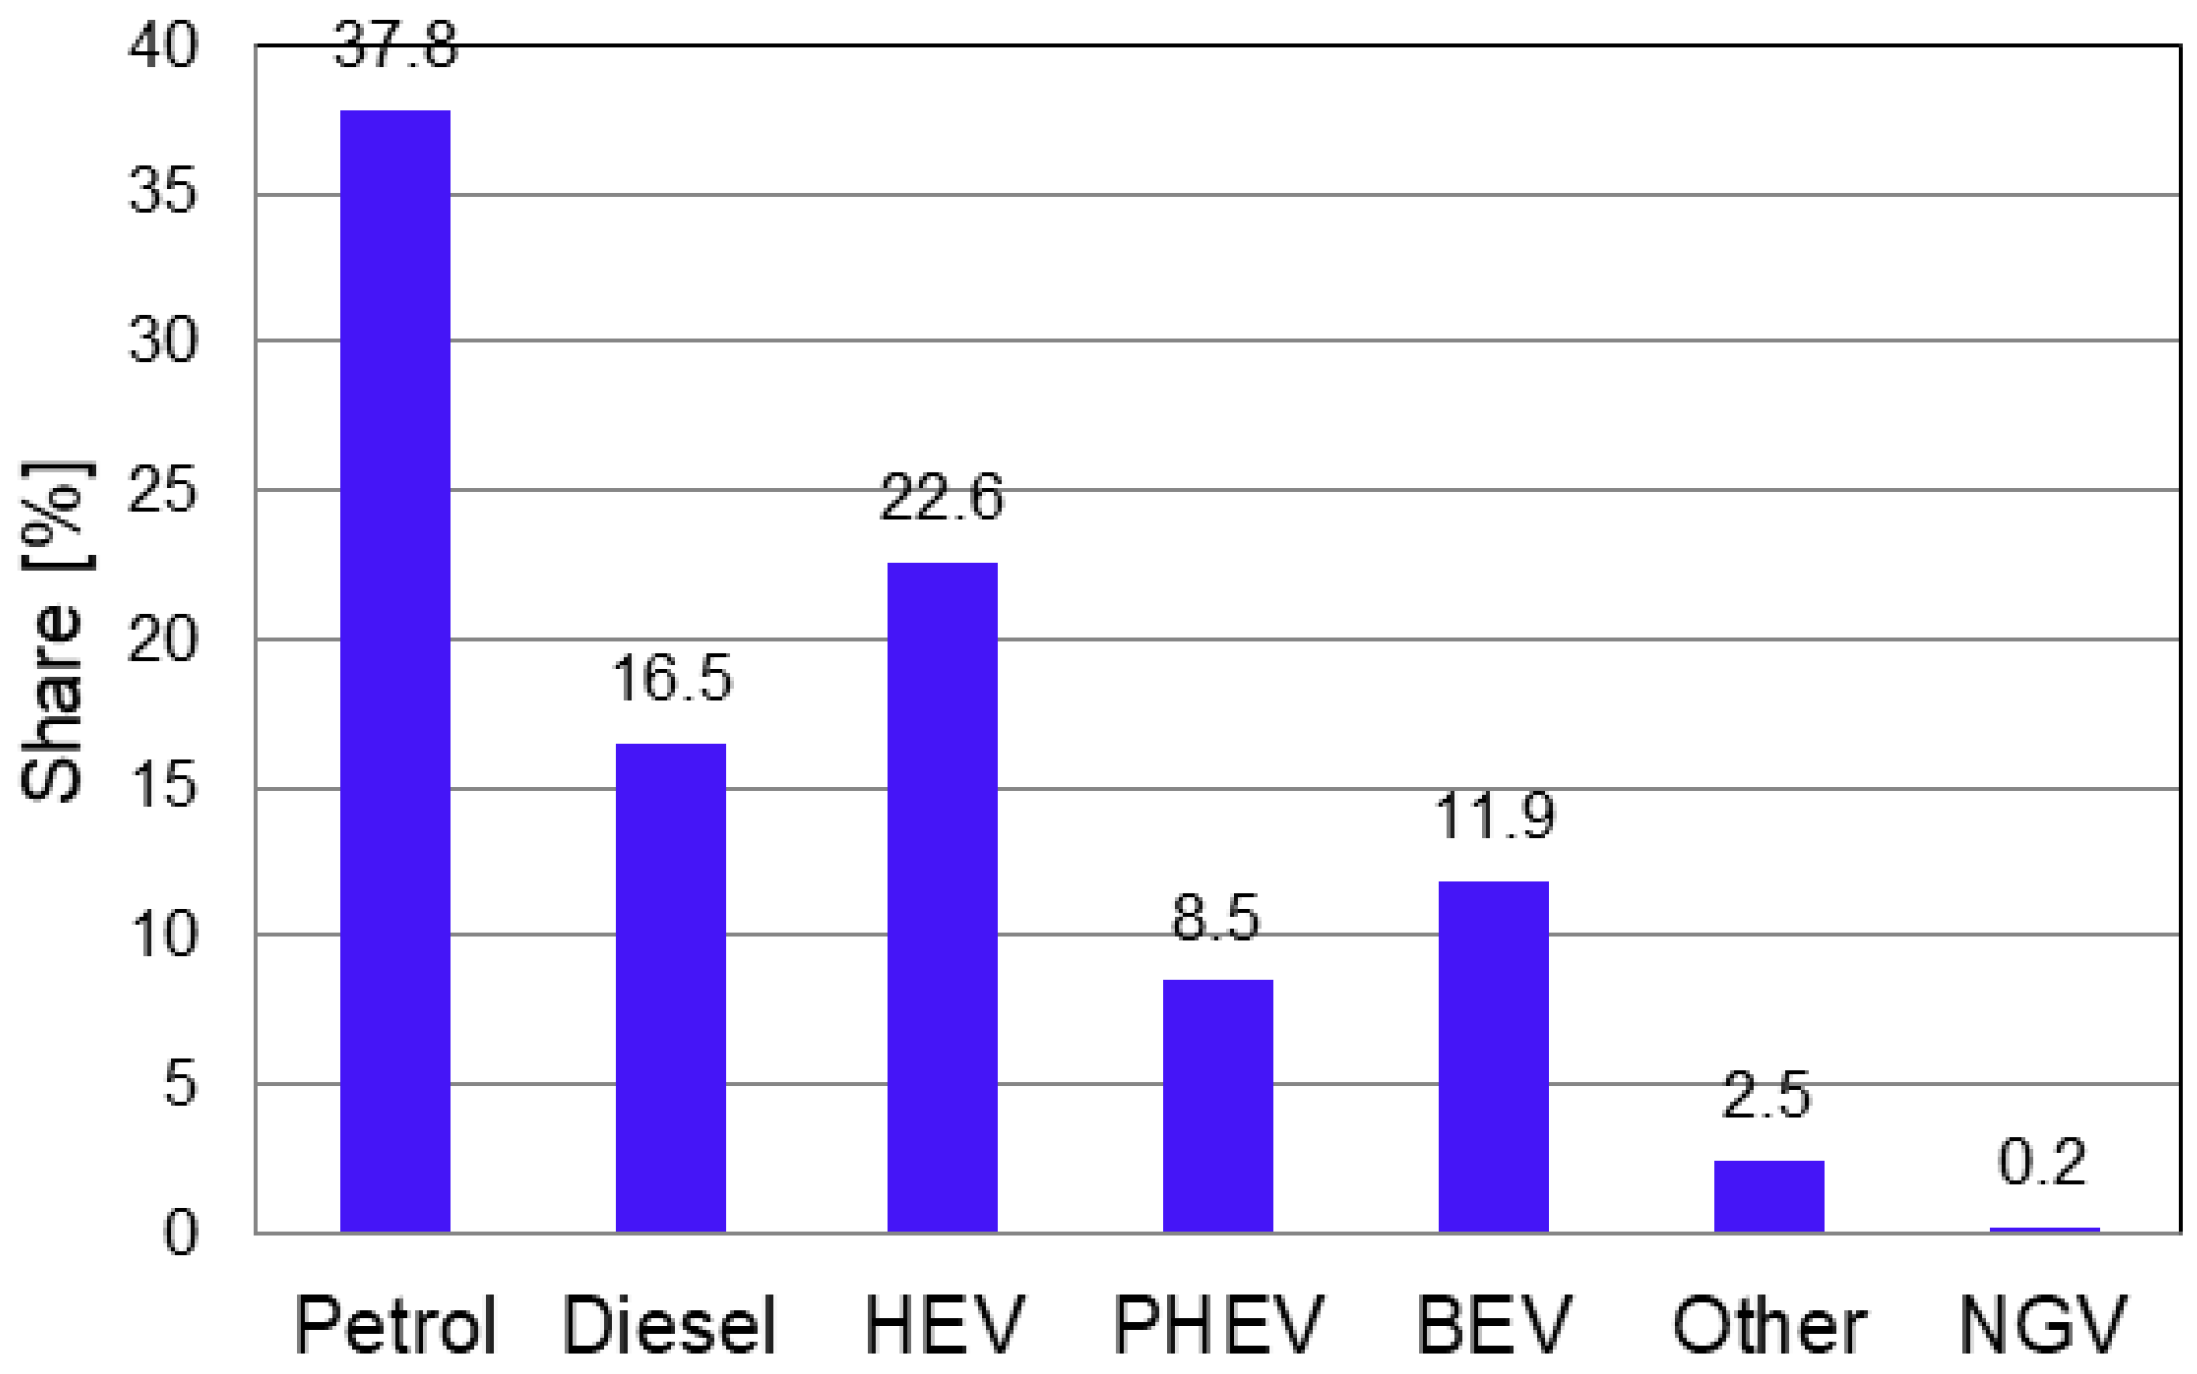
Before alternative fuel vehicles come close to surpassing internal combustion engines, it must be said that spark ignition and diesel engines will continue to exist and will be the main source of energy in transport for the time being (Figure 1). In some markets (Africa, South America, Asia), and in some applications (aerospace and seafaring), the internal combustion engine will continue to dominate. Taking this into account, it is necessary to continue to develop and improve their design.

Figure 1.
New passenger cars by fuel type in the EU-27 (based on data from [2]).
The introduction of the restrictive Euro 7 standard, and especially the Fit to 55 legislative proposals, practically eliminates the use of internal combustion engines as a source of propulsion in means of transport starting in 2035.
The war in Ukraine and the stance of vehicle manufacturers belonging to the European Automobile Manufacturers’ Association (ACEA [3,4]) have led to the position of the European Union being softened. This new emission norm is likely to come into force in 2025 and, fortunately, in a less restrictive form compared to the original assumptions, and these emission limits in the Euro 7 will not be lower than in the Euro 6e. Engines will have to comply with the emission norms at a cold start, during short periods of operation and in real operating conditions (in the RDE test [5]).
For LDV vehicles in 2030, the European Union calls for a 37.5% reduction in CO2 emissions for the tank to wheel cycle, while Japan calls for a 32% reduction for the well to wheel cycle, due to the planned large number of plug-in hybrid and electric vehicles as well as those powered by fuel cells. The problems of recycling and energy saving have also been noted to be of importance, and they are being given increasingly more scrutiny.
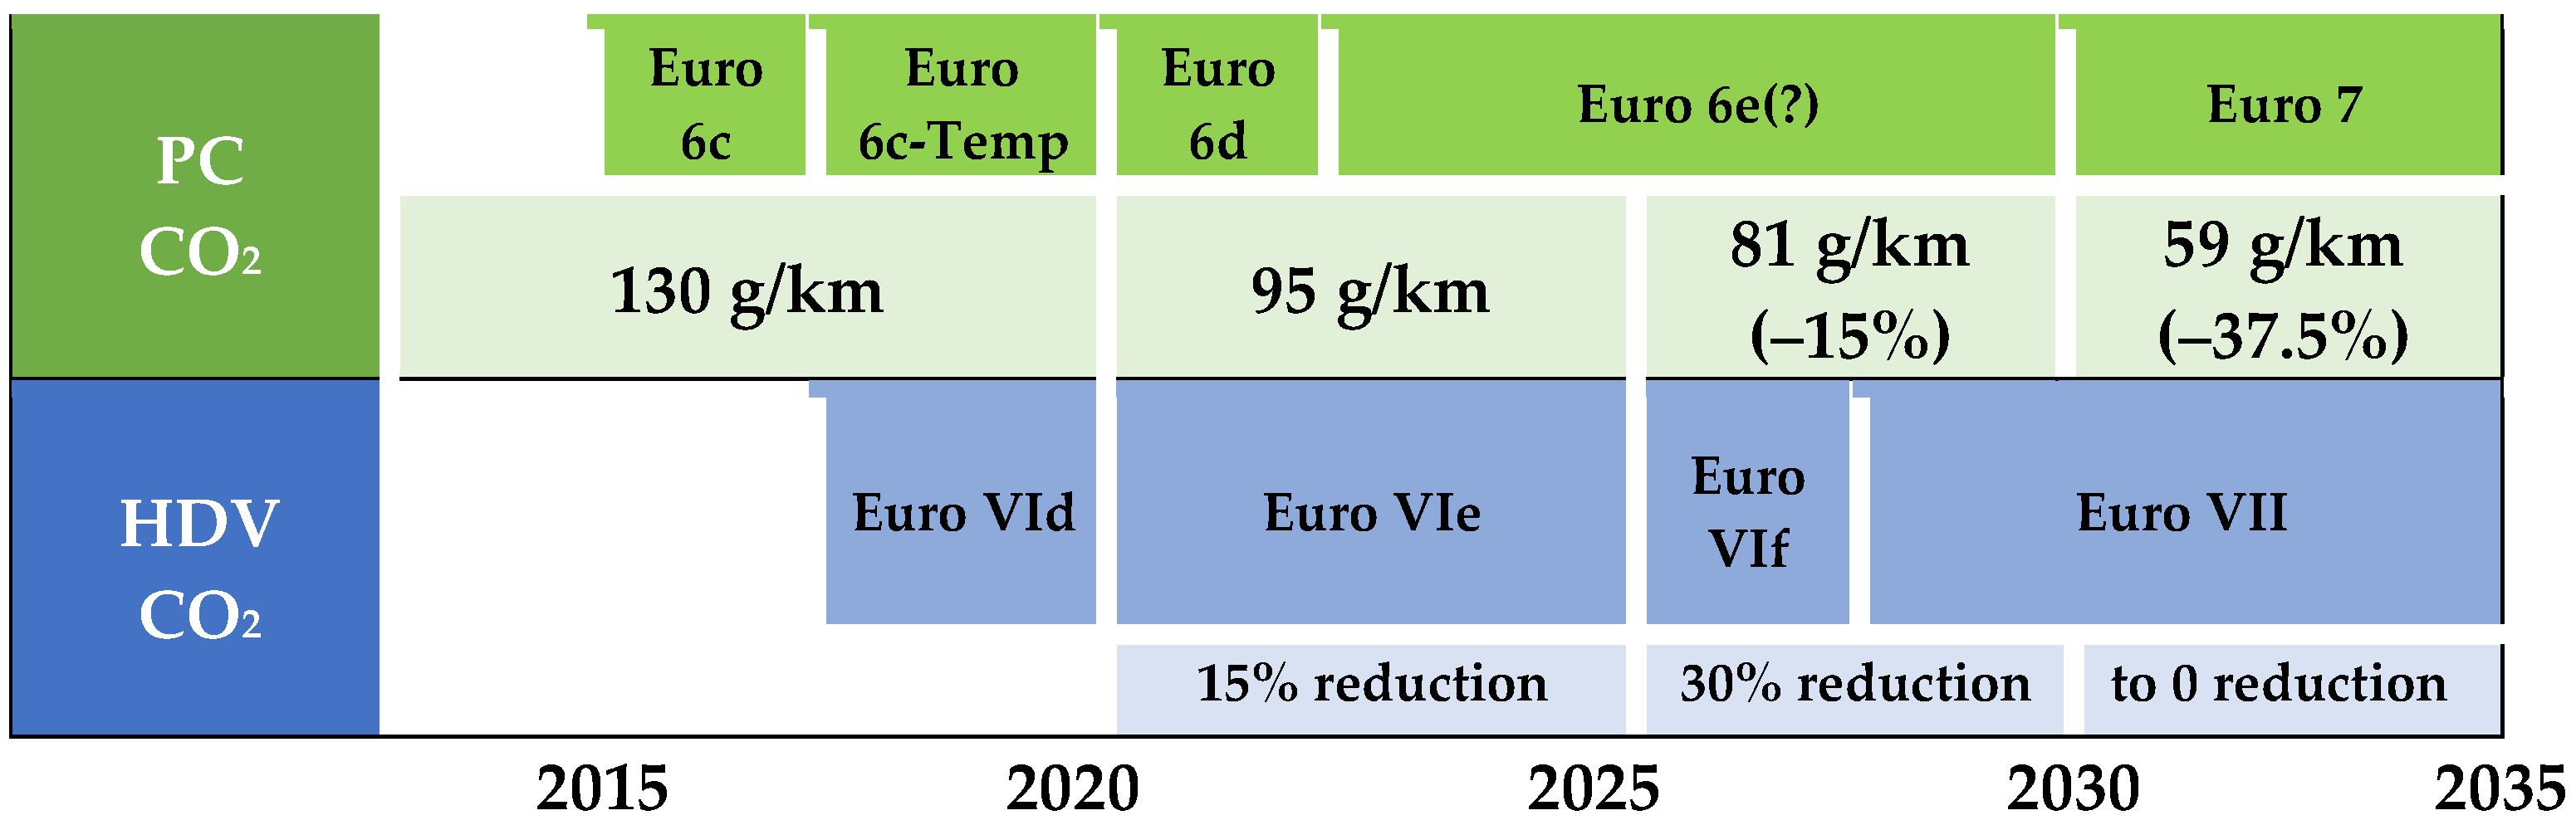
Considering the stance of the Association for Emissions Control by Catalyst (AECC) [6], the development of the Euro 7/VII standard has created an opportunity to ensure clean vehicles while maintaining mobility options. The introduction of real-world emission measurements (RDE) led to a change in the method of carrying out type-approval tests, in line with the holistic approach to the vehicle (Figure 2). Advanced emission control systems have been shown to achieve near-zero emissions of nitrogen oxides and particulate matter in real driving conditions. These technologies can be used in light and heavy-duty vehicles, and they are solutions for zero-emission mobility in Europe by 2050 (Table 1).
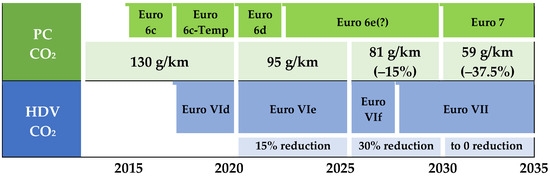
Figure 2.
Passenger cars’ CO2 emission norm changes (adopted from [7]).

Table 1.
Changes in emission limits for passenger cars and heavy-duty trucks (adopted from [7]).
In order to meet the Euro 7 standard and achieve the goal of zero (or near-zero) emissions vehicles, the plan is to introduce the following solutions to the design of the diesel engine in connection with improved operating strategies using artificial intelligence:
- Steel piston;
- Multi-phase common rail ~180–300 MPa;
- Combined, double-dosing EGR (HP w/w-o cooling and LP with cooling);
- Combined boosting (turbocharging, electric booster);
- Optimized air and exhaust gas duct;
- VVT and VVL;
- Thermomanagement;
- Sensors: NOx, PM and air humidity;
- Flexible electrification;
- E-machine with 30 kW peak;
- Hydrogen as fuel;
- Advanced exhaust after-treatment system (E-cat, DPF, LNT, DOC etc.);
- Advanced OBD.
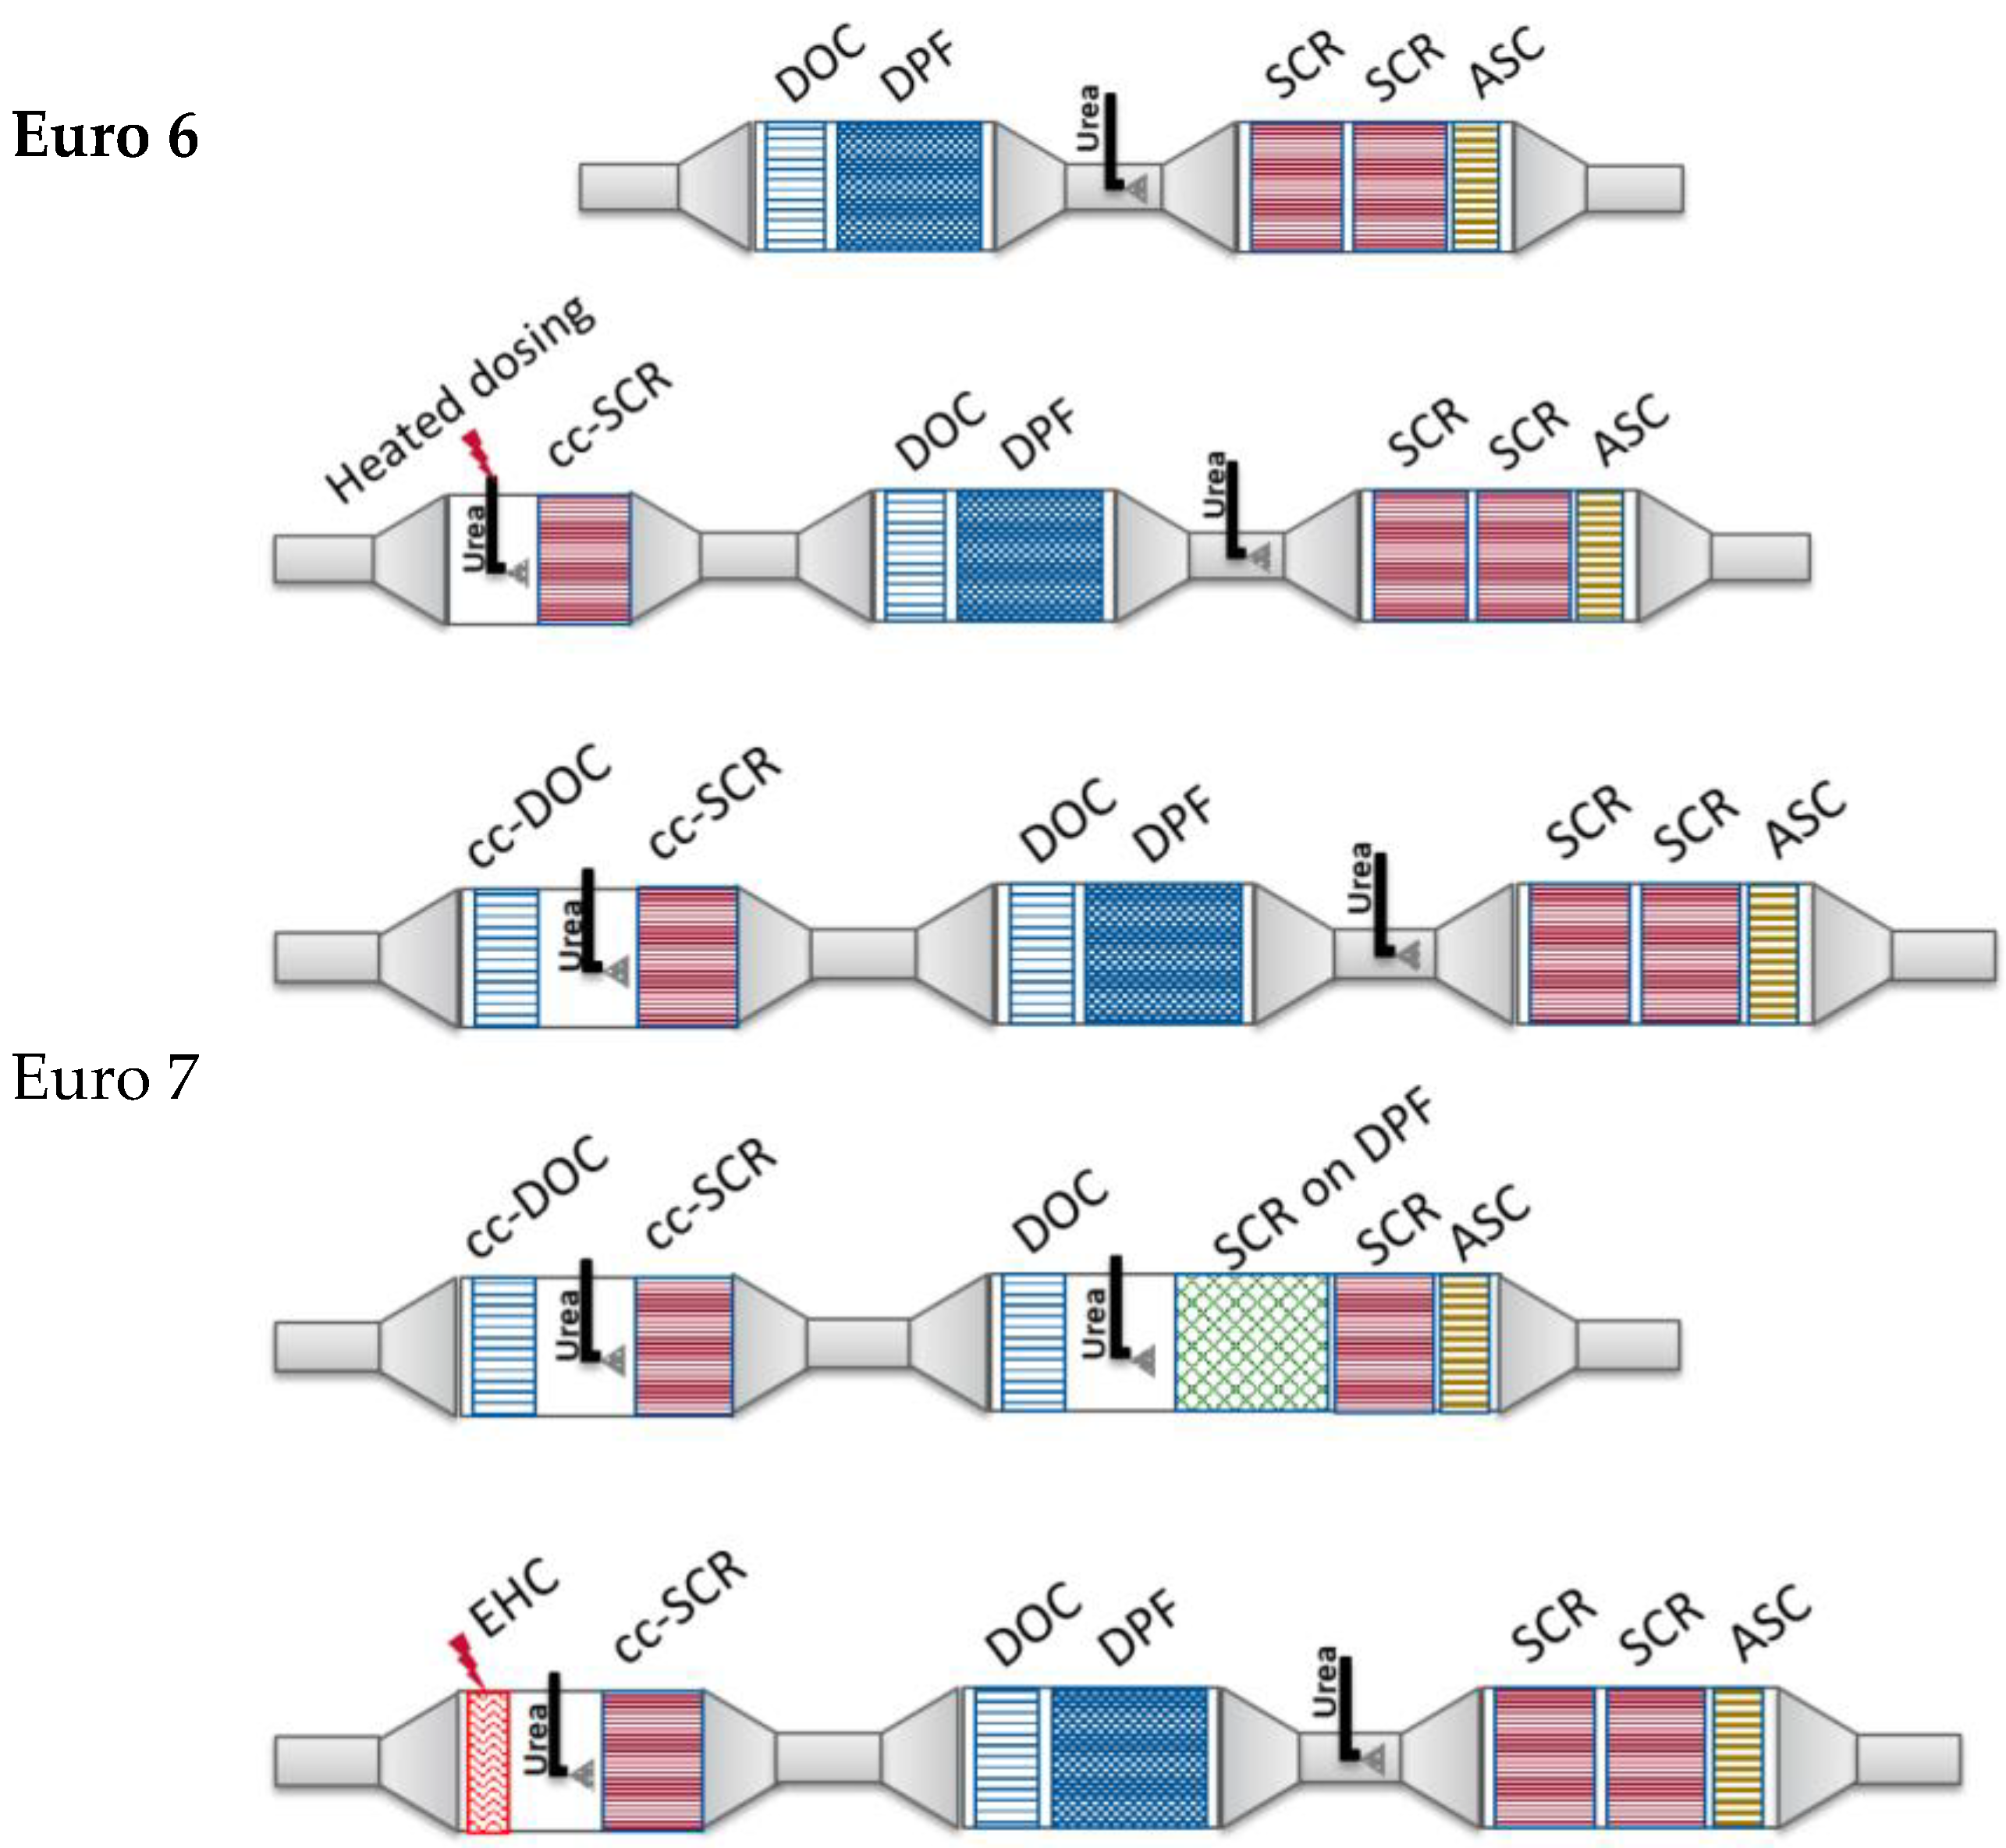
The decisive factor in achieving these goals is the intelligent combination of multi-criteria optimization of the engine and the exhaust aftertreatment system toward meeting the RDE test requirements. Thus, to meet the Euro 7 standard, great emphasis must be placed on very complex, multi-part and integrated aftertreatment systems, including an electrically heated catalytic converter (EHC) system (Figure 3). Unfortunately, these systems are very expensive, and it is estimated that this will result in a significant increase in the price of about EUR 430 for systems, not counting the costs of changing the control system itself, the AdBlue supply system, the AdBlue mixing system and other related systems (e.g., MHEV) [8,9].

Figure 3.
Advanced aftertreatment for ultra-low urban and motorway operation to meet Euro 7 standard; ccSCR—close coupled position SCR, SDPF—SCR catalyst coated on a DPF, ufSCR—underfloor position SCR, and ASC—ammonia slip catalyst (adopted from [10]).
Considering the above and the fact that the internal combustion engine will be in operation for many years to come, the authors propose the use of a much cheaper concept, i.e., an internal catalyst, aimed at reducing the exhaust emissions during engine start-up and short urban trips. The proposed solution was mainly intended to improve the quality of combustion in internal combustion engines used in hybrid vehicles, which are characterized by frequent engine starts. In addition, it is possible to use it in traditional, already operated vehicles powered by an internal combustion engine, which could result in an improvement in the emission class through so-called retrofitting. This is especially important since the average age of LDV vehicles in the European Union is about 12 years [11].
Passenger cars, due to the way they are used, especially during urban driving, are characterized by small mileage between individual engine starts, so they are often operated starting from a cold engine state and work with an underheated engine [12]. According to studies from Scandinavia [13], 2.7 billion cold engine starts in passenger cars are performed in Sweden each year, and 2.6 billion in Finland. Cold starts are the cause of about 90% of the total hydrocarbon and carbon monoxide emissions and 50–70% of those emissions from passenger cars in Scandinavian countries, so they are a significant source of exhaust emissions from automotive sources.
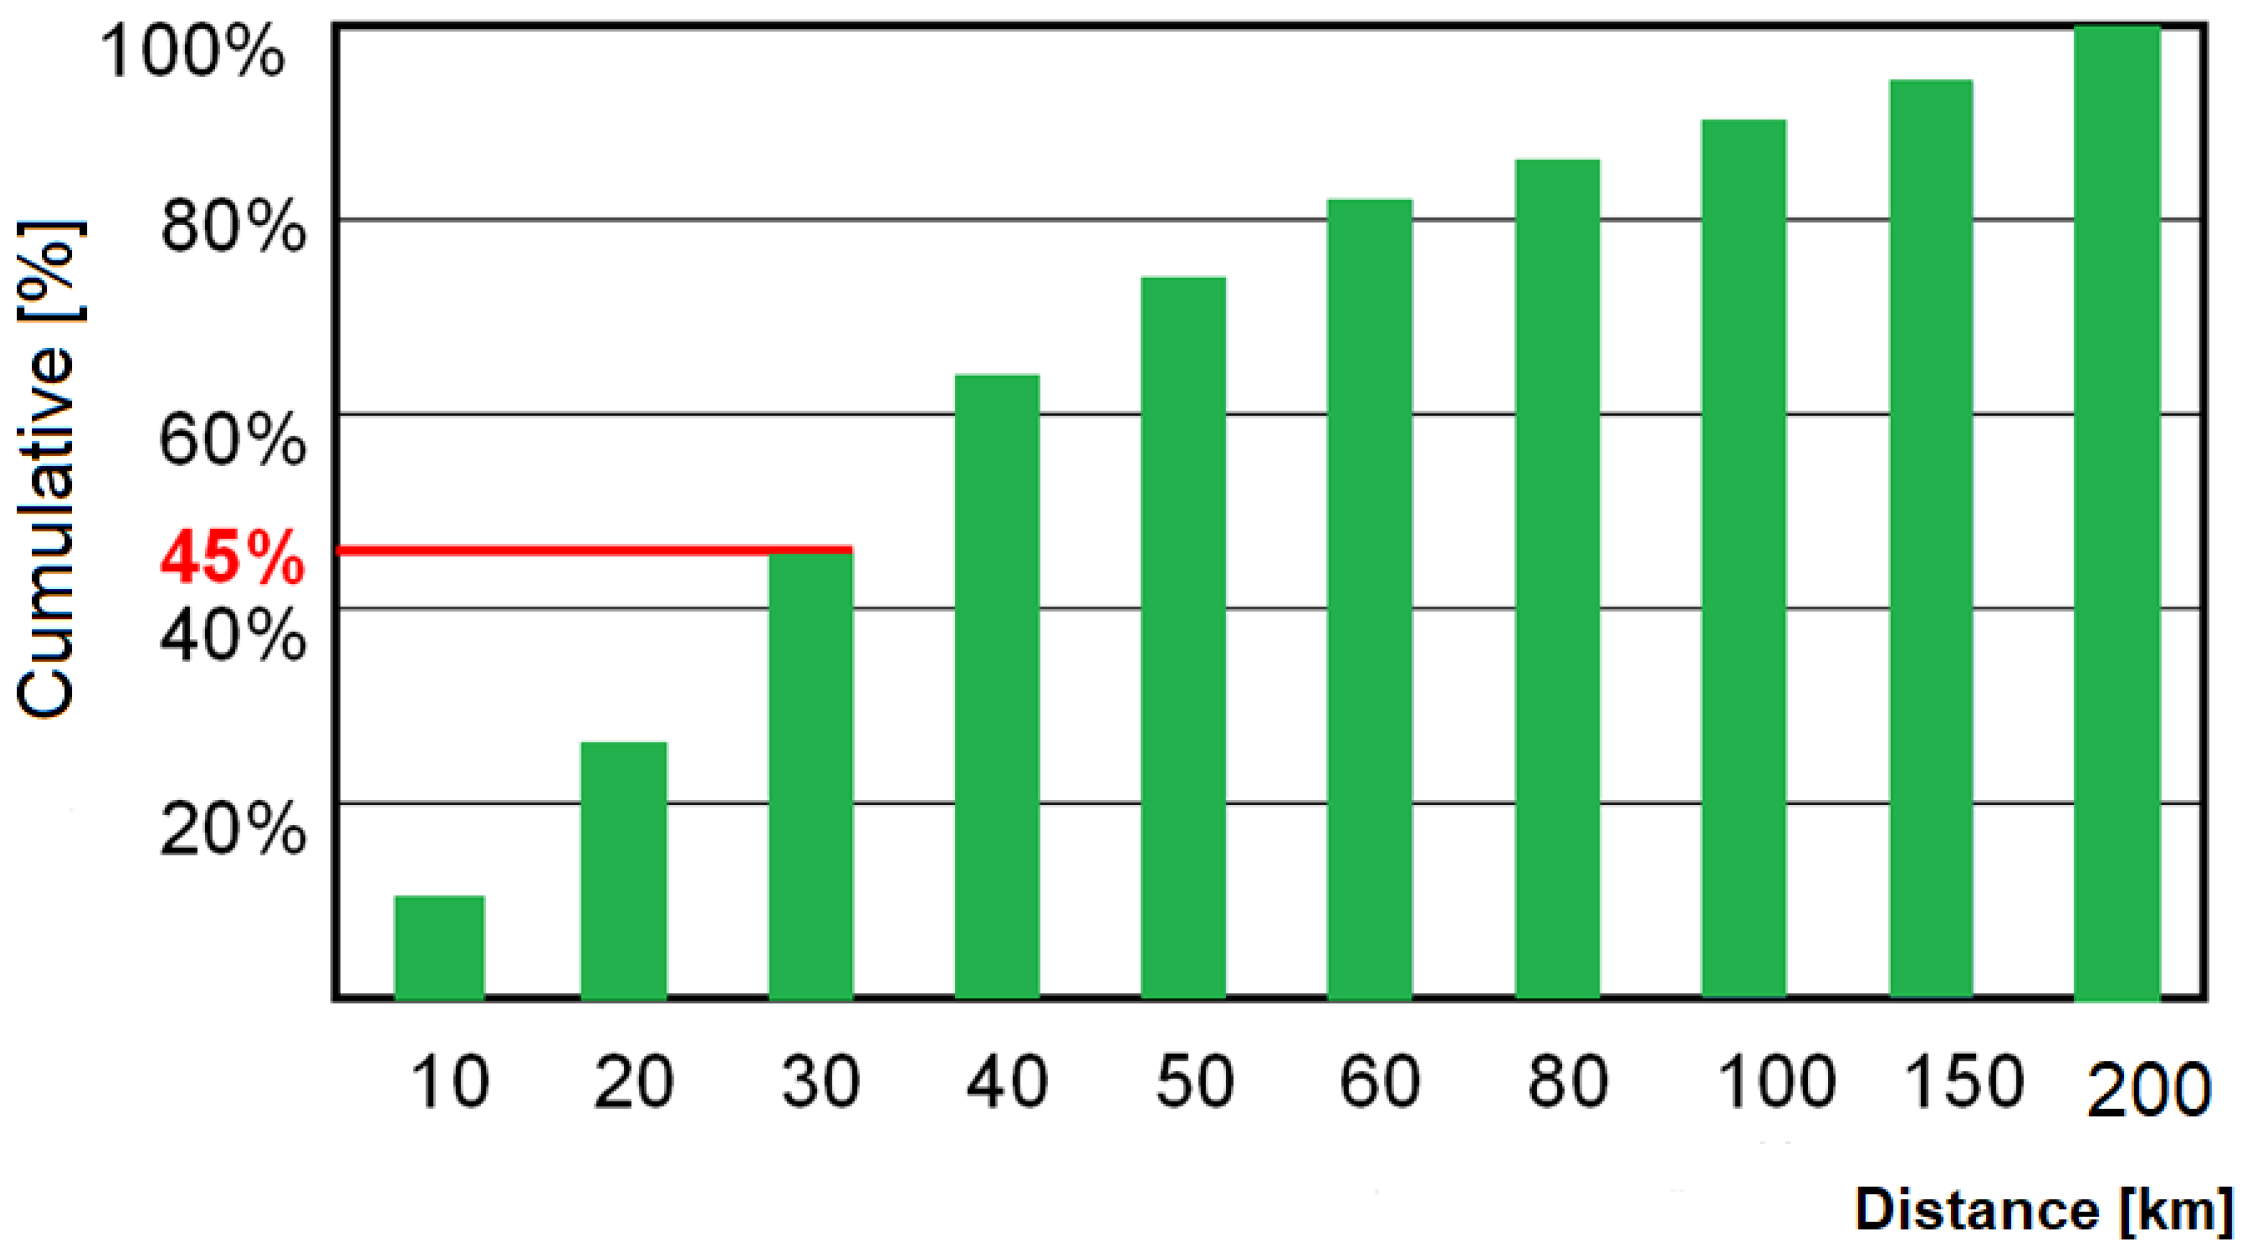
Based on European data (Figure 4), it appears that 45% of routes are shorter than 30 km, so the engine is underheated and the catalytic reactor is not fully operational, especially when stationary—therefore, it is possible to use engine and non-engine measures to reduce this phenomenon [12]. Recent studies indicate that the most typical ‘home–office’ commute in the EU is about 11 km long, which corresponds to the distance driven in the NEDC test [14].
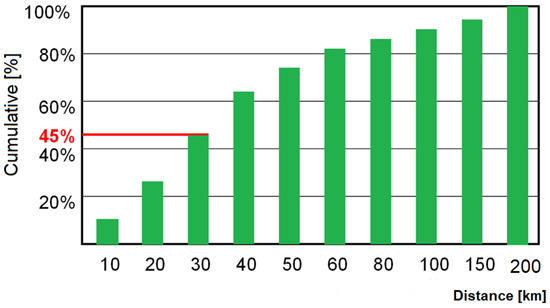
Figure 4.
Daily mileage of passenger cars in Europe (based on data from [15]).
2. Discussion in the Literature
Increasing emphasis on reducing the negative environmental impact of internal combustion vehicles, both from the legislative institutions of individual countries as well as their communities, drives the search for more and more advanced technical solutions for internal combustion engines that will ensure the reduction of this impact and meet the current exhaust emission standards. Among such activities, the most important are those that directly improve combustion and reduce the formation of the toxic components of exhaust gases still in the combustion chamber of the engine.
Another important issue in reducing environmental pollution is the development of new fuels for internal combustion engines. The practice of adding alternative fuels to diesel fuel in order to reduce the exhaust emissions was discussed by Dongli et al. [16,17,18], among others. The addition of biofuels and a different injection strategy were shown to reduce nitrogen oxide emissions by 50–85%, as well as reducing the exhaust emissions of hydrocarbons by 24–38%, while increasing fuel consumption [16]. The addition of 5–15% of hydrogen reduced the emission of nitrogen oxides, carbon monoxide and hydrocarbons by about 30% [17]. Studies on the effect of ethanol on exhaust emissions have shown that its addition to regular fuel reduces nitrogen oxide emissions by 8–20%, carbon monoxide by 12–20%, and particulate matter by 27–48% relative to diesel fuel [18].
Works on pro-environmental issues in internal combustion engines and the beneficial effect of an internal catalyst placed in the cylinder on engine performance and exhaust emissions were the subject of research as early as the mid-twentieth century. The application of a catalytic coating in the cylinder was mainly aimed at reducing smoke opacity in diesel engines by reducing the auto-ignition delay [19,20,21,22]. Other advantages were the subject of works in which the internal catalyst (platinum coating of the exhaust valve) resulted in a reduction of carbon monoxide and hydrocarbon emissions in a diesel engine fueled with methanol [23] and diesel oil [24,25].
In their work on the internal catalyst [26,27], Hu and Ladommatos presented an innovative approach to reducing hydrocarbon emissions from gasoline engines using in-cylinder catalysts. They applied a platinum–rhodium coating deposited on the top and side surfaces of the piston crown, and its effect on the combustion characteristics and exhaust emissions was experimentally investigated. The in-cylinder catalyst reduced emissions of unburned hydrocarbons in exhaust gases by approximately 20% over a wide range of operating conditions.
Wu et al. developed and tested a catalytic coating of cylinder walls in internal combustion engines in [28]. The coating consisted of a La0.8Sr0.2CoO3 (LSCO) catalyst on an aluminum-based ceramic substrate. In addition, the effect of LSCO-coated substrates on the flame extinguishing distance in a fixed-volume combustion chamber was investigated. The LSCO coating has been shown to result in reduced flame extinguishing at low wall temperatures, although it has a negligible effect at high temperatures. The effect of LSCO coatings on the gas composition near the cylinder wall was also shown using a fast gas sampling methodology with a sample duration of less than 1 ms. Ion Molecule Reaction Mass Spectrometry and Fourier Transform Infrared Spectroscopy showed a significant reduction of hydrocarbons and carbon monoxide after the LSCO coating.
The article [29] presents an approach to reducing the emission of unburned hydrocarbons from a homogeneous charge compression ignition (HCCI) engine by using in-cylinder catalysts. The characteristics of the HCCI engine were numerically simulated for three cases, i.e., a base engine with the original piston crown, an engine with a platinum coating on the top and side surfaces of the piston crown, and an engine with a platinum coating only on the side surface of the piston crown (partly coated housing). The in-cylinder catalyst reduces the emission of unburnt hydrocarbons in the exhaust gas by about 15% when the piston crown is fully covered with a platinum catalyst; however, when partially covered, the in-cylinder catalyst can reduce their emissions by about 20%.
The problem of the catalyst in the cylinder is widely considered by the authors in publications [30,31,32,33,34]. The results of research work on the use of an internal catalyst in various engine operating conditions are given in them, including during start-up tests, dynamic engine dynamometer tests (in homologation tests and simulations of road tests), as well as in road tests of vehicles [30]. The research objects in this case were glow plugs covered with a catalytic layer. Platinum was used as the catalyst. The use of an internal catalytic converter during various engine [31] (or vehicle [32]) operating conditions resulted in a few percent reduction in the carbon monoxide, hydrocarbons, carbon dioxide and particulate matter emissions. What is particularly important is that the internal catalytic converter worked most effectively during the engine cold start [33], which often occurs in urban driving. In addition, an analysis of the effect of the glow plug heating time on the exhaust emissions in selected studies and changes in emissions with the use of an internal catalyst on the prototype glow plugs with an elongated heating section was presented.
Janicka et al. [35,36,37] discussed the research results on the impact of a catalyst in the cylinder on the operating parameters of the diesel engine. The method of preparing the catalyst and the method of evaluating the effectiveness of this solution were presented [35]. The active agent was platinum and rhodium applied to the engine valves [36]. Zirconia ceramics were used as the support layer. The research focused mainly on the effect of the solution on the formation and emission of polycyclic aromatic hydrocarbons [37]. A decrease in PAHs and volatile organic compounds was observed.
Research [38] focused on engine components coated with aluminum, titanium, nickel and chromium compounds applied by plasma spraying. The concentrations of CO, HC and NOx were determined, and the specific fuel consumption was determined for various engine elements (piston head and piston crown) that were catalytically coated. No unequivocal effect of the type of catalytic coating on the value of the carbon monoxide concentration in the exhaust gas was observed, while an increase in the concentration of HC in most of the tested load ranges of up to 60% was found, as well as a decrease in the concentration of nitrogen oxides by about 30% and a decrease in the specific fuel consumption by about 15%.
The internal catalytic converter can not only be used in passenger car engines. In [39], the authors presented theoretical considerations for a diesel engine with a catalytic piston surface for propelling small aircraft at high altitudes. The authors of the article [40] also suggest the possibility of improving liquid atomization in aircraft engines by changing the processes inside the cylinders or changing the fuel [41].
Based on the analysis of the literature data, it can be concluded that the modification of the engine combustion space, consisting of the introduction of an active substance (catalyst), can shorten the ignition delay by reducing the activation energy of pre-ignition reactions, thus improving engine operation and limiting the formation of harmful exhaust compounds in the engine cylinder.
The solution consisting of placing a platinum glow plug is unique and original on a global scale. The technology for applying a platinum coating is also innovative. The results of the studies carried out so far by the authors justify the desirability of developing this concept in terms of reducing exhaust emissions from diesel engines.
3. Research Method
3.1. Object Research
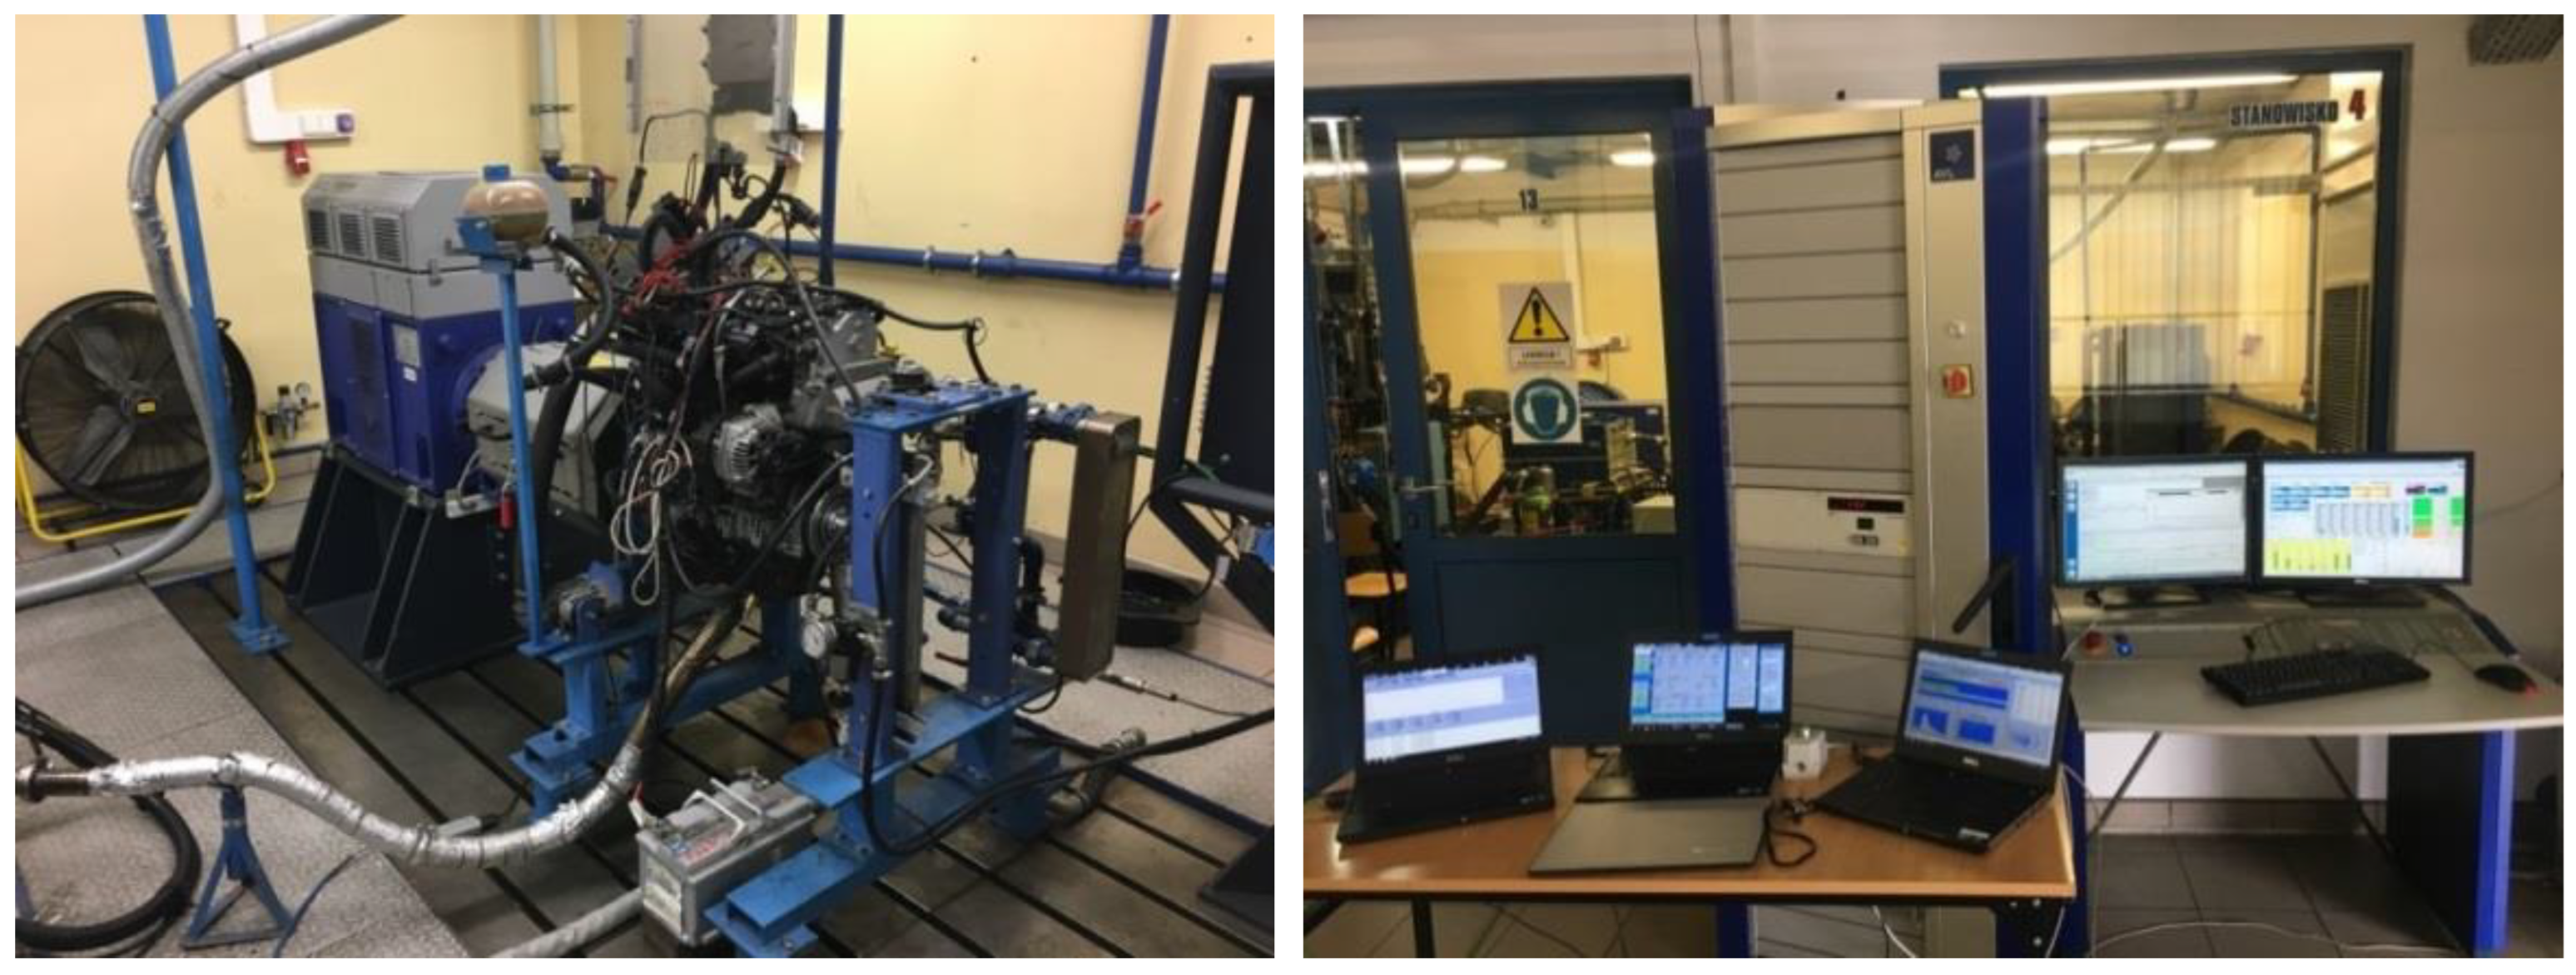
The test object was a supercharged diesel engine with a displacement of 1.3 dm3 in the Euro 4 emission class (technical data are presented in Table 2). The tests were carried out on a test stand (Figure 5), which can be used to simulate the NEDC approval test (after prior parameterization of the vehicle data). The exhaust aftertreatment system was typical of diesel engines with direct fuel injection with a common rail fuel supply system. Such a system was only a dual-function catalytic reactor (a diesel particulate filter is not required in vehicles of this emission category).
Table 2.
The engine unit characteristics for the tested vehicle.

Figure 5.
The test object on the engine dynamometer and the engine control system.
The choice of such a research object was dictated by the fact that over 50% of cars in the European Union are equipped with similar engines. At the same time, the Euro 4 emission standard was in force from 1 January 2006 to 2010, and the average age of cars imported to Poland is 14 years (of which 42% are vehicles with diesel engines). Therefore, the most representative engine in Europe and in Poland was a vehicle with the Euro 4 emission class equipped with a diesel engine. Another fact is that it is an engine in which carbon monoxide and hydrocarbon emissions can be reduced—by simply replacing the glow plug—which is a very low-cost component. This procedure can improve their emission class, which is known as retrofitting.
3.2. Test Stand
One of the modern methods for determining the rated parameters as well as the ecological indicators of internal combustion engines is the use of engine dynamometers, which allow for engine testing in dynamic conditions. The tests were carried out on the Dynoroad 120 kW stand made by AVL, which enabled the recording of the engine operating parameters with a sampling frequency of 10 Hz. One of the basic functions of the test stand used was the ability to implement a simulation algorithm in the software that reflected the operation of the combustion engine in road test conditions. The impacts of the drive system components, vehicle structure parameters (e.g., gear ratio), drivetrain resistance, vehicle weight, drag coefficient, clutch operation characteristics and vehicle inertia were all taken into account. The fully completed test stand allowed us to record the parameters related to the operation of the engine, as well as those of its accessories. During the tests, the stand could be supplemented with additional parameters, e.g., allowing the acquisition of exhaust gas analysis parameters.
The basic executive element performing the tasks on the test stand (Figure 6) was a three-phase asynchronous electric motor. It allows the reception of maximum power up to 120 kW. The combustion engine during the tests generates mechanical work converted in the brake into electricity, which, after voltage-frequency conversion, is transferred to the external network. The ISAC 400 software interface installed on the stand enabled the definition of a test cycle including, among others, an NEDC chassis test.
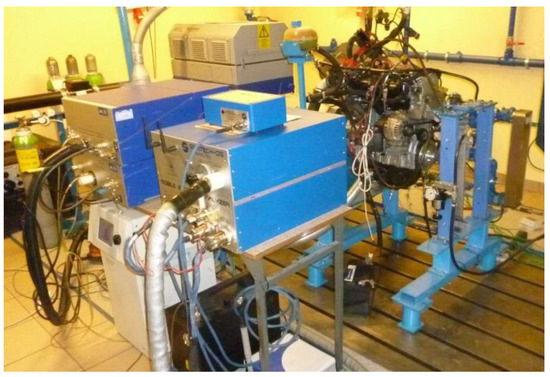
Figure 6.
The test stand used in the research.
3.3. Research Plan
The test plan included determining the efficiency of the external reactor (standard vehicle equipment) with various glow plugs used in the engine (standard or modified). This efficiency was determined based on exhaust emission measurements (before and after the catalytic reactor) in two stages:
- Stage 1: hot engine idling;
- Stage 2: an NEDC test simulation (test type relevant to the tested engine).
The authors chose the NEDC test performed on a dynamic dynamometer to ensure the greater repeatability and accuracy of the results.
3.4. Measuring Equipment
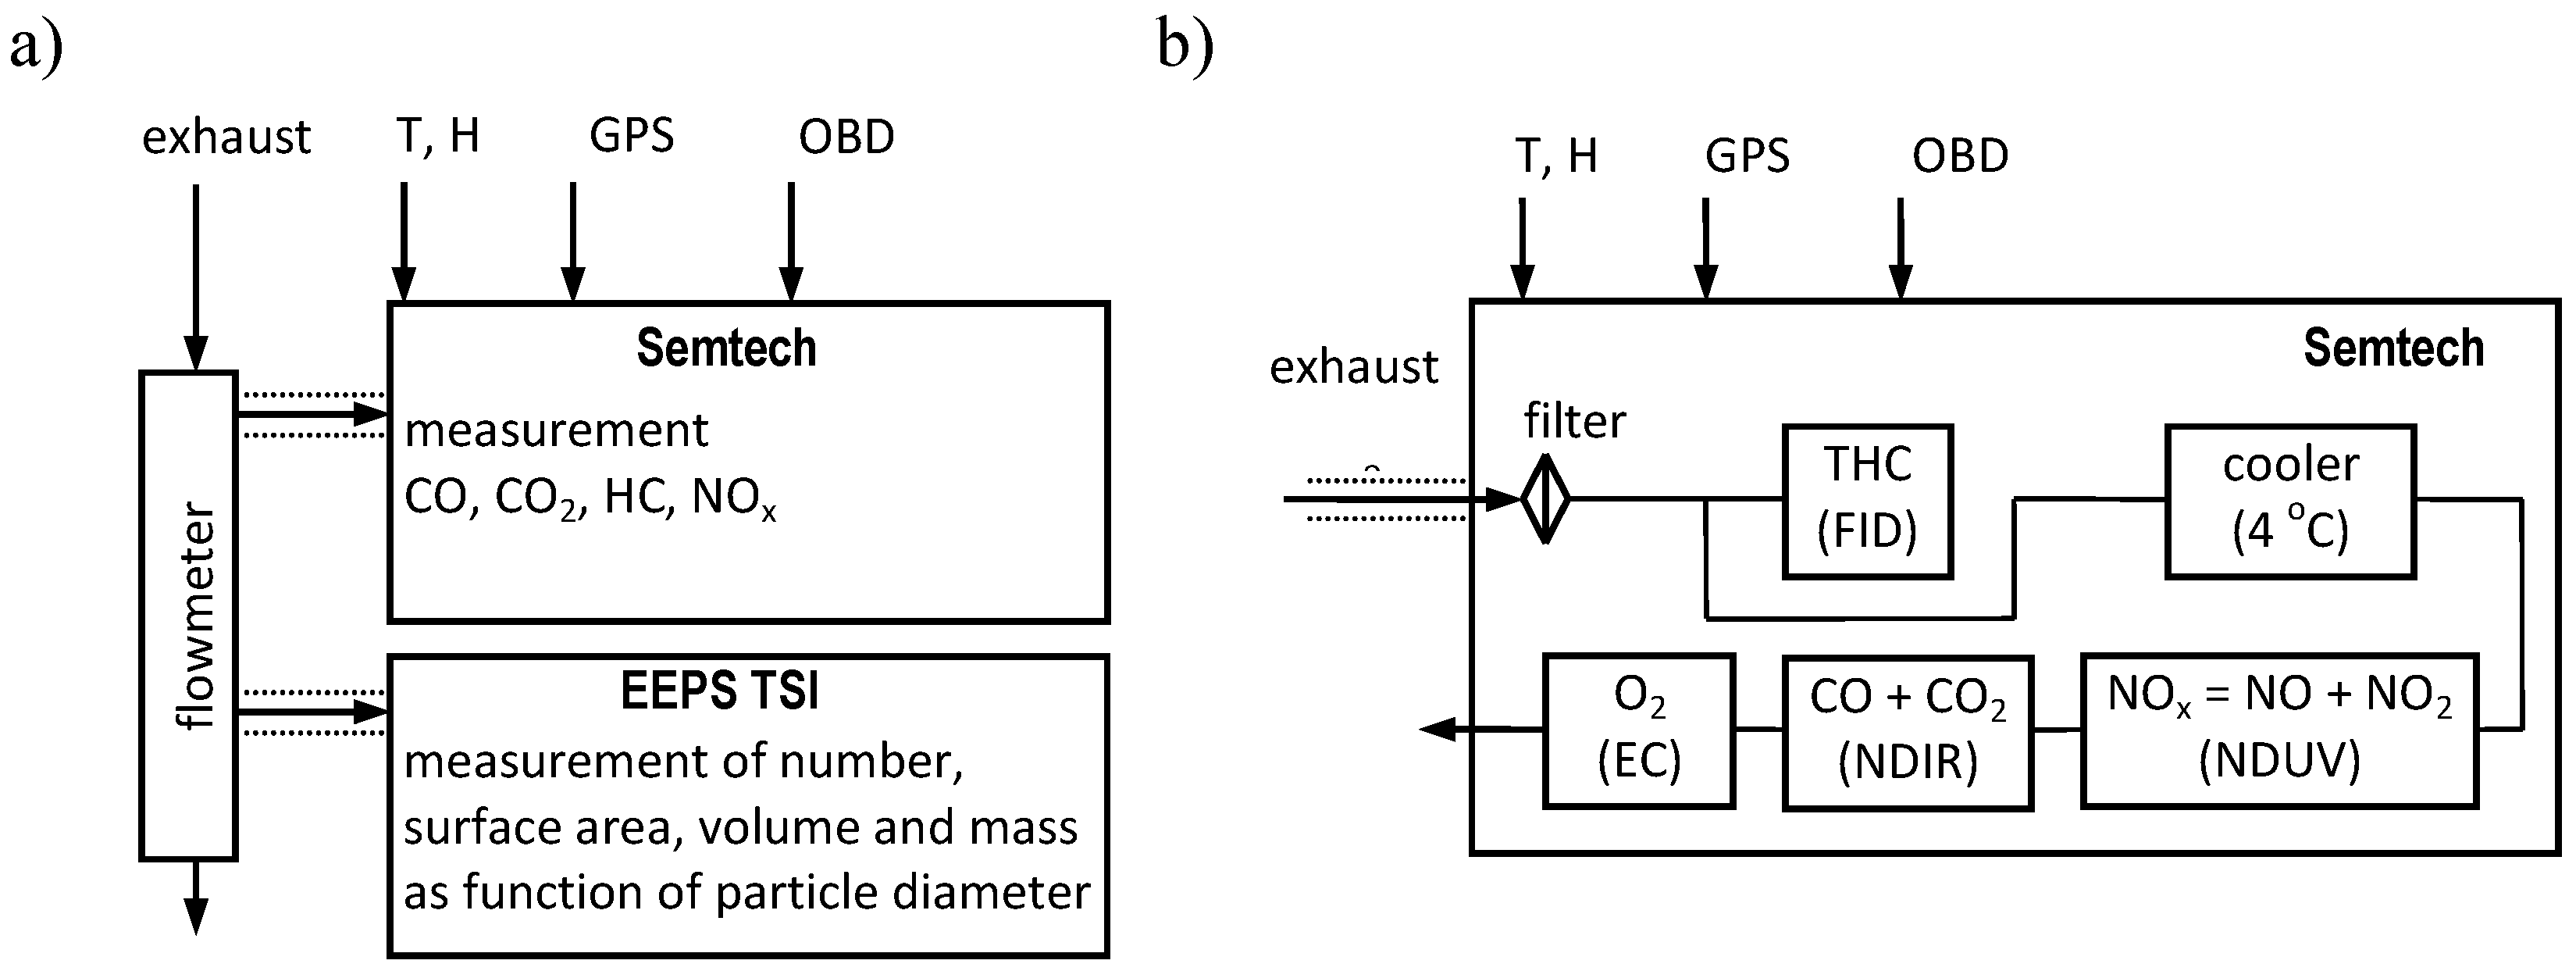
The information contained in publications on the use of mobile exhaust gas analyzers in conjunction with the data recorded from engine diagnostic systems confirm the desirability of assessing exhaust emissions in simulated road tests on engine dynamometers. The Semtech DS analyzer by the Sensors company was used to measure the concentration of harmful compounds in the exhaust gas, the characteristics of which are given in Table 3. It enabled the measurement of the concentrations of harmful compounds—such as carbon monoxide, hydrocarbons, nitrogen oxides and carbon dioxide.
Table 3.
Semtech DS measuring device characteristics.
The TSI 3090 Engine Exhaust Particle Sizer™ Spectrometer (EPSS™) analyzer was used to measure the particle number. It enabled the measurement of a discrete range of particle diameters (in the range from 5.6 nm to 560 nm) emitted in the exhaust gases after determining their diameters based on their different velocities (Table 4). Thanks to the possibility of recording the measurement with a frequency of 10 Hz, the analyzer can be used when testing particulate emissions at transient engine operating states.
Table 4.
Technical data of the TSI 3090 EPSS™ analyzer.
Figure 7 outlines the configuration of the measurement setup.
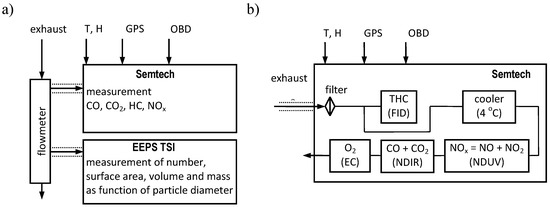
Figure 7.
The measurement system schematic used for the tests (a) and the mobile exhaust gas analyzer with the marked exhaust gas flow (b) for testing the emission of gaseous compounds and particulate matter; T—ambient temperature, H—air humidity.
3.5. NEDC Test
For the selected test object with the Euro 4 emission class, the New European Driving Cycle (NEDC) test (Figure 8) was used, consisting of the Urban Driving Cycle (UDC) test and the Extra Urban Driving Cycle (EUDC) test.

Figure 8.
The European homologation NEDC test for passenger vehicles.
3.6. Engine Equipment Changes
The first stage of the research was carried out using standard (hereinafter referred to as STD) glow plugs (catalogue number 250203002). In the second stage, the glow plugs were switched for modified ones (hereinafter referred to as MOD), which were developed and prepared as devised by the authors. The new glow plugs were 4 mm longer than the standard ones, which resulted in a 50% increase in the active surface of the internal catalytic converter. The heating part was made of acid-resistant INOX stainless steel with a thickness of 0.05 mm, which enabled the elimination of the ceramic layer. The lack of a ceramic layer made it possible to reduce the thermal insulation and, consequently, to heat up the glow plugs faster and increase the working temperature of the catalytic layer. Figure 9 shows a part of the glow plug in the combustion chamber of standard length and a prototype one with the length of the heating part being longer by 4 mm.
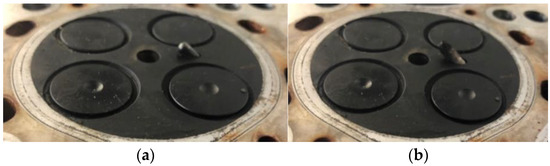
Figure 9.
View of the top of the cylinder with the glow plug in the combustion chamber: standard (a) and catalytically coated prototype (b).
4. Results and Discussion
4.1. The Exhaust Concentration before and after DOC for Hot Engine Idling
During the exhaust emission tests for hot engine start conditions, the rotational speed and relative load, as well as the exhaust gas parameters (flow rate and exhaust temperature), were recorded ahead and behind the DOC. Similar values of the measured exhaust gases parameters allowed us to compare their concentration values and the determined exhaust emissions of harmful components when using the standard and catalytically coated glow plugs. A comparison of the above parameters with the same measurement methodology made it possible to determine the efficiency of the catalytic reactor for each of the measured harmful compounds for both the standard and modified glow plugs.
The measurements of the exhaust emission components were carried out for carbon monoxide, hydrocarbons and the particle number during a 10 min test cycle using the standard and catalytically coated glow plugs.
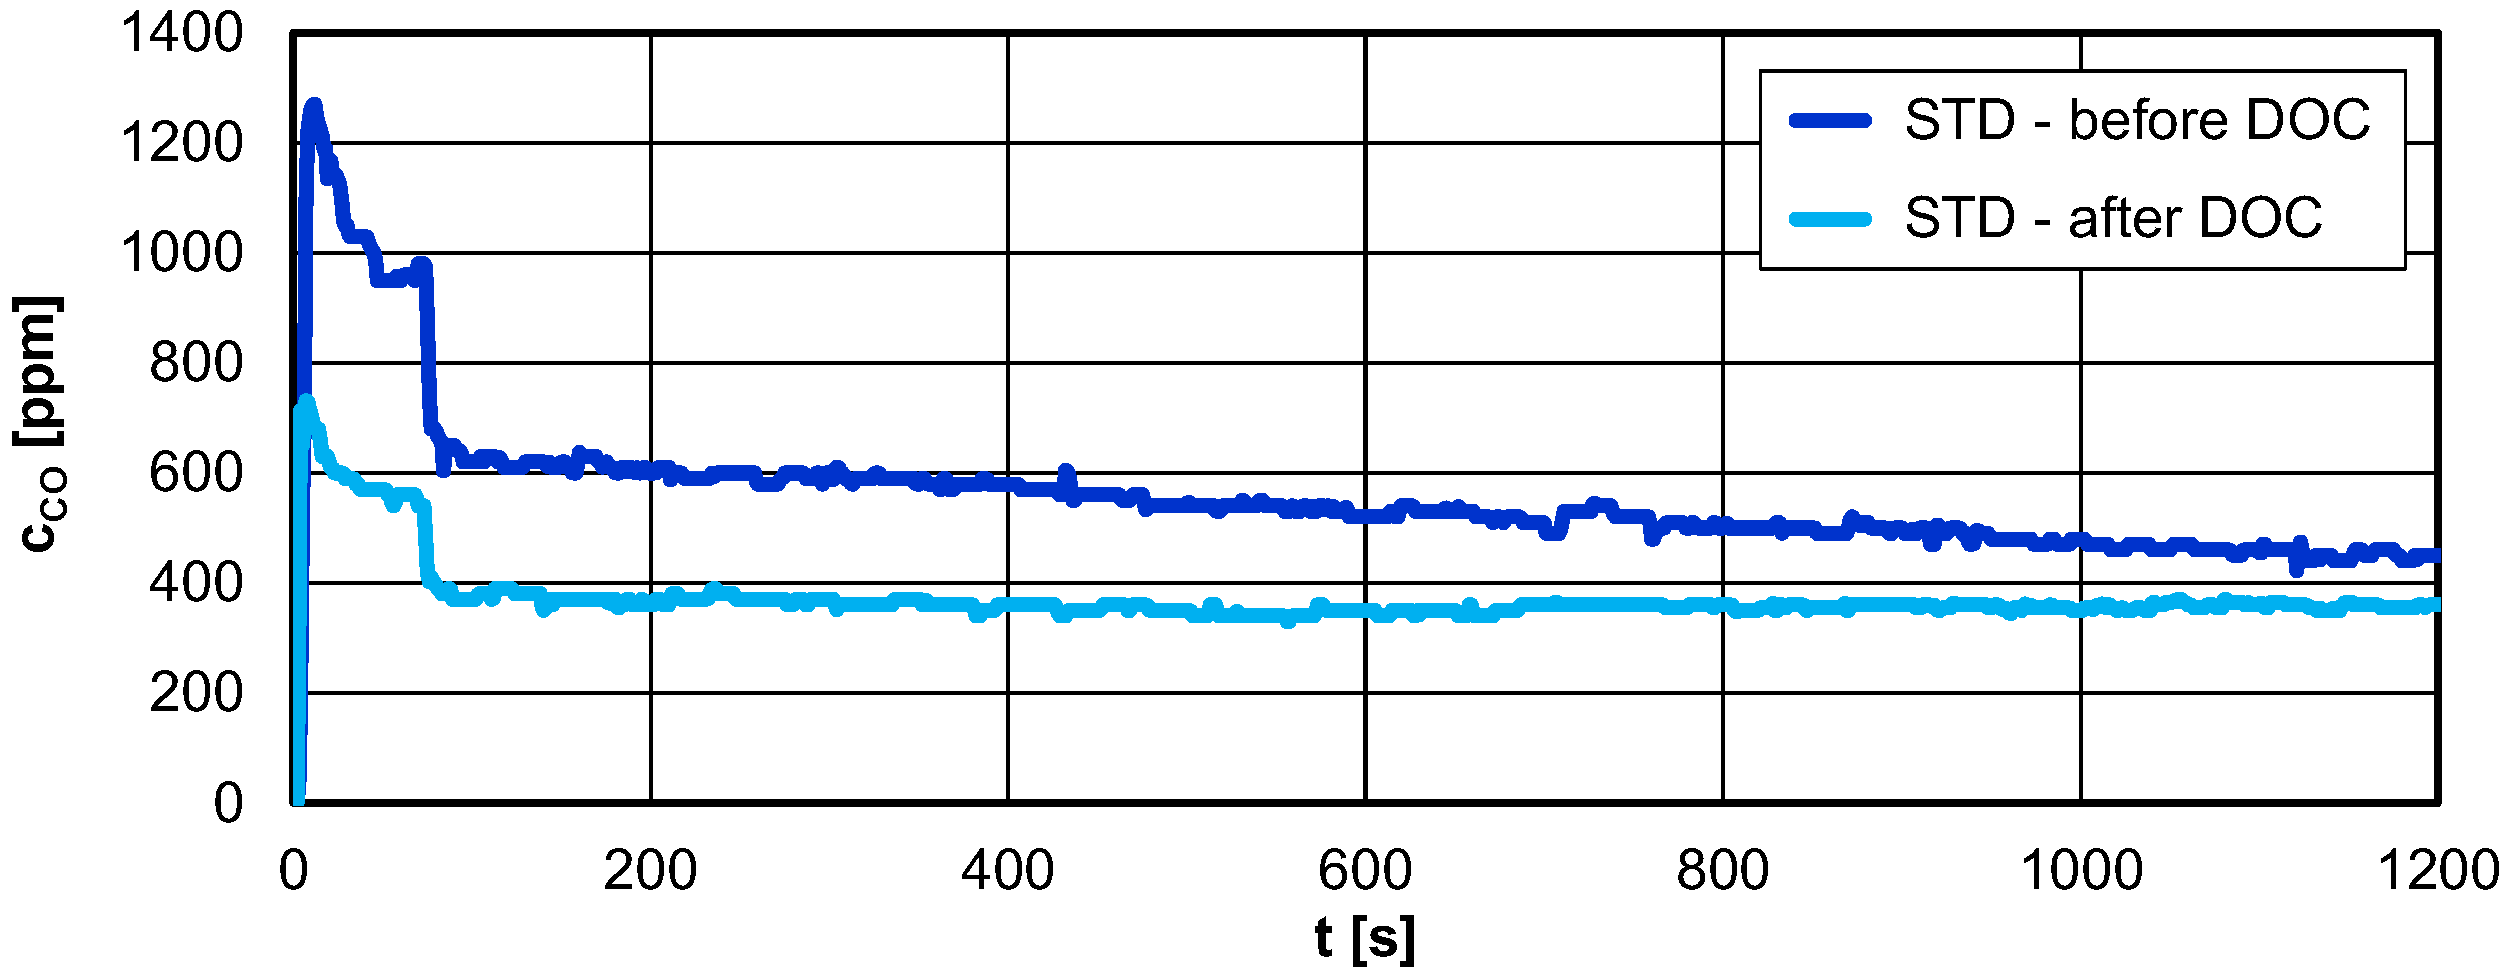
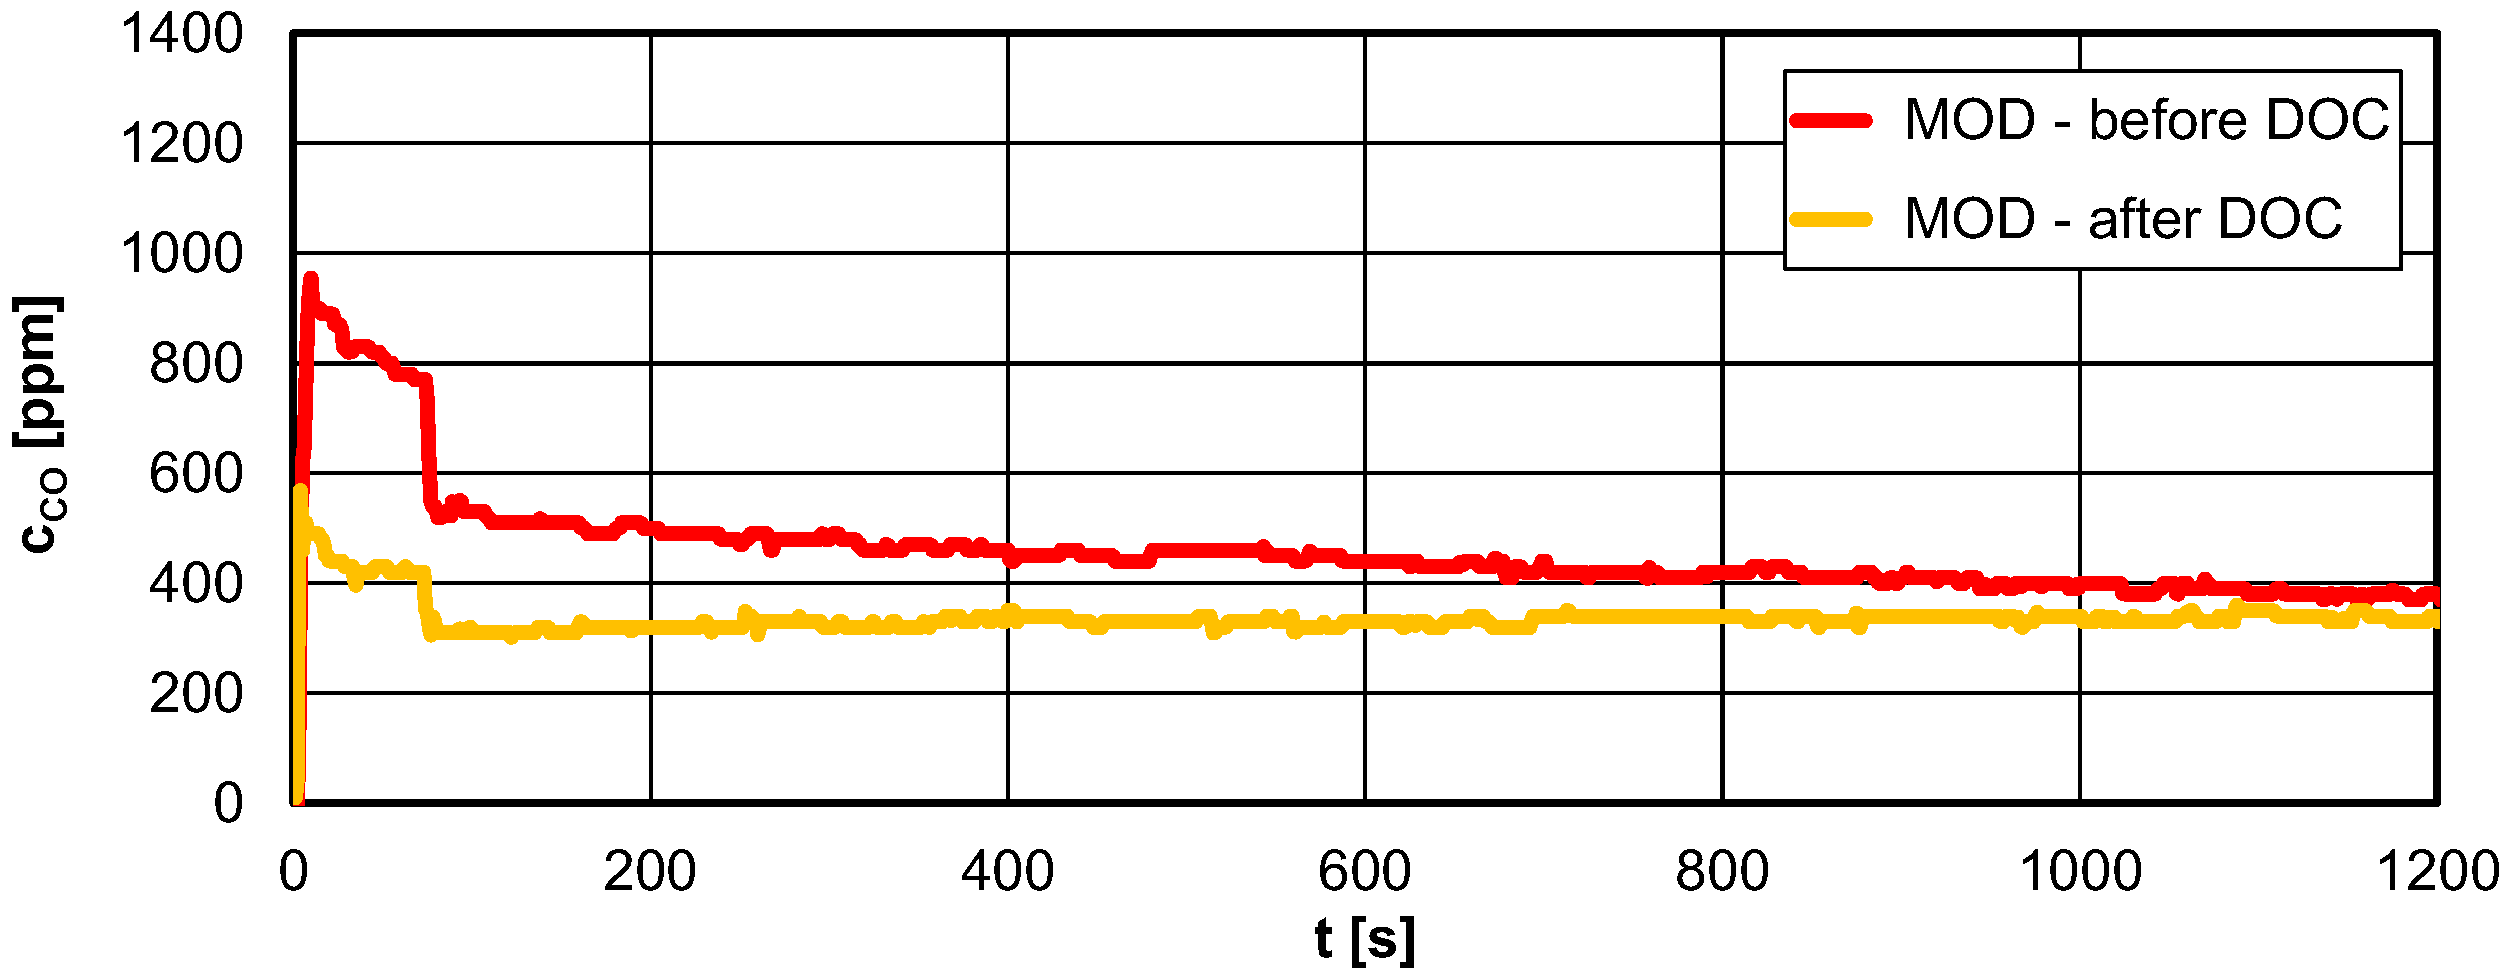
When measuring the concentration of carbon monoxide in front of the catalytic reactor for the standard glow plugs, a rapid increase was observed immediately after the cold engine start, and then a slow decrease from 3000 ppm (several seconds after starting) to 400–500 ppm at the end of the measurement period (Figure 10). The differences in the concentration values were small for the modified glow plugs (Figure 11); however, the conversion of the concentration value into the emission intensity and the determined carbon monoxide emission were reduced (using catalytically coated glow plugs) during the engine start-up and warm-up phases.

Figure 10.
Comparison of the carbon monoxide concentration during start-up and idling of a hot engine (diesel engine, measured upstream and downstream of the DOC, 1200 s) using standard glow plugs (STD).
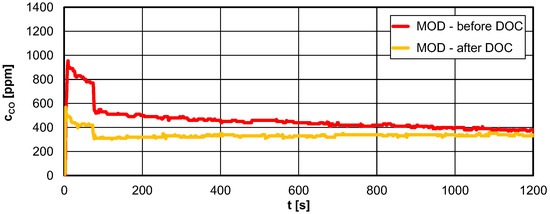
Figure 11.
Comparison of the carbon monoxide concentration during start-up and idling of a hot engine (diesel engine, measured upstream and downstream of the DOC, 1200 s) using the modified glow plugs (MOD).
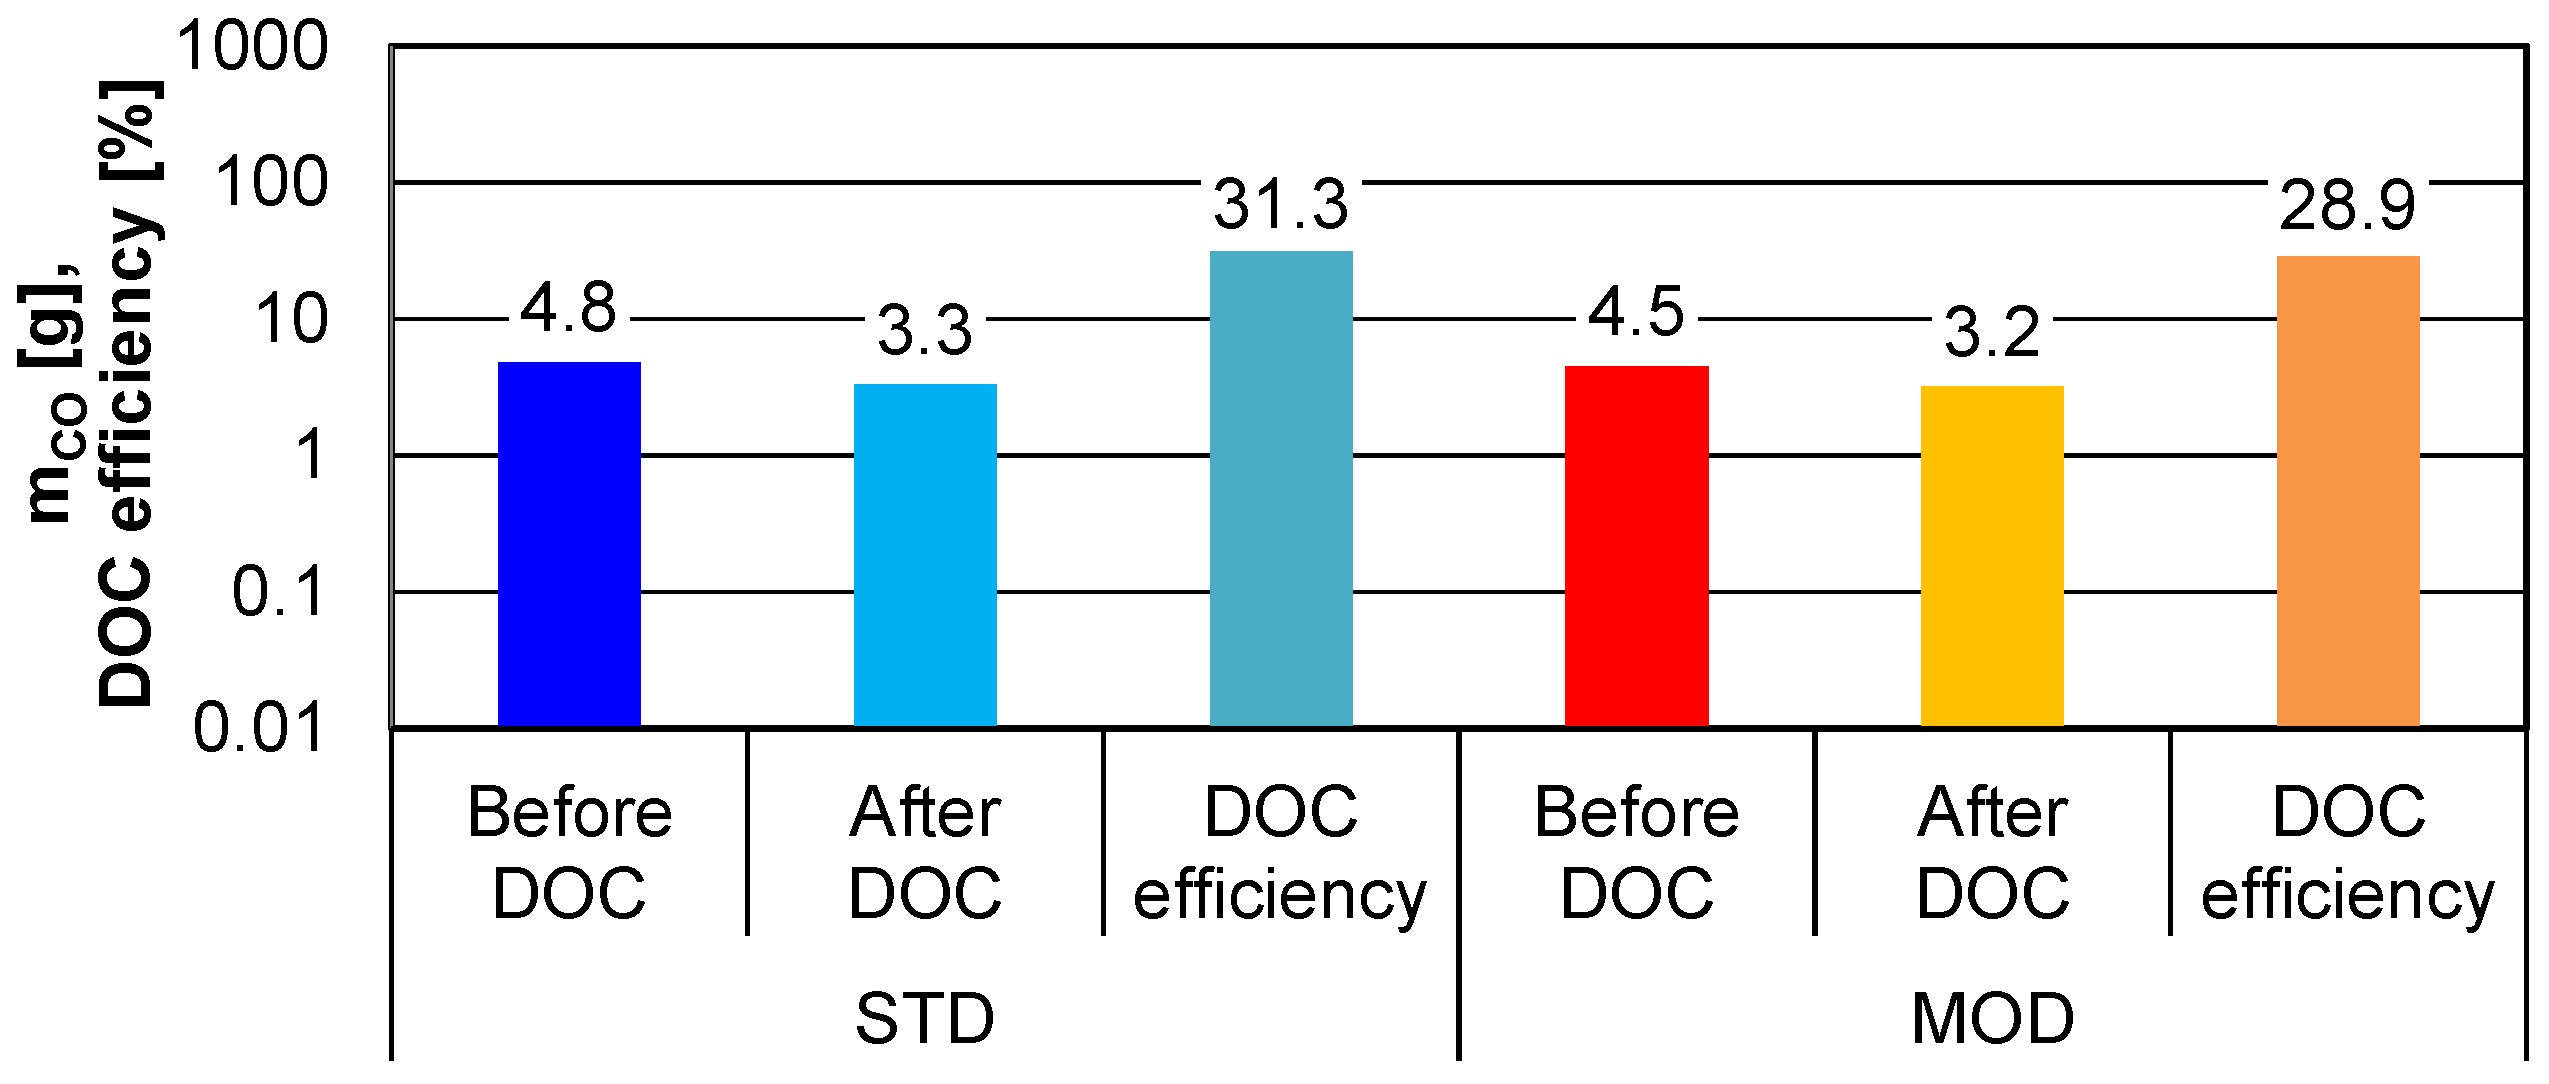
The final values for the carbon monoxide and hydrocarbon emissions were presented as their mass, and the conversion of the concentration value at a practically constant rotational speed illustrated the operating characteristics of the catalytic reactor for an idling engine (Figure 12). The carbon monoxide mass values determined for the entire test duration (1200 s) for the standard and modified plugs were as follows: for the STD plugs, respectively, ahead of the DOC: mCO = 4.8 g, behind the DOC: mCO = 3.3 g, and the DOC efficiency: ηDOC,CO = 31.3%; for the modified glow plugs ahead of the DOC: mCO = 4.5 g, behind the DOC: mCO = 3.2 g, and the DOC efficiency: ηDOC,CO = 28.9%.

Figure 12.
Comparison of the carbon monoxide mass and catalytic reactor efficiency during hot start and idling (diesel engine, measured upstream and downstream of the DOC, 1200 s) using the standard (STD) and modified (MOD) glow plugs.
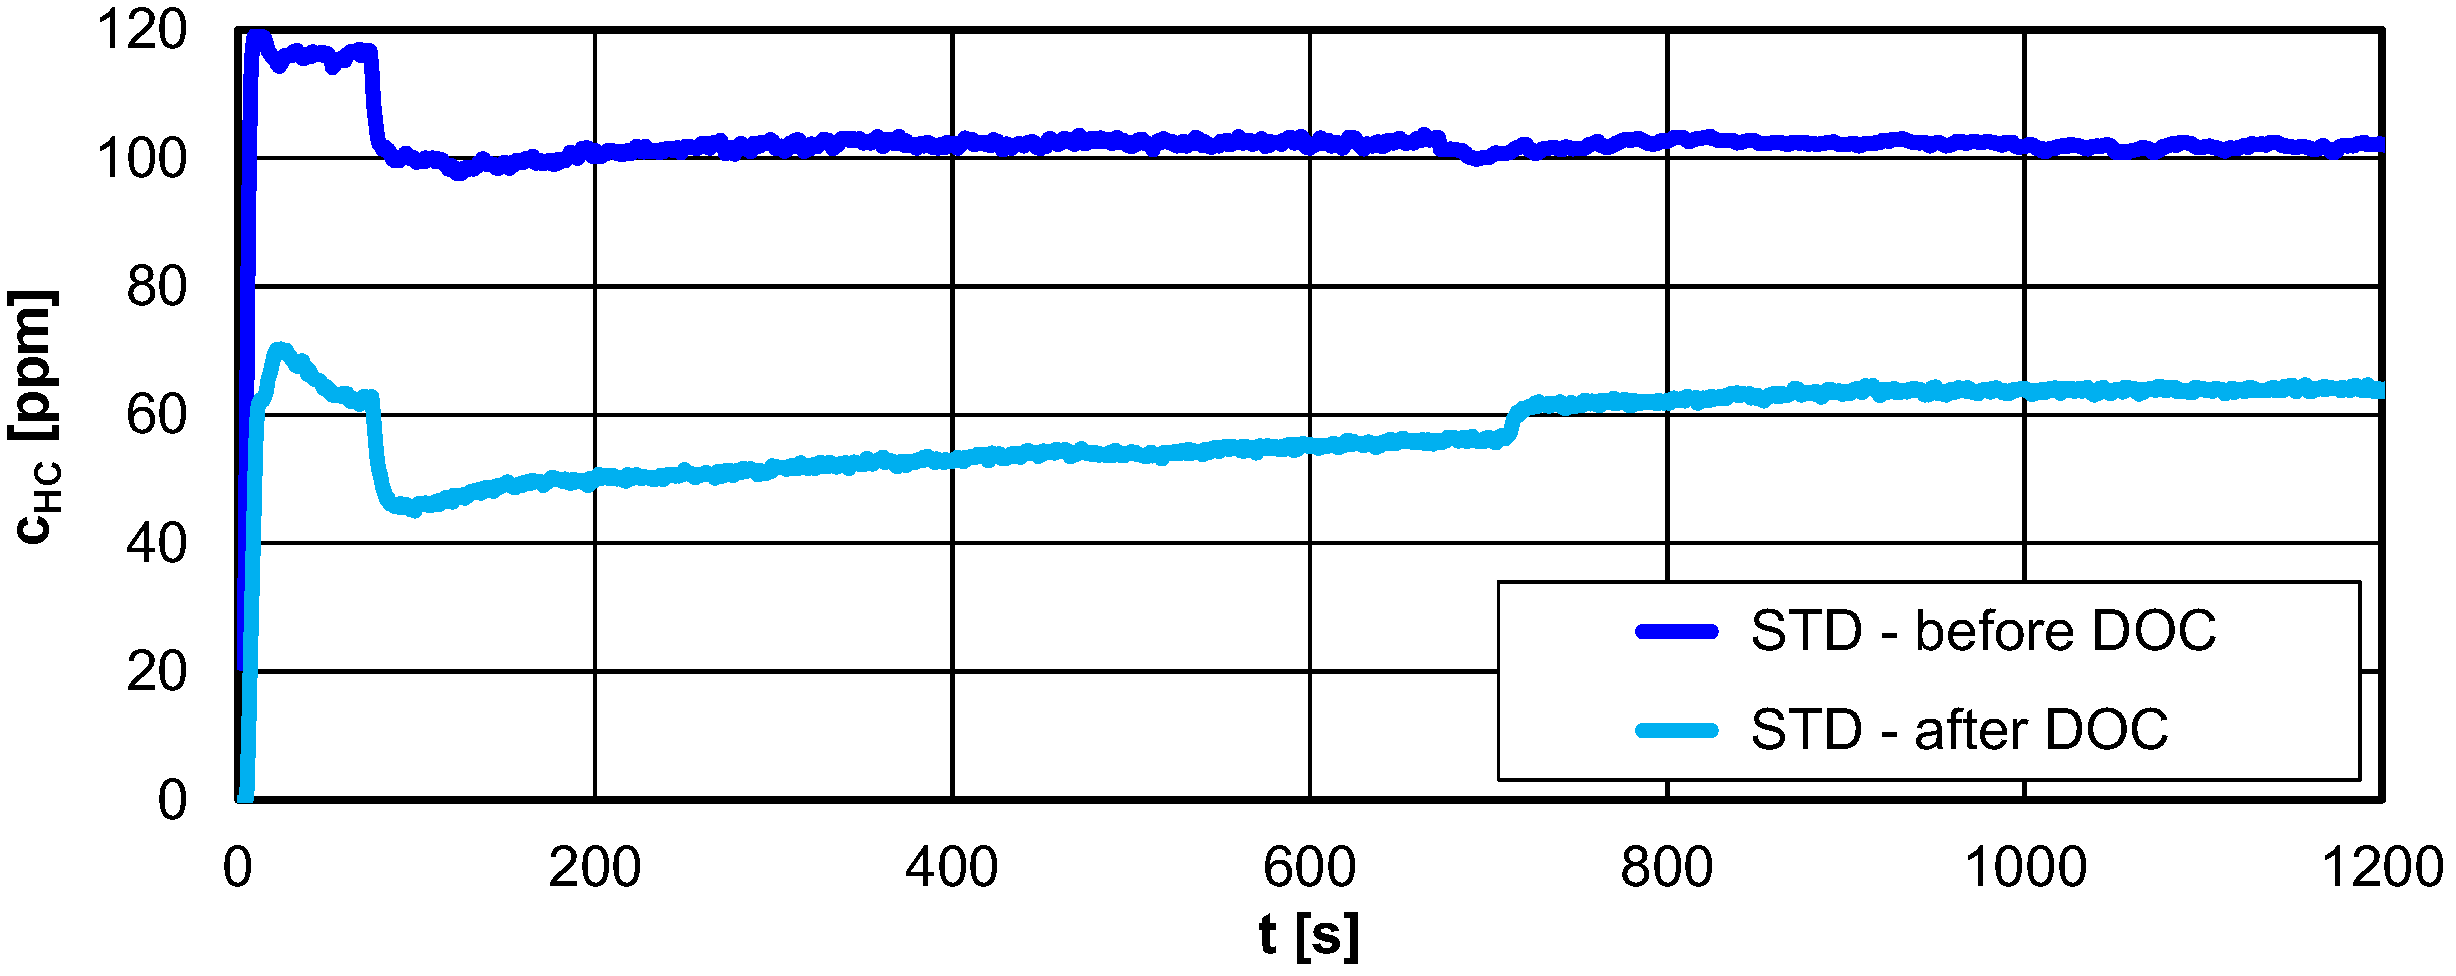
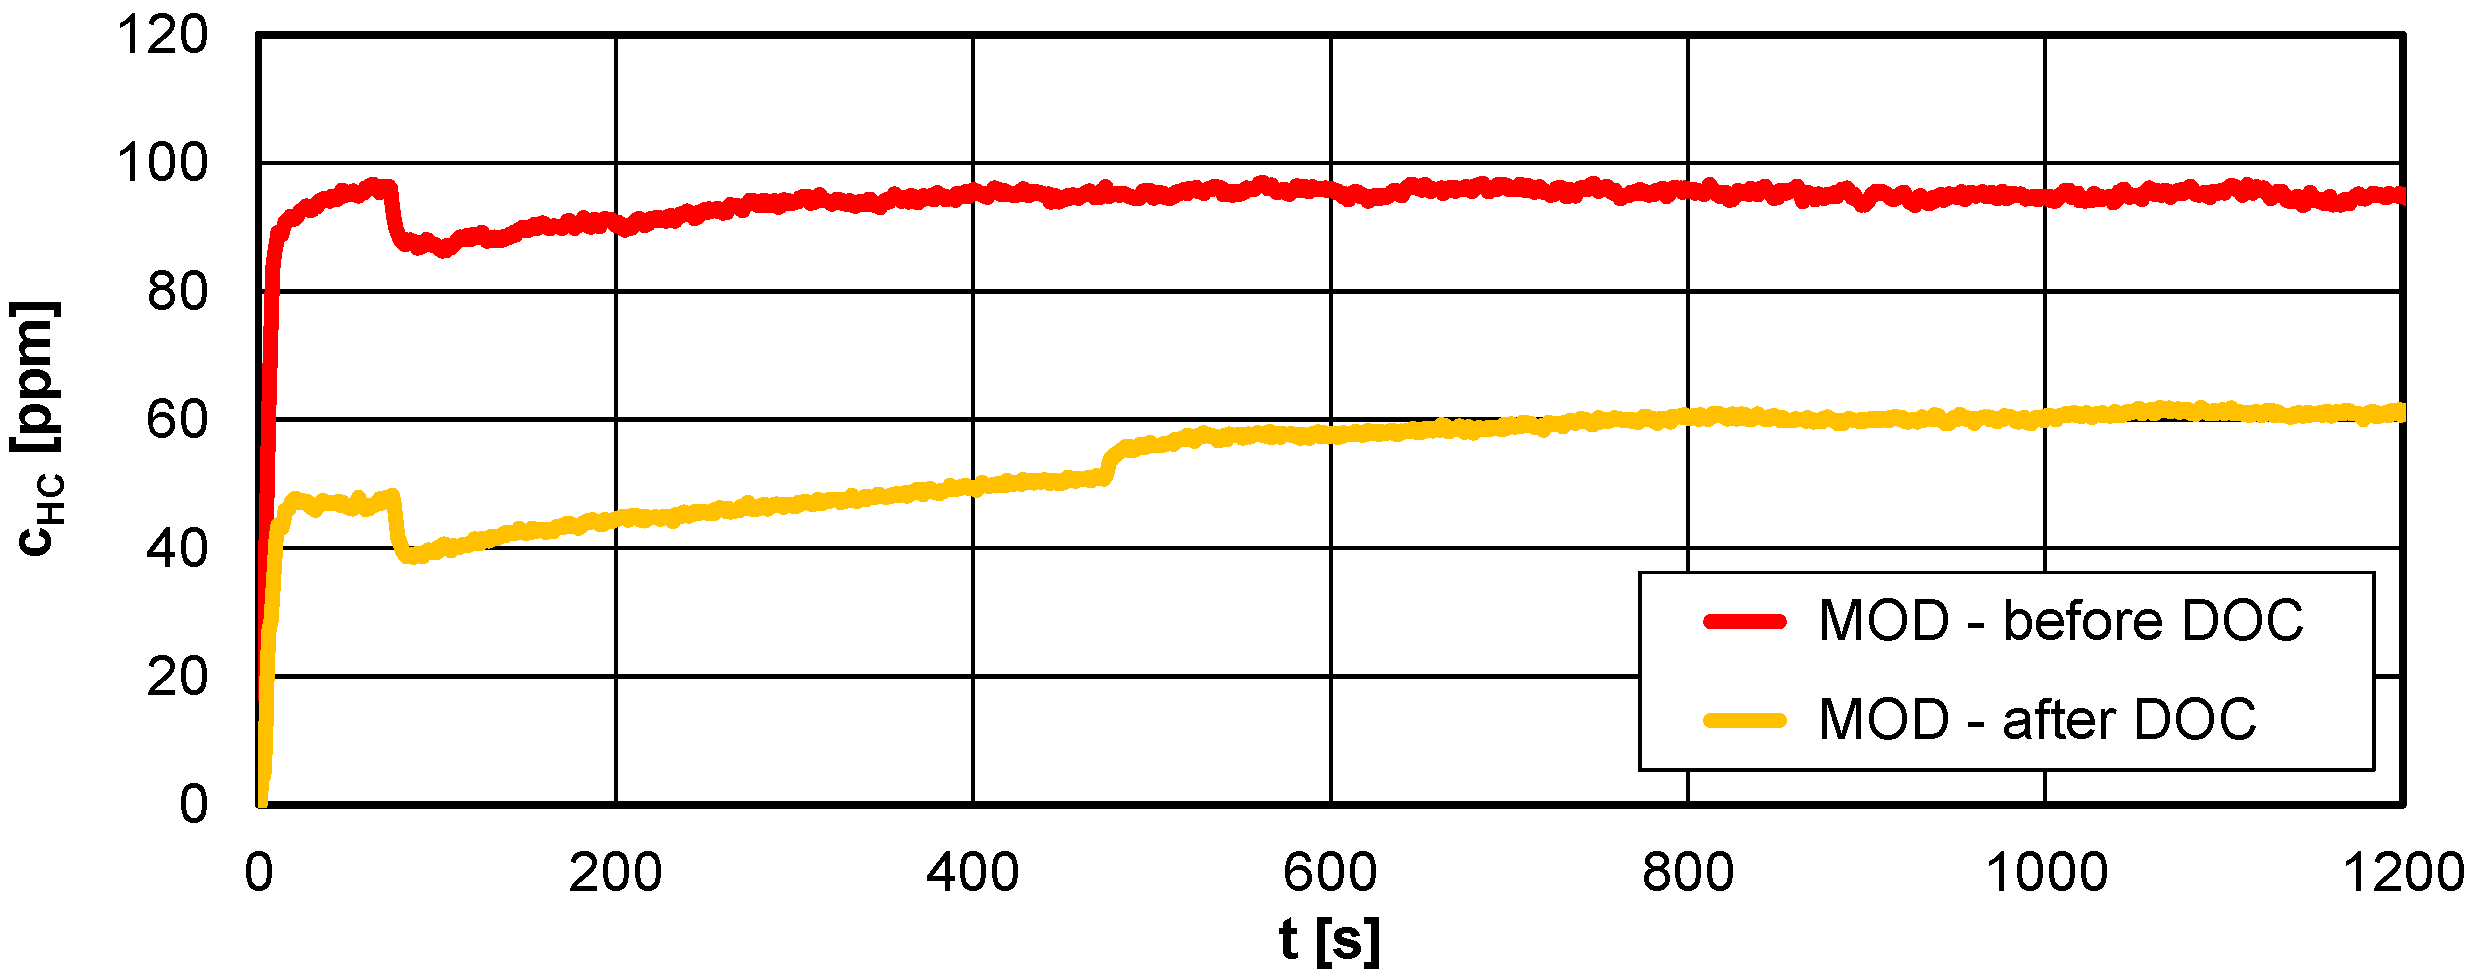
The concentration of hydrocarbons measured ahead of the DOC for the standard glow plugs increased rapidly immediately after a hot engine start (to a value of about 120 ppm), and it was then observed to slowly decrease to a value of about 100 ppm in the final phase of the measurement. For the same test set, but measuring the concentration behind the DOC, lower concentration values were observed in the first phase of idling, amounting to 70 ppm, and then the concentration decreased to 50 ppm. After cooling the catalytic reactor, an increase in the concentration to over 60 ppm was observed after 1200 s (Figure 13).
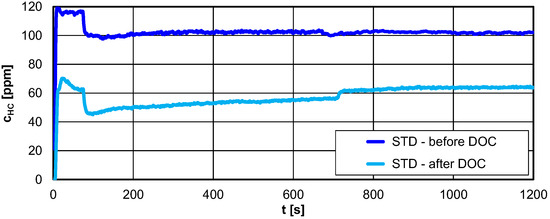
Figure 13.
Comparison of the hydrocarbon concentration during start-up and idling of a hot engine (diesel engine, measured upstream and downstream of the DOC, 1200 s) using standard glow plugs (STD).
The repeated test upstream and downstream of the catalytic reactor for the modified glow plugs provided similar results, although the values were lower by about 10–20%. This was due to the oxidation of part of the hydrocarbons in the combustion chamber thanks to the catalytic material applied to the tip of the glow plug (Figure 14).
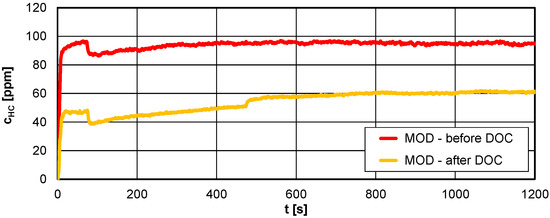
Figure 14.
Comparison of the hydrocarbon concentration during start-up and idling of a hot engine (diesel engine, measured upstream and downstream of the DOC, 1200 s) using the modified glow plugs (MOD).
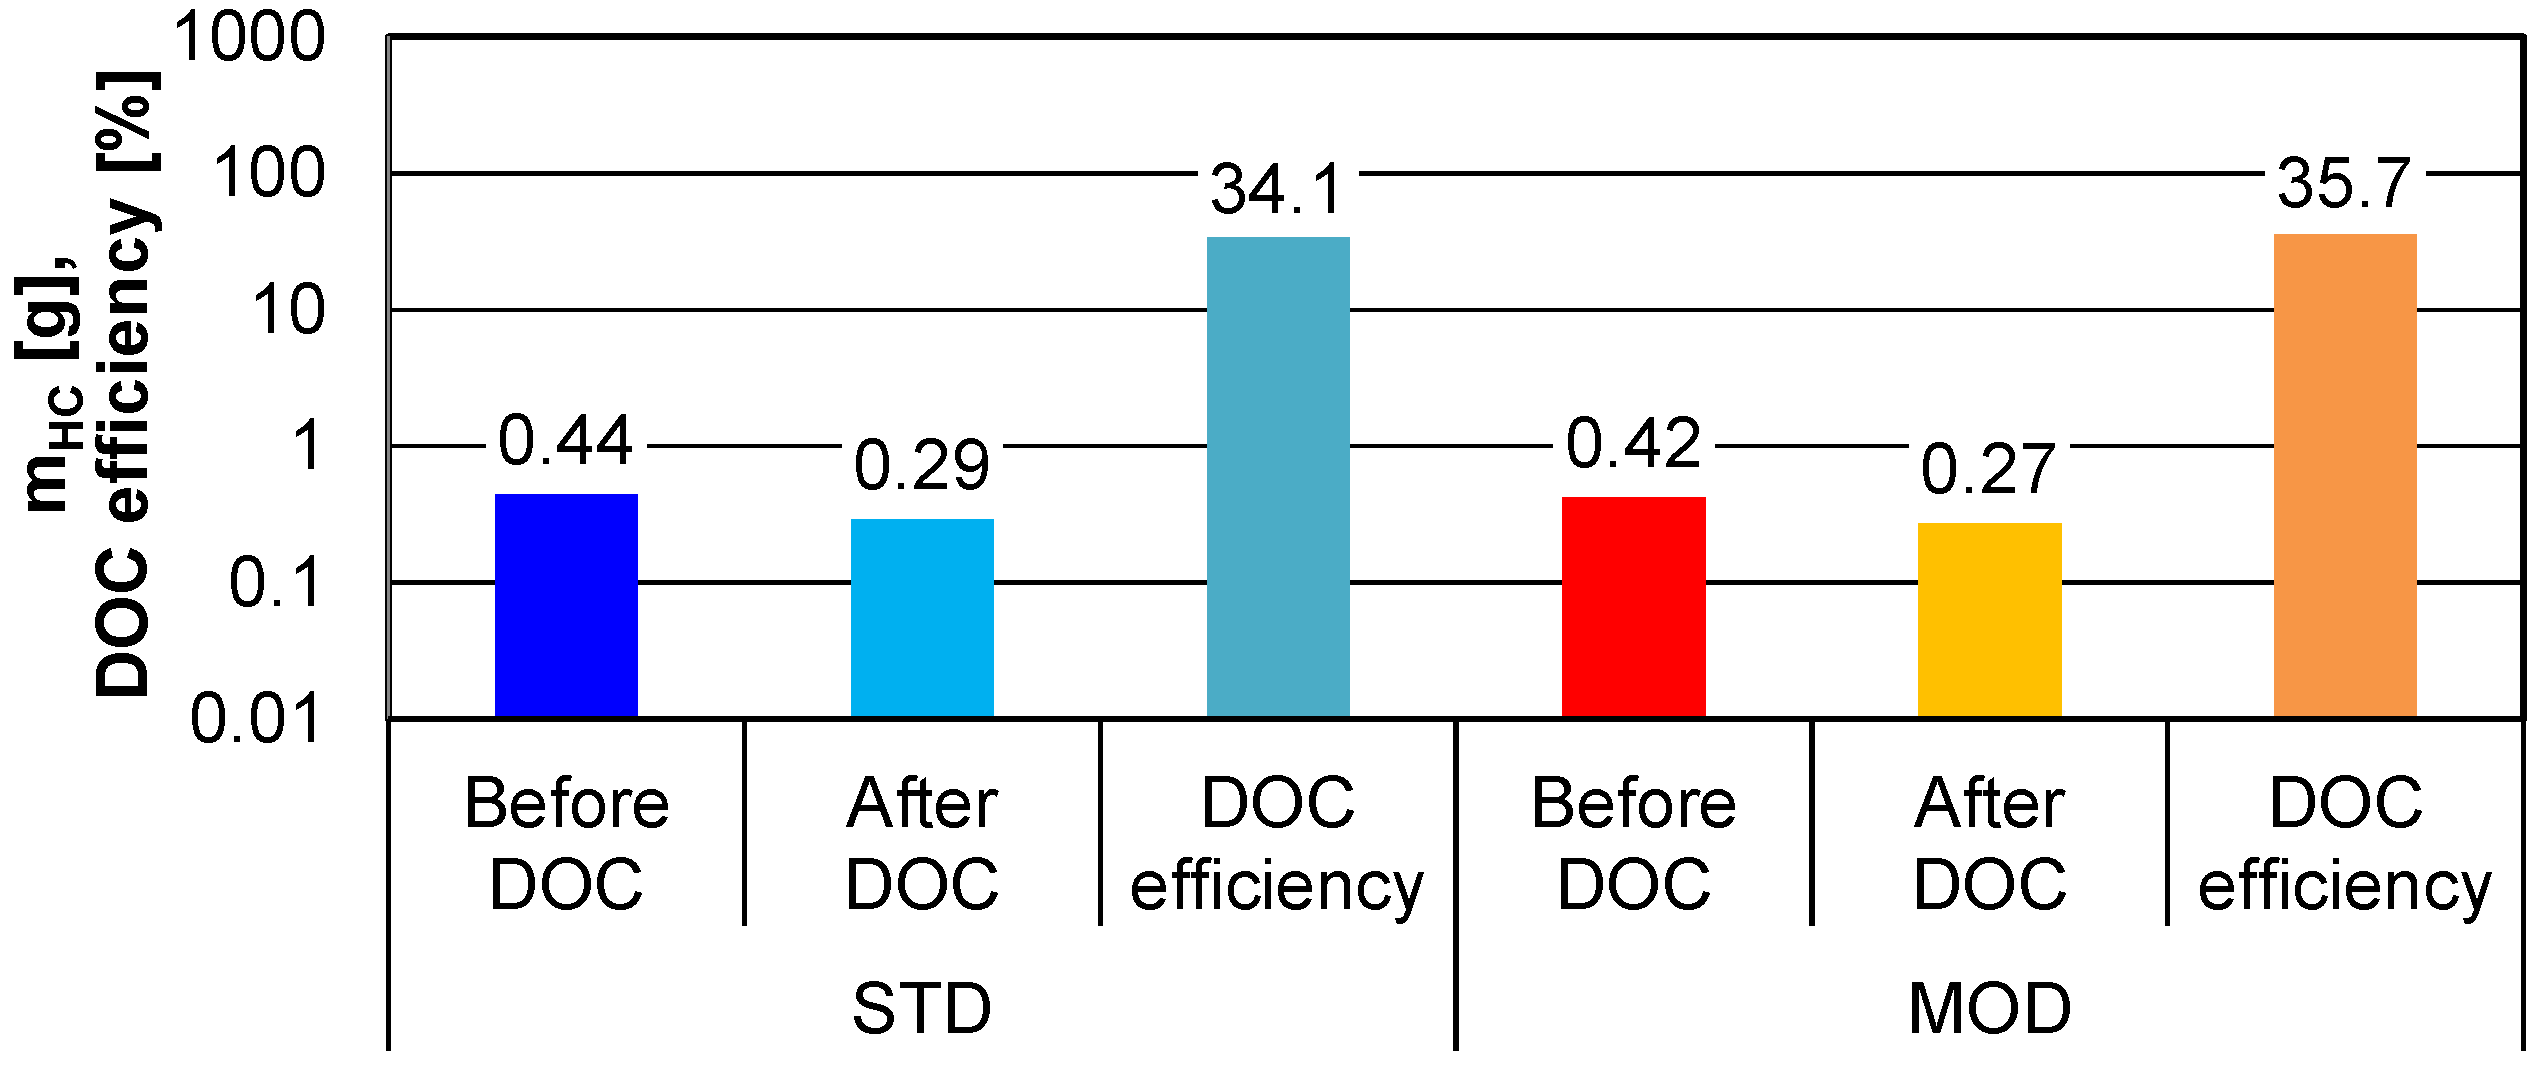
The exact differences in the results of the component mass measured after the test time of 1200 s are shown in Figure 15. The hydrocarbon mass values determined for the entire period of starting and idling with the use of the standard and modified glow plugs were as follows: for the STD spark plugs, respectively, ahead of the DOC: mHC = 0.44 g, behind the DOC: mHC = 0.293 g, and the DOC efficiency: ηDOC,HC = 34.1%; for the modified glow plugs ahead of the DOC: mHC = 0.42 g, behind the DOC: mHC = 0.27 g, and the DOC efficiency: ηDOC,HC = 35.7%.

Figure 15.
Comparison of the hydrocarbon mass and catalytic reactor efficiency during hot start and idling (diesel engine, measured upstream and downstream of the DOC, 1200 s) using the standard (STD) and modified (MOD) glow plugs.
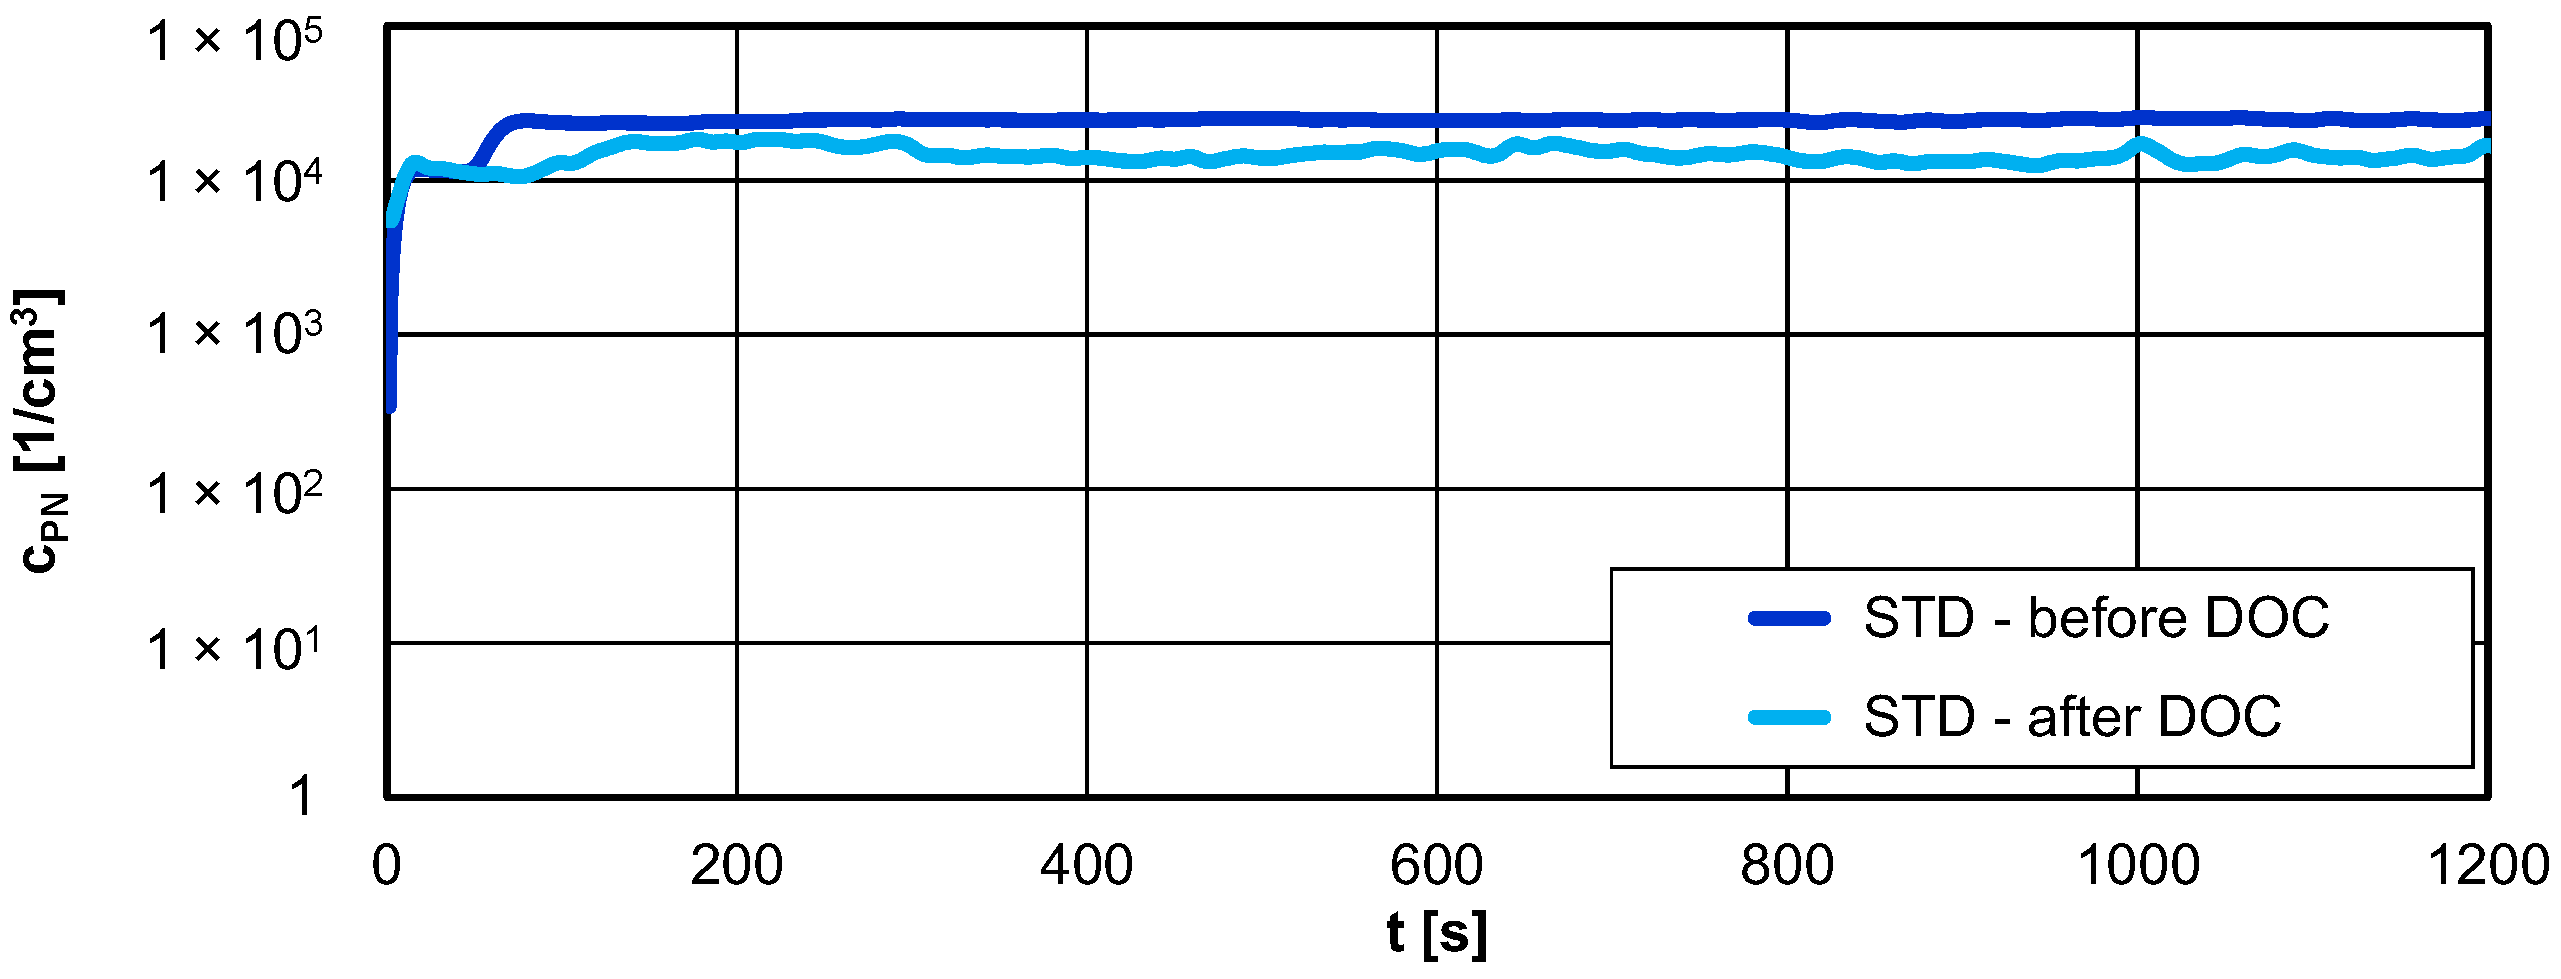
The particulate count and measurements downstream of the DOC for the standard glow plugs were not much different. A lower level of the number of particles behind the DOC was observed, which may be the result of retaining large particles, as the exhaust aftertreatment system did not include a diesel particulate filter (Figure 16).

Figure 16.
Comparison of the particle number concentration during start-up and idling of a hot engine (diesel engine, measured upstream and downstream of the DOC, 1200 s) using the standard glow plugs (STD).
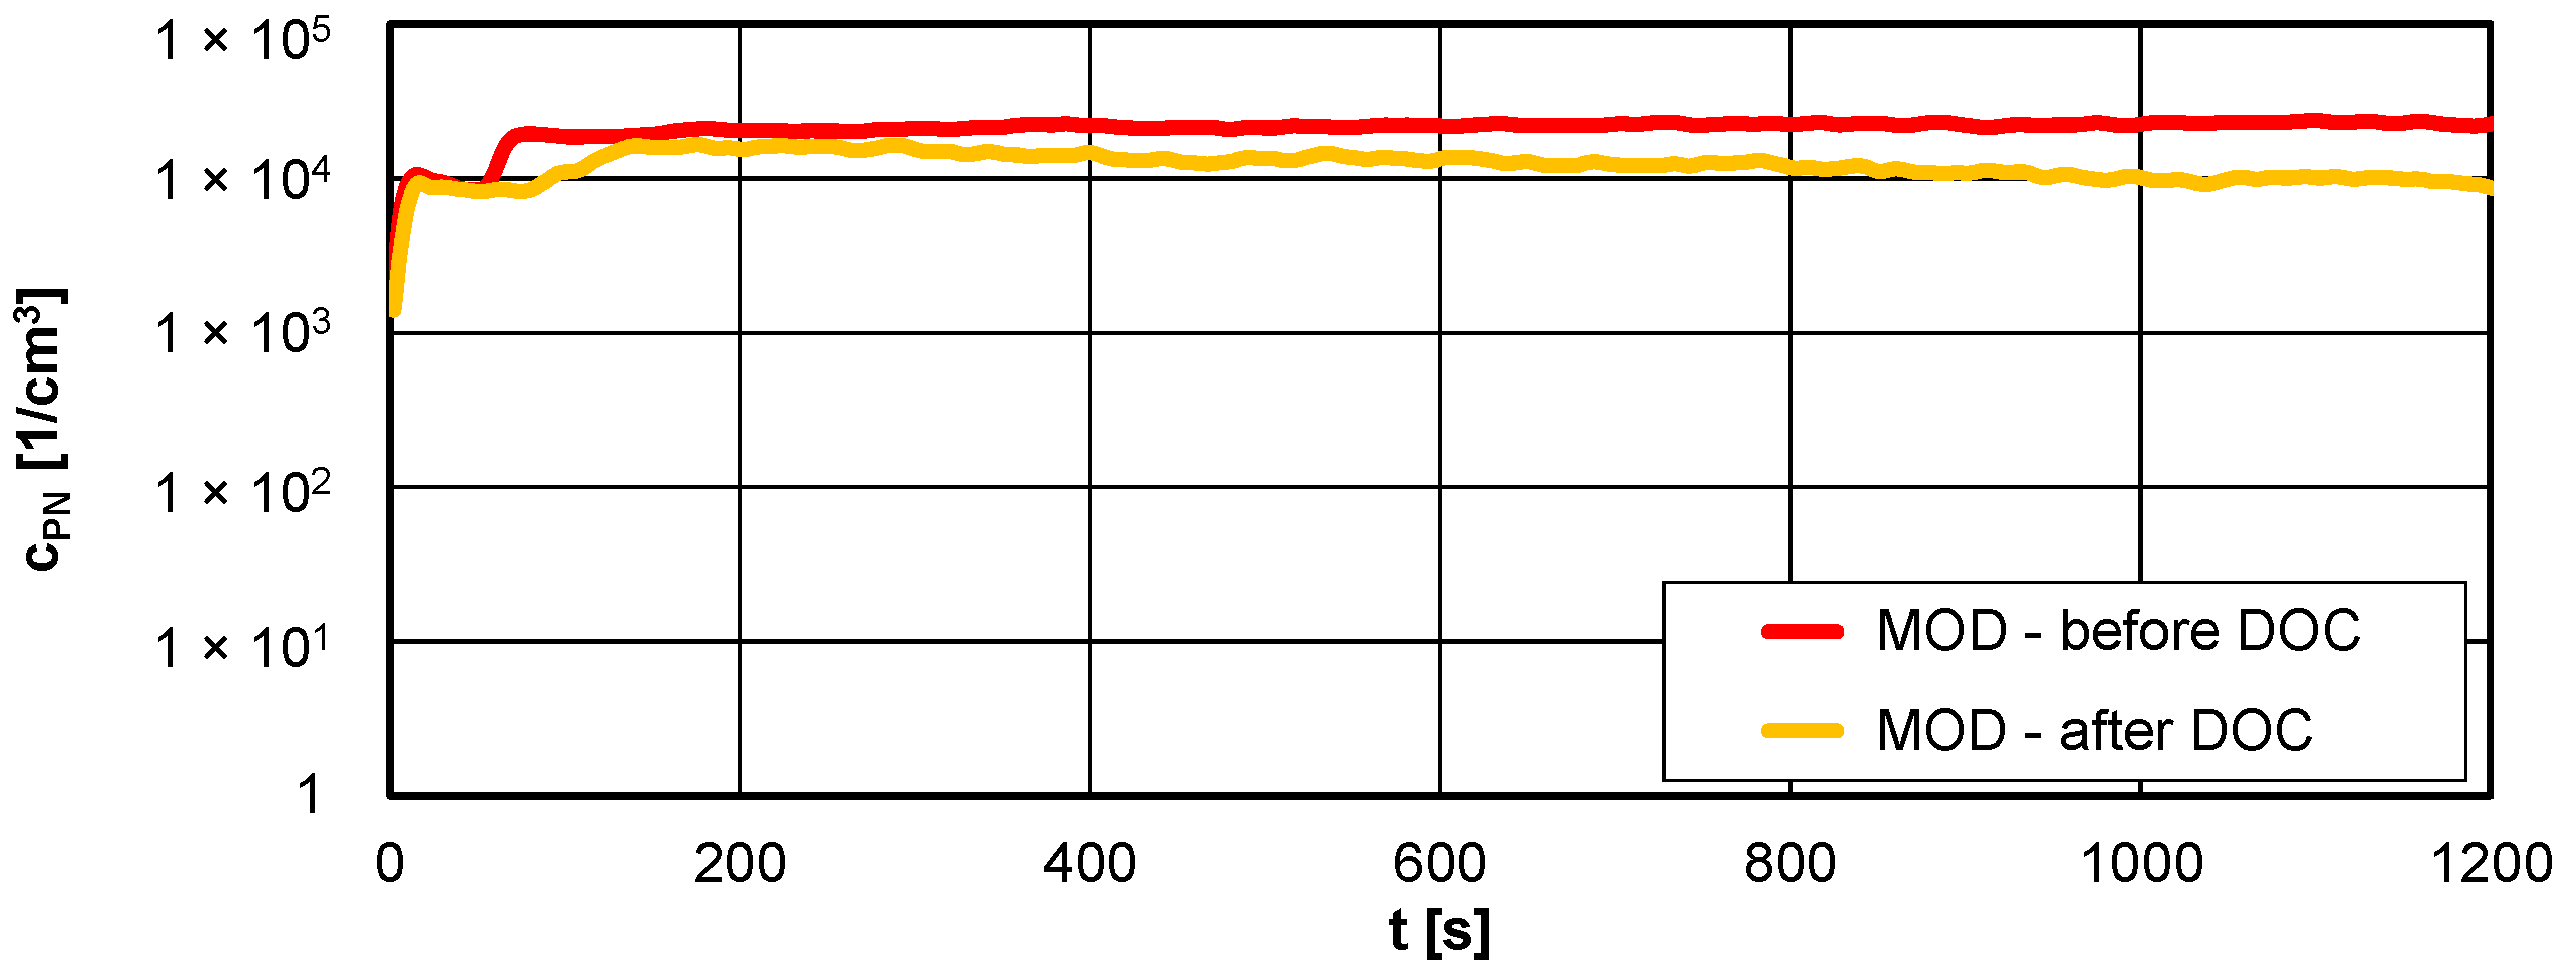
Changing the plugs from standard to catalytically coated for the particle number measurements upstream and downstream of the catalytic reactor revealed similar relationships as obtained for the previous configuration. Lower values of the PN concentration were observed downstream of the catalytic reactor, but at the same time, the PN concentration upstream of the DOC reactor was also lower. This was due to the partial oxidation of the particles already in the combustion chamber thanks to the catalytic material (Figure 17).
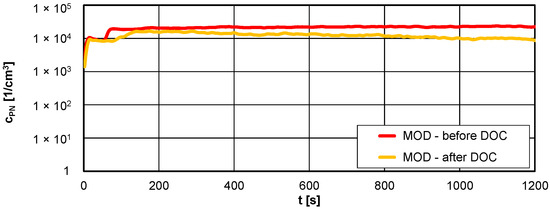
Figure 17.
Comparison of the particle number concentration during start-up and idling of a hot engine (diesel engine, measured upstream and downstream of the DOC, 1200 s) using the modified glow plugs (MOD).
Detailed values of the PN emission changes depending on the type of glow plugs used and the point of exhaust gas sampling are shown in Figure 18. The number of particulate matter determined for the entire period of engine starting and idling with the use of the standard and modified plugs was as follows: for the STD plugs, respectively, before the DOC: kPN = 2.10 × 10¹¹, behind the DOC: kPN = 1.80 × 10¹¹, and the DOC efficiency: ηDOC,PN = 14.3%; for the modified glow plugs ahead of the DOC: kPN = 2.00 × 10¹¹, behind the DOC: kPN = 1.75 × 10¹¹, and the DOC efficiency: ηDOC,PN = 12.5%.
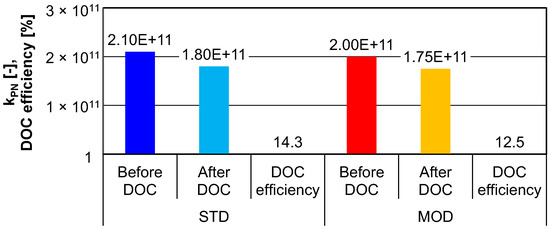
Figure 18.
Comparison of the particle number and catalytic reactor efficiency during hot start and idling (diesel engine, measured upstream and downstream of the DOC, 1200 s) using the standard (STD) and modified (MOD) glow plugs.
4.2. Exhaust Emissions Measurements Upstream and Downstream of the DOC in the NEDC Test
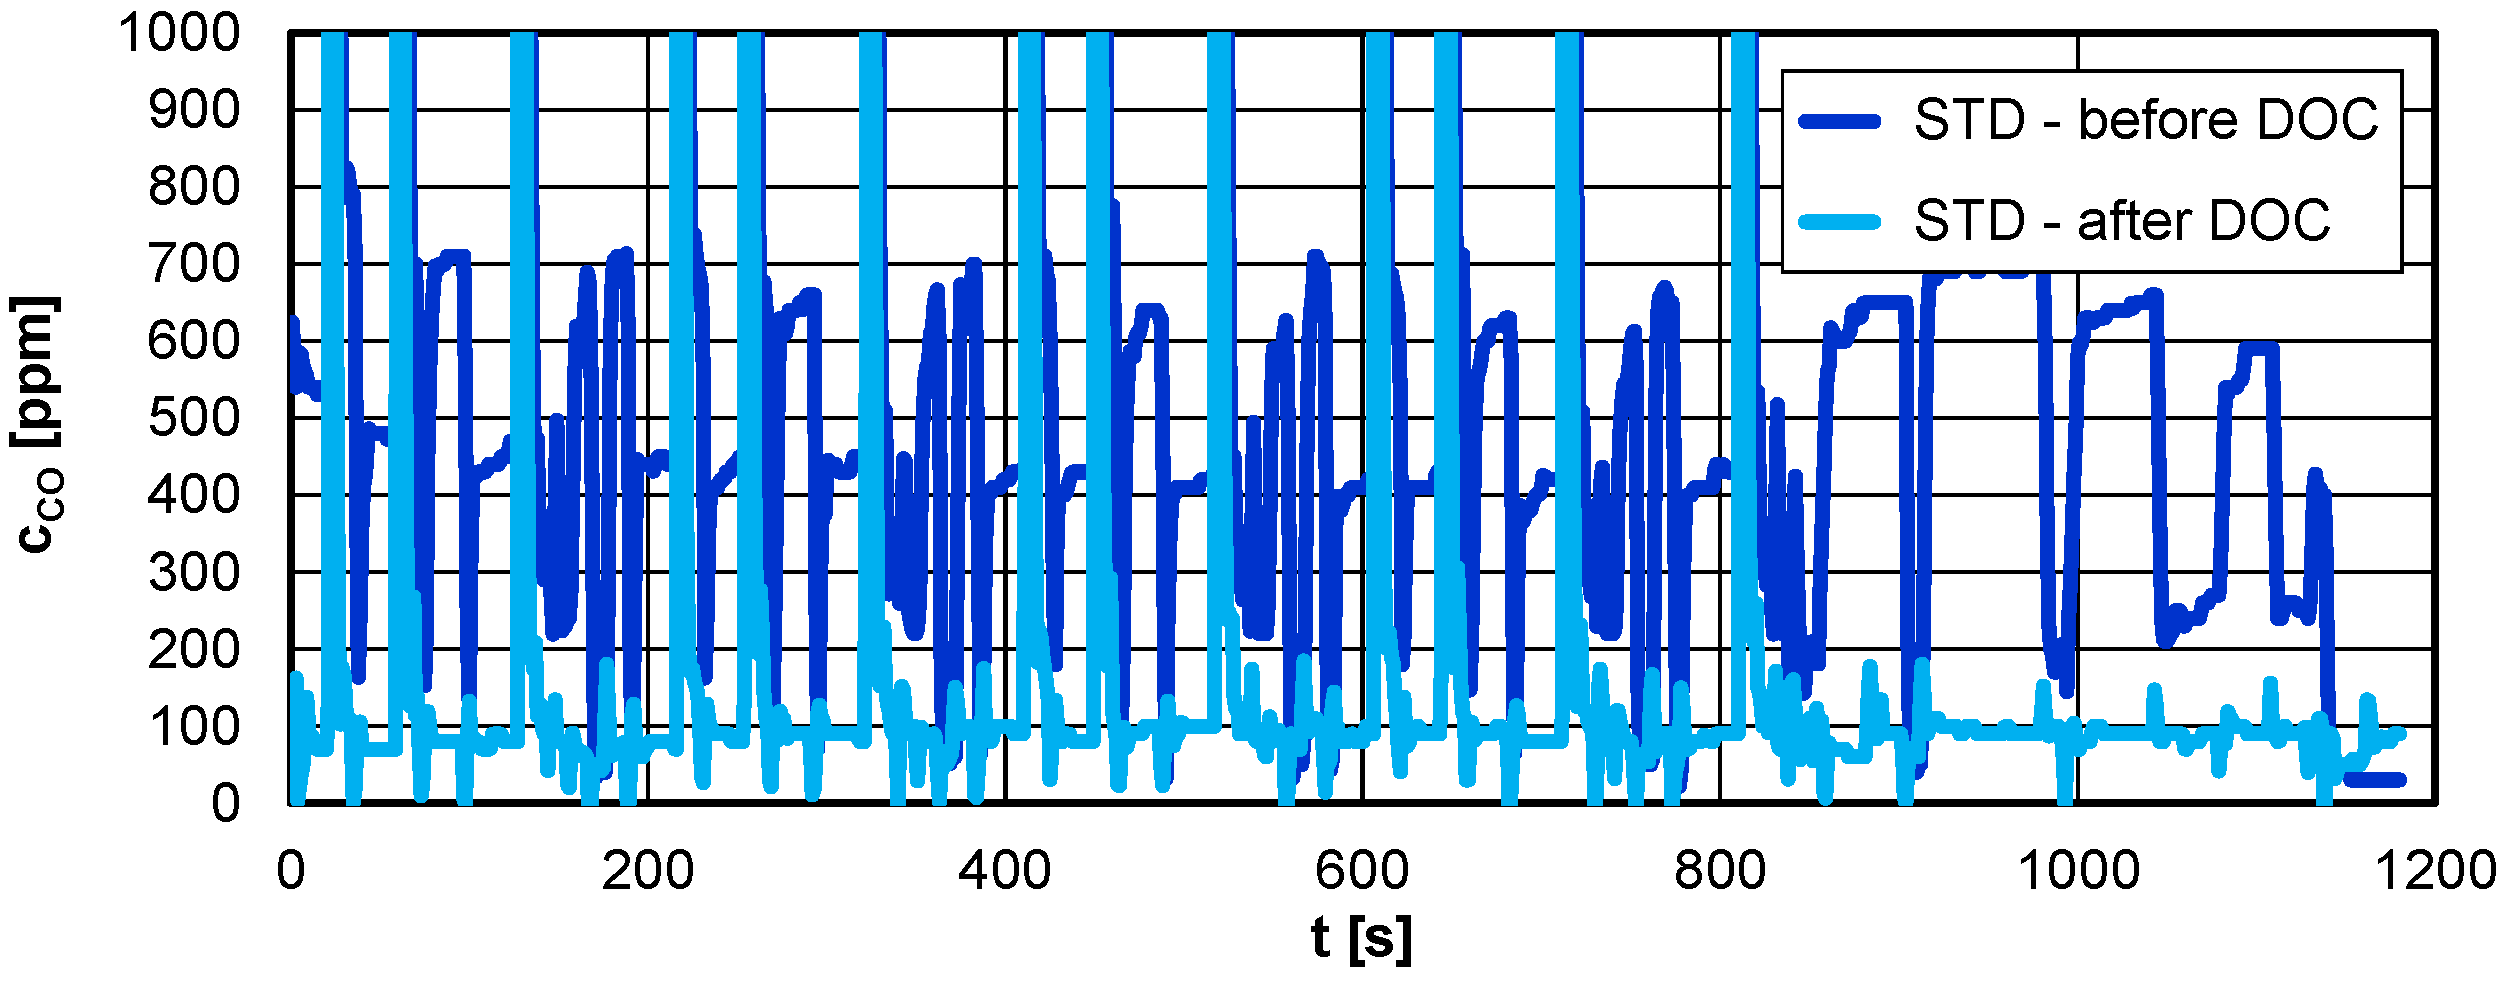
During the emission tests, the engine operating parameters (rotation speed and load) as well as the exhaust gas parameters (mass flow rate and temperature) were recorded. Similar values of these parameters made it possible to compare the obtained concentration values and the determined exhaust emissions when using the standard and modified glow plugs. During the measurement of the carbon monoxide concentration (using the standard glow plugs; measurement ahead of the DOC), a rapid increase was observed immediately after engine start-up (to a value of over 1000 ppm), and then a decrease to 400 ppm several seconds after starting (in Figure 19 marked with the line: STD—before DOC), while values of about 700 ppm were observed for the increased driving speed. In the case of the values downstream of the DOC, these values were several times lower—the most common value was 100 ppm. Values of over 1000 ppm were observed only during a rapid change in the engine load and an increase in the exhaust gas flow (in Figure 19 marked with the line STD—after DOC).
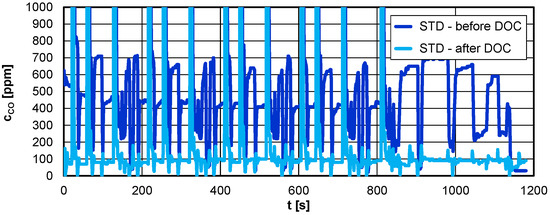
Figure 19.
Comparison of the carbon monoxide concentration in the NEDC test (diesel engine, measured upstream and downstream of the DOC) using the standard glow plugs (STD).
When using the modified plugs (Figure 20), the carbon monoxide concentration ahead of the DOC was also the highest immediately after the engine start (but to a value of about 800 ppm—red line), and it then decreased to 400 ppm (several seconds after starting)—this value occurred most often. On the other hand, the values behind the DOC were much lower: the most frequently observed value was 80–100 ppm, with no changes in the driving speed, while in conditions of increased speed (before thermal stabilization), the concentration of carbon monoxide increased periodically to about 400 ppm.
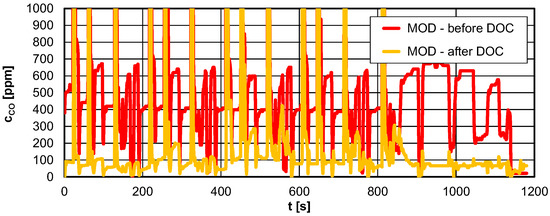
Figure 20.
Comparison of the carbon monoxide concentration in the NEDC test (diesel engine, measured upstream and downstream of the DOC) using the modified glow plugs (MOD).
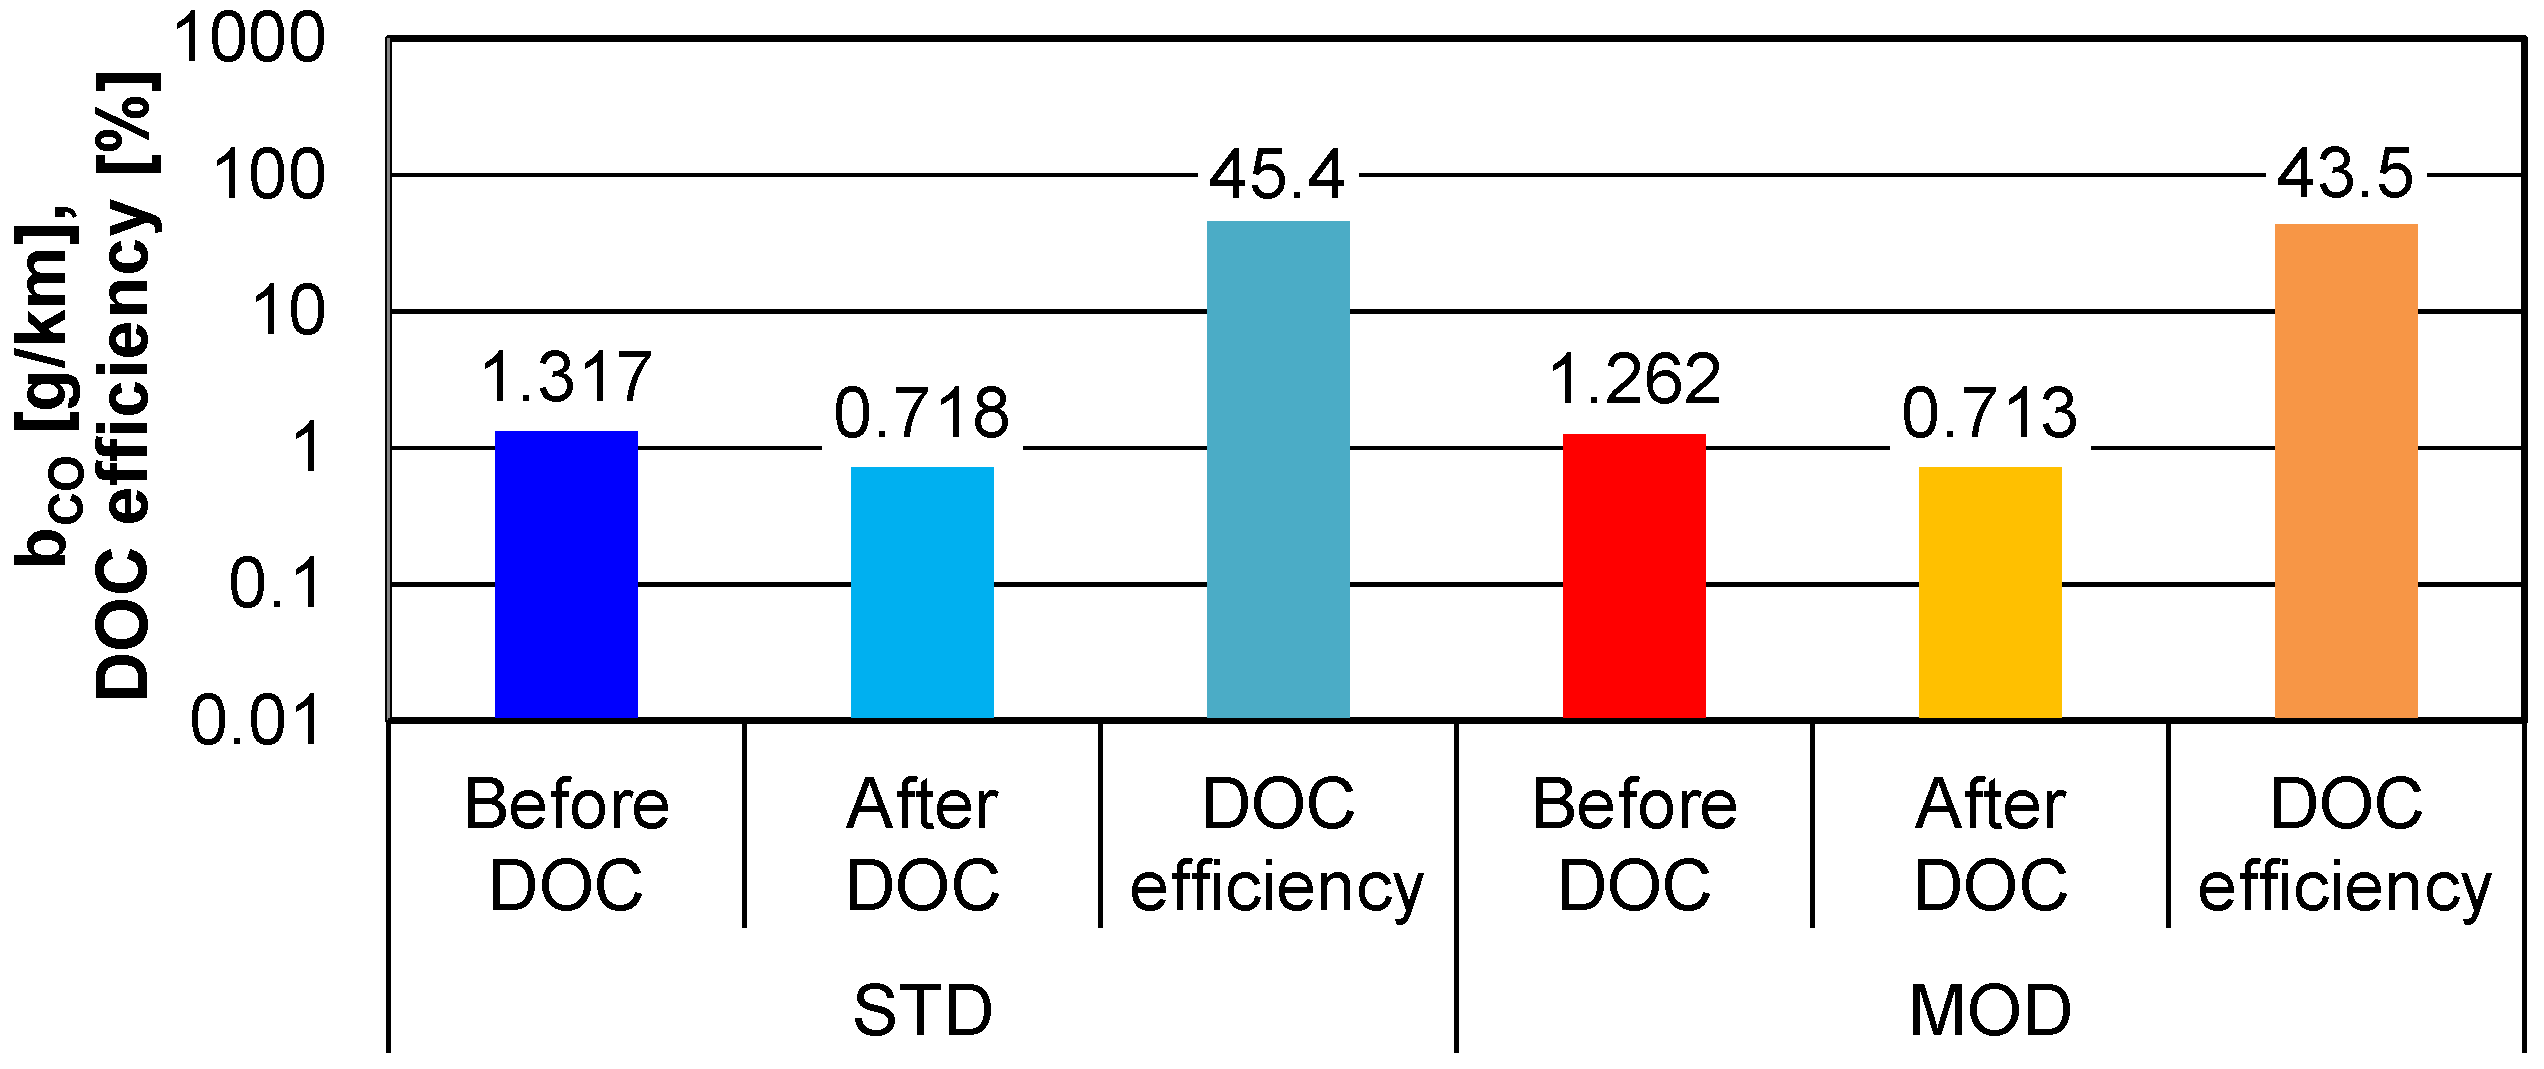
The differences in the carbon monoxide concentration values for the standard and modified glow plugs were small; however, conversion of the concentration values into emissions showed a reduction in carbon monoxide emissions during the NEDC test (Figure 21). The distance-specific carbon monoxide emission values determined for the entire test period (1180 s) showed the differences in the obtained results. The following results were obtained: for the standard plugs, respectively, ahead of the DOC: bCO = 1.317 g/km, behind the DOC: bCO = 0.718 g/km, and the DOC efficiency: ηDOC,CO = 45.3%; for the modified glow plugs ahead of the DOC: bCO = 1.262 g/km, behind the DOC: bCO = 0.713 g/km, and the DOC efficiency: ηDOC,CO = 43.5%.
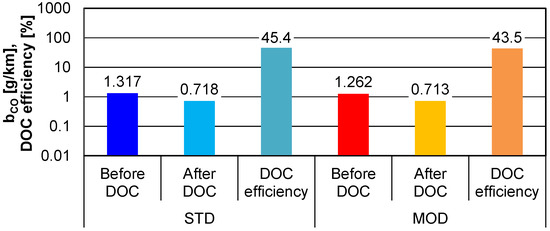
Figure 21.
Comparison of the distance-specific carbon monoxide emissions and efficiency of the catalytic reactor for the NEDC test (diesel engine, measured upstream and downstream of the DOC) using the standard (STD) and modified (MOD) glow plugs.
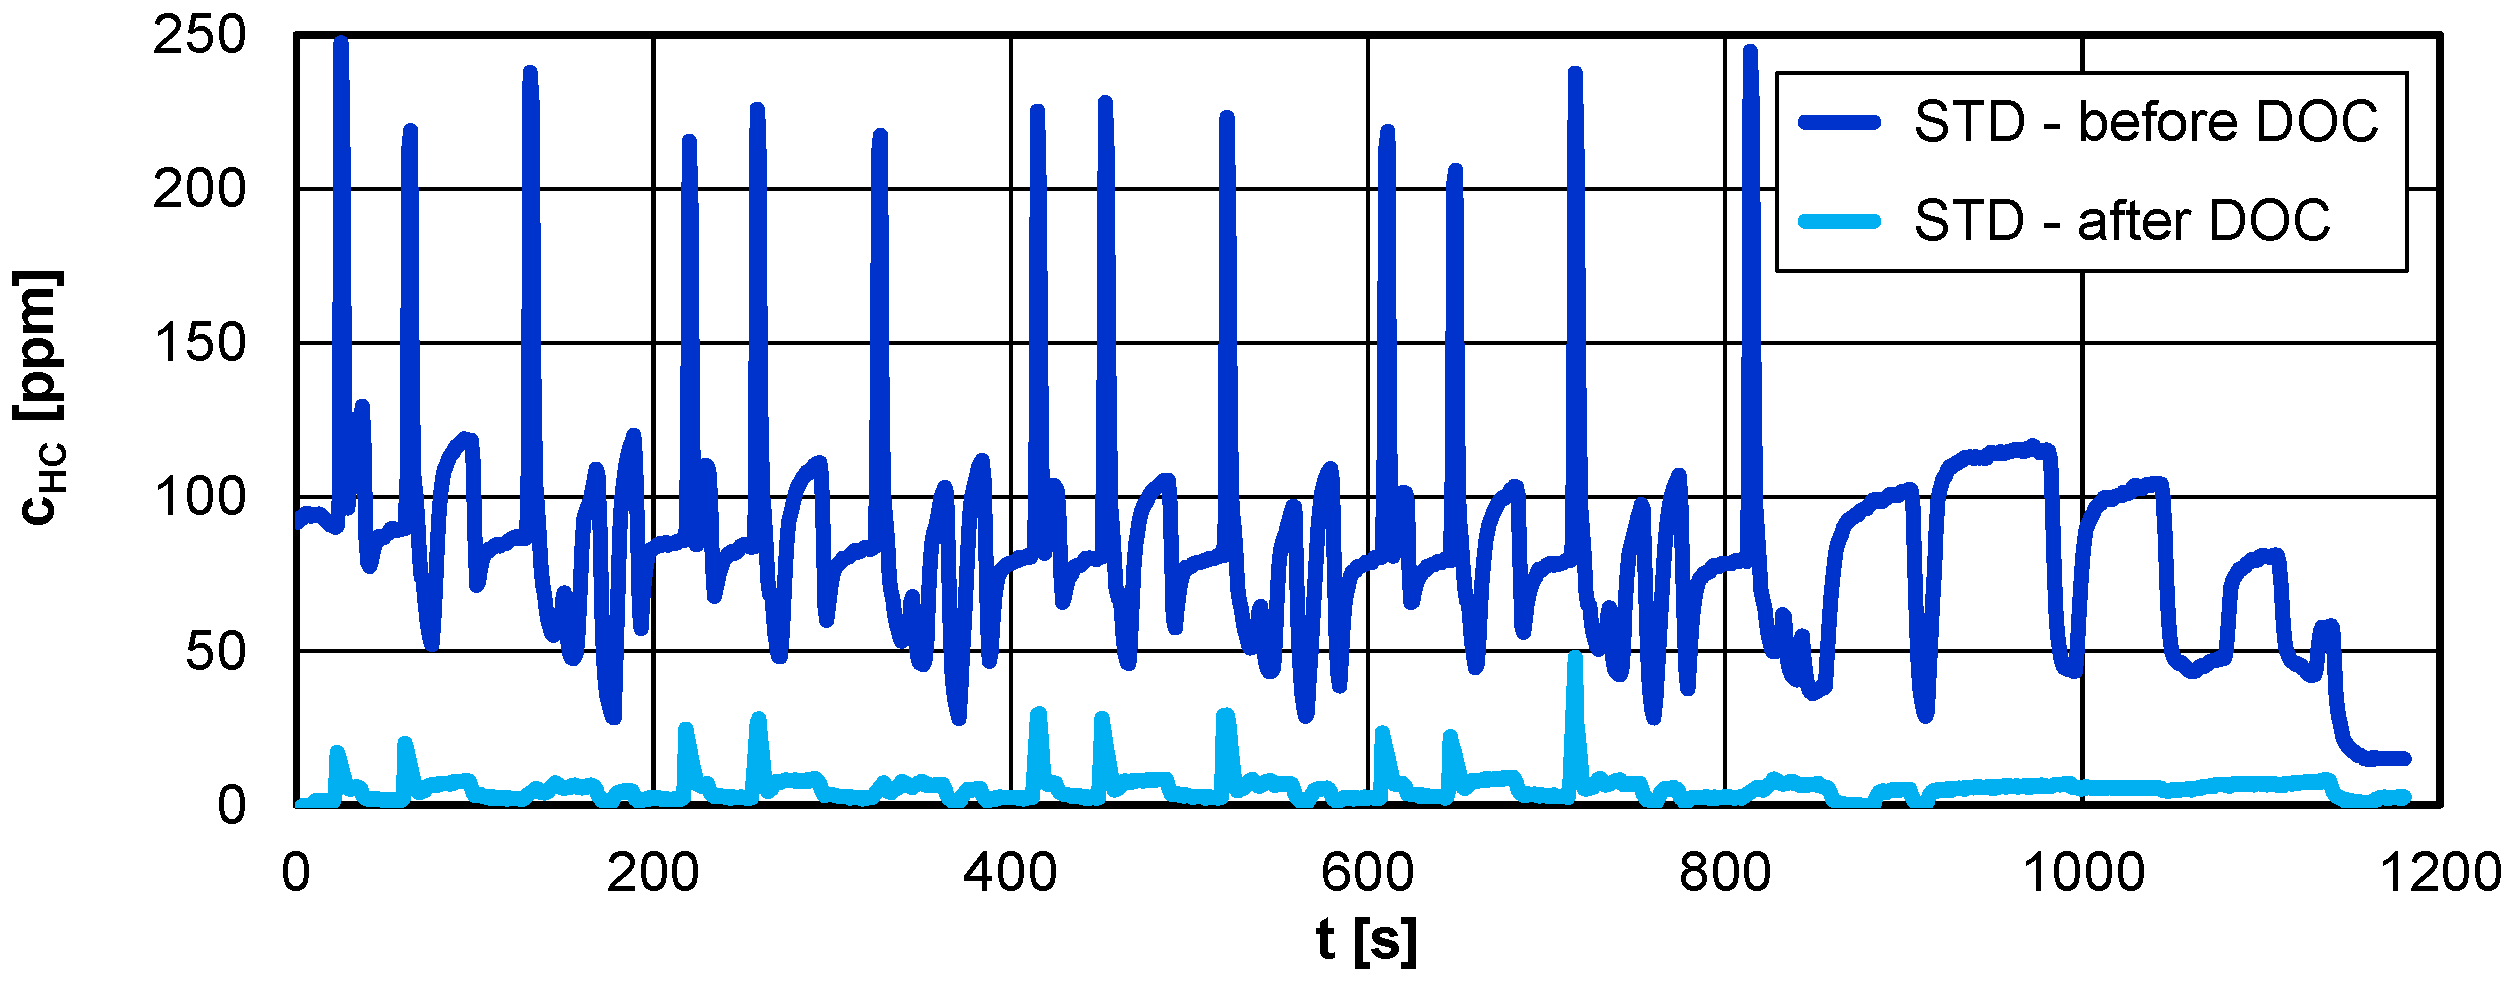
Similar results were obtained for the hydrocarbon concentration measurements. However, for the measurements before and after the DOC in the NEDC test, greater differences in the concentration values were obtained, which resulted in a reduction in hydrocarbon emissions when using the catalytically coated glow plugs (Figure 22). The hydrocarbon concentration values using the standard glow plugs ahead of the DOC were very dependent on the driving speed and varied from 50 ppm to 100 ppm. However, behind the DOC, they were very small—they reached values up to 20 ppm.
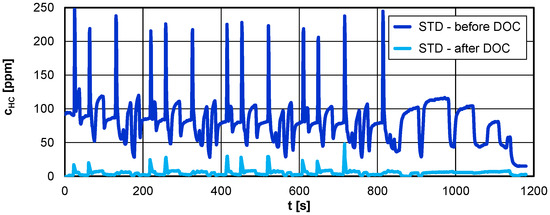
Figure 22.
Comparison of the hydrocarbon concentration in the NEDC test (diesel engine, measured upstream and downstream of the DOC) using the standard glow plugs (STD).
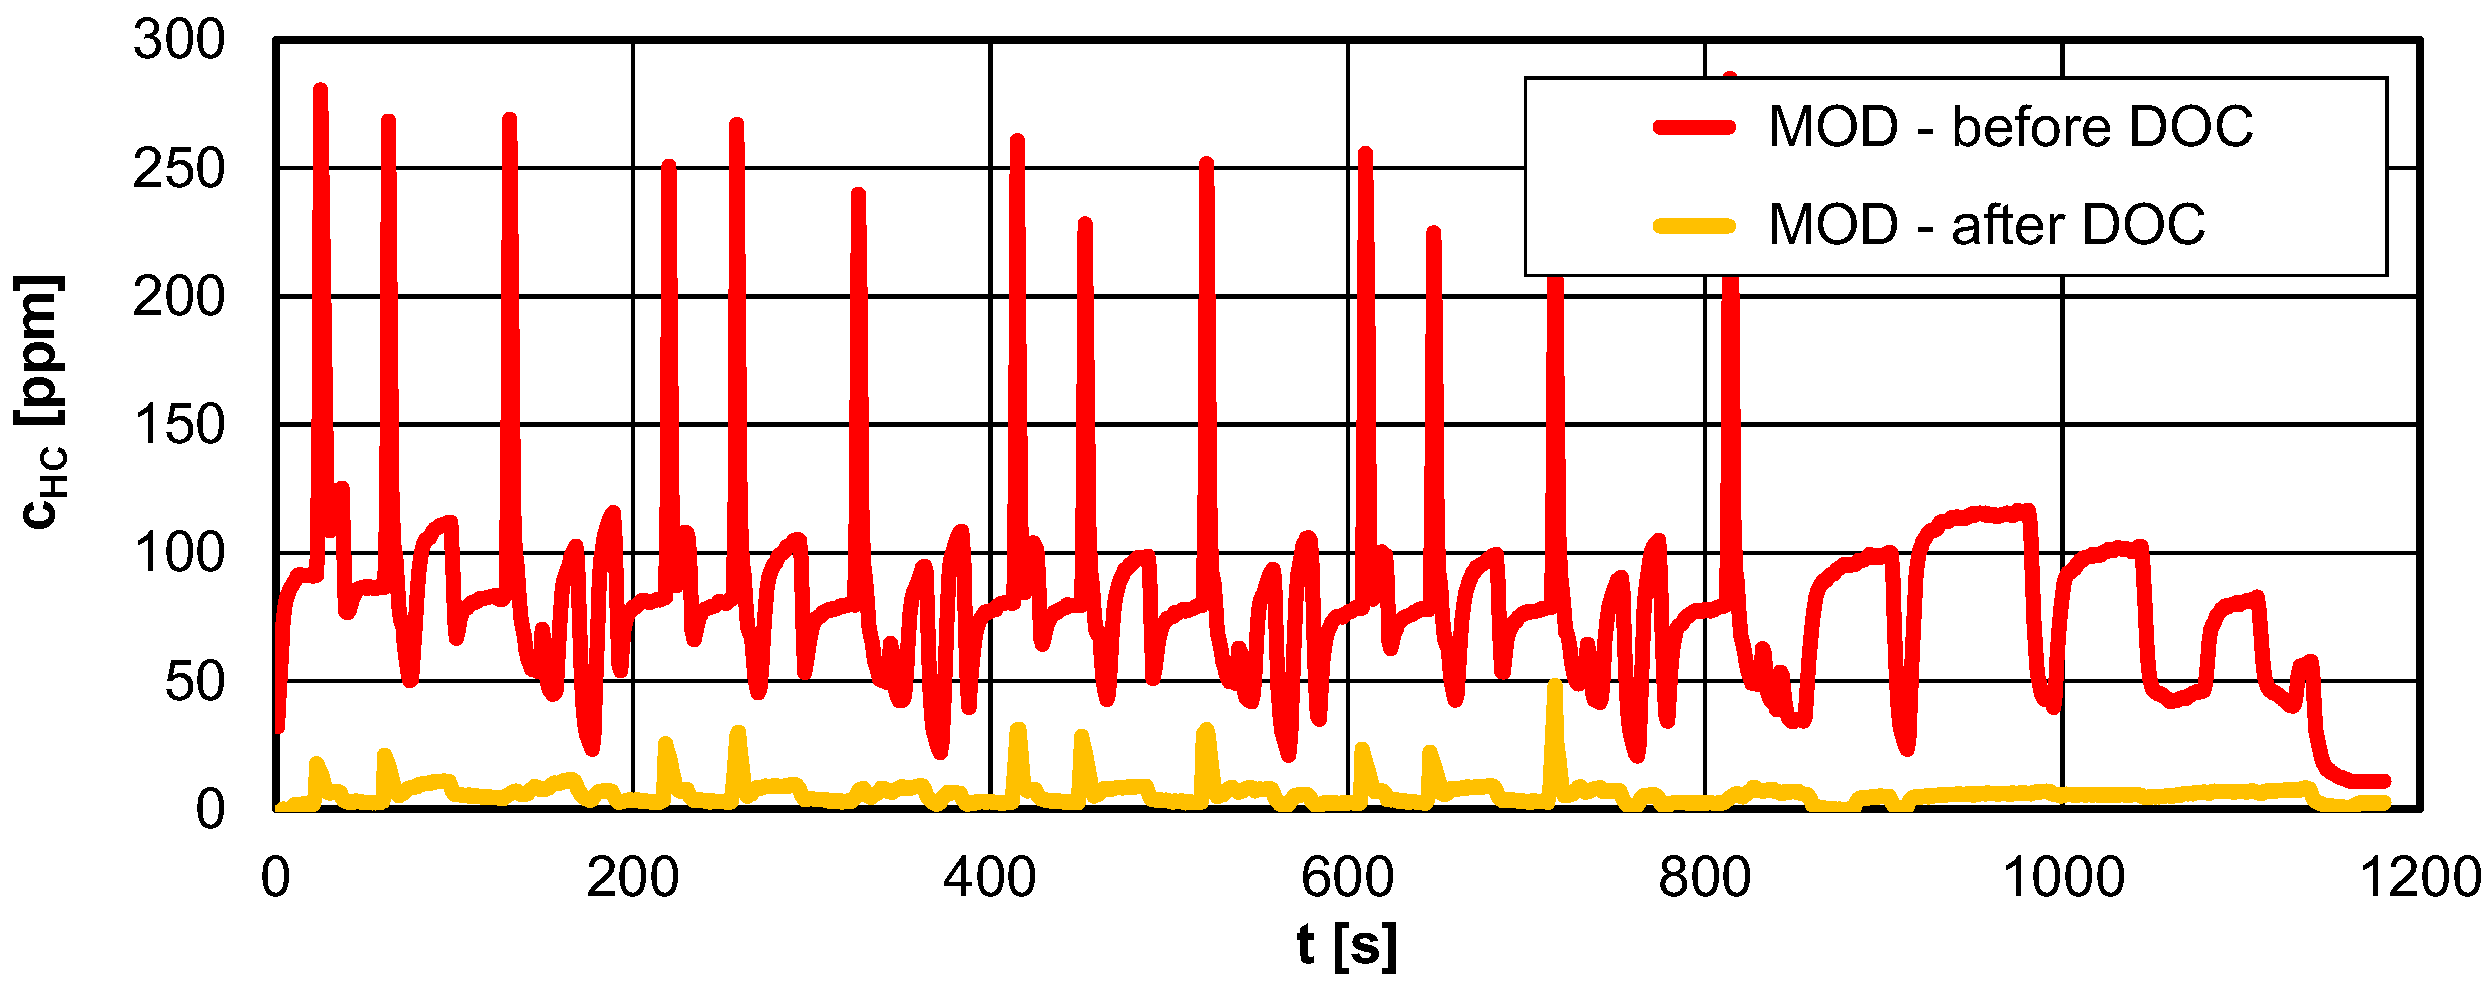
A very similar change was also noted for the modified glow plugs (Figure 23). The measurement of the hydrocarbon concentration before the DOC also strongly depended on the simulated speed of the vehicle, and for the greatest changes in the engine load value, the concentration of hydrocarbons reached values of about 250 ppm. These instantaneous values, however, were very strongly reduced by the DOC, because the hydrocarbon concentration measurement behind the DOC was characterized by a value of 50 ppm at most.

Figure 23.
Comparison of the hydrocarbon concentration in the NEDC test (diesel engine, measured upstream and downstream of the DOC) using the modified glow plugs (MOD).
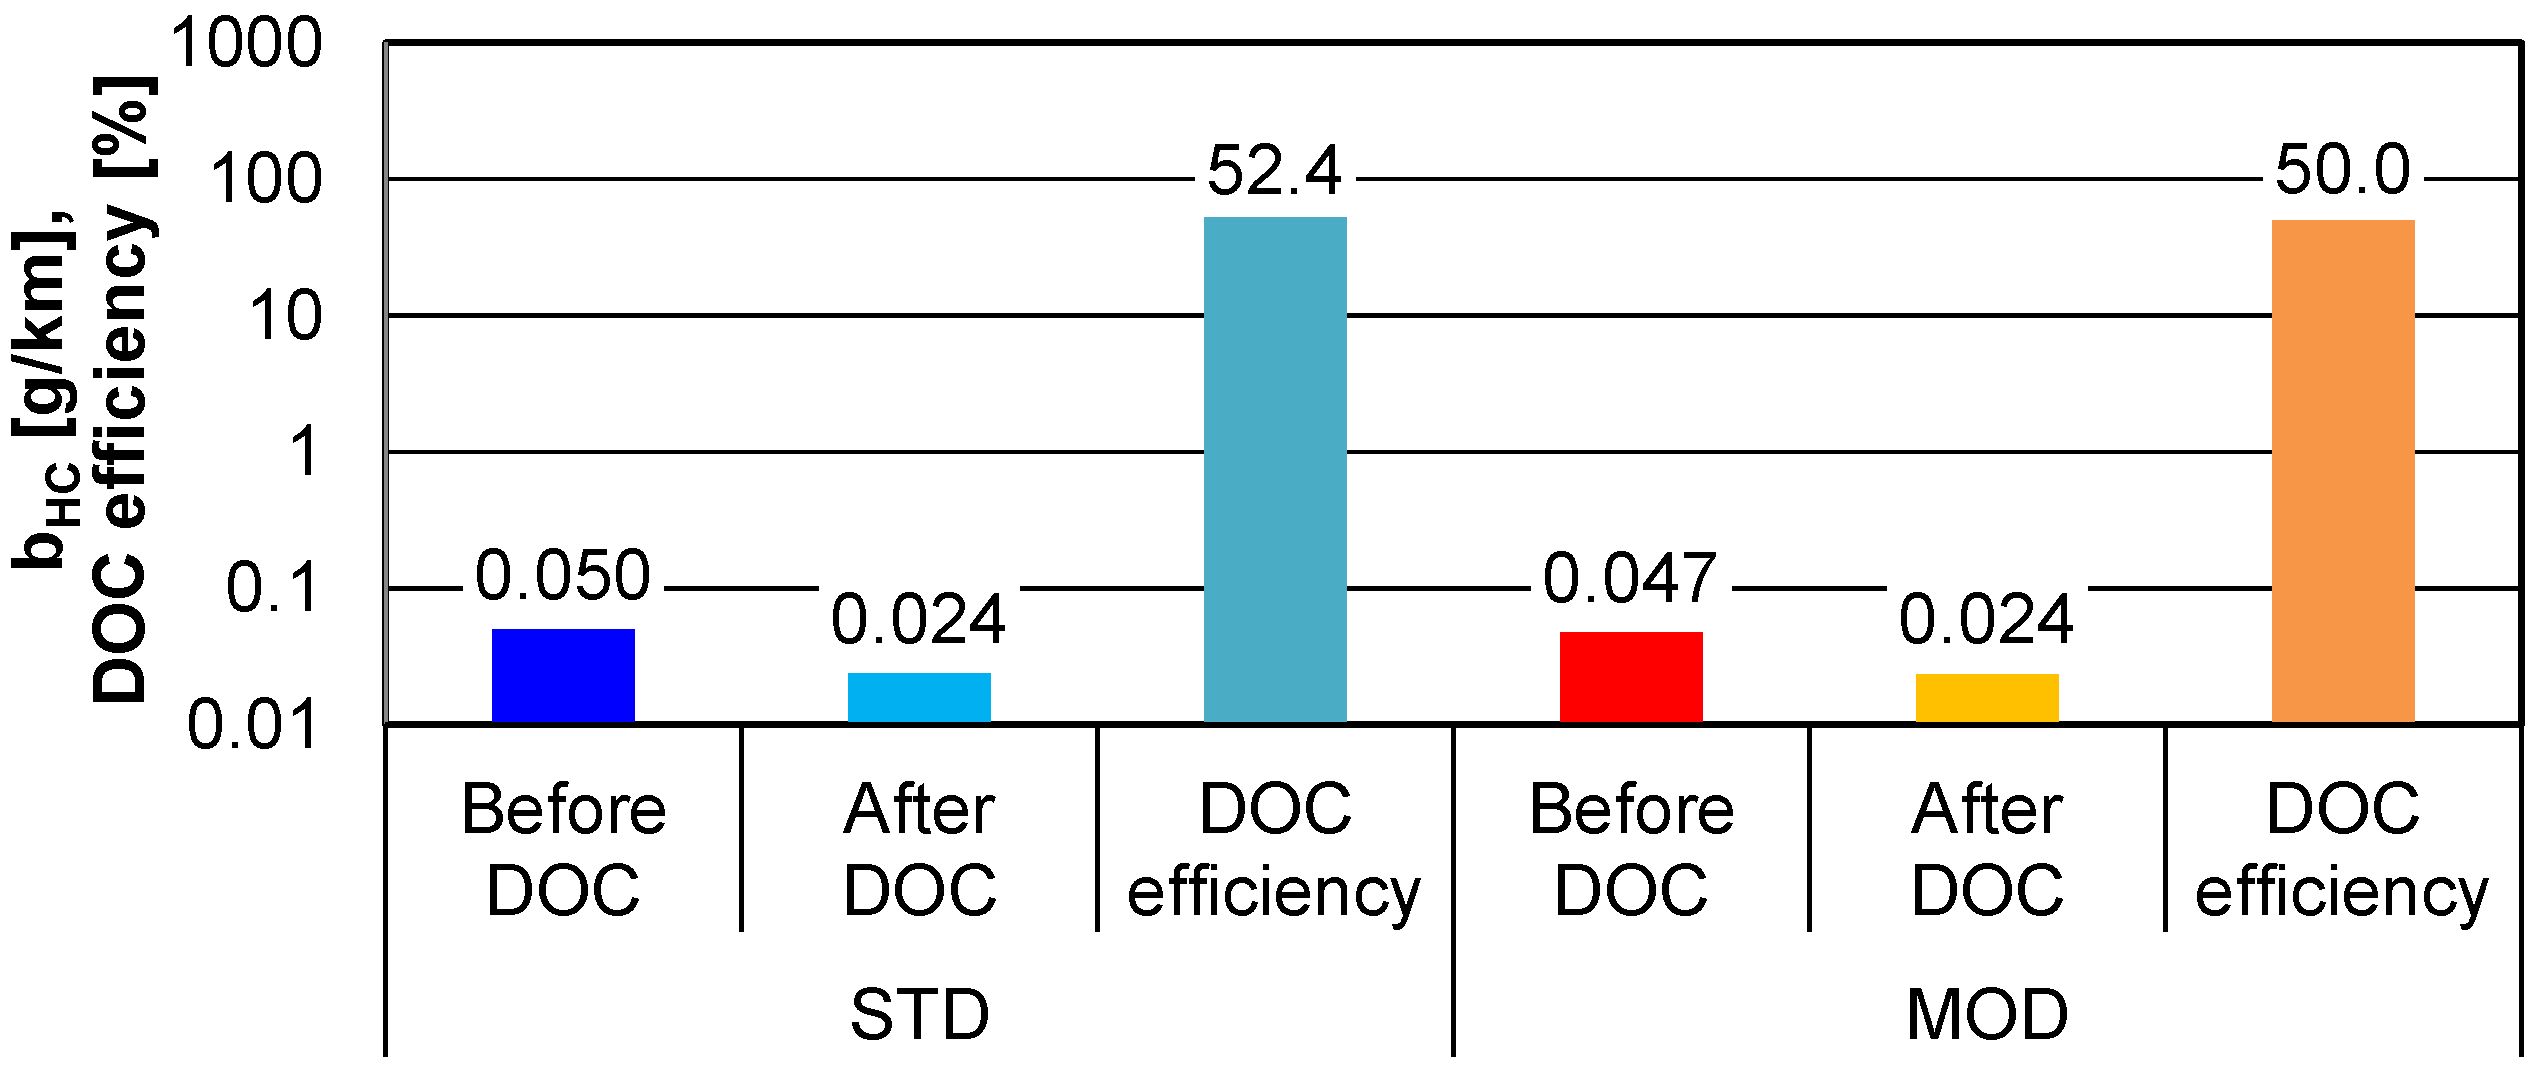
The conversion of the hydrocarbon concentration into the distance-specific emission yielded the following results (Figure 24), respectively, for the standard plugs: ahead of the DOC: bHC = 0.050 g/km, behind the DOC: bHC = 0.024 g/km, and the DOC efficiency: ηDOC,HC = 52.4%; for the modified glow plugs ahead of the DOC: bHC = 0.047 g/km, behind the DOC: bHC = 0.024 g/km, and the DOC efficiency: ηDOC,HC = 50.0%. Comparing these values to the carbon monoxide emissions, it should be noted that the catalytic reactor reduced the hydrocarbon emissions to a greater extent than the carbon monoxide emissions (by 1/10); however, the reference concentration level was also completely different (carbon monoxide concentration was 4–5-times greater than that of hydrocarbons).
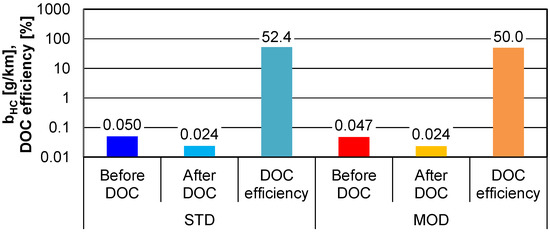
Figure 24.
Comparison of the distance-specific hydrocarbon emissions and efficiency of the catalytic reactor for the NEDC test (diesel engine, measured upstream and downstream of the DOC) using the standard (STD) and modified (MOD) glow plugs.
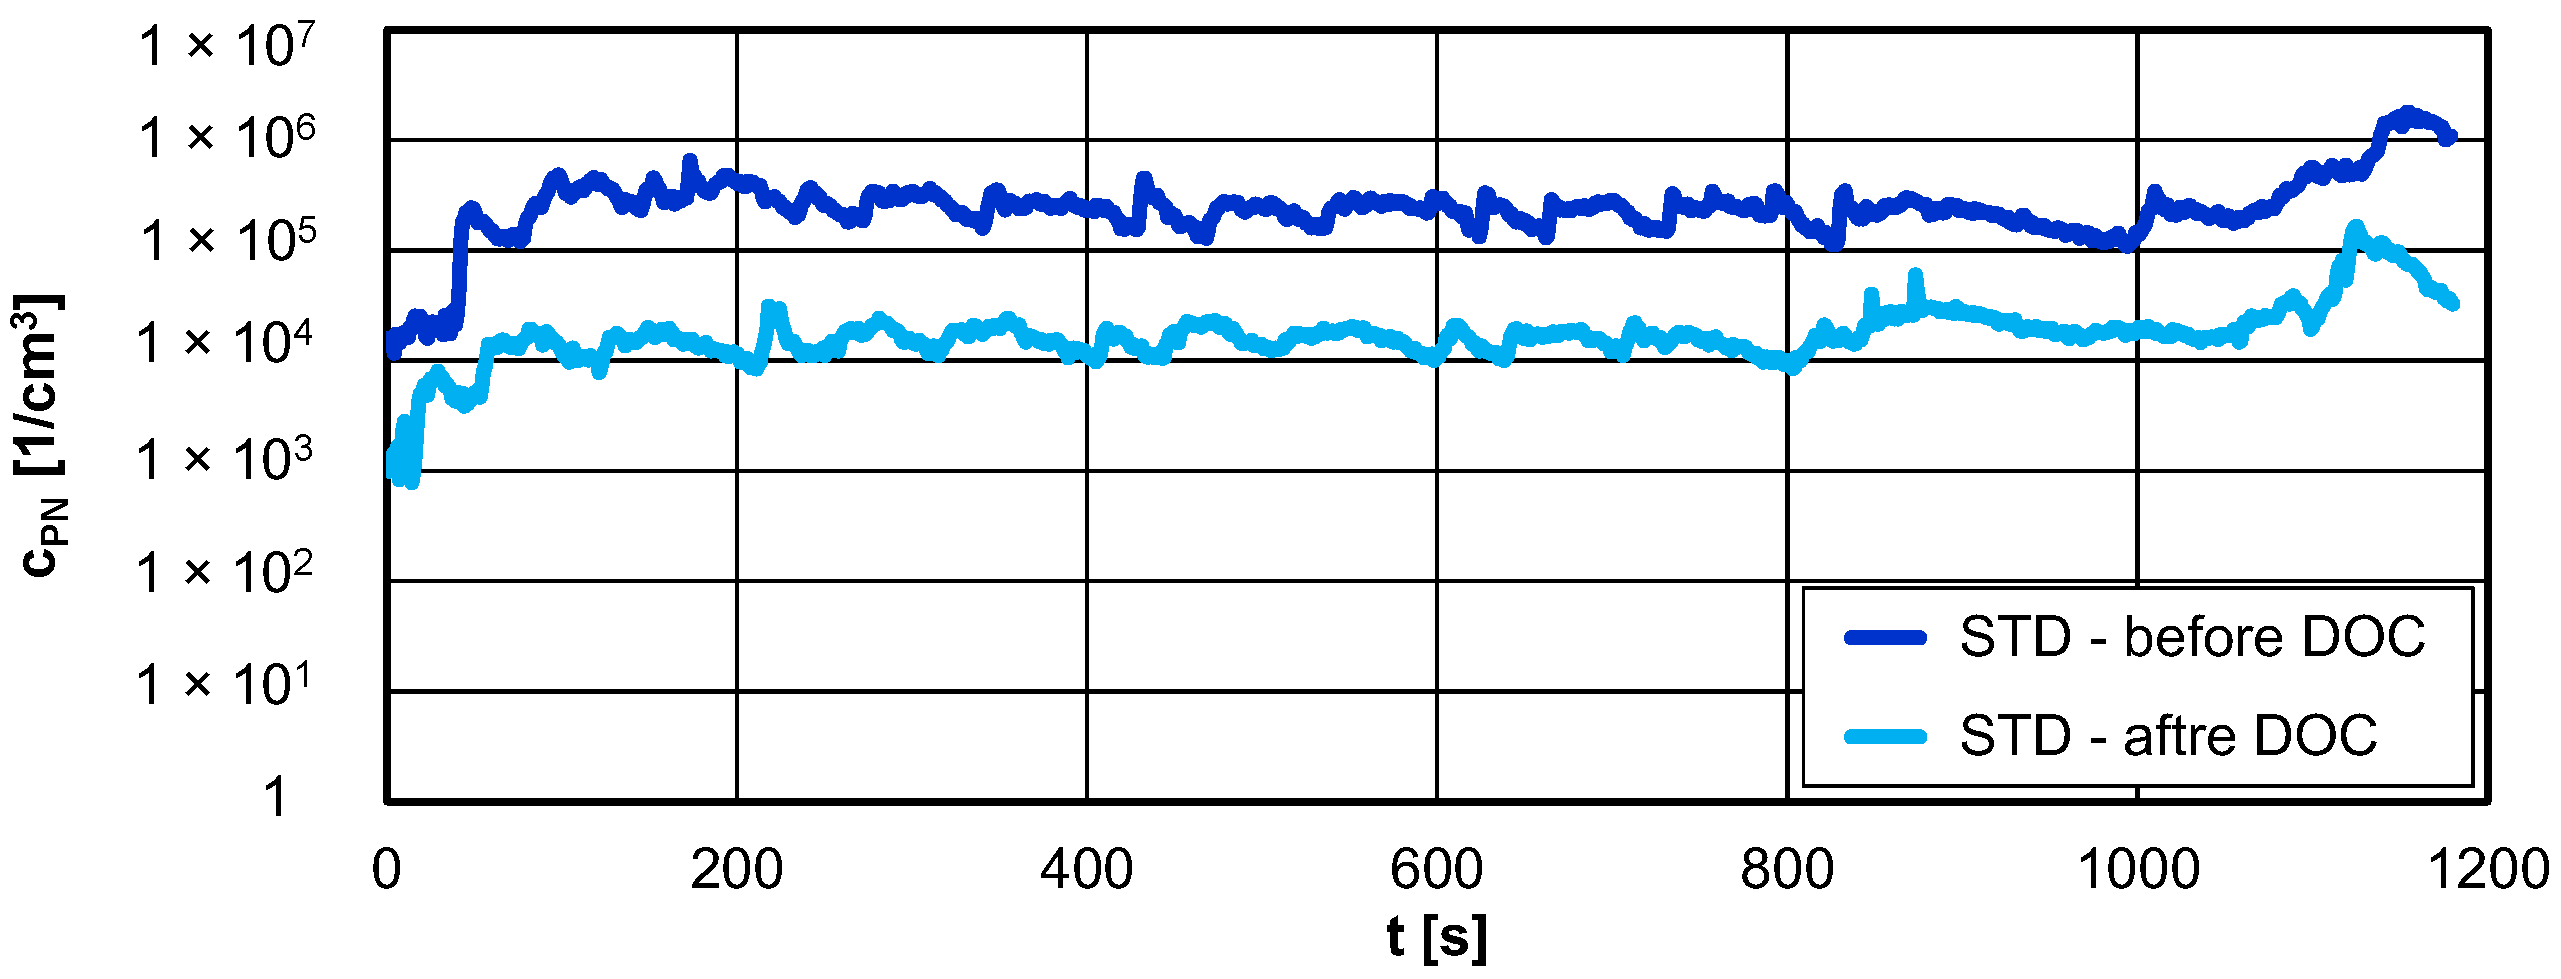
In the case of the PN emissions, the measured changes were similar to the results of the previous compounds—carbon monoxide and hydrocarbons. The concentration results for the PN values for the standard glow plugs ahead of the DOC (Figure 25) provided values in the range of 1 × 10⁵–1 × 10⁶ 1/cm3. The highest values were recorded during the highest driving speed in the EUDC test—they were over 1 × 10⁶ 1/cm3.
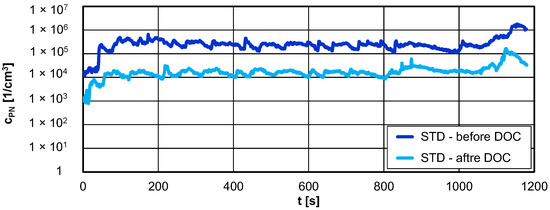
Figure 25.
Comparison of the particle number in the NEDC test (diesel engine, measured upstream and downstream of the DOC) using the standard glow plugs (STD).
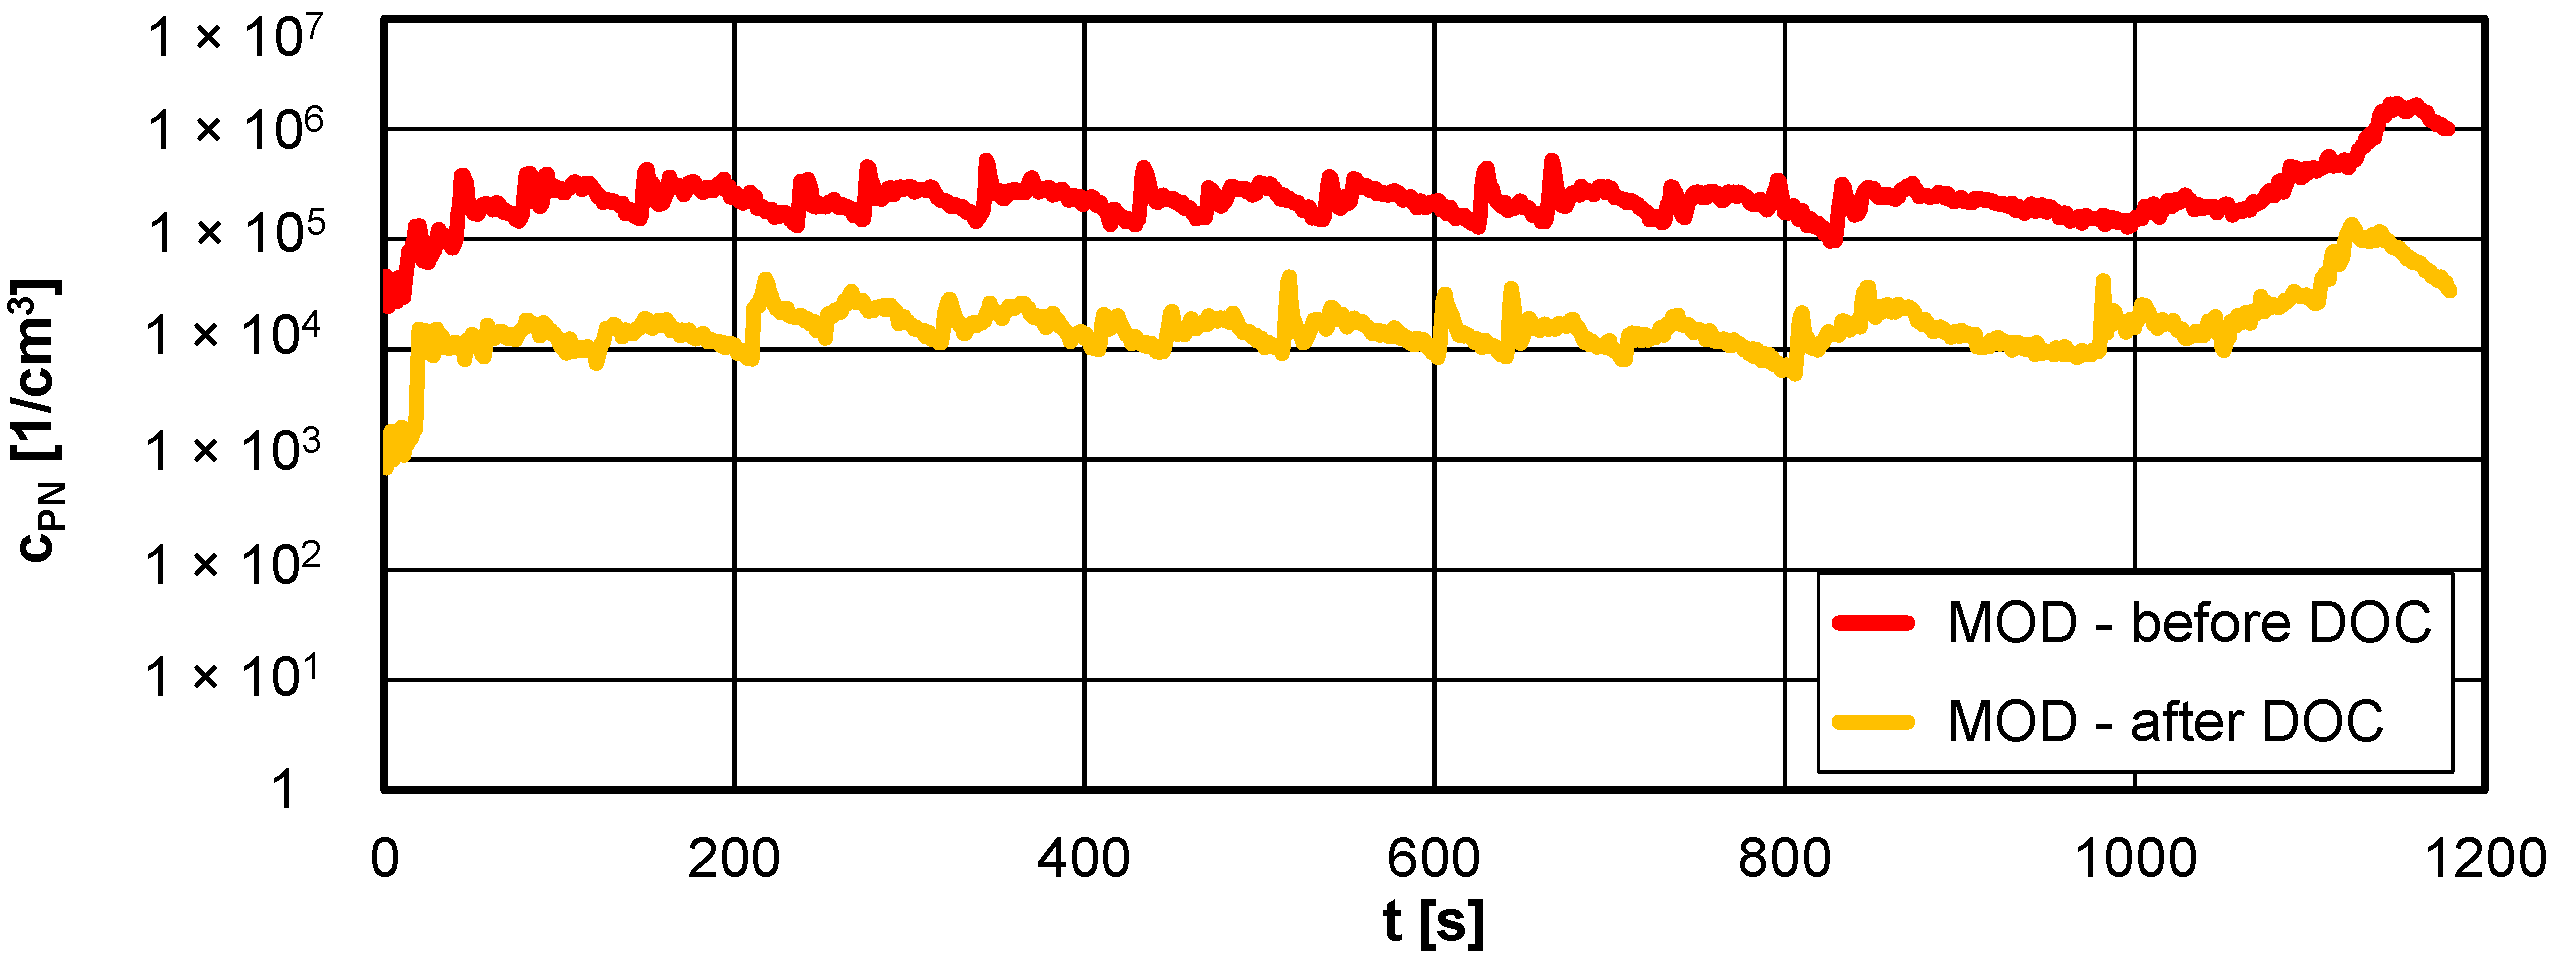
Changing the glow plugs to the modified version did not result in significant differences in the number of particles measured (Figure 26). Similar values to the previous ones (STD plugs) were obtained both ahead of the DOC (change within 1 × 10⁵–1 × 10⁶ 1/cm3) as well as behind the DOC (change within 1 × 10⁴–1 × 10⁵ 1/cm3). This result was understood to be the effect of the lack of a particulate filter in the exhaust aftertreatment system of the tested vehicle.
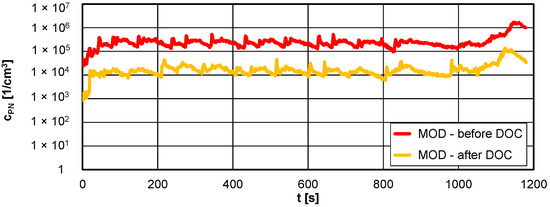
Figure 26.
Comparison of the particle number in the NEDC test (diesel engine, measured upstream and downstream of the DOC) using the modified glow plugs (MOD).
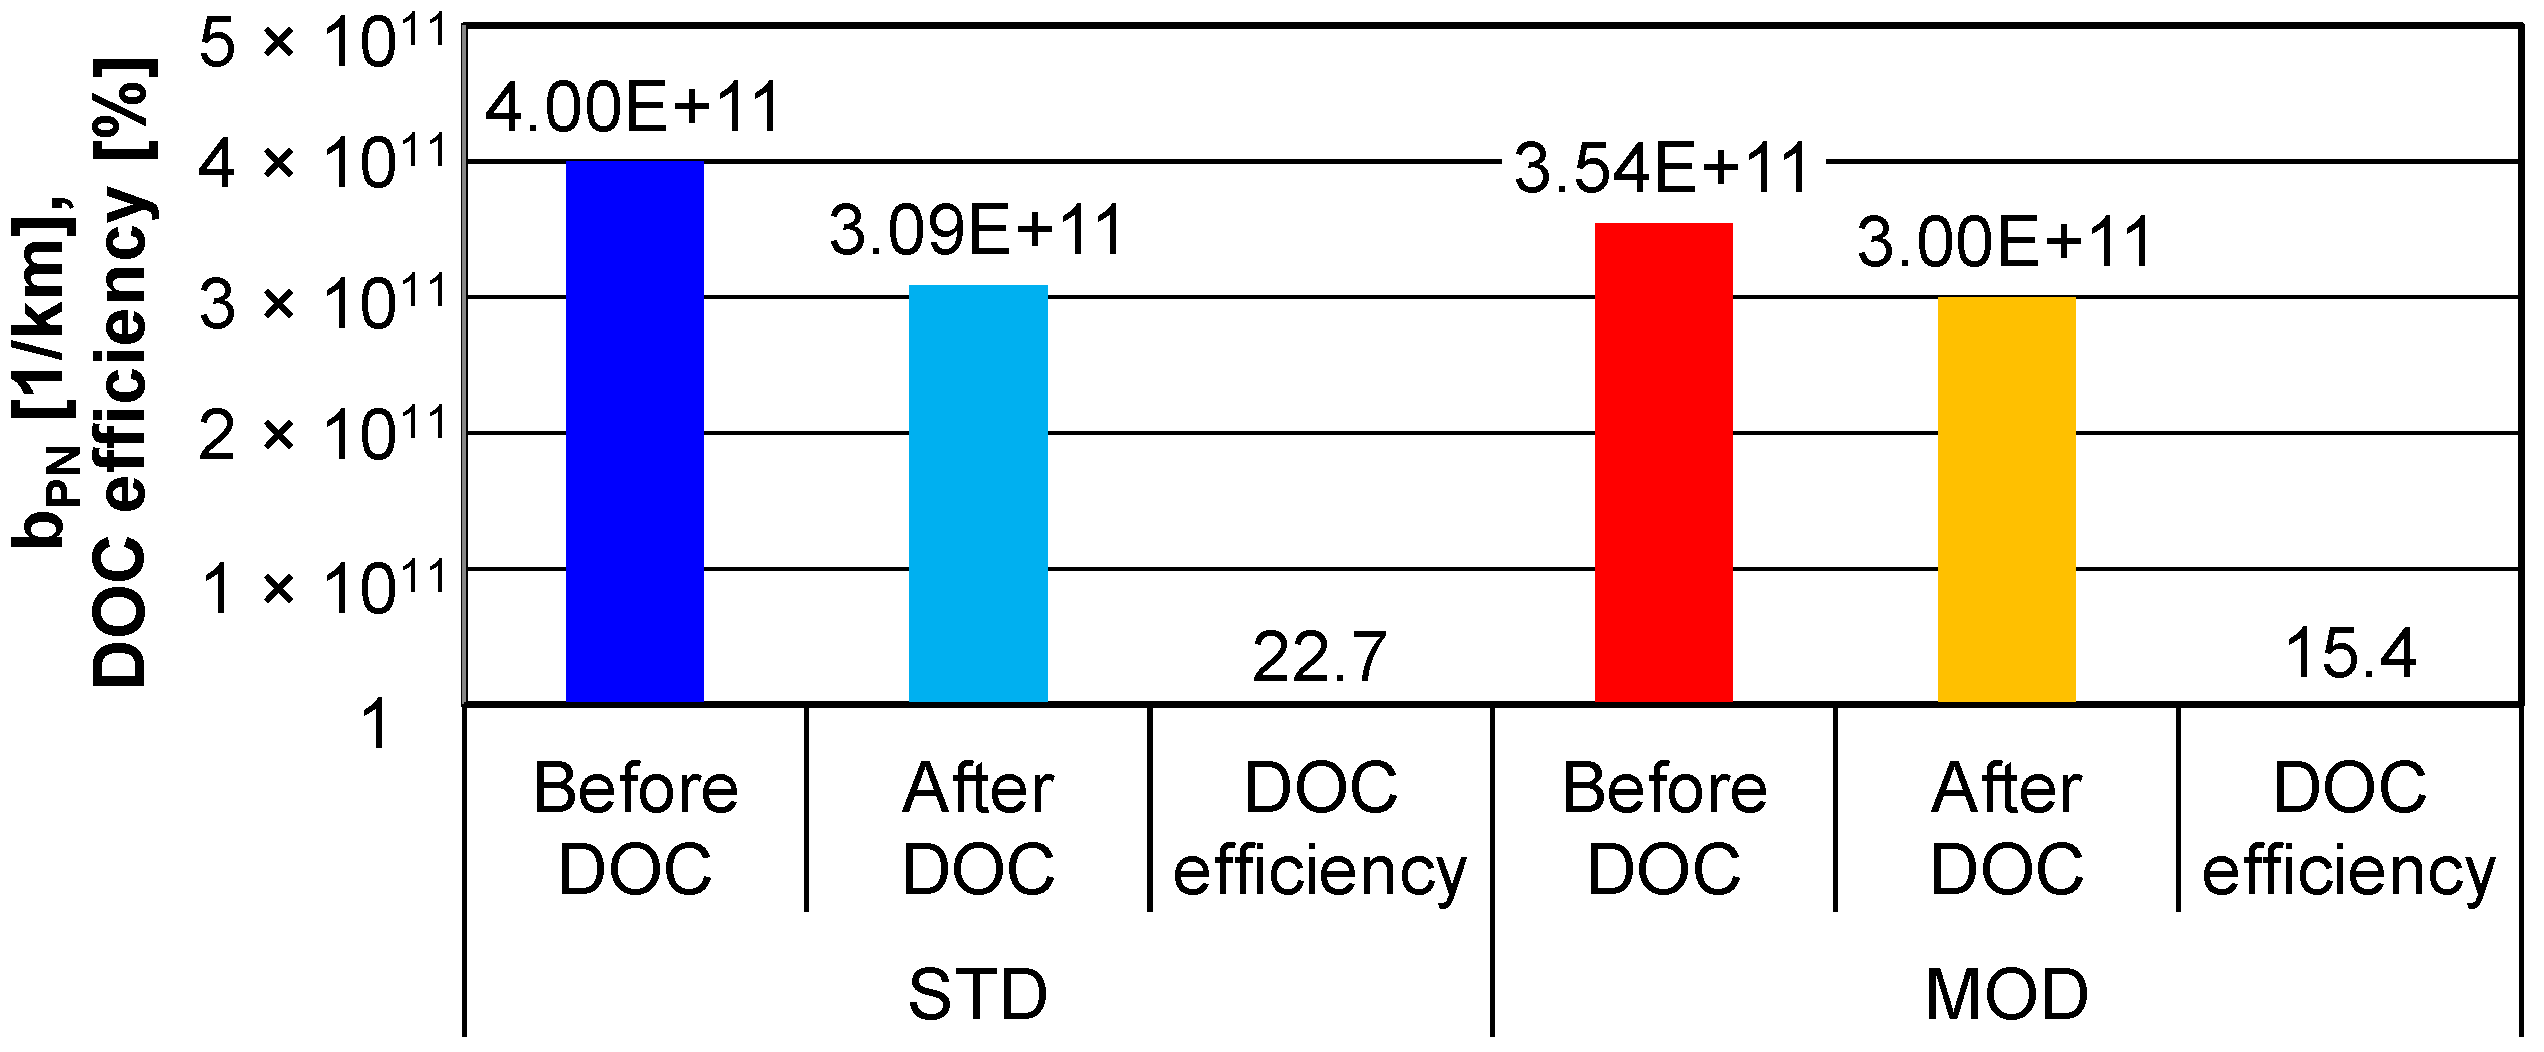
When determining the distance-specific PN emissions in the entire NEDC test, and taking into account the exhaust gas flow rate, the following results were obtained (Figure 27): for the standard glow plugs, respectively, ahead of the DOC: bPN = 4.00 × 10¹¹ 1/km, behind the DOC: bPN = 3.09 × 10¹¹ 1/km, and the DOC efficiency: ηDOC,PN = 22.7%; for the modified glow plugs ahead of the DOC: bPN = 3.54 × 10¹¹ 1/km, behind the DOC: bPN = 3.00 × 10¹¹ 1/km, and the DOC efficiency: ηDOC,PN = 15.4%. The low efficiency of the DOC in relation to the number of emitted particles was not surprising, because that is not the basic function of this device. However, it should be noted that an efficiency of 15–20% was still achieved, which was probably due to the proportion of quite large particles emitted by the engine, which were nevertheless retained by the DOC.
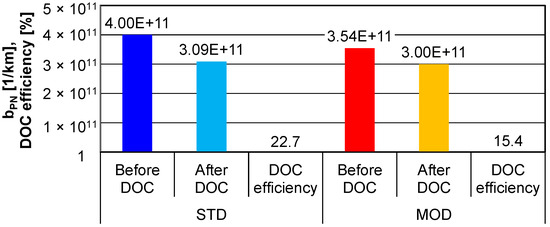
Figure 27.
Comparison of the distance-specific PN emissions and efficiency of the catalytic reactor for the NEDC test (diesel engine, measured upstream and downstream of the DOC) using the standard (STD) and modified (MOD) glow plugs.
5. Conclusions
The efficiency of the diesel oxidation catalytic reactor (DOC) during the engine start-up and warm-up phases with the use of the standard glow plugs reached the following values:
- For carbon monoxide: 31.3%;
- For hydrocarbons: 34.1%;
- For particle number: 14.3%.
On the other hand, the determined efficiency of the DOC in a setup with the modified glow plugs was as follows:
- For carbon monoxide: 28.9%;
- For hydrocarbons: 35.7%;
- For particle number: 12.5%.
The lower efficiency values obtained when using the modified plugs (and, at the same time, the lower emissions measured upstream of the DOC) prove that the catalytic layer applied to the glow plugs reduced the emissions already inside the combustion chamber.
The efficiency of the catalytic reactor in the NEDC test using the standard glow plugs was as follows:
- For carbon monoxide: 45.4%;
- For hydrocarbons: 52.4%;
- For particle number: 22.7%.
The determined efficiency of the DOC in a setup with the modified glow plugs was as follows:
- For carbon monoxide: 43.5%;
- For hydrocarbons: 50.5%;
- For particle number: 15.4%.
The lower efficiency values obtained when using the modified plugs (and, at the same time, the lower emissions measured upstream of the DOC) prove that the catalytic layer applied to the glow plugs initiated an emissions reduction already inside the combustion chamber.
It is again noted that the catalytic reactor efficiency results—regardless of the type of test—were the highest in reducing the concentration of hydrocarbons, and the lowest in relation to the number of emitted particles (as this is not the main function of a DOC).
Author Contributions
Conceptualization, Z.C., J.M., M.A.-Z. and J.P.; methodology, Z.C., J.M. and J.P.; software, J.P.; validation, Z.C., J.M., M.A.-Z. and J.P.; formal analysis, Z.C., J.M., M.A.-Z. and J.P.; investigation, Z.C., J.M. and J.P.; resources, Z.C. and J.M.; data curation, Z.C., J.M., M.A.-Z. and J.P.; writing—original draft preparation, Z.C. and J.M.; writing—review and editing, Z.C., J.M., M.A.-Z. and J.P.; visualization, Z.C. and J.P.; supervision, Z.C., J.M., M.A.-Z. and J.P.; project administration, Z.C., J.M., M.A.-Z. and J.P.; funding acquisition, Z.C., J.M., M.A.-Z. and J.P. All authors have read and agreed to the published version of the manuscript.
Funding
This research received no external funding.
Data Availability Statement
The data presented in this study are available on request from the corresponding author.
Conflicts of Interest
The authors declare no conflict of interest.
Abbreviations
| ACEA | European Automobile Manufacturers’ Association |
| AECC | Association for Emissions Control by Catalyst |
| ASC | Ammonia slip catalyst |
| b | Distance-specific emissions |
| BEV | Battery-electric vehicle |
| c | Concentration |
| ccSCR | Close-coupled position SCR |
| CF | Conformity factor |
| CO | Carbon monoxide |
| CO2 | Carbon dioxide |
| CLD | Chemiluminescence detector |
| CPC | Condensation particle counter |
| DOC | Diesel oxidation catalyst |
| EGR | Exhaust gas recirculation |
| EHC | Electrically heated catalyst |
| HC | Hydrocarbons |
| HEV | Hybrid-electric vehicle |
| LNT | Lean NOx Trap |
| NDIR | Non-dispersive infrared detector |
| NEDC | New European Driving Cycle |
| NGV | Natural gas vehicle |
| NH3 | Ammonia |
| NOx | Nitrogen oxides |
| PEMS | Portable exhaust measurement system |
| PHEV | Plug-in hybrid electric vehicle |
| PN | Particle number |
| RDE | Real driving emissions |
| SCR | Selective reduction catalyst |
| SDPF | SCR catalyst coated on a DPF |
| ufSCR | Underfloor position SCR |
| v | Vehicle speed |
References
- Greenhouse Gas Emission Intensity of Electricity Generation in Europe. Available online: www.eea.europa.eu/data-and-maps/indicators/overview-of-the-electricity-production-3 (accessed on 12 January 2023).
- New Car Registrations by Fuel Type, European Union. Available online: www.acea.auto/fuel-pc/fuel-types-of-new-cars-battery-electric-11-9-hybrid-22-6-and-petrol-37-8-market-share-in-q3-2022/ (accessed on 14 January 2023).
- Proposal for a Euro 7 Regulation. Available online: https://www.acea.auto/publication/position-papers-proposal-for-a-euro-7-regulation/ (accessed on 15 January 2023).
- Samaras, Z.; Hausberger, S.; Mellios, G. Preliminary Findings on Possible Euro 7 Emission Limits for LD and HD Vehicles. In Proceedings of the Online AGVES Meeting, Online, 27 October 2020; Available online: https://circabc.europa.eu/sd/a/fdd70a2d-b50a-4d0b-a92a-e64d41d0e947/CLOVE%2520test%2520limits%2520AGVES%25202020-10-27%2520final%2520vs2.pdf (accessed on 25 February 2023).
- Müller, V.; Pieta, H.; Schaub, J.; Ehrly, M.; Korfer, T. On-Board Monitoring to meet upcoming EU-7 emission standards – Squaring the circle between effectiveness and robust realization. Transp. Eng. 2022, 1, 10138. [Google Scholar] [CrossRef]
- AECC. Euro 7 Emission Standards for Cars, Vans, Buses and Trucks; Position Paper; European Comission: Brussels, Belgium, 2023. [Google Scholar]
- Hopwood, P. Euro 7/VII–New Emissions Limits, the Challenges and Solutions. Deliv. Excell. Through Innov. Technology. Ricardo 2020. [Google Scholar]
- Bunar, F. Holistic ECT Cost Estimation; Final Report (Executive Summary) v.2. Automotive Engineering. 2021. Available online: https://www.iav.com (accessed on 21 November 2021).
- Joshi, A. Technology Pathways to Meet the Ultra-Low NOx Regulations for Heavy-Duty Truck. In Proceedings of the FEV Diesel Powertrains 3.0. Online Conference, Online, 29 June 2021; Available online: https://fev-live.com/diesel/ (accessed on 27 February 2023).
- Demuynck, J.; Favre, C.; Bosteels, D.; Randlshofer, G.; Bunar, F.; Spitta, J.; Friedrichs, O.; Kuhrt, A.; Brauer, M. Integrated Diesel System Achieving Ultra-Low Urban and Motorway NOx Emissions on the Road. In Proceedings of the 40th International Vienna Motor Symposium, Vienna, Austria, 16 May 2019; Available online: https://www.aecc.eu/wp-content/uploads/2020/11/190516-AECC-IAV-IPA-Integrated-Diesel-System-achieving-Ultra-Low-NOx-on-the-road-Vienna-Symposium-1.pdf (accessed on 22 December 2022).
- Vehicles in Use Report. National Statistics. 2022. Available online: https://www.acea.auto/figure/average-age-of-eu-vehicle-fleet-by-country/ (accessed on 14 February 2023).
- Bielaczyc, P.; Merkisz, J.; Pielecha, J. Thermal State of Combustion Engine in Relation to Exhaust Emissions; Publishing House of Poznan University of Technology: Poznan, Poland, 2001. [Google Scholar]
- Burk, P.; Hochmuth, J.; Anderson, D.; Sung, S.; Tauster, S.; Tolentino, C.; Rogalo, J.; Miles, G.; Niejako, M.; Punke, A.; et al. Cold start hydrocarbon emissions control. Automot. Eng. 1995, 10. [Google Scholar]
- Passenger Mobility Statistics, Passenger Mobility. Available online: https://ec.europa.eu/eurostat/statistics-explained/index.php?title=Passenger_mobility_statistics (accessed on 22 February 2023).
- Merkisz, J.; Pielecha, J.; Radzimirski, S. New Trends in Emission Control in the European Union; Springer Tracts on Transportation and Traffic: Cham, Switzerland, 2014; Volume 4. [Google Scholar]
- Dongli, T.; Yujun, M.; Jie, T.; Chengtao, Z.; Zhiqing, Z.; Guanhua, Y.; Shuwan, C.; Jingyi, H.; Ziheng, Z. Utilization of renewable and sustainable diesel/methanol/n-butanol (DMB) blends for reducing the engine emissions in a diesel engine with different pre-injection strategies. Energy 2023, 269, 126785. [Google Scholar] [CrossRef]
- Dongli, T.; Yao, W.; Junshuai, L.; Jian, L.; Xiaoyu, O.; Yujun, M.; Guanglin, L.; Yanhui, C.; Zhiqing, Z. Performance optimization of a diesel engine fueled with hydrogen/biodiesel with water addition based on the response surface methodology. Energy 2023, 263, 125869. [Google Scholar] [CrossRef]
- Zhiqing, Z.; Jiangtao, L.; Jie, T.; Rui, D.; Zhi, Z.; Sheng, G.; Dongli, T. Performance, combustion and emission characteristics investigations on a diesel engine fueled with diesel/ ethanol /n-butanol blends. Energy 2022, 249, 123733. [Google Scholar] [CrossRef]
- Bradstreet, S. Flame sprayed catalyst coatings. Clay Prod. News Ceram. Rec. 1961, 24, 16–17. [Google Scholar]
- Navalihina, M.; Romanovsky, B.; Topchieva, K. Investigation of acidic properties of zeolite by high temperature poisoning technique. Catal. Kinet. 1971, 12, 1062–1065. [Google Scholar]
- Samahov, A.; Zaidman, M.; Chizhik, M. Change of Activity of Catalysts during Exploitation; Science, Siberia Branch: Novosibirsk, Russia, 1976. [Google Scholar]
- Vasilev, I.; Gavrilinko, P.; Zvonov, V. Method of definition of catalytic activity of combustion chamber surface of IC engine. USSR Author Sertificate 1987, 1312206. [Google Scholar]
- Mitchell, W.; Litzinger, T.; Lee, W. Effects of In-Cylinder Catalysts on Combustion and Emissions of a D.I. Diesel Engine Fuelled on Neat Methanol; SAE Technical Paper; SAE: Warrendale, PA, USA, 1992. [Google Scholar] [CrossRef]
- Winkler, M.; Parker, D. The Role of Diesel Ceramic Coatings in Reducing Automotive Emissions and Improving Combustion Efficiency; SAE Technical Paper; SAE: Warrendale, PA, USA, 1993. [Google Scholar] [CrossRef]
- Wong, V.; Bauer, W.; Kamo, R.; Bryzik, W.; Reid, M. Assessment of Thermal Barrier Coatings for IC Engines; SAE Technical Paper; SAE: Warrendale, PA, USA, 1995. [Google Scholar] [CrossRef]
- Hu, Z.; Ladommatos, N. In-Cylinder Catalysts–A Novel Approach to Reduce Hydrocarbon Emissions from Spark-Ignition Engines; SAE Technical Paper; SAE: Warrendale, PA, USA, 1995. [Google Scholar] [CrossRef]
- Hu, Z.; Ladommatos, N. Reduction of unburnt hydrocarbon emissions from spark ignition engines using in-cylinder catalysts. Proc Instn Mech Engrs Part D J. Automob. Eng. 1996, 210, 2. [Google Scholar] [CrossRef]
- Wu, X.; Fischer, M.; Nolte, A.; Lenßen, P.; Wang, B.; Ohlerth, T.; Wöll, D.; Heufer, K.A.; Pischinger, S.; Simon, U. Perovskite catalyst for in-cylinder coating to reduce raw pollutant emissions of internal combustion engines. ACS Omega 2022, 7, 5340–5349. [Google Scholar] [CrossRef]
- Zeng, W.; Xie, M. A novel approach to reduce hydrocarbon emissions from the HCCI engine. Chem. Eng. J. 2008, 139, 380–389. [Google Scholar] [CrossRef]
- Andrych-Zalewska, M.; Merkisz, J.; Pielecha, J. The influence of the heating time of a catalyst-covered glow plug on the exhaust emissions from a diesel engine. Combust. Engines 2021, 184, 52–56. [Google Scholar] [CrossRef]
- Andrych-Zalewska, M.; Chłopek, Z.; Merkisz, J.; Pielecha, J. Assessment of the internal catalyst efficiency in a diesel engine of a vehicle under the conditions simulating real driving. Energies 2020, 13, 6569. [Google Scholar] [CrossRef]
- Pielecha, J.; Andrych-Zalewska, M.; Skobiej, K. The impact of using an in-cylinder catalyst on the exhaust gas emission in real driving conditions tests of a Diesel engine. IOP Conf. Ser. Mater. Sci. Eng. 2018, 421, 042064. [Google Scholar] [CrossRef]
- Andrych-Zalewska, M.; Merkisz, J.; Pielecha, J. Analysis of the efficiency of the in-cylinder catalyst to reduce exhaust emissions during the cold start combustion engine. Combust. Engines 2019, 178, 38–45. [Google Scholar] [CrossRef]
- Andrych-Zalewska, M.; Merkisz, J.; Pielecha, J. Influence of the length of a catalyst-coated glow plug on exhaust emissions. Energies 2020, 13, 6557. [Google Scholar] [CrossRef]
- Janicka, A.; Sroka, Z.; Walkowiak, W. The analysis of diesel engine performance equipped with inner catalyst. Siln. Spalinowe 2011, 3, 50. [Google Scholar]
- Janicka, A.; Walkowiak, W.; Szczepaniak, W. The effect of Pt active coating application inside diesel engine on polycyclic aromatic hydrocarbons (PaHs) emission. J. KONES 2008, 2, 131–136. [Google Scholar]
- Janicka, A.; Walkowiak, W.; Tkaczyk, M. Toxicity of polycyclic aromatic hydro-carbons (PAHs) in diesel exhausts. J. KONES 2009, 4, 195–199. [Google Scholar]
- Karuppasamy, K.; Mageshkumar, M.; Manikandan, T.; Naga Arjun, J.; Senthilkumar, T.; Kumaragurubaran, B.; Chandrasekar, M. The effect of thermal barrier coatings on diesel engine performance. ARPN J. Sci. Technol. 2013, 3, 382–385. [Google Scholar]
- Karsenty, K.; Tartakovsky, L.; Sher, E. A diesel engine with a catalytic piston surface to propel small aircraft at high altitudes—a theoretical study. Energies 2021, 14, 1905. [Google Scholar] [CrossRef]
- Zhongwei, M.; Zhentao, L.; Jinlong, L. Investigation of in-cylinder combustion deterioration of diesel engines in plateau regions. Fuel 2022, 324, 124824. [Google Scholar] [CrossRef]
- Zafar, S.; Tuan, H.N.; Prabhakar, S.; Changhe, L.; Hafiz, M.A.; Van Nhanh, N.; Van Viet, P.; Shams, F.A.; Dong, N.V.; Thanh, H.T. Multi-attribute optimization of sustainable aviation fuel production-process from microalgae source. Fuel 2022, 324, 24759. [Google Scholar] [CrossRef]


Disclaimer/Publisher’s Note: The statements, opinions and data contained in all publications are solely those of the individual author(s) and contributor(s) and not of MDPI and/or the editor(s). MDPI and/or the editor(s) disclaim responsibility for any injury to people or property resulting from any ideas, methods, instructions or products referred to in the content. |
© 2023 by the authors. Licensee MDPI, Basel, Switzerland. This article is an open access article distributed under the terms and conditions of the Creative Commons Attribution (CC BY) license (https://creativecommons.org/licenses/by/4.0/).