Article

A Maximum Power Point Tracking Technique for a Wind Power System Based on the Trapezoidal Rule

by
Jayshree Pande
and
Paresh Nasikkar
*,†
Symbiosis Institute of Technology, Symbiosis International (Deemed University), Pune 412115, Maharashtra, India
*
Author to whom correspondence should be addressed.
These authors contributed equally to this work.
Energies 2023, 16(6), 2799; https://doi.org/10.3390/en16062799
Submission received: 6 February 2023 / Revised: 27 February 2023 / Accepted: 13 March 2023 / Published: 17 March 2023

Abstract

:
This work presents a new trapezoidal-rule-based variation of the perturb and observe algorithm to track the point with maximum power for a wind energy conversion system. The algorithm works in three steps. In the first step, the trapezoidal-rule-based division of the power curve into trapezoids of equal width is carried out. In the second step, areas of the adjacent trapezoids are compared to identify the trapezoid with the largest area. In the third step, the conventional perturb and observe algorithm is employed in the trapezoid having the largest area to capture the point of maximum power. The algorithm is simulated in MATLAB/SIMULINK to check the efficacy in capturing the maximum power. The simulation results suggest that the proposed method performs well under fluctuating wind conditions with improved yielded power. An effort to achieve simplicity for implementation and effectively track the maximum power point is made and presented.

1. Introduction

The growing population, tremendous industrial development, and enhanced living standards have considerably increased global energy consumption and demand for higher energy requirements. As a result, the reserves of conventional energy sources such as coal, gas, fossil fuels, and oil are becoming exhausted over time [1]. Hence, there is a global need to enhance renewable energy resources, which aid in preserving the environment for a safer and better future. Wind energy is gaining tremendous popularity globally, as it is a source of clean energy [2]. The actual behaviour of wind is characterized by extreme fluctuation; hence, capturing and extracting the maximum power from wind turbines (WTs) becomes a challenging task.
A WT helps to capture and yield power available in the wind. It captures the kinetic form of energy constituted in the wind. The essential building blocks that make up the wind energy conversion system (WECS) are depicted in Figure 1. The turbine blades capture energy for the WECS that is available in the wind. It converts the mechanical form of energy to a usable electrical form, with the help of the generator employed in the WECS. Different generators are used for constructing WECS. The squirrel cage induction generator (SCIG) presents advantages such as improved reliability and lower cost, and is simple [3]. Another alternative to SCIG is the doubly fed induction generator (DFIG), which is preferred because it is cheaper when employed with converters. The problem associated with DFIGs is the need for excitation and a gearbox with multiple stages [4,5,6]. The attractive alternative of the permanent magnet synchronous generator (PMSG) is preferred as it presents improved efficiency, reliability, and fault ride through (FRT) capability [7,8,9,10]. An extensive survey on generators employed for WECS is presented in [5,11,12]. The generator output is fed to the rectifier stage for AC–DC conversion. This is followed by the converter stage. This stage houses the algorithms for capturing and tracking power produced by the system. Its output is finally fed to the load/battery or the utility grid.
Numerous types of WTs are available that help to capture the power available in the wind. WTs operating at variable speed (VSWT) and fixed speed (FSWT) are the two essential types of WTs. Mechanically, the FSWT is robust, simple, and cheap compared to the VSWT. FSWTs suffer from the problems of higher mechanical stress, requiring multiple-stage gears, and their operating speed range is limited [11]. For all wind speeds, maximal energy can be extracted using the VSWT. Moreover, the issues associated with FSWTs can be overcome by employing VSWTs [12]. The significant advantage of using VSWTs is that maximal power can be obtained for every wind speed, with a considerable reduction in mechanical stress and fluctuations in the power supply [13,14,15]. Another way of categorizing the WTs is based on the axis of rotation [16]. A WT in which the rotation axis is 90 to the ground is a vertical axis WT (VAWT), whereas for horizontal axis wind turbine (HAWTs), the rotation axis is parallel to the ground. Several problems are associated with VAWTs, such as lower generated power and issues with blade lift forces [17,18]. HAWTs present improved aerodynamic performance. They are cheaper, and balanced drive train loading is observed compared to VAWTs [11]. Most of the drawbacks of VAWTs can be eliminated by the use of HAWTs [12]. The prevalence of the three-blade design in the industry is evident [19].
The power yielded at the WECS output is highly influenced by the variations in wind speed. The greatest benefit of employing a WECS is possible only if the power capture occurs efficiently for every single wind speed. This capture process is reliably performed by the maximum power point tracking (MPPT) algorithm. MPPT algorithms serve a paramount role in the process of capturing and tracking maximum power from WECS. They are classified as indirect power control (IPC), direct power control (DPC), smart MPPT algorithms, and hybrid techniques. Conventional MPPT techniques, such as optimal torque (OT), power signal feedback (PSF), and tip speed ratio (TSR) are grouped as a part of the IPC technique [20,21,22]. The IPC technique involves the pre-calculation of power using the plots of the wind velocities in order to maximize the mechanical power P w i n d . On the other hand, the DPC scheme involves the use of electrical power ( P e l e ) for the turbine operation at the maximum power point (MPP). The DPC control scheme comprises methods such as incremental conductance (INC) [23,24], optimal relation-based (ORB) [25] and perturb and observe (P&O) [26]. The DPC and IPC-based schemes majorly comprise the conventional types of algorithms. The dominant use and popularity of the conventional P&O (CPO) technique is clear from the reviewed literature as it exhibits advantages such as simplicity, no sensor requirement, and ease of implementation. This method suffers from the problem of oscillations around the MPP and lower efficiency under high wind fluctuations [27]. It also suffers from a trade-off between efficiency and tracking speed. They are classified as indirect power control (IPC), direct power control (DPC), smart MPPT algorithms, and hybrid techniques. Conventional MPPT techniques, such as optimal torque (OT), power signal feedback (PSF), and tip speed ratio (TSR) are grouped as a part of the IPC technique [20,21,22]. The IPC technique involves the pre-calculation of power using the plots of the wind velocities in order to maximize the mechanical power P w i n d . On the other hand, the DPC scheme involves the use of electrical power ( P e l e ) for the turbine operation at the maximum power point (MPP). The DPC scheme comprises methods such as incremental conductance (INC) [23,24], optimal-relation-based (ORB) [25] and perturb and observe (P&O) [26]. The DPC- and IPC-based schemes comprise the majority of conventional algorithms.The dominant use and popularity of the conventional P&O (CPO) technique is clear from the reviewed literature, as it exhibits advantages such as simplicity, no sensor requirement, and ease of implementation. This method suffers from the problems of oscillations around the MPP and lower efficiency under high wind fluctuations [27]. It also suffers from a trade-off between efficiency and tracking speed.
Several modified versions of the CPO algorithm based on intelligent MPPT algorithms, soft computing techniques, and hybrid techniques are found in the literature to address these issues. A variety of modifications are also evident in the P&O algorithms, such as the approach adopted in [28], which employs modified P&O along with PSF to overcome the issue of tracking in the wrong direction at high wind fluctuations. Another technique described in [29] addresses issues of the CPO method by adopting the combination of the ORB and CPO methods. In [30], a modified P&O (MPO) method based on the approach of modular sectors is adopted to overcome the drawbacks of CPO. The technique used in [31] is useful in eliminating these CPO drawbacks by employing variable steps along with the model reference adaptive control technique. In [24,32], adaptive steps for the MPO technique are employed, and the tuning of multiple constants for the objective functions results in higher computational complexity. The MPO method described in [33,34,35] adopts the technique of the speed power plot categorized into several regions. Every region has a particular associated value of the step employed. This approach presents the problem of considerable transient overshoot, and the need of sensors for implementing this method is another issue.
Every conventional technique is characterized by its own merits and demerits. To retain the benefits of the conventional techniques and to bypass their drawbacks, two conventional methods are merged together to obtain hybrid techniques. The problems of the conventional methods, especially the CPO technique, are eliminated by the use of a hybrid approach. In [36], the CPO method, when merged with the intelligent fuzzy logic controller (FLC) technique, provides a significant improvement in addressing the mentioned trade-off between efficiency and tracking speed. The work presented in [37] is based on multiple step sizes of different kinds. To decide their employment sequence during the tracking process, higher computational complexity is required.
A great deal of literature is available, which makes it apparent that this is an emerging area, and much research is being carried out to generate and extract maximum power from WECS. A comprehensive review of these control techniques is presented in [38,39,40,41]. The objective of this research is primarily focused on maximizing the generation and extraction of energy from WECS. The problems associated with the conventional techniques are removed by the use of advanced algorithms employing artificial intelligence techniques, neural networks, artificial neural networks, and hybrid techniques, which are either the combination of conventional techniques or the combination of traditional and advanced optimization techniques. Artificial-intelligence-based methods are in trend in recent works, with example such as neural networks (NNs), FLC, and artificial neural networks (ANNs) [41]. However, these are computationally complex and costly, and their practical hardware implementation is difficult.
Recently, a variety of meta-heuristic algorithms have been evident in the literature. Ant colony optimization (ACO) [42], particle swarm optimization (PSO) [43], and grey wolf optimization (GWO) [44] are some of the techniques available in the literature. The technique presented in [45] combines PSO and ORB methods to achieve higher efficiency. These methods present high performance under fluctuating wind speeds but suffer from some issues. They are computationally complex because many iterations are required for the large population size while tracking the MPP. Additionally, the random search mechanism may result in significant power fluctuations for the WECS.
Based on the review of existing MPPT techniques, it is evident that one performance parameter is enhanced at the cost of the others. This reveals that the real challenge is to improve and enhance the performance of the MPPT algorithm for WECS in terms of implementation complexity, oscillations occurring near the MPP, and the system performance under fluctuating wind with faster response. Simpler techniques for addressing the above-mentioned issues are required. Numerical methods have been found to provide solutions to many problems in different fields of computer science, mathematics, and many others in the literature. The use of numerical methods for tracking global MPP in solar photovoltaics is found in [46,47].
The approach presented in this work involves the merging of the trapezoidal rule with the P&O algorithm for tracking the MPP. The trapezoidal rule is a numerical analysis technique that is a simple mathematical approach. It is merged with the CPO technique for tracking the MPP under fluctuating wind speeds for a WECS, and to address the issues described in Table 1.
This work is structured as follows: the Introduction is followed by Section 2, which covers and explains the overall power system and the concept of MPPT and related terminologies. In Section 3, the proposed algorithm is presented. A description of the simulation of a WECS is presented in Section 4. Results and Discussion are presented in Section 5 and Section 6, respectively. The paper is concluded based on the findings presented in Section 7.

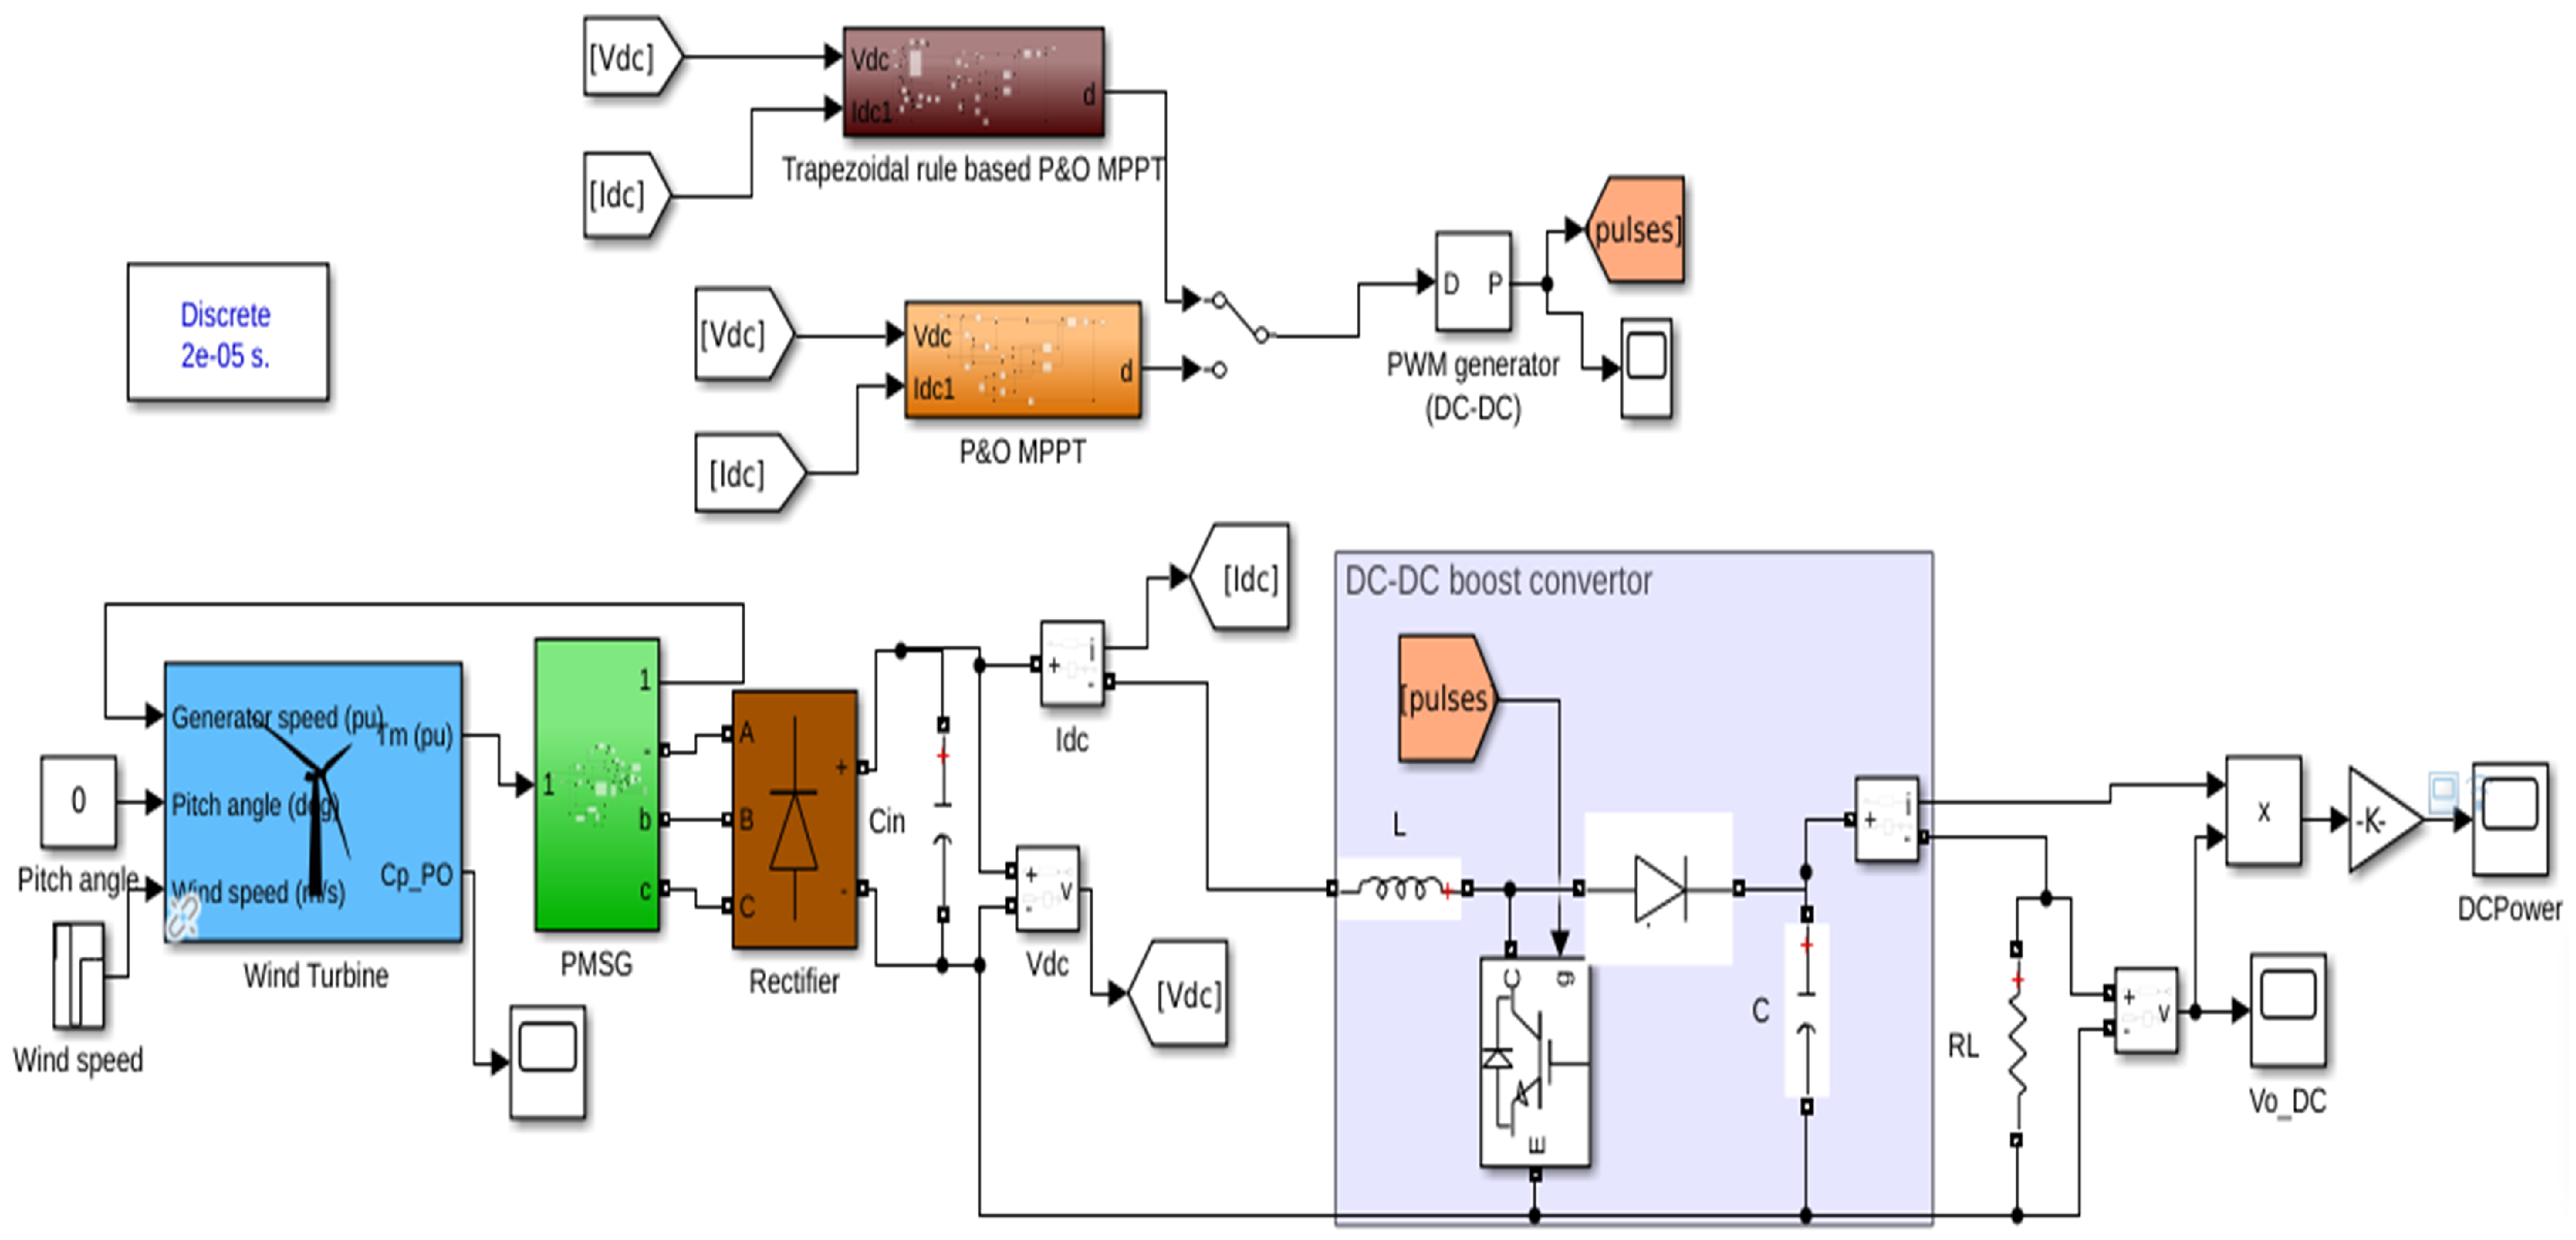
2. Overall Power System with MPPT Algorithm

The overall power system is depicted in Figure 1. The WT output is given to the PMSG, which provides the input to the rectifier. The rectifier output is then given to the boost converter stage. The algorithm is housed in the boost converter. The HAWT is employed to extract wind energy. The mechanical power P m is represented by Equation (1).
P m = 1 2 ρ A V 3 C p ( λ , β )
As per the Betz limit, 59% is actually extracted by the WT from the total available energy contained by the wind. Equation (2) represents the power available in the air, P a i r .
P a i r = 1 2 ρ A V 3
λ = R ω V
In Equation (2) ρ symbolizes the density of air, A symbolizes the area that is swept by the WT blades in m 2 , and V in m/s represents the wind speed. λ in Equation (3) symbolizes the TSR, R symbolizes the WT radius, and ω the angular speed in rad/s. Equations (1)–(4) are as stated in [30].
C p = P w i n d t u r b i n e P a i r
The highest value of the power coefficient C p in Equation (4) is restricted by the Betz limit to be less than 59%. P w i n d t u r b i n e is the power absorbed by the turbine from wind and P a i r represents the power present in the wind. The pitch angle is represented by β . C p is a function based on the values of λ and β .

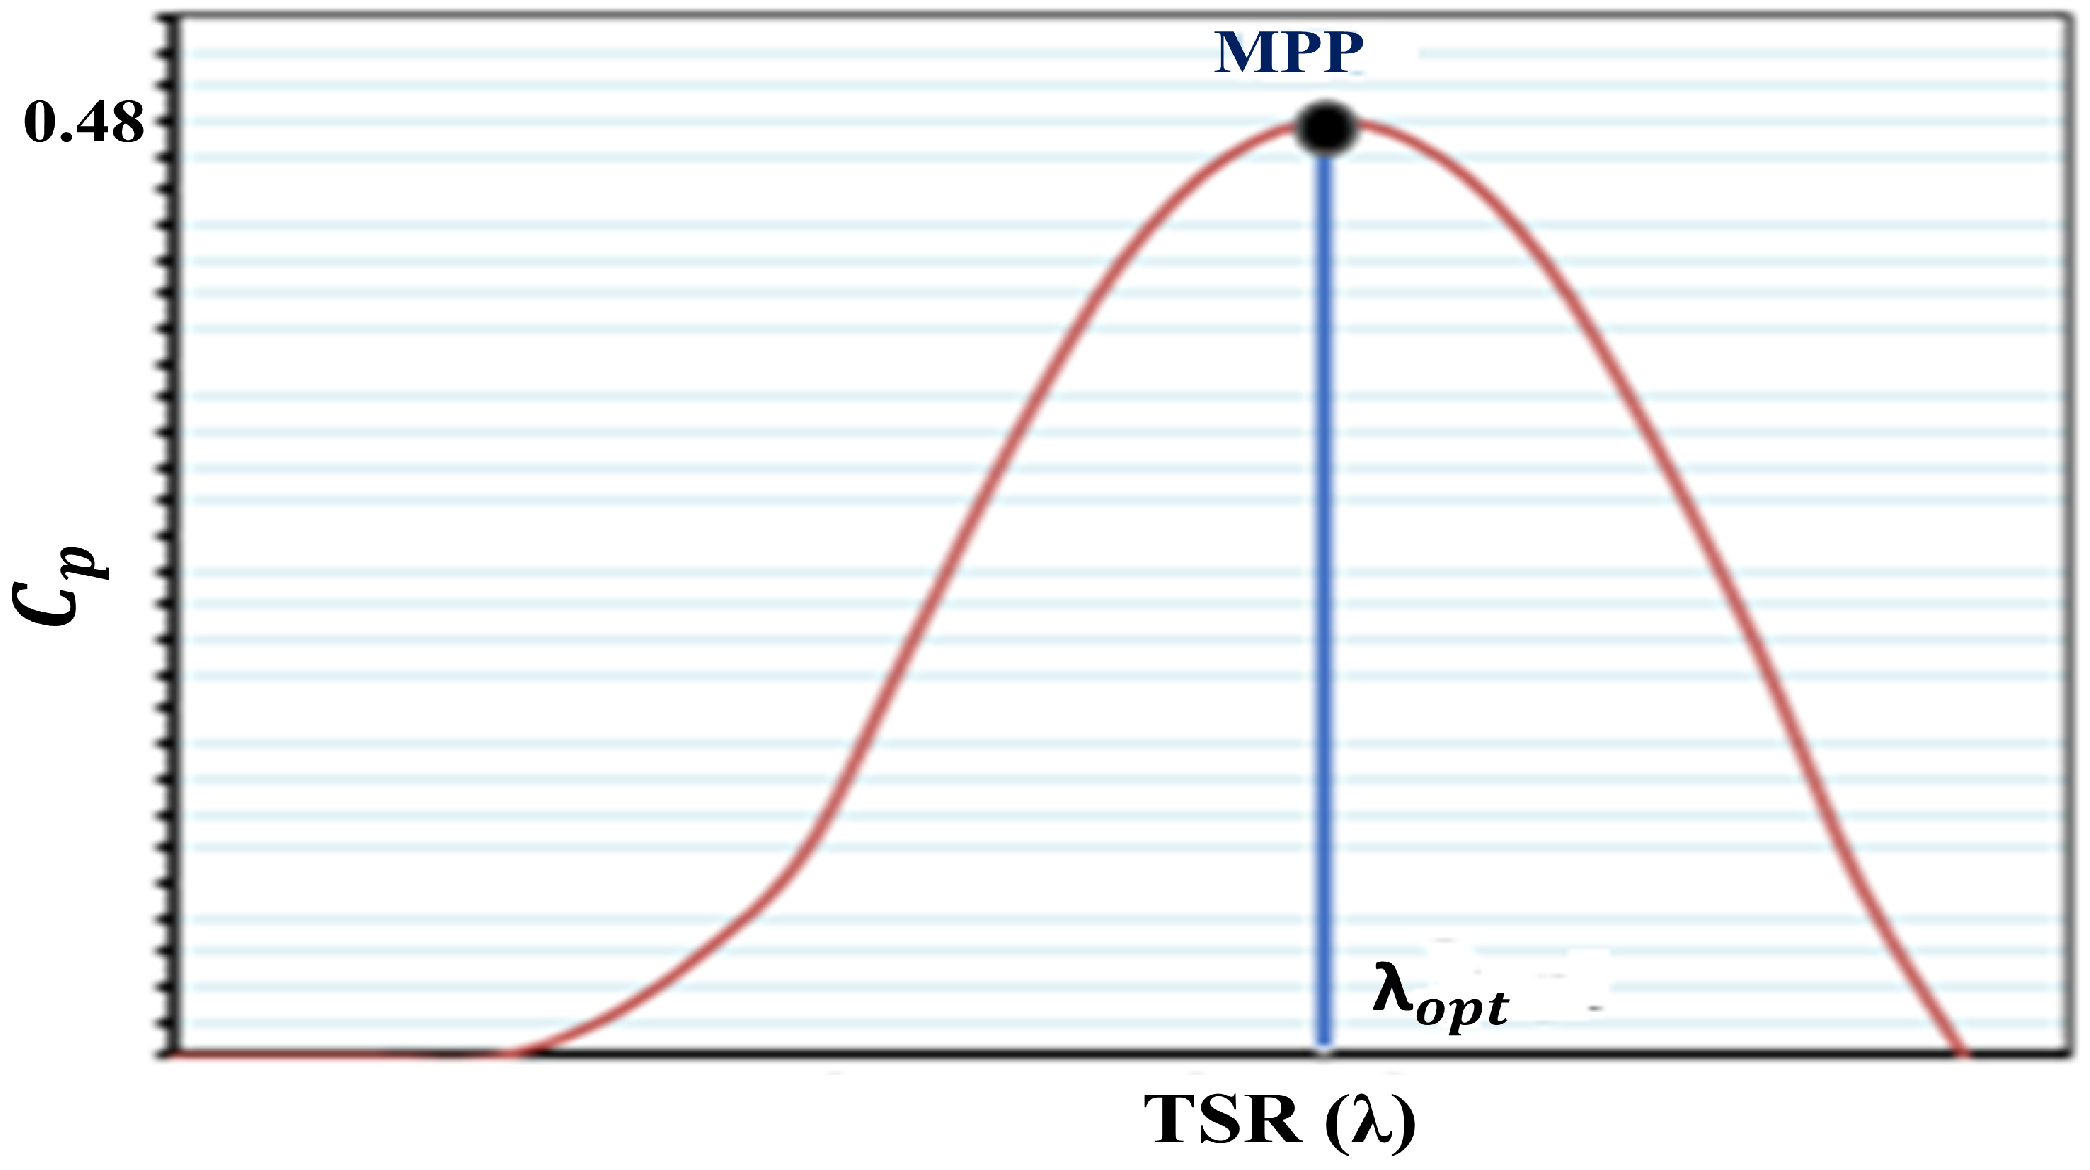
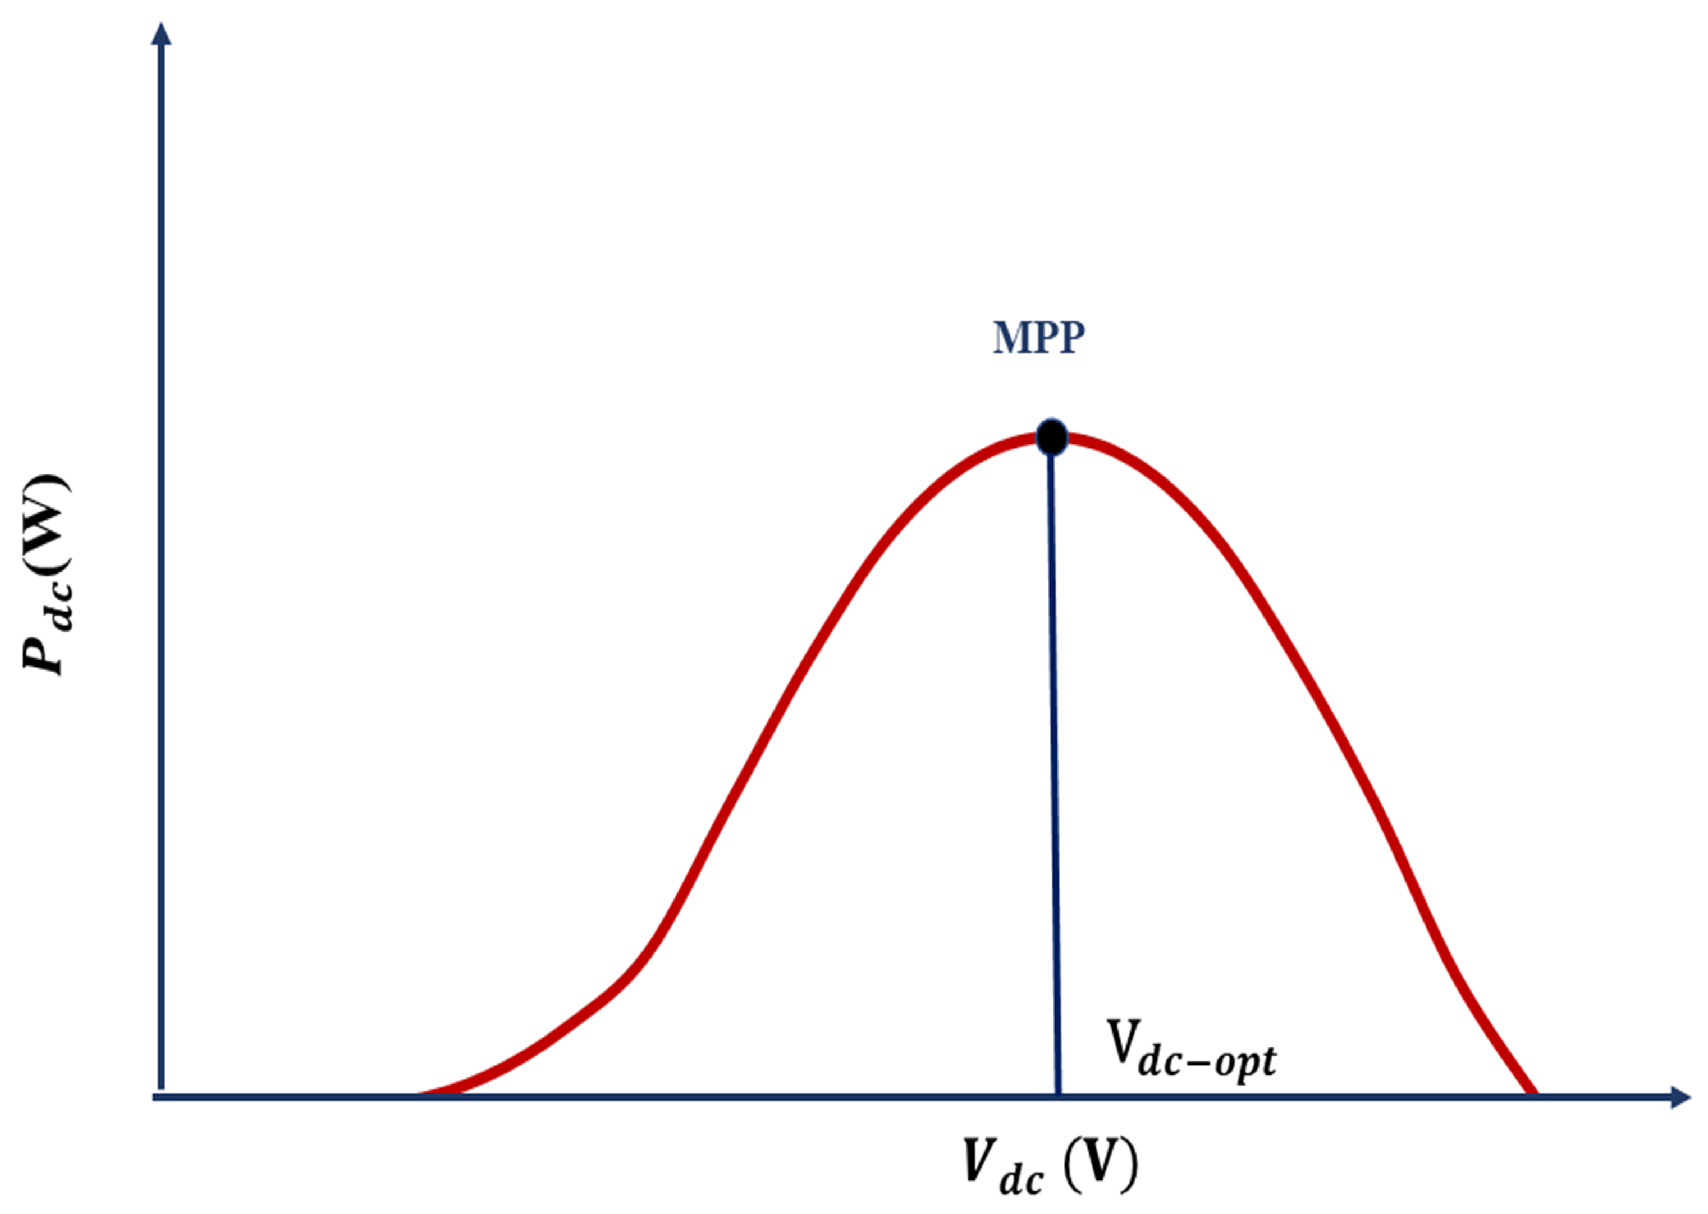
Concept of MPPT and Related Terminologies

Figure 2 depicts the relationship among the variables C p and TSR. It is evident from the graph that C p has the highest value C p m a x of 0.48 for a specific value of λ . As shown in Figure 3, the various operating regions of the WECS can be observed. For wind speeds below the cut-in value, there is no generation of power. Useful power is obtained at the rated speed. The extraction of maximum power takes place in the second region, which is between the V c u t i n and the V r a t e d speeds. This region of operation is critically important for the extraction of maximum power. A great deal of literature is available that describes several MPPT controllers that use this region for capturing maximum power.
Figure 4 demonstrates the basic concept of MPPT for a WECS. Most of the MPPT methods available in the literature utilize the region two of operation for implementing the MPPT algorithm for the purpose of tracking the MPP for WECS. Wind, being varying in nature, makes it necessary to employ techniques to extract maximum power. The kind of control strategy employed to capture maximum power greatly influences the WECS’s performance. The extraction of maximum power is a major challenge under extreme wind speed fluctuations.

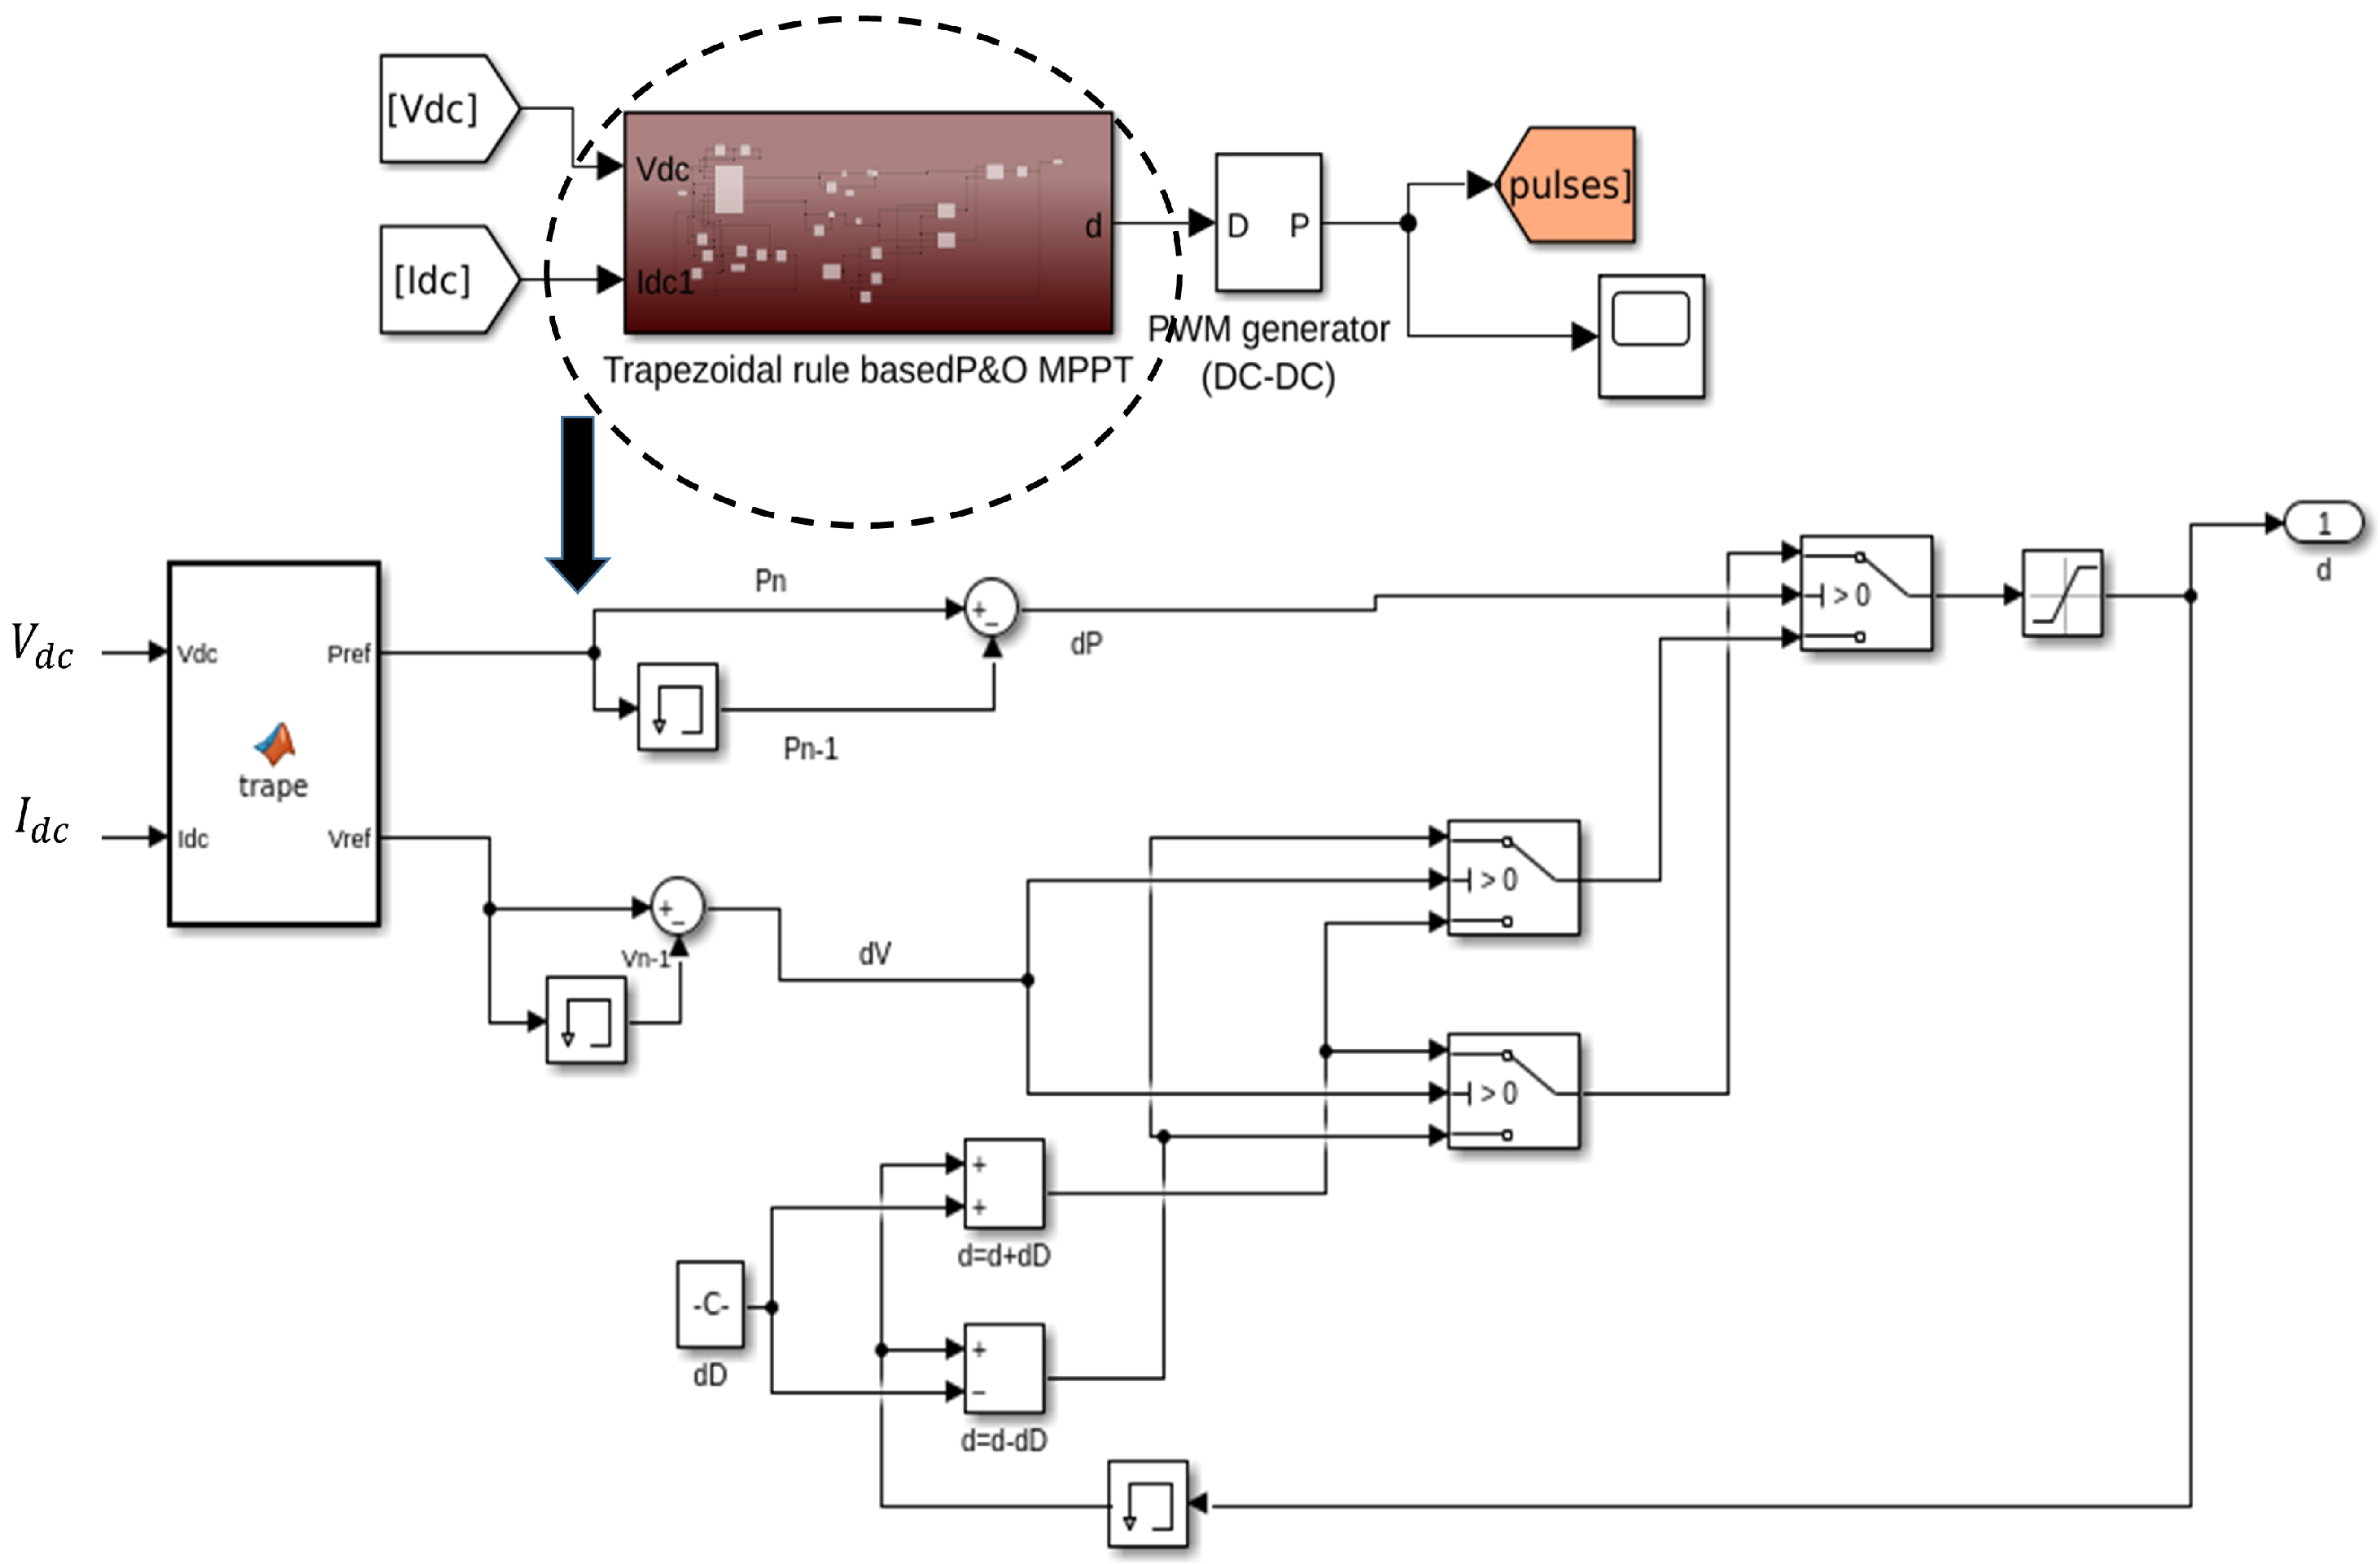
3. Proposed Algorithm

The CPO technique employs the approach of periodically perturbing the voltage, and a comparison is made between the previous and current values of power, as in Figure 5. Initially the rectifier voltage and current values are measured and used to calculate P d c . The value of Δ P d c is calculated by subtracting the previous and present values of P d c , whereas the value of Δ V d c is found by subtracting the previous and present values of V d c . Positive changes in power imply the correct approach towards MPP; otherwise, the perturbation sign is reversed. This makes the selection of the step size critical, as a larger step implies a faster response, but greater oscillations are found near the MPP, while a smaller step size implies a slower response with reduced power loss.
The approach presented in this work uses the trapezoidal rule in order to provide an appropriate path for tracking the MPP. The trapezoidal rule is a numerical analysis technique employed to approximate the definite integral. The basic concept of the trapezoidal rule is depicted in Figure 6. It involves the computation of the area of the given region by dividing it into trapezoids of equal width. The trapezoidal rule formula is presented in Equation (5). More accurate results can be obtained by segmenting the interval [c, d] into n intervals, each of which has a width of w. The value of w is presented in Equation (6).
c d f ( y ) d c 2 ( f ( c ) + f ( d ) )
w = d c n
Using nodes that are uniformly placed, the formula for the composite trapezoidal rule is specified in Equation (7).
y n = y 0 + n ∗ w for n = 0, 1, 2, 3, …m.
y ( n 1 ) y ( n ) f ( y ) y ( n ) y ( n 1 ) f ( y ( n ) ) + f ( y ( n 1 ) ) 2
The presented approach involves the merging of the trapezoidal rule with the P&O algorithm for tracking the MPP to remove the defects from the existing algorithms, such as oscillations in the output power, higher computational complexity, and lower tracking speed. It is evident from Figure 7 that for an optimal value of V d c , optimal DC power can be obtained. This value is used for the tracking process.
The working of the proposed algorithm can be summarized and described briefly in three basic steps. These steps are described below as depicted in Figure 8 and Figure 9.
  • Step 1 The first step of the algorithm employs the trapezoidal rule and divides the P d c V d c curve into trapezoids of equal width using the formula for the trapezoidal rule.
  • Step 2 In the second stage, the adjacent trapezoids are compared with respect to area, and the trapezoid with the maximum area (and hence power) is identified.
  • Step 3 In the third and last step of the algorithm, the values of voltage ( V r e f ) and power ( P r e f ) from this identified trapezoid are updated, and based on these updated values, the P&O technique is employed for tracking the MPP.
Figure 10 presents the step-by-step procedure of the algorithm. Initially, the rectifier voltage and current values are measured, and they serve as the inputs for the MPPT algorithm. The product of the measured values of V d c and I d c yields the value of P d c . The difference between the previous and present values of V d c is given by Δ V d c , whereas the difference between the previous and present values of P d c is given by Δ P d c . The next step involves the application of the trapezoidal rule formula to compute the area of each trapezoid lying on the P d c V d c curve having equal width dV, as shown in Figure 6. The difference in the areas of the previous and present trapezoid is represented by dA. This value is used for updating the reference values of area, power, and voltage, A r e f , P r e f , and V r e f , respectively, based on the comparison. This is followed by the comparison of the area of each trapezoid with the reference value of the area in order to identify the trapezoid possessing the maximum area and power. On the basis of this comparison, the values of P r e f and V r e f are updated. The final updated values of P r e f and V r e f are passed on further as inputs to the CPO algorithm, which finally tracks the MPP. The step size employed here is extremely small. The trapezoid corresponding to the largest area and power is utilized for the implementation of the CPO algorithm.

4. Simulation of the Proposed Algorithm
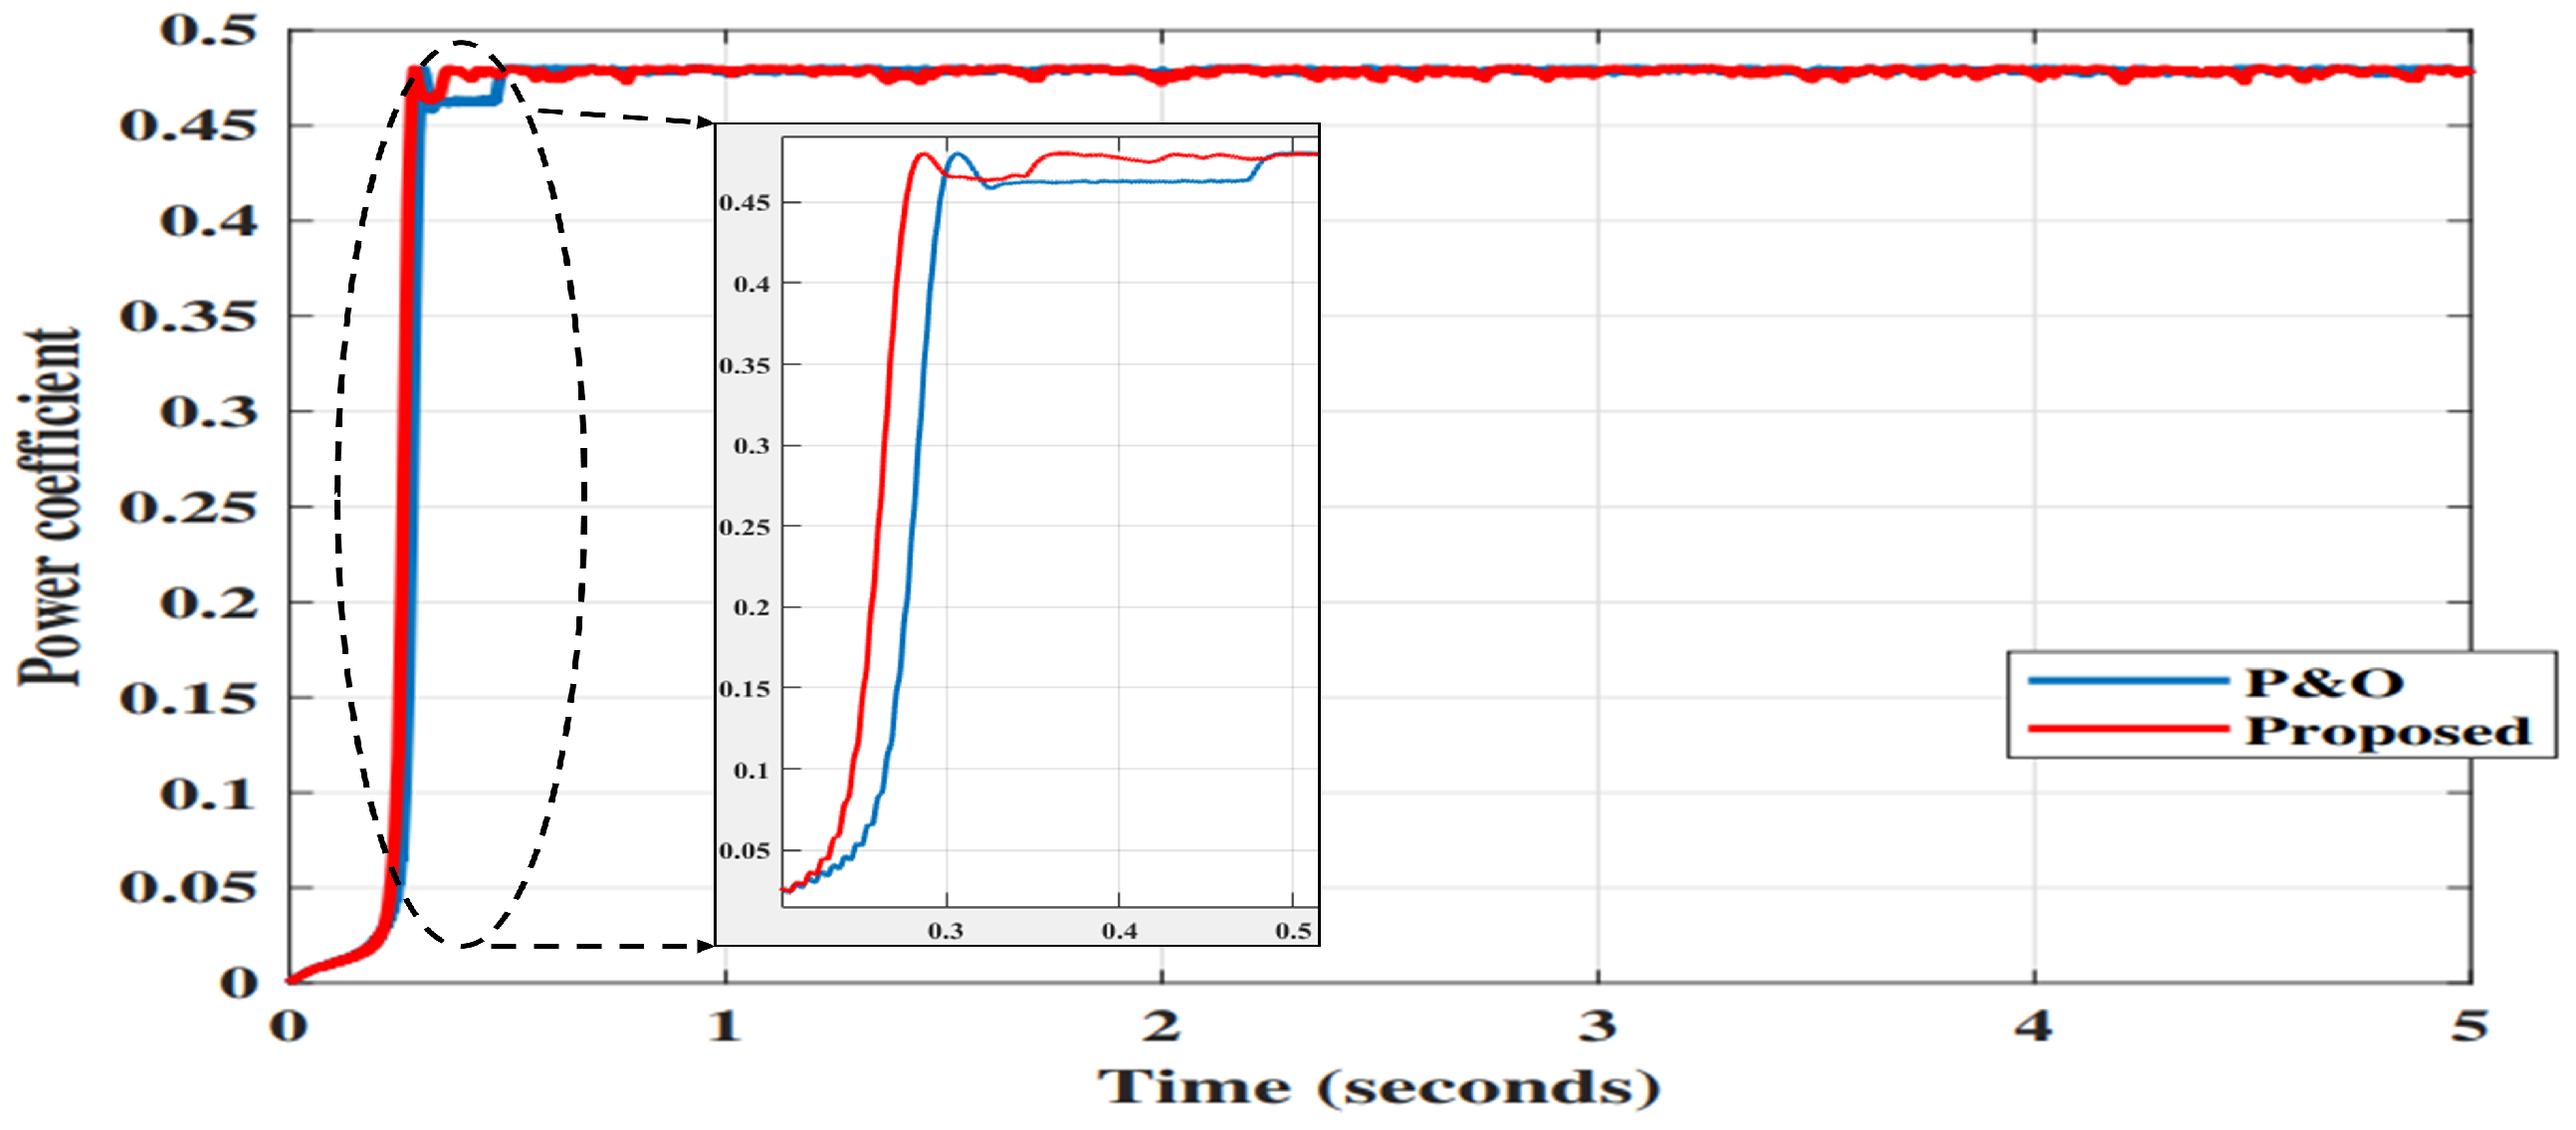
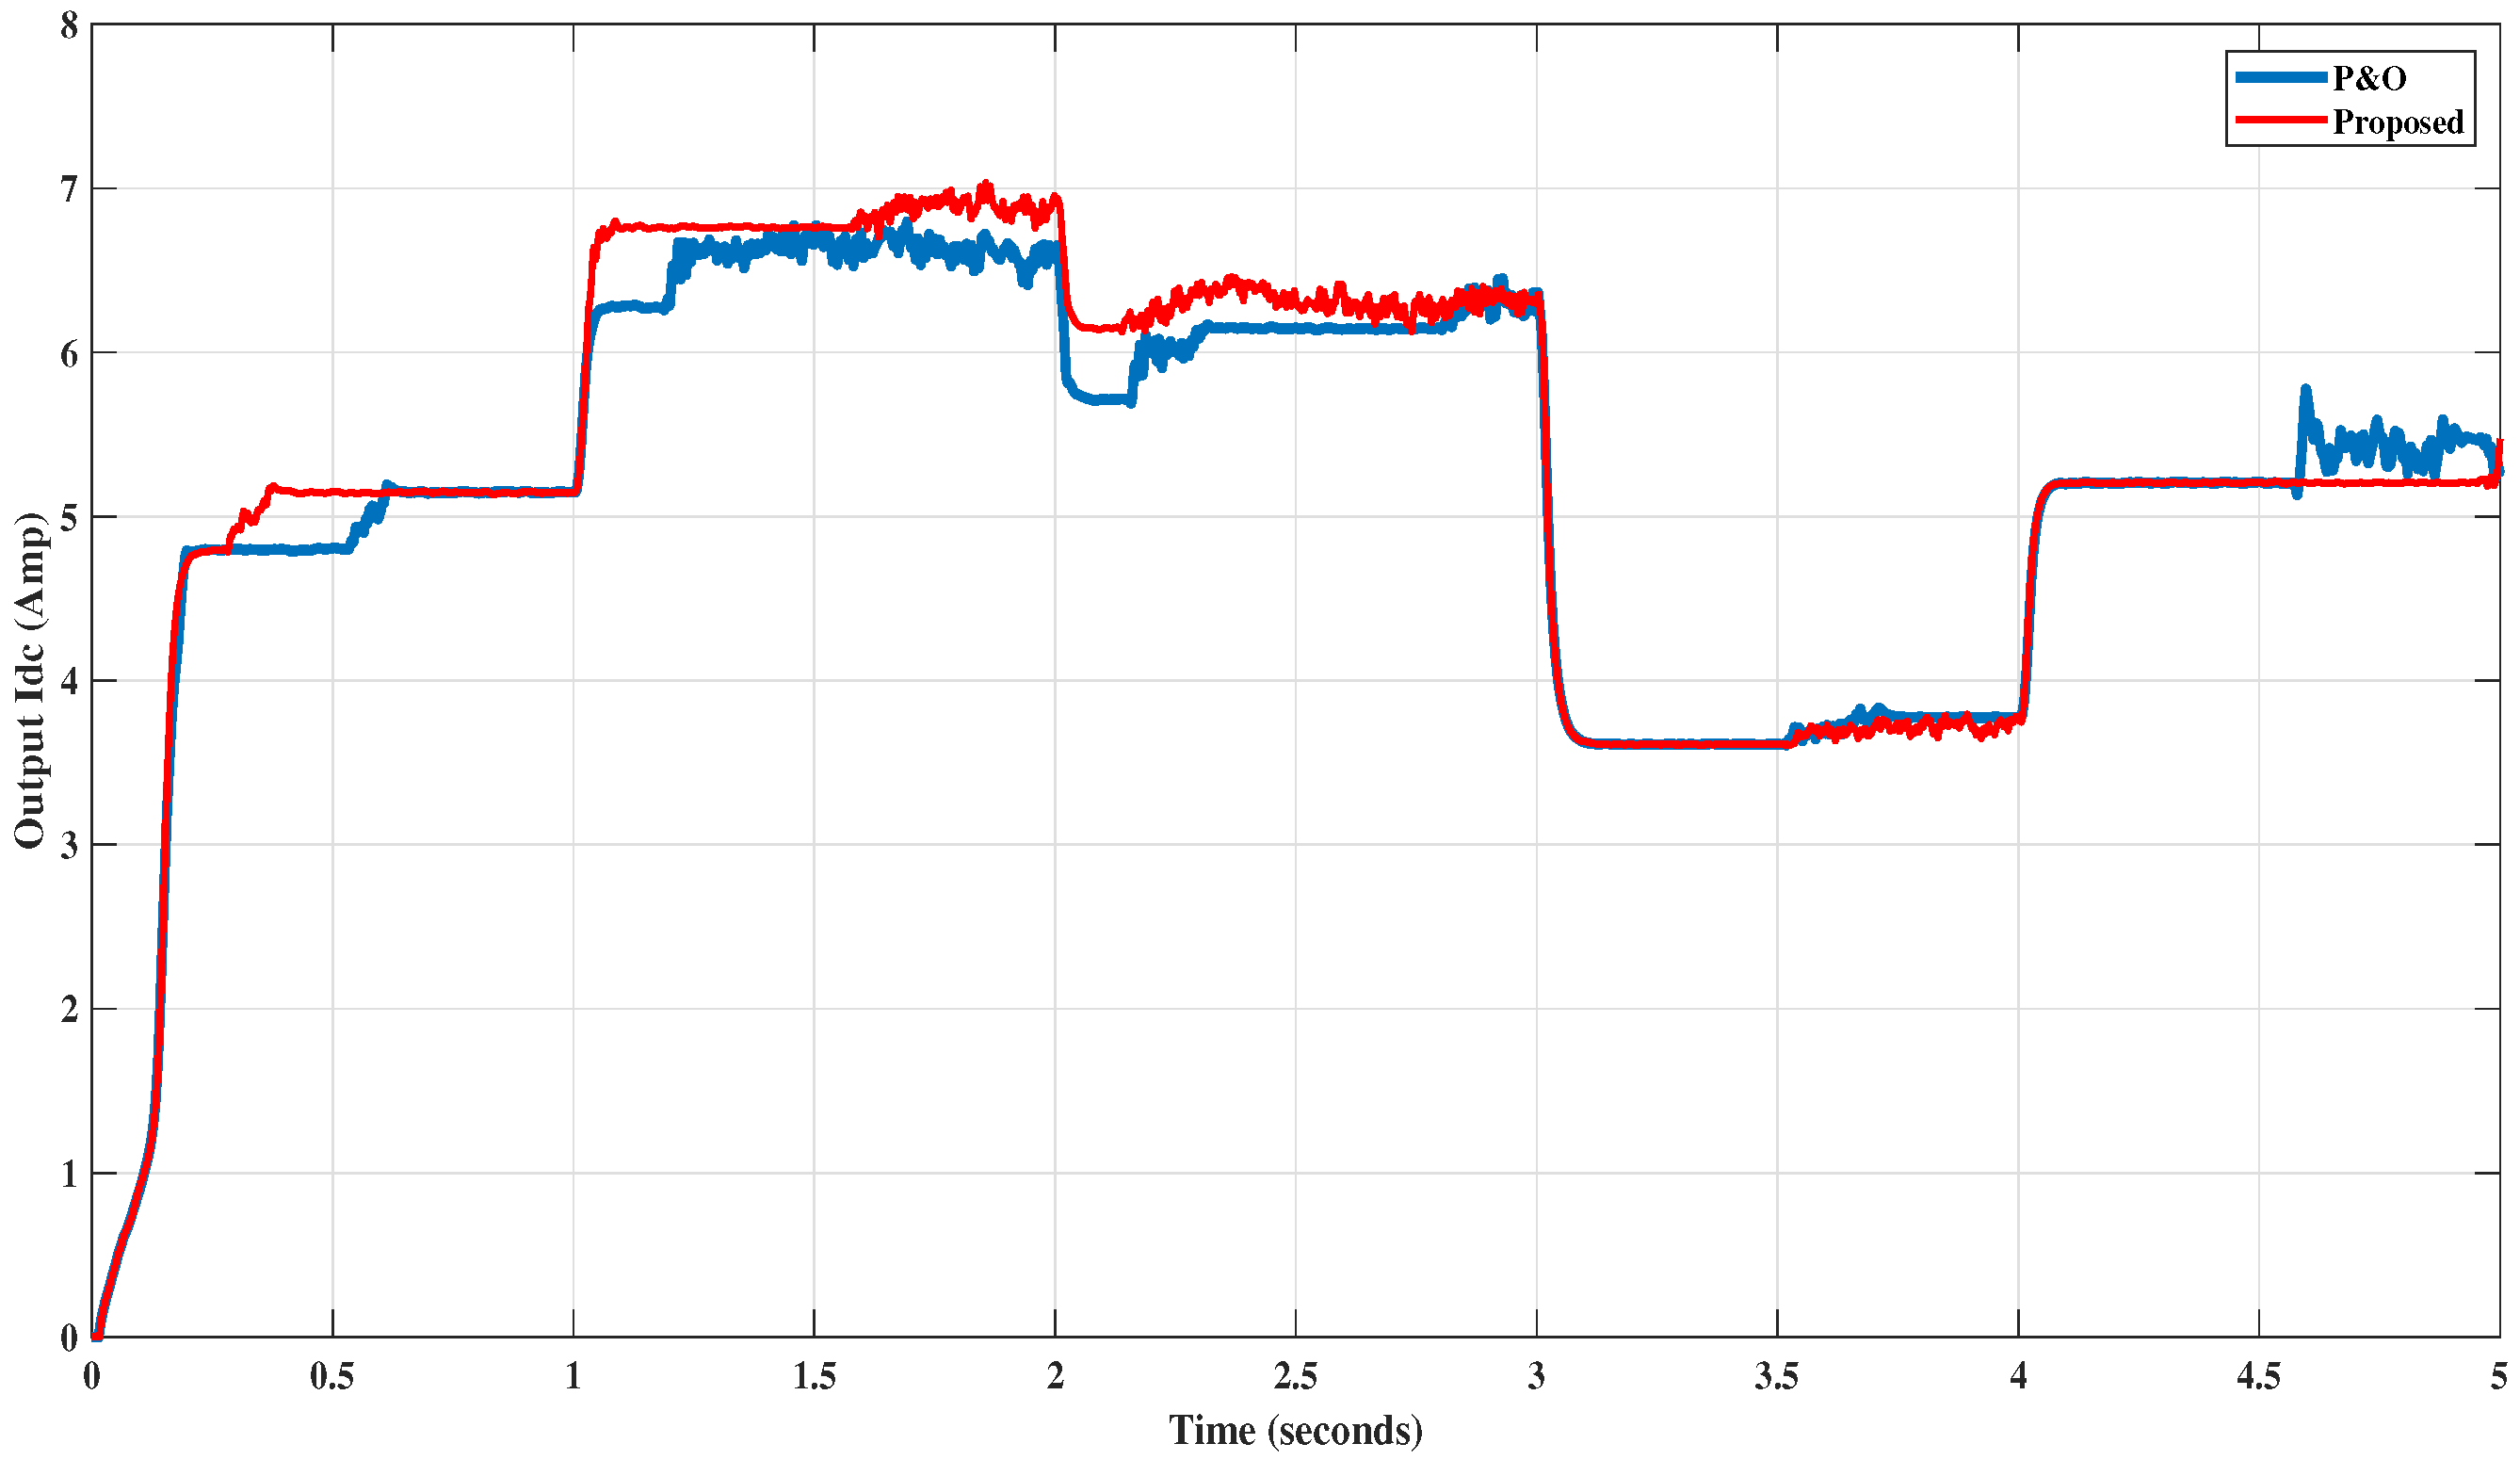
This section presents the MATLAB/SIMULINK model of a 3 KW WECS to evaluate the performance of the proposed technique and the CPO method. The power rating of the WT and PMSG is 3 KW. The various parameters used for building the WT, PMSG, and the boost converter blocks are depicted in Table 2. Figure 11 depicts the MATLAB/SIMULINK model of the proposed and P&O method. The specifications of the WT, PMSG, and the boost converter for simulation are depicted in Table 2. The simulations were carried out using the ode4 (Runge–Kutta) solver.
The system is simulated with the input of changing wind speeds for a duration of 5 s. The wind speed is varied randomly from a minimum speed of 7 m/s to a maximum wind speed of 12 m/s. The wind speeds are varied in a random sequence of 10 m/s, 12 m/s, 11 m/s, 7 m/s and 9 m/s. The CPO algorithm and the proposed algorithm are both simulated using the same system parameters, as depicted in Figure 11. The inputs to the MPPT block for the CPO method as well as the proposed method are the DC voltage and current from the output of the rectifier stage. Figure 12 depicts the block for the CPO method. The inputs given to the P&O block are the rectified voltage and current V d c and I d c . The output of this block is the duty cycle d given to the pulse width modulator (PWM) generator block. The pulses produced by this block are then given to the boost converter stage for producing the output power. Figure 13 shows the SIMULINK block for the simulation of the proposed algorithm. The MATLAB function trape block is used to apply the trapezoidal rule. It receives the inputs I d c and V d c from the rectifier stage. These values are then used by the MATLAB function to apply the trapezoidal rule and identify the trapezoid with the largest area and power. The outputs of the MATLAB function, power and voltage reference, are passed on to apply the CPO method for tracking the MPP. The output of this block is again the duty cycle, denoted by d. The memory blocks are used to obtain the previous state.
The pulses generated and controlled by the steps of the algorithm are given to the switching element of the boost converter, which help in capturing the power at the output. The comparative power coefficient, output power, output voltage and current of the CPO and the proposed algorithm are presented in blue and red plots varying with respect to time, respectively.
To prove the superiority of the proposed algorithm, it was compared with the dominantly adopted technique in the literature, the P&O algorithm. The output DC power is maximal for the wind speed of 12 m/s for both methods.

5. Results

The MATLAB/SIMULINK model of a WECS for the proposed technique and the conventional P&O method are shown in the previous section. Table 2 provides the parameters for the simulated system. The variable wind profile is shown in Figure 14. Figure 15 depicts the power coefficient of P&O (in red) and the proposed method (in blue) comparatively at fixed wind speed. The zoomed section of the power coefficient reveals the improvement achieved by the proposed method. It is evident that the proposed technique provides higher output power than the P&O method. The proposed algorithm yields better P d c at the output as comparatively seen in Figure 16. A zoomed section of the output P d c is depicted in Figure 17, which clearly shows that at wind speeds of 10 m/s, 12 m/s, and 11 m/s denoted by sections A, B, and C, the power obtained for the proposed algorithm is considerably greater than that obtained for the CPO method. For sections A, B, and D, the oscillations are also found to be reduced. Figure 18 depicts better yielded V d c at the output. Figure 19 shows the zoomed sections of the output voltage, which clearly shows that at wind speeds of 10 m/s, 12 m/s, and 11 m/s denoted by sections A, B, and C, the voltage obtained for the proposed algorithm is considerably greater than that obtained for the CPO method. The output I d c is presented in Figure 20. The zoomed sections in Figure 21 depict the improvement in the output current. For both methods, maximal DC output power is obtained at the wind speed of 12 m/s. There is a 3.7%, 1.5%, and 1.45% increase in the obtained output DC power, voltage, and current, respectively, by adopting the proposed method in comparison to the CPO technique.

6. Discussion

Several MPPT techniques can be found in the literature for tracking the MPP. It is evident that one performance parameter is enhanced at the cost of the others. This reveals that the real challenge is to improve and enhance the performance of the algorithm employed for WECS based on implementation complexity, oscillations occurring near the MPP, and the performance under wind fluctuations with faster response. Simple techniques for addressing the issues of complex MPP tracking processes and higher dependency on the accuracy and convergence of the solution obtained by the metaheuristic method are required. The latest hybrid techniques evident in the literature are found to be very efficient, but they suffer from implementation complexity, as the tracking process employed is complex for these methods. This issue can be very well addressed by the combination of numerical methods with existing techniques. Numerical techniques have been found to provide solutions to several problems in the fields of computer science, mathematics, and many others in the literature. An approach based on the combination of the trapezoidal rule and CPO is presented in this work. The simulation results indicate better yielded power and voltage as compared to the CPO method. Moreover, this method does not require any sensor. Simplicity, no requirement of sensors, and better performance can be achieved with very low computational complexity using this method. Future work can be carried out involving the combination of numerical methods with other conventional, modified, hybrid, or smart techniques to eliminate the drawbacks in the available algorithms and implement simple implementation techniques for achieving faster and better tracking of the MPP for WECS.

7. Conclusions

A wide variety of techniques can be found in the literature available for the tracking of the MPP for WECS. However, simpler techniques for addressing the issues of complex MPP tracking processes and higher dependency of the accuracy and convergence on the solution obtained by the metaheuristic method are required. This work presents a new approach for tracking the MPP for WECS by employing the combination of the trapezoidal rule and the P&O algorithm. The algorithm works in a three-step process by dividing the P d c V d c curve by the trapezoidal rule, identifying the trapezoid with the largest area and power and then applying the CPO algorithm in the identified trapezoid to track the MPP. The system was simulated in MATLAB/SIMULINK. The inputs for this method are the DC voltage and the current from the rectifier stage. This technique requires no sensors. To prove the superiority of the proposed algorithm, it was compared with the dominantly adopted technique in the literature, the P&O algorithm. It is evident from the graphs plotted for the output DC power and voltage that there are 3.7%, 1.5%, and 1.45% increases in the obtained DC power, voltage, and current, respectively, at the output by employing the proposed method in comparison to the CPO technique. The simulation results indicate that the proposed approach yields better voltage and power than the CPO technique. The complexity of implementation is found to be reduced to a great extent with the presented method. Future directions include the combination of numerical methods with other conventional, modified, intelligent, and hybrid techniques to eliminate the drawbacks in the available algorithms and implement simple implementation techniques for achieving faster and better tracking of the MPP for WECS.

Author Contributions

Conceptualization, J.P. and P.N.; methodology, J.P.; software, J.P.; validation, J.P. and P.N.; formal analysis, J.P.; investigation, J.P.; resources, J.P.; data curation, J.P.; writing—original draft preparation, J.P.; writing—review and editing, J.P. and P.N.; visualization, J.P.; supervision, J.P. and P.N.; project administration, J.P.; funding acquisition, P.N. All authors have read and agreed to the published version of the manuscript.

Funding

This research received no external funding.

Institutional Review Board Statement

Not applicable.

Informed Consent Statement

Not applicable.

Data Availability Statement

Not applicable.

Acknowledgments

The authors would like to thank Symbiosis International (Deemed University) for the constant encouragement and support.

Conflicts of Interest

The authors declare no conflict of interest.

Abbreviations

A list of the abbreviations used is given below:
WTWind turbine
WECSWind energy conversion system
MPPMaximum power point
MPPTMaximum power point tracking
P&OPerturb and observe
VAWTVertical axis wind turbine
HAWTHorizontal axis wind turbine
VSWTVariable speed wind turbine
FSWTFixed speed wind turbine
SCIGSquirrel cage induction generator
DFIGDoubly fed induction generator
PMSGPermanent magnet synchronous generator
FRTFault ride through
IPCIndirect power control
DPCDirect power control
TSRTip speed ratio
PSFPower signal flow
OTOptimal torque
INCIncremental conductance
ORBOptimal-relation-based
NNNeural network
ANNArtificial neural network
FLCFuzzy logic control
PIDProportional integral derivative
MVPOMultivariable perturb and observe
CPOConventional perturb and observe
MPOModified perturb and observe
CSCuckoo search
PSOParticle swarm optimization
ACOAnt colony optimization
TLBOTeaching learning based optimization

References

  1. Kaldellis, J.K.; Apostolou, D. Life cycle energy and carbon footprint of offshore wind energy. Comparison with onshore counterpart. Renew. Energy 2017, 108, 72–84. [Google Scholar] [CrossRef]
  2. Aliyu, A.K.; Modu, B.; Tan, C.W. A review of renewable energy development in Africa: A focus in South Africa, Egypt and Nigeria. Renew. Sustain. Energy Rev. 2018, 81, 2502–2518. [Google Scholar] [CrossRef]
  3. Egea-Alvarez, A.; Junyent-Ferre, A.; Bergas-Jané, J.; Bianchi, F.D.; Gomis-Bellmunt, O. Control of a wind turbine cluster based on squirrel cage induction generators connected to a single VSC power converter. Int. J. Electr. Power Energy Syst. 2014, 61, 523–530. [Google Scholar] [CrossRef]
  4. Rajaei, A.; Mohamadian, M.; Yazdian Varjani, A. Vienna-rectifier-based direct torque control of PMSG for wind energy application. IEEE Trans. Ind. Electron. 2013, 60, 2919–2929. [Google Scholar] [CrossRef]
  5. Singh, M.; Chandra, A. Application of adaptive network-based fuzzy inference system for sensorless control of PMSG-based wind turbine with nonlinear-load-compensation capabilities. IEEE Trans. Power Electron. 2011, 26, 165–175. [Google Scholar] [CrossRef]
  6. Chen, Z.; Guerrero, J.M.; Blaabjerg, F. A review of the state of the art of power electronics for wind turbines. IEEE Trans. Power Electron. 2009, 24, 1859–1875. [Google Scholar] [CrossRef]
  7. Linus, R.M.; Damodharan, P. Maximum power point tracking and grid feeding of permanent magnet synchronous generator based wind energy conversion system using modified hill climb searching algorithm. In Proceedings of the India International Conference on Power Electronics, IICPE, Delhi, India, 6–8 December 2012; pp. 1–6. [Google Scholar] [CrossRef]
  8. Zhang, Z.; Zhao, Y.; Qiao, W.; Qu, L. A space-vector-modulated sensorless direct-torque control for direct-drive PMSG wind turbines. IEEE Trans. Ind. Appl. 2014, 50, 2331–2341. [Google Scholar] [CrossRef]
  9. Xie, D.; Lu, Y.; Sun, J.; Gu, C. Small signal stability analysis for different types of PMSGs connected to the grid. Renew. Energy 2017, 106, 149–164. [Google Scholar] [CrossRef]
  10. Uehara, A.; Pratap, A.; Goya, T.; Senjyu, T.; Yona, A.; Urasaki, N.; Funabashi, T. A coordinated control method to smooth wind power fluctuations of a PMSG-Based WECS. IEEE Trans. Energy Convers. 2011, 26, 550–558. [Google Scholar] [CrossRef]
  11. Duran, M.J.; Barrero, F.; Pozo-Ruz, A.; Guzman, F.; Fernandez, J.; Guzman, H. Understanding power electronics and electrical machines in multidisciplinary wind energy conversion system courses. IEEE Trans. Educ. 2013, 56, 174–182. [Google Scholar] [CrossRef]
  12. Cheng, M.; Zhu, Y. The state of the art of wind energy conversion systems and technologies: A review. Energy Convers. Manag. 2014, 88, 332–347. [Google Scholar] [CrossRef]
  13. Singh, G.K. Self-excited induction generator research—A survey. Electr. Power Syst. Res. 2004, 69, 107–114. [Google Scholar] [CrossRef]
  14. Patel, M.R. Wind and solar power systems: Design, analysis, and operation, second edition. J. Environ. Energy 2005, 35, 692. [Google Scholar] [CrossRef]
  15. Kumar, D.; Chatterjee, K. Artificial bee colony based MPPT algorithm for wind energy conversion system. In Proceedings of the 2016 IEEE 6th International Conference on Power Systems, ICPS 2016, New Delhi, India, 4–6 March 2016. [Google Scholar] [CrossRef]
  16. Mittal, R.; Sandhu, K.; Jain, D. An Overview of Some Important Issues Related to Wind Energy Conversion System (WECS). Int. J. Environ. Sci. Dev. 2010, 1, 351–363. [Google Scholar] [CrossRef] [Green Version]
  17. Aslam Bhutta, M.M.; Hayat, N.; Farooq, A.U.; Ali, Z.; Jamil, S.R.; Hussain, Z. Vertical axis wind turbine—A review of various configurations and design techniques. Renew. Sustain. Energy Rev. 2012, 16, 1926–1939. [Google Scholar] [CrossRef]
  18. Njiri, J.G.; Söffker, D. State-of-the-art in wind turbine control: Trends and challenges. Renew. Sustain. Energy Rev. 2016, 60, 377–393. [Google Scholar] [CrossRef]
  19. Pao, L.Y.; Johnson, K.E. Control of Wind Turbines: Approaches, challenges, and recent developments. IEEE Control Syst. 2011, 31, 44–62. [Google Scholar] [CrossRef]
  20. Castelló, J.; Espí, J.M.; García-Gil, R. Development details and performance assessment of a Wind Turbine Emulator. Renew. Energy 2016, 86, 848–857. [Google Scholar] [CrossRef]
  21. Ghaffari, A.; Krstić, M.; Seshagiri, S. Power optimization and control in wind energy conversion systems using extremum seeking. IEEE Trans. Control Syst. Technol. 2014, 22, 1684–1695. [Google Scholar] [CrossRef]
  22. Taveiros, F.E.; Barros, L.S.; Costa, F.B. Back-to-back converter state-feedback control of DFIG (doubly-fed induction generator)-based wind turbines. Energy 2015, 89, 896–906. [Google Scholar] [CrossRef]
  23. Abdullah, M.A.; Yatim, A.H.; Tan, C.W.; Saidur, R. A review of maximum power point tracking algorithms for wind energy systems. Renew. Sustain. Energy Rev. 2012, 16, 3220–3227. [Google Scholar] [CrossRef]
  24. Youssef, A.R.; Mousa, H.H.; Mohamed, E.E. Development of self-adaptive P&O MPPT algorithm for wind generation systems with concentrated search area. Renew. Energy 2020, 154, 875–893. [Google Scholar] [CrossRef]
  25. Mei, Q.; Shan, M.; Liu, L.; Guerrero, J.M. A novel improved variable step-size incremental-resistance MPPT method for PV systems. IEEE Trans. Ind. Electron. 2011, 58, 2427–2434. [Google Scholar] [CrossRef]
  26. Lahfaoui, B.; Zouggar, S.; Mohammed, B.; Elhafyani, M.L. Real Time Study of P&O MPPT Control for Small Wind PMSG Turbine Systems Using Arduino Microcontroller. Energy Procedia 2017, 111, 1000–1009. [Google Scholar] [CrossRef]
  27. Kazmi, S.M.R.; Goto, H.; Guo, H.J.; Ichinokura, O. A novel algorithm for fast and efficient speed-sensorless maximum power point tracking in wind energy conversion systems. IEEE Trans. Ind. Electron. 2011, 58, 29–36. [Google Scholar] [CrossRef]
  28. Chen, J.; Lin, T.; Wen, C.; Song, Y. Design of a Unified Power Controller for Variable-Speed Fixed-Pitch Wind Energy Conversion System. IEEE Trans. Ind. Electron. 2016, 63, 4899–4908. [Google Scholar] [CrossRef]
  29. Ahmed, S.; Rashid, M.A.; Mohamed, S.B.; Yaakob, S.B. A Novel Maximum Power Point Tracking Algorithm for Wind Energy Conversion System. Eng. Lett. 2019, 27, 822–830. [Google Scholar]
  30. Mousa, H.H.; Youssef, A.R.; Mohamed, E.E. Variable step size P&O MPPT algorithm for optimal power extraction of multi-phase PMSG based wind generation system. Int. J. Electr. Power Energy Syst. 2019, 108, 218–231. [Google Scholar] [CrossRef]
  31. Ali, M.M.; Youssef, A.R.; Ali, A.S.; Abdel-Jaber, G.T. Variable step size PO MPPT algorithm using model reference adaptive control for optimal power extraction. Int. Trans. Electr. Energy Syst. 2020, 30, 1–21. [Google Scholar] [CrossRef]
  32. Mozafarpoor-Khoshrodi, S.H.; Shahgholian, G. Improvement of perturb and observe method for maximum power point tracking in wind energy conversion system using fuzzy controller. Energy Equip. Syst. 2016, 4, 111–122. [Google Scholar] [CrossRef]
  33. Mousa, H.H.; Youssef, A.R.; Mohamed, E.E. Adaptive P&O MPPT algorithm based wind generation system using realistic wind fluctuations. Int. J. Electr. Power Energy Syst. 2019, 112, 294–308. [Google Scholar] [CrossRef]
  34. Youssef, A.R.; Ali, A.I.; Saeed, M.S.; Mohamed, E.E. Advanced multi-sector P&O maximum power point tracking technique for wind energy conversion system. Int. J. Electr. Power Energy Syst. 2019, 107, 89–97. [Google Scholar] [CrossRef]
  35. Hassan Abdou, E.; Youssef, A.R.; Kamel, S.; Aly, M. Sensor Less Proposed Multi Sector Perturb and Observe Maximum Power Tracking for 1.5 MW Based on DFIG. J. Control. Instrum. Eng. 2020, 6, 1–13. [Google Scholar] [CrossRef]
  36. Chaicharoenaudomrung, K.; Areerak, K.; Areerak, K.; Bozhko, S.; Hill, C.I. Maximum Power Point Tracking for Stand-Alone Wind Energy Conversion System Using FLC-P&O Method. IEEJ Trans. Electr. Electron. Eng. 2020, 15, 1723–1733. [Google Scholar] [CrossRef]
  37. Mousa, H.H.; Youssef, A.R.; Mohamed, E.E. Hybrid and adaptive sectors P&O MPPT algorithm based wind generation system. Renew. Energy 2020, 145, 1412–1429. [Google Scholar] [CrossRef]
  38. Watil, A.; El Magri, A.; Raihani, A.; Lajouad, R.; Giri, F. Multi-objective output feedback control strategy for a variable speed wind energy conversion system. Int. J. Electr. Power Energy Syst. 2020, 121, 106081. [Google Scholar] [CrossRef]
  39. Errami, Y.; Ouassaid, M.; Maaroufi, M. A performance comparison of a nonlinear and a linear control for grid connected PMSG wind energy conversion system. Int. J. Electr. Power Energy Syst. 2015, 68, 180–194. [Google Scholar] [CrossRef]
  40. Jadhav, H.T.; Roy, R. A comprehensive review on the grid integration of doubly fed induction generator. Int. J. Electr. Power Energy Syst. 2013, 49, 8–18. [Google Scholar] [CrossRef]
  41. Pande, J.; Nasikkar, P.; Kotecha, K. A Review of Maximum Power Point Tracking Algorithms for Wind Energy Conversion Systems. J. Mar. Sci. Eng. 2021, 9, 1187. [Google Scholar] [CrossRef]
  42. Priyadarshi, N.; Ramachandaramurthy, V.K.; Padmanaban, S.; Azam, F. An ant colony optimized mppt for standalone hybrid pv-wind power system with single cuk converter. Energies 2019, 12, 167. [Google Scholar] [CrossRef] [Green Version]
  43. Parker, C.M.; Leftwich, M.C. The effect of tip speed ratio on a vertical axis wind turbine at high Reynolds numbers. Exp. Fluids 2016, 57, 1–11. [Google Scholar] [CrossRef]
  44. Yang, B.; Zhang, X.; Yu, T.; Shu, H.; Fang, Z. Grouped grey wolf optimizer for maximum power point tracking of doubly-fed induction generator based wind turbine. Energy Convers. Manag. 2017, 133, 427–443. [Google Scholar] [CrossRef]
  45. Abdullah, M.A.; Al-Hadhrami, T.; Tan, C.W.; Yatim, A.H. Towards green energy for smart cities: Particle swarm optimization based MPPT approach. IEEE Access 2018, 6, 58427–58438. [Google Scholar] [CrossRef]
  46. Altwallbah, N.M.M.; Radzi, M.A.M.; Azis, N.; Shafie, S.; Zainuri, M.A.A.M. New perturb and observe algorithm based on trapezoidal rule: Uniform and partial shading conditions. Energy Convers. Manag. 2022, 264, 115738. [Google Scholar] [CrossRef]
  47. Mahmod Mohammad, A.N.; Amran Mohd Radzi, M.; Azis, N.; Shafie, S.; Atiqi Mohd, M.A. Composite trapezoidal rule-based maximum power point tracking algorithm for photovoltaic systems under complex shading conditions. In Proceedings of the PECon 2020—2020 IEEE International Conference on Power and Energy, Penang, Malaysia, 7–8 December 2020; Institute of Electrical and Electronics Engineers Inc.: Piscatawaj, NJ, USA, 2020; pp. 270–275. [Google Scholar] [CrossRef]
  48. Mousa, H.H.H.; Youssef, A.R.; Mohamed, E.E.M. International Journal of Electrical Power and Energy Systems State of the art perturb and observe MPPT algorithms based wind energy conversion systems: A technology review. Int. J. Electr. Power Energy Syst. 2021, 126, 106598. [Google Scholar] [CrossRef]
Figure 1. Overall power system. The mechanical power is represented by P m and ω m is the angular speed in rad/s. C represents the input capacitor of the boost converter, I d c and V d c represent the rectified current and voltage, L is the boost converter inductor, C o is the output capacitor of the boost converter stage. The duty cycle D is the output from the MPPT algorithm block. R L is the load resistance.
Energies 16 02799 g001
Figure 2. Relation between TSR and C p . This figure is adapted with permission from Ref. [48]. Copyright 2021, Elsevier.
Energies 16 02799 g002
Figure 3. WECS operating regions. This figure is adapted with permission from Ref. [48]. Copyright 2021, Elsevier.
Energies 16 02799 g003
Figure 4. WT characteristics for λ o p t and C p o p t . This figure is adapted with permission from Ref. [48]. Copyright 2021, Elsevier.
Energies 16 02799 g004
Figure 5. Procedure of the CPO method.
Energies 16 02799 g005
Figure 6. Concept of the trapezoidal rule.
Energies 16 02799 g006
Figure 7. Relation between P d c and V d c .
Energies 16 02799 g007
Figure 8. Steps involved in the proposed algorithm.
Energies 16 02799 g008
Figure 9. Concept of the proposed algorithm.
Energies 16 02799 g009
Figure 10. Flowchart of the proposed MPPT algorithm.
Energies 16 02799 g010
Figure 11. SIMULINK model for the proposed algorithm and P&O method.
Energies 16 02799 g011
Figure 12. SIMULINK block for the P&O method.
Energies 16 02799 g012
Figure 13. SIMULINK block for the proposed algorithm.
Energies 16 02799 g013
Figure 14. Variable wind profile.
Energies 16 02799 g014
Figure 15. Time and power coefficient for fixed wind speed.
Energies 16 02799 g015
Figure 16. Time and output DC power.
Energies 16 02799 g016
Figure 17. Time and output DC power—zoomed sections. At wind speeds of 10 m/s, 12 m/s, and 11 m/s denoted by sections A, B, and C, the power obtained for the proposed algorithm is considerably greater than that obtained for the CPO method. For sections A, B, and D, the oscillations are also found to be reduced.
Energies 16 02799 g017
Figure 18. Time and DC voltage.
Energies 16 02799 g018
Figure 19. Time and output DC voltage—zoomed sections. At wind speeds of 10 m/s, 12 m/s, and 11 m/s denoted by sections A, B, and C, the voltage obtained for the proposed algorithm is considerably greater than that obtained for the CPO method.
Energies 16 02799 g019
Figure 20. Time and DC current.
Energies 16 02799 g020
Figure 21. Time and output current—zoomed sections. At wind speeds of 10 m/s, 12 m/s, and 11 m/s denoted by sections A, B, and C, the current obtained for the proposed algorithm is considerably greater than that obtained for the CPO method.
Energies 16 02799 g021
Table 1. Issues in the existing MPPT algorithms and the contributions of the proposed algorithm.
Issues in Existing MPPT Techniques for WECSContribution of the Proposed MPPT Algorithm
Complex trackingSimple tracking approach, employing trapezoidal-rule-based perturb and observe algorithm
Higher computational complexityReduced computational complexity
Accuracy and convergence dependent on best solution provided by metaheuristic methodsAccurate convergence is achieved without the involvement of random steps, thereby helping to reduce oscillation in the generated power.
Table 2. Parameters used for simulation.
Parameters for Wind TurbineValue and Unit
R1.8 m
ρ 1.22 kg/m3
Power rating3 kW
β 0
Parameters for PMSGValue and Unit
Power rating3 kW
Number of pole pairs4
Rs0.4578 ohms
Ld = Lq3.34 mH
J0.00496 kgm2
Parameters for the Boost ConverterValue and Unit
L75 mH
C0.468 μ F
fs5000 Hz
RL54 ohms
Disclaimer/Publisher’s Note: The statements, opinions and data contained in all publications are solely those of the individual author(s) and contributor(s) and not of MDPI and/or the editor(s). MDPI and/or the editor(s) disclaim responsibility for any injury to people or property resulting from any ideas, methods, instructions or products referred to in the content.

