Article

Catalytic Oxidation of Volatile Organic Compounds Using the Core–Shell Fe2O3-Cenospheric Catalyst in a Fluidised Bed Reactor

Faculty of Chemical Engineering and Technology, Cracow University of Technology, Warszawska 24, 31-155 Cracow, Poland
*
Author to whom correspondence should be addressed.
Energies 2023, 16(6), 2801; https://doi.org/10.3390/en16062801
Submission received: 2 March 2023 / Revised: 14 March 2023 / Accepted: 15 March 2023 / Published: 17 March 2023

Abstract

:
The results of selected volatile organic compounds (benzene, n-hexane, isopropanol, and formic acid) catalytic oxidation are presented on Fe2O3 cenospheres in the fluidised bed reactor. The core–shell Fe2O3-cenosphere catalyst was developed by applying an Fe layer on cenospheres by FB-MO-CVD (fluidised bed, metal–organic chemical vapor deposition) and following Fe layer oxidation. The efficiency of the decomposition of VOCs was tested in the range of 200 to 500 °C, using the method based on infrared spectroscopy (FTIR). The research was focused especially on the analysis of incomplete combustion products, such as CO and oxygen compounds. During the oxidation of isopropanol and n-hexane, in addition to carbon monoxide, species such as acetone, formaldehyde, and acetaldehyde were also detected. The oxidation of formic acid proceeded with only a slight emission of carbon monoxide, unexpectedly the oxidation of benzene proceeded in a similar way, and no other products of the incomplete oxidation were detected. In addition, the CO concentration was lower than in the case of conversion of isopropanol and n-hexane. For the presented solution, complete formic acid oxidation is possible at temperatures below 400 °C, and almost complete oxidation to CO2 of isopropyl alcohol, benzene, and n-hexane was achieved at 500 °C. Additionally, the possibility of conducting the autothermal process of oxidation of VOCs in a fluidised bed, provided that heat recuperation is used, was presented.

1. Introduction

Volatile organic compounds (VOCs) are one of the most important types of air pollution. The emission of these compounds can occur as a result of many processes in industry, agriculture (cattle breeding), and more. They pose a serious threat to both the surrounding environment and local health. In addition, VOCs strongly absorb infrared radiation and, thus, significantly enhance the greenhouse effect caused in the atmosphere by the presence of CO2. Efficient and clean removal of VOCs from the air is an important part of many industrial processes that minimises their environmental impact. The simplest way is to perform the thermal degradation of VOCs in an oxidising environment. However, when VOC concentrations are low, this is an energy-intensive process and may require the use of a supporting fuel and, therefore, contribute to increased greenhouse gas emissions. Among other methods for VOC removal, methods can be distinguished on the basis of sorption [1,2,3,4,5], photocatalytic oxidation [6,7,8,9,10], and catalytic oxidation [11,12,13,14,15]. Catalytic methods involve additional energy to heat the reactants, but the energy demand is much lower than that in the case of thermal degradation. Research dedicated to catalytic oxidation focuses mainly on VOC removal in the stationary bed, despite the significant advantages provided by fluidised bed technology. Fluidised bed reactors (FBRs) ensure intensive mixing of reagents, thus providing uniform concentration of reactants and uniform temperature in the bed space. FBRs provide a versatile environment for the thermal utilisation of fuel and waste in all states of matter [16,17,18,19,20,21].
The fluidised bed is additionally resistant to the presence of dust pollutants, which are often present in the air together with VOCs, and unlike stationary reactors, it is easy to scale up. To ensure the fluidised bed catalytic process, it is necessary to select the appropriate catalyst support. In the presented solution, cenospheres were selected as the bed material on which iron oxide was deposited. Cenospheres are aluminosilicate materials with hollow and spherical structure, low apparent density, and high mechanical and thermal resistance [22], so they have found application in fluidised bed systems [17].
The catalyst was produced on the cenospheres by chemical vapour deposition [23]. On the basis of previous experience, such coatings have mechanical strength that allows them to work in fluidised bed reactors [17]. The goal was to produce a core–shell catalyst in which the active phase is deposited only on the outer surface of the carrier. This results in better utilization of the catalyst because the diffusion rate decreases rapidly in the inner volume of the catalyst support. It is especially important in the case of using expensive catalysts based on Pt, Pd, or Au [24,25].
Fluidised bed catalytic experiments were performed for four different gaseous air pollutants at low concentrations (benzene, n-hexane, isopropanol, and formic acid). The research was focused especially on the analysis of combustion products, such as CO and oxygen compounds.
During the oxidation of VOCs with relatively low concentrations, a certain amount of heat is generated, but this amount is not sufficient to run the process in an autothermal condition. The energy deficit must be compensated by supplying energy from the external source. To avoid expensive heating of the bed, this can be achieved by pre-heating of the air introduced into the reactor via a heat exchanger. In this paper, a counter-current heat exchanger was proposed. Furthermore, the demand for energy in the process in the fluidised bed reactor was also calculated and the solution with heat recuperation combined with a catalytic fluidised bed reactor was presented. To date, research on the catalytic oxidation of VOCs focused mostly on improving the efficiency of the catalyst, while a more complex process approach is missing. In the present work, an original core–shell type of catalyst was used in fluidised bed processes of VOC oxidation. In addition, the possibility of running this type of process in an autothermal manner was evaluated.

2. Materials and Methods

2.1. Catalyst Preparation

The 160–200 μm fraction was separated from fly ash cenospheres (Połaniec Power Plant—Poland, Połaniec). The material was hydrothermally treated in distilled water at 80 °C for 30 min (500 rpm). This was carried out to remove the dust from the material and to separate the crushed cenospheres (falling to the bottom of the vessel). After the boiling process, the floating fraction was collected from the surface of the water and dried at 150 °C for 12 h. The resulting material was used as a support for the Fe2O3 catalyst. The coating process was carried out in two stages. Initially, the iron layer was deposited by thermal decomposition of Fe(CO)5 (Iron (0) pentacarbonyl, Sigma Aldrich, Germany, Schnelldorf) using a MO-CVD process (metal–organic chemical vapour deposition) (Figure 1B). The vapour deposition of Fe was performed in a fluidised bed reactor with an inner diameter of 75 mm and a wall thickness of 2.5 mm. The cenospheres were placed in the reactor, and the fluidised state was achieved by introducing a nitrogen stream at a volumetric flow rate of 5.5 L·min−1 to the reactor (Figure 1B, 1d). The thermal decomposition process of Fe(CO)5 was carried out at 180 °C. Iron pentacarbonyl (0) was introduced into the triple-neck flask and evaporated at room temperature. The carbonyl vapour together with the N2 stream flowed through a perforated bottom plate into the reaction space and was thermally decomposed on a cenospheric bed. The resulting cenospheres containing an iron layer were then oxidised in a muffle furnace at 500 °C for 15 min. The fabricated catalyst contained 8.2 wt.% Fe2O3. Iron content analysis was carried out with a PerkinElmer AAnalyst 300 (USA, Waltham) analyser using the flame atomic absorption spectrometry (F-AAS) technique. The characterisation of the catalyst obtained by this technique (SEM, XRD, and TPR) is presented in the article [17].

2.2. Methodology for Testing the Catalytic Oxidation Process

For the preparation of ‘contaminated’ air, the corresponding VOCs (Table 1) were introduced into the scrubber immersed in a water bath (temperature within the scrubber, TSC). The scrubber contained benzene (B, 99.9%, POCH, Poland, Gliwice), n-hexane (Hx, 95%, POCH, Poland, Gliwice), isopropanol (IPA, 99.9%, Chemland, Poland, Stargard), and formic acid (FA, 99%, Acros Organics, Belgium, Geel). Air was fed into the scrubber at a specific volumetric flow rate (Table 1 V ˙  1a) then mixed with atmospheric air (Table 1 V ˙  1b). After mixing, part of the contaminated air was fed into the fluidised bed reactor at a volumetric flow rate of 0.4 or 0.8 L·min−1 (Table 1 V ˙  1c). The processes carried out at a volumetric flow rate of 0.8 L·min−1 were those with a short retention time in the bed (two times shorter than that of the 0.4 L·min−1 volumetric flow rate), and, therefore, were designated as fast (F). The excess contaminated air was discharged with the combustion gases to the exhaust. A test stand diagram is shown in Figure 1A. The catalytic oxidation process was carried out in a fluidised bed reactor made of borosilicate glass with an inner diameter of 34 mm packed with 50 g Fe2O3/cenospheres. The experiments were carried out in the temperature range of 200–500 °C with a constant temperature increase of 3 °C/min. Measurement and temperature regulation was conducted using the PID controller (type RE82, Lumel, Poland, Zielona Góra), and air volumetric flow rate was measured using Aalborg mass flow meters (converting mass flow into mL·min−1 or L·min−1 at a standard temperature of 21.1 °C and pressure of 101.4 KPa). The composition of the exhaust gas generated during the process was continuously analysed during the linear temperature increase at a speed of 1 spectrum per 1 °C of temperature change using an FTIR analyser (atmosFIR, Protea, UK, Middlewich).
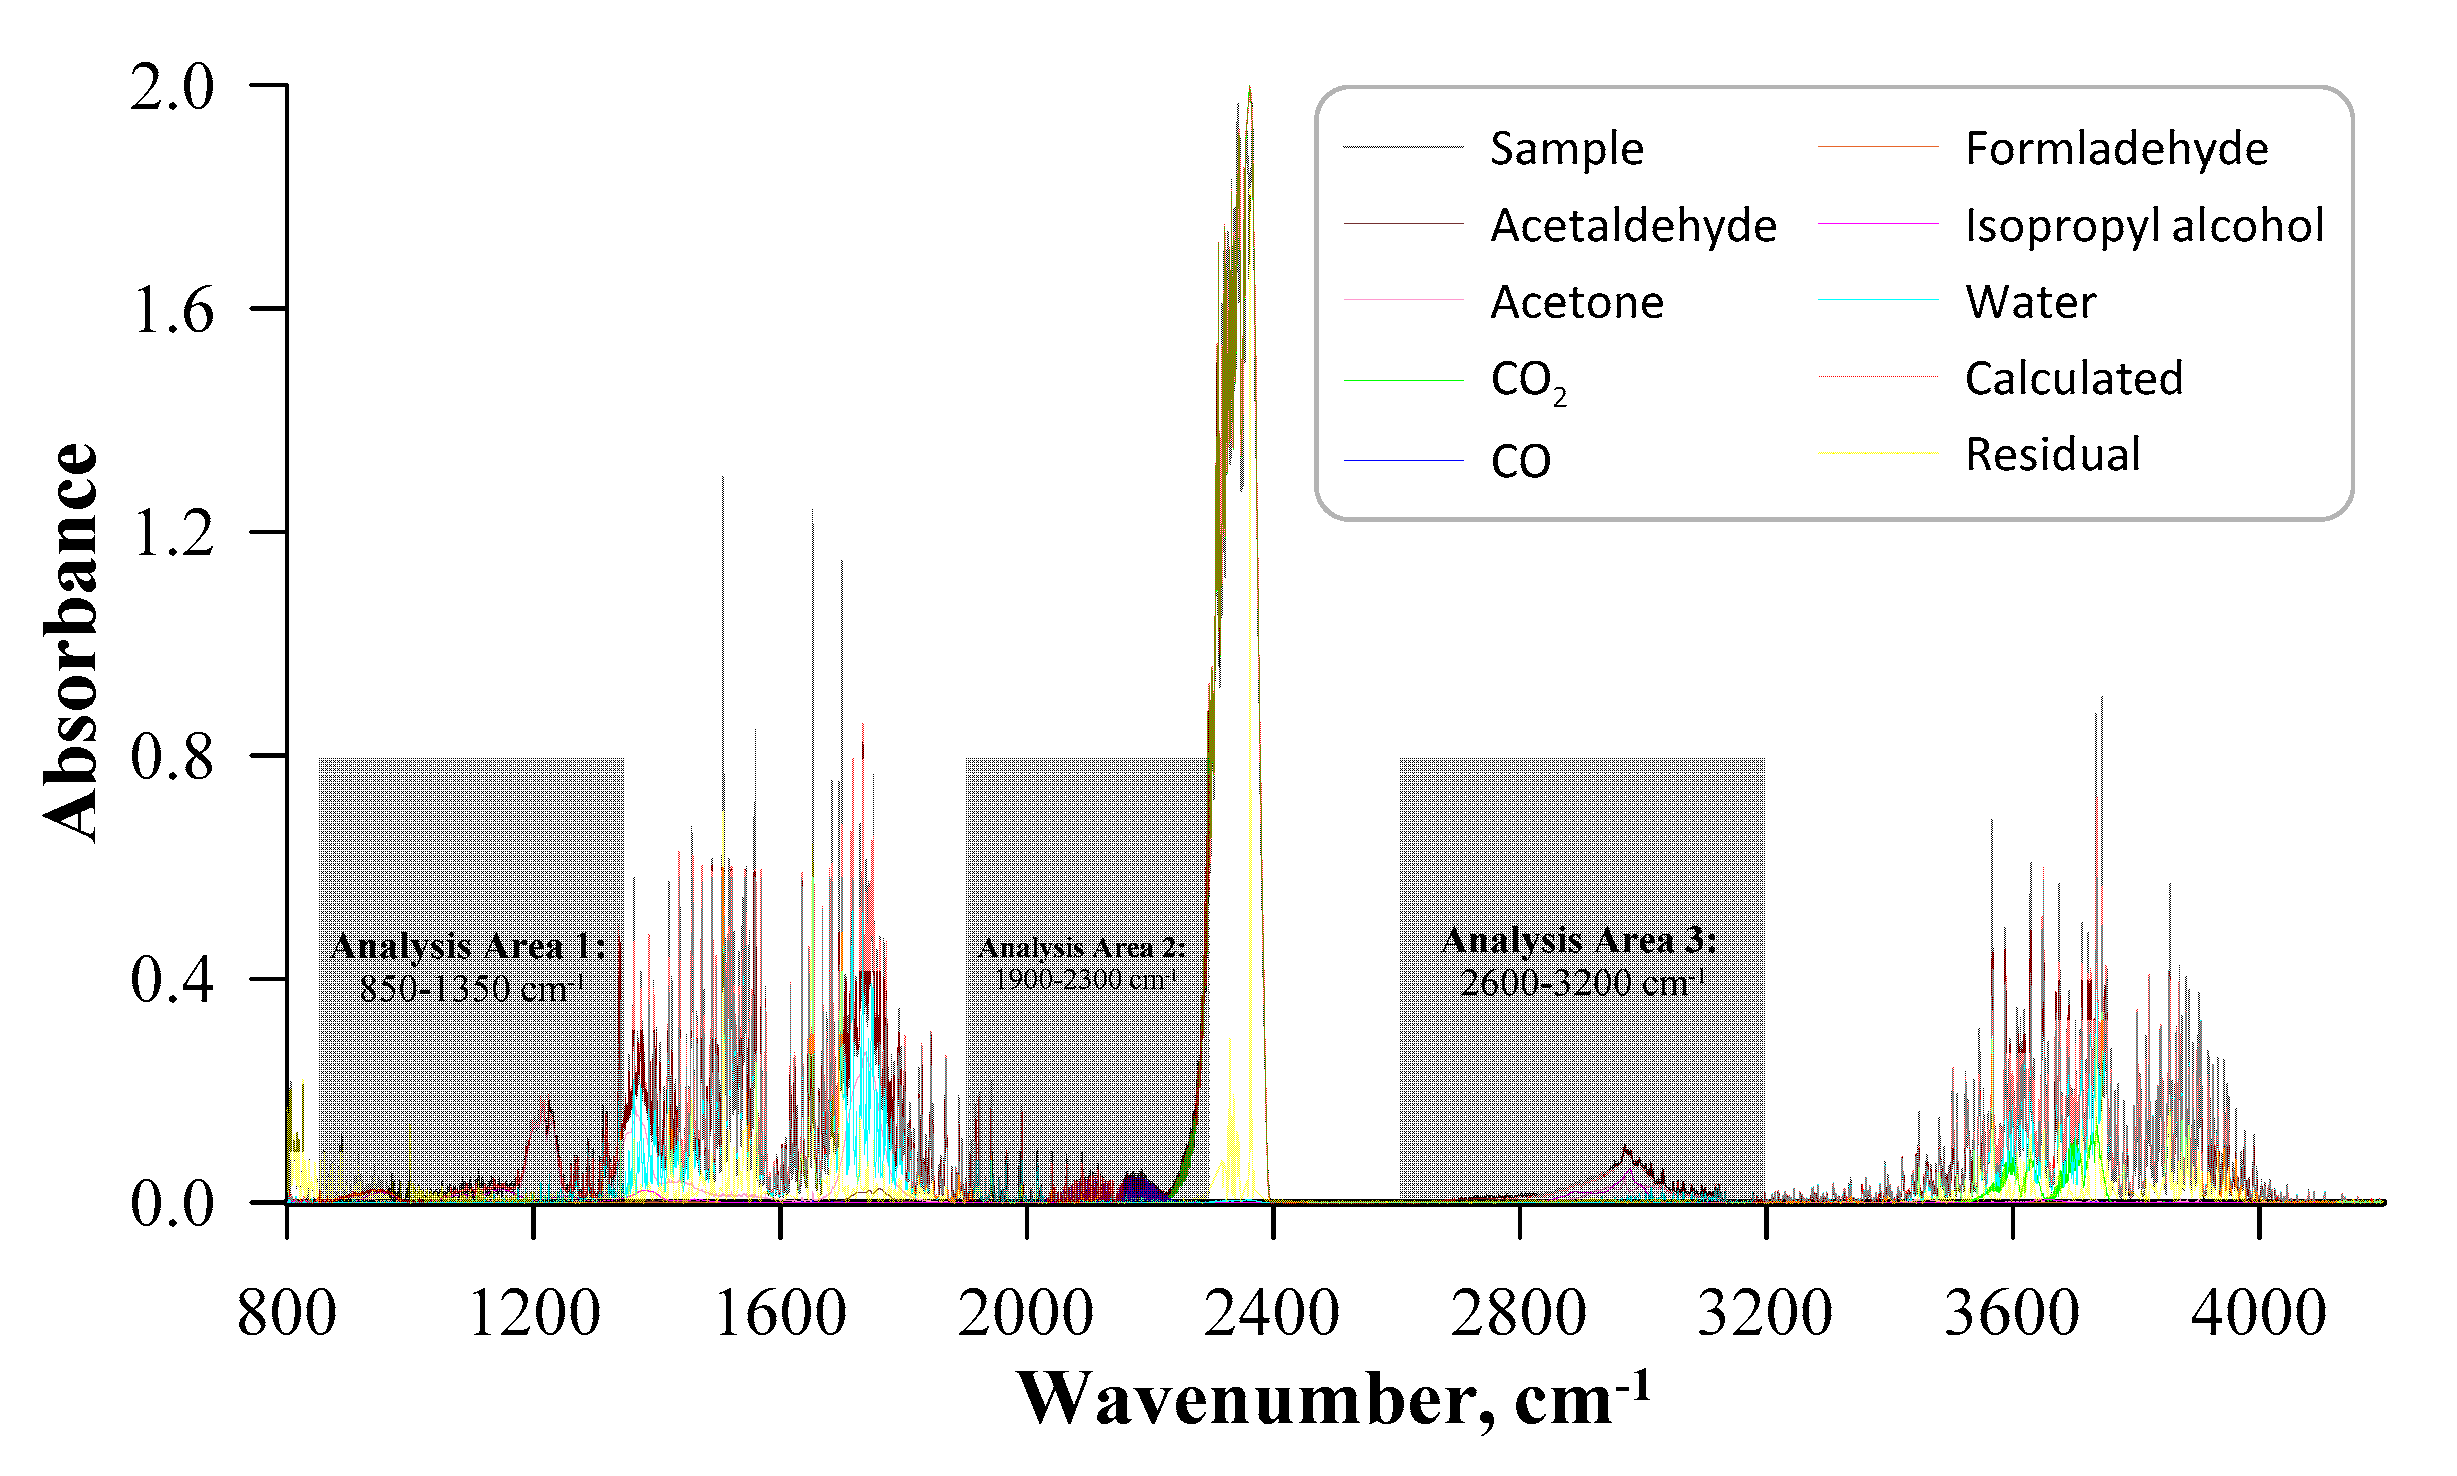
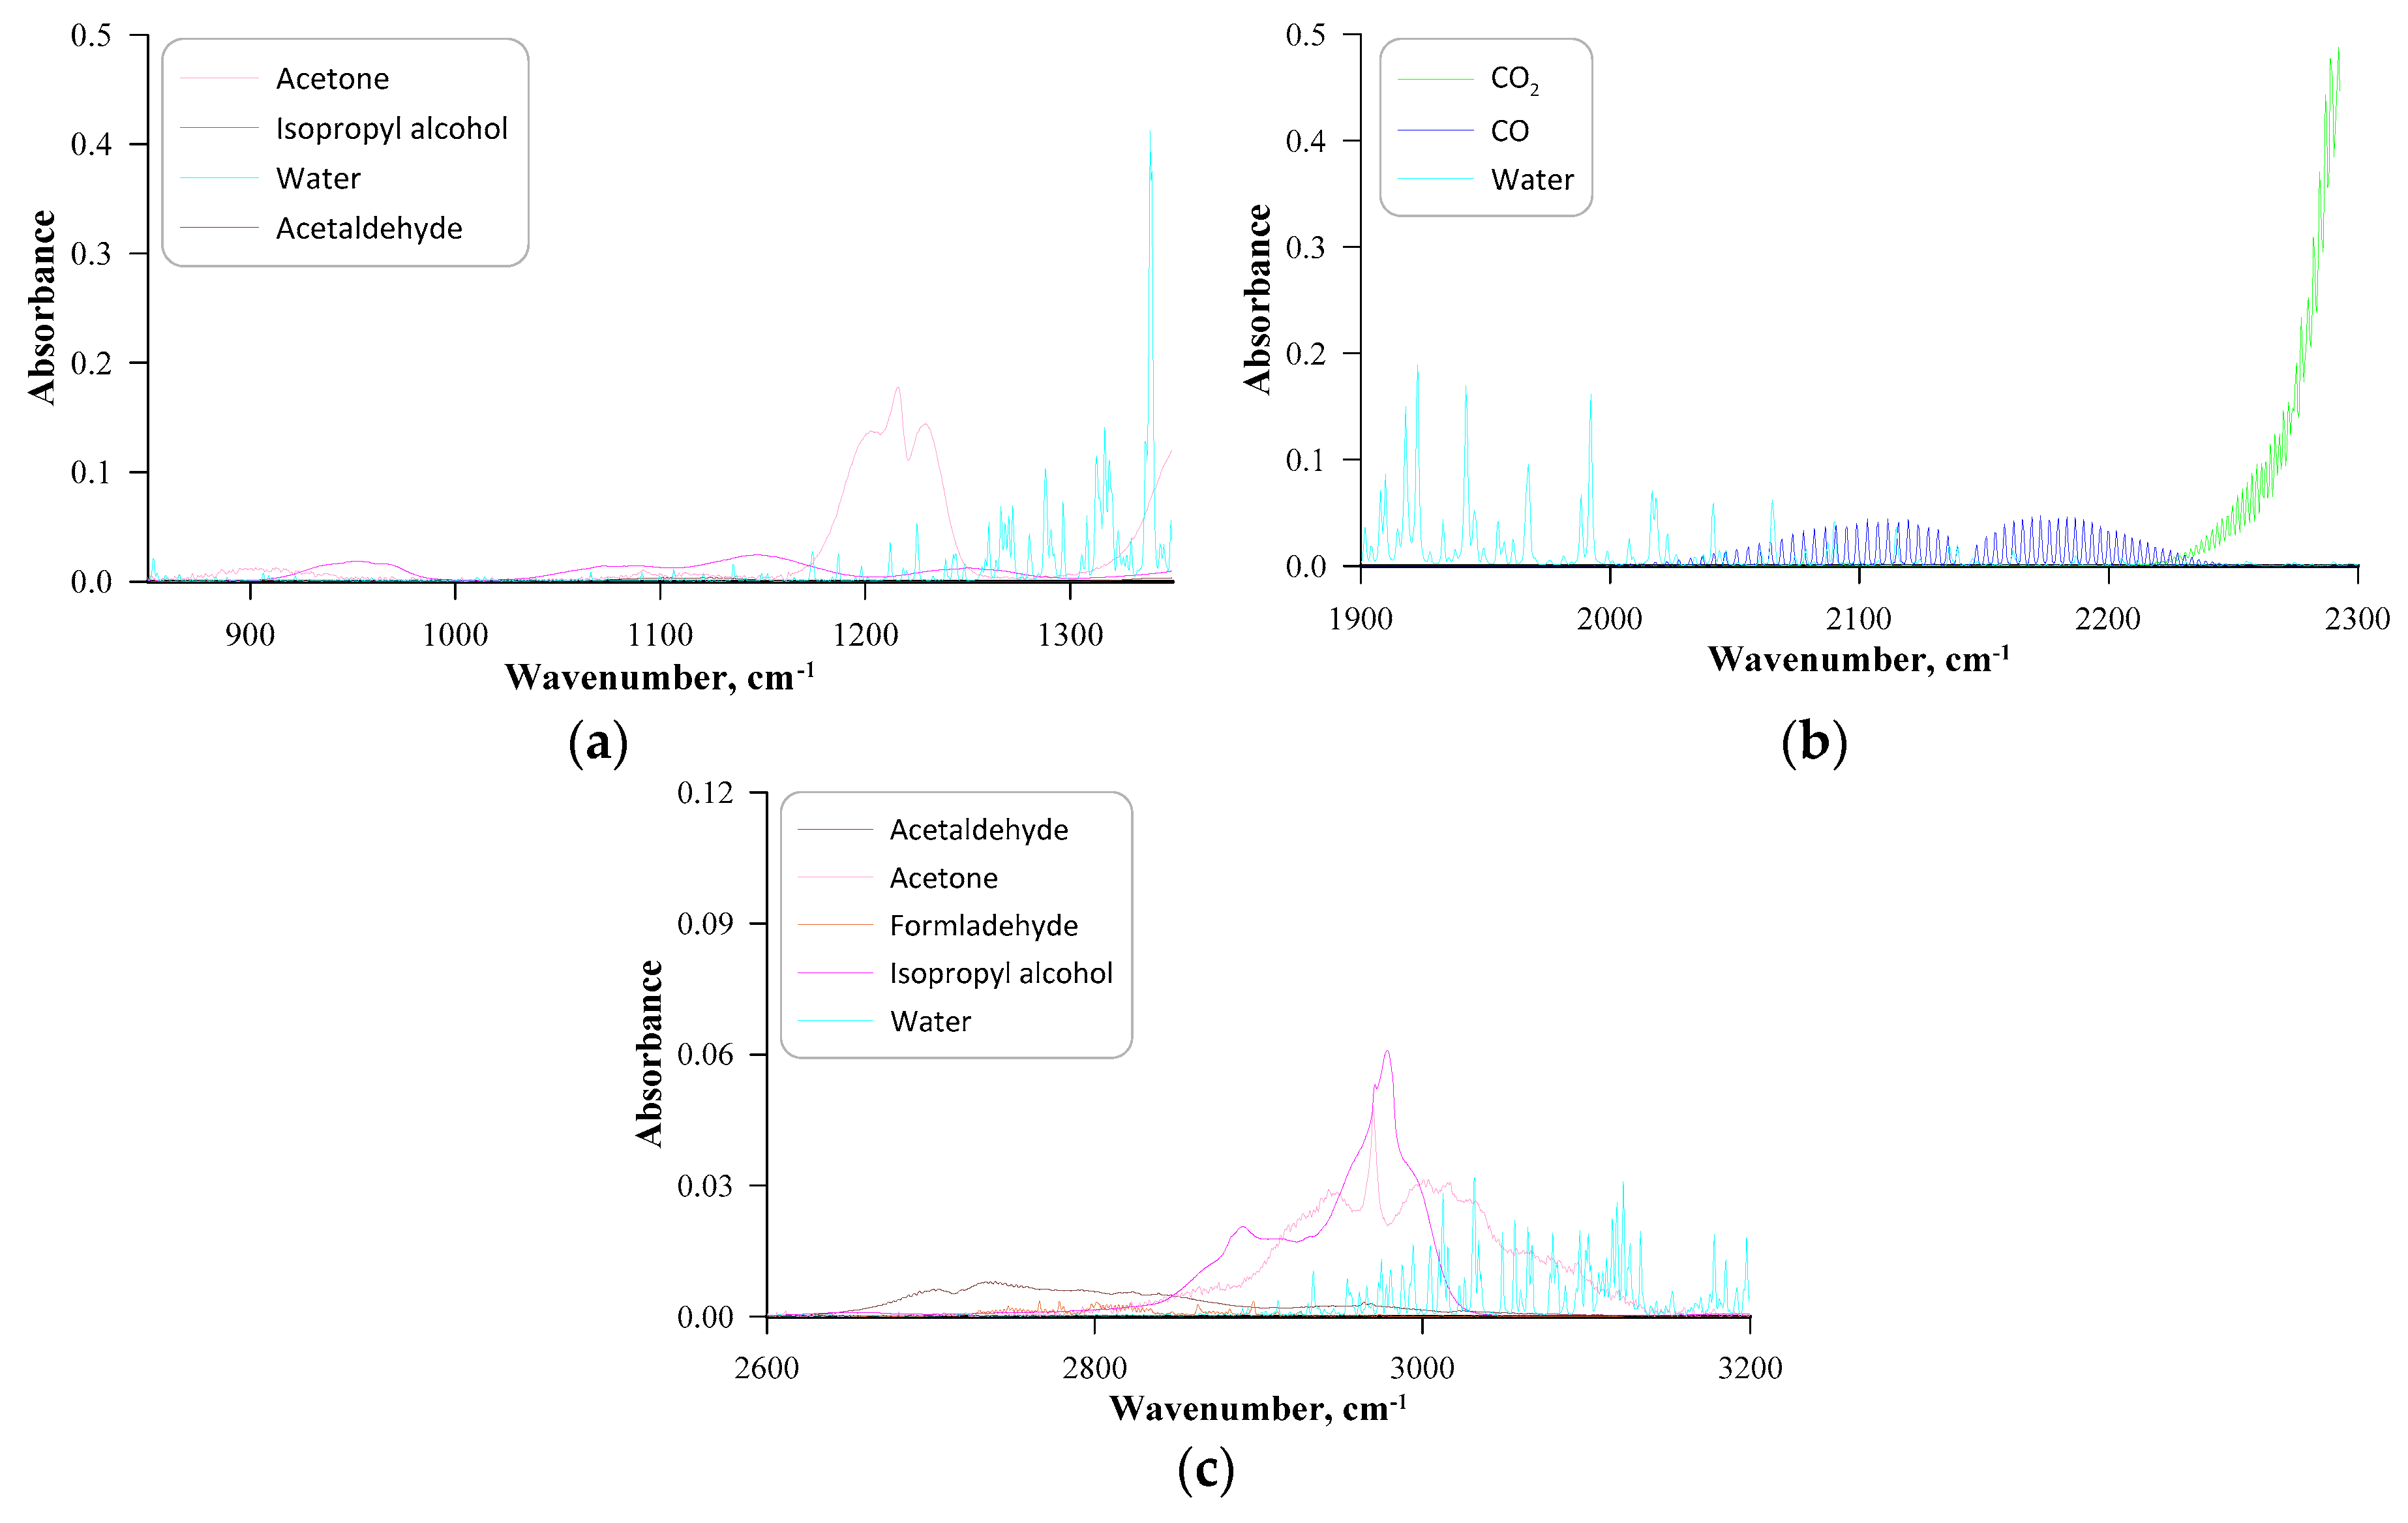
The method for the qualitative and quantitative analysis of the gaseous compounds formed during the catalytic oxidation process was presented on the example of isopropyl alcohol since the degradation of this pollutant produces the widest range of compounds. In Figure 2, the FTIR spectrum of a sample in an experiment with IPA (Table 1, No. 3) at 325.4 °C is shown. Three areas were selected for the analysis of the FTIR gas spectra: Analysis Area 1: 850–1350 cm−1, Analysis Area 2: 1900–2300 cm−1, and Analysis Area 3: 2600–3200 cm−1. These areas, according to the recommendation of the manufacturer, are limited to an absorbance of 0.8 in order to maintain a linear concentration–absorbance relationship. Analysis Area 1 (Figure 3a) allows the analysis of acetone (which is formed only when isopropyl alcohol is decomposed), as well as water, isopropyl alcohol, and acetaldehyde. Analysis Area 3 (Figure 3c) also allows for the analysis of the same organic compounds and additionally formaldehyde. This compound in the shown example had a concentration of only 4 ppmv, yet its characteristic FTIR spectrum allows a specific part of the sample spectrum to be unambiguously assigned to this compound. Analysis Area 2 (Figure 3b) includes bands characteristic of inorganic compounds that are the predominant components of the flue gas, that is, water, CO2, and CO. After the analysis areas and reference spectra of the compounds are specified, the software performed an optimisation to match the calculated spectrum with the sample spectrum. The residual spectrum (the difference between the sample spectrum and the calculated spectrum) in the analysed example is a straight line, especially in the analysis area that excludes water and carbon dioxide, i.e., Analysis Area 3, which indicates the correct selection of the list of compounds list. After the optimisation process, the information regarding the flue gases composition was provided.
On the basis of the organic and inorganic compounds concentrations, the masses of carbon atoms present in each of the analysed compounds were calculated. Additionally, the background concentration level of CO2 in the air was removed. Subsequently, the carbon shares of each compound in the total amount of carbon were determined as a function of the process temperature, and on the basis of these calculations, catalytic oxidation progress diagrams were prepared (Figure 4, Figure 5, Figure 6 and Figure 7). In addition, the temperature at which the 25, 50, and 75% decomposition of the VOCs occurred is shown in Table 2.
In the next step, the energy balance was calculated in a system where a heat exchanger was used to pre-heat the air introduced into the reactor (Figure 1C). The counter-current heat exchanger was proposed, in which the air is heated from TAir1 to TAir2 with the use of flue gases cooling from TExh1 to TExh2. To determine the initial temperature of the air introduced into the reactor (equal TAir2), the (ΔTad) adiabatic temperature increase generated in the reactor during the catalytic oxidation of the selected VOC was calculated. In the calculations of the exchanger area, it was assumed that the temperature TAir2 is approximately equal to the difference of the flue gas temperature at the reactor outlet (TExh1) and the increase in adiabatic temperature. Thus, the sum of the ΔTad and TAir2 allows for reaching the operating temperature of the reactor that is necessary to carry out the conversion of gaseous pollutants.
The heat generated at time t during catalytic oxidation of the selected compound QReact.(t) was calculated as the difference between the products and substrates heat of formation according to the Equation (1):
  Q R e a c t . t = Δ f H g a s   i o × m ˙ i t P r o d . Δ f H g a s   i o × m ˙ i t S u b . W
The theoretical increase in adiabatic temperature in the reactor during the catalytic conversion of the selected compound was calculated by equation:
Δ T a d = Q R e a c t . C p A i r T × V A i r ˙ × ρ A i r T   ° C
The ratio between theoretical energy generated through the reaction in relation to the energy demand for heating the air from room temperature to temperature within the reaction zone ( γ ) was calculated by equation:
γ = Q R e a c t . t C p A i r T × V A i r ˙ × ρ A i r T × T t B e d 25 ° C   × 100 %
Selected physical and thermodynamic data were obtained from [26,27]. Air density was calculated from the ideal gas equation, while specific heat capacity was determined using the polynomial  C p A i r T = 3 × 10 14 × T 4 1 × 10 10 × T 3 + 4 × 10 7 × T 2 + 2 × 10 5 × T + 1.0054   , where T was expressed in Celsius degrees. The enthalpy of formation of compounds is presented in Table S1 in the Supplementary Materials. During the calculation of γ coefficient, the heat capacity of the catalyst was not considered because it was assumed that the reactor would operate in a stationary state and would initially be heated to the operating temperature (TExh1). Thus, when air is supplied to the reactor at the temperature TAir2, a reaction will be initiated, and the energy needed to heat the air will be released, without necessity of warming up the catalyst. The obtained values of ΔTad and  γ    are plotted on catalytic oxidation progress diagrams (Figure 4, Figure 5, Figure 6 and Figure 7).
The calculation of the heat transfer area for the counter-current heat exchanger was carried out assuming adiabatic conditions, and the total heat transfer coefficient (U) was assumed to be 3 W·m−2·K−1 based on a publication [28] in which the plate heat exchanger designed to work with the fluidised bed furnace was performed. The proposed initial and final temperatures of the air and flue gases at the inlet and outlet of the exchanger, and the heat exchange area calculated on their basis (Equations (4)–(6)), are shown in Table 3.
A H . E . = Q A i r U × Δ T M   cm 2
Δ T M = T E x h 1 T A i r 2 + T E x h 2 T A i r 1 2
  Q A i r = Q E x h = m ˙ A i r × C A i r × T A i r 1 T A i r 2   W
The beta efficiency coefficient considering the efficiency of the catalytic oxidation process expressed as the area of the exchanger in relation to the volumetric flow rate of air was calculated using equation:
β = A H . E . V ˙ A i r   cm 2 · min 1 · L 1

3. Results and Discussion

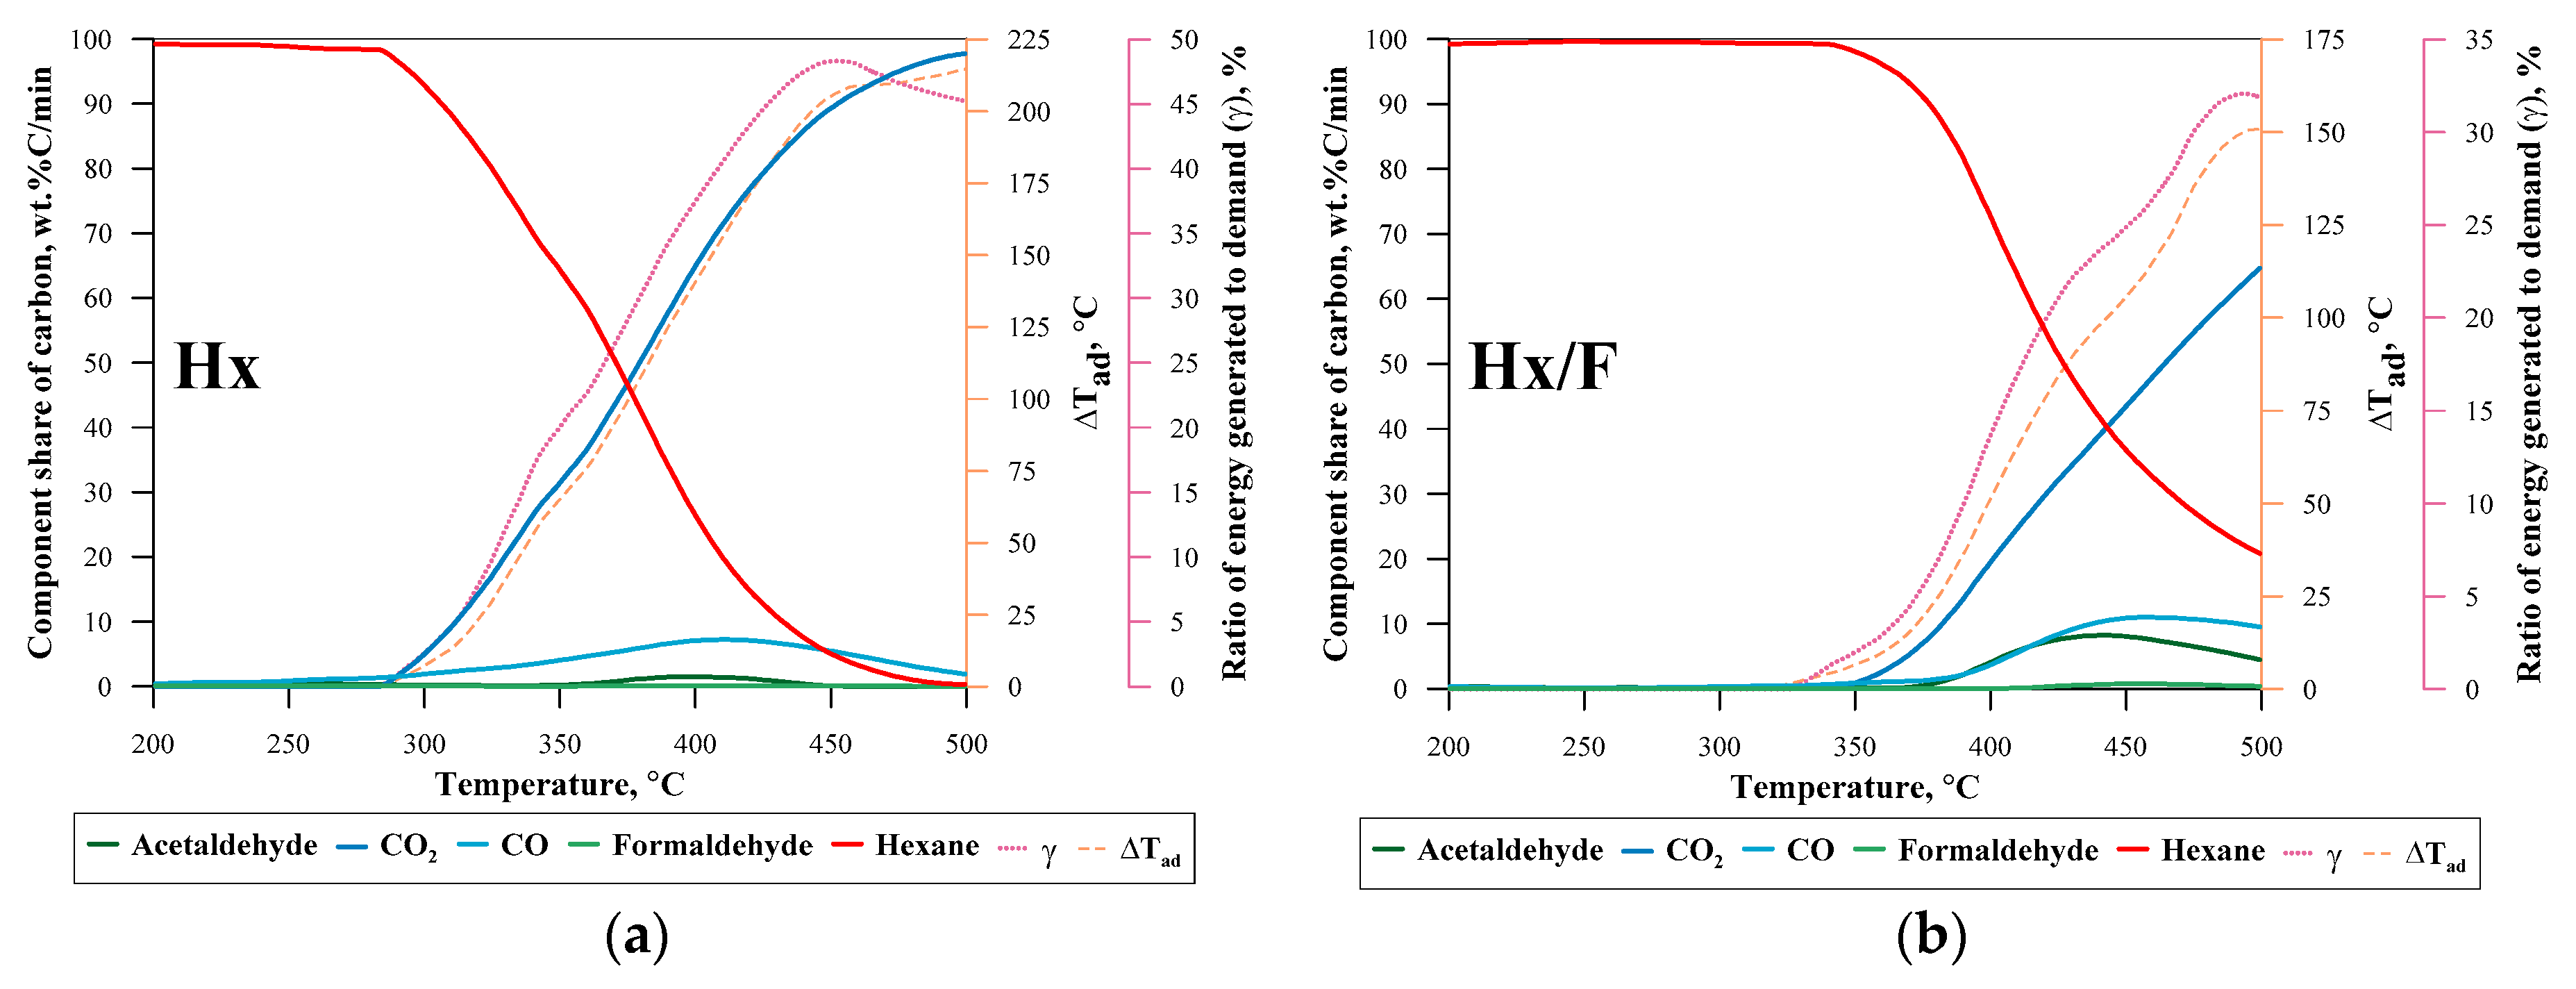
Catalytic oxidation of n-hexane produces CO2, CO, acetaldehyde, and formaldehyde (Figure 4). The decomposition of n-hexane (Hx, Figure 4a) starts at a temperature of approx. 280 °C, while at 500 °C, it is almost completely converted to CO2. The main decomposition product is carbon dioxide, whose share in the gases increases with increasing process temperature. Carbon monoxide is also present in gaseous products from the onset of n-hexane decomposition. Its share reaches a maximum at approx. 410 °C and gradually decreases, indicating the start of the complete oxidation process. Acetaldehyde is present only in the 350–450 °C range, while formaldehyde is detected only in trace amounts.
In the oxidation of n-hexane in a cenospheric bed without catalyst layer (Supplementary Materials, Figure S1a), increased CO and acetaldehyde emissions are observed. The decomposition of 50% of n-hexane requires a temperature of approx. 435 °C compared with approx. 371 °C in the catalytic process (Hx). This confirms that the prepared material exhibits catalytic properties in the oxidation of gaseous pollutants.
The catalytic oxidation of n-hexane in the fast process (Hx/F, Figure 4b) begins at approximately 350 °C. The decomposition of 75% of n-hexane requires a temperature of approx. 482 °C (Table 2), i.e., approx. 20% higher than in the corresponding catalytic oxidation of n-hexane (Hx) carried out at twice the residence time (approx. 402 °C). The fast process of catalytic oxidation of n-hexane also produces higher amounts of CO and acetaldehyde in the tested temperature range. Complete decomposition of n-hexane in the fast process is possible at temperatures higher than 500 °C.
It should be noted that reducing the amount of catalyst by half while maintaining a flow of 0.4 L·min−1 (Hx 25 g Supplementary Materials, Figure S1b) results in a similar degree of conversion of n-hexane as in the fast process (Hx/F, 50 g of catalyst and 0.8 L·min−1). The decomposition of 75% n-hexane requires a temperature of approximately 392 °C when 25 g of catalyst is used compared with 402 °C in the fast process. On the other hand, the amounts of potentially toxic gases, CO, and acetaldehyde, are at levels significantly higher than in the Hx/F process.
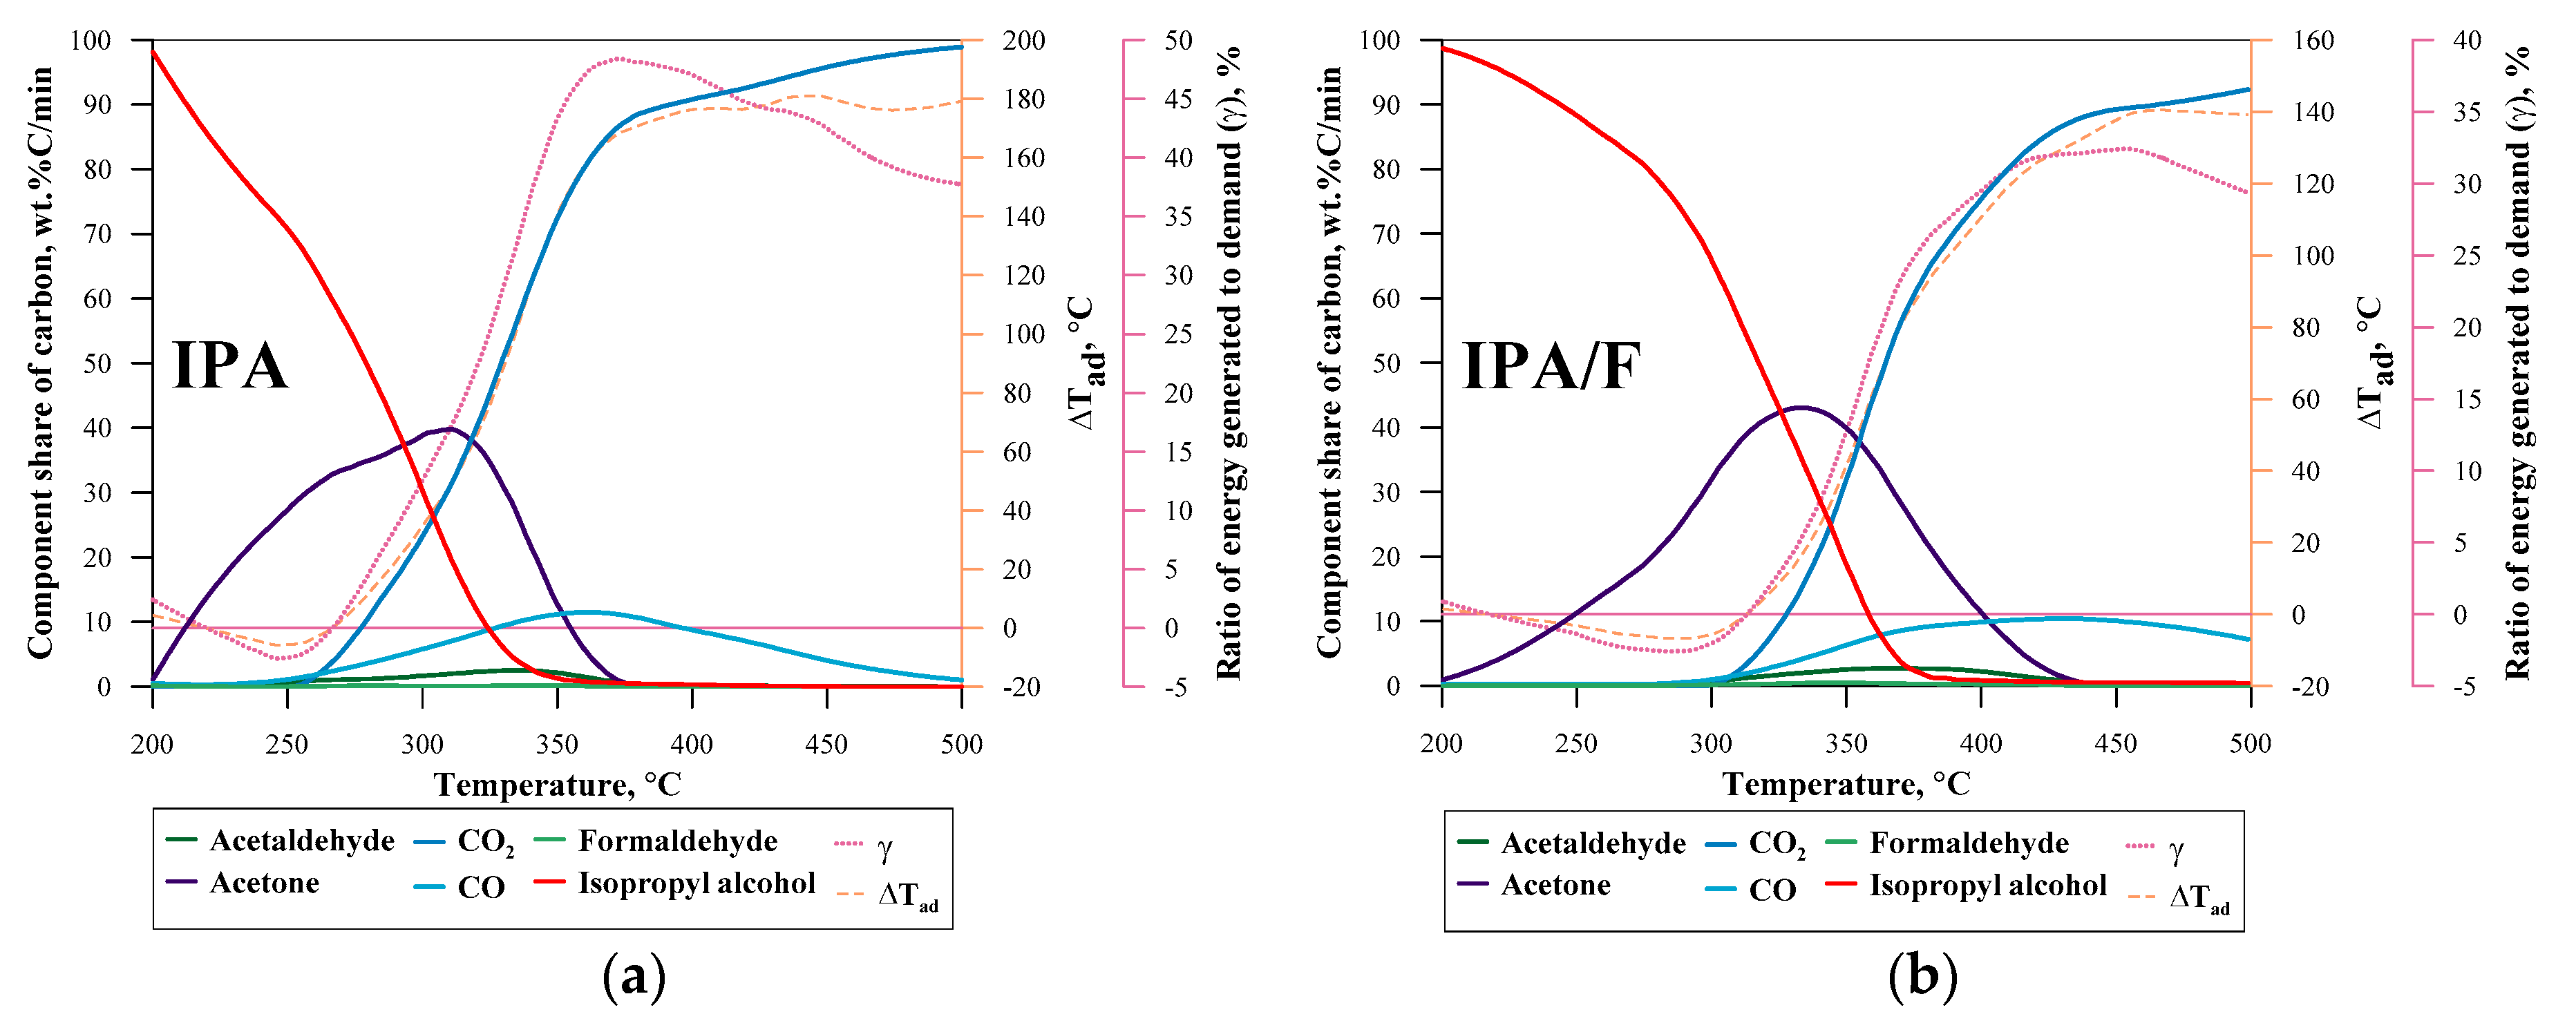
The catalytic oxidation of isopropyl alcohol (IPA Figure 5a) starts at temperatures below 200 °C, and at 400 °C, this compound is no longer present in the gaseous products. Isopropyl alcohol decomposes into acetone, CO2, CO, and to a lesser extent, acetaldehyde and formaldehyde. Acetone is a component of IPA degradation at temperatures up to 370 °C. Carbon monoxide reaches its maximum concentration at this temperature; therefore, it is advantageous to run the catalytic oxidation process at a higher temperature, a minimum at 400 °C. The complete disappearance of CO in the flue gas can be achieved at temperatures slightly above 500 °C. The aldehyde concentrations are at low levels, as was detected during n-hexane oxidation.
In the fast alcohol oxidation process (IPA/F, Figure 5b), the expected shift occurred in the temperature ranges at which acetone and aldehydes are present in gases. The 75% conversion of isopropyl alcohol under these conditions requires temperatures of approx. 344 °C (13% higher) compared with approx. 305 °C in the process with increased residence time (IPA, Figure 5a).
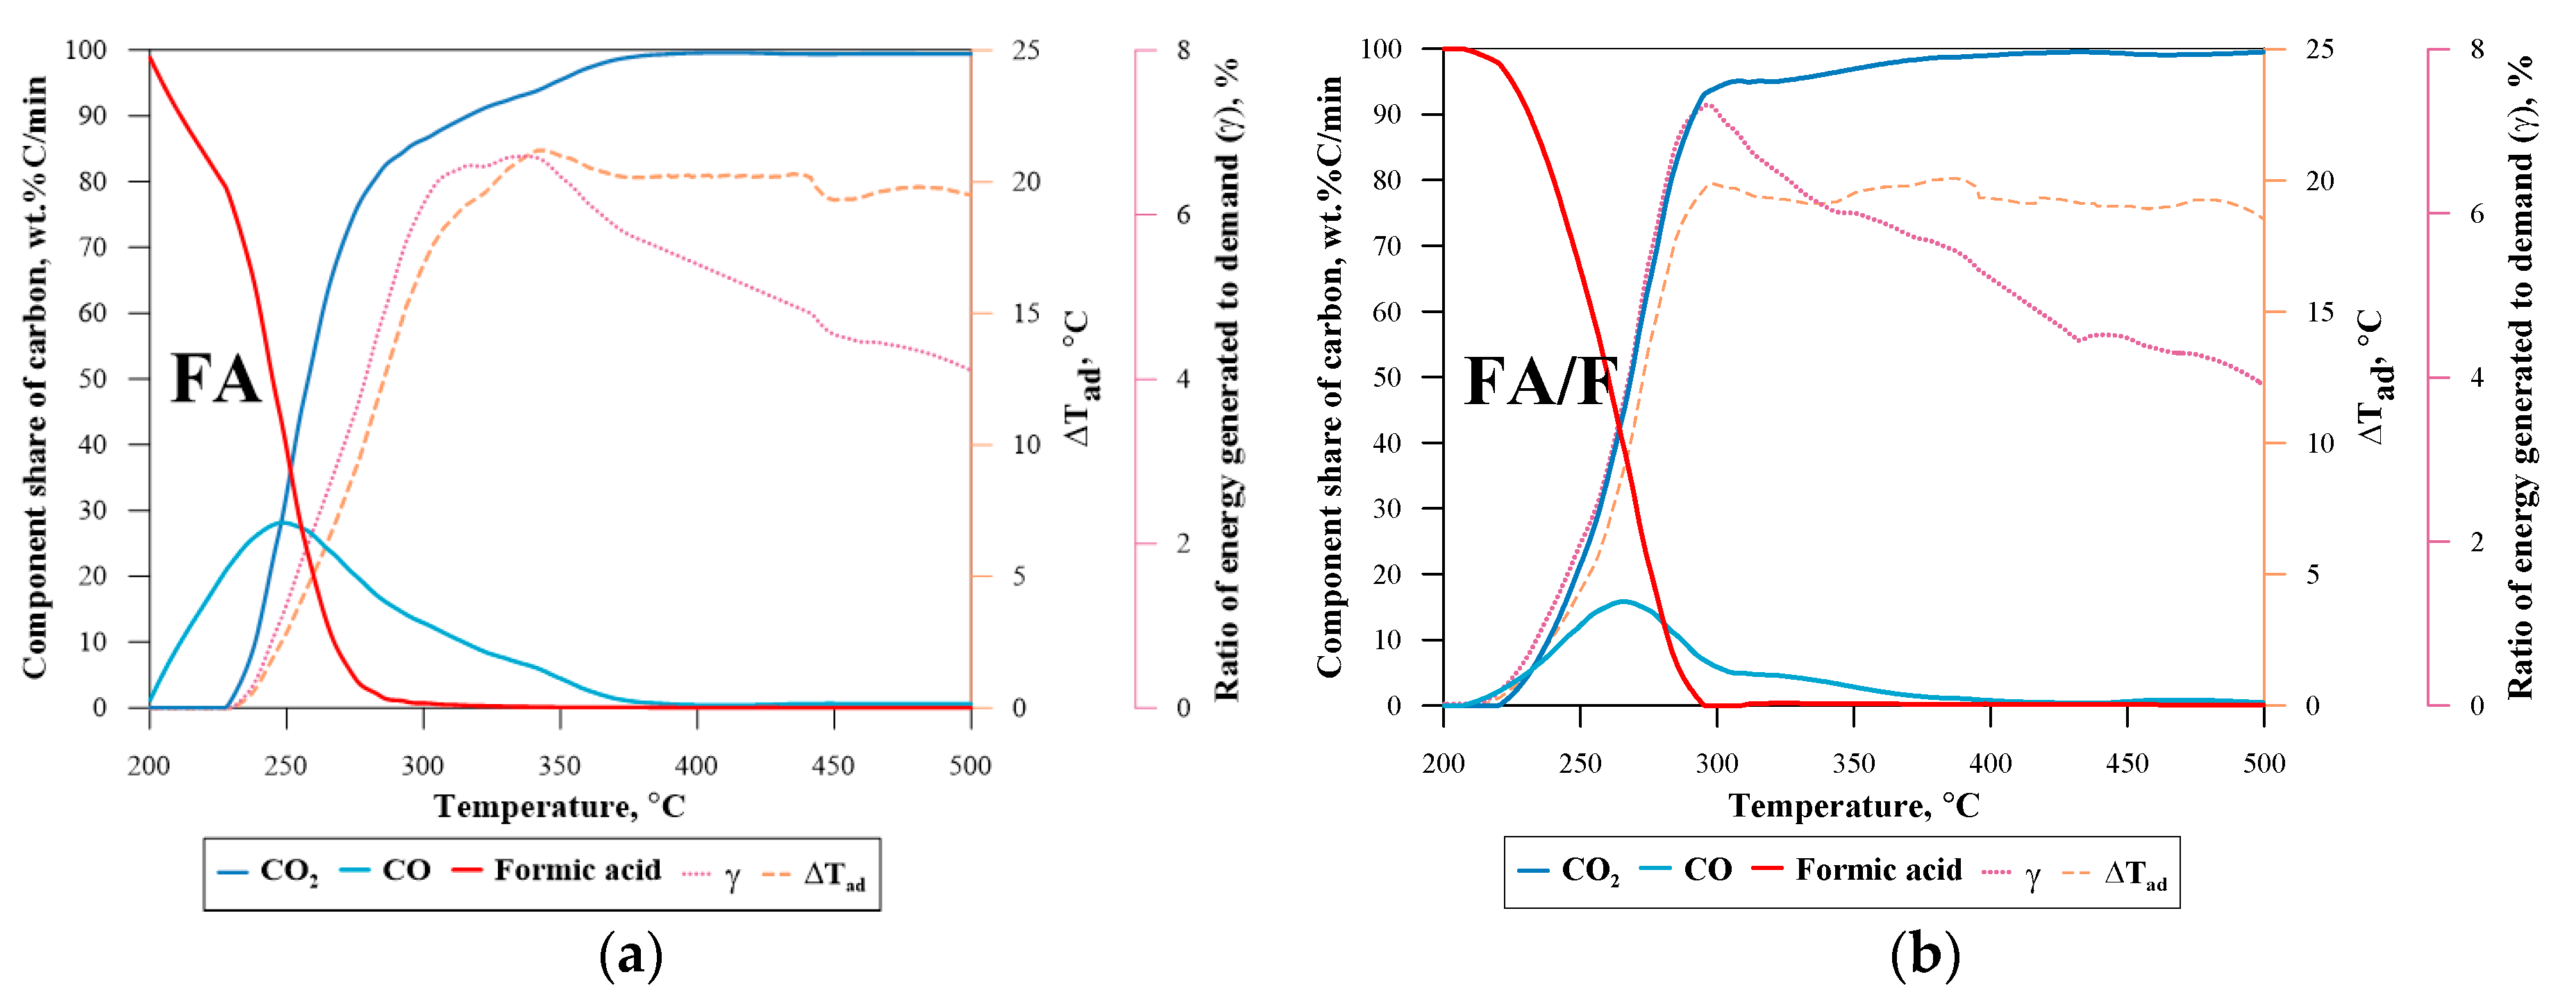
The catalytic decomposition of formic acid proceeds with the emission of only one incomplete oxidation product, namely CO (Figure 6). Interestingly, the process at extended residence time (FA, Figure 6a) is similar to the conversion of FA/F (Figure 6b), and only slight improvement can be observed. The 75% decomposition of formic acid at two times higher residence time (FA) requires only 257 °C compared with approx. 273 °C in the fast process. This is likely related to the oxidation kinetic, which is rapid and requires low energy (temperature). In that case, the limiting factor of this compound oxidation would be only the diffusion of the oxidant and not the chemical reaction on the catalyst particles.
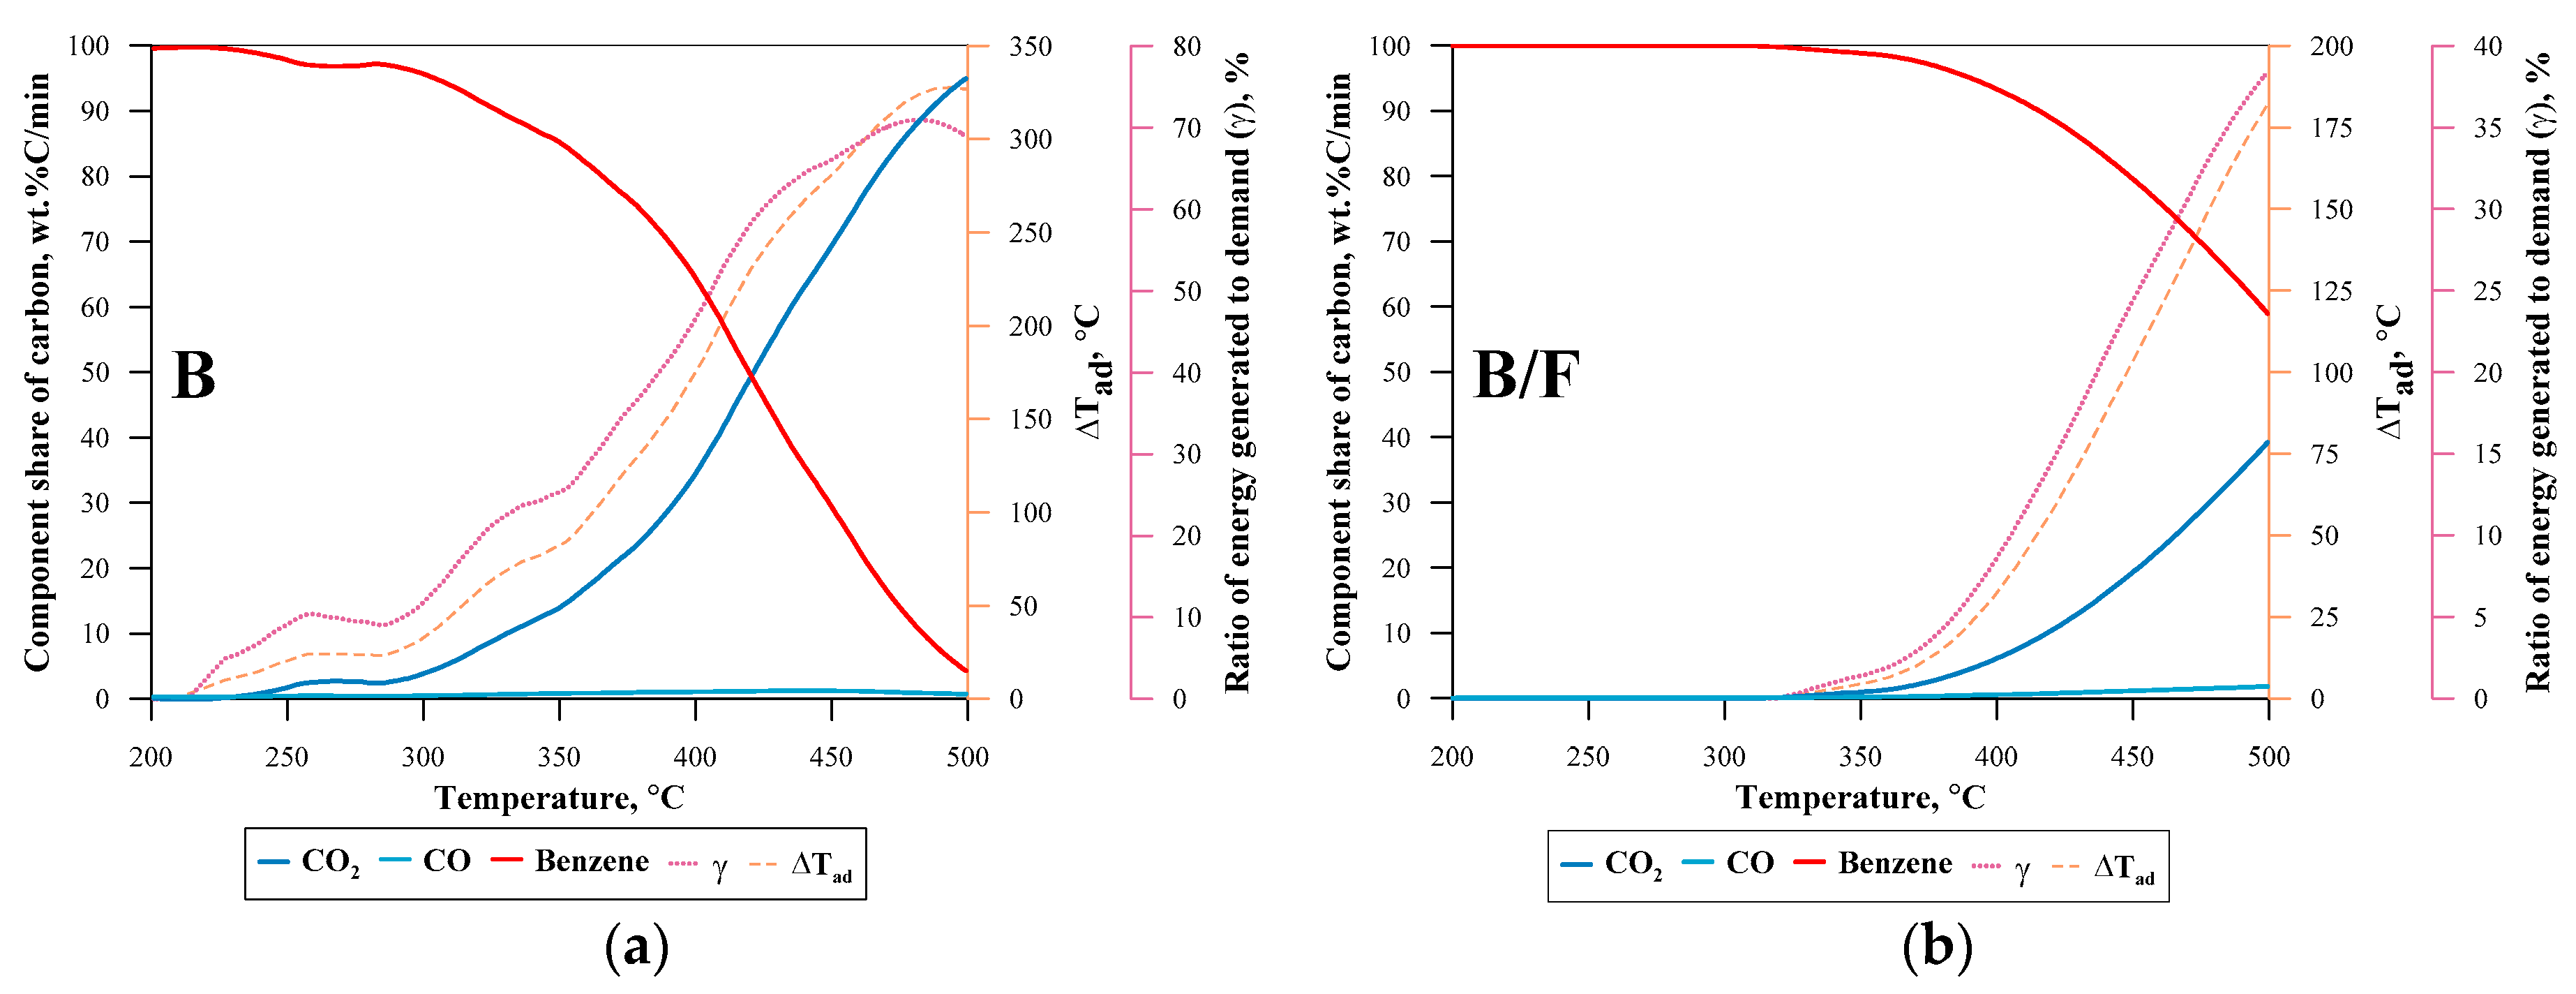
Surprisingly, incomplete catalytic oxidation of benzene is also accompanied by only slight CO emissions, while no other products of incomplete combustion were detected. This is true for both the process with doubled residence time (B) and the fast process (B/F). In the catalytic oxidation of benzene (B) at 500 °C, approx. 95% conversion of the component is achieved, while in the B/F process at this temperature, the decomposition of benzene does not exceed 40%. This indicates that the investigated catalyst is not sufficiently active in the catalytic oxidation of benzene.
The carbon dioxide concentrations that indicate complete conversion of pollutants show a similar trend (in relation to the increase in temperature) in all the cases examined. Initially, there is no or a slow increase in its concentration, followed by a rapid increase stage with an almost linear tendency. At elevated temperatures, there is a slow increase in its concentration, which is related to the slow oxidation of carbon monoxide. The only exception is benzene, where unexpectedly high concentrations of CO were not recorded.
Heat emission during the oxidation of VOCs depends on the concentration of the component, the degree of conversion, and the heat of reaction. The greatest amount of heat per mole of substrate (at 100% conversion to CO2) can be generated by n-hexane ~3886.74 kJ·mol−1, slightly less by benzene ~3169.44 kJ·mol−1 (values do not include the heat of condensation of water). The total heat generated during the oxidation of the selected VOC in relation to the energy demand for heating air (γ) is shown in Figure 4, Figure 5, Figure 6 and Figure 7. In the catalytic oxidation of n-hexane (Figure 4a T = 450 °C), it is possible to cover ~48 % of the heat energy demand (the increase in adiabatic temperature under these conditions is 206 °C). In comparison, in the fast process (Hx/F) at the same temperature, the thermal energy demand is covered in ~25%.
The highest amounts of energy are generated during benzene oxidation (Figure 7), where the demand for thermal energy (at T = 500 °C) in the fast process (B/F) is covered by 38%, while in the process (B) with twice the residence time (maximum value at T = 480 °C), it is slightly greater than 70%. The increase in adiabatic temperature during the oxidation of benzene (B) is 334 °C and is reached at 500 °C; in the fast process at the same temperature, this value slightly exceeds 190 °C.
The γ-factor during isopropyl alcohol oxidation (Figure 5) and the increase in adiabatic temperature are similar to the values achieved during the conversion of n-hexane, despite the higher initial concentration of this compound (2800 and 2600 ppmv), which is due to the lower caloric value of this compound (−1875.03 kJ/mol). An unexpected observation during isopropyl alcohol oxidation at lower temperatures (IPA < 270 °C, IPA/F < 310 °C) is the negative increase in adiabatic temperature and the negative γ-factor. This is related to the prevalence of endothermic synthesis of acetone over exothermic formation of CO and CO2.
Formic acid was supplied at low concentrations of 1100–1200 ppmv. The heat generated during its complete conversion is equal to 519.44 kJ·mol−1. As a result, its oxidation is accompanied by a small amount of heat generated (γ < 8%). In the fast process (FA/F, Figure 6b), this value is reached at T = 293 °C, while in the process with twice the residence time (FA), at T= 328 °C. The increase in adiabatic temperature during acid conversion is relatively low, only 21 °C.
The calculated heat transfer surface area of the counter-current heat exchanger (Table 3) varies from 14.2 cm2 for the conversion of benzene (B) to 1008.2 cm2 for formic acid (FA/F). A twofold increase in the feed rate of air containing the gaseous impurity results in the need to increase the temperature of the air entering the reactor (TAir2) and to increase the surface area of the heat exchanger. For example, the surface area of the exchanger during the oxidation of n-hexane increases from 33.1 to 94.6 cm2 for the Hx and Hx/F processes. Nevertheless, all exchanger surface area values (except for formic acid oxidation) appear to be acceptable from a design point of view. For example, assuming a plate exchanger consisting of five square-shaped chambers (four heat transfer surfaces), the side of the exchanger plate would be ~5.3 cm for an area of 111.3 cm2. Such an exchanger would be sufficient during catalytic oxidation of all components except formic acid. In this case, an exchanger with a plate side of ~11.2 cm (FA) and ~15.9 cm for the FA/F variant would have to be selected, which is an exceptionally large value considering the outer diameter of the reactor of 38 mm. The large surface area of the exchanger that cooperates with the formic acid oxidation reactor is due mainly to the low thermal energy produced during the oxidation process that generates a weak driving force for the heat transfer process ΔTM. For other types of VOCs, the proposed heat exchangers can successfully provide all of the energy required for the catalytic oxidation process.
A twofold increase in the volumetric flow rate of the fed air containing gaseous contamination results in an unproportionally increase in the exchanger area, as shown by the β coefficient (Table 3). For example, during benzene utilisation, the increase is nearly double (33.5 to 70.6), i.e., utilisation of the same amount of the pollutant in a fast process requires two times larger exchanger area in relation to the process with two times higher residence time. It is, therefore, advantageous to run the process with an increased residence time. The only exception is formic acid, in which a process can be realised with twice the volumetric rate of air (twice the acid flux) using an exchanger with twice the surface area, which means an identical β-factor. This is due to the similar acid conversion temperatures for the FA and FA/F processes. Thus, in this case, there is a theoretical advantage to running the FA/F process. However, as mentioned, the utilisation of acid at these concentrations forces the use of exchangers with a large surface area.
Additionally, Table 2 contains two columns that provide information on the state of the process: the weight hourly space velocity (WHSV), defined as the volumetric flow rate of air entering the reactor ( V ˙ 1a +  V ˙ 1b) divided by the mass of the catalyst active phase (4.05 g–8.2 wt.% of 50 g), and the hourly space velocity (HSV), which is the volumetric flow rate of air entering the reactor divided by the volume of the cenospheric bed (0.127 L). When analysing the values of the review publications [24,25], it can be concluded that the fluidised bed process is carried out at a relatively high temperature (for example, benzene may be removed at temperature <250 °C, Table 2 in [24]). Furthermore, the HSV value is lower than the literature values (for the same compound, this value is 4000–100,000), indicating that the reactor volume needs to be increased to decompose the tested compounds. On the other hand, the potentially unfavourable results do not disqualify the proposed process approach. Researchers often focus on porous stationary beds with a low catalyst mass (less than 100 mg) or on the use of nanoparticles. Such studies provide a perspective on the catalyst activity but do not allow for a full evaluation of the potential industrial application of the process. Therefore, it is difficult to make a direct comparison with the proposed method. As mentioned, the advantages of the fluidised bed are undoubtedly the ease of scaling up the reactor and the resistance to dust contamination, in contrast to fixed bed reactors. However, further research is needed to improve the efficiency of the process, e.g., by using more active catalysts that can be implemented in fluidised bed reactors.

4. Conclusions

Cenospheres coated with an Fe2O3 layer are materials that can be used in the process of catalytic oxidation of VOCs in a fluidised bed. The catalytic oxidation of isopropanol is accompanied by the emission of incomplete combustion products, such as CO, acetone, acetaldehyde, and formaldehyde, which was detected only in trace amounts. The decomposition of isopropanol with a concentration of 2800 ppmv in polluted air stream of 0.4 L·min−1 is possible at a temperature of approx. 400 °C; however, small amounts of CO are present in the exhaust gases, even at T = 500 °C. Oxidation of n-hexane, as in the case of isopropanol, produces acetaldehyde and formaldehyde, and the temperature of complete conversion to CO2 (1700 ppmv, 0.4 L·min−1) is approx. 500 °C. The oxidation of benzene and formic acid is not accompanied by the emission of aldehydes, and the only analysed product of incomplete combustion is CO. Complete oxidation of HCOOH (1200 ppmv, 0.4 L·min−1) to carbon dioxide is possible at a temperature of approx. 370 °C. At 500 °C, 95% conversion of benzene (3500 ppmv, 0.4 L·min−1) to CO2 is achieved.
A twofold increase in the volumetric flow rate of the contaminated air introduced into the fluidised bed reactor (while maintaining a similar concentration of the compound) results in an increase in the decomposition temperature of VOCs (~20–80 °C). Additionally, a decrease in efficiency is observed because there is a disproportionate increase in the surface area of the heat exchanger in relation to the increase in the flow of contaminated air.
The emission of thermal energy during HCOOH combustion with a concentration of 1100–1200 ppmv is insufficient for the process to be carried out under autothermal conditions, even with the use of heat recuperation. However, there is a theoretical possibility of conducting the process in an autothermal conditions for other gaseous components, provided that recuperation is used.

Supplementary Materials

The following supporting information can be downloaded at: https://www.mdpi.com/article/10.3390/en16062801/s1, Figure S1: Progress of the catalytic oxidation process of VOCs: (a) Hx 50 g cenospeheres; (b) Hx 25 g Fe2O3/cenospheres. Table S1: Enthalpy of formation in the gaseous state of the examined compounds.

Author Contributions

Conceptualization and methodology, W.Ż. and P.M.; formal analysis and investigation, P.M.; data curation, D.B.; writing—original draft preparation, P.M. and D.B.; writing—review and editing, W.Ż.; funding acquisition, P.M. All authors have read and agreed to the published version of the manuscript.

Funding

This research was funded by National Science Center—Poland, grant number 2022/06/X/ST8/00628.

Data Availability Statement

The data presented in this study are available on request from the corresponding author.

Conflicts of Interest

The authors declare no conflict of interest.

Abbreviations

TSCTemperature inside the scrubber, °C
  V ˙ Volumetric flow rate at standard conditions, L·min−1
  m ˙ i t Mass flow rate (as function of time) of selected compound, kg·s−1
  T t B e d Temperature of the fluidised bed at time t, °C
ΔTadIncrease in adiabatic temperature inside the reactor, °C
TExh1Flue gas temperature at fluidised reactor outlet (heat exchanger inlet), °C
TExh2Flue gas temperature at heat exchanger outlet, °C
TAir1Air temperature at the heat exchanger inlet, °C
TAir2Air temperature at the heat exchanger outlet (reactor inlet), °C
ΔTMMean temperature difference in heat exchanger, °C
T25%Temperature of 25 %wt. VOCs decomposition, °C
T50%Temperature of 50 %wt. VOCs decomposition, °C
T75%Temperature of 75 %wt. VOCs decomposition, °C
  Δ f H g a s   i o Enthalpy of selected compound formation in the gaseous state, J·kg−1
  A H . E . Heat exchange area, cm2
  U Total heat transfer coefficient, W·m−2·K−1
  C p A i r T Heat capacity of air at constant pressure as temperature function J·kg−1·°C−1
  ρ A i r T Air density as temperature function, kg·m−3
βEfficiency coefficient, cm2·min−1·L−1
γ Ratio between the theoretical energy generated by the reaction in relation to the energy demand for heating the air
  Q React . t Heat generated at time t during catalytic oxidation of selected compound, W
  Q Air Heat demand to warm air from TAir1 to TAir2, W
  Q Exh Heat taken from the exhaust during the cooling process from TExh1 to TExh2, W

References

  1. Tokumura, M.; Nakajima, R.; Znad, H.T.; Kawase, Y. Chemical absorption process for degradation of VOC gas using heterogeneous gas-liquid photocatalytic oxidation: Toluene degradation by photo-Fenton reaction. Chemosphere 2008, 73, 768–775. [Google Scholar] [CrossRef] [PubMed]
  2. Kolade, M.A.; Kogelbauer, A.; Alpay, E. Adsorptive reactor technology for VOC abatement. Chem. Eng. Sci. 2009, 64, 1167–1177. [Google Scholar] [CrossRef]
  3. Biard, P.F.; Couvert, A.; Renner, C.; Levasseur, J.P. Assessment and optimisation of VOC mass transfer enhancement by advanced oxidation process in a compact wet scrubber. Chemosphere 2009, 77, 182–187. [Google Scholar] [CrossRef] [PubMed]
  4. Chauveau, R.; Grévillot, G.; Marsteau, S.; Vallières, C. Values of the mass transfer coefficient of the linear driving force model for VOC adsorption on activated carbons. Chem. Eng. Res. Des. 2013, 91, 955–962. [Google Scholar] [CrossRef]
  5. Lhuissier, M.; Couvert, A.; Dabert, P.; Amrane, A.; Kane, A.; Audic, J.L.; Dumont, E. Removal of a Mixture of Seven Volatile Organic Compounds (VOCs) Using an Industrial Pilot-Scale Process Combining Absorption in Silicone Oil and Biological Regeneration in a Two-Phase Partitioning Bioreactor (TPPB). Energies 2022, 15, 4576. [Google Scholar] [CrossRef]
  6. Huang, Y.; Ho, S.S.H.; Niu, R.; Xu, L.; Lu, Y.; Cao, J.; Lee, S. Removal of indoor volatile organic compounds via photocatalytic oxidation: A short review and prospect. Molecules 2016, 21, 56. [Google Scholar] [CrossRef] [Green Version]
  7. Matsumoto, D.; Diniz, L.A.; Castro, L.S.; Teixeira, A.C.S.C.; Guardani, R.; de Paiva, J.L. Kinetic modeling and experimental validation of a photocatalytic fluidized bed reactor for n-hexane degradation. Braz. J. Chem. Eng. 2019, 36, 1561–1570. [Google Scholar] [CrossRef] [Green Version]
  8. Debono, O.; Thevenet, F.; Gravejat, P.; Hequet, V.; Raillard, C.; Lecoq, L.; Locoge, N. Toluene photocatalytic oxidation at ppbv levels: Kinetic investigation and carbon balance determination. Appl. Catal. B Environ. 2011, 106, 600–608. [Google Scholar] [CrossRef]
  9. Li, C.-y.; Jia, Y.-r.; Zhang, X.-c.; Zhang, S.-y.; Tang, A.-d. Photocatalytic degradation of formaldehyde using mesoporous TiO2 prepared by evaporation-induced self-assembly. J. Cent. South Univ. 2014, 21, 4066–4070. [Google Scholar] [CrossRef]
  10. Alshorifi, F.T.; Alswat, A.A.; Mannaa, M.A.; Alotaibi, M.T.; El-Bahy, S.M.; Salama, R.S. Facile and Green Synthesis of Silver Quantum Dots Immobilized onto a Polymeric CTS-PEO Blend for the Photocatalytic Degradation of p-Nitrophenol. ACS Omega 2021, 6, 30432–30441. [Google Scholar] [CrossRef]
  11. Scirè, S.; Minicò, S.; Crisafulli, C.; Galvagno, S. Catalytic combustion of volatile organic compounds over group IB metal catalysts on Fe2O3. Catal. Commun. 2001, 2, 229–232. [Google Scholar] [CrossRef]
  12. Kang, J.; Wang, Z.; Yang, Z.; Yan, Y.; Ran, J.; Guo, M. Catalytic Combustion of Low-Concentration Methane over Mx-Cu/γ-Al2O3 (M = Mn/Ce) Catalysts. Ind. Eng. Chem. Res. 2020, 59, 4291–4301. [Google Scholar] [CrossRef]
  13. Sophiana, I.C.; Topandi, A.; Iskandar, F.; Devianto, H.; Nishiyama, N.; Budhi, Y.W. Catalytic oxidation of benzene at low temperature over novel combination of metal oxide based catalysts: CuO, MnO2, NiO with Ce0.75Zr0.25O2 as support. Mater. Today Chem. 2020, 17, 1–9. [Google Scholar] [CrossRef]
  14. Zuo, S.; Liu, F.; Tong, J.; Qi, C. Complete oxidation of benzene with cobalt oxide and ceria using the mesoporous support SBA-16. Appl. Catal. A Gen. 2013, 467, 1–6. [Google Scholar] [CrossRef]
  15. Leclercq, J.; Giraud, F.; Bianchi, D.; Fiaty, K.; Gaillard, F. Novel inductively-heated catalytic system for fast VOCs abatement, application to IPA in air. Appl. Catal. B Environ. 2014, 146, 131–137. [Google Scholar] [CrossRef]
  16. Kwong, K.Y.; Marek, E.J. Combustion of Biomass in Fluidized Beds: A Review of Key Phenomena and Future Perspectives. Energy Fuels 2021, 35, 16303–16334. [Google Scholar] [CrossRef]
  17. Żukowski, W.; Berkowicz, G. The combustion of liquids and low-density solids in a cenospheric fluidised bed. Combust. Flame 2019, 206, 476–489. [Google Scholar] [CrossRef]
  18. Okasha, F.M.; Zeidan, E.S.B. Experimental study on propane combustion in a novel fluidized bed configuration. Fuel Process. Technol. 2013, 116, 79–84. [Google Scholar] [CrossRef]
  19. Wang, L.; Wu, P.; Ni, X. Combustion of liquid petroleum gas in a fluidized bed furnace with a jetting-mixing distributor. Powder Technol. 2006, 170, 86–93. [Google Scholar] [CrossRef]
  20. Okasha, F.; Zaater, G.; El-Emam, S.; Awad, M.; Zeidan, E. Co-combustion of biomass and gaseous fuel in a novel configuration of fluidized bed: Combustion characteristics. Fuel 2014, 133, 143–152. [Google Scholar] [CrossRef]
  21. Miccio, F.; Raganati, F.; Ammendola, P.; Okasha, F.; Miccio, M. Fluidized bed combustion and gasification of fossil and renewable slurry fuels. Energies 2021, 14, 7766. [Google Scholar] [CrossRef]
  22. Ranjbar, N.; Kuenzel, C. Cenospheres: A review. Fuel 2017, 207, 1–12. [Google Scholar] [CrossRef]
  23. Sathasivam, S.; Williamson, B.A.D.; Althabaiti, S.A.; Obaid, A.Y.; Basahel, S.N.; Mokhtar, M.; Scanlon, D.O.; Carmalt, C.J.; Parkin, I.P. Chemical Vapor Deposition Synthesis and Optical Properties of Nb2O5 Thin Films with Hybrid Functional Theoretical Insight into the Band Structure and Band Gaps. ACS Appl. Mater. Interfaces 2017, 9, 18031–18038. [Google Scholar] [CrossRef] [PubMed]
  24. He, C.; Cheng, J.; Zhang, X.; Douthwaite, M.; Pattisson, S.; Hao, Z. Recent Advances in the Catalytic Oxidation of Volatile Organic Compounds: A Review Based on Pollutant Sorts and Sources. Chem. Rev. 2019, 119, 4471–4568. [Google Scholar] [CrossRef] [PubMed]
  25. Tomatis, M.; Xu, H.H.; He, J.; Zhang, X.D. Recent Development of Catalysts for Removal of Volatile Organic Compounds in Flue Gas by Combustion: A Review. J. Chem. 2016, 2016, 15. [Google Scholar] [CrossRef] [Green Version]
  26. NIST Chemistry WebBook. Available online: https://webbook.nist.gov/chemistry/name-ser/ (accessed on 14 March 2023).
  27. Engineering ToolBox. Available online: https://www.engineeringtoolbox.com/ (accessed on 14 March 2023).
  28. Żukowski, W.; Migas, P.; Gwadera, M.; Larwa, B.; Kandafer, S. A numerical analysis of heat transfer in a cross- current heat exchanger with controlled and newly designed air flows. Open Chem. 2018, 16, 627–636. [Google Scholar] [CrossRef]
Figure 1. The equipment for combustion process (A) for MO-CVD deposition (B) and potential system with heat exchanger (C): 1—Air flow meters (1a—Concentrated VOC+Air, 1b—Air, 1c—Lean VOC+Air, 1d—Nitrogen), 2—Air blower, 3—Scrubber with selected compounds, 4—Temperature control and measurement system, 5—Fluidised bed reactor with heater, 6—Additional air, 7—FTIR analyser, 8—Flue gas outlet, 9—Fe(CO)5 dosing inlet, and 10—Heat exchanger.
Energies 16 02801 g001
Figure 2. Gas FTIR spectra: sample spectrum—recorded at catalytic oxidation of isopropyl alcohol at 325.4 °C, reference spectra of analysed compounds, calculated spectrum and residual spectrum; with the 3 analysis areas marked.
Energies 16 02801 g002
Figure 3. Analysis areas with reference spectra of the compounds analysed (magnified fragments of Figure 2): (a) Analysis Area 1, (b) Analysis Area 2, and (c) Analysis Area 3.
Energies 16 02801 g003
Figure 4. Progress of the catalytic oxidation process of VOCs in the bed made of 50 g Fe2O3/cenospheres catalyst: (a) Hx and (b) HX/F.
Energies 16 02801 g004
Figure 5. Progress of the catalytic oxidation process of VOCs in the bed made of 50 g Fe2O3/cenospheres catalyst: (a) IPA and (b) IPA/F.
Energies 16 02801 g005
Figure 6. Progress of the catalytic oxidation process of VOCs in the bed made of 50 g Fe2O3/cenospheres catalyst: (a) FA and (b) FA/F.
Energies 16 02801 g006
Figure 7. Progress of the catalytic oxidation process of VOCs in the bed made of 50 g Fe2O3/cenospheres catalyst: (a) B and (b) B/F.
Energies 16 02801 g007
Table 1. Selected process parameters.
No.LabelVOCTSCConcentration of VOC, ppmv   V ˙ 1a mL·min−1   V ˙ 1b L·min−1   V ˙ 1c L·min−1
1Hxn-Hexane3.5–4.0 °C17001001.50.4
2Hx/Fn-Hexane3.5–4.0 °C15001001.50.8
3IPAIsopropanol30.0–30.5 °C28001800.90.4
4IPA/FIsopropanol30.0–30.5 °C26001800.90.8
5FAFormic acid30.0–30.5 °C12001001.50.4
6FA/FFormic acid30.0–30.5 °C11001001.50.8
7BBenzene40.0–40.5 °C35001800.90.4
8B/FBenzene40.0–40.5 °C37001800.90.8
Table 2. Temperature of VOC decomposition degree (mass weight basis).
No.LabelT25%, °CT50%, °CT75%, °CWHSV,
L·g−1·h−1
HSV,
h−1
1Hx332.6370.7402.123.7755.9
2Hx/F397.4427.0482.323.7755.9
3IPA240.8279.1305.316.0510.2
4IPA/F286.6317.5344.016.0510.2
5FA231.2244.9256.823.7755.9
6FA/F243.9260.1273.023.7755.9
7B379.5419.6456.716.0510.2
8B/F462.2--16.0510.2
Table 3. Selected parameters and heat exchange area for counter-flow heat exchanger.
VOCLabelTAir1, °CTAir2, °CTExh1, °CTExh2, °CQExh, WAH.E., cm2β, cm2·min−1·L−1
n-HexaneHx252805002452.233.182.7
* n-HexaneHx/F253806002456.294.6118.2
IsopropanolIPA253205002052.547.0117.5
* IsopropanolIPA/F253705502056.0111.3139.1
Formic acidFA25380400453.0504.11260.2
Formic acidFA/F25380400456.01008.21260.2
* BenzeneB251905203551.414.235.5
* BenzeneB/F253406703555.656.570.6
* Due to insufficient compound conversion, the TExh1 values were extrapolated. The assumptions were based on the conversion results (Figure 4, Figure 5, Figure 6 and Figure 7).
Disclaimer/Publisher’s Note: The statements, opinions and data contained in all publications are solely those of the individual author(s) and contributor(s) and not of MDPI and/or the editor(s). MDPI and/or the editor(s) disclaim responsibility for any injury to people or property resulting from any ideas, methods, instructions or products referred to in the content.