Article

Comprehensive Benefit Analysis of Port Shore Power Based on Carbon Trading

School of Electrical Engineering, Guangxi University, Nanning 530004, China
*
Author to whom correspondence should be addressed.
Energies 2023, 16(6), 2755; https://doi.org/10.3390/en16062755
Submission received: 7 February 2023 / Revised: 12 March 2023 / Accepted: 13 March 2023 / Published: 15 March 2023
(This article belongs to the Special Issue Modeling Energy–Environment–Economy Interrelations)

Abstract

:
The concept of “oil to electricity” is crucial for expanding the share of electricity in final energy consumption as well as for encouraging energy efficiency and emission reduction. Initially, a multidimensional strategy analysis is conducted for the government, ports, and ships concerned. From an economics perspective, a mathematical model of electricity substitution benefit analysis based on multiagent cooperative game theory under cap and trade and carbon tax policies is constructed, and the effect of carbon emissions caused by ships on the environment and society is converted into economic value. How several variables, such as transformation costs, ship electricity consumption, subsidy rates, carbon tax prices, and the ratio of shore power usage time to berthing time, affect the functioning of shore power is analyzed. The best electricity price under various circumstances is determined while considering the benefits of the three parties to maximize social welfare. The reduction in carbon dioxide and pollutant emissions is calculated. Meanwhile, the environmental advantages of the “replacement of oil with electricity” procedure are estimated. An example supports the claim that the suggested modeling approach can successfully resolve the economic benefits of each participant for the period that fosters the growth of electricity replacement projects and offers a sound scientific foundation for the formation of pertinent legislation.

1. Introduction

Seaborne trade stalled in 2020 amid the COVID-19 epidemic and the anticipated downturn in global economic growth. Surveys conducted by UNCDAT have revealed that the world container throughput declined by 1.2% to 815.6 million 20-foot TEUs [1]. Governments advocated for citizens to stay inside to prevent contact, which tremendously accelerated the rise of international e-commerce. The distribution of vaccines has slowed the epidemic’s growth and deaths, enabling the recovery of international trade. The beginning of the economic recovery was heralded in 2021, with seaborne trade predicted to increase by 4.3% [2]. The maritime sector’s quick ascent has resulted in significant emissions of pollutants such as CO2, SO2, and NOx. As of 2012, shipping was responsible for 972 million tons of greenhouse gas release, or 2.5% of all releases worldwide [3]. It not merely raises the global temperature but also leads to respiratory illnesses in those who live close to ports and coastlines [4]. There is a consensus among experts that 60% to 90% of the diffusion in ports stems from ships, which also account for 70% of marine diffusion [5].
Several nations and international organizations are pursuing numerous explorations and research to lessen the issue of pollution discharge from ships. Based on the “IMO 2020” guideline, ships operating outside specified emission-control areas can diminish sulfur oxide outflow by 8.5 million tons while exploiting low-sulfur oil with a sulfur content of 0.50% m/m [6]. More than 570,000 residents will die prematurely if the SOx limit reduction is postponed from 2020 to 2025 [7]. Even though low-sulfur oil modestly reduces NOx discharge by 10% [8], the maritime industry still contributes to 250,000 fatalities [9]. The usage of shore power minimizes pollution emissions by 94–97% when berthing at the port [10]. It satisfies fundamental needs such as lighting, cooling, and communication, notably improving air quality [11], decreasing carbon emissions by 800,000 tons, and elevating environmental benefits [12,13].
The present literature on shore power is confined and centers especially on technology [14,15], economy [16,17], management [18,19], policy promotion [20], etc. One study by Qi [8] observed the trend in obstacles to the upgrading of shore power in China, focusing on the economic evaluation for different stakeholders. Zhao [21] considered the effects of port size, fines, and subsidies on the evolutionary game to analyze the financial relationship between the government and the port. A mathematical model was constructed by Wu [22] to investigate how government subsidy schemes might help shorten the outflow from ship berths. Song [23] set up four parties, the government, the port, the ship, and the power grid, then pondered the cost-effectiveness of each in the shore power system to calculate the optimal shore power price. Through quantitative evaluation, Tseng [24] demonstrated that environmental policies levying pollution taxes can immensely suppress pollutant discharge.
The global community has agreed on limiting carbon emissions since the “Kyoto Protocol” took effect. On the one hand, developed nations such as the European Union, Japan, and Australia were the first to adopt cap-and-trade and carbon tax policies, which victoriously decreased CO2 emissions [25]. On the other hand, China pledged to achieve carbon neutrality by 2060 at the 75th UN General Assembly. However, there are few surveys on the carbon trade mechanism of shore power, and the majority of studies concentrate on economic factors. Murray [26] discovered the carbon price legislation lowered British Columbia’s emissions by 5–15% through modeling. The EU Emissions Trading Scheme’s implementation has resulted in a 0.5–2 million ton CO2 reduction [27]. Song [28] developed a stochastic model to explore the effects of various carbon tax rates on the growth of logistical capacity. A dual-objective optimization model was developed by Liu [29] to discuss the liner’s best performance under the carbon tax policy. Chen [30] described a social optimal welfare model to assess how carbon taxes affect production, consumption, and redistribution.
This study uses multiagent game behavior as its research object in the “oil-to-electricity” conversion process. Economically speaking, the government, the port, and the ship are strategically examined, and the cost of the port includes the value of the carbon. The whole social welfare is maximized by the favorable shore electricity price. The environmental advantages of “oil-to-electricity” are counted simultaneously.

2. Electricity Substitution Multiagent Game Model

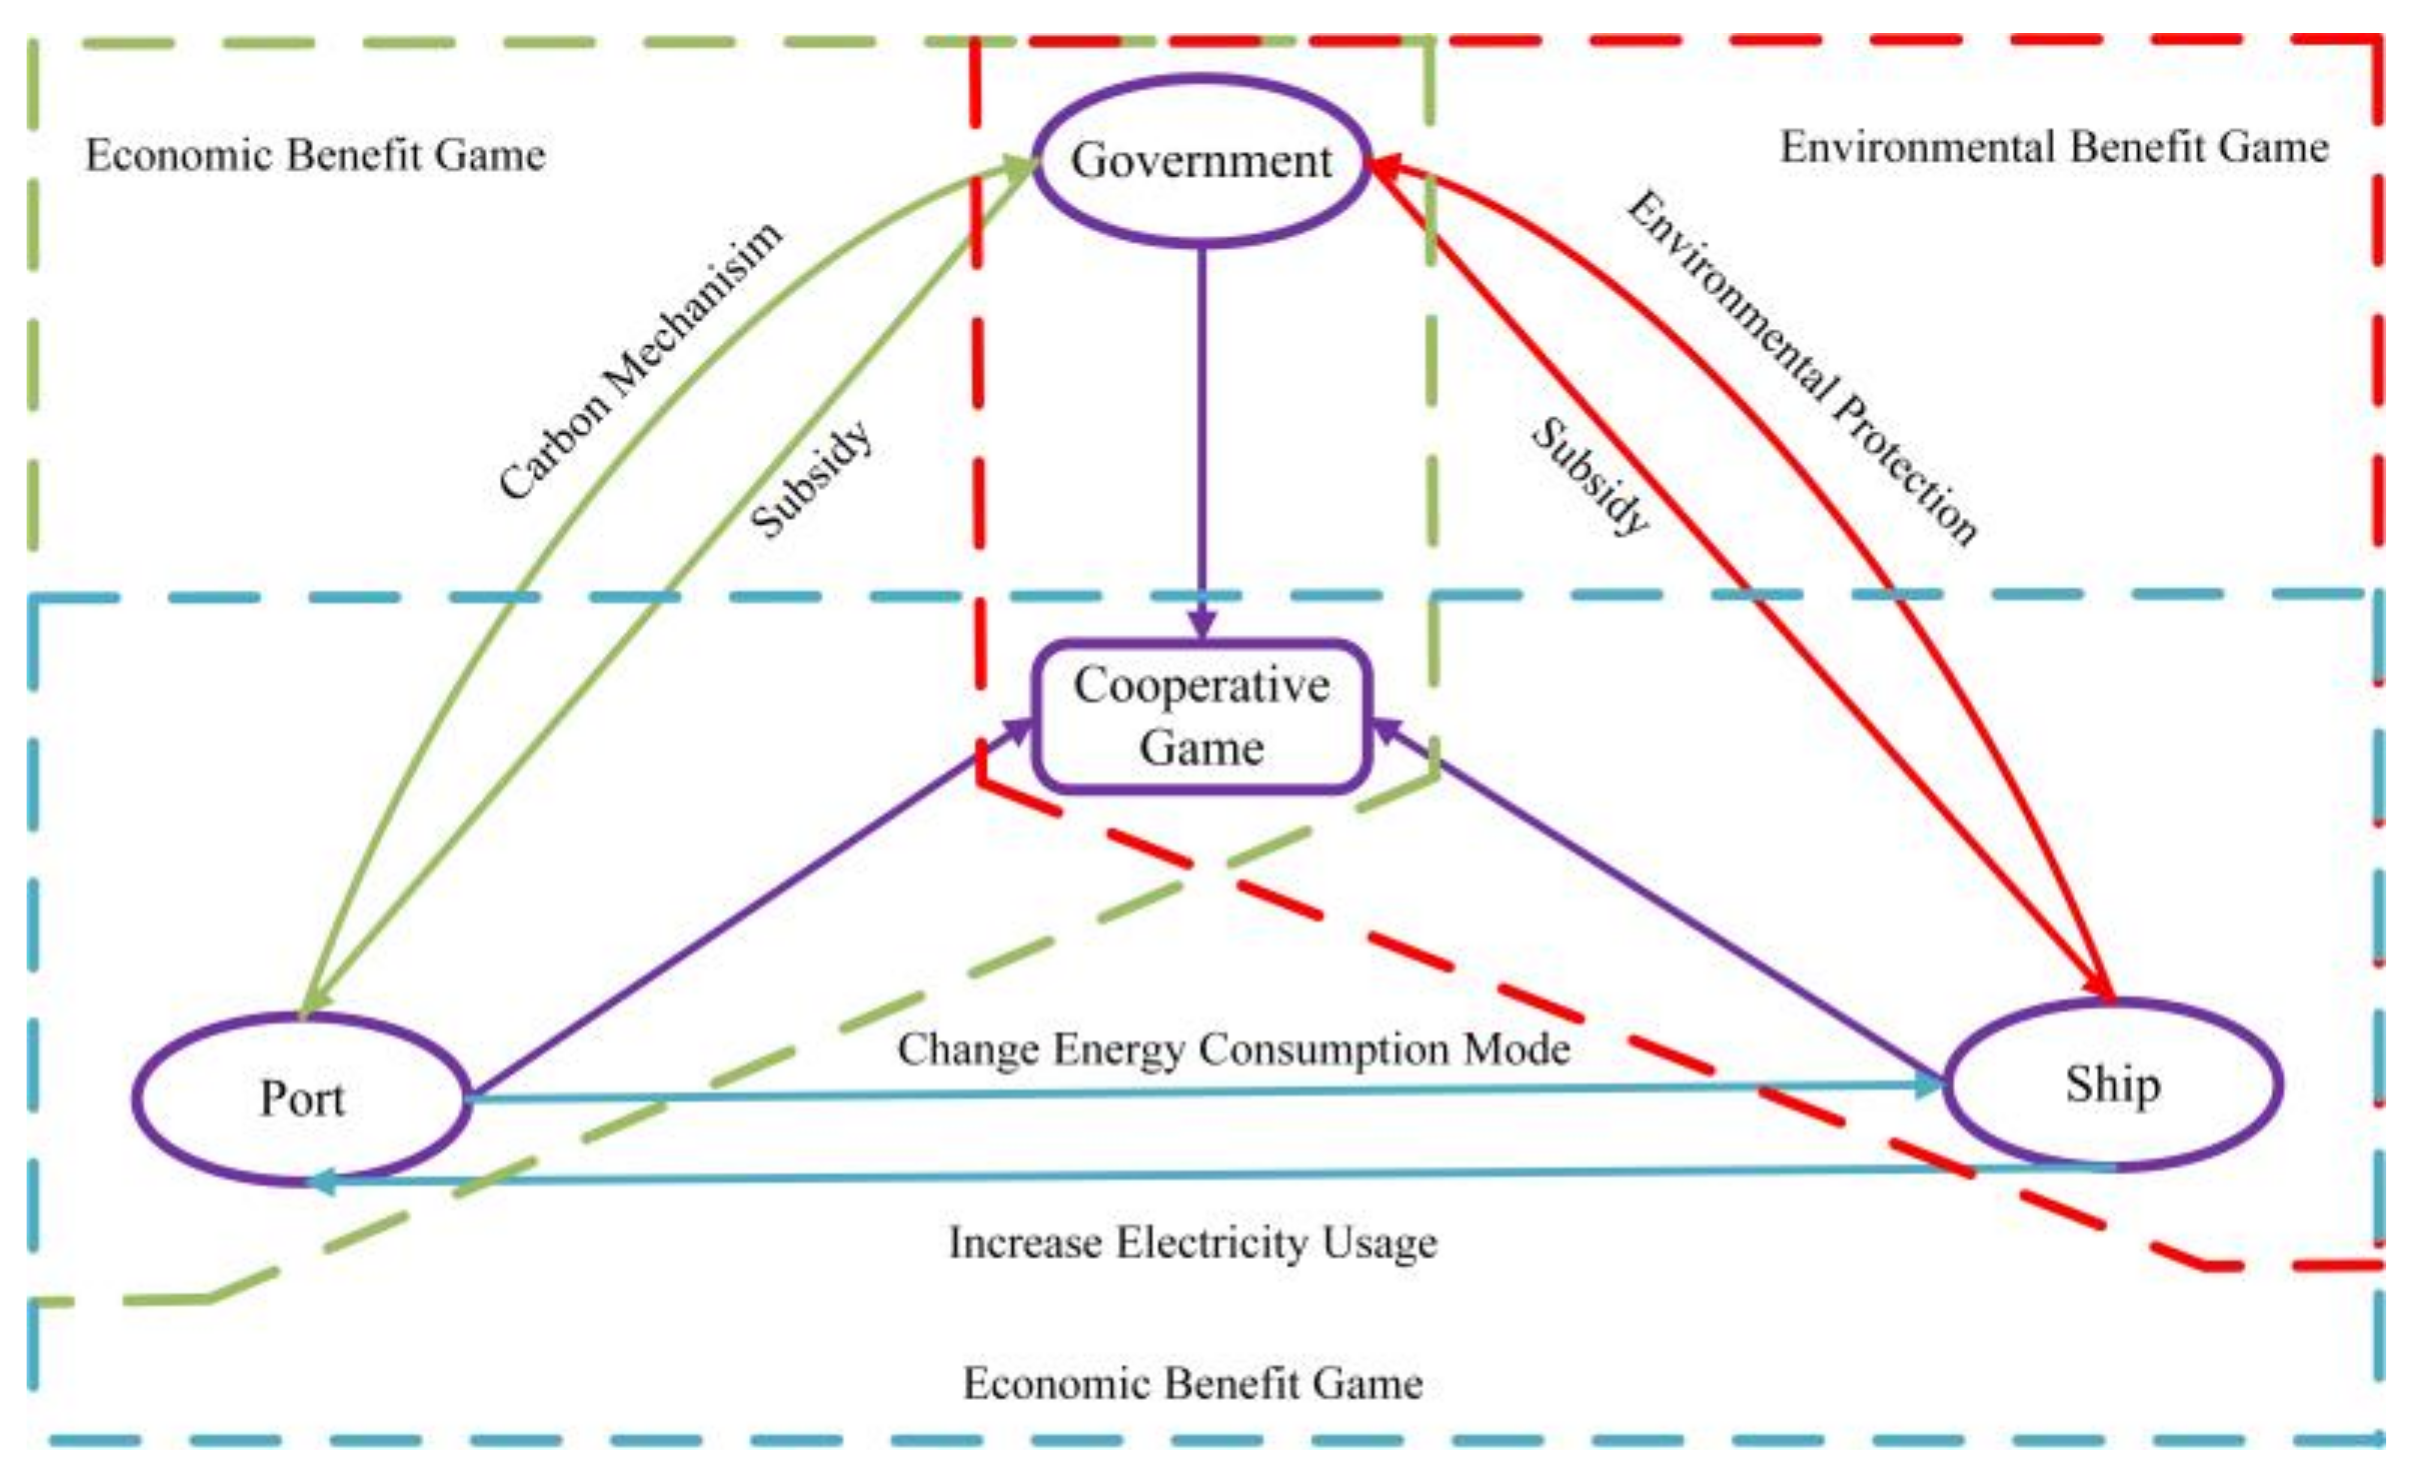
2.1. Multiagent Game Analses

Figure 1 depicts the evolution of port shore power based on a cooperative game. Due to the contradictory objectives being sought by the government, port, and ships while replacing electricity, a game of interests has developed.
Ships consuming fuel oil pollute the environment, harm locals’ health, and make it more difficult to achieve carbon neutrality, all of which run counter to the government’s stated environmental objectives. From an economic and market standpoint, shipping corporations feel there are few ports with the ability to supply shore power, whereas ports think there are not many ships with the capability to use shore power. Nobody wants to take the initiative and make themselves passive. Now is the time for the government to take a two-pronged strategy and develop policies that would encourage the implementation of shore power projects through incentives and sanctions.
The government subsidizes port renovation and applies carbon emission controls to increase port operating costs. The government encourages the development of the energy structure by funding ship retrofits while imposing environmental protection tariffs on pollutants released through the use of fuel oil. By giving priority to berthing for ships using shore power, ports can entice ship retrofits. Ships can decide whether to employ shore power depending on their financial circumstances.
Consequently, the three parties’ game is impacted by the subsidy rate, carbon mechanism, environmental protection tax, and shore electricity price. The ideal shore power pricing can be attained in the endless game, allowing the electric energy replacement effort to continue.
This article proposes a simple method to calculate the carbon emissions of ports, which only considers the carbon emissions of ships. Other equipment will not be considered, such as harbor railway, quayside container crane, locomotive, and other special machinery. We calculate the carbon emissions of ships using fuel oil and shore power and add the carbon emissions to the economic value, including the port cost. Then, the tripartite economic game models under the two carbon mechanisms are established, respectively, and the impact of the power supply service price, the carbon price, and the proportion of the time using shore power to the docking time on the social welfare, government benefits, port benefits, and ship benefits is discussed.

2.2. Assumptions

To simplify the problem and facilitate modeling and subsequent analysis and discussion, the following assumptions are proposed for the research content:
  • The government stipulates carbon emission caps or implements carbon tax policies for ports;
  • The created carbon emissions belong to the port once the ship has berthed there.

2.3. Methodology

In order to address climate change, the Ministry of Ecology and Environment of China has formulated “Implementation Plan for Setting and Allocating the Total Amount of Carbon Emission Trading Quotas for 2019–2020 (Power Generation Sector)”, which includes enterprises or other economic organizations that emit 26,000 ton of carbon dioxide equivalent or more in any one year from 2013 to 2019. As carbon emissions trading management has only just started, the central government is currently only regulating the power sector. However, in places such as Guangdong Province and Shanghai, it has already started to cover industries such as steel, chemicals, cement, paper, and aviation. The allocation methods are mainly the historical intensity method and the historical emissions method. The former is applicable to industrial enterprises with a high correlation between product output and carbon emissions, and well measured. The latter is suitable for industrial enterprises where the boundary has changed significantly in recent years and it is difficult to apply the industry baseline method or the historical intensity method.
In the historical intensity method, the annual base quota for enterprises is equal to the historical intensity base multiplied by the annual business volume. The historical intensity base is the weighted average of the enterprise’s annual business volume of carbon emissions in the previous three years. The annual business volume is the business volume data of the enterprise for the current year verified by a third party verification agency and validated and confirmed by the relevant departments. In the historical emissions approach, an enterprise’s annual base allowance is equal to the historical emissions base. In this article, port companies use the historical intensity method and carbon emissions from ports only consider carbon emissions from ships, not from other equipment such as shoreside cranes and locomotives. Thus, carbon emissions are only relevant to the activities of the ship, and the oil or electricity consumed per unit of power has a relevant carbon emission factor to calculate carbon emissions.

2.4. Parameter Descriptions

The following is a description of the parameters that appear in the mathematical model of the three-way game.
P k , i = W sp k , i / T sp k , i W sp k = i = 1 N i W sp k , i W oil k = i = 1 N i P k , i T k , i T sp k , i W k = W sp k + W oil k
where k denotes the year; i denotes the type of ships; P k , i is the power of the ship’s auxiliary engine, kWh; W sp k is the power consumed by the ship using shore power, kWh; W oil k is the power consumed by the ship using fuel oil, kWh; W k is the total power consumption of the ship, kW h; T k , i is the berthing time of the ship, h; T sp k , i is the time when the ship uses shore power, h.
C dj k = C grid k + C serve k
C e k = W sp k C grid k C sp k = W sp k C dj k T e k = C e k / 1 + 16 % × 16 % T s k = W sp k C serve k / 1 + 6 % × 6 %
where C grid k is the electricity basic price, CMY/kWh; C serve k is the electricity service price, CMY/kWh; C dj k is the electricity actual price, CMY/kWh; C e k is the cost of purchasing electricity for the port, CMY; C sp k is the ship paying the port for electricity, CMY; T e k is to pay value-added tax to the government as the power grid provides electricity to the port, CMY; T s k is the port that makes a profit from providing shore power service to the ship and pays value-added tax to the government, CMY.
C oil , sp k = 10 6 W sp k E 1 C per oil C oil , oil k = 10 6 W oil k E 1 C per oil
where C oil , sp k represents the fuel cost savings by the ship using shore power, CMY; C oil , oil k represents the cost of fuel oil used by the ship, CMY; E 1 is the fuel consumption per unit of electricity emitted by the auxiliary engine, g/kWh; C per−oil is the price of marine fuel oil, CMY/Mt.
T ep , sp k = 10 3 C dl W sp k n = 1 N n F n / E dl n T ep , oil k = 10 3 C dl W oil k n = 1 N n F n / E dl n
where n denotes the type of pollutant; T ep , sp k is the environmental protection tax saved by ships using shore power, CMY; T ep , oil k is the environmental protection tax paid by ships using fuel oil, CMY; C dl is the pollution factor pollutant discharge fee standard per unit of pollution equivalent, CMY/equivalent; F n is the emission factor of pollutants discharged from the fuel oil of the ship’s auxiliary engine, g/kWh; E dl n is the pollution equivalent value of pollutants, kg.
V sp k = 10 6 W sp k F e V oil k = 10 6 W oil k F c V actual k = V sp k + V oil k
F cef k = 10 6 V actual k / W k F wef k = 10 6 V actual k 3 + V actual k 2 + V actual k 1 W k 3 + W k 2 + W k 1
where V sp k and V oil k are the CO2 emissions of the ship using shore power and fuel oil, respectively, Mt; V actual k is the total CO2 emissions of the ship, Mt; F e is the annual average power supply emission factor of the regional power grid, g/kWh; F c is the emission factor of carbon dioxide pollutants emitted by marine auxiliary engine fuel oil, g/kWh; F cef k is the comprehensive CO2 emission factor of the ship, g/kWh; F wef k is the ship’s weighted CO2 emission factor, g/kWh. Equation (6) gives the calculation of the carbon emissions from the use of shore power and the use of oil, respectively, as well as the total emissions for the year. In Equation (7), the ship CO2 weighted emission factor is taken as the weighted average of the carbon emissions per unit of business of the port in the previous three years, which is used as the base of the historical carbon emission intensity.
V cap k = 10 6 η F wef k W k T c 1 k = V actual k V cap k × P c 1 k
where V quato k is the port’s carbon emission cap, Mt; η is the annual decline coefficient, taking 1; T c 1 k is the total amount of carbon trading, CMY; P c 1 k is the carbon price in the carbon trading market, CMY/Mt CO2. Since only the power sector is currently subject to government regulation and other sectors are not yet subject to excessive restrictions, the annual decline coefficient in Equation (8) is set to 1. This gives the port room to strengthen its efforts to reduce carbon emissions. Carbon emission allowances for the year were calculated, as well as the fees paid in excess of the allowances.
T c 2 k = V actual k × P c 2 k
where T c 2 k is the carbon emission tax paid by the port, CMY; P c 2 k is the carbon tax price, CMY/Mt CO2.
T u k = W sp k / S ω cos φ
where T u k is the annual utilization hours, h; S is the total installed capacity of the shore power system, kVA; ω means that there is a certain margin between the actual use of the shore power capacity of the terminal and the planned construction capacity of shore power; cos φ is the comprehensive power factor of the shore power frequency conversion equipment and the ship’s load. We experimentally set ω = 0.8 and cos φ = 0.7 . ω is needed to make sure that the shore power equipment is working properly under the load. Part of the shore power equipment must be suspended during equipment repairs and maintenance in order to prolong the equipment’s useful life. cos φ is related to the nature of the load: different devices have different power factors, so, here, the integrated power is used instead. When W sp k and S are fixed, obviously, the larger ω and cos φ , the smaller T u k .

3. Game Research under Two Carbon Mechanism

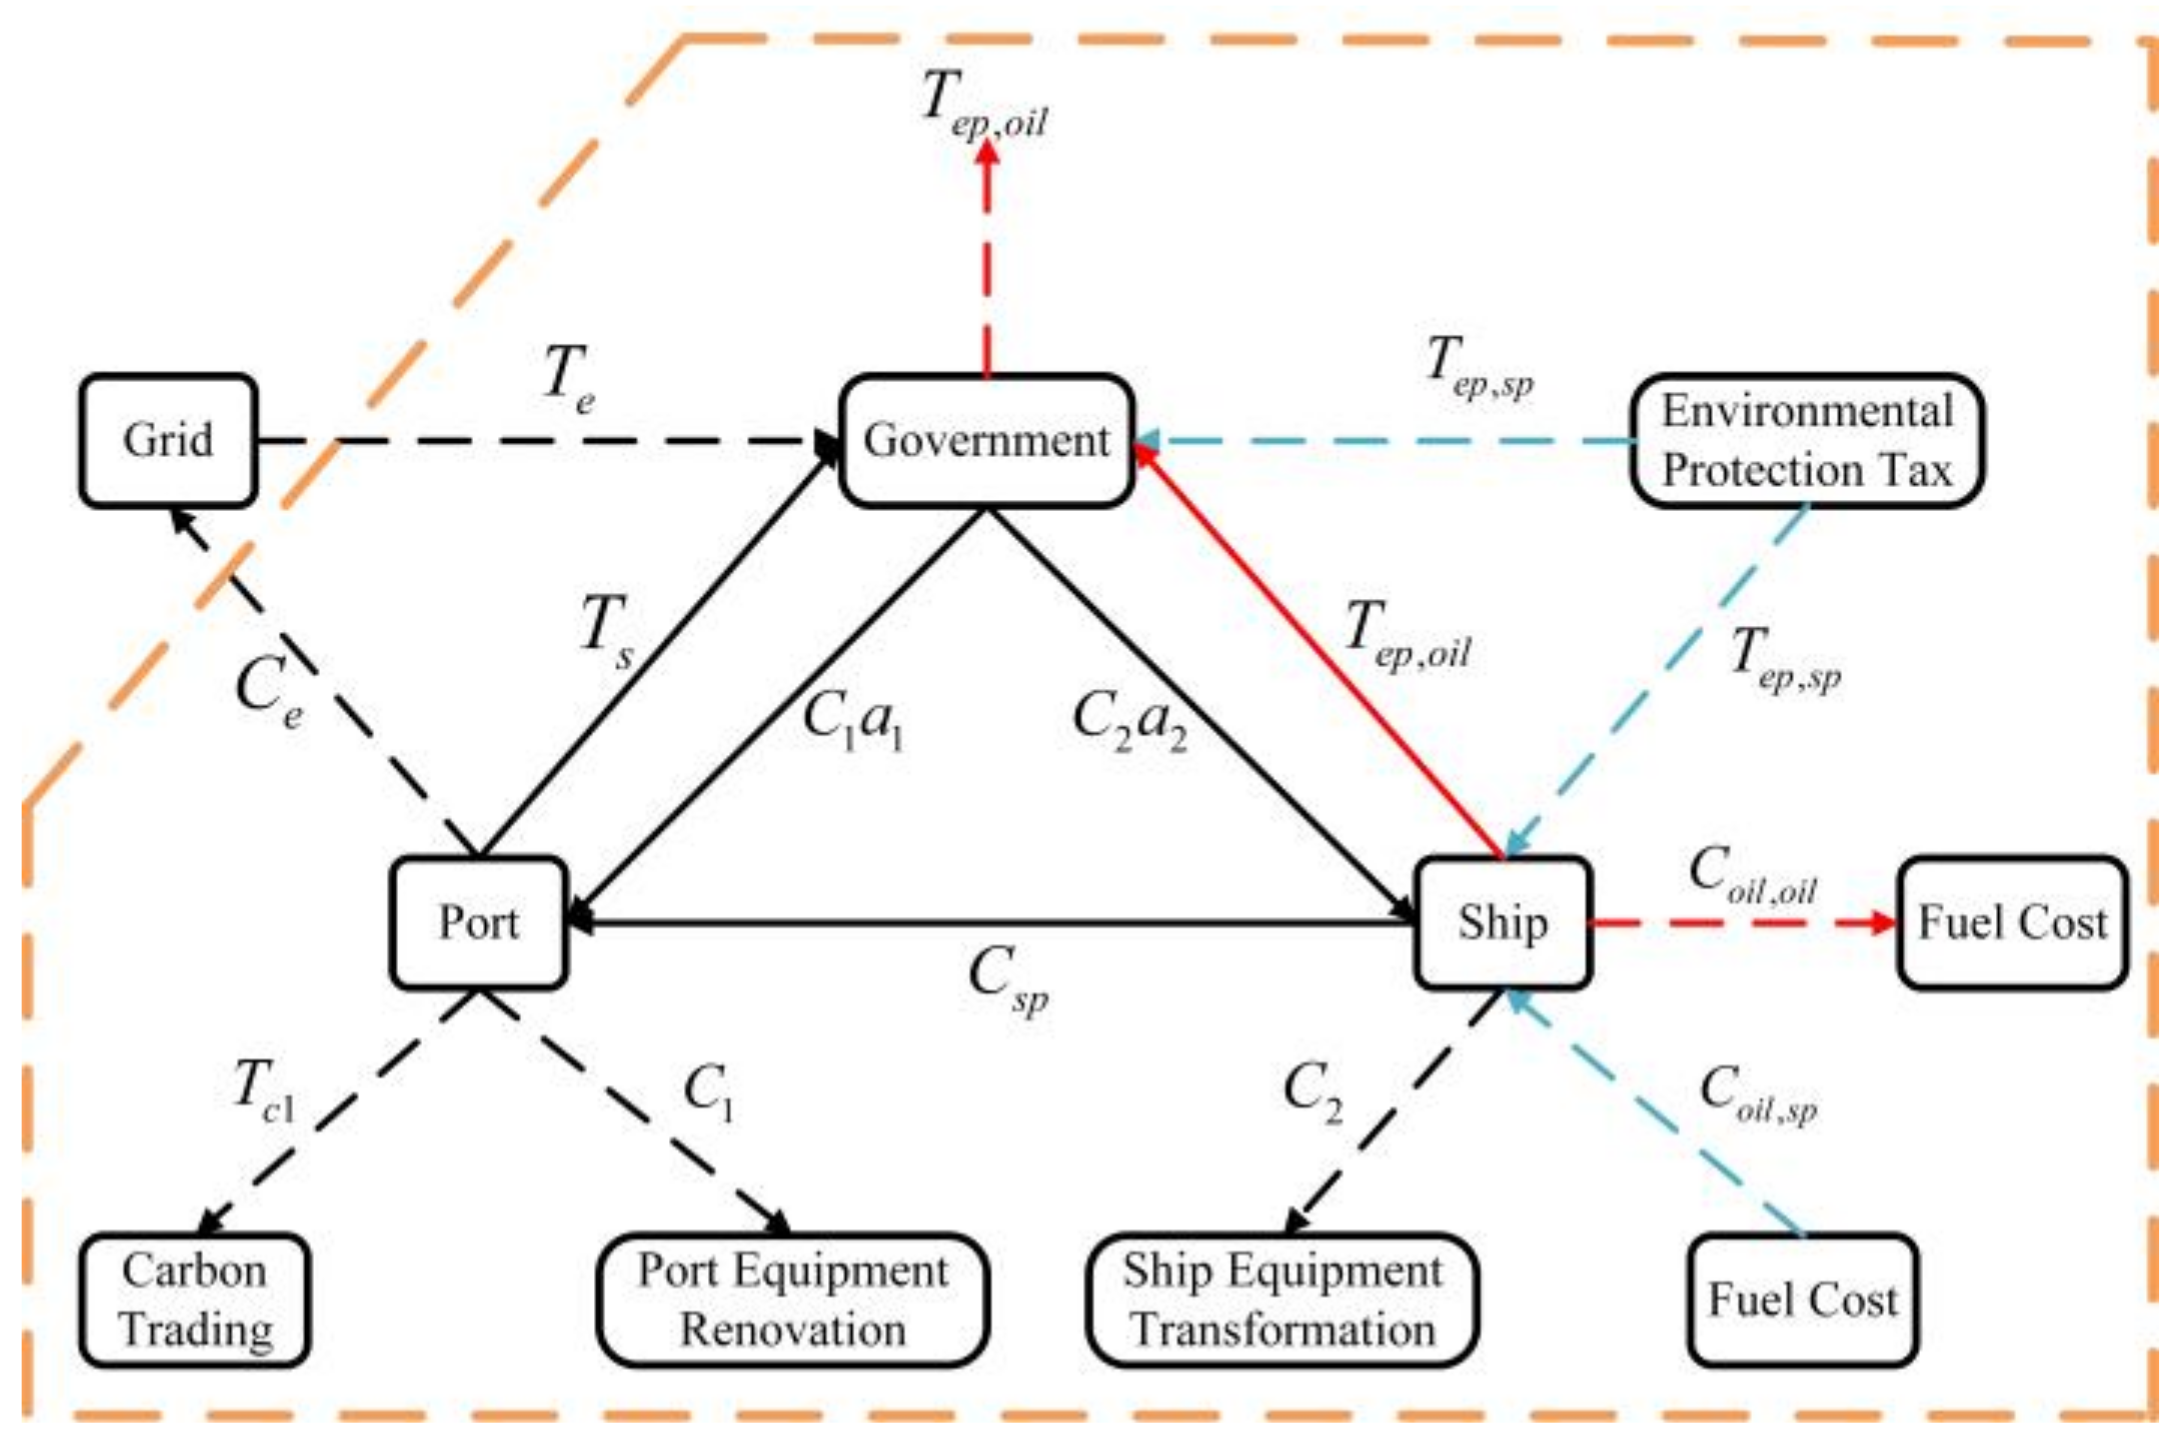
3.1. Game Research on the Use of Shore Power under Cap and Trade

Figure 2 explains the three-way game model in the case of cap and trade. The government defines carbon emission rights as a commodity and establishes carbon emission caps for ports. By incorporating the value of carbon emissions into port costs, ports can directly buy or sell allowances in the carbon trading market. Ships can voluntarily choose to use shore electricity while they are docked in port and the amount of time they utilize it has been rising every year.
1.
Government Benefit Analysis Model
B g = T e + T s + T ep , sp + T ep , oil C g = C 1 α 1 + C 2 α 2 + T ep , oil F g = B g C g
where B g is the government income; C g is the government cost; F g is the government profit; α 1 and α 2 are the subsidy rates for shore power equipment transformation given by the government to the port and the ship, respectively; C 1 and C 2 are the transformation costs of the port and the ship, respectively, CMY.
2.
Port Benefit Analysis Model
B p = C sp + C 1 α 1 C p = C 1 + C e + T s + T c 1 F p = B p C p
where B p is the port income; C p is the port cost; F p is the port profit.
3.
Ship Benefit Analysis Model
B s = C 2 α 2 + C oil , sp + T ep , sp C s = C sp + C 2 + C oil , oil + T ep , oil F s = B s C s
where B s is the ship income; C s is the ship cost; F s is the ship profit.
S W 1 = F p + F s + T e + T s T c 1
where S W 1 refers to social welfare, including consumer surplus, producer surplus, government tax, and environmental benefits [31]. T ep , sp represents the environmental benefit, which not only reduces the environmental protection fee levied on the ship but also is included in the government income. Note that social welfare is only counted once and does not accumulate repeatedly.
The use of shore power is abandoned after the ship converts to shore power owing to the high price. In the worst case, all ships consume fuel for power supply. In this way:
B s , oil = C 2 α 2 C s , oil = C oil , oil + C oil , sp + T sp , oil + T ep , sp + C 2 F s , oil = B s , oil C s , oil
where B s , oil is the ship income; C s , oil is the ship cost; F s , oil is the ship profit.
When some ships use shore power, the benefits of the entire ship are improved:
F s , save = F s F s , oil
When the ships use all fuel oil, the costs come from the fuel costs and the environmental protection taxes paid. The income comes from freight and is unincluded in the scope of the three-party game, so the ship’s benefit is negative, which is similar to social welfare.

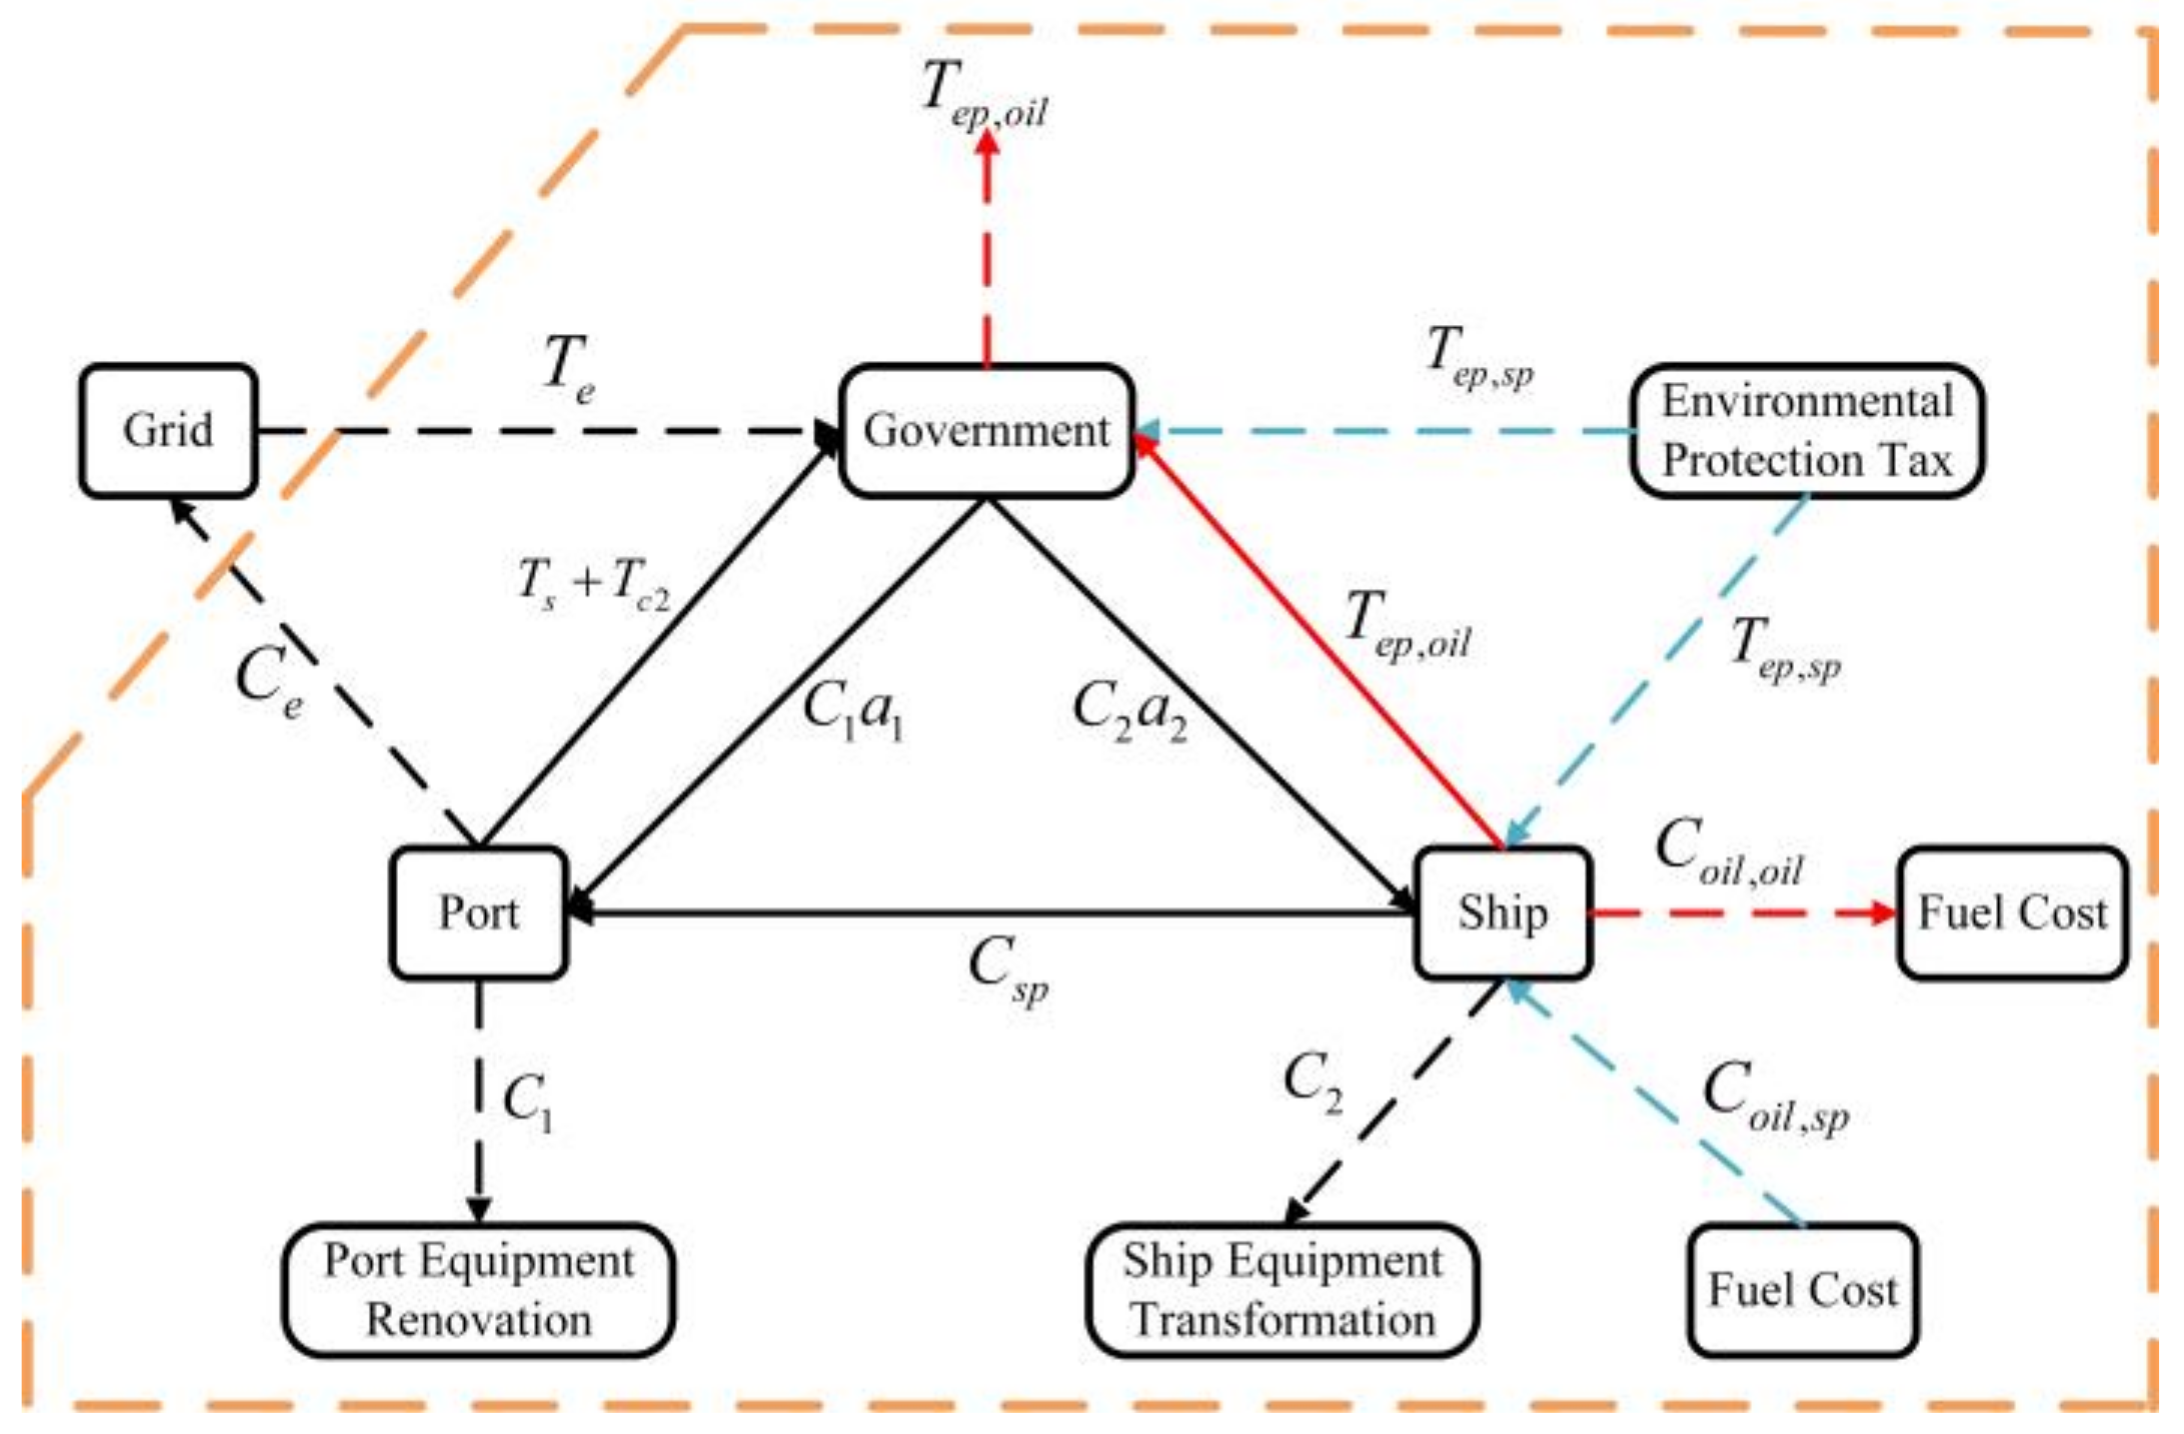
3.2. Game Researches on the Use of Shore Power under the Carbon Tax Policy

Figure 3 illustrates the three-way game model in the case of carbon tax policy. The government sets the carbon tax rate, and ports must offer the government a carbon tax for every metric ton of carbon dioxide they emit.
1.
Government Benefit Analysis Model
B g = T e + T s + T c 2 + T ep , sp + T ep , oil C g = C 1 α 1 + C 2 α 2 + T ep , oil F g = B g C g
where B g is the government income; C g is the government cost; F g is the government profit.
2.
Port Benefit Analysis Model
B p = C sp + C 1 α 1 C p = C 1 + C e + T s + T c 2 F p = B p C p
where B p is the port income; C p is the port cost; F p is the port profit.
3.
Ship Benefit Analysis Model
B s = C 2 α 2 + C oil , sp + T ep , sp C s = C sp + C 2 + C oil , oil + T ep , oil F s = B s C s
where B s is the ship income; C s is the ship cost; F s is the ship profit.
Social welfare is given by:
S W 2 = F p + F s + T e + T s
If all types of ships are powered by fuel oil, the benefit analysis of the ship is as follows:
B s , oil = C 2 α 2 C s , oil = C oil , oil + C oil , sp + T ep , oil + T ep , sp + C 2 F s , oil = B s , oil C s , oil
where B s , oil is the ship income; C s , oil is the ship cost; F s , oil is the ship profit.
Some ships are converted from oil to electricity, and the overall benefit of the ship is improved:
F s , save = F s F s , oil

4. Data Selection

4.1. Government Data Acquisition

According to the “Interim Measures for the Management of Subsidy Funds for Ports, Ship Shore Power Facilities and Marine Low Sulfur Oil Subsidy Funds in Shenzhen”, the subsidy will be provided for the reconstruction of port shore power facilities, which will not exceed 30% of the project construction costs [32].

4.2. Port Data Acquisition

According to the survey, a port has built 14 sets of shore power systems, covering a total of 23 berths. The installed capacity of the shore power system has reached 11,600 kVA. Including the equipment purchase fee and construction installation fee, the investment and renovation costs of the power equipment are CMY55,144,134. Taking the service life as 30 years, the interest rate of the annualized cost is 8%, which is equivalent to the annual renovation cost:
C 1 = 8 % × 1 + 8 % 30 1 + 8 % 30 1 × 55,144,134 = 4,898,312   CMY

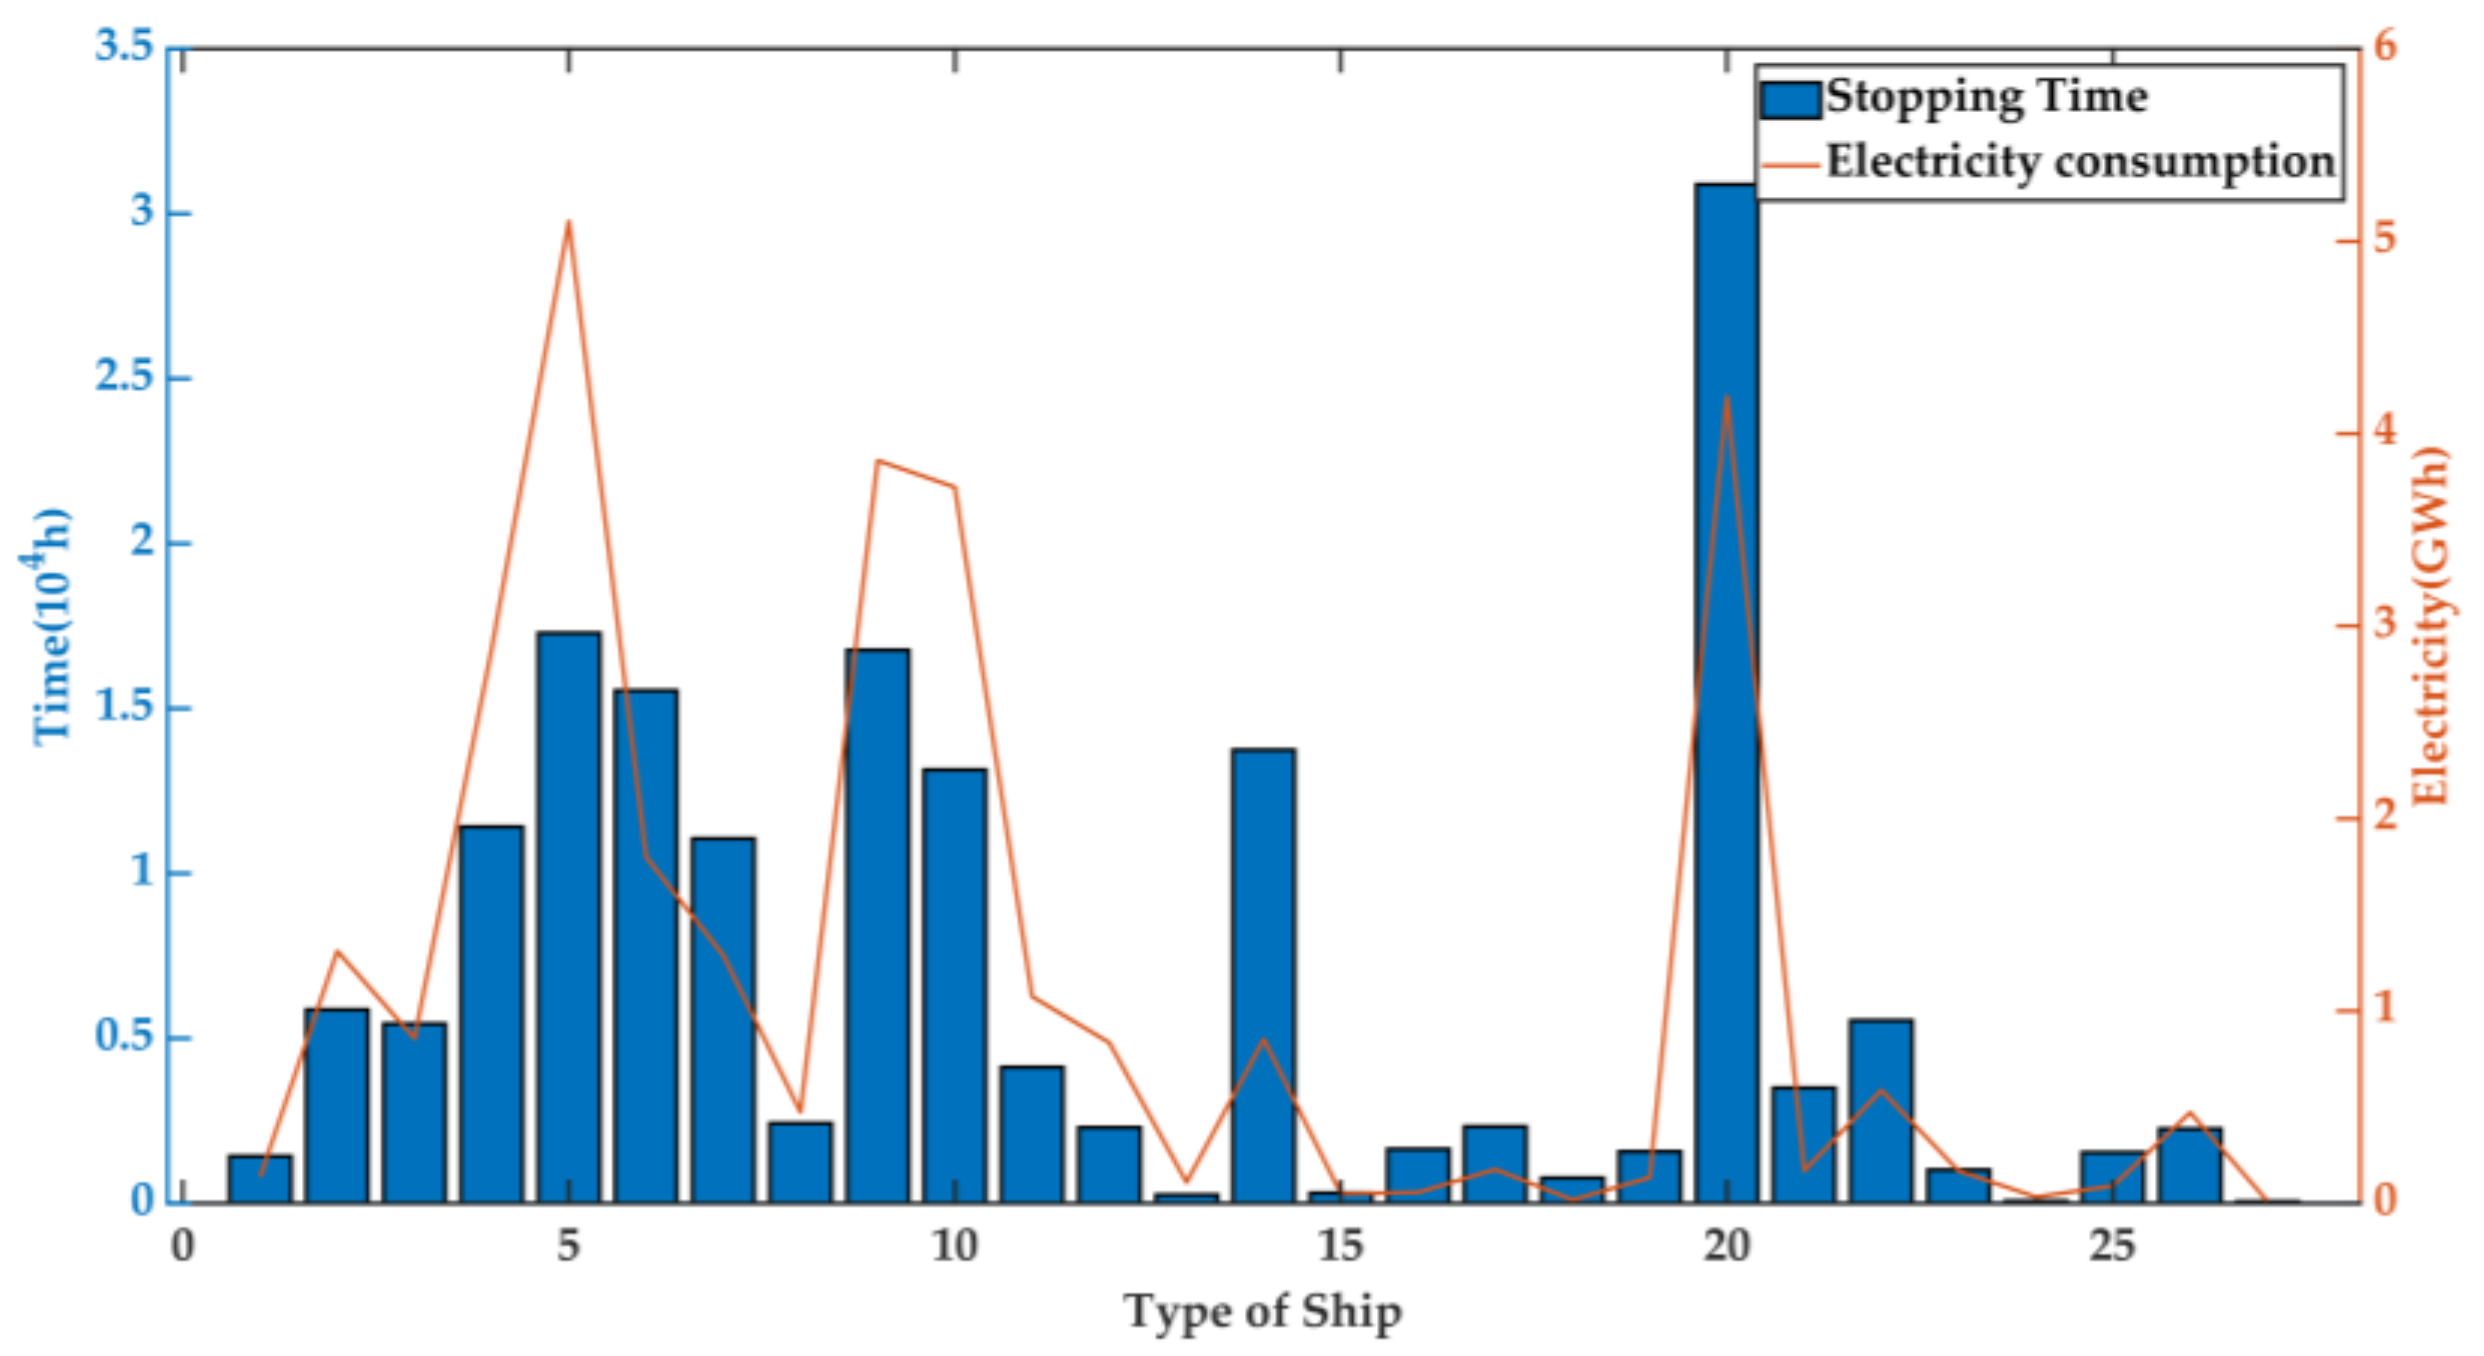
4.3. Ship Data Acquisition

The investment and transformation cost of onboard electrical equipment, referring to the report of the European Commission Environment Directorate (ECDGE) [33], converted into unit power is 1530 CMY/kW.
The berthing time of the ship in the port, the length of the use of shore power in a certain year, and the electricity consumed by the use of shore power are shown in Figure 4.

4.4. Electricity Price Acquisition

According to the “Notice on Clarifying the Electricity Price and Service Price of Ship’s Shore-based Power Supply Facilities” of the price bureau of Jiangsu province, C g r i d k takes the electricity price of large industrial electricity at 0.6601 CMY/kWh. The maximum price of shore power used by ships in Taizhou is 1.20 CMY/kWh [34].
In order to standardize the accounting of carbon dioxide emissions implied by electricity consumption by regions, industries, enterprises, and other units, and to ensure comparability of results, the government organized a study to determine the average carbon dioxide emission factor for regional power grids in China. It refers to the carbon emissions generated by one unit of electricity used in the grid, and is obtained by dividing the total emissions of the entire grid by the total electricity generation. As the port study is in the southern region, the average CO2 emission factor for the southern regional grid was used. F e is the annual average power supply emission factor of the regional power grid, taking 527.1 g/kWh.

4.5. Pollutant Data Acquisition

According to the literature [33], E 1 is taken as 213 g/kWh. According to the “2020 Implementation Plan for the Global Sulfur Restriction Order for Marine Fuel Oil” issued by the China Maritime Safety Administration, those entering the country’s inland river ships’ air pollutant emission control areas should use fuel oil with a sulfur content of no more than 0.10% [35]. C p e r o i l was taken as 3800 CMY/Mt.
According to the “Decision of the Standing Committee of the Jiangsu Provincial People’s Congress on the Applicable Tax Amount of Environmental Protection Tax for Air Pollutants and Water Pollutants”, the tax rate in Nanjing is CMY8.4 per pollution equivalent of air pollutants [36].
The annual emission factors and pollution equivalent values of various pollutants caused by marine auxiliary engine fuel are shown in Table 1 [37,38].

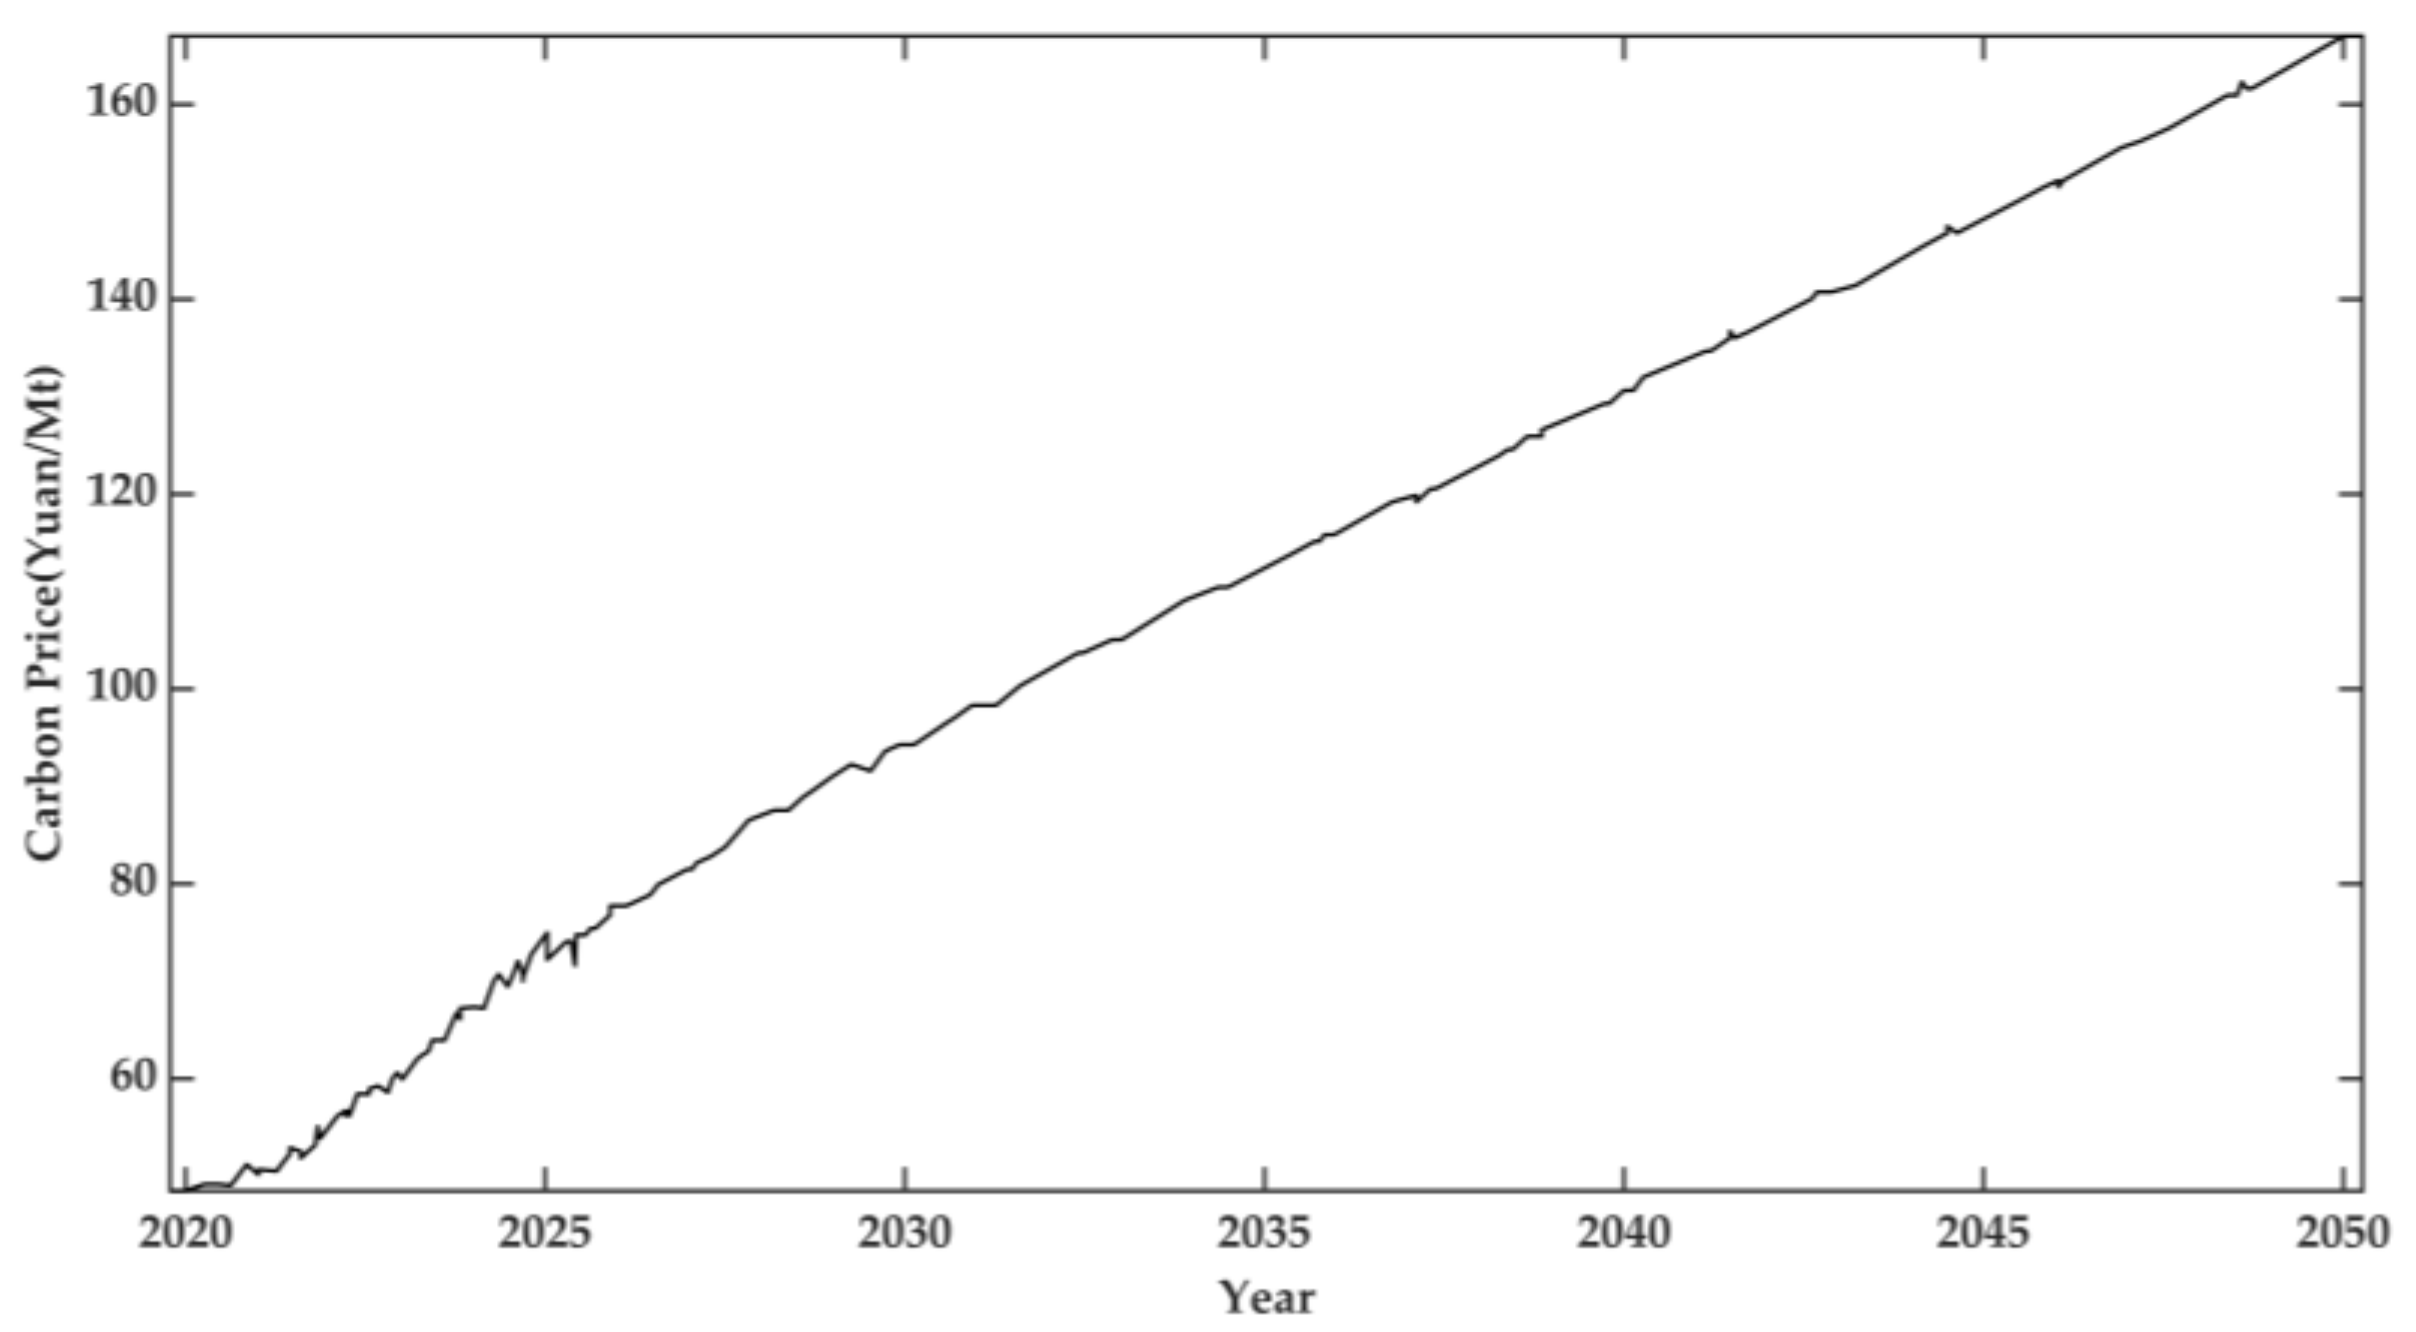
4.6. Carbon Price Data Acquisition

The carbon price data from 2020 to 2050 comes from the “2020 China Carbon Price Survey” [39]. Figure 5 reveals that there has been a steady increase in the carbon price in China since 2020.

5. The Impact of Various Factors on the Benefits of Each Party

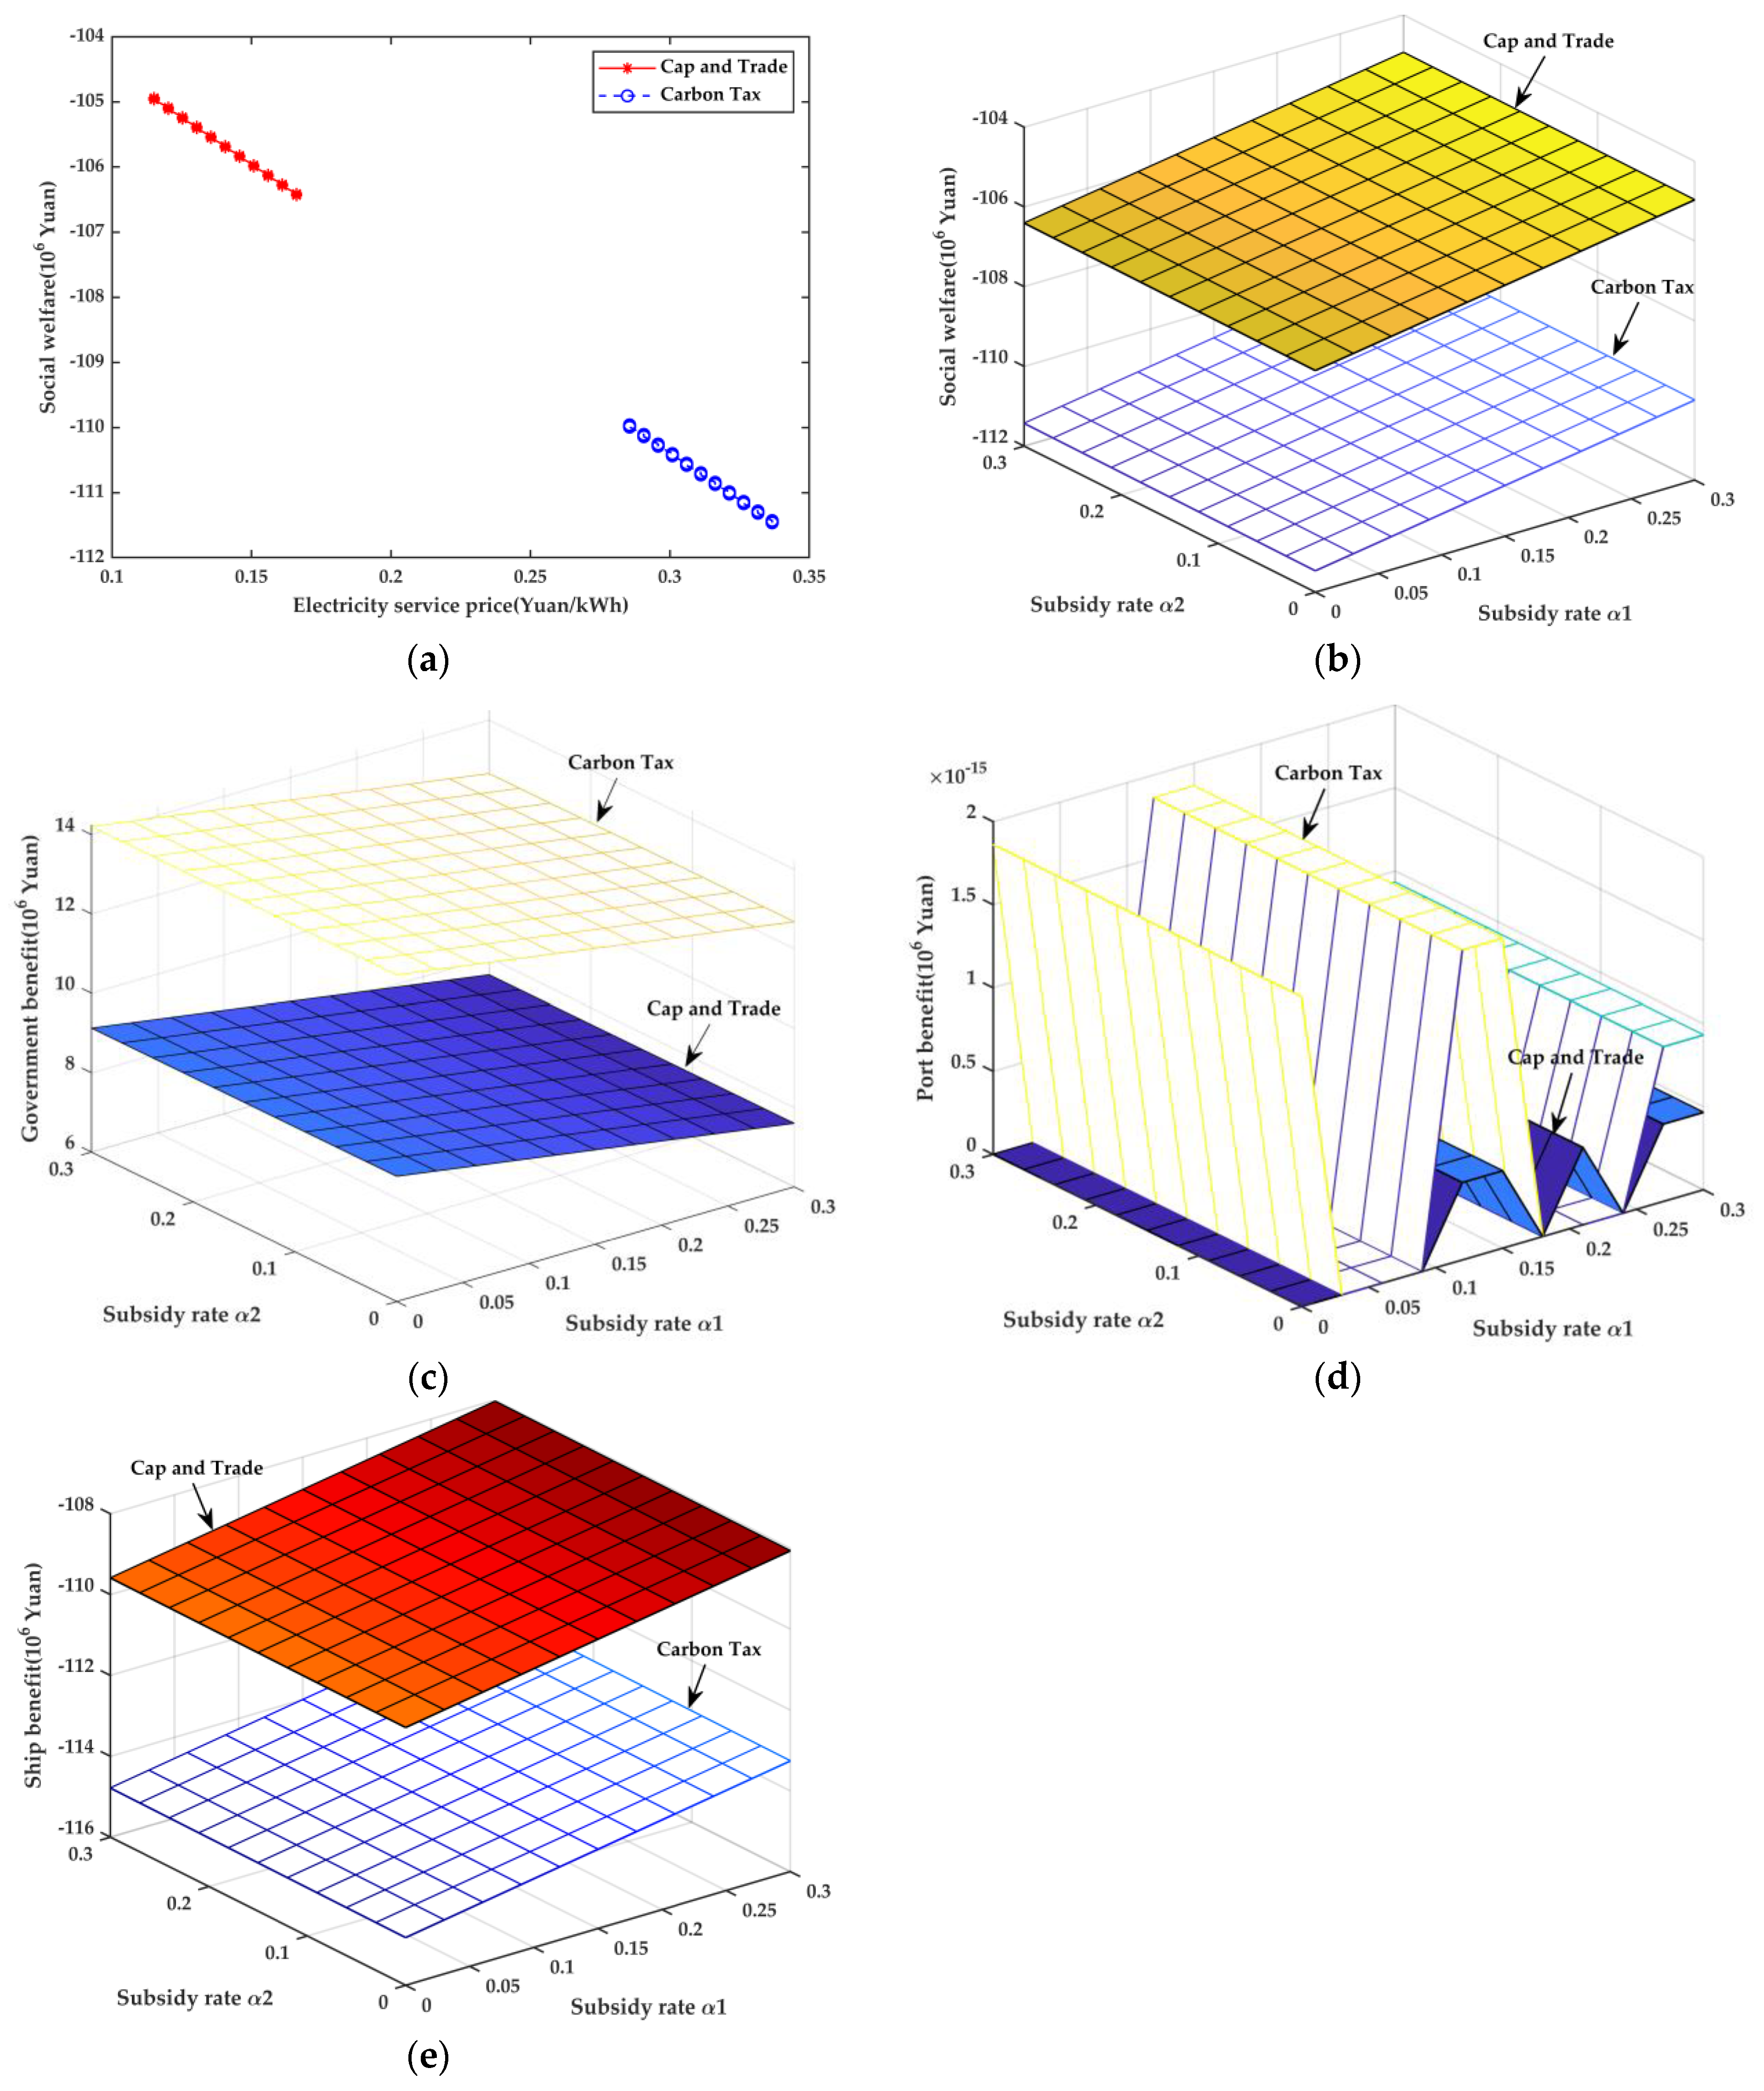
5.1. Comparison of the Impact of Subsidy Rates

Based on the maximization of social welfare, we explore the impact of subsidy rates under two carbon mechanisms on the optimal price and the benefits to all parties.
Restrictions:
0 a 1 30 % 0 a 2 30 % C s e r v e 0 0 C d j 1.2 F g 0 F p 0 F s , s a v e 0
Objective function:
max . S W
Table 2 and Table 3 state the impact of the subsidy rate on the economic and environmental benefits of each party in the three-way game model under the two carbon regimes, respectively.
As can be seen from Figure 6a, whether under the cap-and-trade or the carbon tax policy, social welfare decreases when the electricity service price rises with roughly a linear negative correlation between the two. The cost of power supply services is rising, which does not promote social welfare, and there is clear resistance to the use of shore power. In addition, the lowest value of social welfare under cap and trade is much higher than the maximum value under a carbon tax policy. As a result, cap and trade offers a significant benefit in this case and merits consideration. From Figure 6b–e, we can observe that the subsidy rate a1 affects social welfare, port benefit, and ship benefit to a larger extent than a2 affects all three. The social welfare and ship benefits rise as the subsidy rate a1 rises. The effects of a1 and a2 on government benefits are identical. Government benefits rise with an increase in a2, while they decline with an increase in a1. A comparison of the two results reveals that the cap-and-trade group reported far more social welfare and ship benefits than the other one. On the contrary, the government benefit and port benefit under cap and trade are in every case short of what they are under the other system.

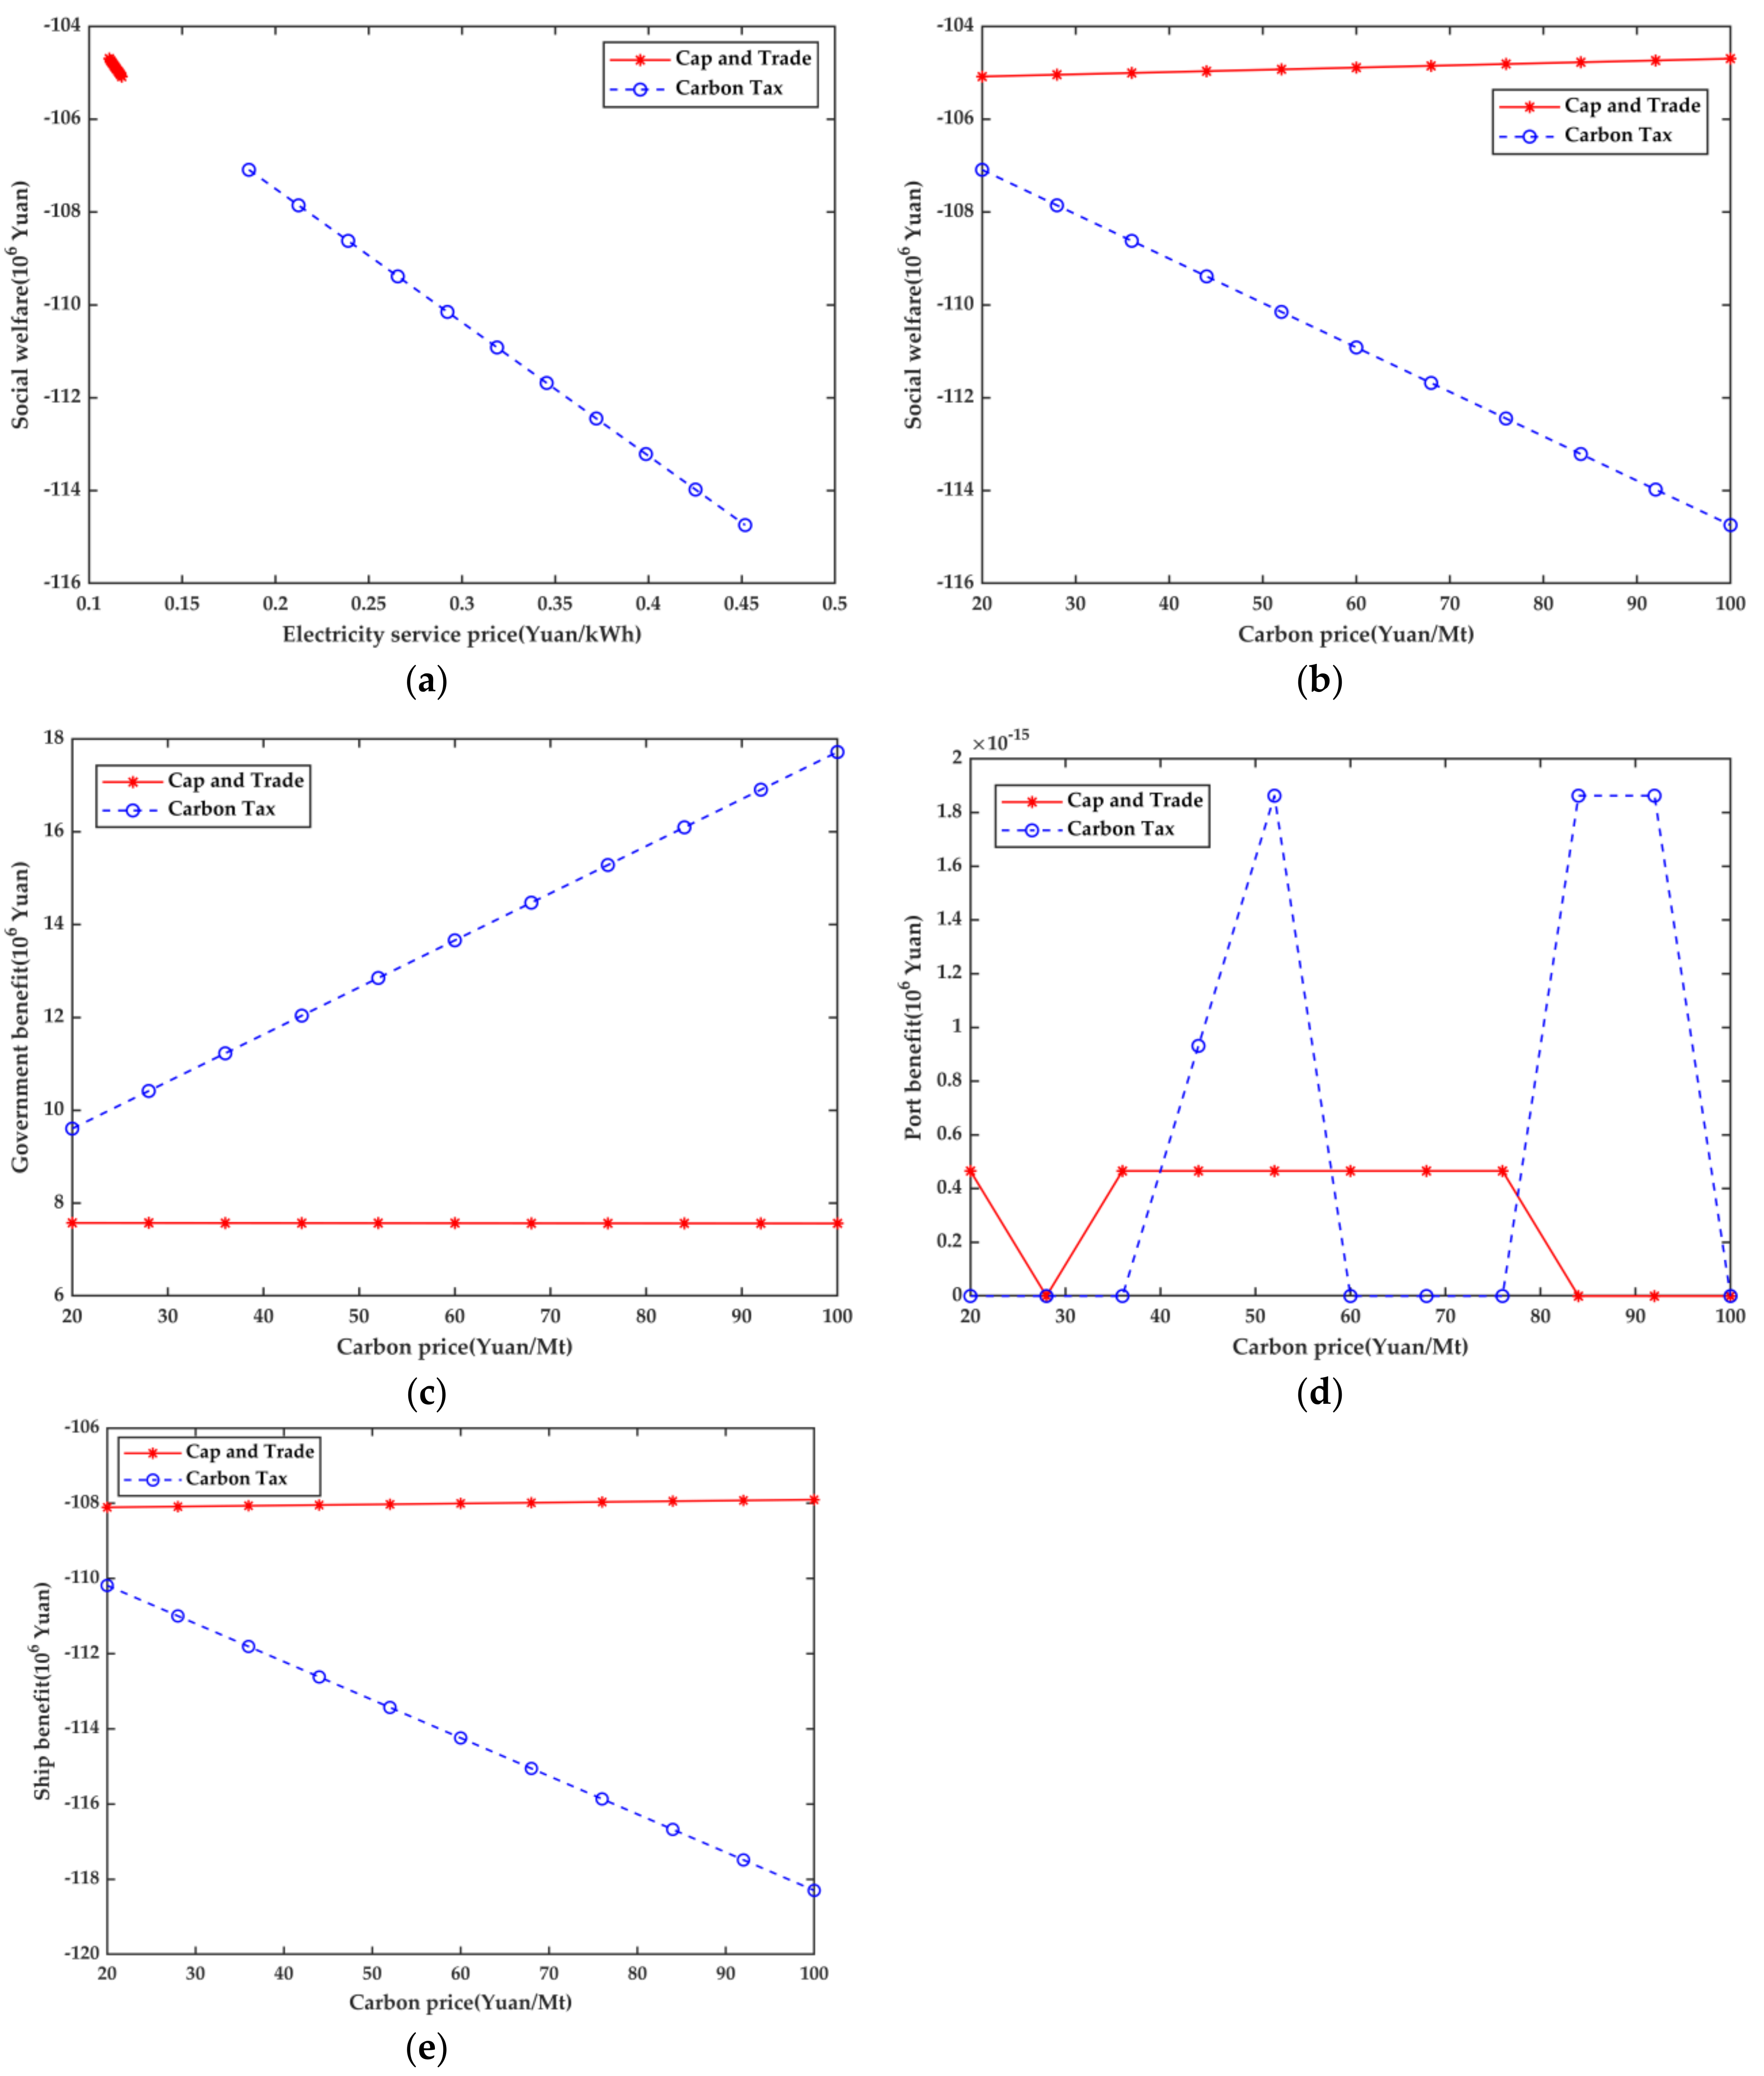
5.2. Carbon Price Impact Comparisons

We evaluated how the price of carbon affects the best price and the gains for all parties under two carbon mechanisms based on the maximization of social welfare.
Restrictions:
20 P c 100 C s e r v e 0 0 C d j 1.2 F g 0 F p 0 F s , s a v e 0
Objective function:
max . S W
Table 4 and Table 5 indicate the impact of the carbon price on the economic and environmental benefits of each party in the three-way game model under the two carbon regimes, respectively.
Figure 7 compares the outcomes gained from the analysis of the two carbon mechanisms. Under both the cap-and-trade and carbon tax policies, social welfare decreases as electricity service prices rise. The social welfare under cap and trade is always greater than that under the carbon tax policy. Figure 7b–e shows that the price of carbon has a significant impact on social welfare, government benefits, port benefits, and ship benefits under the carbon tax policy. The four are not significantly impacted by the carbon price under cap and trade. According to the cap-and-trade model, while government benefits decline as the price of carbon rises, social welfare and ship benefits increase. The carbon tax policy states that when carbon prices rise, the government gains more advantages whereas social welfare and ship benefits decline. Social welfare and ship benefits under cap and trade tend to be invariably greater than those under the carbon tax approach. In comparison to a carbon tax, the government’s benefit under cap and trade is always less. The port efficiency fluctuates positively around 0.

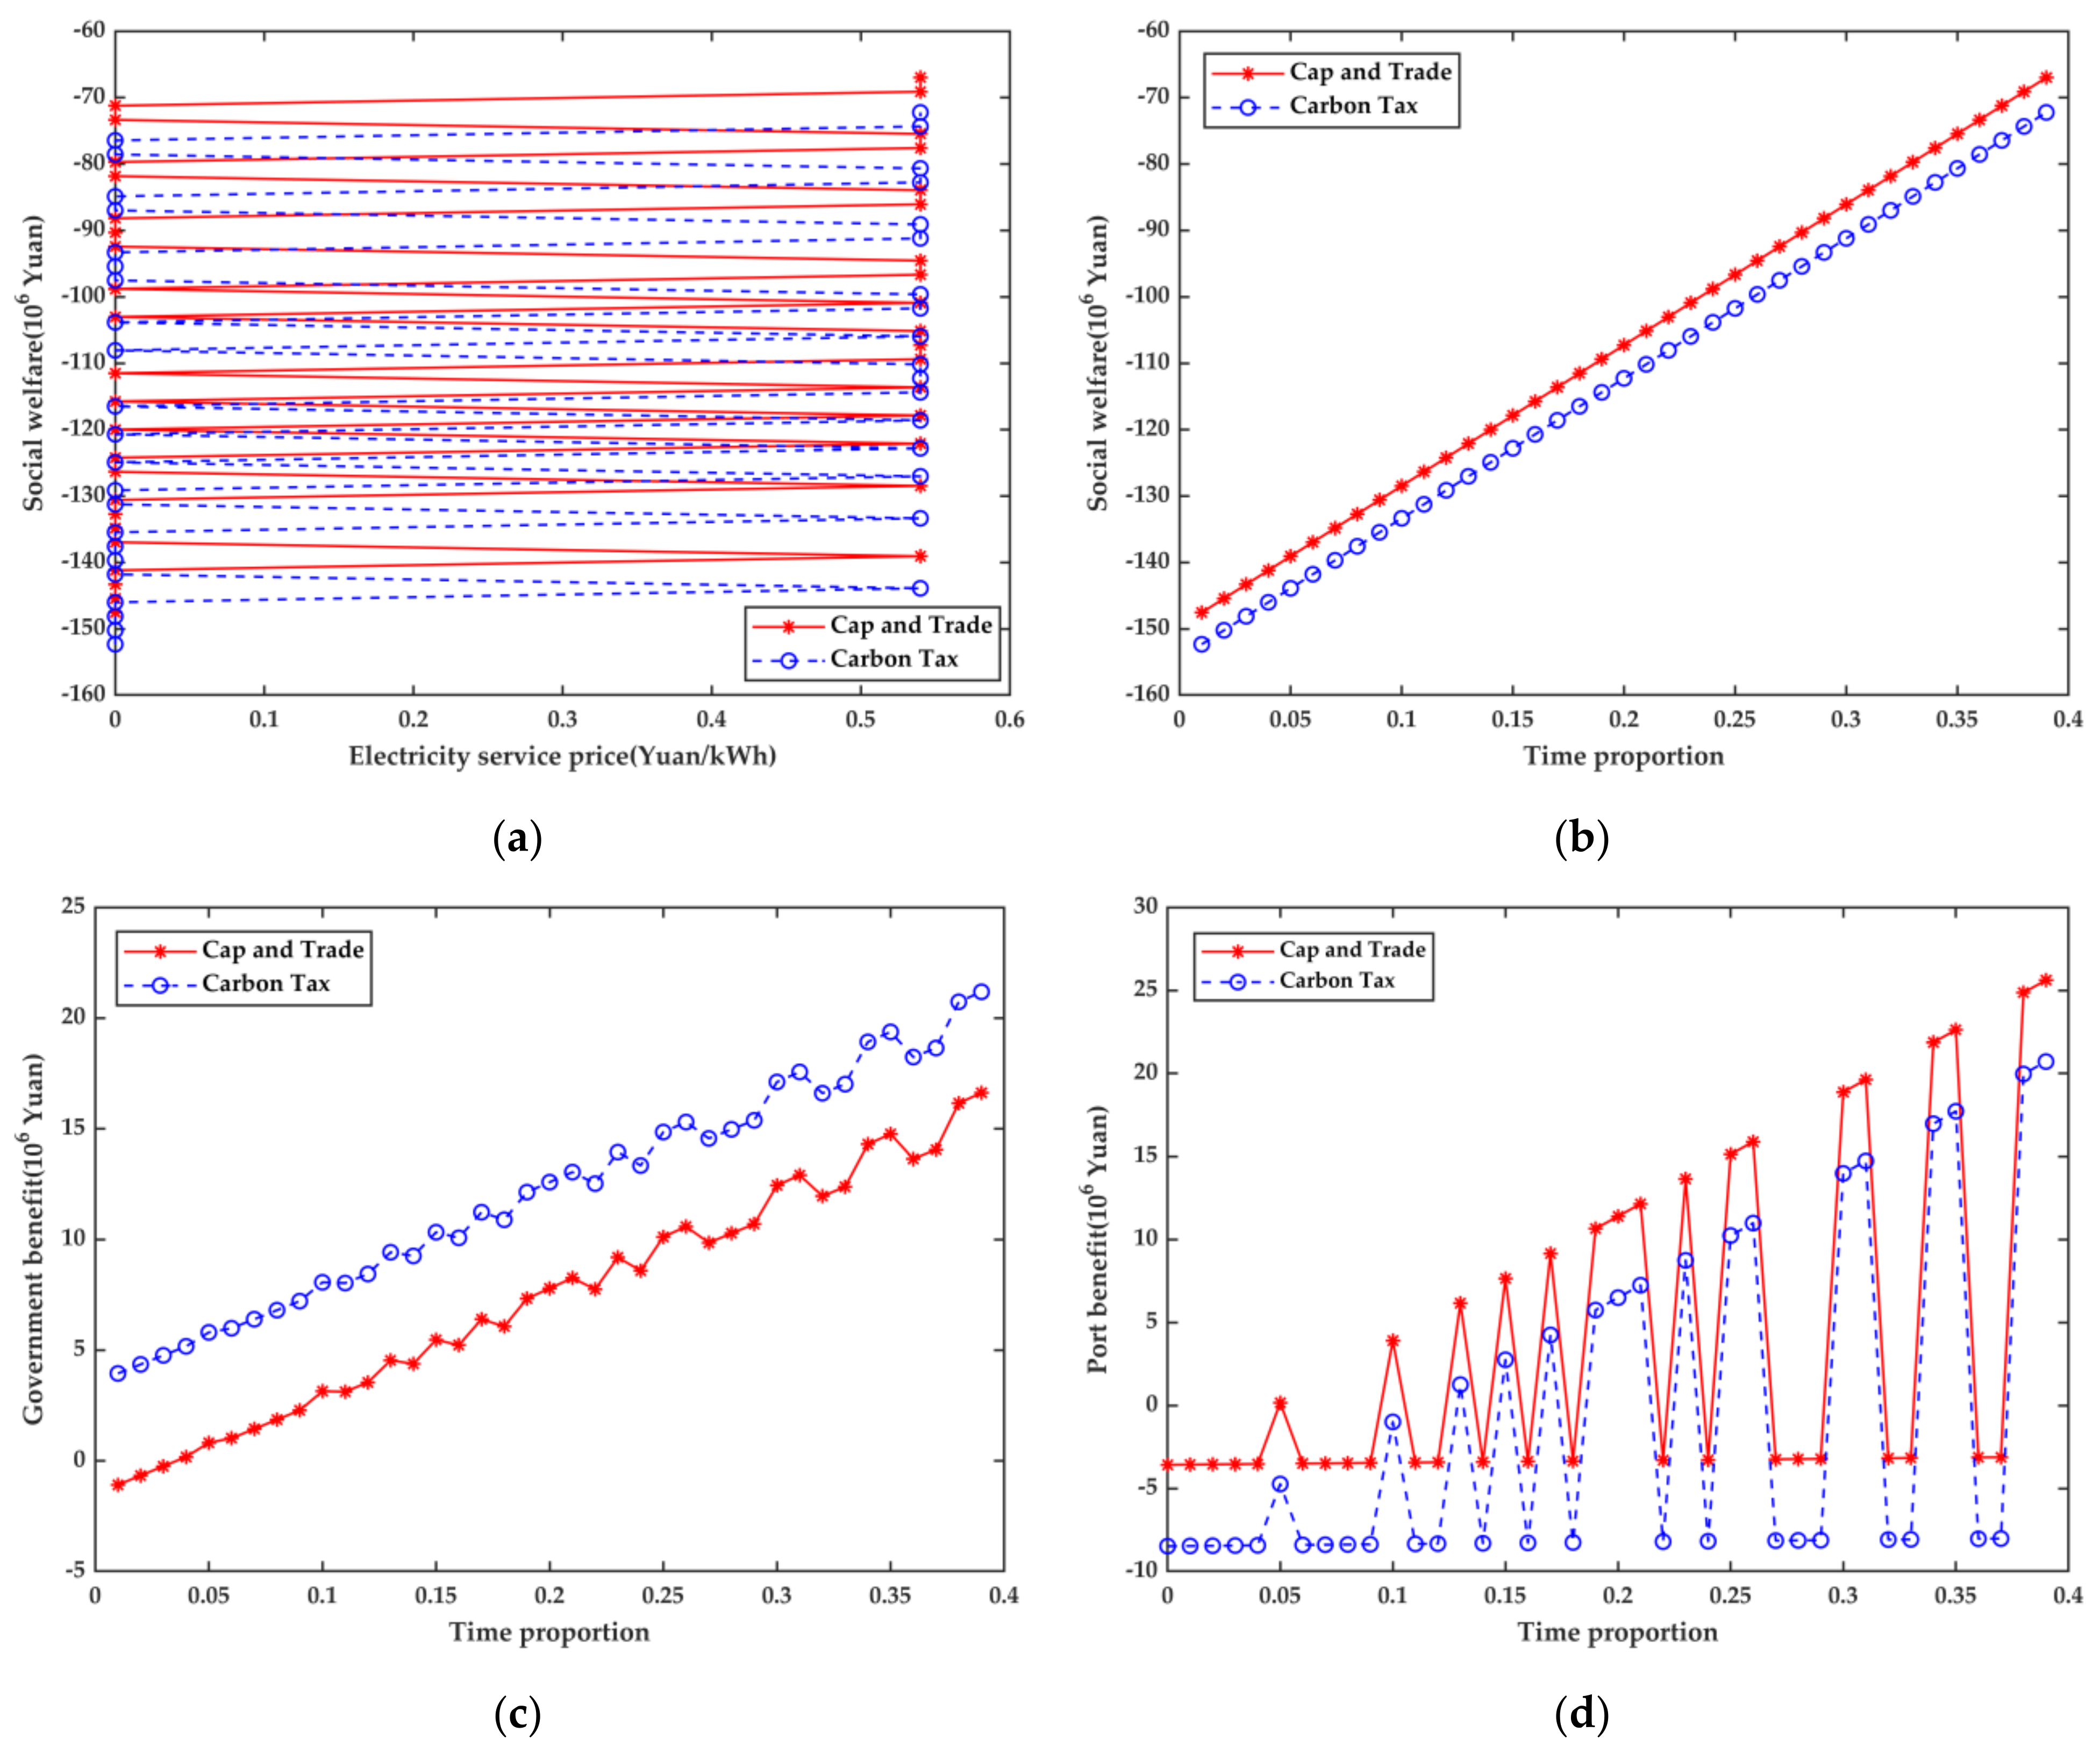
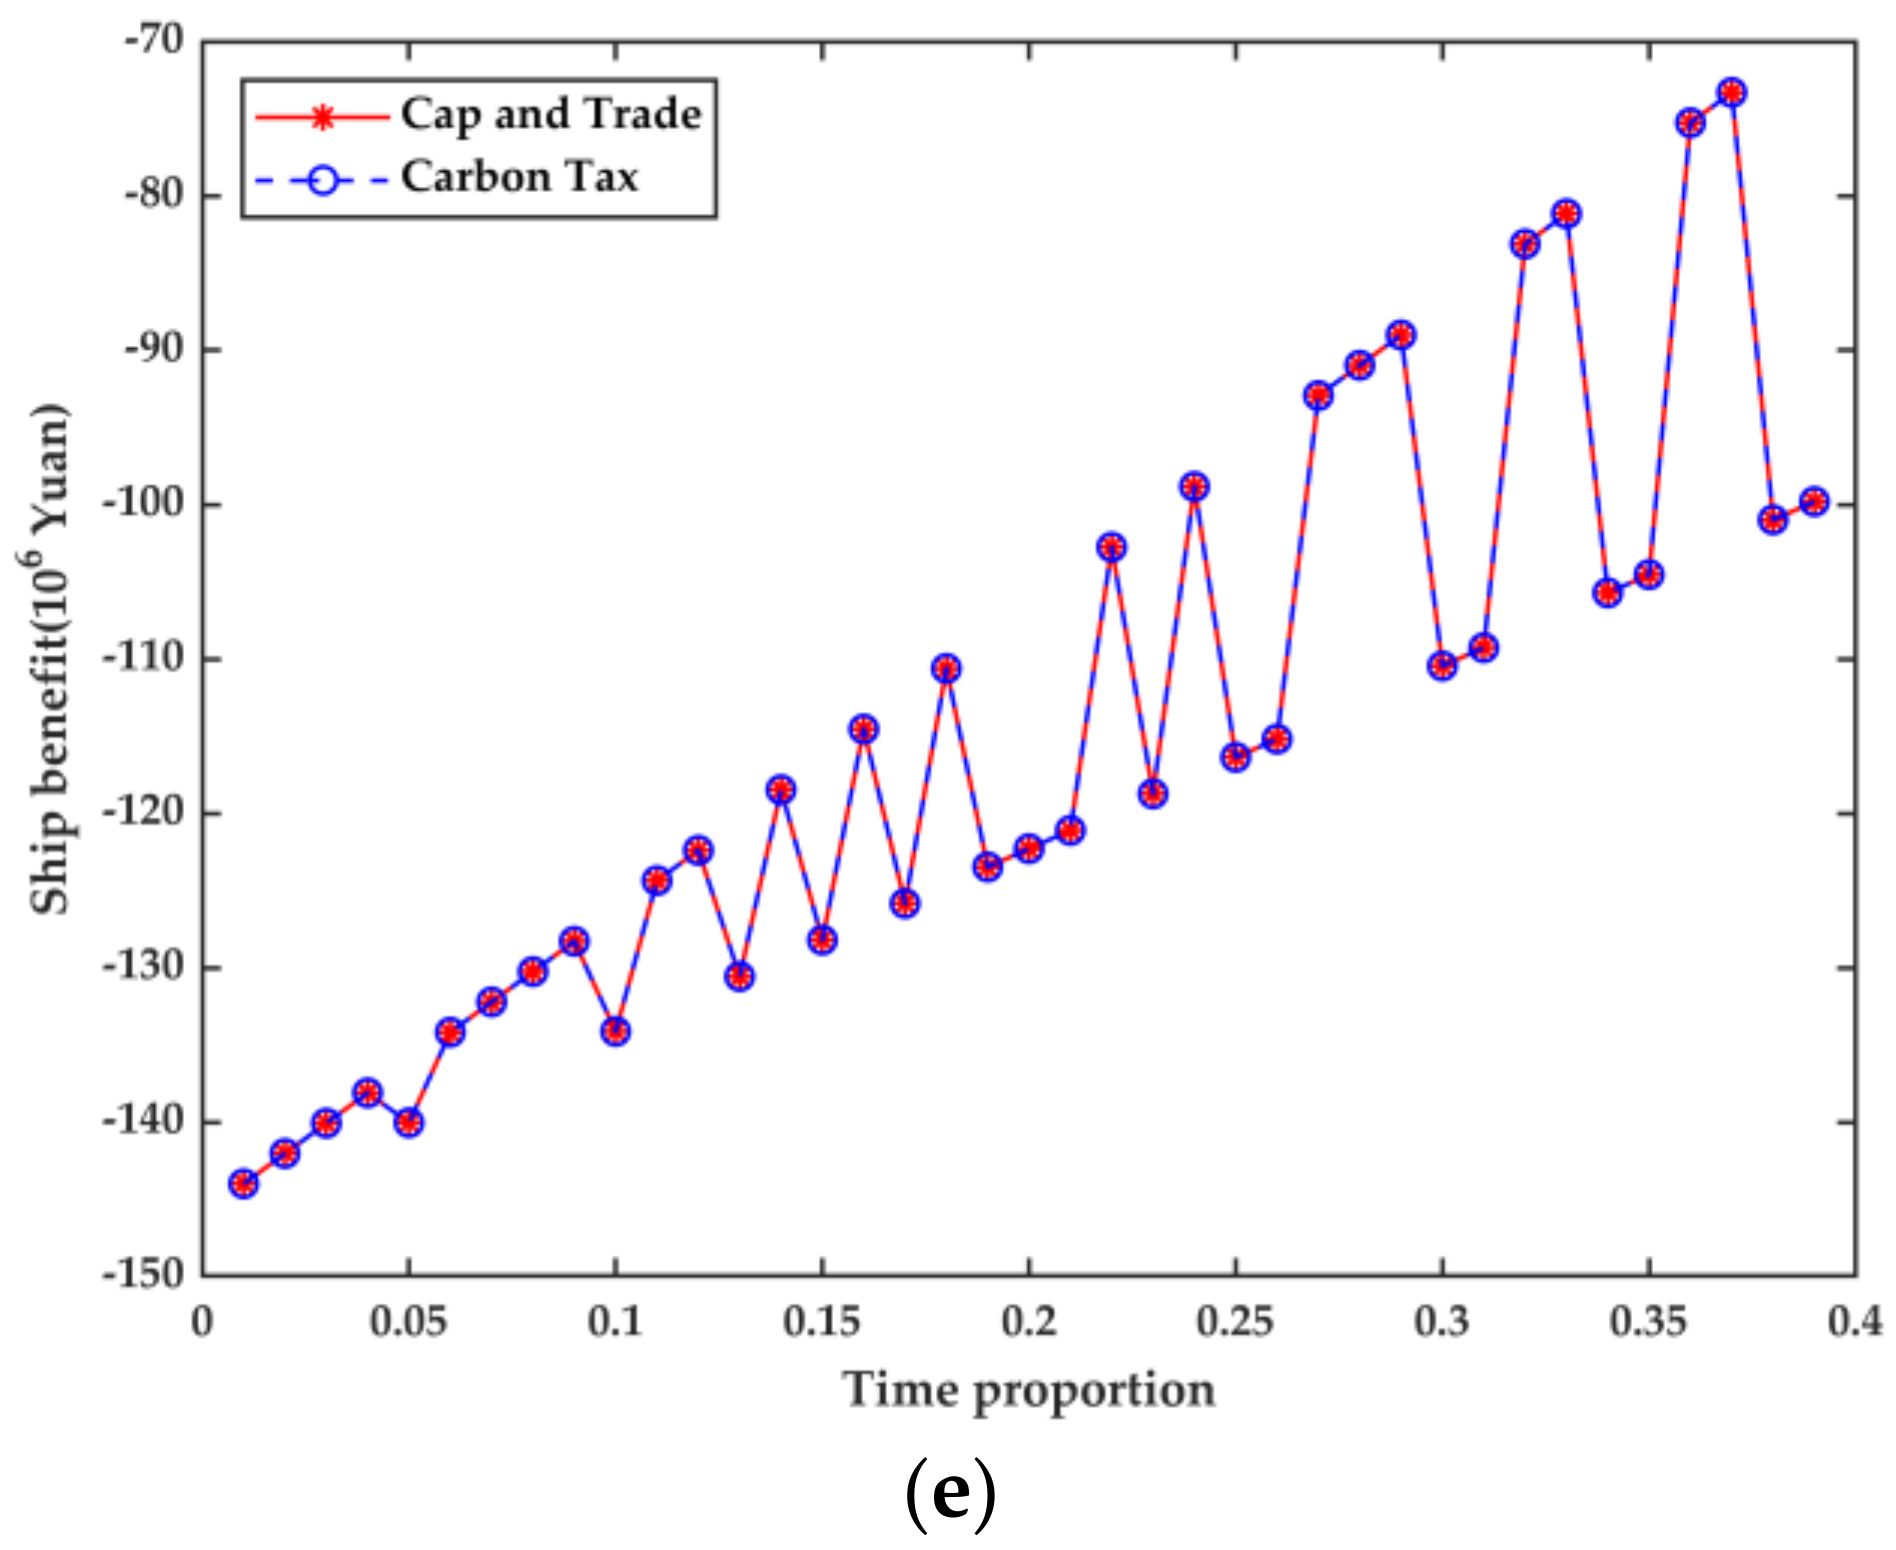
5.3. Comparison of Time-Proportional Effects of Using Shore Power

This study investigates the impact of the ratio of time spent using shore power to total docking time on the best pricing and the gains for all parties under two carbon mechanisms, based on the maximization of total social welfare.
T u k = λ i = 1 N i T k , i P k , i / S ω cos φ
where λ is the ratio of using shore power to the berthing time. As the total port call time is constant, T u k and λ are proportional. T u k decreases, so λ decreases, which affects all aspects of electricity prices, social welfare, government benefits, port benefits, ship benefits, etc.
Restrictions:
C s e r v e 0 0 C d j 1.2 T u 8760
Objective function:
max . S W
Table 6 and Table 7 explicate the impact of the time-proportional on the economic and environmental benefits of each party in the three-way game model under the two carbon regimes, respectively.
What stands out in Figure 8a is the price of electricity supply service changes regularly between 0 and 0.5399 CMY/kWh, and social welfare is also changing. The service price must be 0.5399/kWh under cap and trade in order to reach its maximum value, and it must be 0 under the carbon tax policy in order to reach its minimum value. In Figure 8b–d, the similarity between the two carbon mechanisms is highlighted above. The overall level of social welfare rises as the ratio of time spent utilizing shore power to docking time grows. Under the two carbon mechanisms, the change curves for overall social welfare, government benefits, and port benefits are comparable and can be attained by moving up and down. The curve of ship benefit with the time proportion of using shore power is exactly the same in Figure 8e. With the share of time spent utilizing shore power increasing, the overall level of social welfare rises monotonically. However, government benefits, port benefits, and ship benefits show an upward trend with the increase in the proportion of time when shore power is used.

6. Conclusions

The two systems of cap and trade and carbon tax are clear and easy to understand, but too many similar parameters appear in the modeling process, leading to easy confusion. In both cap and trade and carbon tax, the specific components of tripartite benefits and social welfare are different and are simply represented by the same parameters, and the specific values change as the electricity service price, carbon tax, and the ratio of using shore power to the berthing time change. Also note that the government is happy to see and promote the use of shore power, which is in line with the plan to reduce carbon emissions; the port is to take the responsibility of a state-owned enterprise, respond to the national policy, take responsibility for emission reduction and establish a good image among the public. Ships have the least public pressure and social responsibility, and they are oriented by economic interests, so they are more unstable, and they need government guidance and support because they have to face technical and economic difficulties in the “oil-to-electricity” conversion. In the model, we should focus on understanding the cost saving of some ships after “oil-to-electricity” conversion, which is the key to decide whether ships should insist on using shore power. There is a difference between the CO2 emitted from using oil to meet the power and the CO2 emitted from switching to shore power to replace this power, and the focus is on calculating the difference and the accompanying economic and environmental benefits.
Depending on the port’s yearly business volume and historical carbon emission intensity base, the government calculates the annual carbon cap for the port. The comprehensive CO2 emission factor of ships in the first three years is greater than the current year’s CO2 emission factor. Therefore, the carbon cap is frequently higher than the actual CO2 emission, according to calculations of the port’s real energy usage. Currently, compared to other businesses, the government’s criteria for reducing carbon emissions in the maritime sector are not stringent enough.
In summary, these results indicate that the annual hours of shore power facility use, the amount of environmental protection tax saved by utilizing shore power, and the reduction in pollutants and carbon dioxide are all equivalent as long as the ships’ energy consumption is constant. The social welfare, governmental benefits, port benefits, and ship benefits appear to vary depending on the subsidy rate, carbon price, and percentage of time using shore power.
It is reasonable for the port to set the shore electricity price within the range of 0.6601 to 1.2 CMY/kWh, taking into consideration both its own transformation costs and government subsidies. As long as ships use electricity instead of fuel, the economic benefits will be significantly improved, no matter what changes in various carbon mechanisms and influencing factors. The primary source of improvement may partly be related to reduced fuel costs. The government’s benefits are always greater than zero, mostly due to the environmental benefits of decreasing pollutant emissions. Low economic advantages are expected for the port, as a result of high costs of self-renovation and government limits on the actual electricity price.
The major limitation of this study is that ships are assumed to be equivalent to a virtual ship although they have distinct types and numbers when in berth. It is a macro analysis for multiagent games; hence, it cannot accurately reflect the benefit to an individual ship. The three-party game is dynamic and played repeatedly, and ships are allowed to choose whether to utilize shore power or not, which makes it challenging to calculate the best electricity price. By examining the status of the tripartite game in electricity substitution, this study offers a particular reference value for the cycle planning and benefit distribution of electric energy replacement projects in the future.

Author Contributions

Conceptualization, Y.H. and Y.Z.; methodology, Y.H.; software, Y.H.; validation, Y.H.; formal analysis, Y.H.; investigation, Y.H.; resources, Y.Z.; data curation, Y.H.; writing—original draft preparation, Y.H.; writing—review and editing, Y.Z.; visualization, Y.H.; supervision, Y.Z.; project administration, Y.Z.; funding acquisition, Y.Z. All authors have read and agreed to the published version of the manuscript.

Funding

Guangxi Special Fund for Innovation-Driven Development (AA19254034).

Data Availability Statement

Publicly available datasets were analyzed in this study. These data can be found in the References section.

Conflicts of Interest

The authors declare no conflict of interest. The funders had no role in the design of the study; in the collection, analyses, or interpretation of data; in the writing of the manuscript; or in the decision to publish the results.

References

  1. Handbook of Statistics 2021. In Proceedings of the United Nations Conference on Trade and Development. Available online: https://unctad.org/system/files/official-document/tdstat46_en.pdf (accessed on 6 February 2023).
  2. Review of Maritime Transport 2021. In Proceedings of the United Nations Conference on Trade and Development. Available online: https://unctad.org/publication/review-maritime-transport-2021 (accessed on 6 February 2023).
  3. Sheng, D.; Li, Z.-C.; Fu, X.; Gillen, D. Modeling the effects of unilateral and uniform emission regulations under shipping company and port competition. Transp. Res. E Logist. Transp. Rev. 2017, 101, 99–114. [Google Scholar] [CrossRef] [Green Version]
  4. Rolán, A.; Manteca, P.; Oktar, R.; Siano, P. Integration of cold ironing and renewable sources in the barcelona smart port. IEEE Trans. Ind. Appl. 2019, 55, 7198–7206. [Google Scholar] [CrossRef]
  5. Ballini, F.; Bozzo, R. Air pollution from ships in ports: The socio-economic benefit of cold-ironing technology. Res. Transp. Bus. Manag. 2015, 17, 92–98. [Google Scholar] [CrossRef]
  6. IMO 2020—Cutting Sulphur Oxide Emissions. Available online: https://www.imo.org/en/MediaCentre/HotTopics/Pages/Sulphur-2020.aspx (accessed on 1 August 2022).
  7. Corbett, J.; Winebrake, J.; Carr, E.; Jalkanen, J.; Johansson, L.; Prank, M.; Sofiev, M.; Winebrake, S.; Karppinen, A. Health impacts associated with delay of MARPOL global sulphur standards. In Air Pollution and Energy Efficiency; Annex II MEPC; International Maritime Organization: London, UK, 2016; Volume 70. [Google Scholar]
  8. Qi, J.; Wang, S.; Peng, C. Shore power management for maritime transportation: Status and perspectives. Marit. Transp. Res. 2020, 1, 100004. [Google Scholar] [CrossRef]
  9. Sofiev, M.; Winebrake, J.J.; Johansson, L.; Carr, E.W.; Prank, M.; Soares, J.; Vira, J.; Kouznetsov, R.; Jalkanen, J.-P.; Corbett, J.J. Cleaner fuels for ships provide public health benefits with climate tradeoffs. Nat. Commun. 2018, 9, 406. [Google Scholar] [CrossRef] [PubMed] [Green Version]
  10. Corbett, J.J.; Winebrake, J.J.; Green, E.H.; Kasibhatla, P.; Eyring, V.; Lauer, A. Mortality from ship emissions: A global assessment. Environ. Sci. Technol. 2007, 41, 8512–8518. [Google Scholar] [CrossRef]
  11. Chen, J.; Zheng, T.; Garg, A.; Xu, L.; Li, S.; Fei, Y. Alternative maritime power application as a green port strategy: Barriers in China. J. Clean. Prod. 2019, 213, 825–837. [Google Scholar] [CrossRef]
  12. Radwan, M.E.; Chen, J.; Wan, Z.; Zheng, T.; Hua, C.; Huang, X. Critical barriers to the introduction of shore power supply for green port development: Case of Djibouti container terminals. Clean Technol. Environ. Policy 2019, 21, 1293–1306. [Google Scholar] [CrossRef]
  13. Winkel, R.; Weddige, U.; Johnsen, D.; Hoen, V.; Papaefthimiou, S. Shore side electricity in Europe: Potential and environmental benefits. Energy Policy 2016, 88, 584–593. [Google Scholar] [CrossRef]
  14. Pettit, S.; Wells, P.; Haider, J.; Abouarghoub, W. Revisiting history: Can shipping achieve a second socio-technical transition for carbon emissions reduction? Transp. Res. D Transp. Environ. 2018, 58, 292–307. [Google Scholar] [CrossRef] [Green Version]
  15. Vaishnav, P.; Fischbeck, P.S.; Morgan, M.G.; Corbett, J.J. Shore power for vessels calling at US ports: Benefits and costs. Environ. Sci. Technol. 2016, 50, 1102–1110. [Google Scholar] [CrossRef] [PubMed]
  16. Sciberras, E.A.; Zahawi, B.; Atkinson, D.J. Electrical characteristics of cold ironing energy supply for berthed ships. Transp. Res. D Transp. Environ. 2015, 39, 31–43. [Google Scholar] [CrossRef] [Green Version]
  17. Peterson, K.L.; Islam, M.; Cayanan, C. State of shore power standards for ships. In Proceedings of the 2007 IEEE Petroleum and Chemical Industry Technical Conference, Calgary, AB, Canada, 17–19 September 2007; pp. 1–6. [Google Scholar]
  18. Lam, J.S.L.; Notteboom, T. The greening of ports: A comparison of port management tools used by leading ports in Asia and Europe. Transp. Rev. 2014, 34, 169–189. [Google Scholar] [CrossRef]
  19. Zis, T.; North, R.J.; Angeloudis, P.; Ochieng, W.Y.; Harrison Bell, M.G. Evaluation of cold ironing and speed reduction policies to reduce ship emissions near and at ports. Marit. Econ. Logist. 2014, 16, 371–398. [Google Scholar] [CrossRef]
  20. Styhre, L.; Winnes, H.; Black, J.; Lee, J.; Le-Griffin, H. Greenhouse gas emissions from ships in ports–Case studies in four continents. Transp. Res. D Transp. Environ. 2017, 54, 212–224. [Google Scholar] [CrossRef]
  21. Zhao, X.; Liu, L.; Di, Z.; Xu, L. Subsidy or punishment: An analysis of evolutionary game on implementing shore-side electricity. Reg. Stud. Mar. Sci. 2021, 48, 102010. [Google Scholar] [CrossRef]
  22. Wu, L.; Wang, S. The shore power deployment problem for maritime transportation. Transp. Res. E Logist. Transp. Rev. 2020, 135, 101883. [Google Scholar] [CrossRef]
  23. Song, T.; Li, Y.; Hu, X. Cost-effective optimization analysis of shore-to-ship power system construction and operation. In Proceedings of the 2017 IEEE Conference on Energy Internet and Energy System Integration (EI2), Beijing, China, 26–28 November 2017; pp. 1–6. [Google Scholar]
  24. Tseng, P.-H.; Pilcher, N. Evaluating the key factors of green port policies in Taiwan through quantitative and qualitative approaches. Transp. Policy 2019, 82, 127–137. [Google Scholar] [CrossRef] [Green Version]
  25. Drake, D.F.; Kleindorfer, P.R.; Van Wassenhove, L.N. Technology choice and capacity portfolios under emissions regulation. Prod. Oper. Manag. 2016, 25, 1006–1025. [Google Scholar] [CrossRef]
  26. Murray, B.; Rivers, N. British Columbia’s revenue-neutral carbon tax: A review of the latest “grand experiment” in environmental policy. Energy Policy 2015, 86, 674–683. [Google Scholar] [CrossRef]
  27. Ellerman, A.D.; Buchner, B. Over-Allocation or Abatement? A Preliminary Analysis of the EU Emissions Trading Scheme Based on the 2005 Emissions Data; MIT Joint Program on the Science and Policy of Global Change: Cambridge, MA, USA, 2006. [Google Scholar]
  28. Song, S.; Govindan, K.; Xu, L.; Du, P.; Qiao, X. Capacity and production planning with carbon emission constraints. Transp. Res. E Logist. Transp. Rev. 2017, 97, 132–150. [Google Scholar] [CrossRef]
  29. Liu, Y.; Xin, X.; Yang, Z.; Chen, K.; Li, C. Liner shipping network-transaction mechanism joint design model considering carbon tax and liner alliance. Ocean Coast. Manag. 2021, 212, 105817. [Google Scholar] [CrossRef]
  30. Chen, Z.-y.; Nie, P.-y. Effects of carbon tax on social welfare: A case study of China. Appl. Energy 2016, 183, 1607–1615. [Google Scholar] [CrossRef]
  31. Wang, C. Monopoly with corporate social responsibility, product differentiation, and environmental R&D: Implications for economic, environmental, and social sustainability. J. Clean. Prod. 2021, 287, 125433. [Google Scholar]
  32. Interim Measures of Shenzhen Municipality on the Administration of Subsidies for Ports, Ship Shore Power Facilities and Low Sulfur Oil for Ships. Available online: http://jtys.sz.gov.cn/jtzx/wycx/slcx/khzc/content/post_4302973.html (accessed on 1 August 2022).
  33. Ritchie, A.; de Jonge, E.; Hugi, C.; Cooper, D. European Commission Directorate General Environment, Service Contract on Ship Emissions: Assignment, Abatement, and Market-based Instruments. In Task 2c–SO2 Abatement; Entec UK Limited: Northwich, Cheshire, UK, 2005. [Google Scholar]
  34. Notice on Defining the Price of Ship Shore Based Power Supply Service. Available online: http://zwgk.taizhou.gov.cn/art/2016/12/26/art_46293_1282722.html (accessed on 1 August 2022).
  35. Implementation Plan of Global Marine Fuel Sulfur Limit Order in 2020. Available online: https://www.msa.gov.cn/page/article.do?articleId=7917B172-1CB6-421E-881C-25E5D00001B3 (accessed on 1 August 2022).
  36. Decision of the Standing Committee of the People’s Congress of Jiangsu Province on the Applicable Amount of Environmental Protection Tax for Air Pollutants and Water Pollutants. Available online: http://czt.jiangsu.gov.cn/art/2017/12/5/art_7805_6939598.html (accessed on 1 August 2022).
  37. Environmental Protection Tax Law of the People’s Republic of China. Available online: https://www.mee.gov.cn/ywgz/fgbz/fl/201811/t20181114_673632.shtml (accessed on 1 August 2022).
  38. Hu, X.; Wang, B.; Huang, J.; Ruan, W. Cost-benefit optimization analysis of all parties involved in shore power construction and operation and comparison of coastal power characteristics in rivers and lakes. Electr. Power Autom. Equip. 2018, 9. [Google Scholar]
  39. Slater, H.; De Boer, D.; Qian, G.; Shu, W. 2021 China Carbon Pricing Survey; ICF: Beijing, China, 2021. [Google Scholar]
Figure 1. Multiagent game of oil-to-electricity conversion.
Energies 16 02755 g001
Figure 2. Tripartite benefit analysis under cap and trade.
Energies 16 02755 g002
Figure 3. Tripartite benefit analysis under carbon tax policy.
Energies 16 02755 g003
Figure 4. Ship information.
Energies 16 02755 g004
Figure 5. The expected price of the national carbon emissions trading market in 2021–2050.
Energies 16 02755 g005
Figure 6. The relationship between subsidies and the benefits to all parties. (a) The relationship between electricity service price and social welfare; (b) The relationship between subsidy and social welfare; (c) The relationship between subsidy and government benefit; (d) The relationship between subsidy and port benefit; (e) The relationship between subsidy and ship benefit.
Energies 16 02755 g006
Figure 7. The relationship between carbon price and the benefits to all parties. (a) The relationship between electricity service price and social welfare; (b) The relationship between carbon price and social welfare; (c) The relationship between carbon price and government benefit; (d) The relationship between carbon price and port benefit; (e) The relationship between carbon price and ship benefit.
Energies 16 02755 g007
Figure 8. The relationship between time proportion and the benefits to all parties. (a) The relationship between electricity service price and social welfare; (b) The relationship between time proportion and social welfare; (c) The relationship between time proportion and government benefit; (d) The relationship between time proportion and port benefit; (e) The relationship between time proportion and ship benefit.
Energies 16 02755 g008aEnergies 16 02755 g008b
Table 1. Annual emission factors and pollution equivalent values of pollutants.
Marine Fuel Emission Pollutants F n g / kWh E dl n kg
SO20.460.95
NOx11.800.95
VOC0.530.05
CO1.6816.7
general dust PM100.304
CO26985000
Table 2. Comparison of the impact of subsidy rates on economic benefits to all parties under the two carbon regimes.
Carbon MechanismCap and TradeCarbon Tax
Subsidy rate a1 (%)3030
Subsidy rate a2 (%)3030
Electricity service price (CMY/kWh)0.11510.2855
Electricity actual price (CMY/kWh)0.77520.9456
Electricity consumption (GWh)30.48430.484
Annual utilization hours (h)4692.84692.8
Social welfare (million CMY)−104.937−109.959
Government benefit (million CMY)7.57012.647
Port benefit (million CMY)4.657 × 10−169.313 × 10⁻¹⁶
Ship benefit (million CMY)−108.031−113.228
Savings from “oil-to-electricity” ships (million CMY)37.91732.720
Table 3. Comparison of the impact of subsidy rates on environmental benefits to all parties under the two carbon regimes.
Carbon MechanismCap and TradeCarbon Tax
Carbon cap (Mt)98,051.842
Carbon price (CMY/Mt)5050
Actual CO2 emissions (Mt)95,649.61195,649.611
Tax involved in carbon mechanism (million CMY)−0.1204.782
Environmental tax savings (million CMY)6.1006.100
CO2 reduction (Mt)5209.7465209.746
SO2 reduction (Mt)14.02314.023
NOx reduction (Mt)359.713359.713
VOC reduction (Mt)16.15716.157
CO reduction (Mt)51.21351.213
General dust PM10 reduction (Mt)9.1459.145
Table 4. Comparison of the impact of carbon price on economic benefits to all parties under the two carbon regimes.
Carbon MechanismCap and TradeCarbon Tax
Subsidy rate a1 (%)3030
Subsidy rate a2 (%)3030
Electricity service price (CMY/kWh)0.11090.1857
Electricity actual price (CMY/kWh)0.77100.8458
Electricity consumption (GWh)30.48430.484
Annual utilization hours (h)4692.84692.8
Social welfare (million CMY)−104.696−107.090
Government benefit (million CMY)7.5639.605
Port benefit (million CMY)00
Ship benefit (million CMY)−107.904−110.186
Savings from “oil-to-electricity” ships (million CMY)38.04535.762
Table 5. Comparison of the impact of carbon price on environmental benefits to all parties under the two carbon regimes.
Carbon MechanismCap and TradeCarbon Tax
Carbon cap (Mt)98,051.842
Carbon price (CMY/Mt)10020
Actual CO2 emissions (Mt)95,649.61195,649.611
Tax involved in carbon mechanism (million CMY)−0.2401.913
Environmental tax savings (million CMY)6.1006.100
CO2 reduction (Mt)5209.7465209.746
SO2 reduction (Mt)14.02314.023
NOx reduction (Mt)359.713359.713
VOC reduction (Mt)16.15716.157
CO reduction (Mt)51.21351.213
General dust PM10 reduction (Mt)9.1459.145
Table 6. Comparison of the impact of time-proportional on economic benefits to all parties under the two carbon regimes.
Carbon MechanismCap and TradeCarbon Tax
Subsidy rate a1 (%)3030
Subsidy rate a2 (%)3030
Electricity service price (CMY/kWh)0.53990.5399
Electricity actual price (CMY/kWh)1.21.2
Proportion of time using shore power (%)3939
Electricity consumption (GWh)56.35456.354
Annual utilization hours (h)8675.28675.2
Social welfare (million CMY)−66.986−72.230
Government benefit (million CMY)16.62521.187
Port benefit (million CMY)25.61620.713
Ship benefit (million CMY)−99.796−99.796
Savings from “oil-to-electricity” ships (million CMY)46.15346.153
Table 7. Comparison of the impact of time-proportional on environmental benefits to all parties under the two carbon regimes.
Carbon MechanismCap and TradeCarbon Tax
Carbon cap (Mt)98,051.842
Carbon price (CMY/Mt)5050
Actual CO2 emissions (Mt)91,228.44591,228.445
Tax involved in carbon mechanism (million CMY)−0.3414.561
Environmental tax savings (million CMY)11.27611.276
CO2 reduction (Mt)9630.9139630.913
SO2 reduction (Mt)25.92325.923
NOx reduction (Mt)664.978664.978
VOC reduction (Mt)29.86829.868
CO reduction (Mt)94.67594.675
General dust PM10 reduction (Mt)16.90616.906
Disclaimer/Publisher’s Note: The statements, opinions and data contained in all publications are solely those of the individual author(s) and contributor(s) and not of MDPI and/or the editor(s). MDPI and/or the editor(s) disclaim responsibility for any injury to people or property resulting from any ideas, methods, instructions or products referred to in the content.

