Article

Process Optimization and CO2 Emission Analysis of Coal/Biomass Gasification Integrated with a Chemical Looping Process

by
Ratikorn Sornumpol
1,
Dang Saebea
2,
Amornchai Arpornwichanop
3 and
Yaneeporn Patcharavorachot
1,*
1
Department of Chemical Engineering, School of Engineering, King Mongkut’s Institute of Technology Ladkrabang, Bangkok 10520, Thailand
2
Research Unit of Developing Technology and Innovation of Alternative Energy for Industries, Burapha University, Chonburi 20131, Thailand
3
Center of Excellence in Process and Energy Systems Engineering, Department of Chemical Engineering, Faculty of Engineering, Chulalongkorn University, Bangkok 10330, Thailand
*
Author to whom correspondence should be addressed.
Energies 2023, 16(6), 2728; https://doi.org/10.3390/en16062728
Submission received: 14 February 2023 / Revised: 12 March 2023 / Accepted: 13 March 2023 / Published: 15 March 2023
(This article belongs to the Special Issue Biomass and Municipal Solid Waste Thermal Conversion Technologies II)

Abstract

:
Biomass gasification is an attractive technology and one of the pathways for producing hydrogen. Due to the variable seasons and low calorific value of biomass, the addition of coal in the gasifier is suggested because coal has a high calorific value and carbon-to-hydrogen ratio. In general, the gaseous product obtained in gasification always contains a high amount of carbon dioxide, therefore, the co-gasification of biomass and coal should integrate with the calcium looping carbon dioxide capture process to provide purified hydrogen. In this work, the model of the co-gasification of biomass and coal integrated with the calcium looping carbon dioxide capture process was developed through an Aspen Plus simulator. The developed model was used to analyze the performance of this process. The sensitivity analysis demonstrated that increasing the gasification temperature, steam-to-feed (S/F) ratio, calcium oxide-to-feed (CaO/F) ratio, and regenerator temperature could improve hydrogen production. Next, further optimization was performed to identify the optimal operating condition that maximizes hydrogen production. The results showed that the optimal operating temperature of the gasifier is 700 °C with an S/F mass ratio of 2 and coal to biomass (C/B) mass ratio of 0.75:0.25. However, the carbonator and regenerator temperatures should be 450 °C and 950 °C, respectively, with a CaO/F mass ratio of 3. Under these operating conditions, the maximum H2 content and H2 yield can be provided as 99.59%vol. (dry basis) and 92.38 g hydrogen/kg biomass feeding. The other results revealed that the energy efficiency and carbon capture efficiency of this process are 42.86% and 99.99%, respectively, and that the specific emission of released CO2 is 80.77 g CO2/MJ.

1. Introduction

Nowadays, conventional power generation based on fossil fuels encounters several problems, including the depletion of fossil fuel resources and CO2 emissions as a greenhouse gas. To solve these problems, many researchers have tried to develop alternative renewable energy sources to replace fossil fuels. Hydrogen in particular is often perceived as an energy carrier for the future since it is a clean, efficient, renewable, and non-polluting energy source with a high energy density (33.3 kW h/kg) [1]. This makes it a promising source of renewable energy that could address the global energy crisis while also meeting environmental concerns [2]. Nowadays, hydrogen can be used as fuel for mobile and stationary applications through fuel cells or internal engines without carbon emissions [3], however, it should be derived from renewable resources, e.g., biomass [4], ethanol [5,6], and biodiesel [7], to support a sustainable energy system.
Biomass, as an agricultural residue, is an alternative renewable energy source since it is abundant, readily available, and inexpensive. The main advantage of biomass is CO2 neutrality, which is a balance between CO2 emission from the production process and CO2 adsorption by the plant. In general, biomass is widely used for energy and heat production through the combustion process [8]. In addition, the conversion of biomass into fuels, chemicals, or gaseous products has received significant attention since the energy storage in this product form is easy to store, transport, and handle.
The selection of methods to produce a chemical product from biomass depends on the desired product. This research focuses on hydrogen production from biomass and thus, the gasification process is recommended. Although the product obtained from biomass gasification is synthesis gas or syngas, hydrogen can be further produced through various purification processes. At present, the investigation of the gasification process has received more attention in both the experiment and process simulation. Syngas production through the gasification process is affected by both the operating conditions of the gasifier and gasifying agent types. Arteaga-Pérez et al. [9] studied the gasification of sugarcane bagasse in a bubbling fluidized bed gasifier through simulation with the Aspen Plus simulator. They reported that under the condition of 750 °C with an equivalent ratio of 0.3, the total exergy efficiency and energy efficiency are the highest. The gasifying agent fed to react with the biomass has an effect on both the composition and heating values of the syngas. Fernandez-Lopez et al. [10] investigated the gasification of animal wastes in a dual fluidized bed gasifier by using the Aspen Plus simulator. At different ratios, two types of gasifying agents, i.e., steam and CO2, were studied. The result indicated that the use of steam as a gasifying agent can produce a higher H2/CO ratio than that of CO2. Shen et al. [11] studied the CO2 gasification of woody biomass in a lab-scale auto-thermal gasifier. Their result showed that the CO composition increased while CH4 decreased because of the Boudouard reaction; carbon conversion and cold gas efficiency (CGE) increased with the CO2 addition.
Although biomass is renewable and available, its amounts may fluctuate depending on agriculture, season, cultivated area, and volume of agricultural production. Therefore, biomass power plants cannot operate in some seasons. In addition, the use of biomass has some obstacles to operation since it has a high moisture content, low bulk density, and low calorific value, which have an impact on hydrogen production [12]. In order to resolve the utilization of biomass, there are many researchers focusing on the co-gasification of biomass and coal [13,14,15]. Not only is coal cheap, easily transportable, and abundant in resources, but coal gasification has a high efficiency in hydrogen production. In addition, coal has a high energy calorific value because the thermodynamic efficiency of coal is higher than biomass. Shahabuddin and Bhattacharya [16] assessed the co-gasification of coal and biomass with a CO2 agent by using the Aspen Plus process simulator. They reported that the blending of coal and biomass in an equal amount can provide a higher lower heating value (LHV) and CGE than pure coal by 12% and 18%, respectively. Biomass blending of up to 50% favors gasification performance with an LHV of 12 MJ/kg and a CGE of 78%. Howaniec et al. [17] determined the reactivity of coal, biomass, and fuel blends in a laboratory-scale fixed bed reactor which was operated at 700, 800, and 900 °C. Their results showed that the reactivity of fuel blends of coal and biomass had the highest value compared to coal and biomass char reactivity at the same operating conditions. Secer et al. [18] implemented response surface methodology (RSM) to determine the optimal operating conditions of the hydrothermal co-gasification of sorghum at a constant temperature of 500 °C for maximum hydrogen content. Their results showed that the highest total gas and hydrogen volumes could be obtained under conditions where the higher levels of the water volume of the reactor and lower levels of the coal percentage of the coal/biomass mixture were combined.
In general, the syngas product derived from gasification is composed of H2, CO, CO2, and CH4. However, to enhance the H2 yield in the syngas product, CO and CO2 must be removed. Calcium looping is the most promising technology for the CO2 capture process and offers many benefits [19]. Calcium oxide (CaO) is cheap and widely distributed; as a sorbent, it can save operation costs and be environmentally friendly [20,21]. When the syngas obtained from the gasification process is delivered to the calcium looping process, the CO2 in the syngas will adsorb on the surface of CaO where the carbonation reaction as an exothermic reaction can occur (referred to as carbonator), and thus, calcium carbonate (CaCO3) can be generated. Since CO2 is produced from the water gas shift reaction while the CO2 is removed from the carbonation reaction, it is possible to perform the separation of CO2 simultaneously during the water gas shift reaction in a single unit. When CO2 is produced from the water gas shift reaction, it will be adsorbed into CaO through the carbonation reaction. Thus, the CO2 removal causes a shift in the equilibrium of the water gas shift reaction to the product side. The occurrence of the two following reactions: the water gas shift and carbonation reactions in a single reactor, which is referred to as the sorption-enhanced water-gas shift (SE-WGS) reaction, can reduce not only CO2 but also CO. After the carbonation reaction is complete, CaCO3 is sent to the regenerator reactor where CaCO3 can be desorbed to CO2 and CaO. Since the reaction occurring in the regenerator (called the calcination reaction) is an endothermic reaction, a high external heat source is required. A number of works have focused on the SE-WGS reaction with wider types of sorbents [21,22,23]; for example, Wang et al. [21] revealed that Ni-doped CaO (Ni-CaO) could promote a SE-WGS reaction.
Most of the previous publications focusing on gasification integrated with the calcium looping process have performed a sensitivity analysis of operating conditions. However, optimization should be performed to determine the global optimal operating condition of gasification and calcium looping that can provide the maximum H2 product. In this research, the statistical method is introduced to discover the important parameters that influence process efficiency. In addition to performance analysis and optimization, an environmental assessment in terms of carbon emission should be considered to ensure that the proposed system has no negative effect on the environment.
This research aims to study hydrogen production from the co-gasification of biomass and coal integrated with the calcium looping process through the Aspen Plus simulator version 10. Firstly, the effect of operating conditions in gasification (i.e., gasification temperature, steam to feed ratio, and coal to biomass mass ratio) and the calcium looping process (i.e., carbonator temperature, regeneration temperature, and CaO to feed mass ratio) on hydrogen production is investigated. Next, the optimization of the gasification and calcium looping process is performed by using Design Expert 11 where the maximum H2 production is the main objective function. Finally, the energy analysis and carbon dioxide emission-to-energy consumption of the co-gasification of biomass and coal integrated with the calcium looping process is determined.

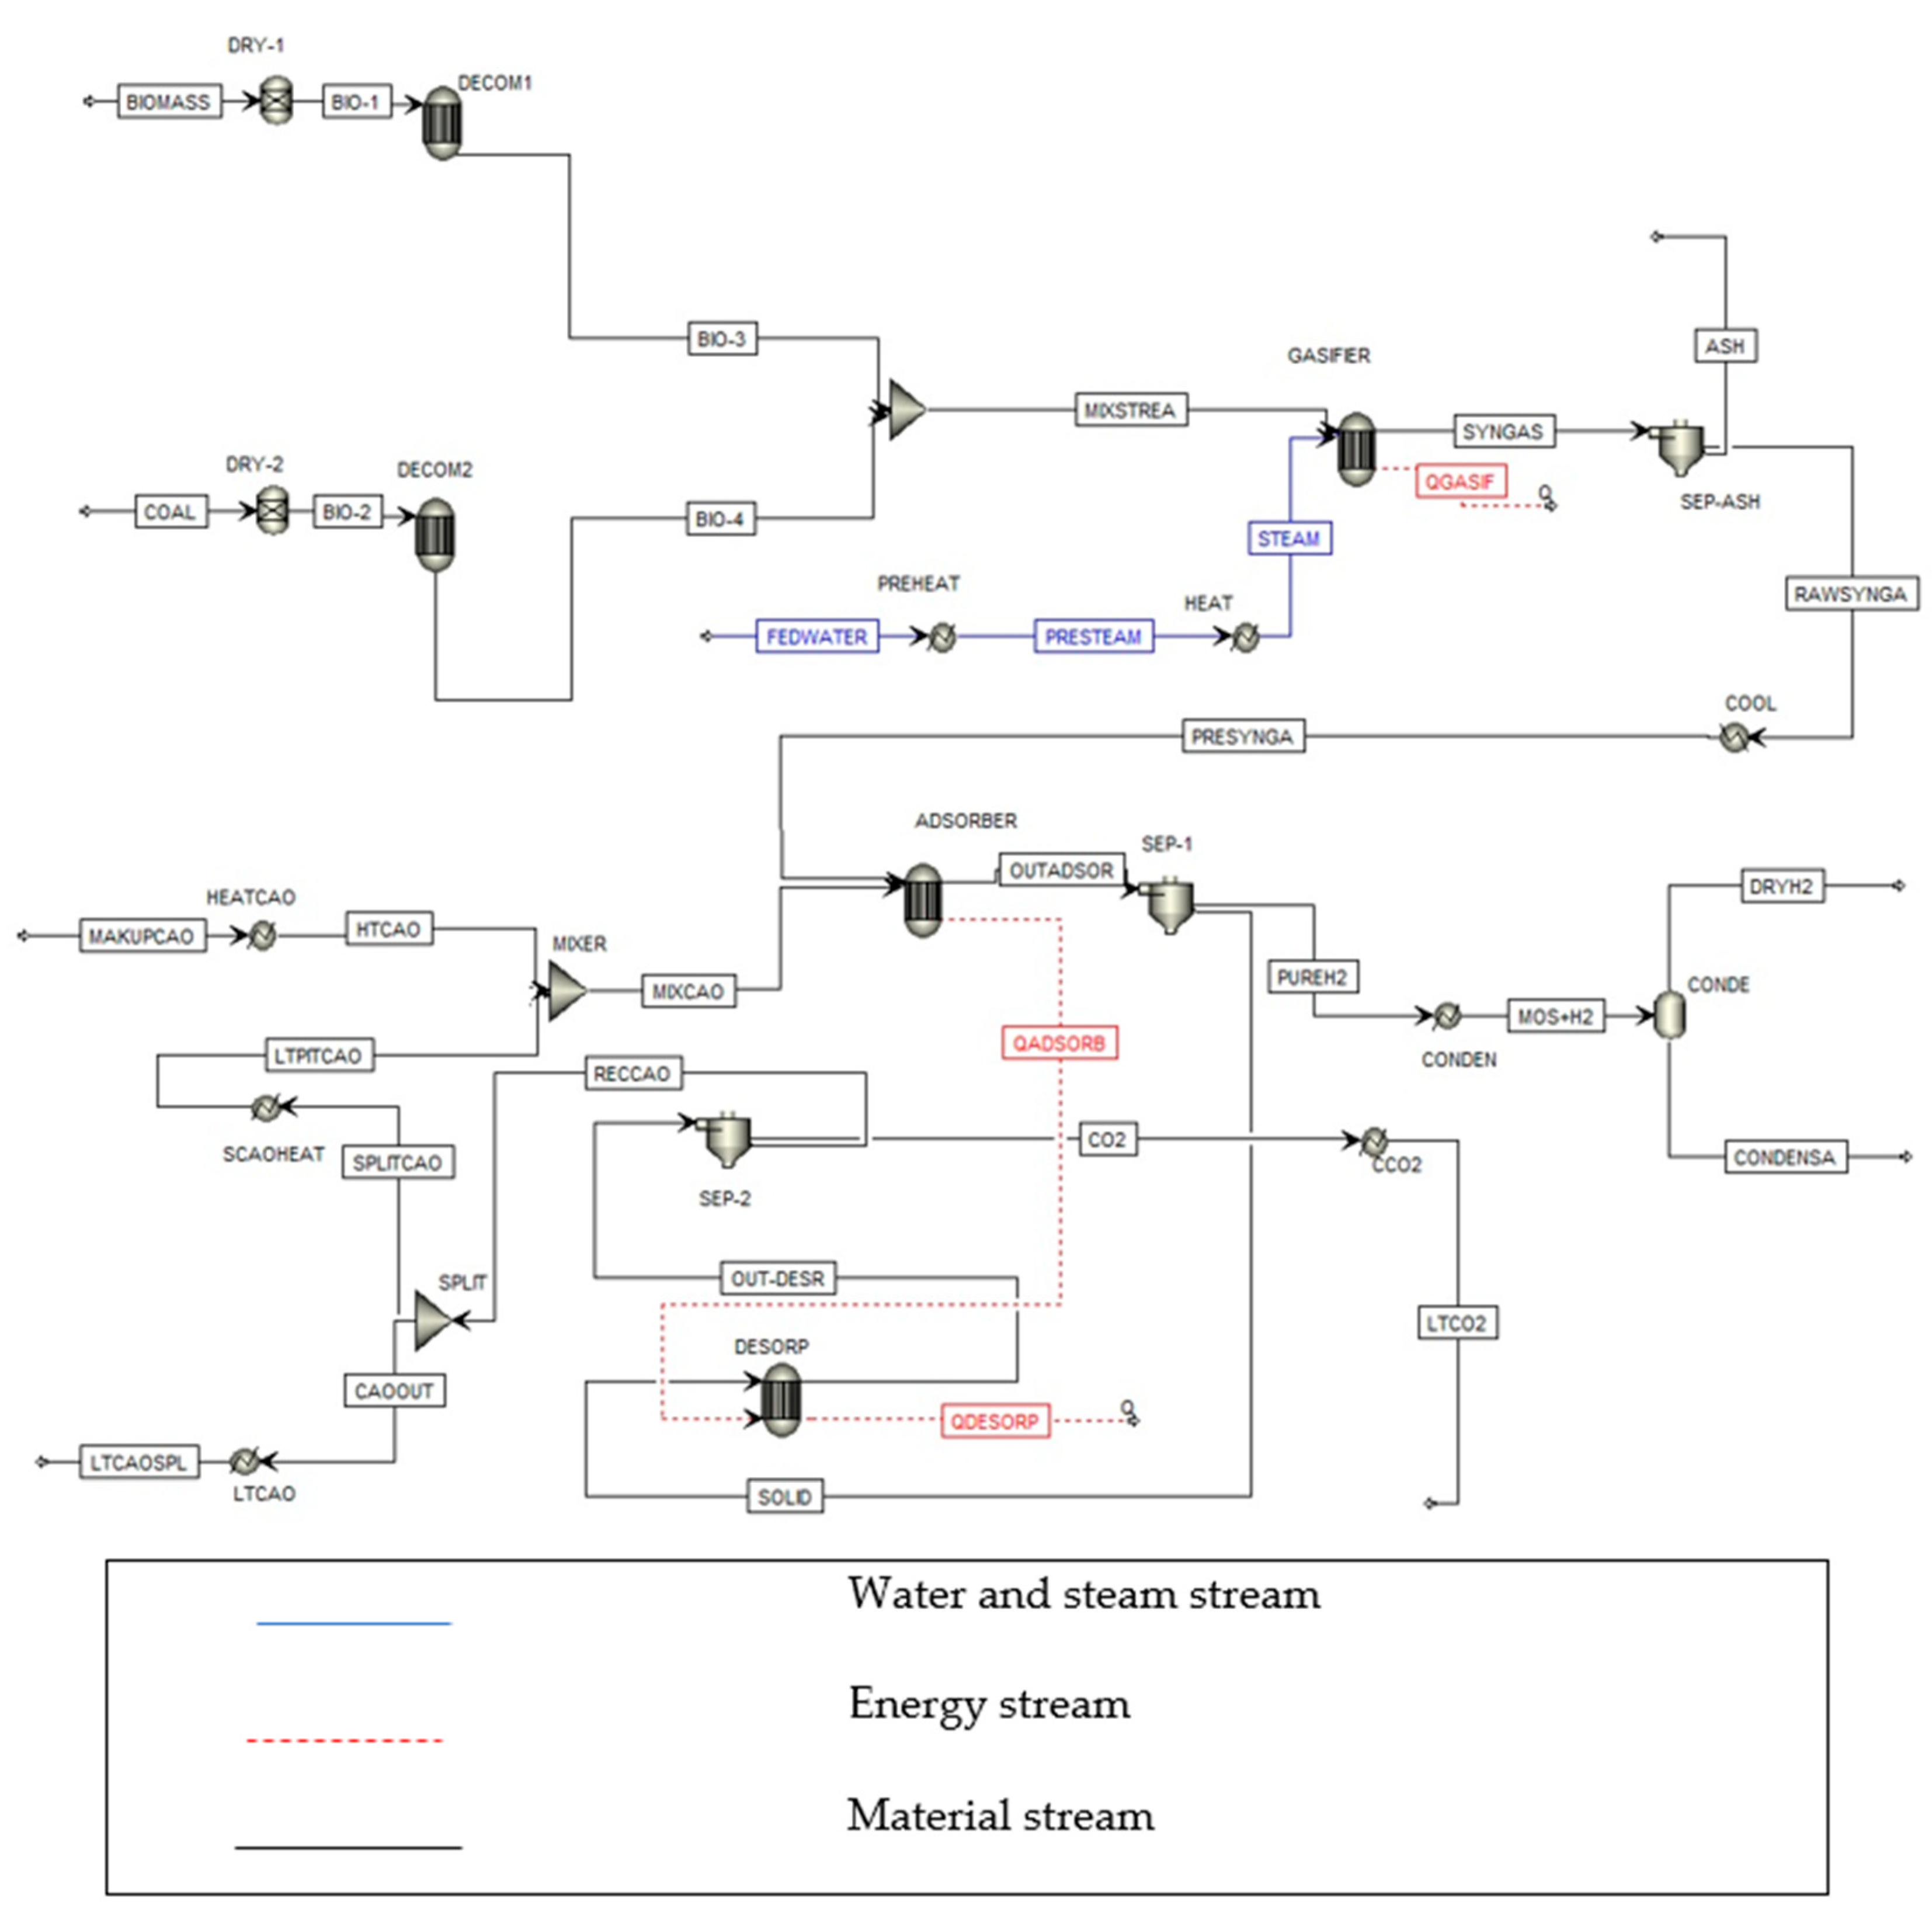
2. Process Flow Diagram Description

Figure 1 presents a schematic diagram of the integrated co-gasification with calcium looping process designed in the Aspen Plus simulator. The black line represents the material stream, whereas the blue and red lines demonstrate the water or steam and energy streams. In this research, the mixture of pellet pine wood and lignite coal is selected as the raw material for hydrogen production. The process is divided into two sections that include (1) the gasification process and (2) the purification of H2 from raw syngas through the calcium looping process. Firstly, biomass (BIOMASS) and coal (COAL) are separately fed into a dryer (DRY), which is modeled by the Sep model to remove moisture from the biomass and coal. Next, the dried biomass (BIO-1) and dried coal (BIO-2) are separately supplied to the decomposition reactor (DECOM) which is represented by the RYield reactor model. In the Aspen Plus simulation, both the biomass and coal are defined as non-conventional components. They must be decomposed into conventional components which include the conventional elements: C, H, N, O, S, etc. The components of biomass and coal are defined based on proximate and ultimate data, as shown in Table 1. Next, the outlet product from each decomposition reactor (BIO-3 for biomass and BIO-4 for coal) is mixed and delivered to a gasifier (GASIFIER) corresponding with steam (STEAM). The gasifier, which is modeled by the RGibbs reactor model, can calculate the gas composition at the chemical equilibrium through the minimization of the Gibbs free energy method. The type of gasifier reactor used in this study is a fluidized bed gasifier. Although the RGibbs reactor model does not require the specification of chemical reactions, the possible chemical reactions occurring in the gasifier have been listed in Equations (1)–(7).
Combustion reaction
C + O2 → CO2    −394 kJ/mol
H2 + 0.5O2 → H2O   −242 kJ/mol
Boudouard reaction
C + CO2 ↔ 2CO    +172 kJ/mol
Water gas reaction
C + H2O ↔ H2 + CO   +131 kJ/mol
Water gas shift reaction
CO + H2O ↔ H2 + CO2  −41 kJ/mol
Methane formation
C + 2H2 ↔ CH4    −74 kJ/mol
Steam methane reforming
CH4 + H2O ↔ CO + 3H2  +206 kJ/mol
The gas product obtained from gasification (SYNGAS) is further supplied to a cyclone (SEP-ASH) to separate carbon and ash (ASH) from the syngas. Then, the produced syngas (RAWSYNGA) can be provided.
Next, the produced syngas, consisting of H2, H2O, CO, CO2, and CH4, is cooled through a cooler (COOL) before feeding into the calcium looping process (ADSORBER) which is modeled by the RGibbs reactor model. In this reactor, CO is further reduced through a water gas shift reaction (Equation (5)). CO2 is produced from the water gas shift reaction and the gasification process is captured by CaO (MIXCAO) as a sorbent through the carbonation reaction (Equation (8)). When CO2 is removed from the syngas, the H2 yield in the syngas product is higher. Next, the purified H2 is separated from the CaCO3 and other contaminants through a gas-solid separator (SEP-1). Then, the CaCO3 is sent to the regenerator reactor (DESORP) which is modeled by the RGibbs reactor model. When the CaCO3 desorbs CO2 it is converted back into CaO through a calcination reaction (Equation (9)). Some regenerated CaO is deactivated from the regenerator and accumulated in the system. Therefore, it is necessary to split out CaO, recycle it to mix with makeup CaO, and then send it to the carbonator reactor.
Carbonation and calcination reaction
CaO + CO2 → CaCO3    −178 kJ/mol
CaCO3 → CaO + CO2    +178 kJ/mol

3. Methodology

3.1. Parametric Analysis

The investigation of hydrogen production through co-gasification integrated with the calcium looping process is performed through the Aspen Plus simulator version 10. The following assumptions are used in the simulation: (1) the process is operated under steady state and isothermal conditions, (2) the pressure drop and heat loss are negligible, (3) the chemical reactions that occurred in the process reached chemical equilibrium, (4) the gasifier does not produce tar under a high-temperature operation, and (5) charcoal is assumed to be carbon. Although tar formation has not been considered in this work, it should be noted that tar can be represented with a complex mixture of aromatic compounds; for example, toluene, phenol, or naphthalene [24]. In this study, the Peng–Robinson thermodynamic model is selected to predict the gas composition obtained from co-gasification integrated with the calcium looping process. The inlet composition of biomass, coal, steam, and CaO can be specified based on the coal to biomass (C/B), steam to feed (S/F), and CaO to feed (CaO/F) mass ratios which are expressed as Equations (10)–(12).
C B = m ˙ coal m ˙ biomass
S F = m ˙ steam m ˙ biomass + m ˙ coal
CaO F = m ˙ CaO m ˙ biomass + m ˙ coal
where m ˙ i represents the mass flow rate of component i.
Table 2 presents the input parameters of each stream and unit operation. The calculations of the gas composition obtained from the gasifier, adsorber, and regenerator are based on the method of minimizing Gibbs’s free energy. In order to investigate the H2 production from an integrated system, the gas product composition (% dry basis) at the outlet of the gasification reactor (SYNGAS stream) and CO2 mole flow rate at the exit of the carbonator reactor (OUTADSOR stream) are determined with a wider range of gasification temperature, C/B mass ratio, S/F mass ratio, CaO/F mass ratio, regenerator, and carbonator temperature.

3.2. Experimental Design and Optimization

Factorial designs are widely used in experiments involving several factors where it is necessary to study the combined effect of the factors on a response. The 2k factorial design is instrumental in the early stages of experimental work when there are many factors to be investigated [25]. In this study, the 2k factorial design analysis is used to investigate the main effects and interactions of the parameters related to H2 mole fraction for the gasification process and CO2 capture efficiency for the calcium looping process. Two levels of the following five varying parameters: the gasification temperature (A), S/F mass ratio (B), C/B mass ratio (C), carbonator temperature (D), and CaO/F mass ratio (E) are investigated.
In this study, the parameters and their levels are selected from the result obtained in Section 5.1. A response surface method (RSM) analysis is an efficient experimental strategy to determine optimal conditions for a multivariable system. The process variable and function of each factor are represented by
y = β 0 + β 1 X 1 + β 2 X 2 + ε
where y is the response variable, X1 and X2 are dependent variables, β0, β1, and β2 are regression coefficients evaluated with the least square method, and ε is the error observed in response variable y [25].
In this study, the optimization of operating conditions in an integrated system to maximize H2 mole fraction and CO2 capture efficiency is performed through Design Expert V11.

3.3. Energy Efficiency Analysis

The energy efficiency of hydrogen production through the co-gasification process is used to measure the thermal efficiency of the integrated process and can be calculated from the below equation.
η H 2 ( % ) = m ˙ H 2 L H V H 2 m ˙ biomass L H V biomass + m ˙ coal L H V coal + m ˙ steam h steam × 100
where m ˙ H 2 , m ˙ biomass , m ˙ coal and m ˙ steam stand for the mass flow rate of hydrogen, the biomass, coal, and steam, respectively. L H V H 2 , L H V biomass , and L H V coal are the lower heating values of hydrogen, the biomass, and coal, respectively. It is noted that h steam refers to the specific enthalpy of steam at 800 °C = 3663.84 kJ/kg.

3.4. Environmental Impact Analysis
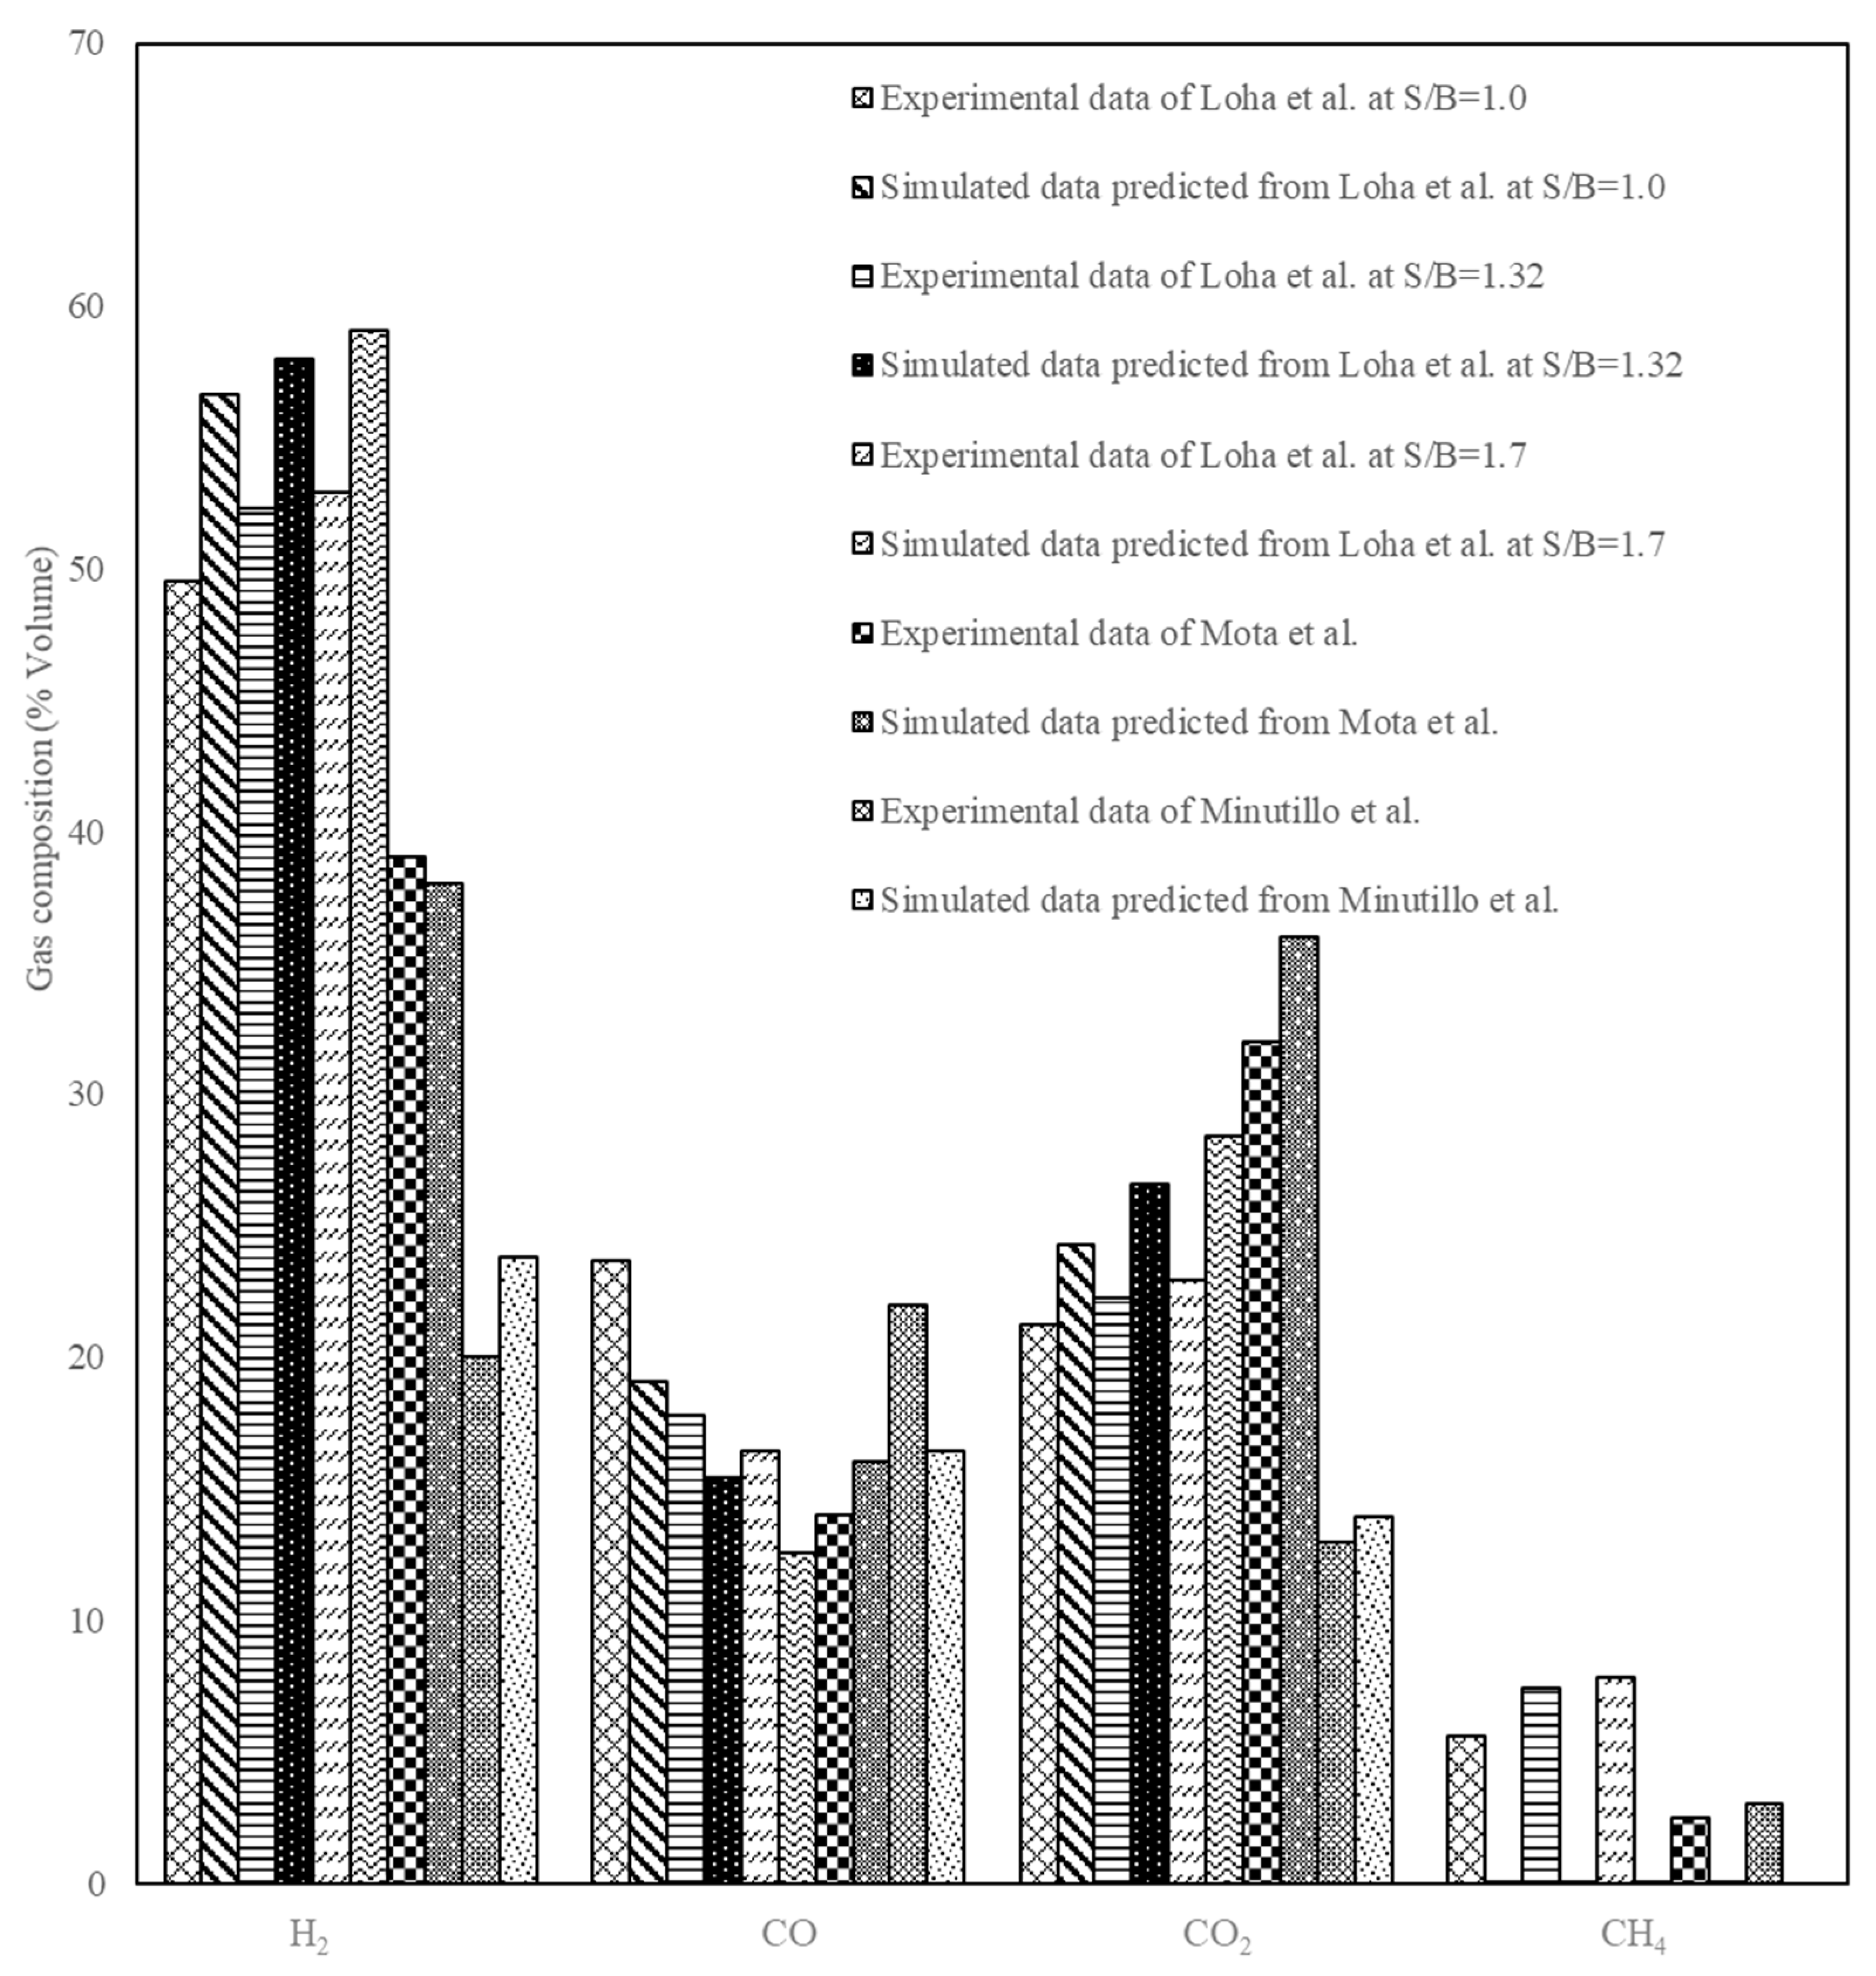
In order to study the environmental impact of the co-gasification of biomass and coal integrated with the calcium looping carbon dioxide capture process, the carbon dioxide emission is evaluated. In this process, CO2 and other greenhouse gas are considered in terms of the CO2 equivalent based on their relative global warming potential (GWP). In this study, the CO2 equivalent calculated from accepted US EPA and IPCC standards can be found in the Aspen Plus simulator. In addition, the carbon dioxide to energy output, which refers to the carbon dioxide emission to net energy, is evaluated by using the following Equation (15) [26].
ε em = m ˙ CO 2 , em W net = m ˙ CO 2 , em m ˙ H 2 L H V H 2
where ε em is the specific emission of released CO2 to the atmosphere, W net is the net power output from the process, and m ˙ CO 2 , em stands for the total mass flow rate of CO2 equivalent emission to the atmosphere. According to Figure 1, m ˙ CO 2 , em is based on LTCO2, LTCAOSPL, and DRYH2 streams.

4. Model Validation

In this study, the simulated gasification results of the biomass and coal are validated with experimental data to ensure that the proposed model can provide predictable results. Loha et al. [27] studied the conversion of rice husk into syngas. Rice husk with a proximate and ultimate analysis, as listed in Table 1, was fed at 1 kg/h into a fluidized bed gasifier at 750 °C and 1.05 bar. The comparison between the simulated results and experimental data, as seen in Figure 2, indicates that the model underpredicts the experimental values for CO and CH4 and overpredicts the value of H2 and CO2, but the trend of changing the compositions with the steam-to-biomass ratio agrees with the experimental data. Minutillo et al. [28] experimented with a downdraft gasifier at a temperature of 900 °C and an air-to-pellet pine wood ratio of 1.96. The result, as shown in Figure 2, indicated that the model is in good agreement with the experimental data. However, the amount of CH4 obtained from the experiment is higher than that from the simulation. This is due to the fact that the calculation is performed based on the equilibrium while the experimental test may not be progressed to chemical equilibrium. Nevertheless, the obtained results are consistent with the literature [13]. Finally, the simulation result is validated for the coal gasification process with experimental data extracted from Mota et al. [29]. In their experiment, the bubbling fluidized bed reactor was operated at a temperature of 750 °C with an oxygen carrier-to-carbon ratio of 1. Figure 2 presents the model prediction of the simulation result and experimental result. It is found that the syngas compositions obtained from the model agree with experimental data.
For the CO2 capture process, the simulated results are compared with the experimental results of Atsonios et al. [30]. In their experiment, the CO2 adsorption and desorption were operated at temperatures of 600–700 °C in a 10 kW dual fluidized bed (DFB) reactor while that of the regenerator temperature is above 850 °C. The comparison between the simulated results and experimental results, as shown in Table 3, reveals that the model prediction is in good agreement with experimental data from Atsonios et al. [30]. The CO2 mole fraction value predicted and the CO2 capture efficiency predicted are matched with the experiments.

5. Result and Discussion

The results of this study can be divided into four parts. First, the sensitivity analysis of the operating parameters in the gasifier (i.e., gasifier temperature and S/F mass ratio) and adsorber (i.e., CaO/F mass ratio, carbonator temperature, and regenerator temperature) on hydrogen production are investigated. In the second part, the DOE method is applied to identify the optimal operating condition of both processes that can provide the maximum H2 amount; the response parameters considered are the H2 mole fraction. Next, the energy analysis is performed to determine the useful energy obtained from this process. Lastly, the environmental assessment is studied to predict the carbon dioxide emission.

5.1. Sensitivity Analysis

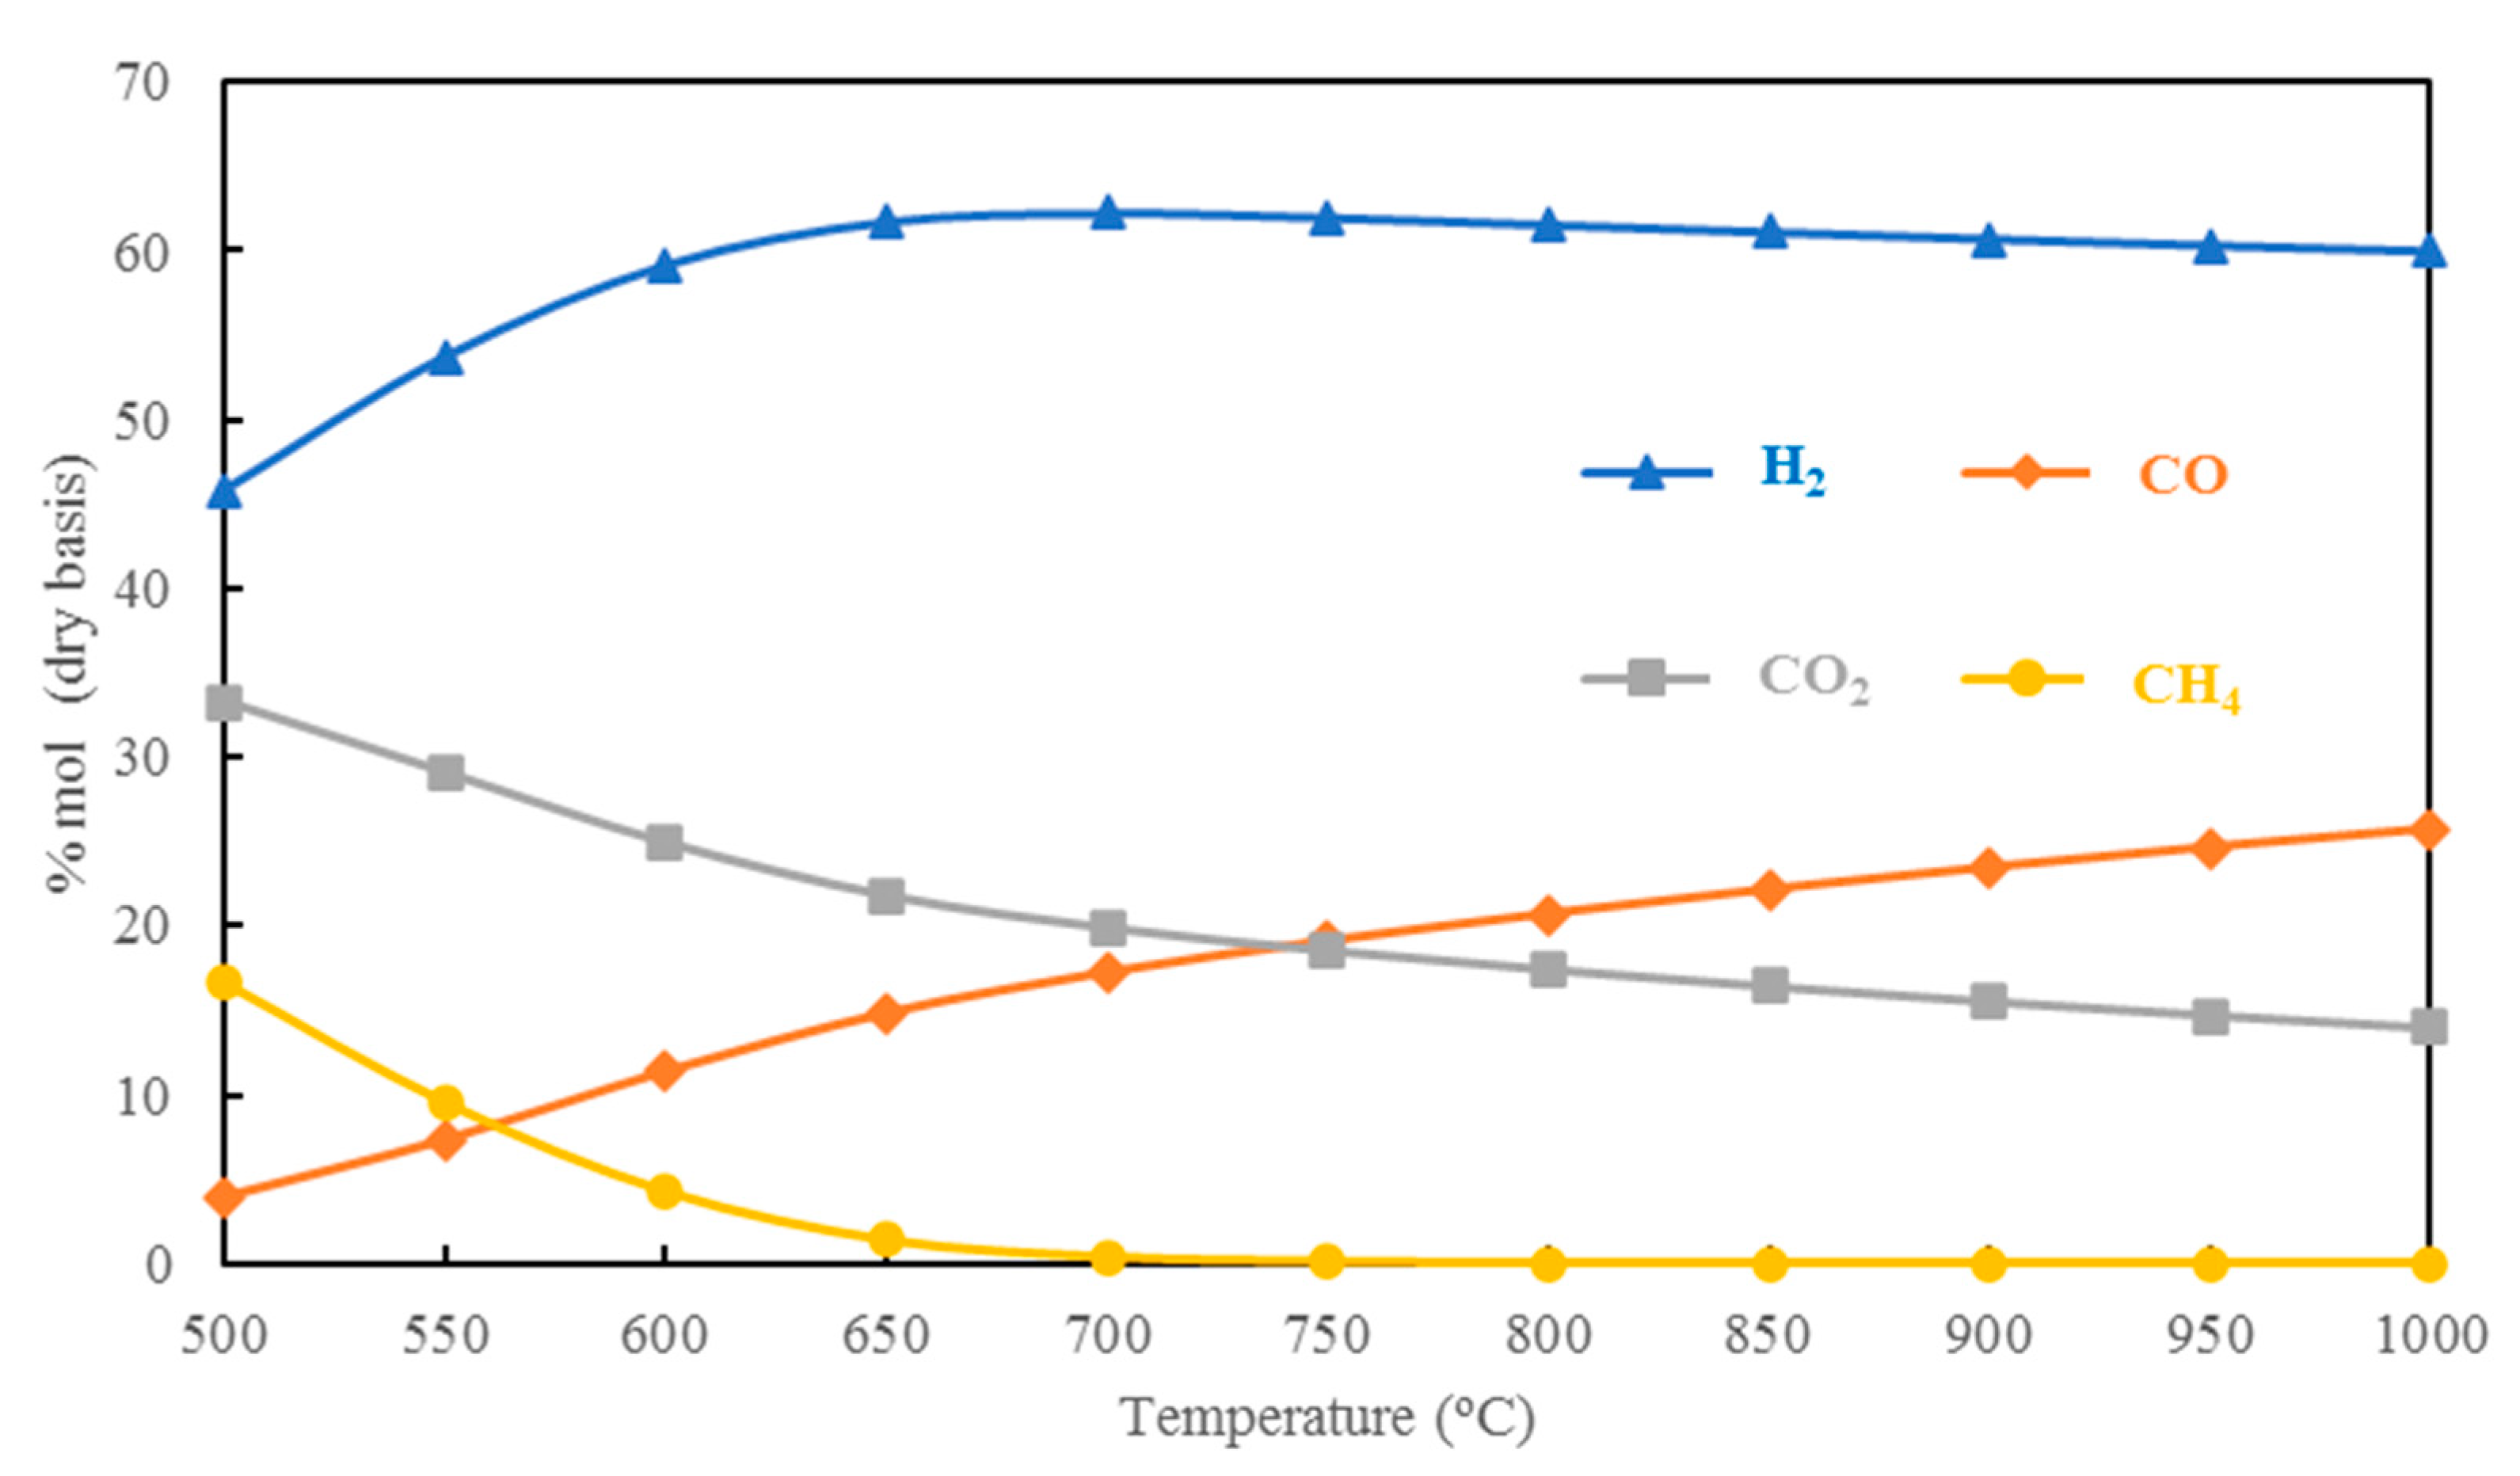
5.1.1. Effect of Gasification Temperature on H2 Production

Figure 3 shows the effect of gasification temperature on compositions of H2, CO, CO2, and CH4 (dry basis). The gasification temperature is varied in a range of 500–1000 °C, whereas the S/F mass ratio of 1 and pressure of 1 atm are fixed as a constant value. It is noted that the mass flow rates of biomass and coal are equal to 1000 kg/h. As shown in Figure 3, the mole fraction of H2 increases when the temperature increases from 500 °C to 700 °C. However, the mole fraction of H2 will be stable at a gasifier temperature above 700 °C because the chemical equilibrium is limited at this temperature. Unlike H2, the mole fraction of CO2 and CH4 decrease with increasing gasification temperature. This is because the Boudouard (Equation (3)), water gas (Equation (4)), and steam methane reforming (Equation (7)) as the endothermic reaction can shift forward to the product side when the gasifier is operated at a high temperature. It is noted that the mole of CH4 at 700 °C is equal to zero since CH4 is completely consumed at this temperature. Thus, CO, CO2, and CH4 can convert to more H2 under a high-temperature operation of a gasifier. From the simulation result, it is found that the optimal gasifier temperature is 700 °C.

5.1.2. Effect of S/F Mass Ratio on H2 Production

Figure 4 demonstrates the effect of the S/F mass ratio on the production of H2, CO, CO2, and CH4 (dry basis). The gasifier is operated at a temperature of 700 °C and pressure of 1 atm, whereas the S/F mass ratio increases from 0 to 10. The simulation results indicate that the H2 mole fraction increases tremendously with the increasing S/F mass ratio in a range of 0–2 and reaches a constant value once the S/F mass ratio is above 2. Increasing the S/F mass ratio means that more steam is fed into the gasifier. This result occurs because more steam feeding into the gasifier can shift reactions (Equations (4) and (7)) forward. In the same manner, higher steam in the process can shift the water gas shift reaction, where CO is converted into H2 and CO2. Therefore, Figure 4 shows the reduction in CO and the increase in CO2 with an increase in the S/F mass ratio. From the simulation result, it can be observed that the CH4 mole fraction becomes zero at an S/F mass ratio above 1. This is due to the fact that CH4 is completely consumed at this ratio. In general, water is typically reactive at temperatures greater than 800 °C and thus, the effect of the S/F mass ratio on hydrogen production is further investigated at a temperature above 800 °C. However, the simulation results show that the mole fraction of H2 is slightly decreased when the gasifier increases. This can be confirmed considering that the chemical equilibrium is limited at 700 °C.

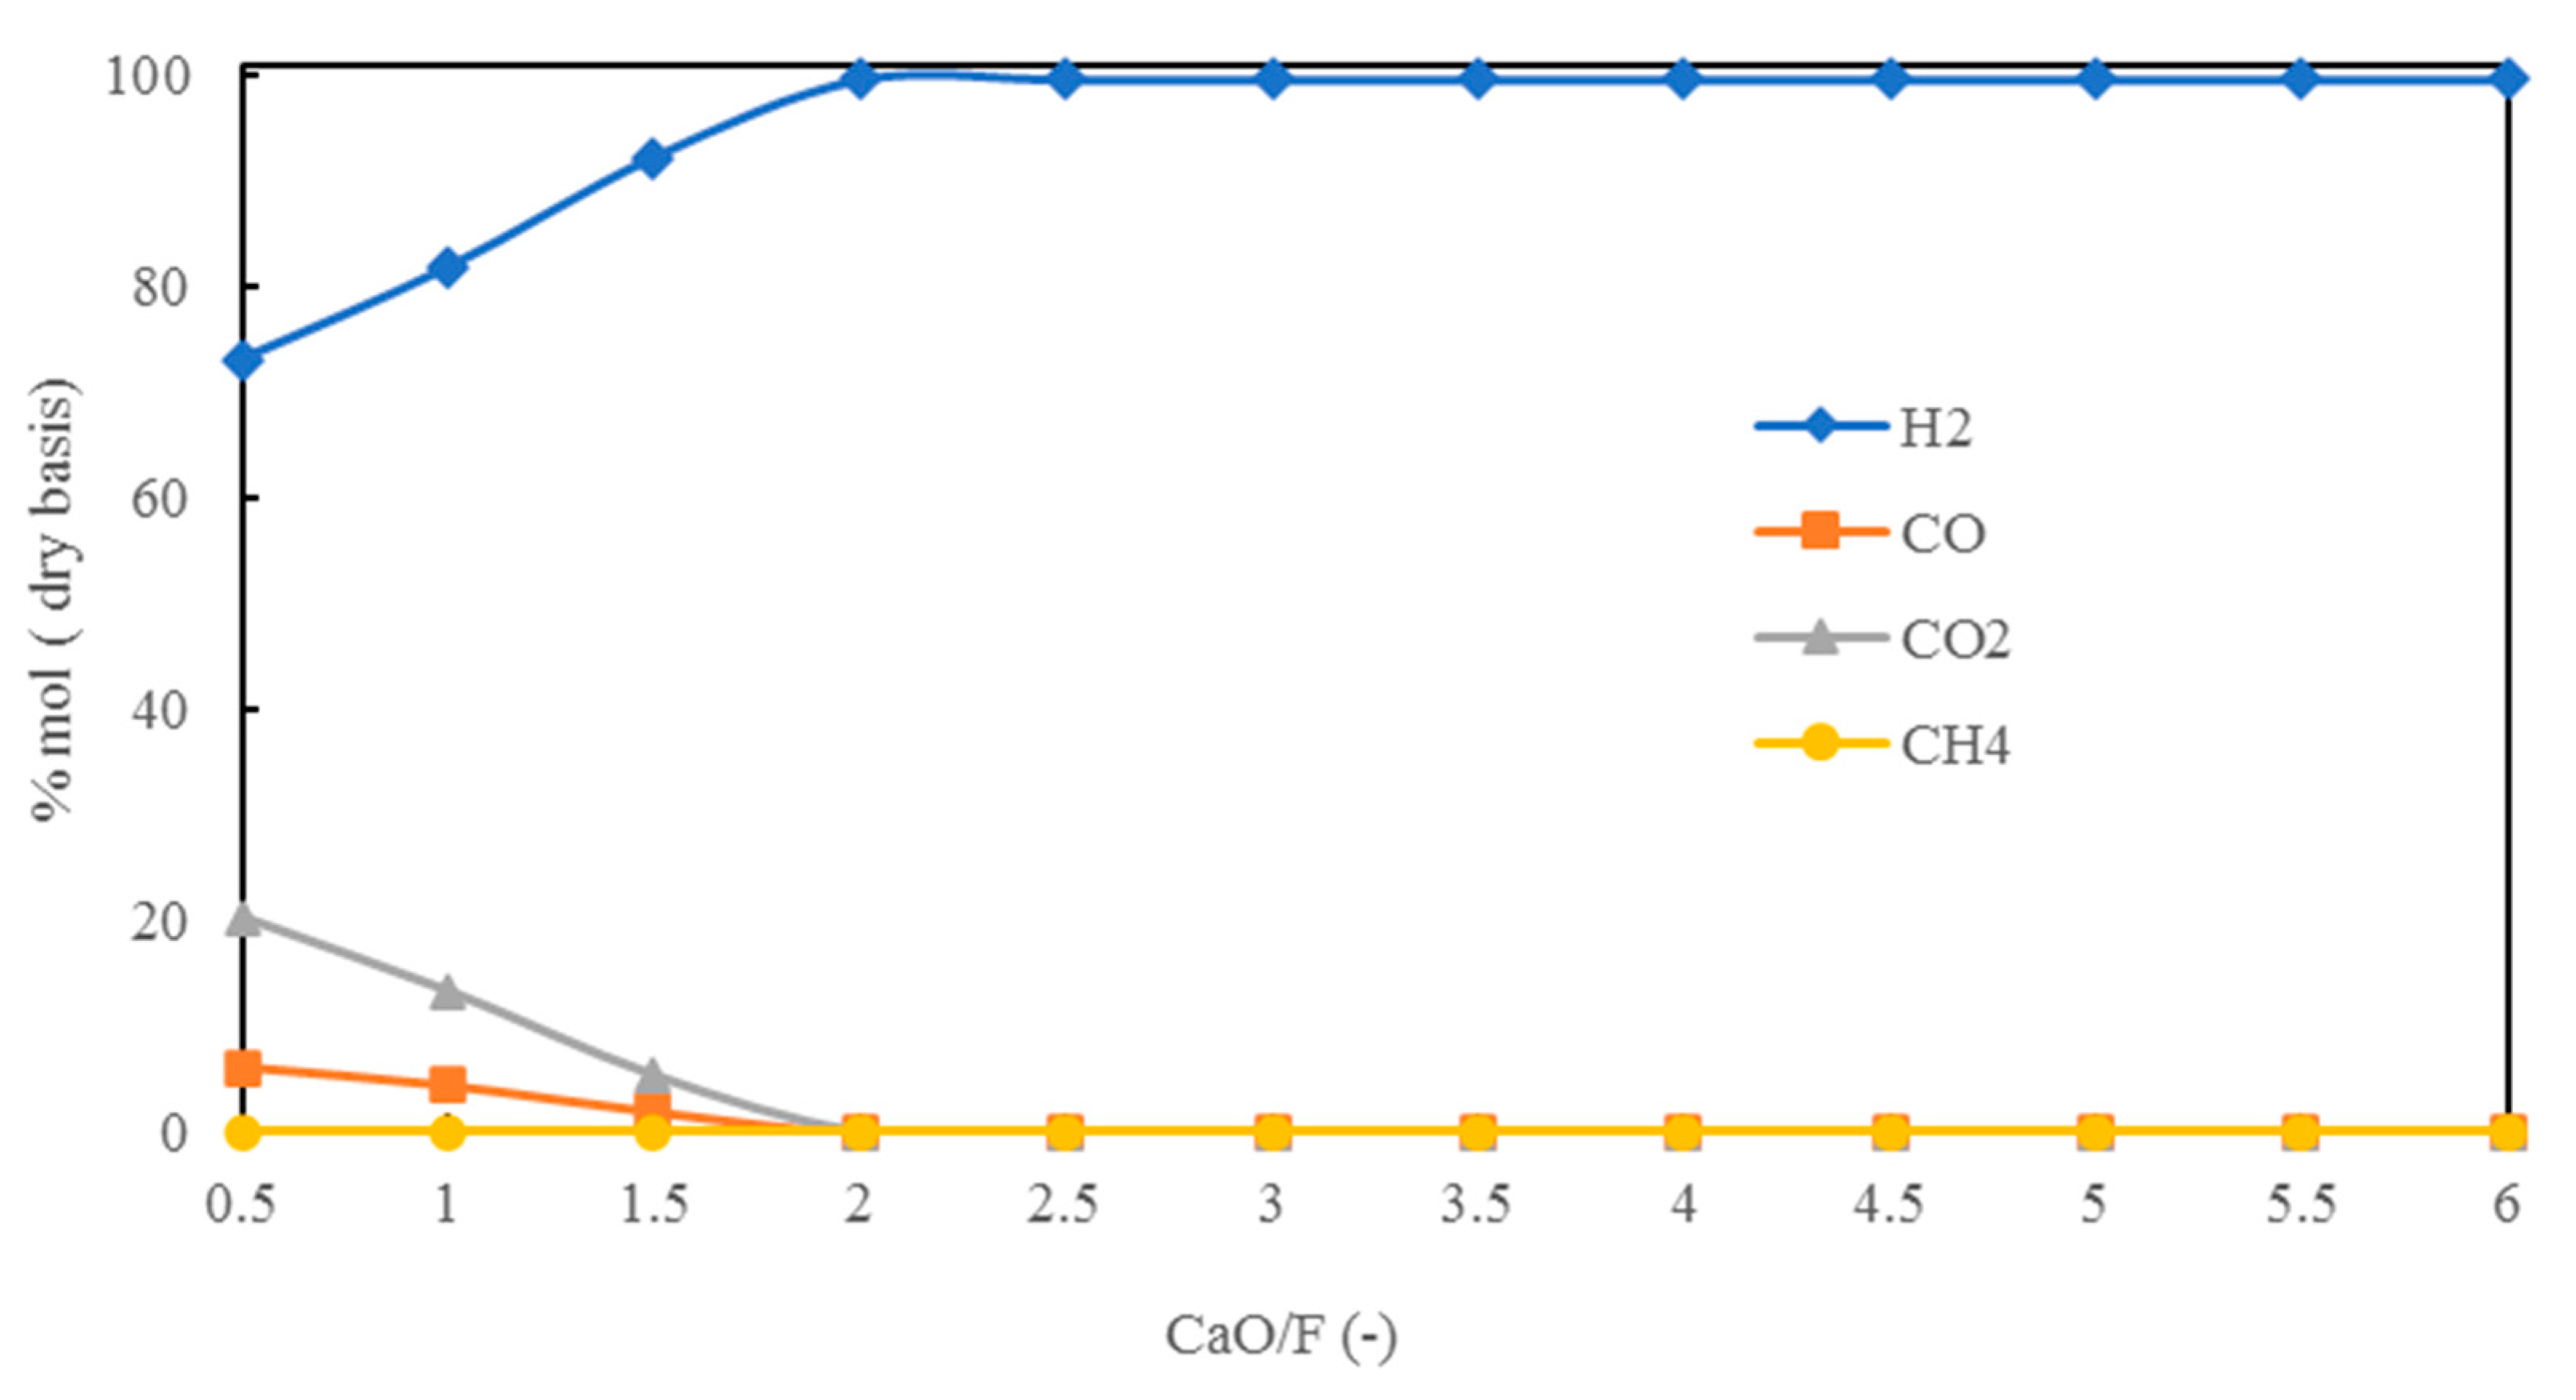
5.1.3. Effect of CaO/F Mass Ratio on H2 Production

In this section, the influence of the CaO/F mass ratio varied from 0 to 6 on H2 production is studied, as shown in Figure 5. When the carbonator temperature is at 450 °C, increasing the CaO/F mass ratio from 0 to 2 can strongly enhance the H2 concentration in the gas product since CO2 is suddenly removed from the syngas. When the CaO/F ratio is higher than 2, the H2 amount drops slightly and reaches a constant value. This is because a CaO/F value of more than 2 may be excess from the stoichiometric value. Unlike H2, an increase in the CaO/F mass ratio causes significant decreases in the amount of CO, CO2, and CH4. This is because CO2 is adsorbed on CaO as an adsorbent. Therefore, the H2 content is higher while the amount of CO2 drops through the carbonation reaction. When CO2 is removed from the system, the amount of CO and CH4 decrease due to the shifting of the water gas shift reaction to the product side. Since a CaO/F mass ratio of more than 2 does not affect H2 production, the suitable CaO/F mass ratio is 2.

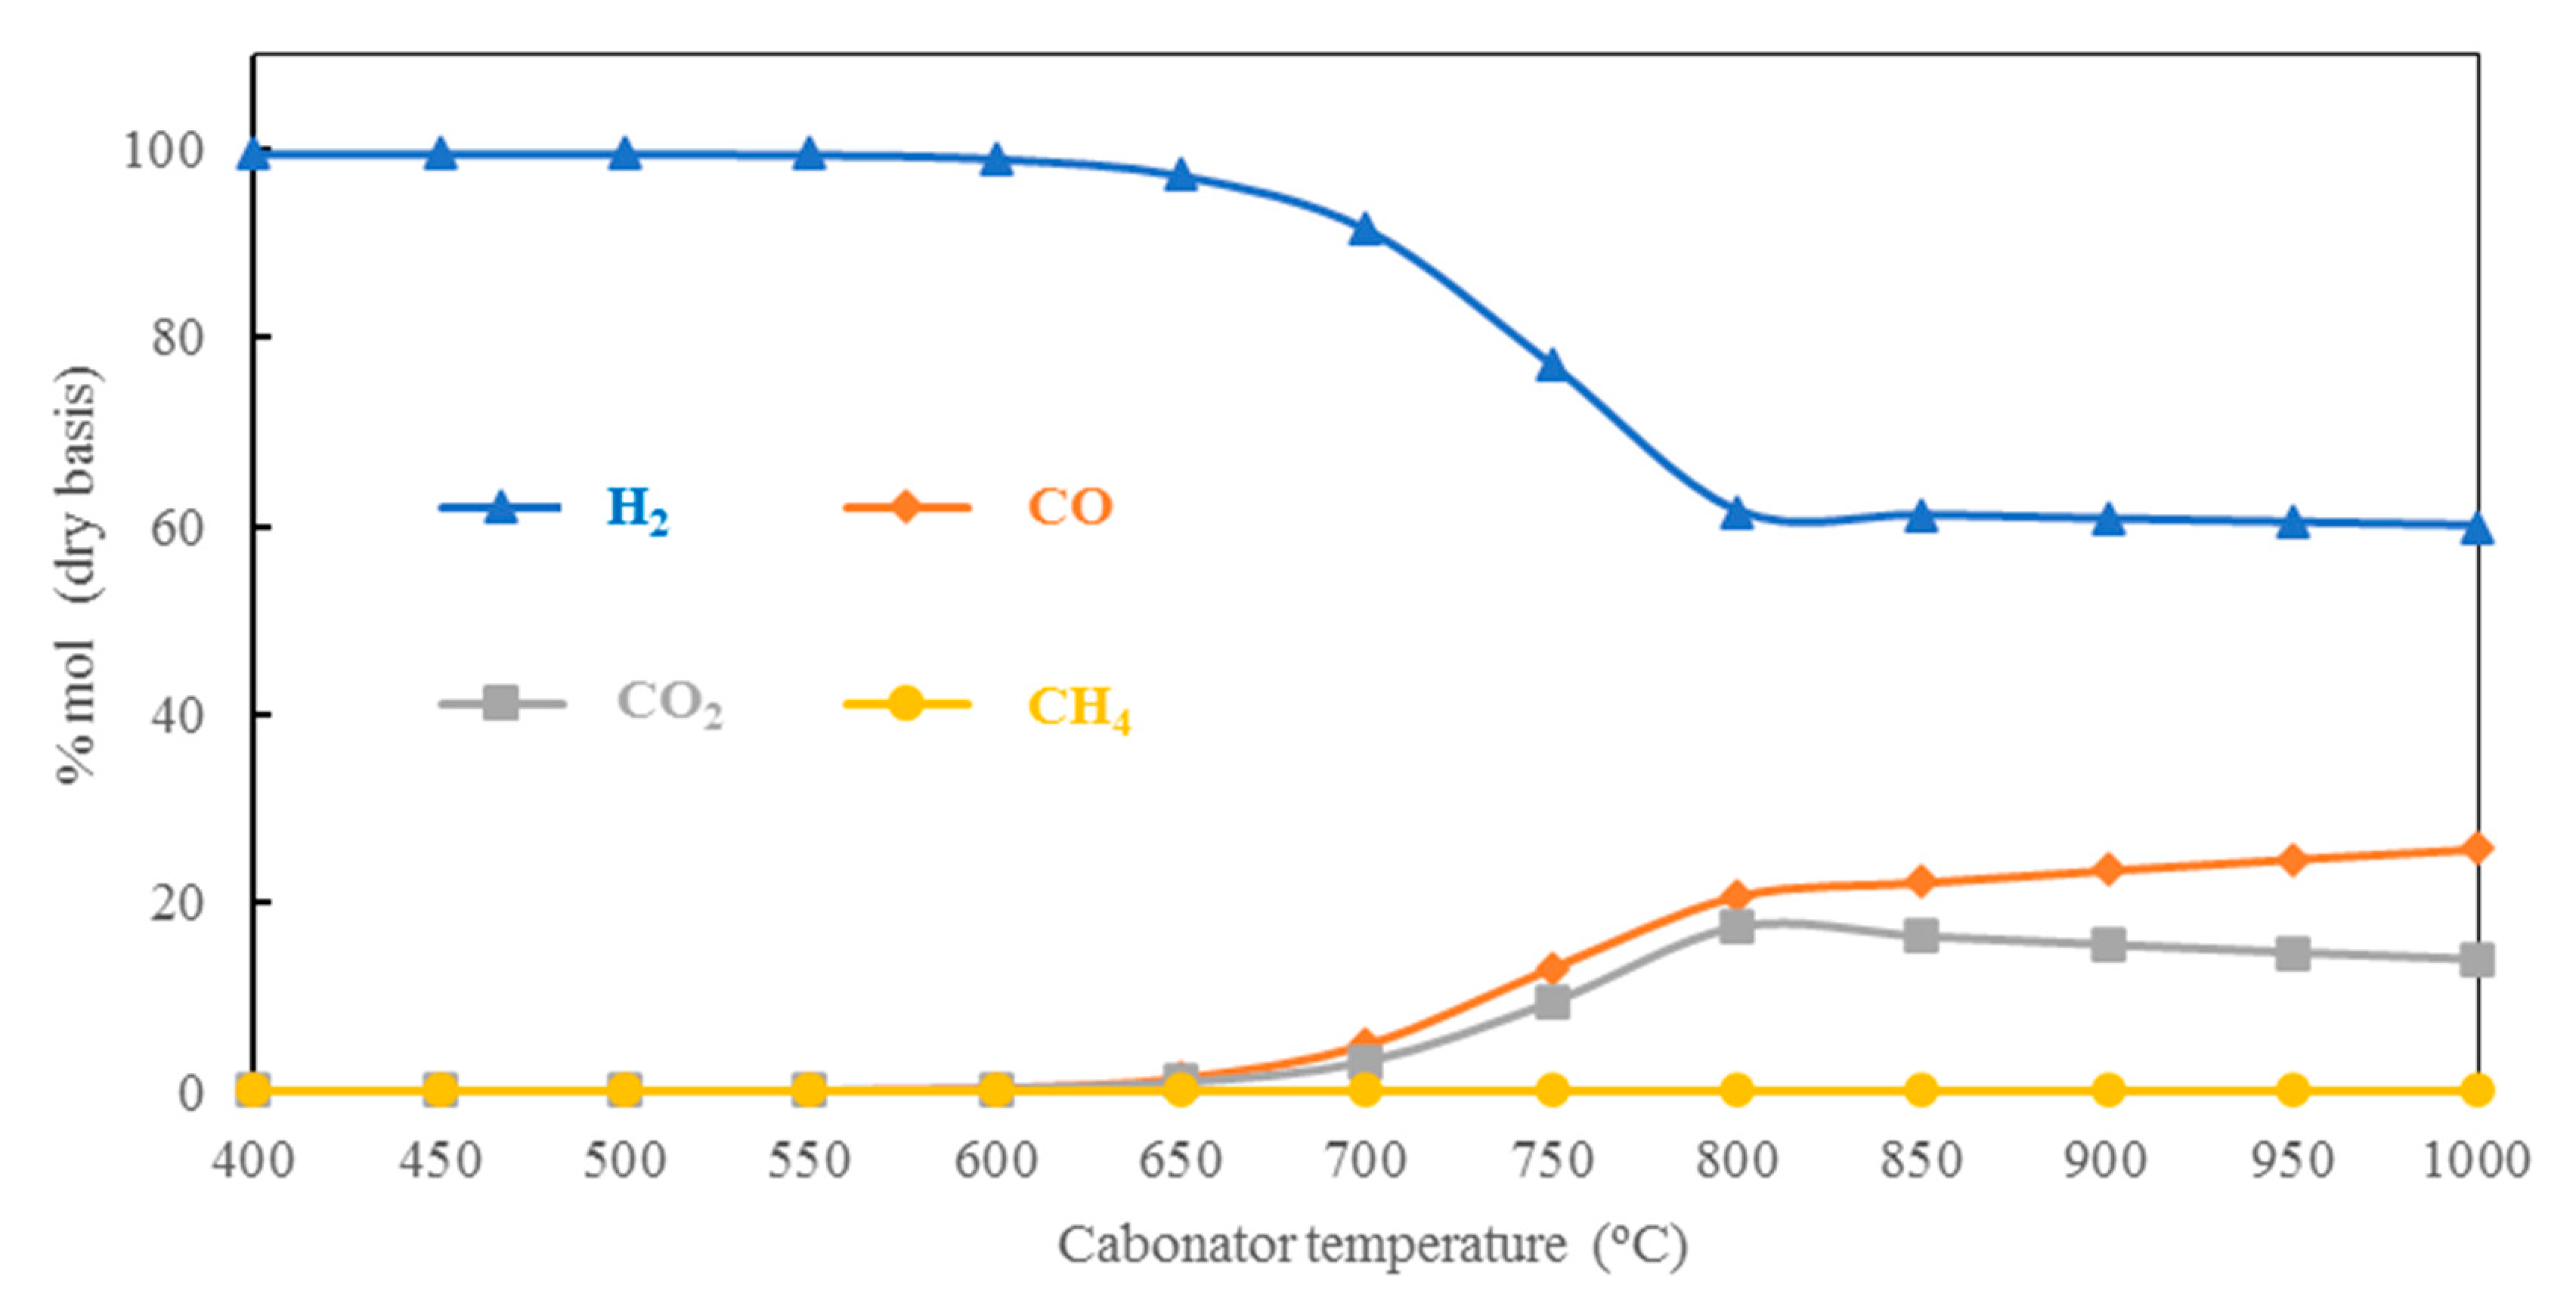
5.1.4. Effect of Carbonator Temperature on H2 Production

The impact of the carbonator temperature increasing from 400 °C to 800 °C on H2 production is also investigated, as illustrated in Figure 6. Because a wide range of carbonator temperatures is investigated, the presence of two plateaus can be observed. The first plateau can be observed when the carbonator operates at a low temperature (400–650 °C). The H2 mole fraction can be improved while CO2 is not present since the carbonator reaction as an exothermic reaction is favorable to low-temperature operation. Under this low-temperature range, all of the CO2 can be removed from the syngas and thus, a stable amount of H2 can be provided. In contrast, the H2 mole fraction will drop and the presence of CO and CO2 can be observed when the carbonator is operated at a high temperature (above 650 °C). Increasing the carbonator temperature can shift the chemical equilibrium backward and thus, CO2 is desorbed from CaCO3. In addition, the reversed water gas shift reaction can occur at high carbonator temperatures, which reduces the CO2 and H2 amounts. However, it can be observed that the amount of H2 is almost constant when the temperature is higher than 800 °C (second plateau). This implies that the chemical equilibrium of reactions is limited at this temperature.

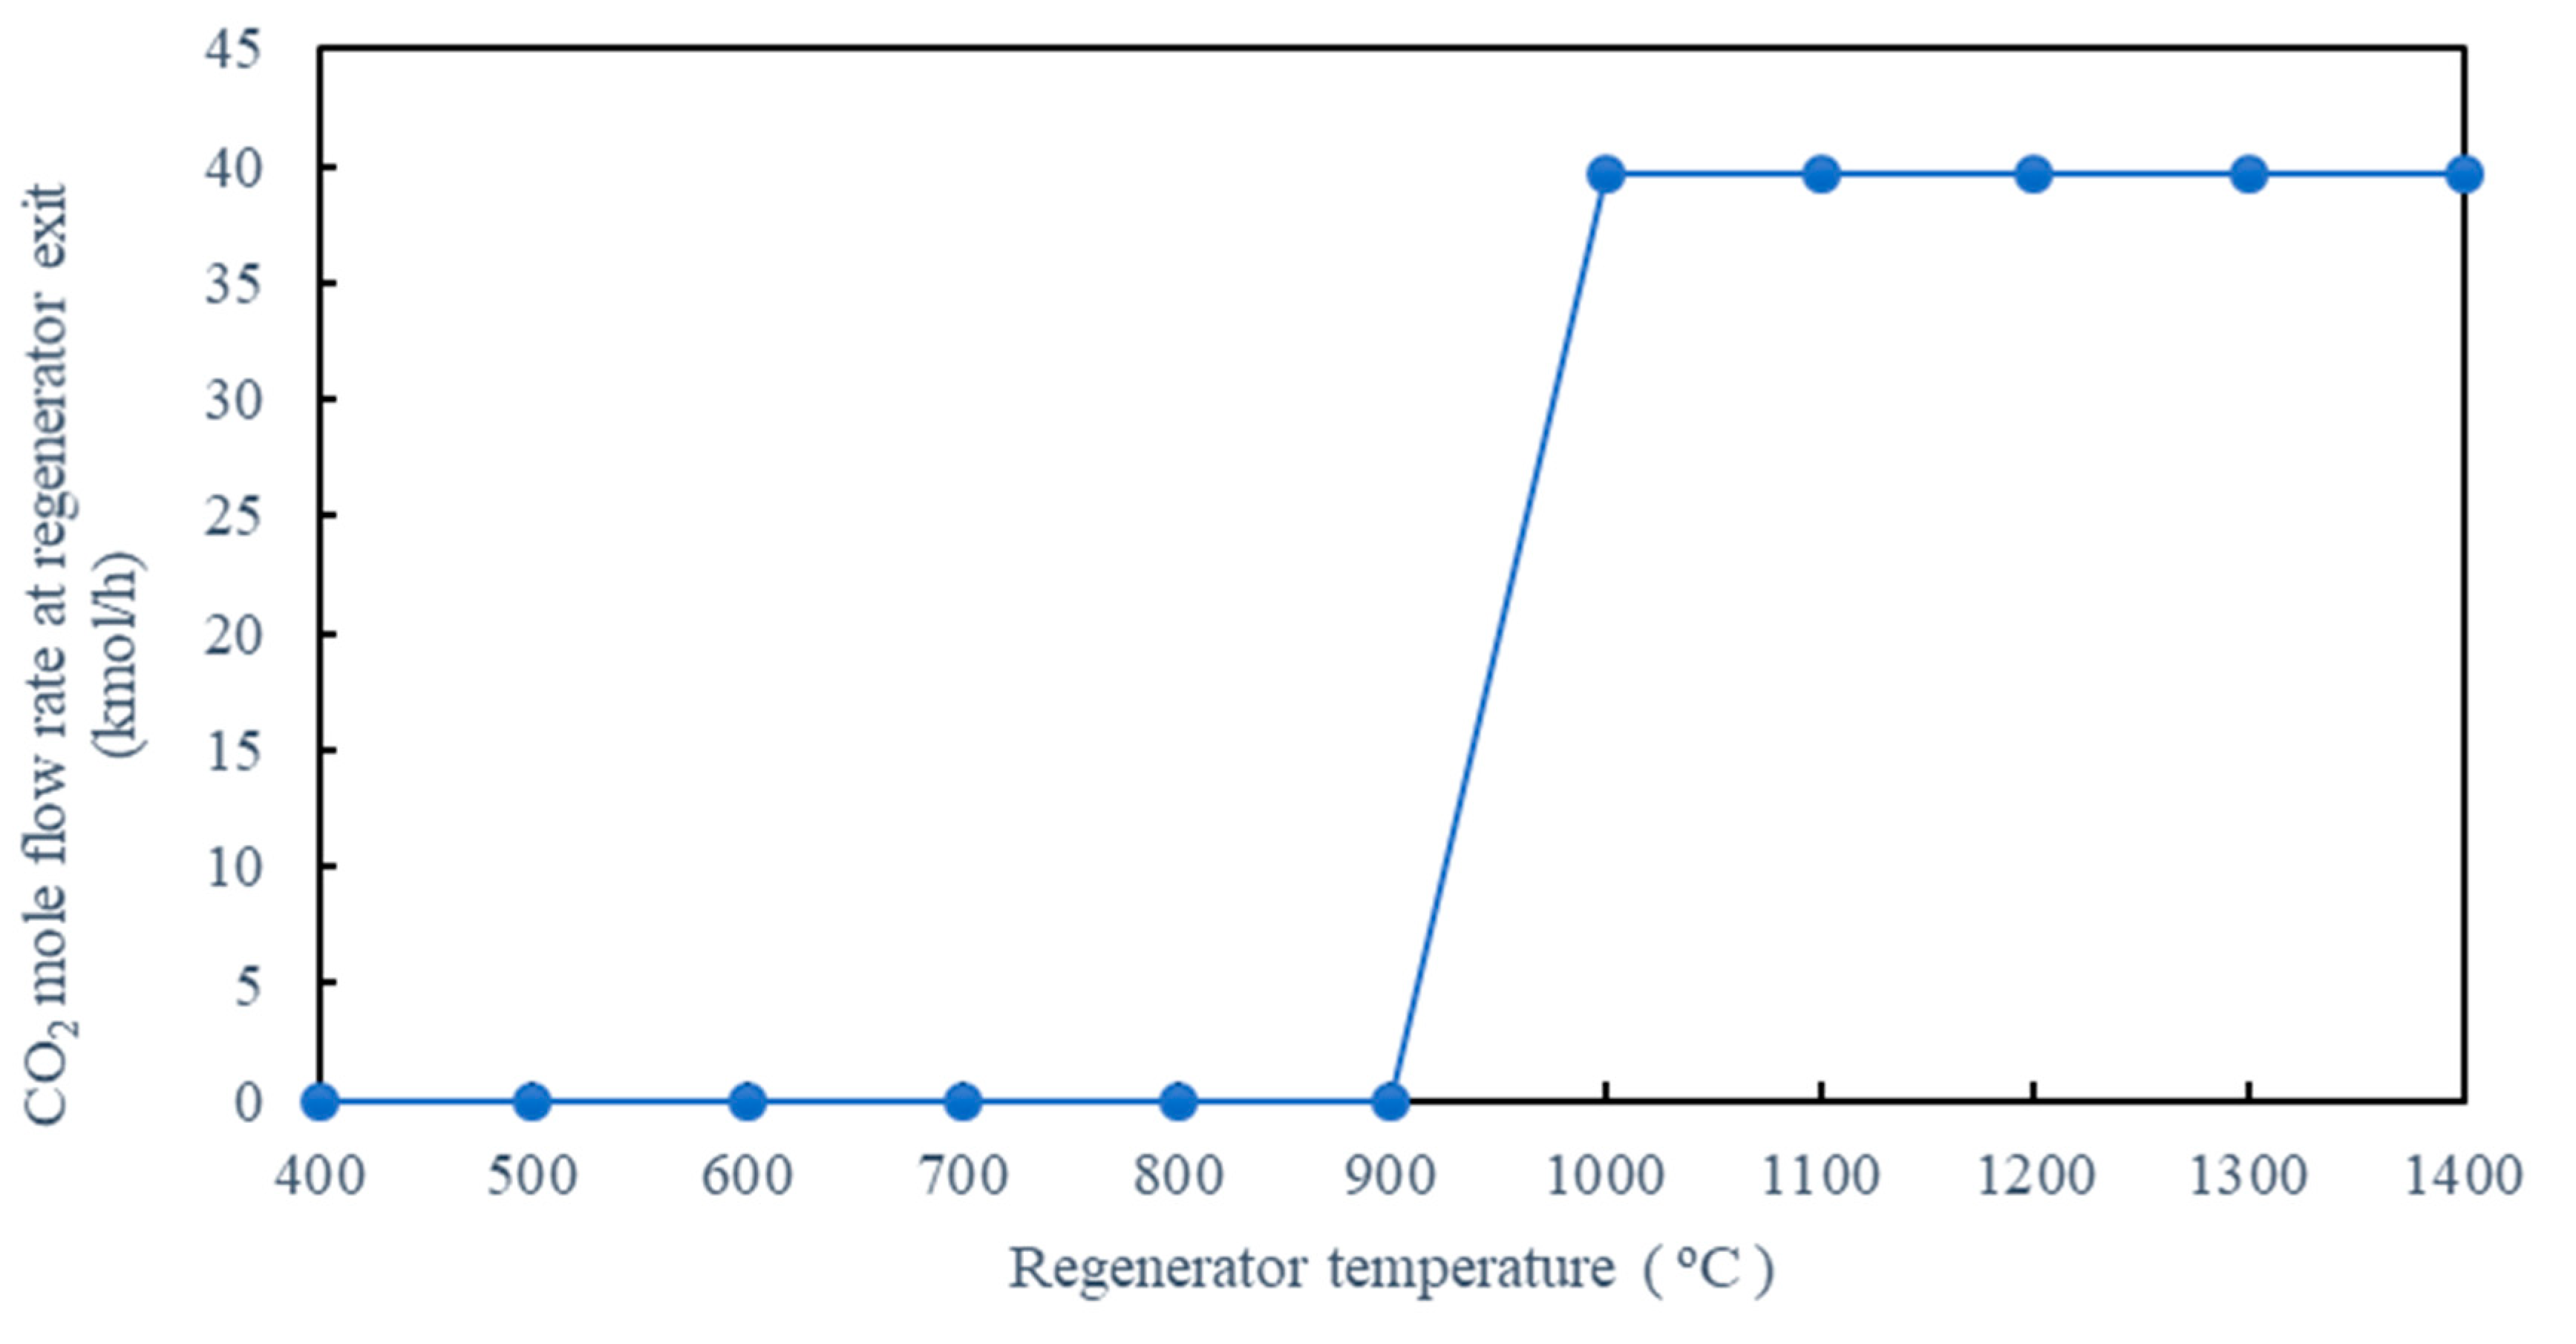
5.1.5. Effect of Regenerator Temperature on CO2 Removal

Figure 7 presents the variation in the CO2 amount when the regenerator temperature is adjusted from 400 °C to 1400 °C, whereas the CaO/F mass ratio and carbonator temperature are set as 2 and 600 °C, respectively. The simulation result indicates that the regeneration process begins to desorb CO2 at a temperature of 900–1000 °C. This can be observed from the production of CO2 at this temperature. However, when the temperature is higher than 950 °C, the CO2 concentration will be constant. From this study, the optimal regenerator temperature is 950 °C.

5.2. Design of Experimental Procedure

Since the sensitivity analysis can indicate the trend of results and some operating conditions must be carefully selected, the optimal operating conditions in the gasification and calcium looping process are determined by using the DOE method. From the results obtained in Section 5.1, it can be seen that both the gasifier temperature and S/F mass ratio have significant influences on H2 production. In addition, the proportion of coal in the biomass, or the coal-to-biomass (C/B) mass ratio, is also an important parameter. Therefore, the selected parameters in the co-gasification of biomass and coal consist of (A) the gasifier temperature, (B) the S/F mass ratio, and (C) the C/B mass ratio. In this way, the full factorial design of three factors with two levels is determined; thus, there are eight numbers in the experiment. The response results from the 23 factorial experimental design analyses with a single replicate are shown in Table 4. The ANOVA statistical analysis of the results obtained with a confidence level of 95% or a p-value equal to 0.05 is summarized in Table 5.
The selected process parameters for the calcium looping carbon dioxide capture process are (D) carbonator temperature and (E) CaO/F mass ratio. The full factorial design of two factors with two levels (22) will provide four numbers in the experiment with a single replicate which are shown in Table 6. The ANOVA statistical analysis of the results obtained with a confidence level of 95% is summarized in Table 7.

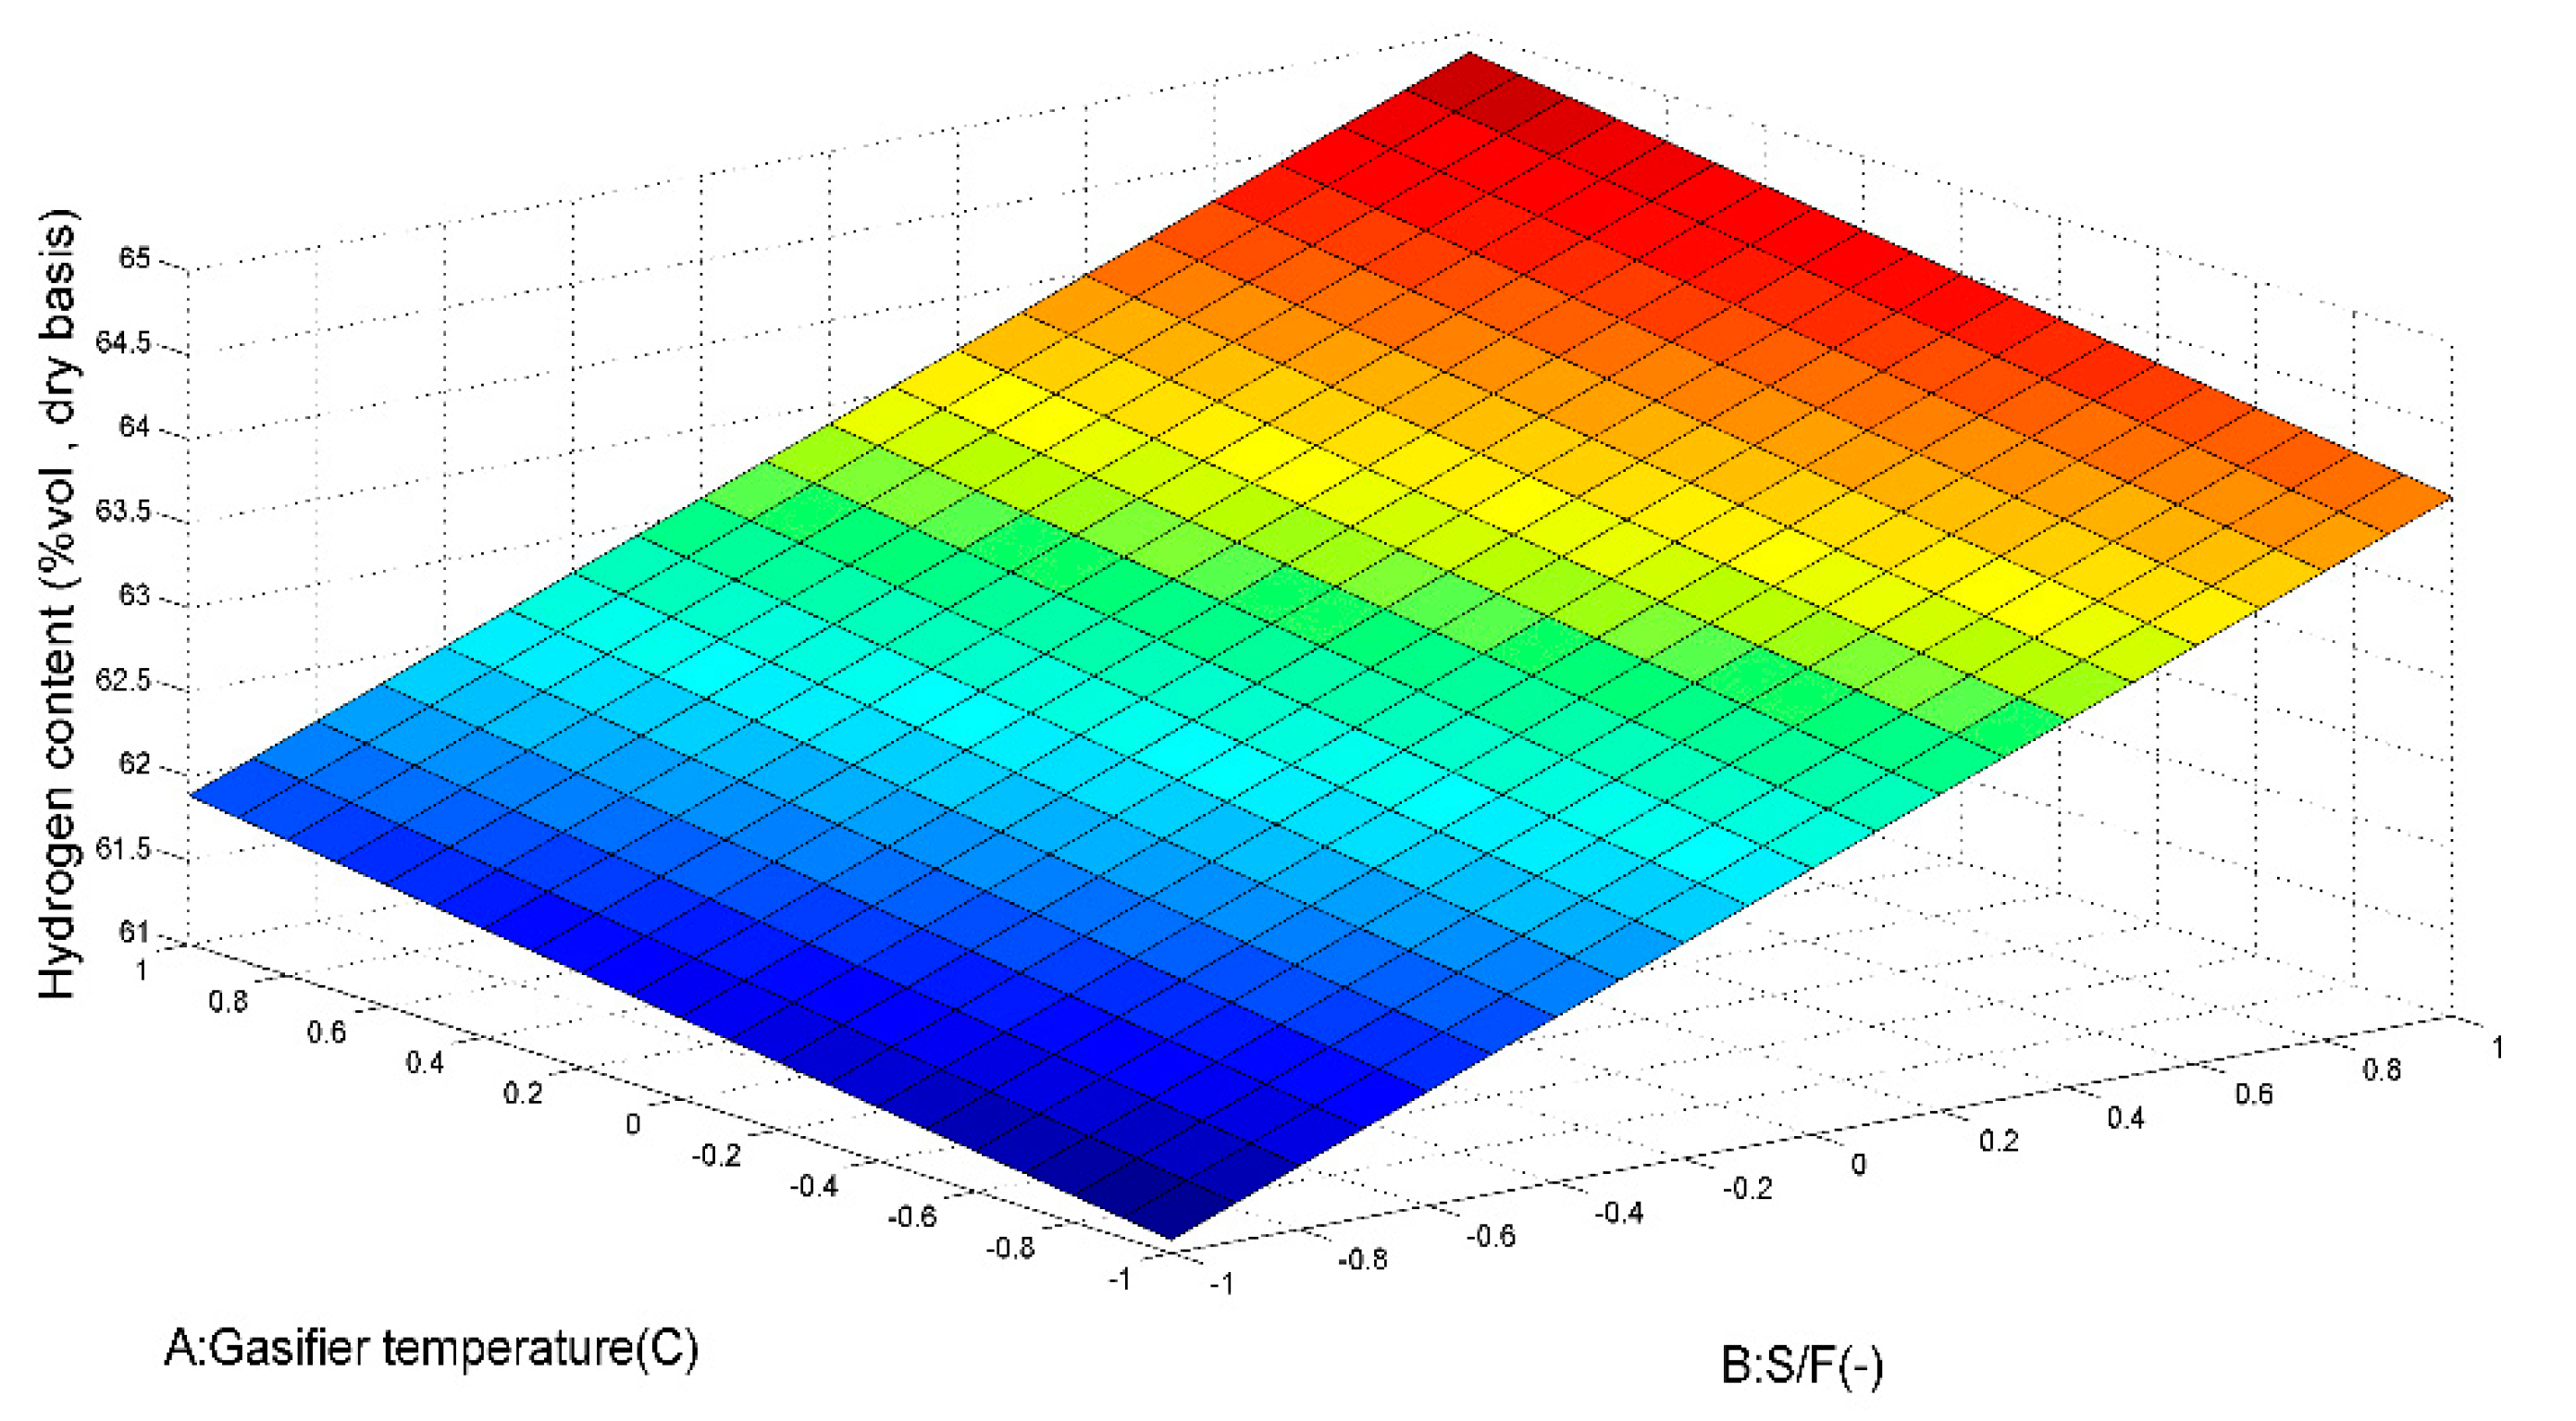
5.2.1. Effect of Process Parameters on the Gasification Process

From the ANOVA as shown in Table 5, it is found that the p-value for the (B) S/F mass ratio and (C) C/B mass ratio are significant variables because the p-value is less than 0.05. The response surface shown in Figure 8 reveals that increasing the S/F mass ratio from 1 to 2 has a positive effect on the %vol. of H2. This is because the steam in the feed can shift the chemical equilibrium of the water gas (Equation (4)) and water gas shift (Equation (5)) reactions. In addition, the result shows that increasing the C/B mass ratio can increase the H2 composition since the biomass has a fixed carbon content less than coal. Therefore, a high biomass content can reduce CO production [31,32].

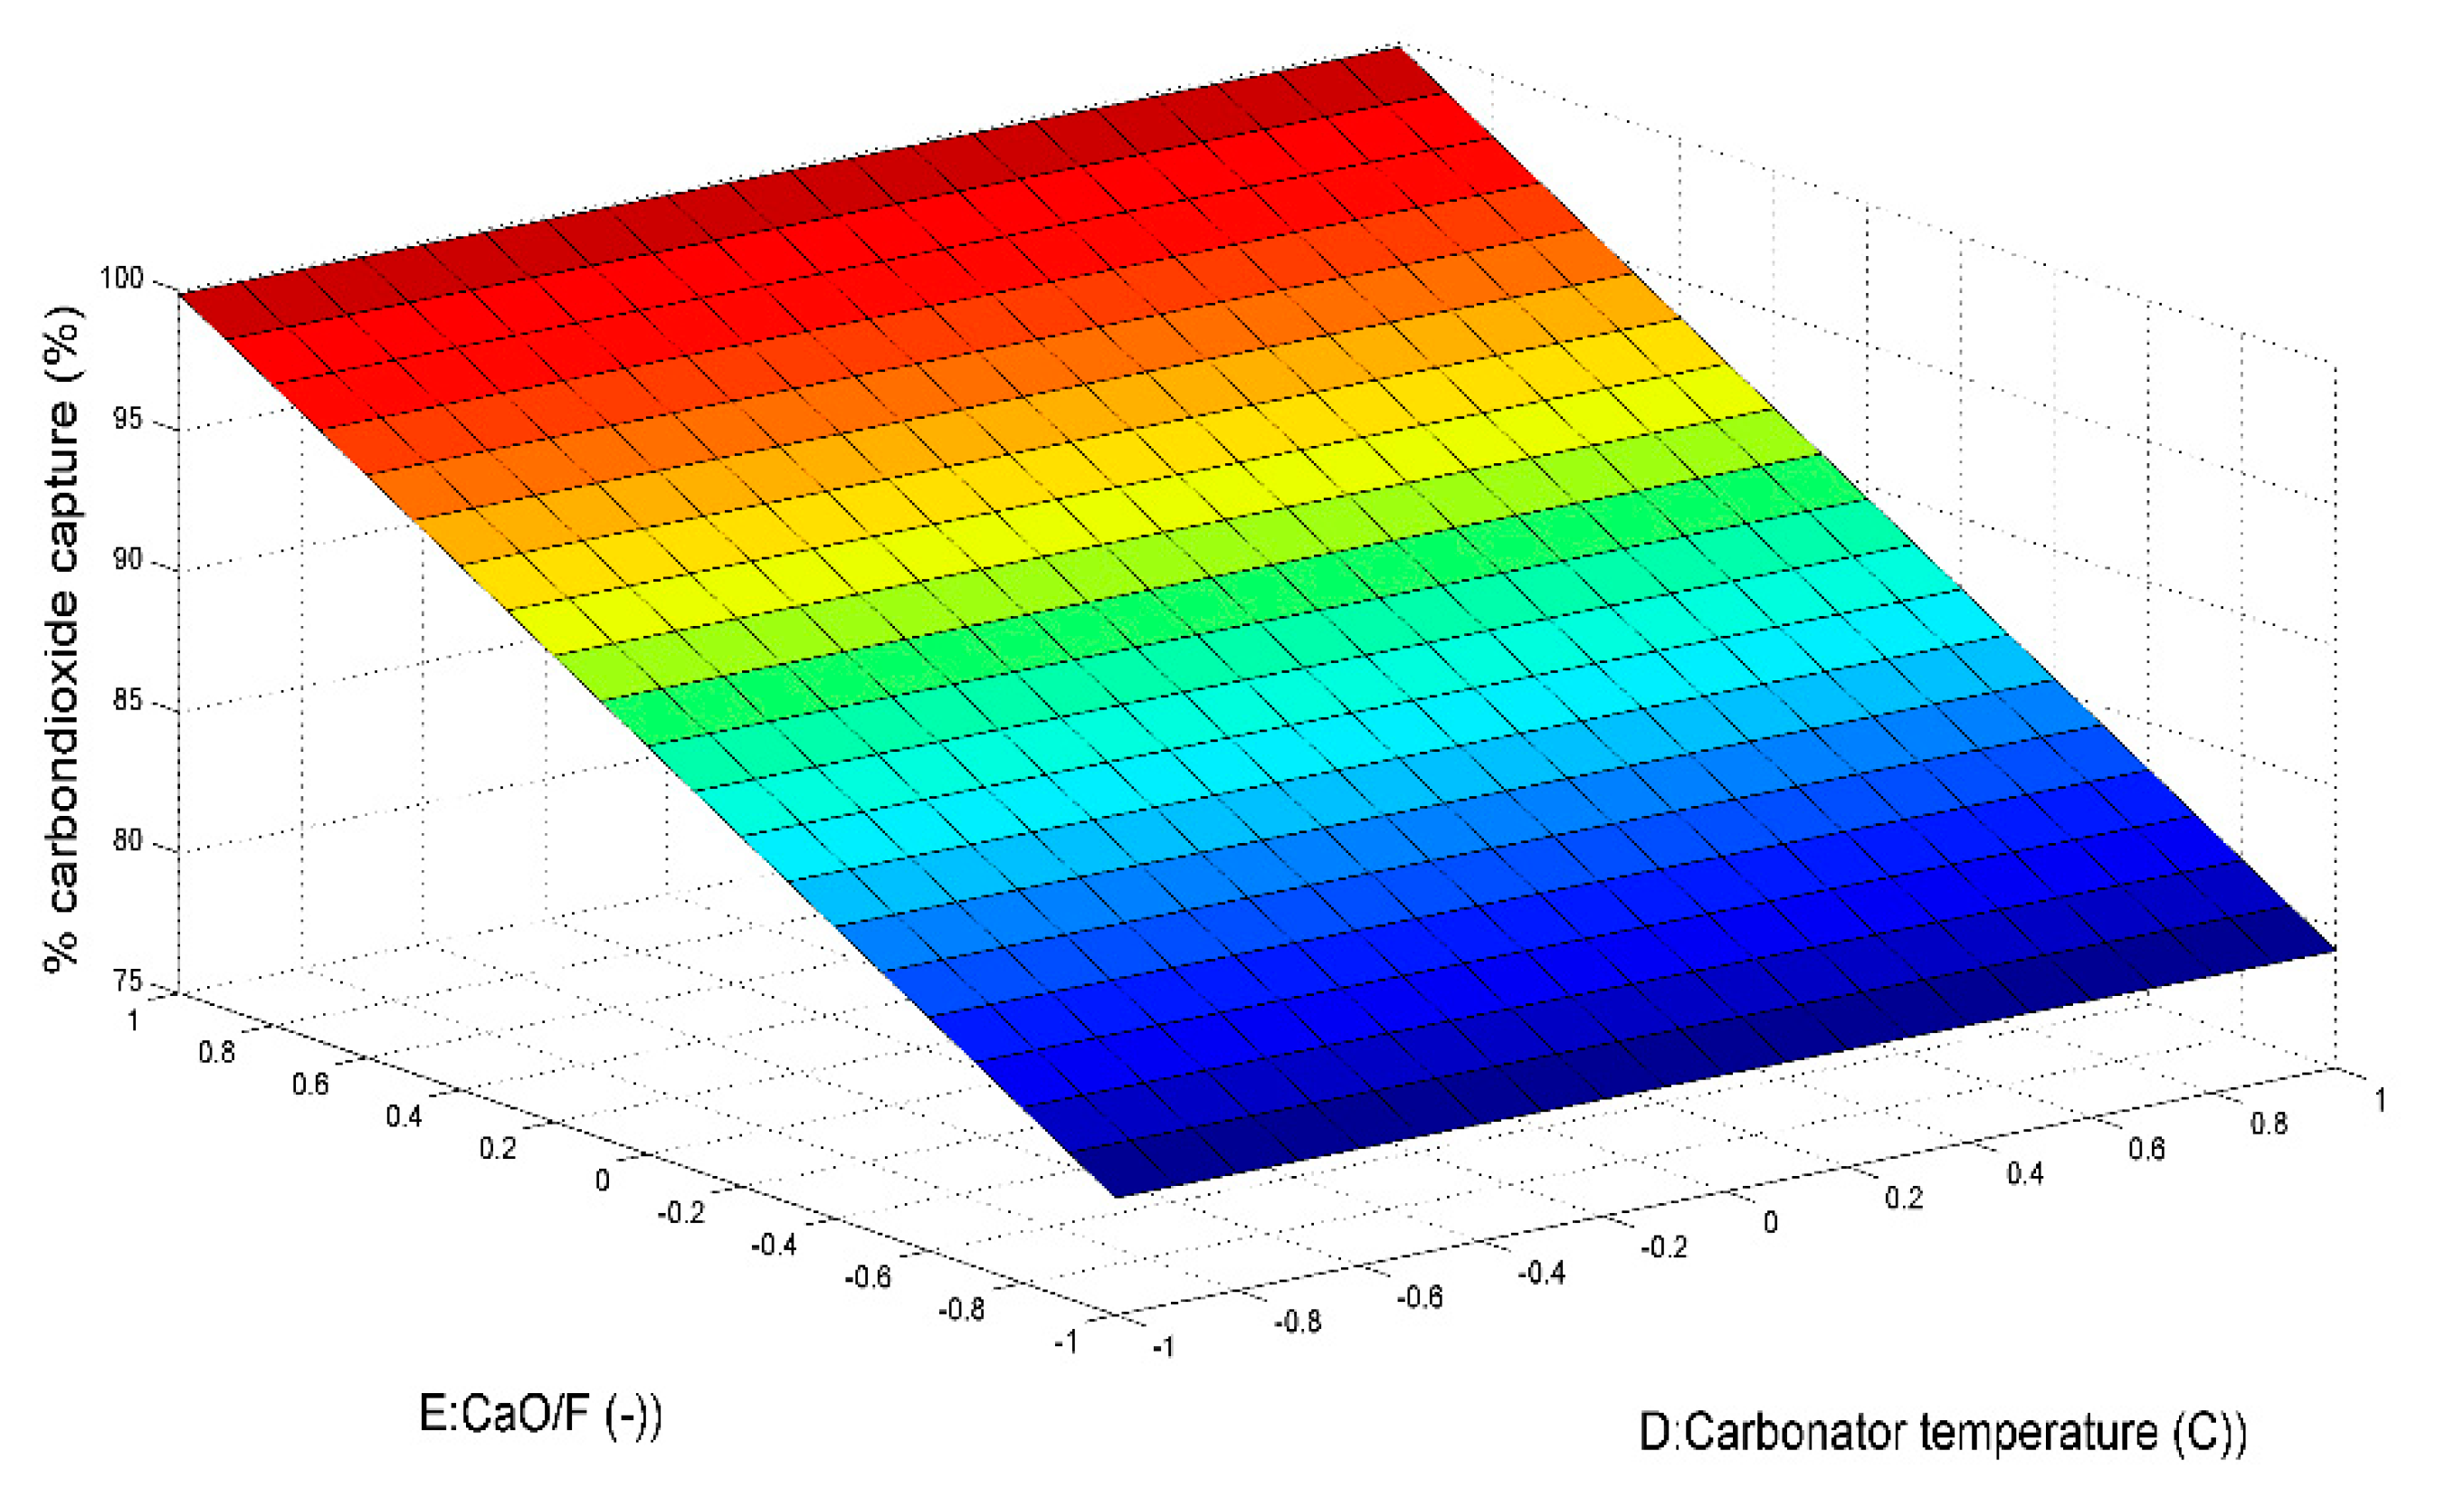
5.2.2. Effect of Process Parameters on the CO2 Capture Process

In Table 7, which presents the results from the ANOVA method, it is found that only the CaO/F mass ratio influences the %CO2 capture. The effect of the CaO/F mass ratio on the %CO2 capture, as illustrated in Figure 9, indicates that increasing the CaO/F mass ratio from 1 to 3 can significantly improve the %CO2 capture from ~78% to ~100%.

5.3. The Energy Efficiency of Co-Gasification of Biomass and Coal Integrated with Calcium Looping Carbon Dioxide Capture Process

From the study on the co-gasification of biomass and coal integrated with the calcium looping carbon dioxide capture process in Section 5.1 and Section 5.2, it is found that the optimal operating temperature of the gasifier is at 700 °C with an S/F mass ratio of 2 and C/B ratio of 0.75:0.25 while the carbon dioxide capture process should be operated at a carbonator temperature of 450 °C and a regenerator temperature of 950 °C with a CaO/F mass ratio of 3. Under these operating conditions, a CO2 capture of 99.99%, a maximum H2 of 99.59%vol., and a hydrogen yield of 92.38 g hydrogen/kg biomass feeding can occur. Further, an energy analysis is performed, and the heat duty of each unit in the integrated process is shown in Table 8. The simulation result reveals that the energy efficiency of H2 production through the co-gasification process is 42%.

5.4. The Environmental Impact Assessment

In this section, the environmental impact in terms of the CO2 equivalent emission and specific carbon dioxide emission are investigated. It should be noted that the carbon emission produced by supplying the necessary heat to the process was not taken into account in this work. Four cases of the chemical looping process operating at different conditions of carbonator temperature and CaO/F mass ratio are considered. The environmental impact assessment is performed to identify the optimal operating conditions that provide the least amount of CO2 emission. It is noted that all cases are operated at the gasifier temperature of 700 °C, S/F mass ratio of 2, C/B mass ratio of 0.75:0.25, and regenerator temperature of 950 °C. Differences in the carbonator temperature and CaO/F mass ratio influence not only the CO2 emissions but also H2 production, CO2 capture efficiency, and energy efficiency. Table 9 shows the results of the performance analysis and environmental assessment at different carbonator temperatures and CaO/F mass ratios. The results show that the mass flow rate of CO2 equivalent emissions from the co-gasification of biomass and coal integrated with the calcium looping carbon dioxide capture process is around 1788–1808 kg/h and that the specific emission of released CO2 to the atmosphere is 79.77–80.77 g CO2/MJ. However, it should be noted that this process utilizes a high coal-to-biomass ratio and thus, the CO2 emission will likely increase compared to conventional biomass-based processes. Although the chemical looping process is operated at different CaO/F mass ratios and carbonation temperatures, the mass flow rate of CO2 equivalent emissions and specific emission of released CO2 to the atmosphere are not different. From the environmental point of view, the operation of a chemical looping process at a CaO/F mass ratio of 1 and carbonation temperature of 450 °C is the most suitable in terms of the high amount of hydrogen and high energy efficiency with a low amount of CO2 emission.

6. Conclusions

This work proposed the co-gasification of biomass and coal integrated with the calcium looping carbon dioxide capture process to produce purified H2. The performance of the hydrogen production process is studied through the Aspen Plus process simulator. Further, the statistical method is used to determine the optimal operating conditions of the co-gasification and the calcium looping carbon dioxide capture process and the effects of the gasifier temperature, S/F mass ratio, C/B mass ratio, CaO/F mass ratio, carbonator temperature, and regenerator temperature on H2 production are investigated.
The sensitivity analysis found that the H2 concentration is improved when the gasifier temperature, S/F mass ratio, CaO/F mass ratio, and regenerator temperature increase. However, the results obtained from the sensitivity analysis cannot indicate the optimal operating condition of this process. Therefore, optimization is further performed through the DOE method. The ANOVA results revealed that the maximum H2 content of 99.59%vol. can be obtained when co-gasification is operated at a gasifier temperature of 700 °C with an S/F mass ratio of 2 and a C/B mass ratio of 0.75:0.25, while the CO2 capture process should be operated at a carbonator temperature of 450 °C and a regenerator temperature of 950 °C with a CaO/F mass ratio of 3. The results of the sensitivity analysis and optimization revealed that a yield of 92.38 g hydrogen/kg biomass feeding of hydrogen gas and CO2 capture efficiency of 99.99% were obtained. The energy analysis indicated that the energy efficiency of the co-gasification process is 42.86% and the specific emission of released CO2 is 80.77 g CO2/MJ.

Author Contributions

Conceptualization, Y.P.; methodology, R.S. and Y.P.; software, R.S.; validation, R.S.; formal analysis, R.S.; investigation, D.S. and A.A.; resources, R.S. and Y.P.; data curation, R.S.; writing—original draft preparation, R.S.; writing—review and editing, D.S., A.A. and Y.P.; visualization, D.S. and A.A.; supervision, Y.P.; project administration, Y.P.; funding acquisition, Y.P. All authors have read and agreed to the published version of the manuscript.

Funding

This research was funded by supporting from King Mongkut’s Institute of Technology Ladkrabang and the National Research Council of Thailand (NRCT) under grant no. NRCT5-RSA63024-02.

Data Availability Statement

Not applicable.

Acknowledgments

The authors gratefully acknowledge King Mongkut’s Institute of Technology Ladkrabang who supported the APC.

Conflicts of Interest

The authors declare no conflict of interest.

References

  1. Singh, S.B.; De, M. Thermally exfoliated graphene oxide for hydrogen storage. Mater. Chem. Phys. 2020, 239, 122102. [Google Scholar] [CrossRef]
  2. Bérubé, V.; Radtke, G.; Dresselhaus, M.; Chen, G. Size effects on the hydrogen storage properties of nanostructured metal hydrides: A review. Int. J. Energy Res. 2007, 31, 637–663. [Google Scholar] [CrossRef]
  3. Felseghi, R.-A.; Carcadea, E.; Raboaca, M.S.; TRUFIN, C.N.; Filote, C. Hydrogen Fuel Cell Technology for the Sustainable Future of Stationary Applications. Energies 2019, 12, 4593. [Google Scholar] [CrossRef] [Green Version]
  4. Prestipino, M.; Piccolo, A.; Polito, M.F.; Galvagno, A. Combined Bio-Hydrogen, Heat, and Power Production Based on Residual Biomass Gasification: Energy, Exergy, and Renewability Assessment of an Alternative Process Configuration. Energies 2022, 15, 5524. [Google Scholar] [CrossRef]
  5. Ulejczyk, B.; Józwik, P.; Nogal, Ł.; Młotek, M.; Krawczyk, K. Efficient Conversion of Ethanol to Hydrogen in a Hybrid Plasma-Catalytic Reactor. Energies 2022, 15, 3050. [Google Scholar] [CrossRef]
  6. Matus, E.; Sukhova, O.; Ismagilov, I.; Kerzhentsev, M.; Stonkus, O.; Ismagilov, Z. Hydrogen Production through Autothermal Reforming of Ethanol: Enhancement of Ni Catalyst Performance via Promotion. Energies 2021, 14, 5176. [Google Scholar] [CrossRef]
  7. Lin, K.-W.; Wu, H.-W. Thermodynamic analysis and experimental study of partial oxidation reforming of biodiesel and hydrotreated vegetable oil for hydrogen-rich syngas production. Fuel 2019, 236, 1146–1155. [Google Scholar] [CrossRef]
  8. Rekleitis, G.; Haralambous, K.-J.; Loizidou, M.; Aravossis, K. Utilization of Agricultural and Livestock Waste in Anaerobic Digestion (A.D): Applying the Biorefinery Concept in a Circular Economy. Energies 2020, 13, 4428. [Google Scholar] [CrossRef]
  9. Arteaga-Pérez, L.E.; Casas-Ledón, Y.; Pérez-Bermúdez, R.; Peralta, L.M.; Dewulf, J.; Prins, W. Energy and exergy analysis of a sugar cane bagasse gasifier integrated to a solid oxide fuel cell based on a quasi-equilibrium approach. Chem. Eng. J. 2013, 228, 1121–1132. [Google Scholar] [CrossRef]
  10. Fernandez-Lopez, M.; Pedroche, J.; Valverde, J.L.; Sánchez-Silva, L. Simulation of the gasification of animal wastes in a dual gasifier using Aspen Plus®. Energy Convers. Manag. 2017, 140, 211–217. [Google Scholar] [CrossRef]
  11. Shen, Y.; Li, X.; Yao, Z.; Cui, X.; Wang, C. CO2 gasification of woody biomass: Experimental study from a lab-scale reactor to a small-scale autothermal gasifier. Energy 2019, 170, 497–506. [Google Scholar] [CrossRef]
  12. Gao, N.; Śliz, M.; Quan, C.; Bieniek, A.; Magdziarz, A. Biomass CO2 gasification with CaO looping for syngas production in a fixed-bed reactor. Renew. Energy 2021, 167, 652–661. [Google Scholar] [CrossRef]
  13. Mongkolsiri, P.; Jitkeaw, S.; Patcharavorachot, Y.; Arpornwichanop, A.; Authayanun, S. Comparative analysis of biomass and coal based co-gasification processes with and without CO2 capture for HT-PEMFCs. Int. J. Hydrog. Energy 2019, 44, 2216–2229. [Google Scholar] [CrossRef]
  14. Hu, J.; Shao, J.; Yang, H.; Lin, G.; Chen, Y.; Wang, X.; Zhang, W.; Chen, H. Co-gasification of coal and biomass: Synergy, characterization and reactivity of the residual char. Bioresour. Technol. 2017, 244, 1–7. [Google Scholar] [CrossRef]
  15. Xiao, Y.; Xu, S.; Liu, Y.; Qiao, C. Catalytic steam co-gasification of biomass and coal in a dual loop gasification system with olivine catalysts. J. Energy Inst. 2020, 93, 1074–1082. [Google Scholar] [CrossRef]
  16. Shahabuddin, M.; Bhattacharya, S. Co-Gasification Characteristics of Coal and Biomass Using CO2 Reactant under Thermodynamic Equilibrium Modelling. Energies 2021, 14, 7384. [Google Scholar] [CrossRef]
  17. Howaniec, N.; Smolinski, A.; Stańczyk, K.; Pichlak, M. Steam co-gasification of coal and biomass derived chars with synergy effect as an innovative way of hydrogen-rich gas production. Int. J. Hydrog. Energy 2011, 36, 14455–14463. [Google Scholar] [CrossRef]
  18. Seçer, A.; Fakı, E.; Üzden, S.T.; Hasanoğlu, A. Hydrothermal co-gasification of sorghum biomass and çan lignite in mild conditions: An optimization study for high yield hydrogen production. Int. J. Hydrog. Energy 2020, 45, 2668–2680. [Google Scholar] [CrossRef]
  19. Shaikh, A.R.; Wang, Q.; Han, L.; Feng, Y.; Sharif, Z.; Li, Z.; Cen, J.; Kumar, S. Techno-Economic Analysis of Hydrogen and Electricity Production by Biomass Calcium Looping Gasification. Sustainability 2022, 14, 2189. [Google Scholar] [CrossRef]
  20. Teixeira, P.; Bacariza, C.; Correia, P.; Pinheiro, C.I.C.; Cabrita, I. Hydrogen Production with In Situ CO2 Capture at High and Medium Temperatures Using Solid Sorbents. Energies 2022, 15, 4039. [Google Scholar] [CrossRef]
  21. Wang, Y.; Li, Y.; Yang, L.; Fan, X.; Chu, L. Revealing the effects of Ni on sorption-enhanced water-gas shift reaction of CaO for H2 production by density functional theory. Process Saf. Environ. Prot. 2022, 157, 254–265. [Google Scholar] [CrossRef]
  22. Stadler, T.J.; Barbig, P.; Kiehl, J.; Schulz, R.; Klövekorn, T.; Pfeifer, P. Sorption-Enhanced Water-Gas Shift Reaction for Synthesis Gas Production from Pure CO: Investigation of Sorption Parameters and Reactor Configurations. Energies 2021, 14, 355. [Google Scholar] [CrossRef]
  23. Hu, Y.; Cheng, Z.; Zhou, Z. High-purity H2 production by sorption-enhanced water gas shift on a K2CO3-promoted Cu/MgO–Al2O3 difunctional material. Sustain. Energy Fuels 2021, 5, 3340–3350. [Google Scholar] [CrossRef]
  24. Ojha, B.; Schober, M.; Turad, S.; Jochum, J.; Kohler, H. Gasification of Biomass: The Very Sensitive Monitoring of Tar in Syngas by the Determination of the Oxygen Demand—A Proof of Concept. Processes 2022, 10, 1270. [Google Scholar] [CrossRef]
  25. Montgomery, D.C. Design and Analysis of Experiments, 5th ed.; John Wiley & Sons Ltd.: New York, NY, USA, 2001. [Google Scholar]
  26. Bet Sarkis, R.; Zare, V. Proposal and analysis of two novel integrated configurations for hybrid solar-biomass power generation systems: Thermodynamic and economic evaluation. Energy Convers. Manag. 2018, 160, 411–425. [Google Scholar] [CrossRef]
  27. Loha, C.; Chatterjee, P.; Chattopadhyay, H. Performance of fluidized bed steam gasification of biomass–Modeling and experiment. Energy Convers. Manag. 2011, 52, 1583–1588. [Google Scholar] [CrossRef]
  28. Minutillo, M.; Alessandra, P.; Elio, J.; Viviana, C.; Suk, W.N.; Sung, P.Y. Coupling of Biomass Gasification and SOFC–Gas Turbine Hybrid System for Small Scale Cogeneration Applications. Energy Procedia 2017, 105, 730–737. [Google Scholar] [CrossRef]
  29. Mota, R.; Krishnamoorthy, G.; Dada, O.; Benson, S.A. Hydrogen Rich Syngas Production from Oxy-Steam Gasification of a Lignite Coal–A Design and Optimization Study. Appl. Therm. Eng. 2015, 90, 13–22. [Google Scholar] [CrossRef] [Green Version]
  30. Atsonios, K.; Zeneli, M.; Nikolopoulos, A.; Nikolopoulos, N.; Grammelis, P.; Kakaras, E. Calcium looping process simulation based on an advanced thermodynamic model combined with CFD analysis. Fuel 2015, 153, 370–381. [Google Scholar] [CrossRef]
  31. Krerkkaiwan, S.; Fushimi, C.; Tsutsumi, A.; Kuchonthara, P. Synergetic effect during copyrolysis/gasification of biomass and sub-bituminous coal. Fuel Process. Technol. 2013, 115, 11–18. [Google Scholar] [CrossRef]
  32. Ongkabin, T. Syngas from Coal and Biomass Gasification Integrated with Combustion in Circulating Fluidized Bed. Master’s Thesis, Chulalongkorn University, Krung Thep Maha Nakhon, Thailand, 2017. Available online: http://cuir.car.chula.ac.th/bitstream/123456789/38326/1/Tassanai_on.pdf (accessed on 10 April 2022).
Figure 1. The schematic process flow diagram of the co-gasification of biomass and coal integrated with the calcium looping carbon dioxide capture process.
Energies 16 02728 g001
Figure 2. Comparison of the syngas composition obtained from the model prediction and experimental data of Loha et al. [27], Mota et al. [28], and Minutillo et al. [29].
Energies 16 02728 g002
Figure 3. Effect of gasification temperature on the gas product composition exited from the gasifier at an S/F mass ratio = 1, CaO/F mass ratio = 1, carbonator temperature = 450 °C, and regenerator temperature = 950 °C.
Energies 16 02728 g003
Figure 4. Effect of the S/F mass ratio on the gas product composition exited from a gasifier at a gasifier temperature = 700 °C, CaO/F mass ratio = 1, carbonator temperature = 450 °C, and regenerator temperature = 950 °C.
Energies 16 02728 g004
Figure 5. Effect of the CaO/F mass ratio on the gas product composition exited from a carbonator at a gasifier temperature = 700 °C, S/F mass ratio = 1, carbonator temperature = 450 °C, and regenerator temperature = 950 °C.
Energies 16 02728 g005
Figure 6. Effect of carbonator temperature on the gas product composition exited from a carbonator at a gasifier temperature = 700 °C, S/F mass ratio = 1, CaO/F mass ratio = 2, and regenerator temperature = 950 °C.
Energies 16 02728 g006
Figure 7. Effect of regenerator temperature on the CO2 mole flow rate released from CaCO3 at a gasifier temperature = 700 °C, S/F mass ratio = 1, CaO/F mass ratio = 2, and carbonator temperature = 600 °C.
Energies 16 02728 g007
Figure 8. Response surface plot of H2 content (%vol., dry basis) in the co-gasification process as a function of the gasifier temperature and S/F mass ratio.
Energies 16 02728 g008
Figure 9. Response surface plot of %CO2 capture in the calcium looping process as a function of the CaO/F mass ratio and carbonator temperature.
Energies 16 02728 g009
Table 1. Proximate analysis, ultimate analysis (wet basis), lower heating values, and CO2 emission factors of pellet pine wood, lignite coal, and rice husk.
Fuel Type
Pellet Pine WoodLignite CoalRice Husk
Proximate analysis (wt.%, wet basis)
 Fixed Carbon14.8533.6014.99
 Volatile matter74.9428.8255.54
 Moisture10.0031.209.95
 Ash0.186.3819.52
Ultimate analysis (wt.%, dry basis)
 C50.5047.8339.44
 H5.906.673.22
 N0.300.520.08
 O43.0037.9537.74
 S0.200.650.01
LHV (kJ/g)17.3019.2913.52
CO2-emission factors (kg/MJ)00.09460
Table 2. Input parameters of each stream and unit operation used in the simulation [13,14].
ParametersValue
Atmospheric condition (atm)1
Biomass flow rate (kg/h)1000
Coal flow rate (kg/h)1000
Coal: Biomass1:1
Steam flow rate (kg/h)2000
Steam temperature (°C)800
Calcium oxide (kg/h)2000
Gasifier temperature (°C)700
Carbonator temperature (°C)450
Regenerator temperature (°C)900
Table 3. Comparison of the CO2 mole fraction exited from the carbonator reactor and CO2 capture efficiency from the model prediction and experimental data of Atsonios et al. [30].
This StudyAtsonios et al. [30]
Parameters
Wet gas composition (mole fraction) CO2, out0.004560.018
CO2 capture efficiency88.0685.57
Table 4. The response results from the 23 factorial experimental design analysis of the co-gasification of biomass and coal with Aspen Plus simulator version 10.
RunGasification Temperature (°C)S/F
Mass Ratio
C/B
Mass Ratio
H2 Content
(%vol., Dry Basis)
170010.5:0.561.12
270010.75:0.2561.96
370020.5:0.564.09
475010.75:0.2561.81
575020.75:0.2564.68
675010.5:0.561.04
770020.75:0.2565.09
875020.5:0.564.09
Code variable: −1 (Low) Gasifier temperature = 700 °C, S/F mass ratio = 1, and C/B mass ratio = 0.5:0.5. +1 (High) Gasifier temperature = 750 °C, S/F mass ratio = 2, and C/B mass ratio = 0.75:0.25.
Table 5. Analysis of variance (ANOVA) for the regression model of H2 content (%vol., dry basis).
SourceSum of SquaresdfMean SquareF-Valuep-Value
Model19.3429.67494.63<0.0001significant
B-S/F18.05118.05923.32<0.0001
C-C/B1.2911.2965.950.0005
Residual0.097850.0196
Cor Total19.447
Std. Dev.0.1398 0.995
Mean62.98 Adjusted R²0.993
C.V. %0.222 Predicted R²0.987
Adeq Precision44.464
Table 6. The response results from the 22 factorial experimental design analysis of the carbon dioxide capture process with Aspen Plus V10.
RunCarbonator Temperature (°C)CaO/F
Mass Ratio
CO2 Capture
(%)
H2 Content
(%vol., Dry Basis)
1550179.8798.47
2450399.9999.59
3550399.6599.53
4450178.4299.01
Code variable: −1 (Low) Carbonator temperature = 450 °C, CaO/F mass ratio = 1. +1 (High) Carbonator temperature = 550 °C, CaO/F mass ratio = 3.
Table 7. ANOVA for the regression model of % CO2 capture in the calcium looping process.
SourceSum of SquaresdfMean SquareF-Valuep-Value
Model427.221427.22769.020.0013significant
E-CaO/F427.221427.22769.020.0013
Residual1.1120.555
Cor Total3151.423
Std. Dev.0.745 0.997
Mean89.49 Adjusted R²0.996
C.V. %0.832 Predicted R²0.9896
Adeq Precision39.217
Table 8. The heat duty of each unit in the co-gasification of biomass and coal integrated with the calcium looping carbon dioxide capture process.
Heat Duty of Each Unit (kW)Values
Gasifier unit3332.32
Regenerator unit3207.00
Carbonator unit−3023.59
Table 9. Results of the performance analysis and environmental assessment with different conditions of carbonator temperatures and CaO/F mass ratios.
ParametersCase No.
1234
CaO/F mass ratio (−)1133
Carbonator temperature (°C)450550450550
Hydrogen production (kg/h)183.82182.92184.75184.72
Hydrogen content (%vol., dry basis)99.0198.4799.5999.53
% CO2 capture (%)78.4279.8799.9999.65
Energy efficiency of hydrogen production (%)42.6442.4342.8642.85
Total mass flow rate of CO2 equivalent emission (kg/h)1788.151768.591808.621807.86
Specific emission of released CO2 (g CO2/MJ)80.2679.7780.7780.75
Disclaimer/Publisher’s Note: The statements, opinions and data contained in all publications are solely those of the individual author(s) and contributor(s) and not of MDPI and/or the editor(s). MDPI and/or the editor(s) disclaim responsibility for any injury to people or property resulting from any ideas, methods, instructions or products referred to in the content.

