Article

CO2 Adsorption Performance of Activated Coke Prepared from Biomass and Coal

1
Institute of Thermal Science and Technology, Shandong University, Jinan 250061, China
2
Institute for Advanced Technology, Shandong University, Jinan 250061, China
3
Shandong Provincial Oil and Gas Pipeline Protection Service Center, Jinan 250012, China
4
Center for Ecology and Environmental Protection Education and Communications of Shandong Province, Jinan 250100, China
5
Department of Thermal Engineering, Shandong Jianzhu University, Jinan 250101, China
*
Authors to whom correspondence should be addressed.
Energies 2023, 16(9), 3872; https://doi.org/10.3390/en16093872
Submission received: 9 April 2023 / Revised: 26 April 2023 / Accepted: 27 April 2023 / Published: 3 May 2023
(This article belongs to the Special Issue Biomass and Municipal Solid Waste Thermal Conversion Technologies II)

Abstract

:
CO2 adsorption is one of the promising CCS technologies, and activated coke is a solid adsorbent with excellent adsorption properties. In this study, activated coke was prepared by using bituminous coal and coconut shells activated with KOH or CaCl2 in a physically activated atmosphere and modified with ammonia. The effect of the active agent impregnation ratio on the physicochemical properties of activated coke was investigated by N2 adsorption isotherms, scanning electron microscopy (SEM) and Fourier transform infrared spectrometry (FTIR). The CO2 adsorption performance of activated coke was tested, and the effect of nitrogen-containing functional groups on CO2 adsorption was investigated by experiments and simulations. The results showed that the specific surface area of activated coke reached 629.81 m2/g at a KOH impregnation ratio of 0.5 and 610.66 m2/g at a CaCl2 impregnation ratio of 1. The maximum CO2 adsorption capacity of activated coke reached 71.70 mg/g and 90.99 mg/g for conventional power plant flue gas and oxy–fuel combustion flue gas, respectively. After ammonia modification, the CO2 adsorption capacity of activated coke was further increased. Simulations showed that pyrrole and pyrrole functional groups changed the polarity of graphene and established weak interactions with CO2.

1. Introduction

Carbon dioxide is a greenhouse gas with high global warming potential, accounting for 77% of all greenhouse gases [1,2]. Since the era of industrialization, fossil fuels utilization in power generation has been the largest point source of CO2 emissions. Its emissions account for roughly 40% of total CO2 emissions, currently [3]. Considering the dominance of fossil fuels in energy consumption and the potential for application of existing technologies for alternative and renewable energy sources [4], current viable solutions include: improving the efficiency of power stations, utilizing low-carbon-intensity fuels, carbon capture and storage (CCS) [5].
CCS mainly involves capturing CO2 from the combustion flue gas, transporting it through pipelines and using it or storing it in different geological formations (depleted oil and gas reservoirs, unmineable coal beds and saline aquifers) [6,7]. Regarding the capture phase, four methods of capturing CO2 have been developed: pre-combustion, post-combustion, oxy–fuel combustion and chemical looping combustion [8]. However, for power plants using fossil fuels, capturing CO2 in the flue gas after combustion is the most common method, as it is relatively simple to retrofit existing power plants with additional carbon capture devices at the end of the flue. Compared with ammonia scrubbing, which corrodes equipment and has a high regeneration energy [9,10], adsorption is a more promising technology for capturing CO2. In addition, as an emerging CO2 capture technology, the high concentration of CO2 in the oxy–fuel combustion flue gas is more favorable for the adsorption of solid adsorbents [11]. Activated coke has advantages over other adsorbents due to the wide availability of raw materials for its production, as well as its significant mechanical strength and cost effectiveness [12]. Over the years, various techniques have been proposed and applied for the regeneration of activated coke, such as thermal treatment, oxidation, microwave irradiation and electrochemical methods [13]. The main regeneration mechanism is the desorption of adsorbate due to the disruption of the adsorption balance (increased temperature or decreased pressure) or the decomposition of adsorbate due to chemical reactions [14]. The development of regeneration technologies has led to a wider application of the activated coke adsorption process and ensured its economic viability.
The specific surface area, pore structure and surface chemistry of activated coke depend on the raw material and can be controlled by the synthesis conditions (e.g., temperature, active agent, activation time) [15,16,17]. In addition, the targeted modification of the surface chemistry of activated coke can improve the adsorption capacity and gas adsorption selectivity [18,19]. Activated coke prepared from coal and biomass has a rich pore structure and a well-developed specific surface area because of the synergistic effect of the pyrolysis process [20,21,22]. The direct combustion of low-rank bituminous coal is inefficient, while the semi-coke obtained by its pyrolysis has a rich pore structure, which has a good effect in gas adsorption. Coconut shell has the characteristics of high density, low ash content and high mechanical strength, which are conducive to the formation of a microporous structure in the preparation process. Activation is divided into physical activation and chemical activation. The physical activation gases are mainly water vapor and CO2, while the chemically active agents are mainly KOH, H2SO4, HNO3, ZnCl2, CaCl2 and so on [23,24,25]. As the most typical active agent in chemical activation, KOH is widely used because it can produce activated cokes with a large specific surface area and well-developed micropores. CaCl2 can reduce the carbonization and activation temperature and increase the yield of activated coke. The modification of the activated coke surface with ammonia can improve the adsorption capacity of acidic gases [26,27], especially CO2. Nitrogen-containing functional groups significantly affect the interaction of CO2 molecules with activated coke [28]. Density functional theory (DFT) is widely used to study the adsorption properties of activated coke at the atomic scale, such as intermolecular interactions [29,30] and surface electronic properties [31,32] (atomic charge and adsorption energy) On the one hand, most authors have demonstrated the effects of activation temperature and time on activated coke. On the other hand, combined physical and chemical activation and the significance of the active agent quantity were less explored, as was the intrinsic mechanism by which modified activated coke improves CO2 adsorption capacity.
In this study, activated cokes were prepared from a mixture of low-rank bituminous coal and coconut shell using KOH and CaCl2 as chemically active agents, combined with physical activation. The effects of the impregnation ratio of the active agent on the yield, specific surface area and pore structure of activated coke were analyzed. The adsorption performance of the prepared activated coke of carbon dioxide from conventional power plant flue gas and oxy–fuel combustion flue gas was also tested. In addition, activated coke was modified with ammonia and then used for CO2 adsorption experiments. The effect of nitrogen-containing functional groups on CO2 adsorption was explored by simulating the adsorption process using Gaussian software.

2. Materials and Methods

2.1. Chemicals and Materials

The low-rank bituminous coal was Zhundong bituminous coal from Xinjiang, and the coconut shells were from Hainan. They were dried, crushed and sieved into particles in the size range of 100–150 mesh (75–150 μm). KOH, CaCl2 and the ammonia solution (10%) were purchased from Shandong Chengchuan Life Science and Technology Co. (Jinan, China). The proximate and ultimate analysis results of the two raw materials on an air-dried basis are listed in Table 1.

2.2. Preparation of Activated Cokes

In a mixture of 5 g of bituminous coal and coconut shell (4:1 mass ratio), KOH or CaCl2 were added, so that the impregnation ratio (IR = ratio of chemical activator mass to raw material mass) was 0, 0.125, 0.25, 0.5, 1 or 2. Then, the samples were placed in a constant-temperature drying oven (3 h, 105 °C). After drying, the samples were placed in a quartz crucible and pushed into a high-temperature tube furnace for activation. The activation time was 1 h, and the temperature was 700 °C. The activation process took place in a nitrogen–water vapor–CO2 atmosphere (flow rate equal to 1000 mL/min, 20% CO2, 10% water vapor). After the activation, the samples were cooled to ambient temperature and then washed with 0.1 mol/L HCl solution, followed by distilled water until the pH value of the solution was 7. Finally, the samples were put into a constant-temperature drying oven at 105 °C for 12 h. The experimental device for the preparation of activated coke is shown in Figure 1.
The main operation of activated coke modification was as follows: 1 g of activated coke obtained from the activation preparation was mixed with 10 mL of ammonia solution at a concentration of 10% in a 250 mL conical flask. The conical flask was placed in a constant-temperature water bath shaker and shaken at a constant temperature of 60 °C and a vibration rate of 110 r/min for 3 h. Finally, the sample was washed with distilled water to neutral pH and dried in a constant-temperature drying oven at 105 °C for 3 h.

2.3. Characterization

In order to obtain the specific surface area and pore structure of the activated cokes, nitrogen was used as the carrier gas, and the nitrogen adsorption isotherms of the activated cokes were obtained using a BSD-pm high-performance specific surface area analyzer (Beijing Best Company, Beijing, China) at 77 K. The surface area of activated coke was calculated by using the BET equation [33], and the total pore volume was calculated from the amount of N2 adsorbed at a relative pressure of P/P0 = 0.99. The micropore volume was calculated by the t-plot method and the DR equation [34].
The Fourier transform infrared spectroscopy (FTIR) spectra were obtained at 4 cm−1 resolution between 4000 and 400 cm−1 using 32 scans, on a Thermo Scientific Nicolet iN10MX (Waltham, MA, USA).

2.4. Carbon Dioxide Adsorption Experiment

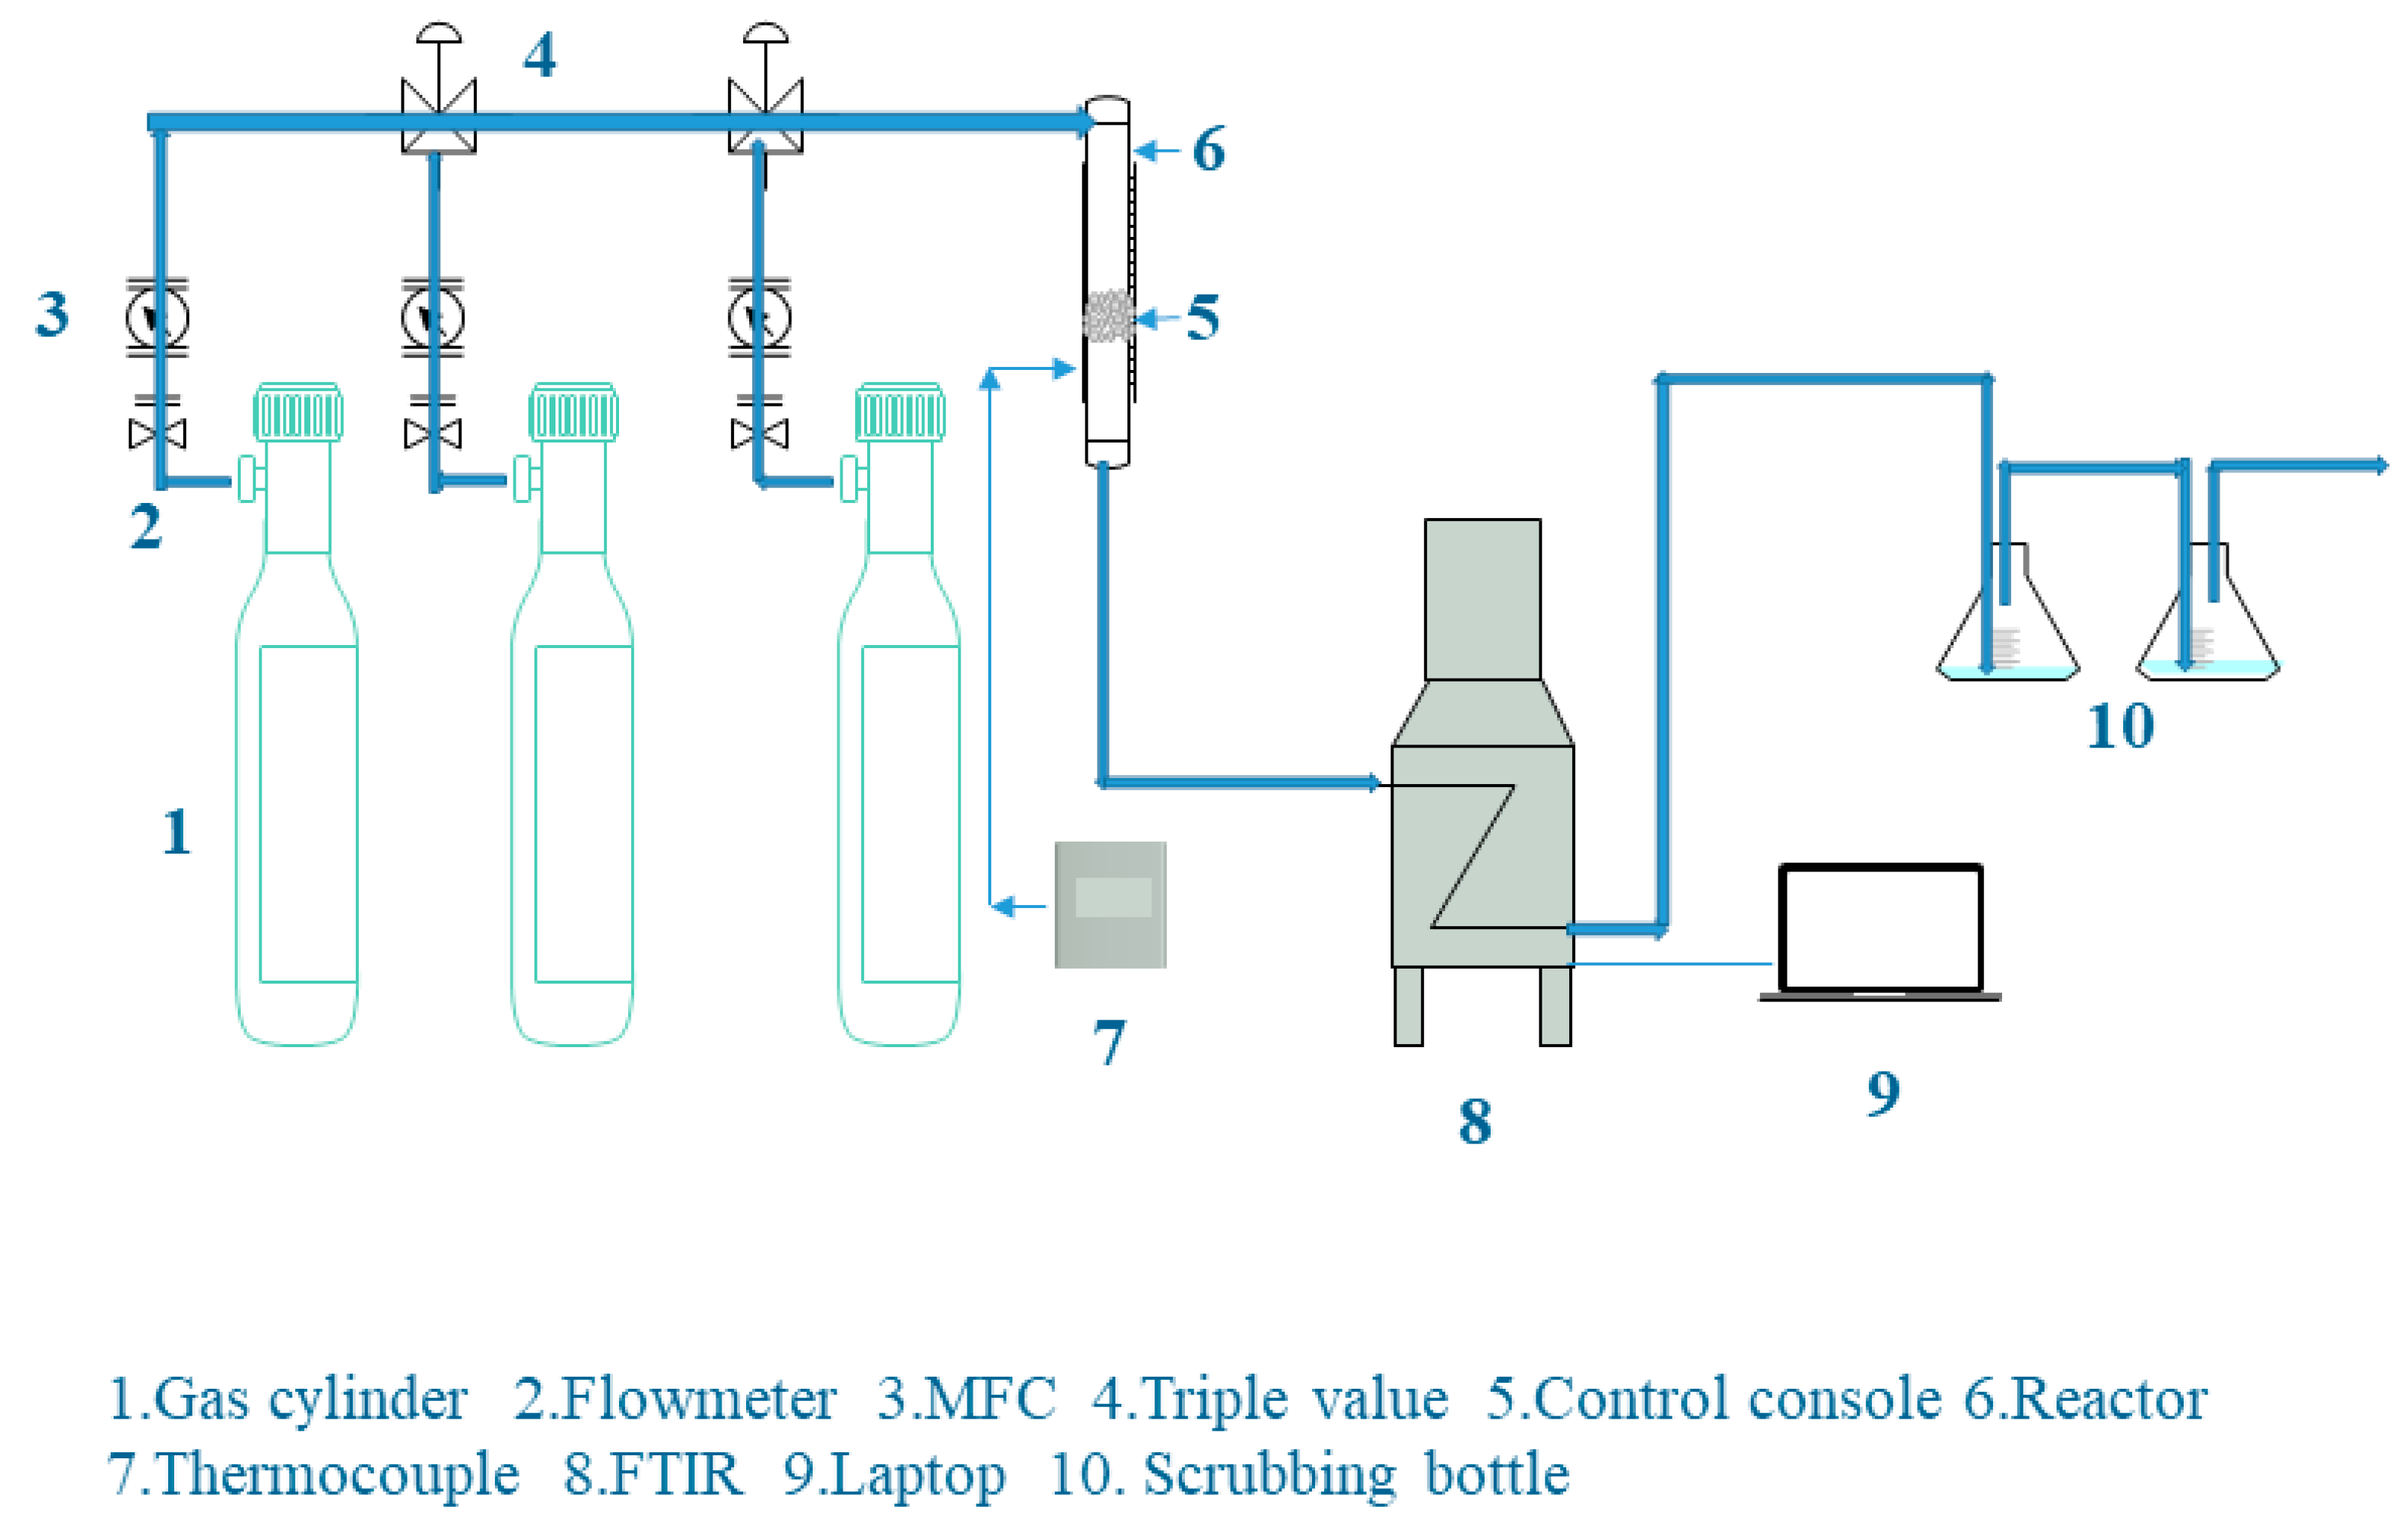
The flue gases for this experiment were traditional power plant flue gas and oxy–fuel combustion flue gas. The traditional power plant flue gas consisted of N2 and CO2 (10%), and the oxy–fuel combustion flue gas consisted of O2 and CO2 (80%). The total flow rate was controlled by a mass flow meter up to 100 mL/min. The mass of activated coke was 0.5 g, and the adsorption temperature was 25 °C. The fixed-bed reaction system was a quartz glass tube with an inner diameter of 18 mm and a length of 580 mm. Firstly, the gas cylinder was switched on, and the flow rate and gas concentration were controlled by different mass flow meters. Then, the system was heated up to the adsorption temperature and maintained at this temperature by heating cables and temperature-control devices. After the gas flow and temperature were kept constant, the activated coke was placed in the quartz glass tube to start the adsorption experiment. Finally, the CO2 gas concentration at the outlet was measured by an MBGAS-3000 Fourier infrared multi-component analyzer. The reaction time (10–30 min) depended on the adsorption situation. The activated coke adsorption experimental device is shown in Figure 2.
The formula for calculating the amount of carbon dioxide adsorption is as follows:
V CO 2 = 0 t ( W in W out ) × Q × 10 3 m AC dt
where V CO 2 represents the accumulated adsorption amount of activated coke, mg/g; W in is the gas concentration at the inlet of the fixed reaction bed, mg/m3; W out is the gas concentration at the outlet of the fixed reaction bed, mg/m3; Q is the total gas flow rate, L/min; m AC is the mass of activated coke, g.

2.5. Model Construction and Calculation Methods

A cluster graphene containing five fused rings was constructed to improve the computational accuracy and efficiency of its adsorption simulation [35]. The graphene model was embedded with pyridine and pyrrole functional groups, as shown in Figure 3a,b.
All DFT calculations were performed using Gaussian software. Geometric optimization and wave function generation were performed using the B3LYP-D3 (BJ) [36] generalized function combined with the 6-311+G** [37] basis set to be used for electrostatic potential (ESP) analysis and improved independent gradient model (IGMH) analysis of weak interactions.
The electrostatic potential (ESP) iso-surface maps were plotted using VMD [38] software based on the files generated by Multiwfn [39] software as a way to investigate possible adsorption sites. In IGMH analysis, the iso-surface of the δginter function is used to visualize the interaction region. The critical point ρ(r) of the weak interaction region is one of the important indicators of the interaction strength, but ρ(r) can only reflect the strength, and the type needs to be reflected by the sign (λ2) function. The sign (λ2) ρ function, obtained by multiplying ρ(r) by sign (λ2), can be projected onto the iso-surface to visualize the location, type and strength of the interaction [40,41]. The common interpretation of sign (λ2) ρ in different value ranges is shown in Figure 4.
The CO2 adsorption energy ( E ads ) is calculated as follows:
E ads = E tot E graphene + E CO 2
where E tot , E graphene and E CO 2 denote the single-point energies of physisorption products, graphene and CO2, respectively.

3. Results and Discussion

3.1. Effect of the Activation Conditions on the Physical Properties of Activated Coke

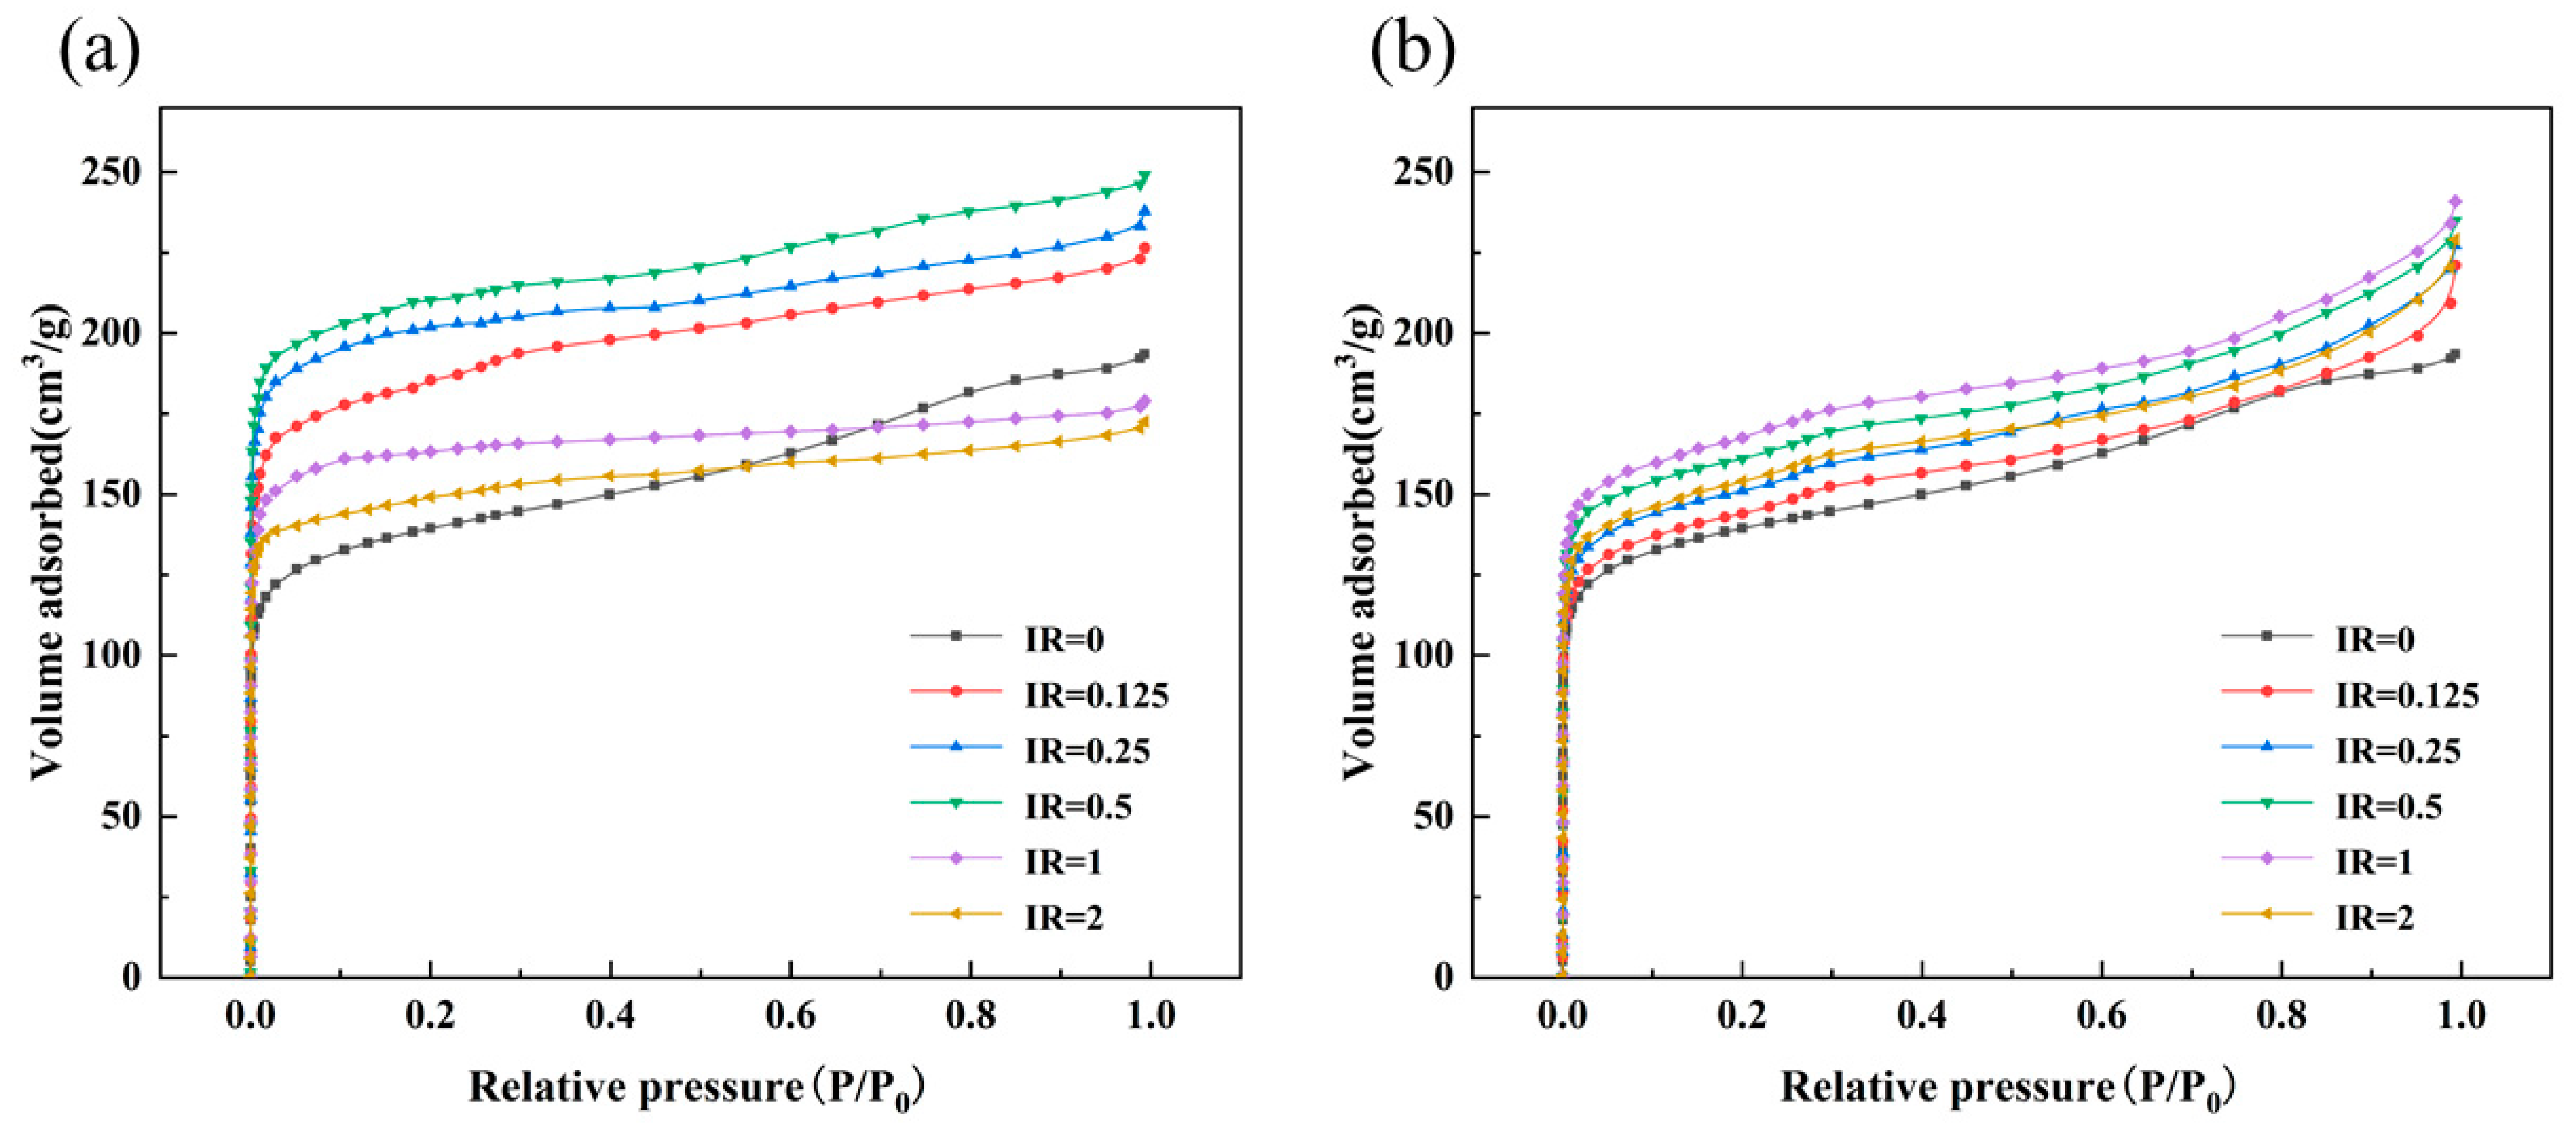
The nitrogen adsorption isotherms of activated cokes are shown by Figure 5. For the activated coke with KOH as the active agent, the adsorption curve of activated coke with the IR of 0.5 was significantly higher than all other adsorption curves, indicating a larger specific surface area. When the relative pressure was less than 0.2, each adsorption curve gradually increased with the increase of the impregnation ratio, which represented the promotion of microporous development by KOH. When IR = 1 and 2, the nitrogen adsorption volume decreased, which indicated that the excess KOH decreased the specific surface area of activated coke.
For activated coke with CaCl2 as the active agent, the activated coke with the IR of 1 had the largest nitrogen adsorption volume. Compared with the activated coke curves with IR = 0, the adsorption curves of each activated coke with the addition of CaCl2 were all increased, which implied that CaCl2 had a promotion effect on the development of the specific surface area and pore structure of activated coke.
The effect of the impregnation ratio of different activators on the physical properties of activated coke can be seen in Table 2. After the addition of KOH, the specific surface area of activated coke first increased and then decreased rapidly with the increase of the impregnation ratio. At the impregnation ratio of 0.5, the maximum specific surface area of activated coke was 629.81 m2/g, which was consistent with the results of the nitrogen adsorption isotherm. The percentage of micropores kept increasing and reached a maximum of 95.04%.
The specific surface area of activated coke first increased and then decreased with the increase of the impregnation ratio. The maximum value of 610.66 m2/g was reached at the impregnation ratio of 1. However, the percentage of micropores did not change too much and never exceeded 70%. This indicated that CaCl2 mainly promoted the formation of mesopores and macropores in activated coke during the activation process, which is consistent with Liu’s [42] study.
The addition of both chemically active agents significantly reduced the yield of activated coke, while having a significant effect on the specific surface of activated coke. During the activation process, the raw material reacted with KOH or CaCl2 to generate a large number of pores while reducing the yield, but the excess chemically active agents caused the original micropores of activated coke to merge into mesopores or macropores, reducing the specific surface area [43,44].

3.2. Evolution of Surface Functional Groups during the Activation of Activated Coke

The activated coke prepared by physical activation was named OAC, and the activated cokes activated by the optimal impregnation ratio of KOH and CaCl2 were named KAC and CAC, respectively. In order to observe the evolution of functional groups before and after activation, the infrared spectra of the raw materials and the three active cokes were analyzed separately, as shown in Figure 6a,b.
As can be seen in Figure 6a, there was a broad and strong peak at 3396 cm−1, which corresponded to the O-H bond stretching vibration of the hydroxyl group. It implied the presence of a large number of hydroxyl functional groups in the raw materials. The peak at 2926 cm−1 was mainly caused by the C-H stretching vibration of aliphatic groups. Two absorption peaks existed at 1262 and 1034 cm−1, which were mainly caused by the C-O single bond and the C-O-C ether-bond stretching vibration, indicating the presence of hydrocarbon groups and unsaturated ethers in the raw materials. The absorption peaks between 1000 and 625 cm−1 were mainly caused by C-H out-of-plane bending vibrations in olefins and aromatics. In summary, a variety of functional groups and bond structures existed on the surface of the raw materials, such as hydroxyl and carbonyl functional groups, aliphatic chains and aromatic structures.
As can be seen in Figure 6b, the infrared spectrums of the activated cokes changed significantly. The peaks at 3700–3200 cm−1 were significantly weakened, mainly due to the release of hydroxyl and hydrocarbon single bonds as volatile fractions during the activation process. Only a very small adsorption peak appeared at 2938 cm−1, compared with the strong absorption peak appearing at 2926 cm−1 in the spectrum of the raw materials; it can be assumed that the C-H stretching vibration was weakened after activation. The changes in the absorption peaks at these locations represented a decrease in the C content and the number of oxygen-containing functional groups in the activated coke after activation. The peaks at 900–625 cm−1 were mainly caused by the bending vibration outside the C-H plane, which indicated the presence of olefins and aromatics in the activated cokes. However, the peaks after activation were much lower, which implied that the olefins and aromatics were cleaved during the activation process. In conclusion, the IR spectra of the activated cokes prepared by different activation methods had similar absorption peaks with different intensity, corresponding to the O-H, C=O, C-O and C-H bonds. This implied that there were abundant functional groups on the surface of the prepared activated cokes.

3.3. Evolution of the Surface Morphology during the Activation of Coke

The surface morphology of raw materials, OAC, KAC and CAC was observed by SEM to compare changes before and after activation, as shown in Figure 7a–d, respectively.
In Figure 7a, it can be seen that before activation, the surface of the raw material was smooth and flat without pores. As shown in Figure 7b, compared to the raw material, the surface of CAC was broken into small pieces and particles and presented cracks, which could be composed of micropores and mesopores. The surface of KAC was uneven and ablated significantly. The presence of pore structures could be observed, and the pore structure was mostly round. As can be seen in Figure 7d, the surface of CAC showed obvious traces of melt etching, and its surface had irregular porous structures with a certain number of large holes, and the presence of micropores and mesopores could be observed. During the activation process, water vapor and CO2 created a certain number of pore structures on the surface of the raw material or expanded the original pore structures. KOH and CaCl2 reacted violently with C atoms in the raw material, the surface of the prepared activated coke was rough, and the pore structure was well developed.

3.4. Effect of the Activation Conditions of Activated Coke on CO2 Adsorption

3.4.1. Adsorption of CO2 in the Flue Gas of Conventional Power Plants

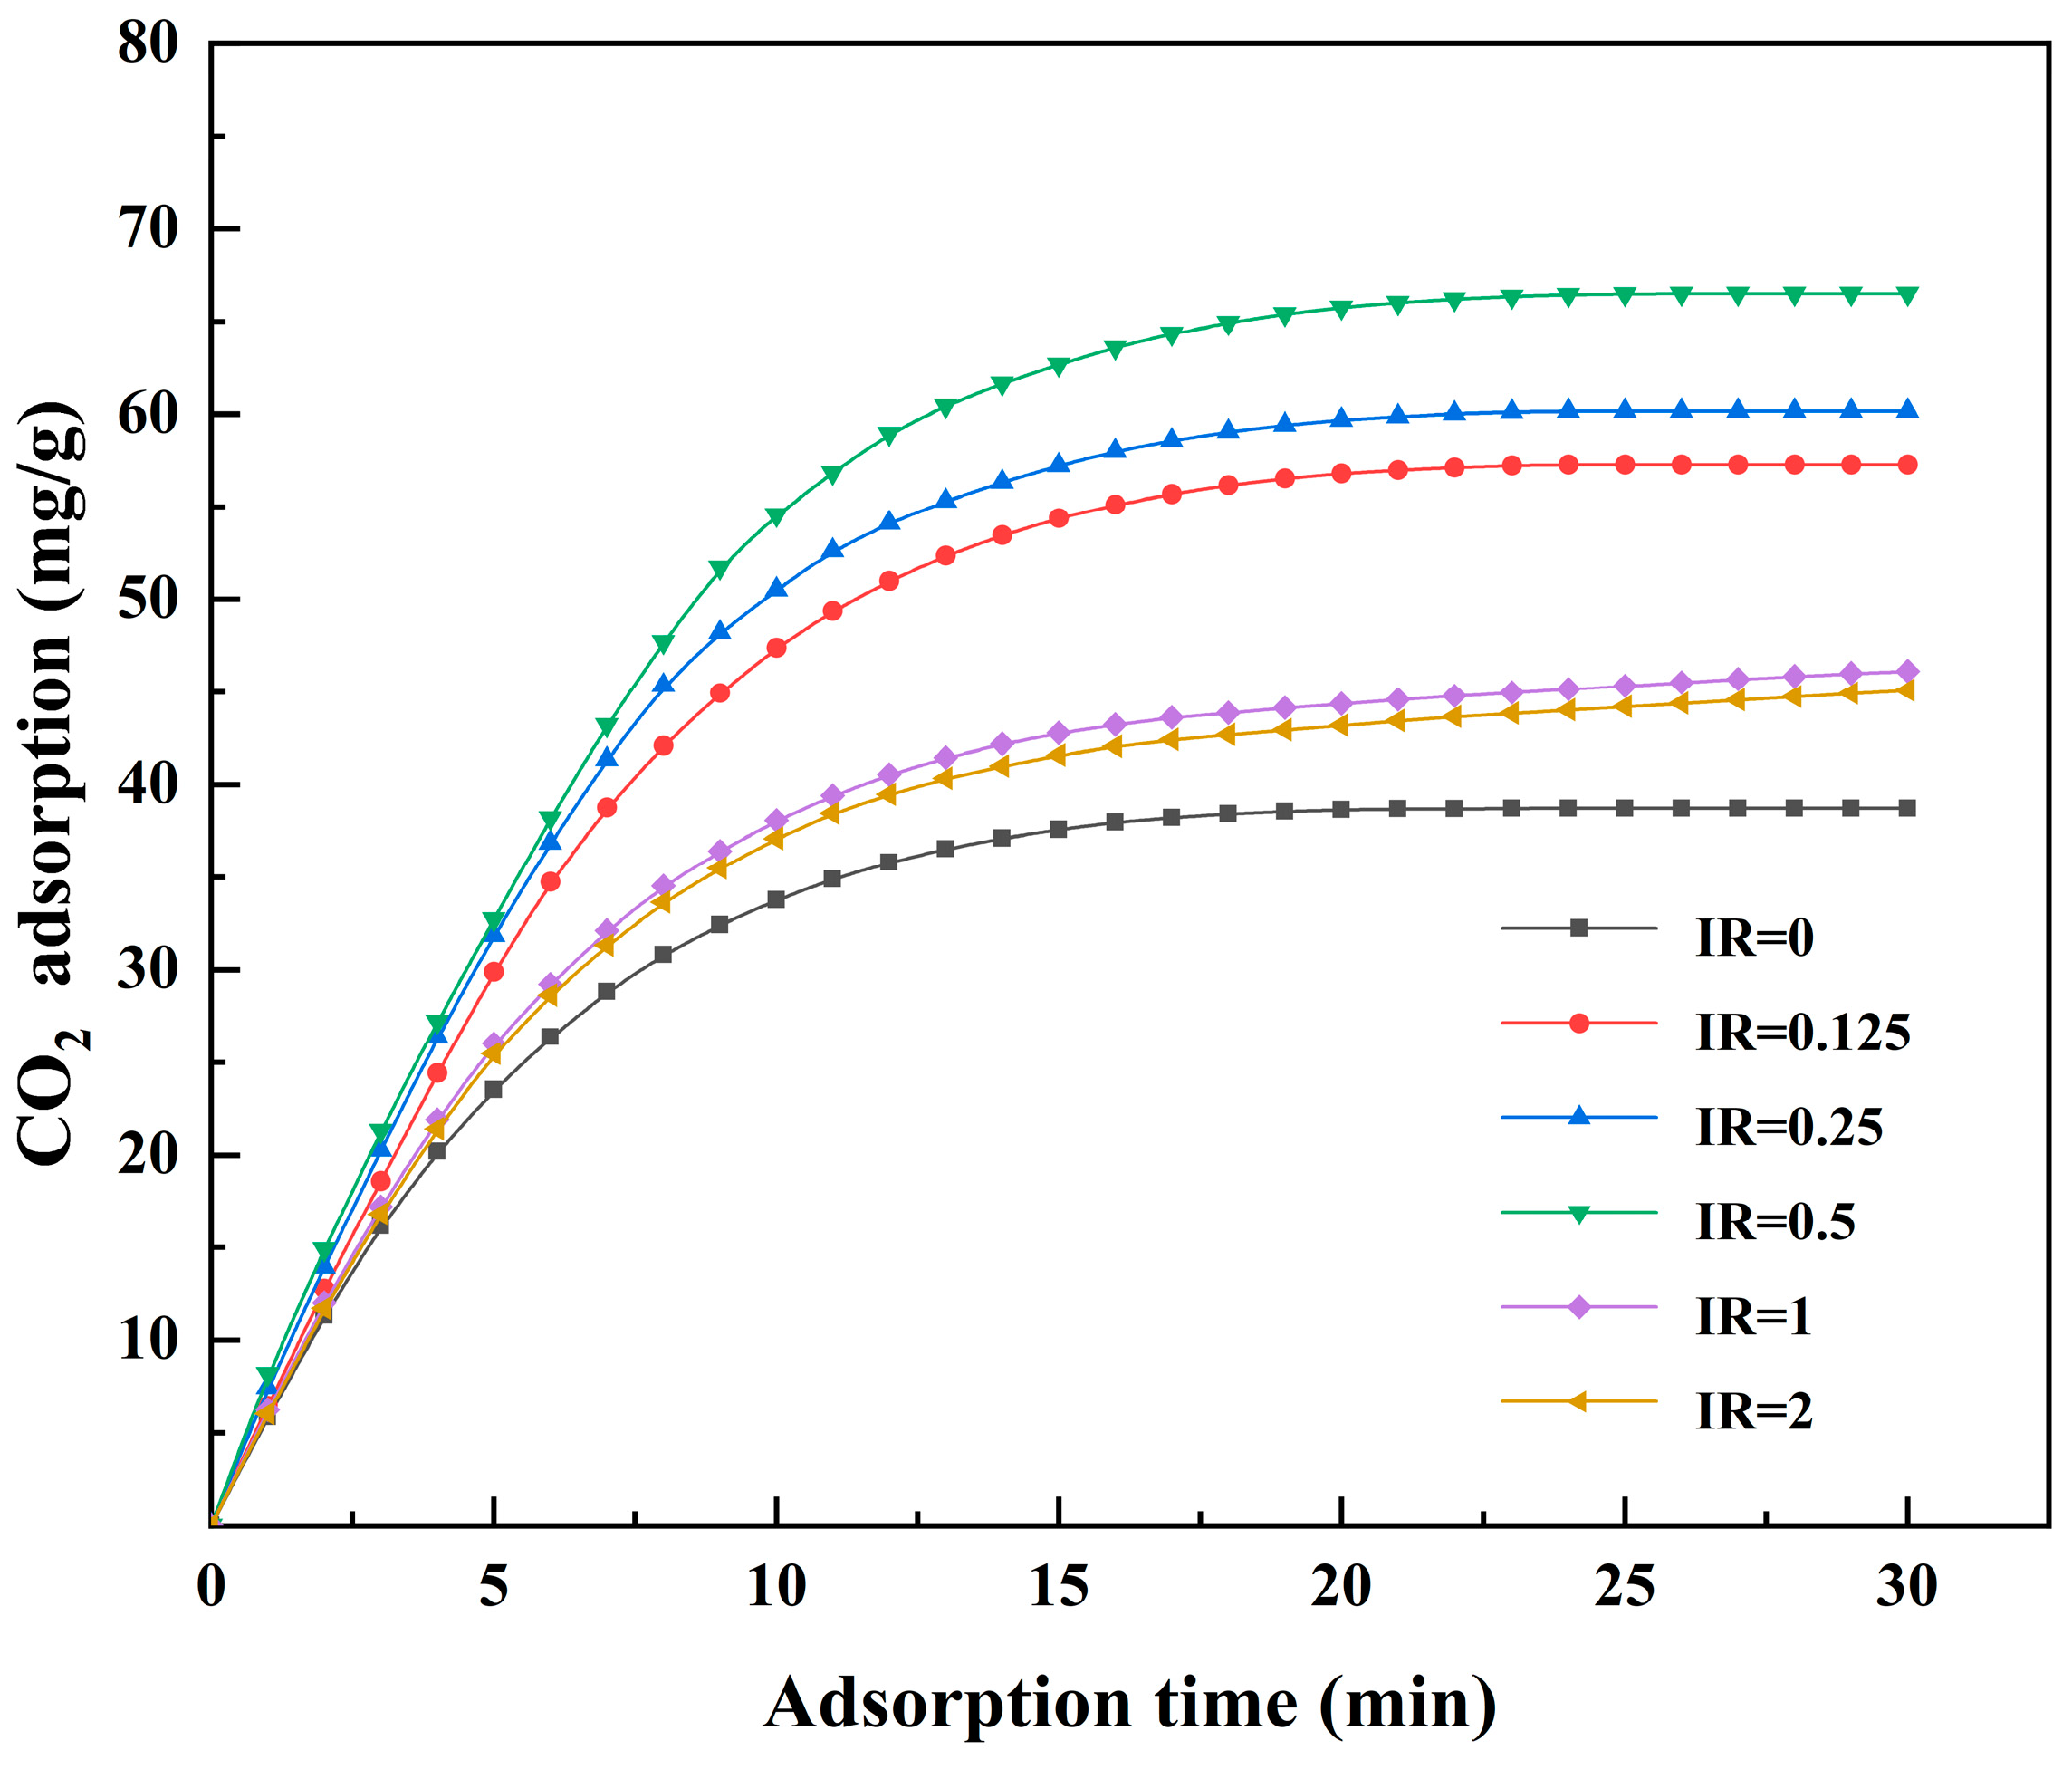
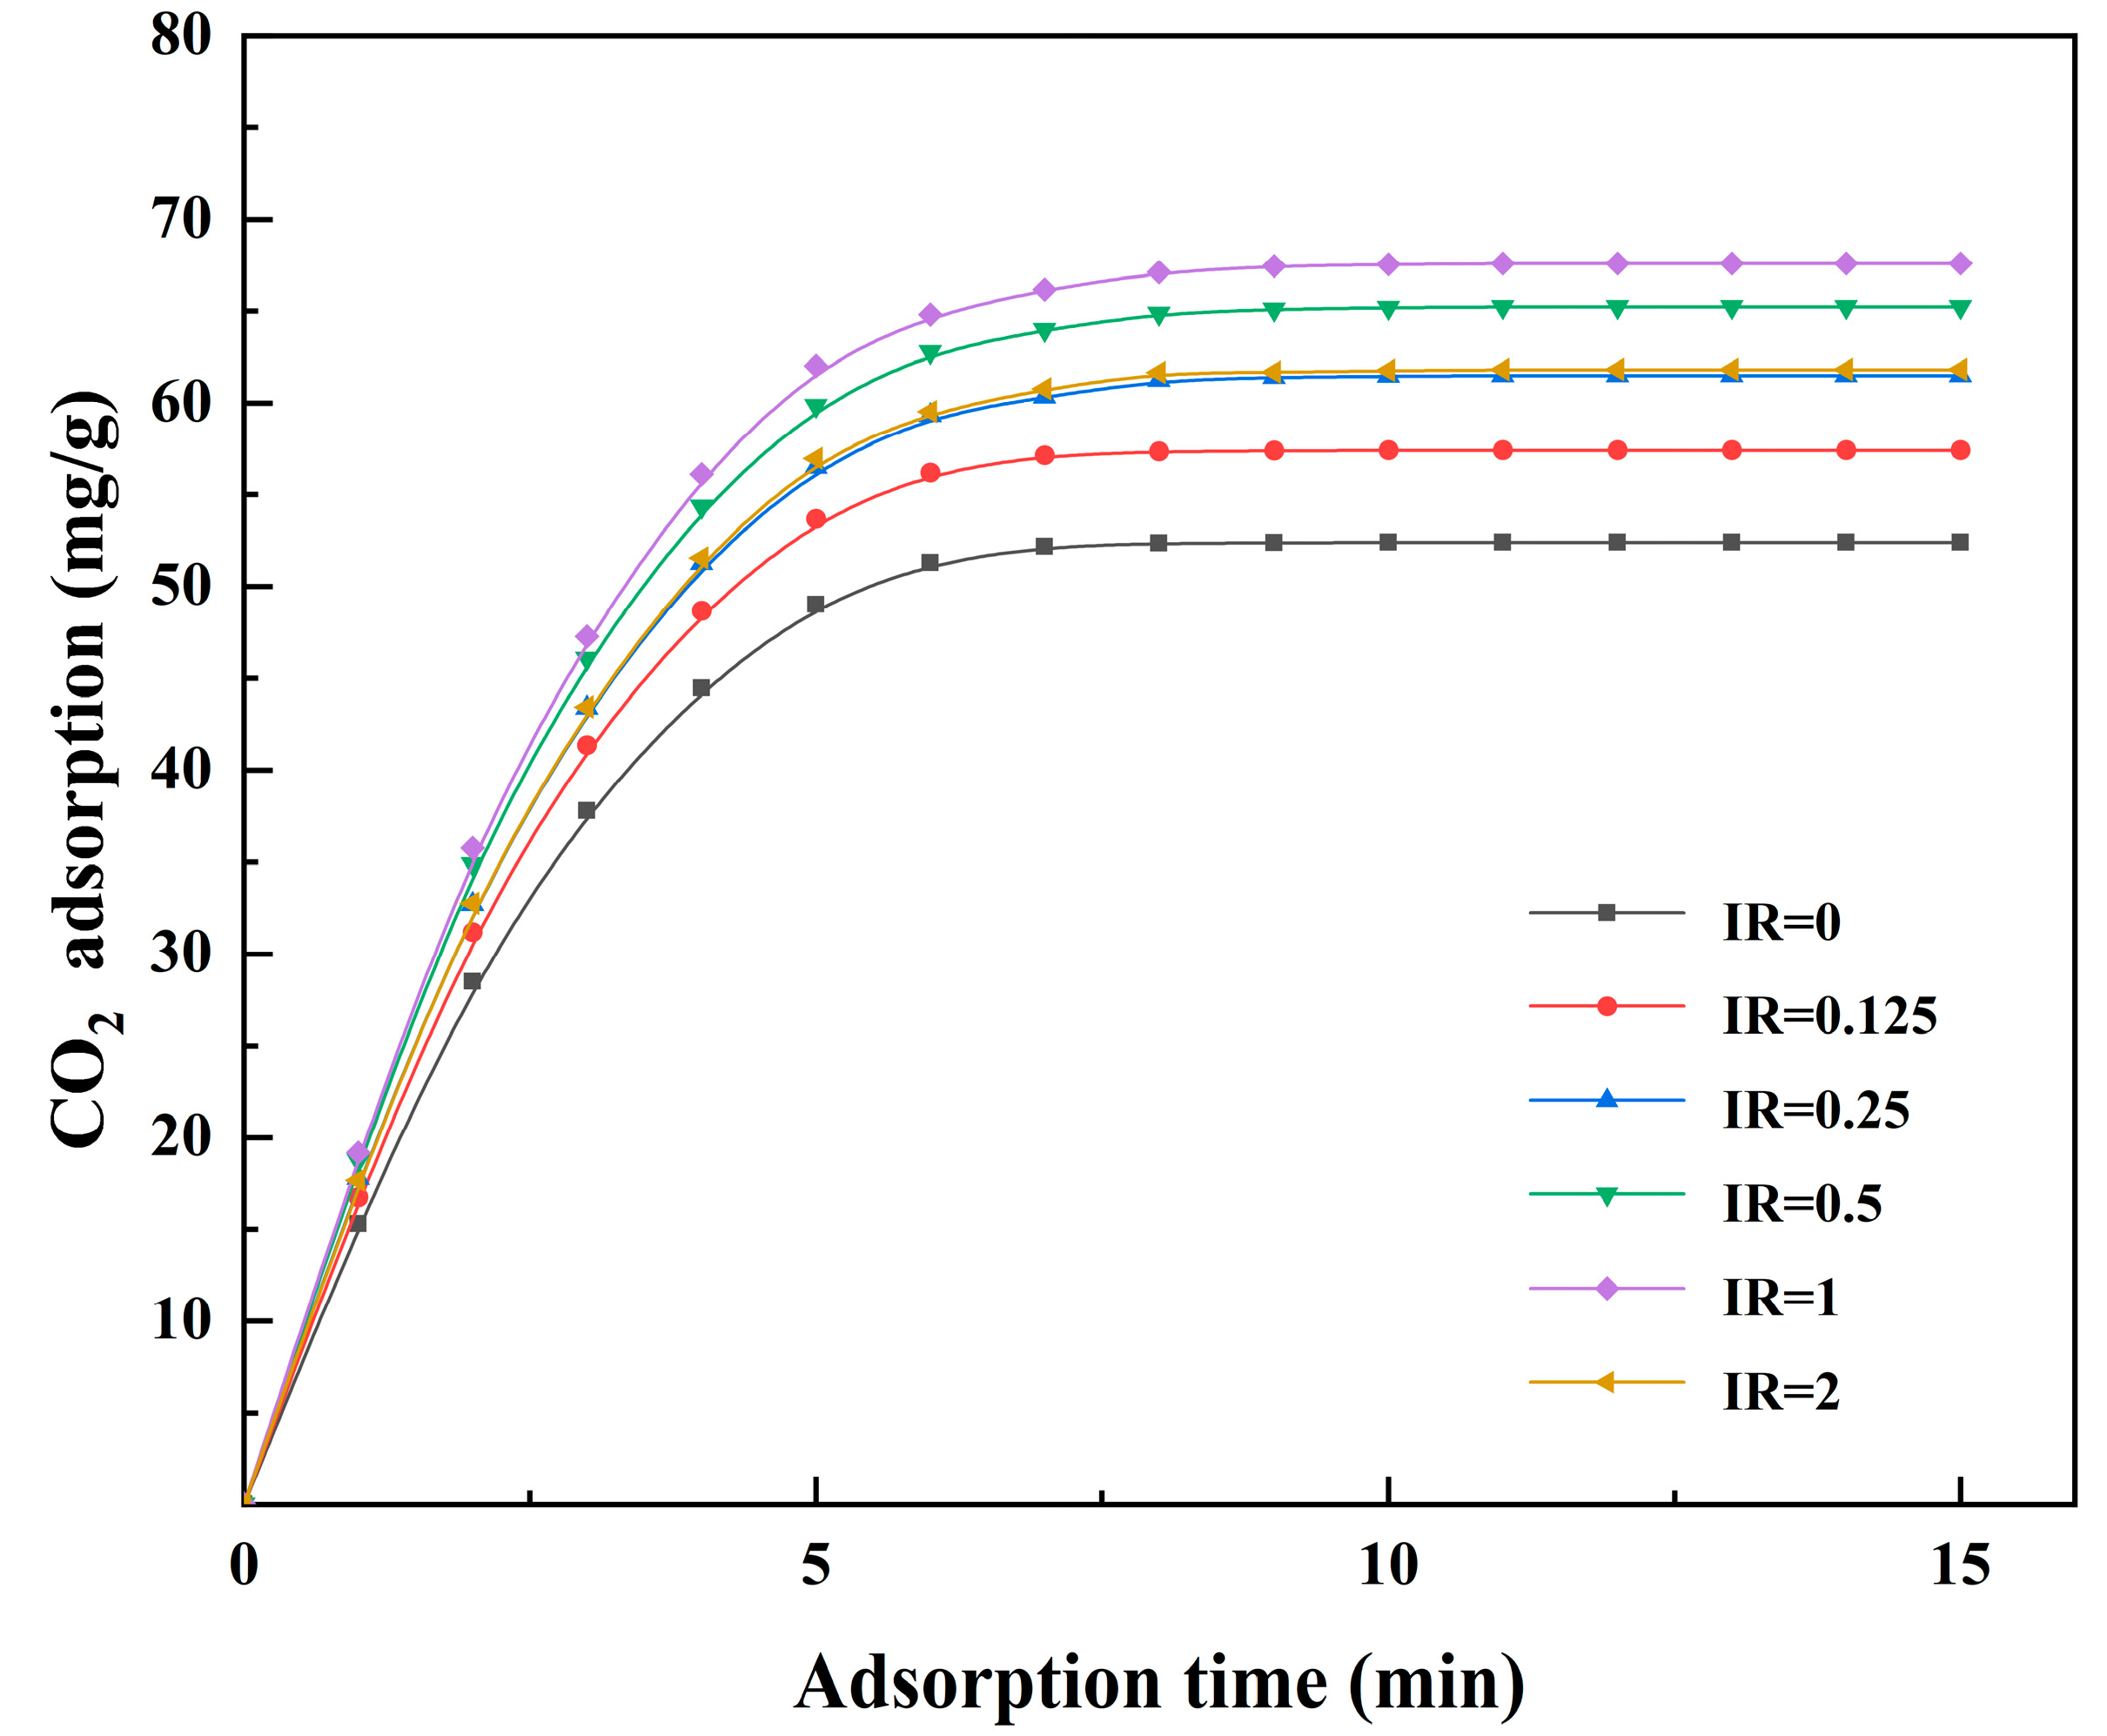
The results of CO2 adsorption by activated coke activated at different KOH impregnation ratios are shown in Figure 8. In general, adsorption is divided into physical adsorption and chemisorption. The physical adsorption process is rapid and corresponds to the stage of a rapid increase in adsorption capacity. Chemical adsorption occurs more slowly but more stably than physical adsorption and corresponds to the slow adsorption stage [45].
Overall, in the fast adsorption phase, the adsorption time of each activated coke was short, but the adsorption amount rose rapidly, while in the slow adsorption phase, the adsorption growth was not obvious, and the adsorption gradually stagnated. Compared with the activated coke prepared by physical activation, the CO2 adsorption performance of each activated coke activated with KOH was better, which was reflected in two aspects: the adsorption curve was steeper in the fast adsorption phase, which meant that the physical adsorption of each activated coke was enhanced due to its larger specific surface area and many micropores. The adsorption capacity of each activated coke increased slightly in the slow adsorption phase, which was more obvious at an IR of 1 and 2.
Specifically, compared with the activated coke prepared by physical activation (IR = 0), the CO2 adsorption capacity of activated coke activated with KOH (IR = 0.125, 0.25, 1, 2) increased by 48.0%, 55.4%, 71.8%, 19.2% and 16.5%, respectively. When the impregnation ratio was less than 0.5, the increase of the impregnation ratio led to a gradual increase in the adsorption capacity of CO2. When the impregnation ratio was too large, the adsorption capacity of CO2 decreased. A moderate amount of KOH promoted the generation of micropores, while an excessive amount of KOH decreased the specific surface area of the micropores. The micropores provided the main adsorption sites and dominated the adsorption capacity of activated coke, and the decrease in the specific surface area of micropores led to a decrease in the CO2 adsorption capacity of activated coke.
It is worth mentioning that the total specific surface area of the activated coke with IR = 0 (528.26 m2/g) was larger than those of the activated cokes with IR = 1 (450.21 m2/g) and 2 (412.87 m2/g), but the CO2 adsorption capacity was lower two. The diameter of the gas molecules of CO2 is 0.33 nm. In the adsorption process of activated coke, the adsorption of gas molecules was mainly realized by the micropores. Mesopores and macropores are the channels for gas molecules to enter and control the adsorption rate. The specific surface area of the micropores of IR = 0, 1, 2 were 334.70 m2/g, 424.24 m2/g and 390.76 m2/g, respectively. In the case of IR = 1 and 2, the amount of KOH was relatively large, and KOH in the internal pore structure of activated coke reacted with the CO2 gas molecules. The chemical adsorption increased the adsorption capacity and prolonged the adsorption time.
In summary, the main reasons for the increased CO2 adsorption by KOH activation are as follows: KOH promoted the development of micropores during the activation process and increased the specific surface area of micropores [46]. The increase in the number of alkaline functional groups on the surface of activated cokes after KOH activation provided a large number of adsorption sites, which were beneficial to the adsorption of the acidic gas CO2. In addition, although the activated cokes were washed several times, a small amount of KOH was still present, which greatly affected the chemisorption of activated cokes.
The results of CO2 adsorption by activated coke activated at different CaCl2 impregnation ratios are shown in Figure 9. It can be seen that the adsorption curve of each activated coke rose rapidly and then leveled off, and the height of each curve was different. The CO2 adsorption capacity of activated coke with an impregnation ratio of 1 reached 51.78 mg/g, while the adsorption capacity of activated coke without CaCl2 activation was 38.70 mg/g.
When considering the whole CO2 adsorption process, it appears that the addition of CaCl2 was beneficial to the adsorption of CO2 by activated coke. In this process, physical adsorption mainly occurred. As the molecular diameter of CO2 is 0.33 nm, the adsorption of CO2 mainly occurred in micropores. If the pore size of activated coke is too large and the binding force is too small, effective adsorption cannot be achieved. Another reason is that CaCl2 generates Ca(OH)Cl during the activation process, which reduces the number of oxygen-containing functional groups on the surface of the activated coke and enhances the alkalinity [47]. Therefore, the effective CO2 adsorption sites on the activated coke surface increased and promoted the adsorption of CO2 by the activated coke.
In order to further evaluate the adsorption capacity of activated cokes obtained in this experiment, the CO2 adsorption capacity of several other carbon-based adsorbent materials was compared with those determined in this study. The results are shown in Table 3. The CO2 adsorption capacity of KAC and CAC reached 66.50 and 51.78 mg/g, respectively, while the CO2 adsorption capacity of other three carbon-based adsorption materials (coal-based and coconut shell-based activated carbon and sludge biochar) reached 51.41 mg/g, 27.10 mg/g and 32.12 mg/g, respectively. This implies that the activated coke obtained in this experiment has excellent CO2 adsorption performance.

3.4.2. Adsorption of CO2 in the Flue Gas of Oxy–Fuel Combustion

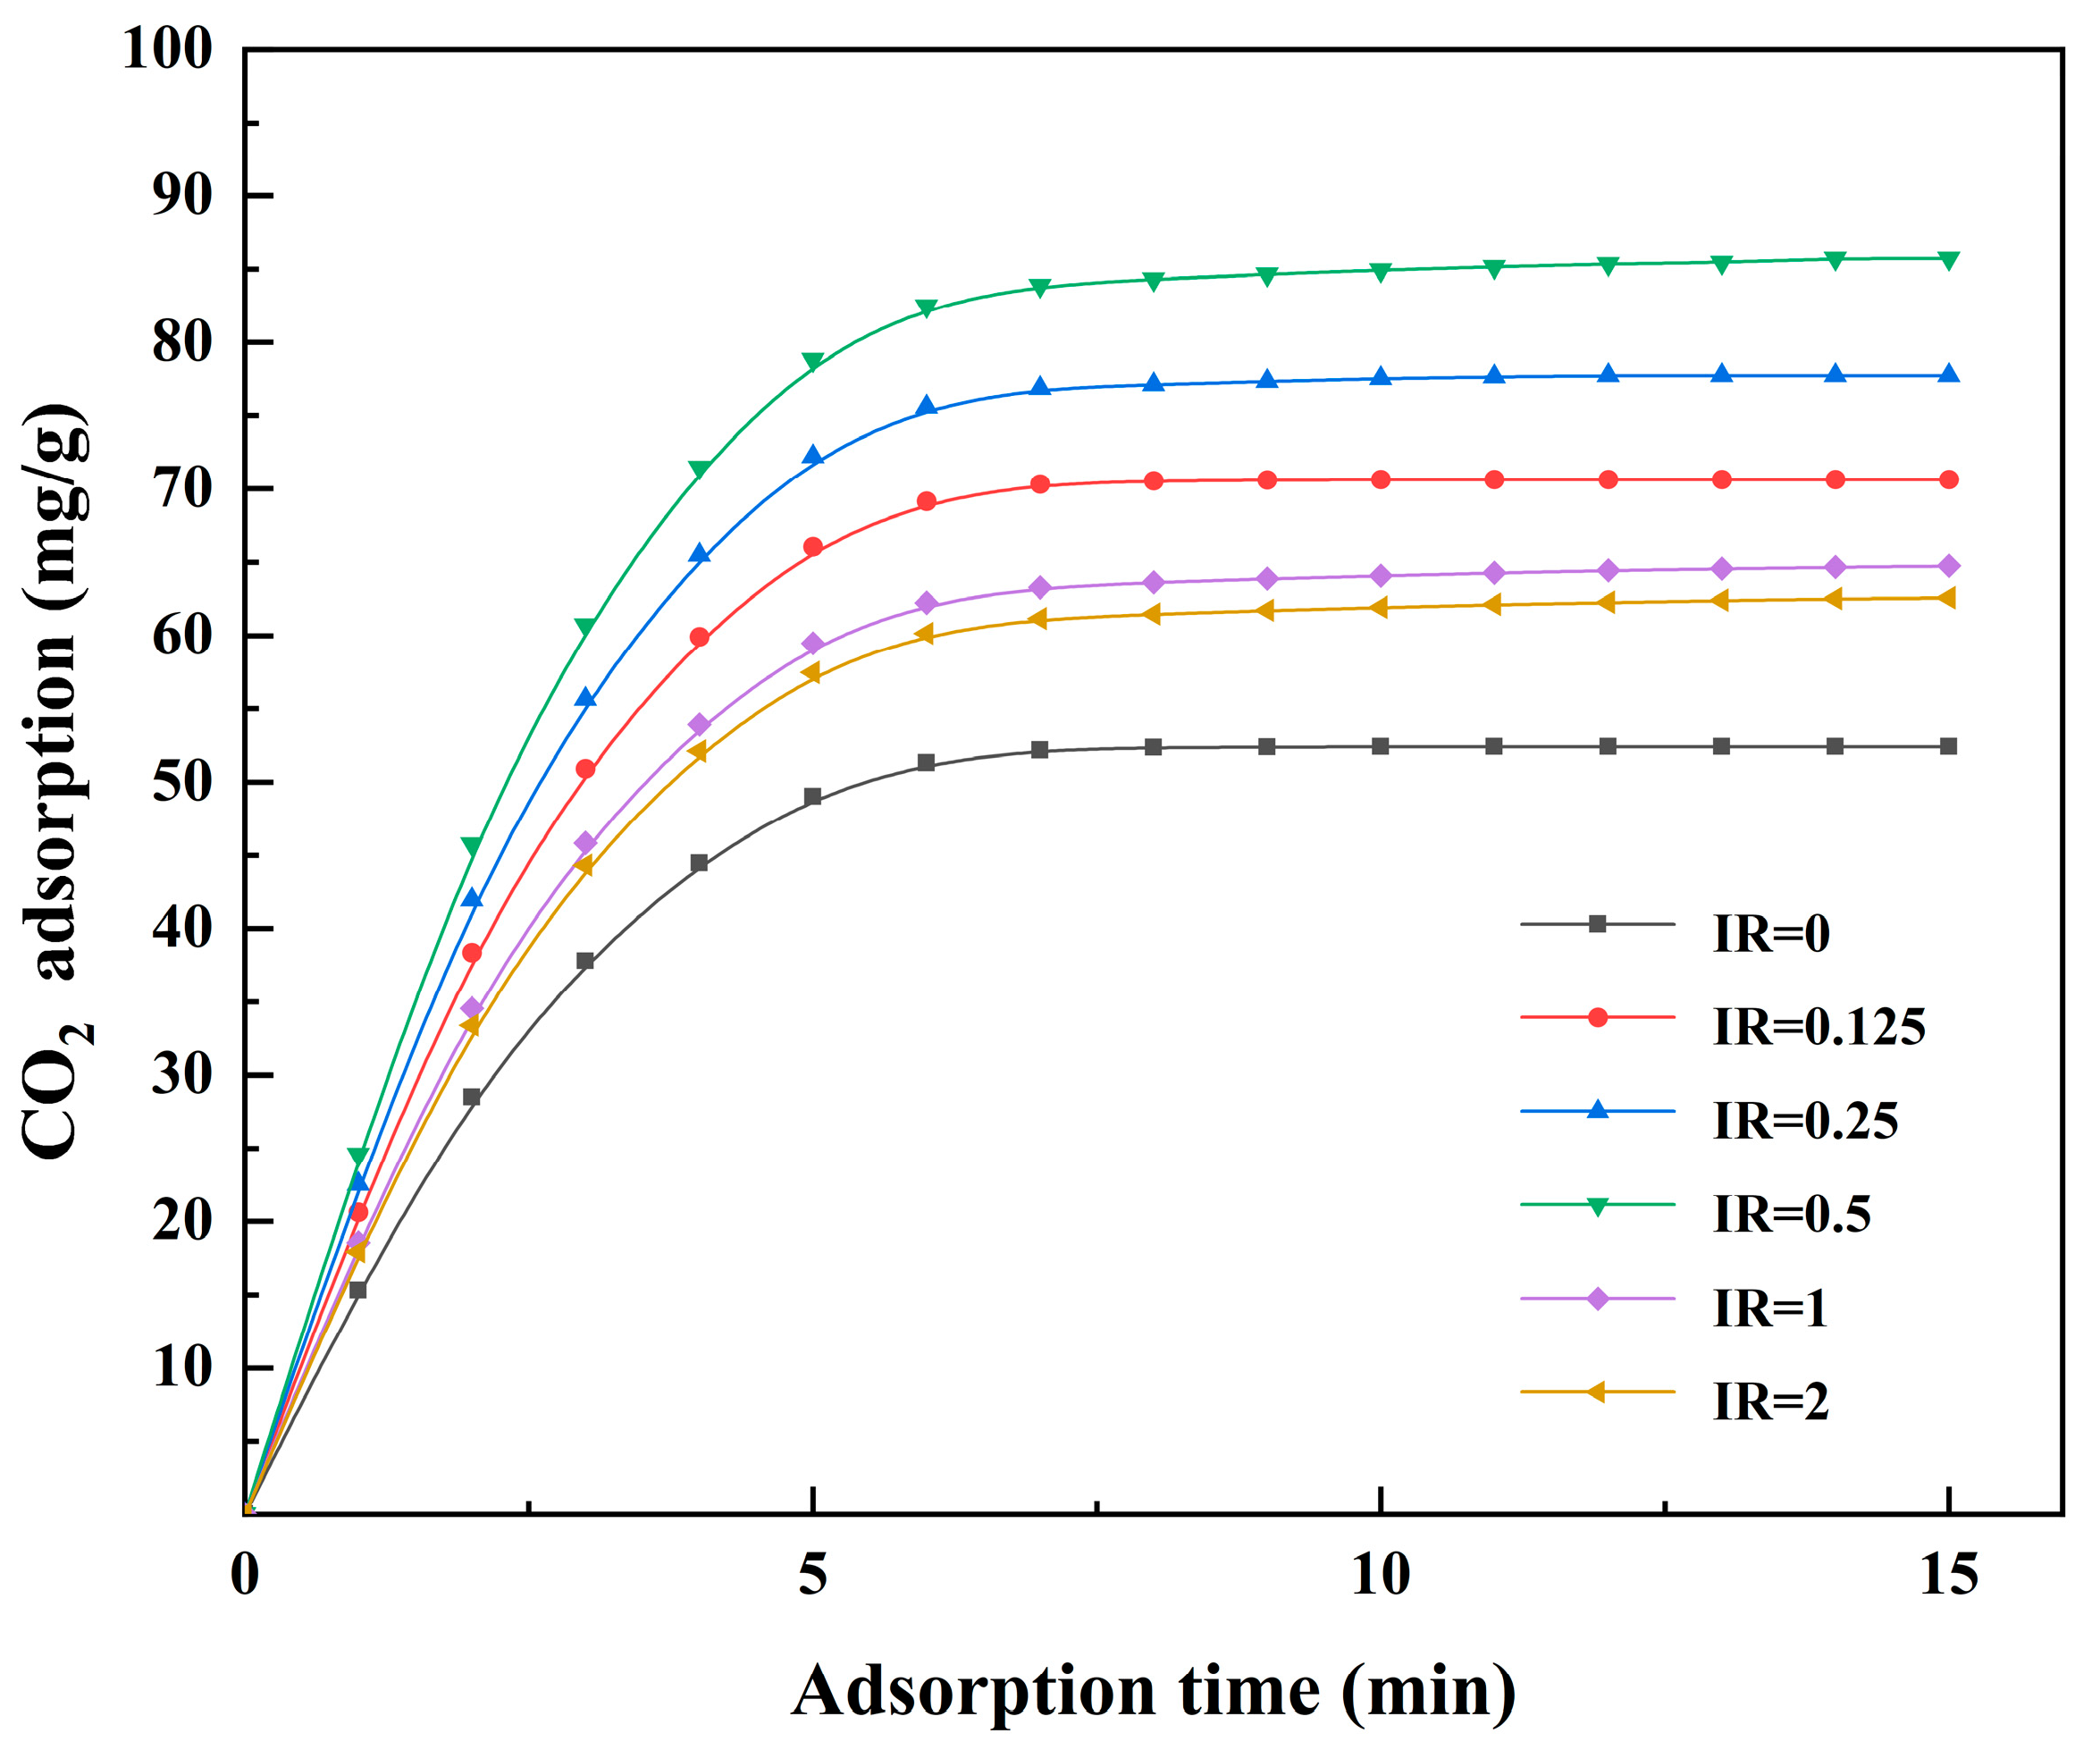
Each activated coke prepared by KOH activation was used to adsorb high concentrations of CO2 in the oxy–fuel combustion flue gas. The adsorption curves are shown in Figure 10. In general, compared with the adsorption of CO2 from conventional power plants flue gas, the CO2 adsorption capacity of each activated coke increased significantly, and the adsorption time was shortened. The main reason for the significant increase in adsorption capacity is that the high concentration of CO2 in the oxy–fuel combustion flue gas led to a high partial pressure of CO2, which greatly enhanced the diffusion dynamics of the CO2 gas molecules, thus increasing the adsorption rate and efficiency [51].
The activation of KOH led to an increase in the specific surface area of microporous pores in the activated coke and an increase in the proportion of microporous pores, thus increasing the adsorption capacity of the activated coke. The maximum adsorption amount was achieved at an IR of 0.5, which was 85.73 mg/g. Similarly, too large impregnation ratios affected the specific surface area of the micropores, thus reducing the adsorption capacity. This could explain the lower height of the adsorption curves at IR of 1 and 2.
The adsorption performance of each activated coke prepared by CaCl2 for high concentrations of CO2 in oxy–fuel combustion flue gas was also tested. The adsorption curves are shown in Figure 11. The adsorption capacity of each activated coke was also significantly increased due to the high concentration of CO2 in the flue gas. Specifically, compared with the activated coke prepared by physical activation (IR = 0), the CO2 adsorption capacity of activated coke activated with CaCl2 (IR = 0.125, 0.25, 1, 2) increased by 10.33%, 17.32%, 24.44%, 28.96% and 17.93%, respectively.

3.5. Adsorption Experiments of Modified Activated Coke

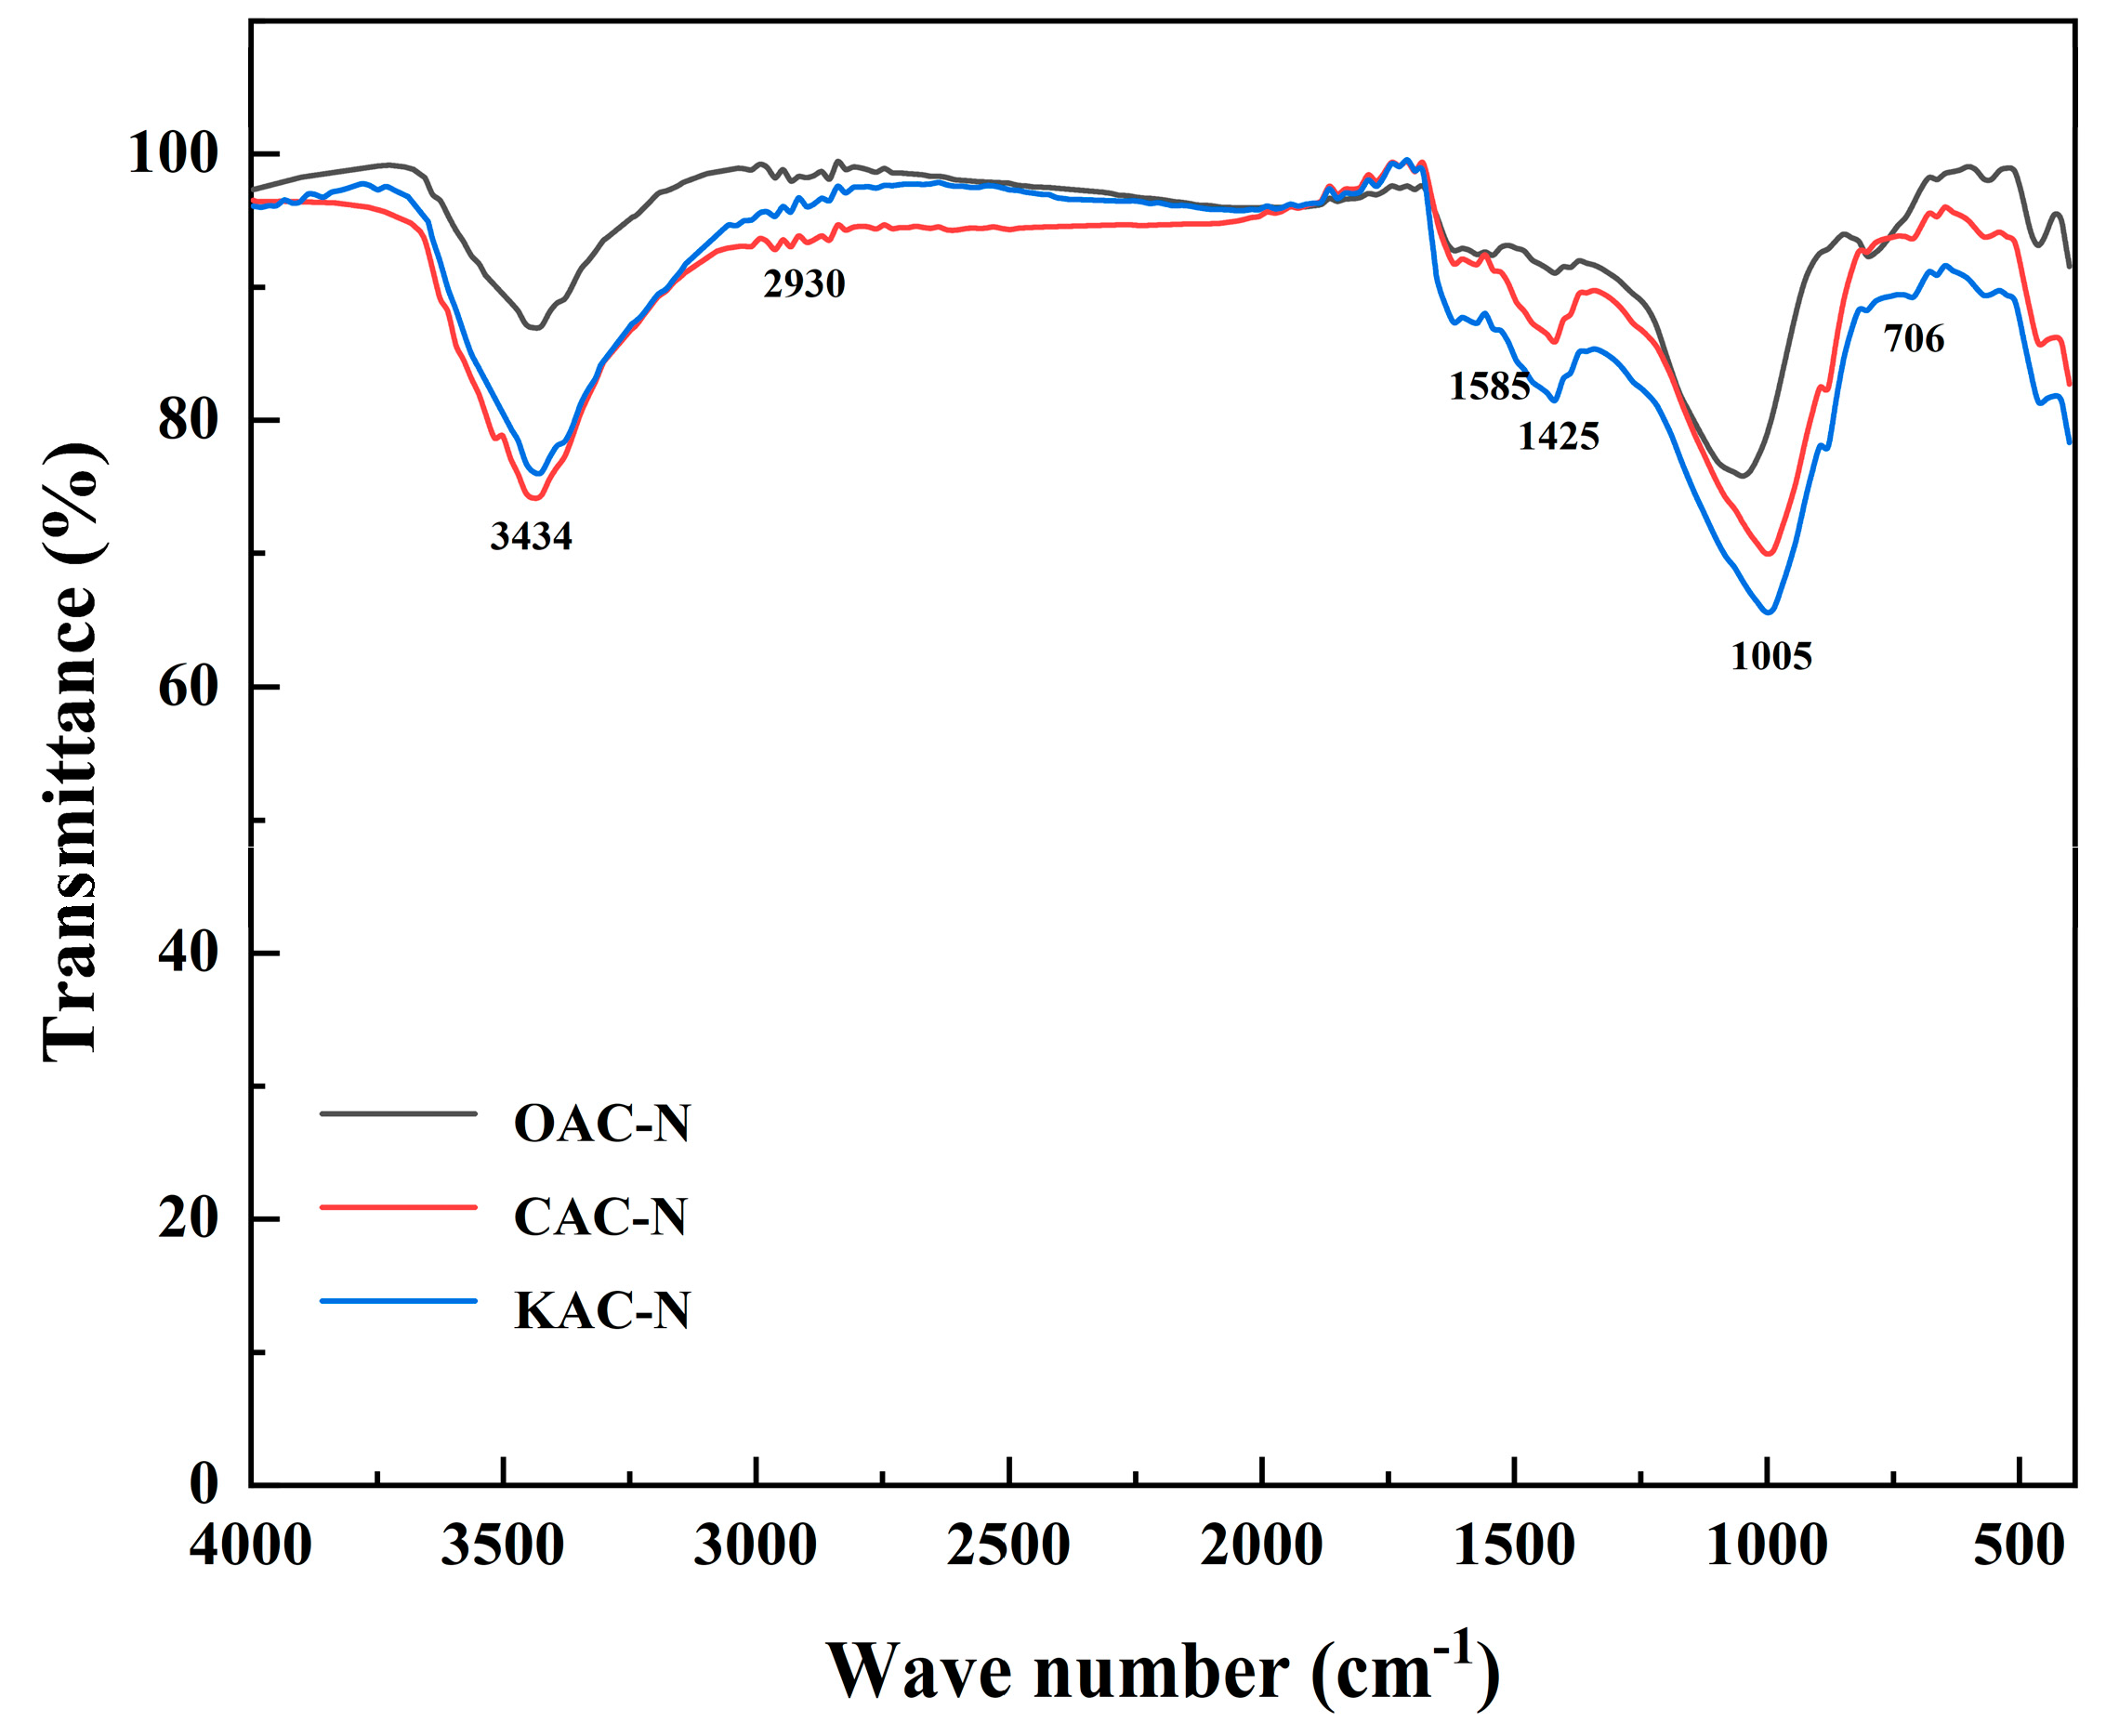
KAC, CAC and OAC were modified with a 10% ammonia solution and named KAC-N, CAC-N and OAC-N, respectively. Before the adsorption experiments, the infrared spectra of the modified activated cokes were analyzed, as shown in Figure 12.
It can be seen that the IR spectra of OAC-N, CAC-N and KAC-N had similar absorption peaks in the range of 4000–400 cm−1, only with different intensities. The broad absorption peak at 3434 cm−1 was caused by the O-H bond stretching vibration. The weak absorption peak at 2930 cm−1 was caused by the C-H stretching vibration. It is noteworthy that the absorption peaks at 1585 and 1425 cm−1 appeared due to the presence of pyridine and pyrrole moieties in the heteroaromatic ring [52]. The peak at 1005 cm−1 was caused by the C-O stretching vibration, which indicated the presence of hydrocarbon groups; the peak in the range of 1000–650 cm−1 was mainly caused by the C-H out-of-plane bending vibration. Combined with the previous FTIR spectra of the activated coke without the ammonia modification, the nitrogen-containing functional groups, such as pyridine and pyrrole, were introduced on the surface of each activated coke after the ammonia modification.
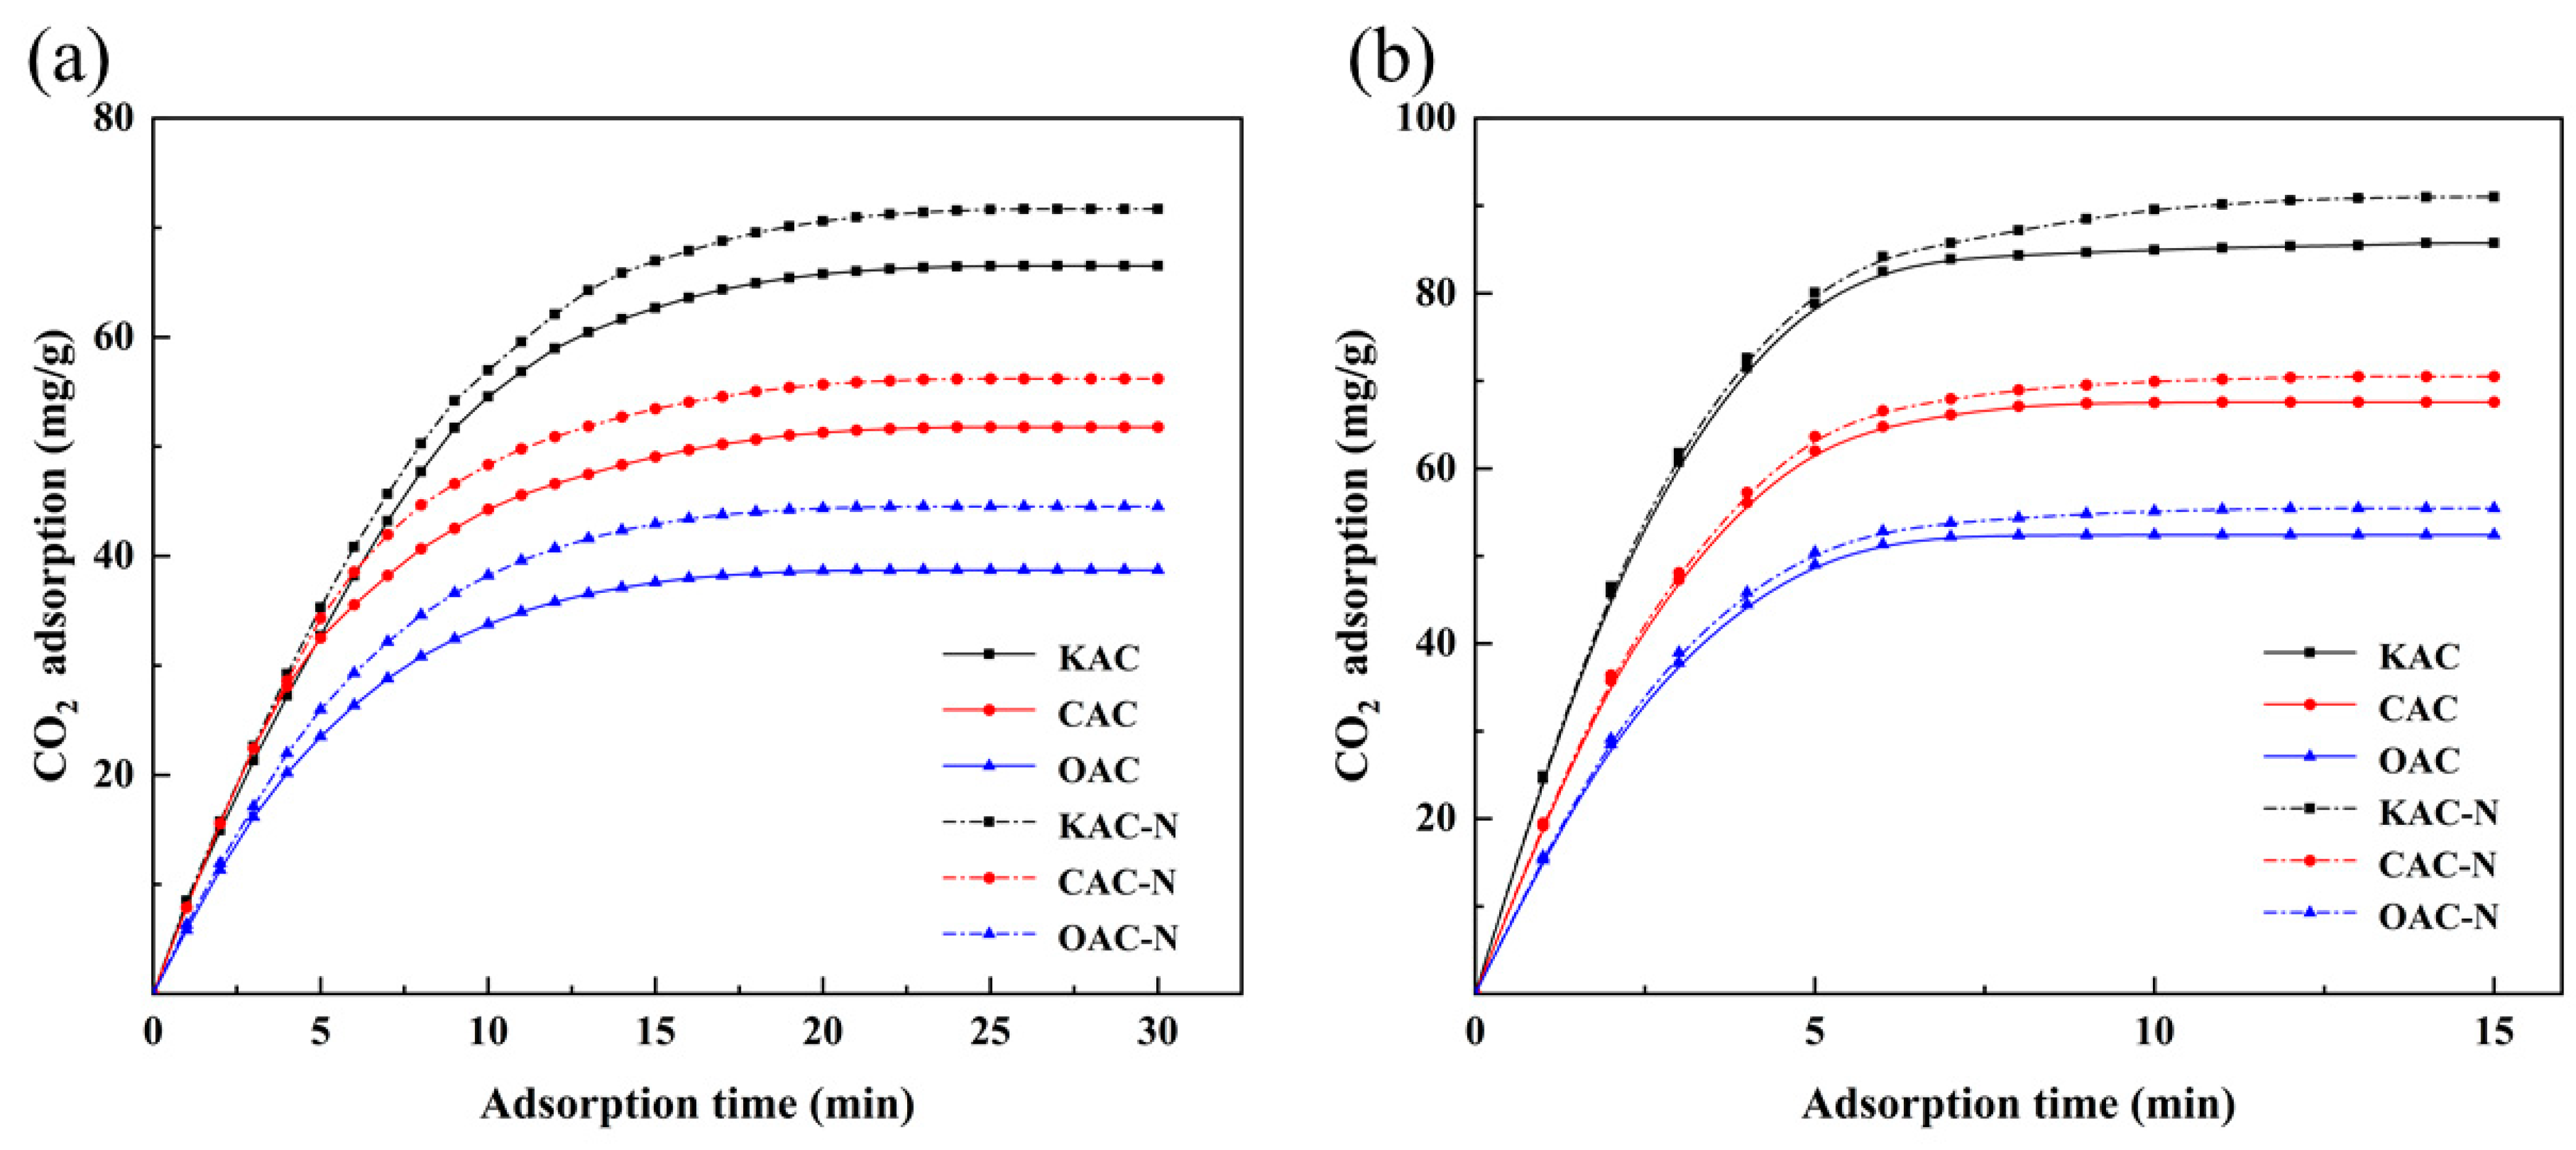
In order to compare the changes of adsorption performance of activated coke before and after the modification, the adsorption curves of activated coke before and after the modification were combined in the same figure, as shown in Figure 13. Figure 13a shows the CO2 adsorption curve when using conventional power plant flue gas for activated coke, and Figure 13b shows the CO2 adsorption curve when using oxy–fuel combustion flue gas for activated coke.
As shown in Figure 13a, the adsorption capacity of each activated coke increased after the ammonia modification, and the CO2 adsorption capacity of KAC-N, CAC-N and OAC-N was increased by 5.20 mg/g, 4.40 mg/g and 5.80 mg/g, respectively. As shown in Figure 13b, the CO2 adsorption capacity of KAC-N, CAC-N and OAC-N increased by 5.26 mg/g, 2.89 mg/g and 3.02 mg/g, respectively.
Since CO2 is an acidic gas with a strong quadrupole moment, the increase of nitrogen-containing functional groups on the surface of activated coke increased its surface alkalinity, thus enhancing the interaction between CO2 and the surface of activated coke [53,54], especially the interaction with nitrogen, which also has a strong quadrupole moment and so can improve the adsorption capacity of activated coke for CO2.

3.6. Effect of Nitrogen-Containing Functional Groups on the Adsorption of CO2 by Activated Coke

3.6.1. Electrostatic Potential Analysis

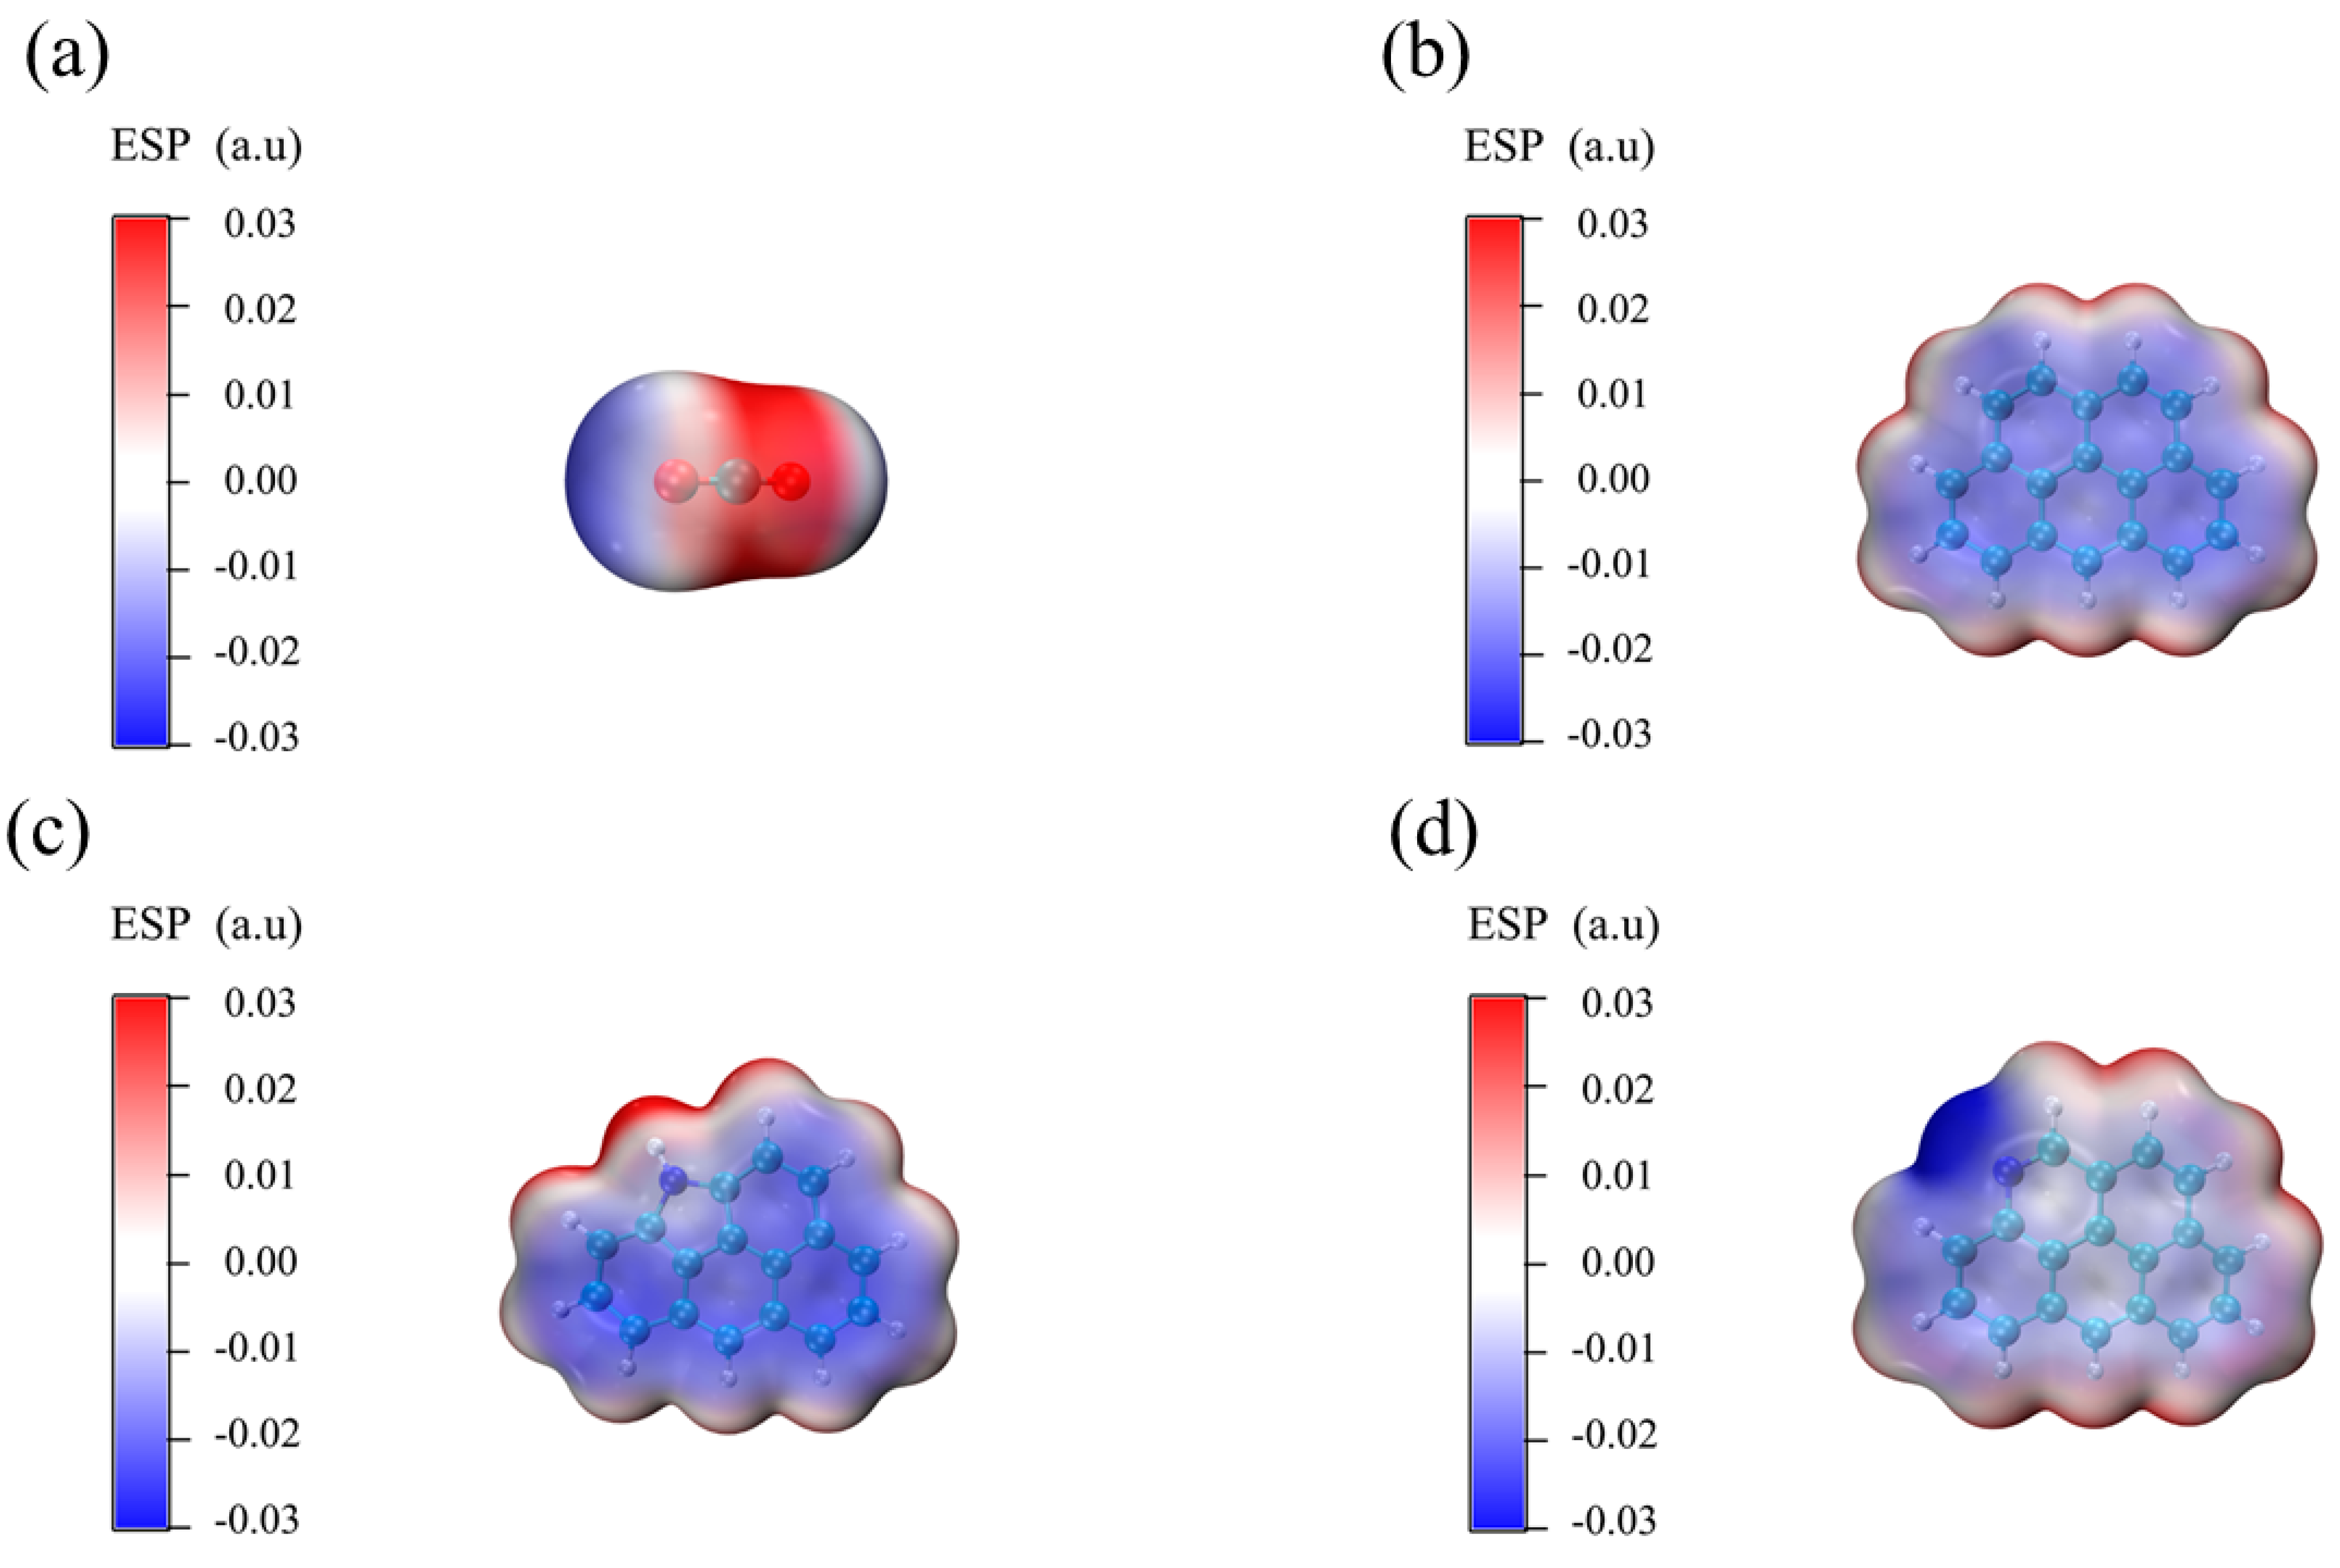
The effect of N atom doping on the electronic properties of the original graphene model was investigated by using electrostatic potential (ESP) analysis. The electrostatic potential distributions of CO2 molecules, the pristine graphene model, the graphene model with pyridine functional groups and the graphene model with pyrrole functional groups are shown in Figure 14a–d. The red area represents the positive electrostatic potential, the blue area represents the negative electrostatic potential, and a deeper color represents a larger value.
In Figure 14b, it can be seen that the electrostatic potential on the surface of the pristine graphene model was relatively uniform, and the maximum value of electrostatic potential appeared at the edge of the termination of the H atom. In Figure 14c,d, it can be seen that the doping with pyridine functional groups and pyrrole functional groups changed the electrostatic potential distribution of the pristine graphene model. When the N atom-containing pyridine was doped on the graphene model, the electrostatic potential near the N atom was negative and released electrons as an electron donor, and the C atom in CO2 was adsorbed; when the N atom of pyrrole was doped on the graphene model, the H atom attached to it had a positive electrostatic potential and obtained electrons as an electron acceptor, and the O atom in CO2 was adsorbed. According to the ESP results, the graphene model electrons were shifted due to the doping of N atoms, resulting in a non-uniform distribution of electrostatic potential and a corresponding change in surface polarity [55].

3.6.2. Adsorption Analysis

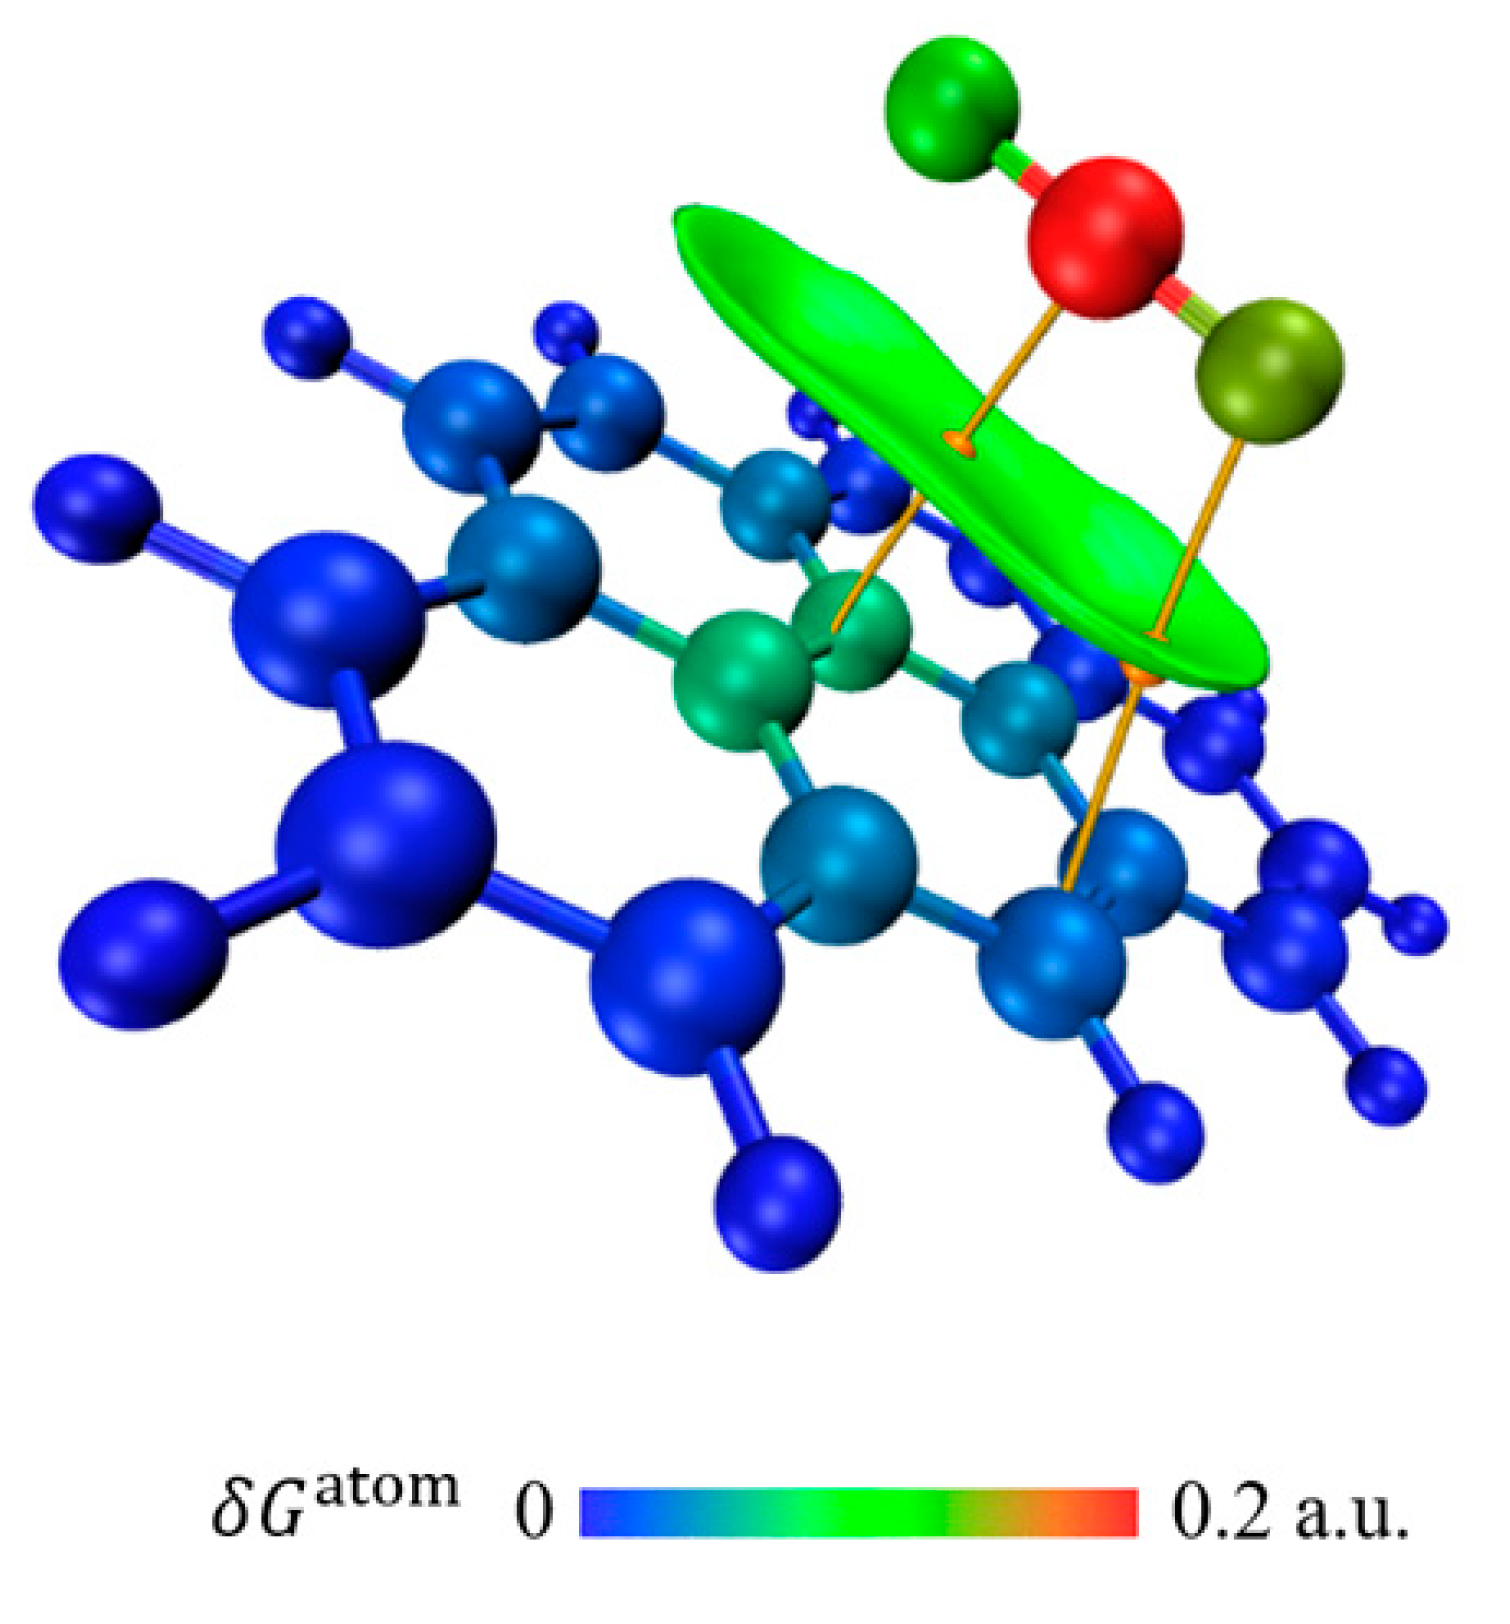
Before simulating the CO2 adsorption process using the nitrogen-containing functional group graphene model, CO2 adsorption was first simulated using the original graphene model. The adsorption configuration analysis of CO2 on the original graphene model showed that the adsorption site of CO2 in this model was in the basal plane, as shown in Figure 15. The large green iso-surface implied that the interaction between the two components implied mainly a dispersion force. The adsorption energy was −0.154 eV.
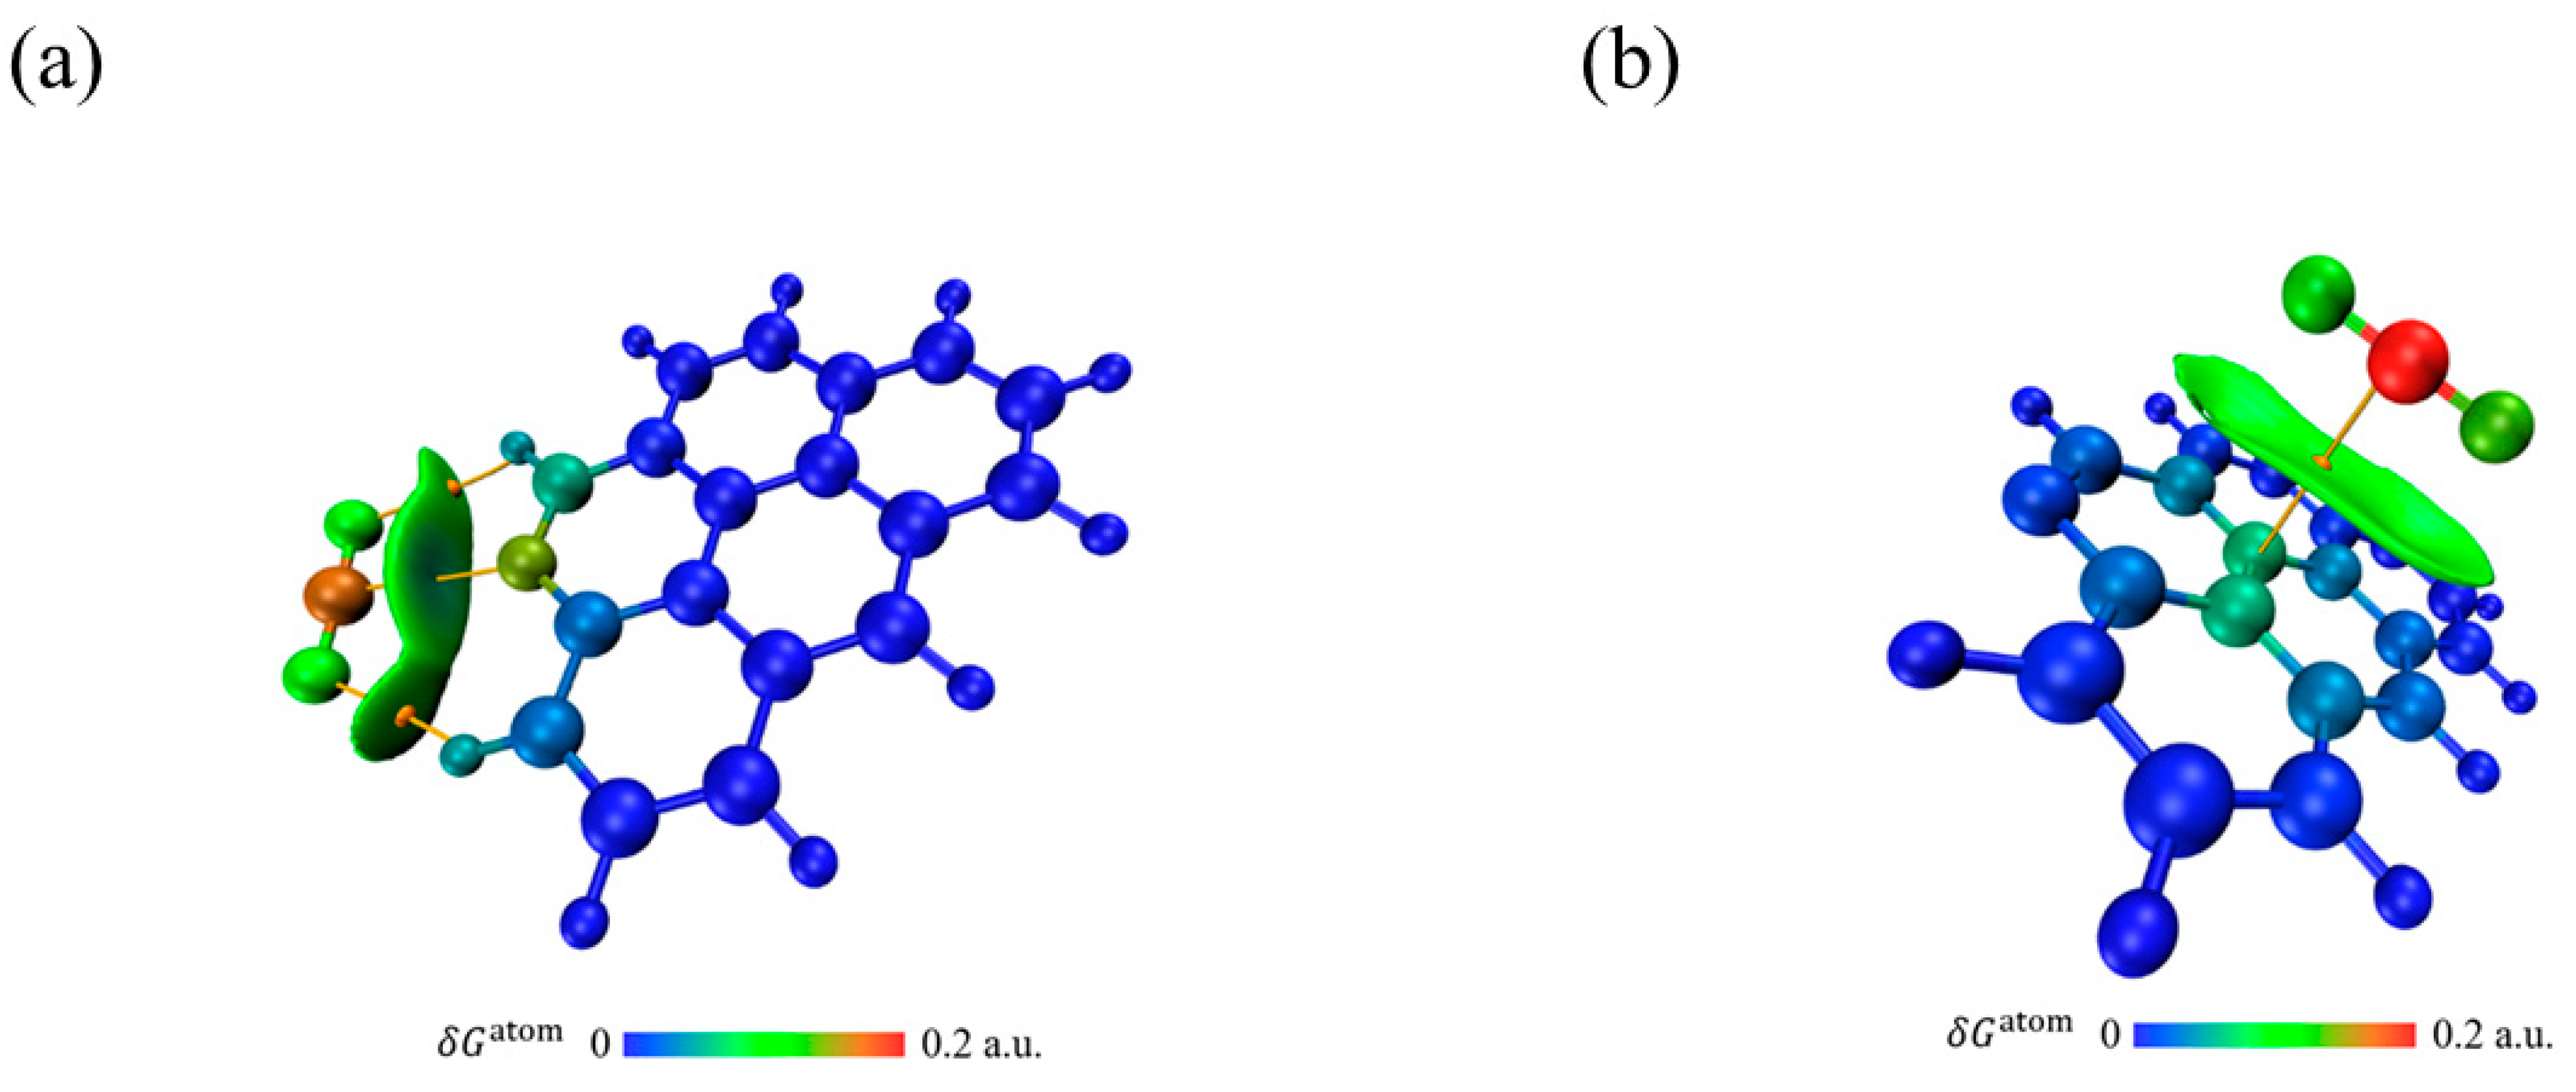
The adsorption configuration analysis of CO2 in the pyridine-containing graphene model showed that the CO2 adsorption sites were not only in the basal plane, but also at the edge positions of the pyridine groups, as shown in Figure 16a,b. This implies that the pyridine group was a favorable adsorption site for CO2 molecules. The adsorption behavior was mainly determined by hydrogen bonding. The adsorption energy was −0.231 eV. When the adsorption configuration provided the adsorption site in the basal plane, the interaction was almost identical to that in the original graphene model. CO2 molecules were adsorbed on the C atom of the original benzene ring, and the adsorption energy was −0.157 eV.
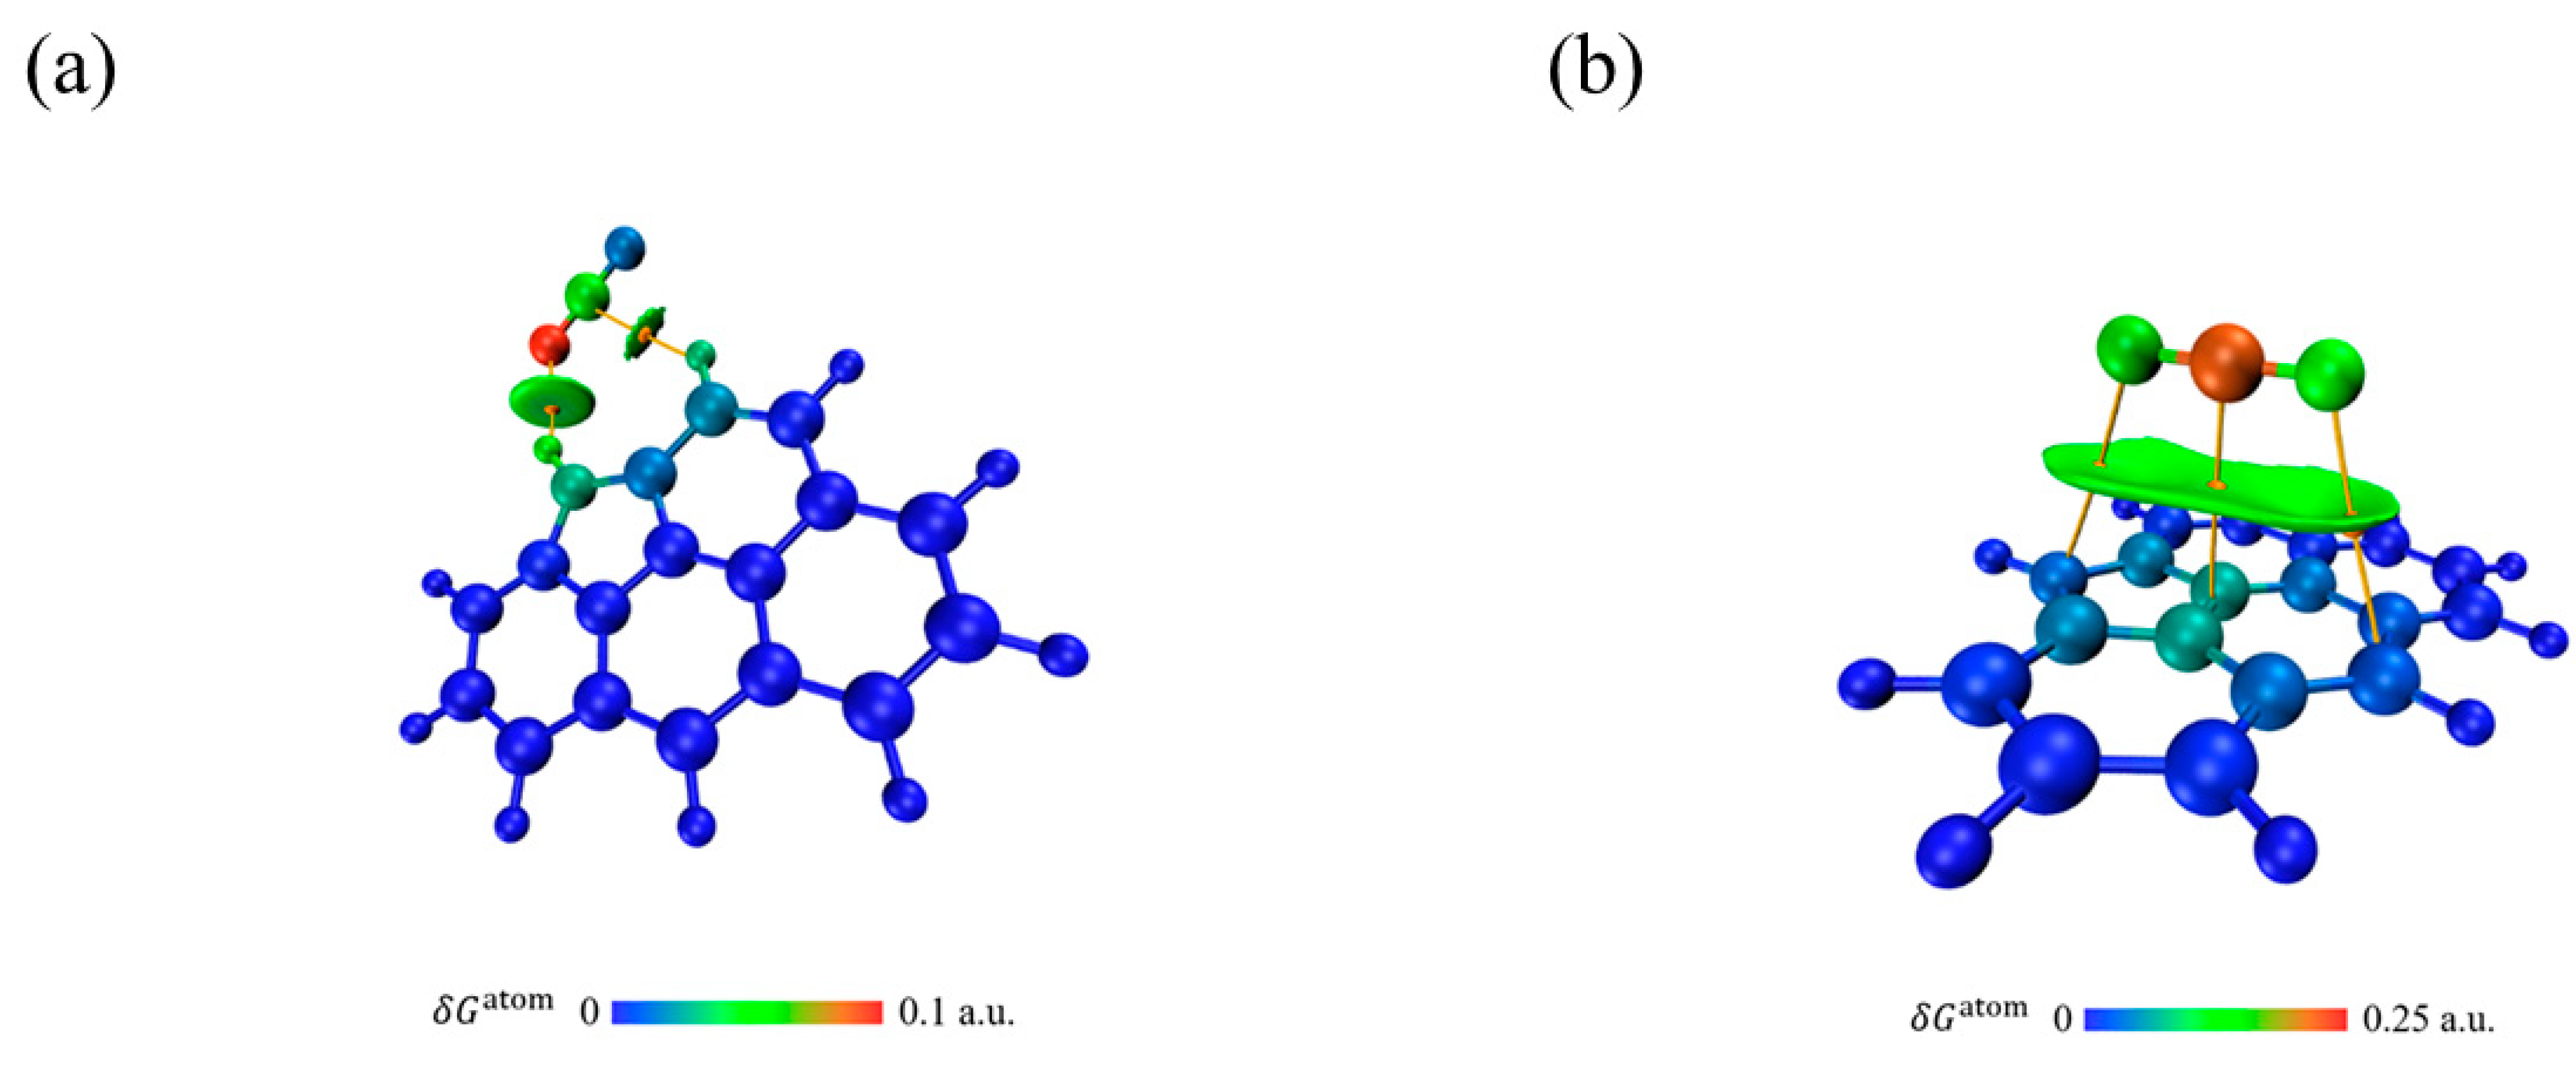
Similarly, during the adsorption of graphene models containing pyrrole functional groups with CO2, the CO2 molecules had two adsorption sites, one in the basal plane, and one on the pyrrole groups, as shown in Figure 17. When the adsorption site was in the basal plane, two green iso-surfaces appeared between the CO2 molecule and graphene; the green color on the iso-surface represented a very low electron density in the region. The adsorption was mainly dominated by hydrogen bonding, and the adsorption energy was −0.08 eV. When the adsorption of CO2 molecules occurred at the basal surface, the adsorption was characterized by a dispersion force, and the adsorption energy was −0.190 eV.

4. Conclusions

Activated coke was prepared from low-rank bituminous coal and coconut shells by using KOH or CaCl2 in a physically activated atmosphere. The addition of chemically active agents decreased the yield of activated coke. The specific surface area of activated coke with a KOH impregnation ratio of 0.5 reached a maximum value of 629.81 m2/g. The specific surface area of activated coke with a CaCl2 impregnation ratio of 1 reached a maximum value of 610.66 m2/g. KOH promoted the development of micropores, while CaCl2 was more favorable to the generation of mesopores. Infrared spectra showed that the number and type of functional groups of activated coke changed significantly after activation. Therefore, the prepared activated coke with large specific surface area, well-developed pore structure and abundant functional groups became an excellent adsorbent for CO2 gas.
The adsorption performance of the prepared activated coke for CO2 in two kinds of flue gases was also tested. The CO2 adsorption performance of each activated coke was enhanced after the activation with KOH and CaCl2. The prepared activated coke had an excellent CO2 adsorption performance compared to other carbon-based adsorption materials. The CO2 adsorption capacity of KAC reached 66.50 mg/g and 85.73 mg/g from conventional power plant flue gas and oxy–fuel combustion flue gas, respectively. The high concentration of CO2 in oxy–fuel combustion flue gas further increased the adsorption capacity of activated coke.
Pyridine and pyrrole functional groups were introduced on the activated coke surface after modification with ammonia. The alkaline adsorption sites on the activated coke surface were increased, and thus the adsorption capacity was enhanced. The CO2 adsorption capacity of KAC-N reached 71.70 mg/g and 90.99 mg/g from conventional power plant flue gas and oxy–fuel combustion flue gas, respectively. The simulations revealed that the pyridine and pyrrole groups caused a non-uniform distribution of electrostatic potential and a change of polarity in the graphene model. The pyridine and pyrrole groups established weak interactions of different degrees with the CO2 molecules, mainly hydrogen bonds.

Author Contributions

H.G.: writing—original draft preparation; S.W.: data curation, M.H.: Methodology; W.S.: resources; S.Z.: writing—review and editing; L.Z.: supervision; X.R.: supervision, writing—review and editing. All authors have read and agreed to the published version of the manuscript.

Funding

This work was funded by Shandong Provincial Natural Science Foundation of China (Grant No. ZR2021QE293).

Data Availability Statement

Not applicable.

Conflicts of Interest

The authors declare no conflict of interest.

References

  1. Peters, G.P.; Andrew, R.M.; Canadell, J.G.; Friedlingstein, P.; Jackson, R.B.; Korsbakken, J.I.; Le Quéré, C.; Peregon, A. Carbon dioxide emissions continue to grow amidst slowly emerging climate policies. Nat. Clim. Chang. 2020, 10, 3–6. [Google Scholar] [CrossRef]
  2. Kielbasa, K.; Bayar, S.; Varol, E.A.; Srenscek-Nazzal, J.; Bosacka, M.; Miadlicki, P.; Serafin, J.; Wrobel, R.J.; Michalkiewicz, B. Carbon Dioxide Adsorption over Activated Carbons Produced from Molasses Using H2SO4, H3PO4, HCl, NaOH, and KOH as Activating Agents. Molecules 2022, 27, 7467. [Google Scholar] [CrossRef]
  3. Gür, T.M. Carbon Dioxide Emissions, Capture, Storage and Utilization: Review of Materials, Processes and Technologies. Prog. Energy Combust. Sci. 2022, 89, 100965. [Google Scholar] [CrossRef]
  4. Chen, J.; Xu, W.; Zuo, H.; Wu, X.; E, J.; Wang, T.; Zhang, F.; Lu, N. System development and environmental performance analysis of a solar-driven supercritical water gasification pilot plant for hydrogen production using life cycle assessment approach. Energy Convers. Manag. 2019, 184, 60–73. [Google Scholar] [CrossRef]
  5. Carapellucci, R.; Di Battista, D.; Cipollone, R. The retrofitting of a coal-fired subcritical steam power plant for carbon dioxide capture: A comparison between MCFC-based active systems and conventional MEA. Energy Convers. Manag. 2019, 194, 124–139. [Google Scholar] [CrossRef]
  6. Spigarelli, B.P.; Kawatra, S.K. Opportunities and challenges in carbon dioxide capture. J. CO2 Util. 2013, 1, 69–87. [Google Scholar] [CrossRef]
  7. Leung, D.Y.; Caramanna, G.; Maroto-Valer, M.M. An overview of current status of carbon dioxide capture and storage technologies. Renew. Sustain. Energy Rev. 2014, 39, 426–443. [Google Scholar] [CrossRef]
  8. Bhavsar, S.; Najera, M.; Solunke, R.; Veser, G. Chemical looping: To combustion and beyond. Catal. Today 2014, 228, 96–105. [Google Scholar] [CrossRef]
  9. Parshetti, G.K.; Chowdhury, S.; Balasubramanian, R. Plant derived porous graphene nanosheets for efficient CO2 capture. RSC Adv. 2014, 4, 44634–44643. [Google Scholar] [CrossRef]
  10. Tian, Z.; Huang, J.; Zhang, X.; Shao, G.; He, Q.; Cao, S.; Yuan, S. Ultra-microporous N-doped carbon from polycondensed framework precursor for CO2 adsorption. Microporous Mesoporous Mater. 2018, 257, 19–26. [Google Scholar] [CrossRef]
  11. Majchrzak, A.; Nowak, W. Separation characteristics as a selection criteria of CO2 adsorbents. J. CO2 Util. 2017, 17, 69–79. [Google Scholar] [CrossRef]
  12. Jang, E.; Choi, S.W.; Hong, S.-M.; Shin, S.; Lee, K.B. Development of a cost-effective CO2 adsorbent from petroleum coke via KOH activation. Appl. Surf. Sci. 2018, 429, 62–71. [Google Scholar] [CrossRef]
  13. Zanella, O.; Tessaro, I.C.; Féris, L.A. Desorption- and decomposition-based techniques for the regeneration of activated carbon. Chem. Eng. Technol. 2014, 37, 1447–1459. [Google Scholar] [CrossRef]
  14. Dutta, T.; Kim, T.; Vellingiri, K.; Tsang, D.C.; Shon, J.; Kim, K.-H.; Kumar, S. Recycling and regeneration of carbonaceous and porous materials through thermal or solvent treatment. Chem. Eng. J. 2019, 364, 514–529. [Google Scholar] [CrossRef]
  15. Reza, M.S.; Yun, C.S.; Afroze, S.; Radenahmad, N.; Bakar, M.S.A.; Saidur, R.; Taweekun, J.; Azad, A.K. Preparation of activated carbon from biomass and its’ applications in water and gas purification, a review. Arab J. Basic Appl. Sci. 2020, 27, 208–238. [Google Scholar] [CrossRef]
  16. Din, M.I.; Ashraf, S.; Intisar, A. Comparative study of different activation treatments for the preparation of activated carbon: A mini-review. Sci. Prog. 2017, 100, 299–312. [Google Scholar] [CrossRef] [PubMed]
  17. Bubanale, S.; Shivashankar, M. History, method of production, structure and applications of activated carbon. Int. J. Eng. Res 2017, 6, 495–498. [Google Scholar]
  18. Sarwar, A.; Ali, M.; Khoja, A.H.; Nawar, A.; Waqas, A.; Liaquat, R.; Naqvi, S.R.; Asjid, M. Synthesis and characterization of biomass-derived surface-modified activated carbon for enhanced CO2 adsorption. J. CO2 Util. 2021, 46, 101476. [Google Scholar] [CrossRef]
  19. Zhang, C.; Song, W.; Sun, G.; Xie, L.; Wang, J.; Li, K.; Sun, C.; Liu, H.; Snape, C.E.; Drage, T. CO2 capture with activated carbon grafted by nitrogenous functional groups. Energy Fuels 2013, 27, 4818–4823. [Google Scholar] [CrossRef]
  20. Fu, J.; Zhou, B.; Zhang, Z.; Wang, T.; Cheng, X.; Lin, L.; Ma, C. One-step rapid pyrolysis activation method to prepare nanostructured activated coke powder. Fuel 2020, 262, 116514. [Google Scholar] [CrossRef]
  21. Zhao, Y.; Mu, J.; Wang, Y.; Liu, Y.; Wang, H.; Song, H. Preparation of hierarchical porous carbon through one-step KOH activation of coconut shell biomass for high-performance supercapacitor. J. Mater. Sci. Mater. Electron. 2023, 34, 527. [Google Scholar] [CrossRef]
  22. Li, Y.; Lu, L.; Lyu, S.; Xu, H.; Ren, X.; Levendis, Y.A. Activated coke preparation by physical activation of coal and biomass co-carbonized chars. J. Anal. Appl. Pyrolysis 2021, 156, 105137. [Google Scholar] [CrossRef]
  23. Khalil, H.; Jawaid, M.; Firoozian, P.; Rashid, U.; Islam, A.; Akil, H.M. Activated carbon from various agricultural wastes by chemical activation with KOH: Preparation and characterization. J. Biobased Mater. Bioenergy 2013, 7, 708–714. [Google Scholar] [CrossRef]
  24. Kılıç, M.; Apaydın-Varol, E.; Pütün, A.E. Preparation and surface characterization of activated carbons from Euphorbia rigida by chemical activation with ZnCl2, K2CO3, NaOH and H3PO4. Appl. Surf. Sci. 2012, 261, 247–254. [Google Scholar] [CrossRef]
  25. Deng, Z.; Sun, S.; Li, H.; Pan, D.; Patil, R.R.; Guo, Z.; Seok, I. Modification of coconut shell-based activated carbon and purification of wastewater. Adv. Compos. Hybrid Mater. 2021, 4, 65–73. [Google Scholar] [CrossRef]
  26. Zhang, C.; Song, W.; Ma, Q.; Xie, L.; Zhang, X.; Guo, H. Enhancement of CO2 capture on biomass-based carbon from black locust by KOH activation and ammonia modification. Energy Fuels 2016, 30, 4181–4190. [Google Scholar] [CrossRef]
  27. Wang, L.; Sha, L.; Zhang, S.; Cao, F.; Ren, X.; Levendis, Y.A. Preparation of activated coke by carbonization, activation, ammonization and thermal treatment of sewage sludge and waste biomass for SO2 absorption applications. Fuel Process. Technol. 2022, 231, 107233. [Google Scholar] [CrossRef]
  28. Sun, F.; Liu, X.; Gao, J.; Pi, X.; Wang, L.; Qu, Z.; Qin, Y. Highlighting the role of nitrogen doping in enhancing CO2 uptake onto carbon surfaces: A combined experimental and computational analysis. J. Mater. Chem. A 2016, 4, 18248–18252. [Google Scholar] [CrossRef]
  29. Chen, H.; Guo, Y.; Du, Y.; Xu, X.; Su, C.; Zeng, Z.; Li, L. The synergistic effects of surface functional groups and pore sizes on CO2 adsorption by GCMC and DFT simulations. Chem. Eng. J. 2021, 415, 128824. [Google Scholar] [CrossRef]
  30. Saha, D.; Kienbaum, M.J. Role of oxygen, nitrogen and sulfur functionalities on the surface of nanoporous carbons in CO2 adsorption: A critical review. Microporous Mesoporous Mater. 2019, 287, 29–55. [Google Scholar] [CrossRef]
  31. Ma, X.; Li, L.; Chen, R.; Wang, C.; Zhou, K.; Li, H. Doping of alkali metals in carbon frameworks for enhancing CO2 capture: A theoretical study. Fuel 2019, 236, 942–948. [Google Scholar] [CrossRef]
  32. Petrovic, B.; Gorbounov, M.; Soltani, S.M. Impact of surface functional groups and their introduction methods on the mechanisms of CO2 adsorption on porous carbonaceous adsorbents. Carbon Capture Sci. Technol. 2022, 3, 100045. [Google Scholar] [CrossRef]
  33. Bardestani, R.; Patience, G.S.; Kaliaguine, S. Experimental methods in chemical engineering: Specific surface area and pore size distribution measurements—BET, BJH, and DFT. Can. J. Chem. Eng. 2019, 97, 2781–2791. [Google Scholar] [CrossRef]
  34. Rehman, A.; Baek, J.W.; Rene, E.R.; Sergienko, N.; Behera, S.K.; Park, H.-S. Effect of process parameters influencing the chemical modification of activated carbon fiber for carbon dioxide removal. Process Saf. Environ. Prot. 2018, 118, 384–396. [Google Scholar] [CrossRef]
  35. Pi, X.; Sun, F.; Gao, J.; Qu, Z.; Wang, A.; Qie, Z.; Wang, L.; Liu, H. A new insight into the SO2 adsorption behavior of oxidized carbon materials using model adsorbents and DFT calculations. Phys. Chem. Chem. Phys. 2019, 21, 9181–9188. [Google Scholar] [CrossRef]
  36. Grimme, S.; Ehrlich, S.; Goerigk, L. Effect of the damping function in dispersion corrected density functional theory. J. Comput. Chem. 2011, 32, 1456. [Google Scholar] [CrossRef]
  37. Krishnan, R.; Binkley, J.S.; Seeger, R.; Pople, J.A. Self-consistent molecular orbital methods. XX. A basis set for correlated wave functions. J. Chem. Phys. 1980, 72, 650–654. [Google Scholar] [CrossRef]
  38. Humphrey, W.; Dalke, A.; Schulten, K. VMD: Visual molecular dynamics. J. Mol. Graph. 1996, 14, 33–38. [Google Scholar] [CrossRef]
  39. Lu, T.; Chen, F. Multiwfn: A multifunctional wavefunction analyzer. J. Comput. Chem. 2012, 33, 580–592. [Google Scholar] [CrossRef]
  40. Lu, T.; Chen, Q. Independent gradient model based on Hirshfeld partition: A new method for visual study of interactions in chemical systems. J. Comput. Chem. 2022, 43, 539–555. [Google Scholar] [CrossRef]
  41. Zhang, S.; Wang, L.; Zhang, Y.; Cao, F.; Sun, Q.; Ren, X.; Wennersten, R. Effect of hydroxyl functional groups on SO2 adsorption by activated carbon. J. Environ. Chem. Eng. 2022, 10, 108727. [Google Scholar] [CrossRef]
  42. Liu, J.; Deng, Y.; Li, X.; Wang, L. Promising nitrogen-rich porous carbons derived from one-step calcium chloride activation of biomass-based waste for high performance supercapacitors. ACS Sustain. Chem. Eng. 2016, 4, 177–187. [Google Scholar] [CrossRef]
  43. Caicedo-Salcedo, O.D.; Vargas-Delgadillo, D.P.; Giraldo, L.; Moreno-Piraján, J.C. Data of preparation and characterization of activated carbon using two activant agents and mango seed as precursor material. Data Brief 2019, 27, 104769. [Google Scholar] [CrossRef] [PubMed]
  44. Gao, Y.; Yue, Q.; Gao, B.; Li, A. Insight into activated carbon from different kinds of chemical activating agents: A review. Sci. Total Environ. 2020, 746, 141094. [Google Scholar] [CrossRef] [PubMed]
  45. Guo, Y.; Zhao, C.; Li, C. CO2 adsorption kinetics of K2CO3/activated carbon for low-concentration CO2 removal from confined spaces. Chem. Eng. Technol. 2015, 38, 891–899. [Google Scholar] [CrossRef]
  46. Huang, G.-G.; Liu, Y.-F.; Wu, X.-X.; Cai, J.-J. Activated carbons prepared by the KOH activation of a hydrochar from garlic peel and their CO2 adsorption performance. New Carbon Mater. 2019, 34, 247–257. [Google Scholar] [CrossRef]
  47. Wu, W.; Wu, C.; Zhang, G.; Liu, J. Preparation of microporous carbonaceous CO2 adsorbents by activating bamboo shoot shells with different chlorides: Experimental and theoretical calculations. J. Anal. Appl. Pyrolysis 2022, 168, 105742. [Google Scholar] [CrossRef]
  48. Dehkordi, S.S.R.; Delavar, Q.; Ebrahim, H.A.; Partash, S.S. CO2 adsorption by coal-based activated carbon modified with sodium hydroxide. Mater. Today Commun. 2022, 33, 104776. [Google Scholar] [CrossRef]
  49. Tan, Y.; Islam, M.A.; Asif, M.; Hameed, B. Adsorption of carbon dioxide by sodium hydroxide-modified granular coconut shell activated carbon in a fixed bed. Energy 2014, 77, 926–931. [Google Scholar] [CrossRef]
  50. Igalavithana, A.D.; Choi, S.W.; Shang, J.; Hanif, A.; Dissanayake, P.D.; Tsang, D.C.; Kwon, J.-H.; Lee, K.B.; Ok, Y.S. Carbon dioxide capture in biochar produced from pine sawdust and paper mill sludge: Effect of porous structure and surface chemistry. Sci. Total Environ. 2020, 739, 139845. [Google Scholar] [CrossRef]
  51. Yaumi, A.; Bakar, M.A.; Hameed, B. Reusable nitrogen-doped mesoporous carbon adsorbent for carbon dioxide adsorption in fixed-bed. Energy 2017, 138, 776–784. [Google Scholar] [CrossRef]
  52. Zhai, Y.; Pang, D.; Chen, H.; Xiang, B.; Chen, J.; Li, C.; Zeng, G.; Qiu, L. Effects of ammonization on the surface physico-chemical properties of sludge-based activated carbon. Appl. Surf. Sci. 2013, 280, 590–597. [Google Scholar] [CrossRef]
  53. Lee, S.-Y.; Jang, D.-I.; Bae, S.-T.; Park, S.-J. Facile synthesis of nitrogen-enriched mesoporous carbon for carbon dioxide capture. Int. J. Hydrogen Energy 2014, 39, 12347–12352. [Google Scholar] [CrossRef]
  54. Lim, G.; Lee, K.B.; Ham, H.C. Effect of N-containing functional groups on CO2 adsorption of carbonaceous materials: A density functional theory approach. J. Phys. Chem. C 2016, 120, 8087–8095. [Google Scholar] [CrossRef]
  55. Jiang, D.; Li, H.; Wang, S.; Cheng, X.; Bartocci, P.; Fantozzi, F. Insight the CO2 adsorption onto biomass-pyrolysis derived char via experimental analysis coupled with DFT calculation. Fuel 2023, 332, 125948. [Google Scholar] [CrossRef]
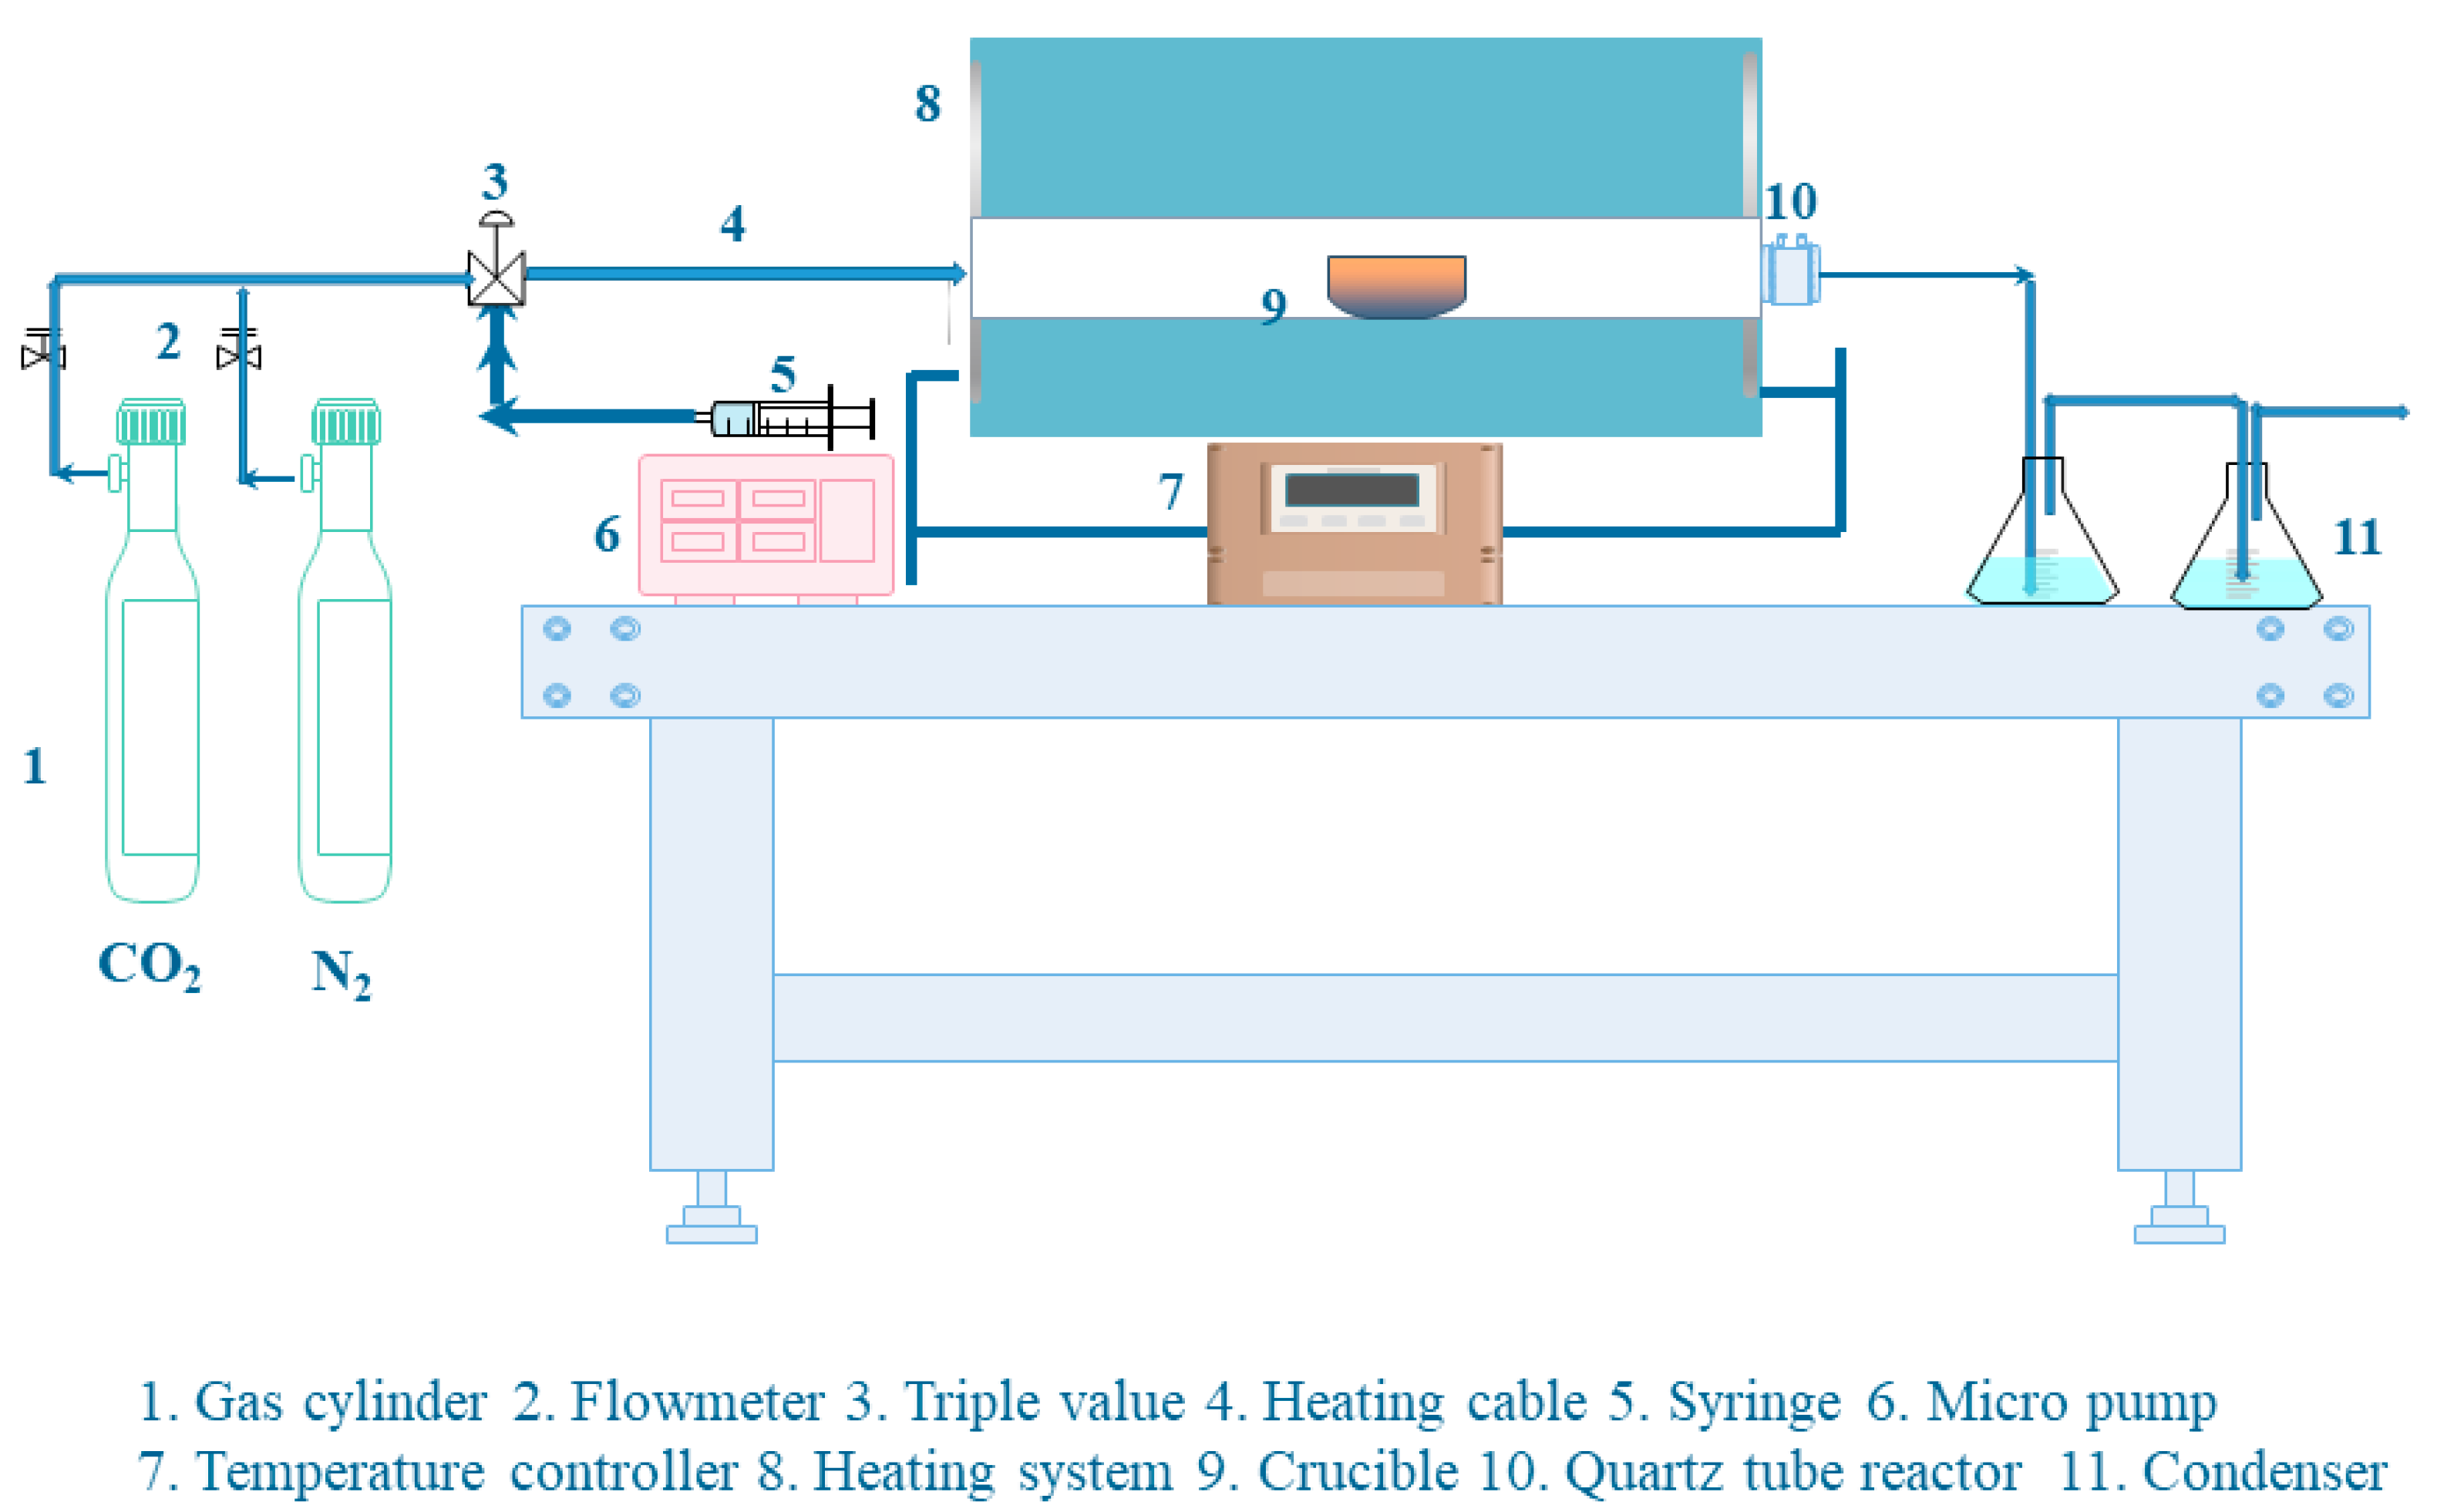
Figure 1. Activated coke preparation experimental device.
Energies 16 03872 g001
Figure 2. Activated coke adsorption experimental device.
Energies 16 03872 g002
Figure 3. Graphene model (green = C, blue = N, gray = H). (a) Pyridine-containing graphene; (b) pyrrole-containing graphene.
Energies 16 03872 g003
Figure 4. Interpretation of the coloring method of the mapped function sign (λ2) ρ in IMGH [40].
Energies 16 03872 g004
Figure 5. Nitrogen adsorption isotherms of activated cokes. (a) Activated coke obtained by using KOH; (b) Activated coke obtained by using CaCl2.
Energies 16 03872 g005
Figure 6. FTIR spectra of raw materials and activated coke. (a) Raw materials; (b) activated cokes.
Energies 16 03872 g006
Figure 7. Surface morphology of raw materials and activated coke. (a) Raw materials; (b) OAC; (c) KAC; (d) CAC.
Energies 16 03872 g007aEnergies 16 03872 g007b
Figure 8. CO2 adsorption curves of activated coke prepared by KOH (10% CO2, 90% N2).
Energies 16 03872 g008
Figure 9. CO2 adsorption curves of activated coke prepared by CaCl2 (10% CO2, 90% N2).
Energies 16 03872 g009
Figure 10. CO2 adsorption curves of activated coke prepared by KOH (80% CO2, 20% O2).
Energies 16 03872 g010
Figure 11. CO2 adsorption curves of activated coke prepared by CaCl2 (80% CO2, 20% O2).
Energies 16 03872 g011
Figure 12. FTIR spectra of modified activated coke.
Energies 16 03872 g012
Figure 13. CO2 adsorption curves for modified activated coke. (a) Conventional power plant flue gas; (b) oxy–fuel combustion flue gas.
Energies 16 03872 g013
Figure 14. Electrostatic potential of CO2 and graphene models. (a) CO2; (b) graphene without functional groups; (c) graphene with pyridine functional groups; (d) graphene with pyrrole functional groups.
Energies 16 03872 g014
Figure 15. Adsorption of CO2 by the original graphene model.
Energies 16 03872 g015
Figure 16. Adsorption of CO2 by the graphene model containing pyridine functional groups. (a) Edge; (b) plane.
Energies 16 03872 g016
Figure 17. Adsorption of CO2 by the graphene model containing pyrrole functional groups. (a) Edge; (b) plane.
Energies 16 03872 g017
Table 1. Proximate and ultimate analysis of raw materials.
SamplesProximate AnalysisUltimate Analysis
MVAFCCHSNO
Zhundong coal10.2829.544.4555.7367.103.500.610.4728.32
Coconut shell6.5373.870.8518.7549.566.560.030.1542.47
Note: M: Moisture; V: Volatile; A: Ash; FC: Fixed carbon.
Table 2. Physical properties of activated coke.
Active AgentIRSBET (m2/g)Smic (m2/g)Micropore Ratio (%)Yield (%)
None0528.26334.7063.3643.51
KOH0.125574.35451.1078.5432.52
KOH0.25600.46493.0482.1128.24
KOH0.5629.81538.1785.4420.42
KOH1450.21405.9190.1621.98
KOH2412.87392.4395.0422.11
CaCl20.125560.10366.5965.4534.25
CaCl20.25575.63384.4166.7829.11
CaCl20.5595.44410.2068.8927.45
CaCl21610.66424.2469.5426.27
CaCl22580.45390.7667.3225.47
Note: SBET: BET surface area; Smic: Micropore surface area.
Table 3. Comparison of the CO2 adsorption capacity of activated cokes and other adsorbent materials.
SamplesRaw MaterialsT (°C)W (%)V (mg/g)
KACbituminous coal and coconut shell251066.50
CACbituminous coal and coconut shell251051.78
Activated carboncoal251251.41 [48]
Activated carboncoconut shell351027.10 [49]
Sludge biocharsludge251532.12 [50]
Note: T: Adsorption temperature; W: CO2 concentration; V: CO2 adsorption capacity.
Disclaimer/Publisher’s Note: The statements, opinions and data contained in all publications are solely those of the individual author(s) and contributor(s) and not of MDPI and/or the editor(s). MDPI and/or the editor(s) disclaim responsibility for any injury to people or property resulting from any ideas, methods, instructions or products referred to in the content.